Estimation of Starch and Sugar Intake in a Japanese Population Based on a Newly Developed Food Composition Database

 , ,
, ,
Abstract
:1. Introduction
2. Materials and Methods
2.1. Development of a Food Composition Database
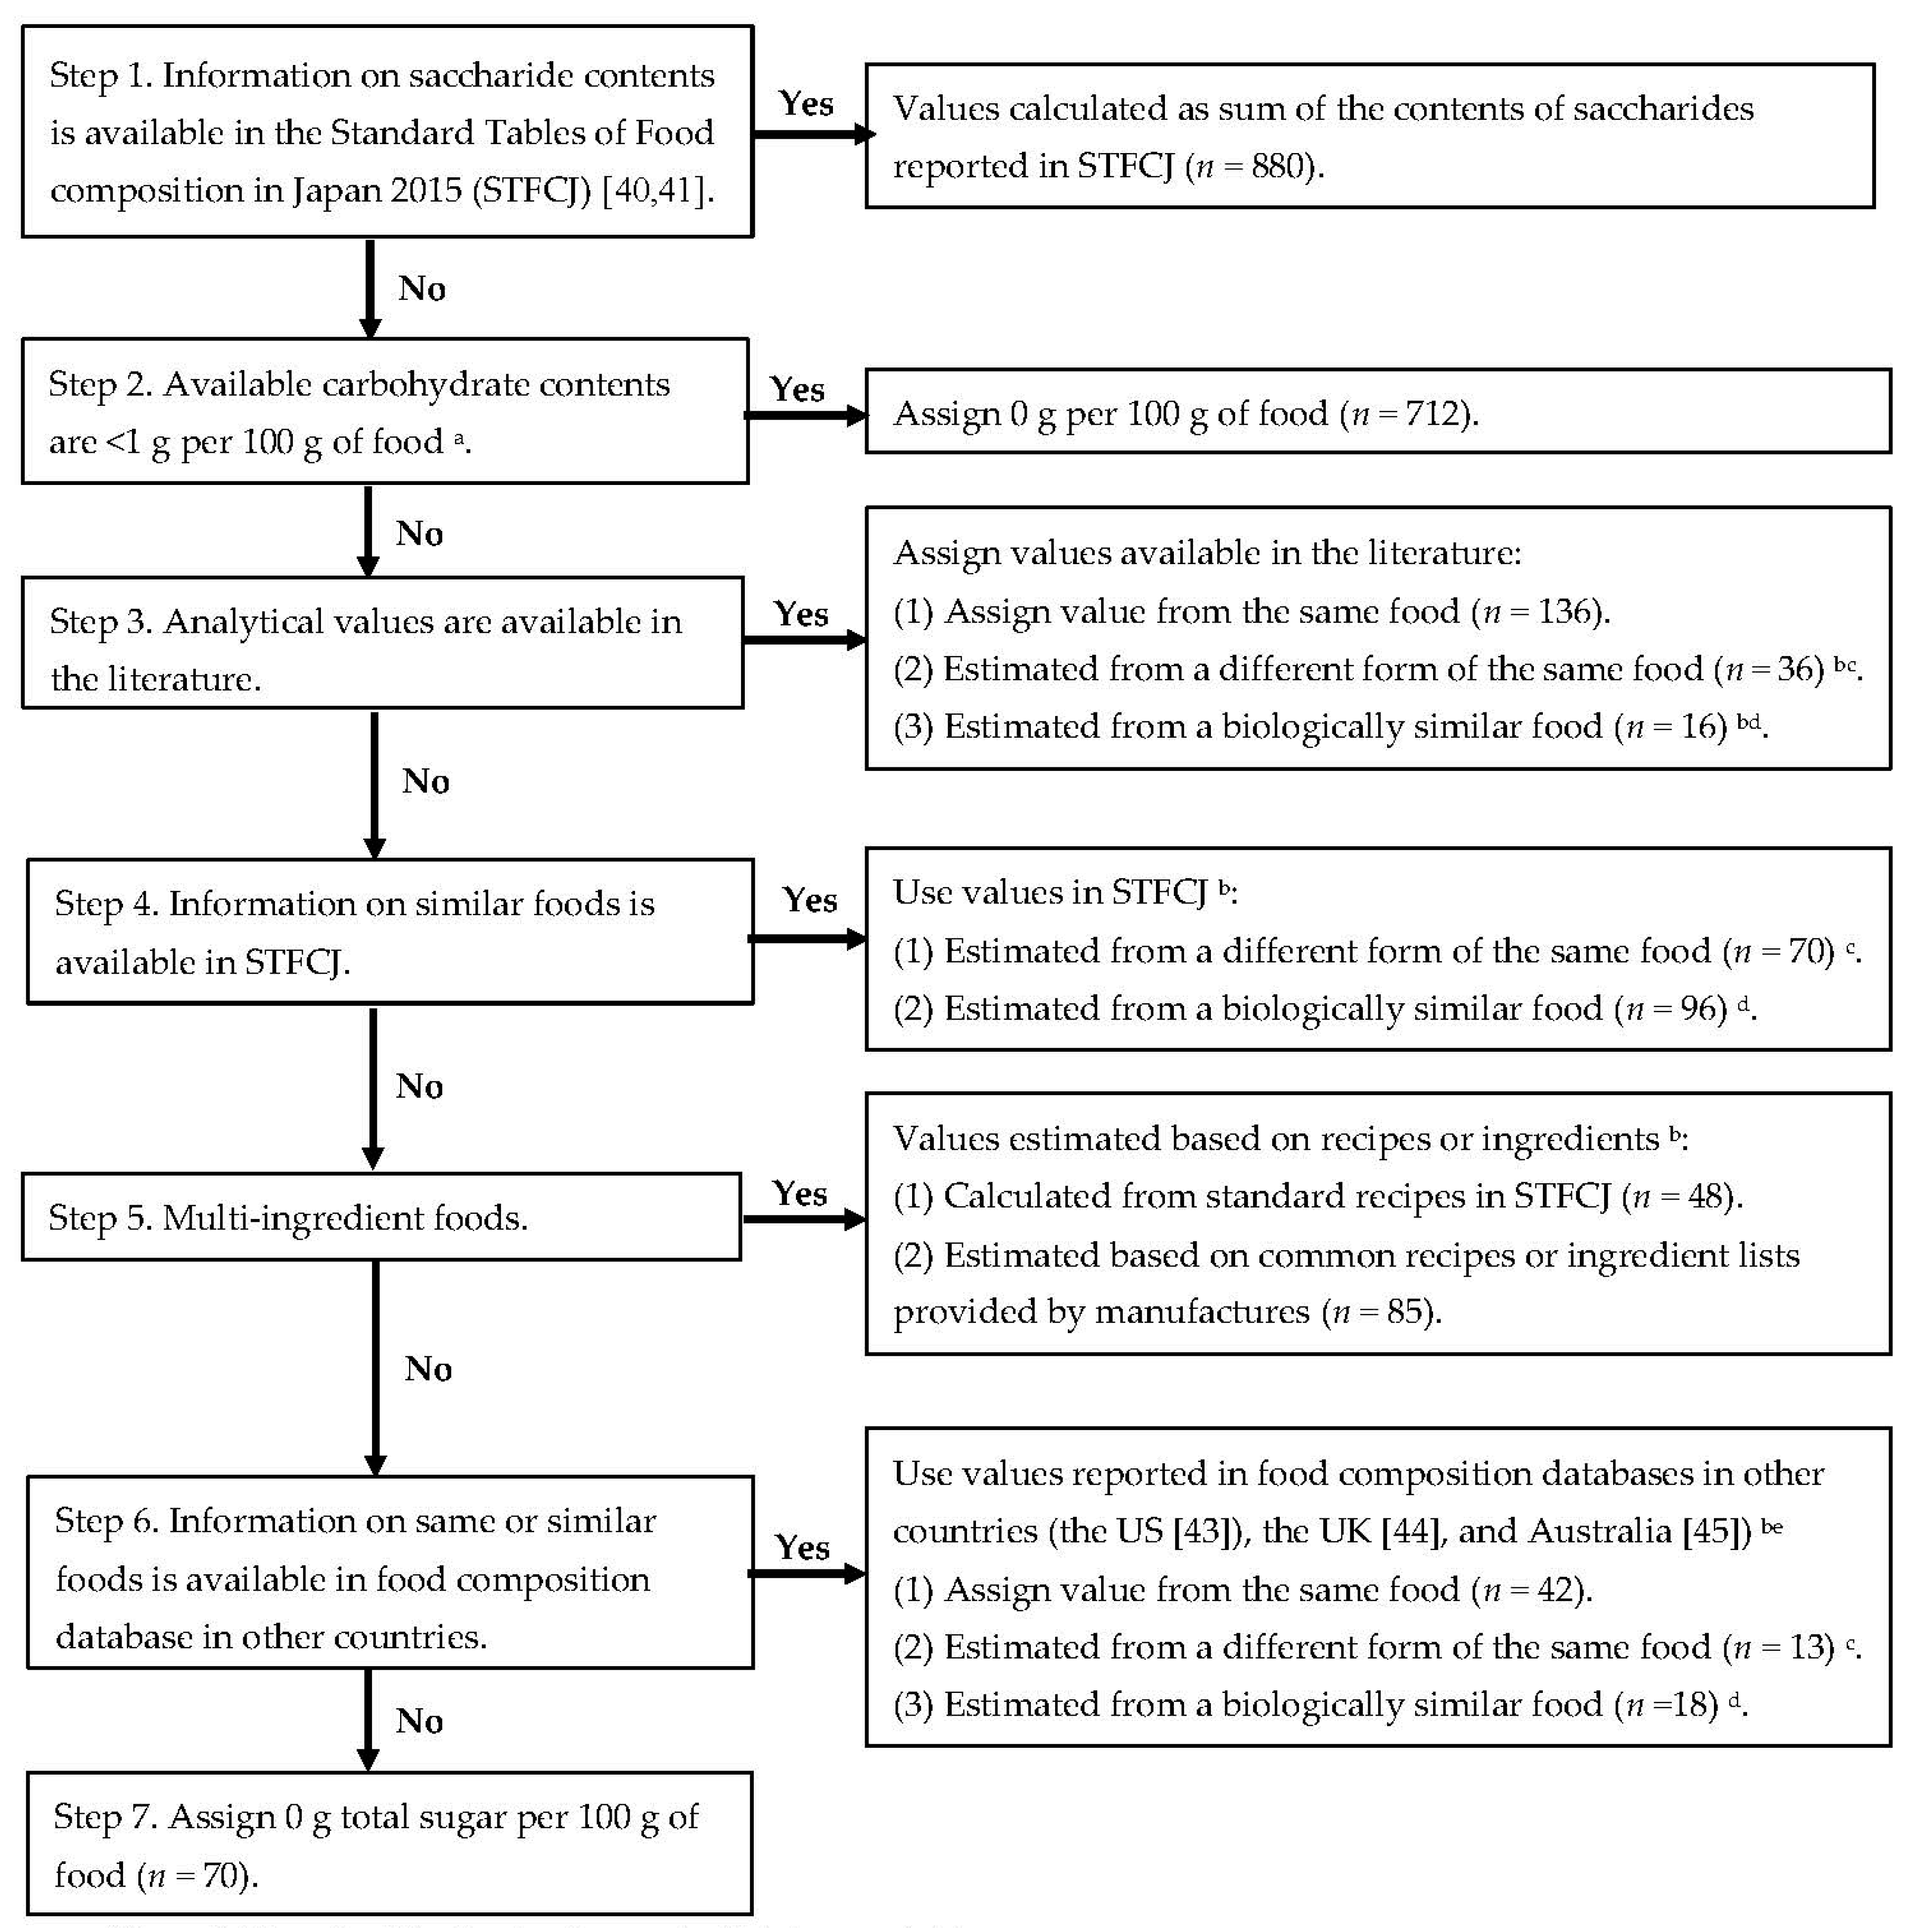
2.1.1. Total Sugar and Saccharides
2.1.2. Starch
2.1.3. Free Sugar and Naturally Occurring Sugar
2.2. Estimation of Starch and Sugar Intake
2.2.1. Dietary Dataset
2.2.2. Statistical Analysis
3. Results
4. Discussion
5. Conclusions
Supplementary Materials
Author Contributions
Funding
Acknowledgments
Conflicts of Interest
References
- Buyken, A.E.; Mela, D.J.; Dussort, P.; Johnson, I.T.; Macdonald, I.A.; Stowell, J.D.; Brouns, F.J.P.H. Dietary carbohydrates: A review of international recommendations and the methods used to derive them. Eur. J. Clin. Nutr. 2018. [Google Scholar] [CrossRef] [PubMed]
- Erickson, J.; Sadeghirad, B.; Lytvyn, L.; Slavin, J.; Johnston, B.C. The Scientific Basis of Guideline Recommendations on Sugar Intake: A Systematic Review. Ann. Intern. Med. 2017, 166, 257–267. [Google Scholar] [CrossRef] [PubMed]
- Moynihan, P.J.; Kelly, S.A.M. Effect on Caries of Restricting Sugars Intake: Systematic Review to Inform WHO Guidelines. J. Dent. Res. 2014, 93, 8–18. [Google Scholar] [CrossRef] [PubMed]
- Te Morenga, L.; Mallard, S.; Mann, J. Dietary sugars and body weight: Systematic review and meta-analyses of randomised controlled trials and cohort studies. BMJ 2012, 346, e7492. [Google Scholar] [CrossRef] [PubMed]
- Imamura, F.; O’Connor, L.; Ye, Z.; Mursu, J.; Hayashino, Y.; Bhupathiraju, S.N.; Forouhi, N.G. Consumption of sugar sweetened beverages, artificially sweetened beverages, and fruit juice and incidence of type 2 diabetes: Systematic review, meta-analysis, and estimation of population attributable fraction. BMJ 2015, 351, h3576. [Google Scholar] [CrossRef] [PubMed]
- Te Morenga, L.A.; Howatson, A.J.; Jones, R.M.; Mann, J. Dietary sugars and cardiometabolic risk: Systematic review and meta-analyses of randomized controlled trials of the effects on blood pressure and lipids. Am. J. Clin. Nutr. 2014, 100, 65–79. [Google Scholar] [CrossRef] [PubMed]
- Yang, Q.; Zhang, Z.; Gregg, E.W.; Flanders, W.D.; Merritt, R.; Hu, F.B. Added Sugar Intake and Cardiovascular Diseases Mortality Among US Adults. JAMA Intern. Med. 2014, 174, 516–524. [Google Scholar] [CrossRef] [PubMed]
- Hauner, H.; Bechthold, A.; Boeing, H.; Brönstrup, A.; Buyken, A.; Leschik-Bonnet, E.; Linseisen, J.; Schulze, M.; Strohm, D.; Wolfram, G. Evidence-based guideline of the German nutrition society: Carbohydrate intake and prevention of nutrition-related diseases. Ann. Nutr. Metab. 2012, 60, 1–58. [Google Scholar] [CrossRef] [PubMed]
- Gibson, S.; Gunn, P.; Wittekind, A.; Cottrell, R. The Effects of Sucrose on Metabolic Health: A Systematic Review of Human Intervention Studies in Healthy Adults. Crit. Rev. Food Sci. Nutr. 2013, 53, 591–614. [Google Scholar] [CrossRef] [PubMed] [Green Version]
- Touger-Decker, R.; Van Loveren, C. Sugars and dental caries. Am. J. Clin. Nutr. 2003, 78, 881–892. [Google Scholar] [CrossRef] [PubMed]
- Lingström, P.; Van Houte, J.; Kashket, S. Food starches and dental caries. Crit. Rev. Oral Biol. Med. 2000, 11, 366–380. [Google Scholar] [CrossRef] [PubMed]
- Sluijs, I.; van der Schouw, Y.T.; van der A, D.L.; Spijkerman, A.M.; Hu, F.B.; Grobbee, D.E.; Beulens, J.W. Carbohydrate quantity and quality and risk of type 2 diabetes in the European Prospective Investigation into Cancer and Nutrition-Nethelands (EPIC-NL) study. Am. J. Clin. Nutr. 2010, 92, 905–911. [Google Scholar] [CrossRef] [PubMed]
- Hodge, A.M. Glycemic index and dietary fiber and the risk of type 2 diabetes. Diabetes Care 2004, 27, 2701–2706. [Google Scholar] [CrossRef] [PubMed]
- Barclay, A.; Flood, V.; Rochtchina, E.; Mitchell, P.; Brand-Miller, J. Glycemic Index, Dietary Fiber, and Risk of Type 2 Diabetes in a Cohort of Older Australians. Diabetes Care 2007, 30, 2811–2813. [Google Scholar] [CrossRef] [PubMed] [Green Version]
- Meyer, K.A.; Kushi, L.H.; Jacobs, D.R., Jr.; Slavin, J.; Sellers, T.A.; Folsom, A.R. Carbohydrates, dietary fiber, and incident type 2 diabetes in older women. Am. J. Clin. Nutr. 2000, 71, 921–930. [Google Scholar] [CrossRef] [PubMed]
- Sluijs, I.; Beulens, J.W.J.; van der Schouw, Y.T.; van der A, D.L.; Buckland, G.; Kuijsten, A.; Schulze, M.B.; Amiano, P.; Ardanaz, E.; Balkau, B.; et al. Dietary Glycemic Index, Glycemic Load, and Digestible Carbohydrate Intake Are Not Associated with Risk of Type 2 Diabetes in Eight European Countries. 2013, 143, 93–99. [Google Scholar] [CrossRef] [PubMed]
- Montonen, J.; Järvinen, R.; Knekt, P.; Heliövaara, M.; Reunanen, A. Consumption of sweetened beverages and intakes of fructose and glucose predict type 2 diabetes occurrence. J. Nutr. 2007, 137, 1447–1454. [Google Scholar] [CrossRef] [PubMed]
- Ahmadi-Abhari, S.; Luben, R.N.; Powell, N.; Bhaniani, A.; Chowdhury, R.; Wareham, N.J.; Forouhi, N.G.; Khaw, K.T. Dietary intake of carbohydrates and risk of type 2 diabetes: The European Prospective Investigation into Cancer-Norfolk study. Br. J. Nutr. 2014, 111, 342–352. [Google Scholar] [CrossRef] [PubMed]
- Tsilas, C.S.; de Souza, R.J.; Mejia, S.B.; Mirrahimi, A.; Cozma, A.I.; Jayalath, V.H.; Ha, V.; Tawfik, R.; Di Buono, M.; Jenkins, A.L.; et al. Relation of total sugars, fructose and sucrose with incident type 2 diabetes: A systematic review and meta-analysis of prospective cohort studies. Can. Med. Assoc. J. 2017, 189, E711–E720. [Google Scholar] [CrossRef] [PubMed]
- Alhazmi, A.; Stojanovski, E.; McEvoy, M.; Garg, M.L. Macronutrient intakes and development of type 2 diabetes: A systematic review and meta-analysis of cohort studies. J. Am. Coll. Nutr. 2012, 31, 243–258. [Google Scholar] [CrossRef] [PubMed]
- Janket, S.-J.; Manson, J.E.; Sesso, H.; Buring, J.E.; Liu, S. A Prospective Study of Sugar Intake and Risk of Type 2 Diabetes in Women. Diabetes Care 2003, 26, 1008–1015. [Google Scholar] [CrossRef] [PubMed] [Green Version]
- Schulze, M.B.; Schulz, M.; Heidemann, C.; Schienkiewitz, A.; Hoffmann, K.; Boeing, H. Carbohydrate intake and incidence of type 2 diabetes in the European Prospective Investigation into Cancer and Nutrition (EPIC)-Potsdam Study. Br. J. Nutr. 2008, 99, 1107–1116. [Google Scholar] [CrossRef] [PubMed]
- Ter Horst, K.W.; Serlie, M.J. Fructose consumption, lipogenesis, and non-alcoholic fatty liver disease. Nutrients 2017, 9, 981. [Google Scholar] [CrossRef] [PubMed]
- Tappy, L. Fructose metabolism and noncommunicable diseases: Recent findings and new research perspectives. Curr. Opin. Clin. Nutr. Metab. Care 2018, 21, 214–222. [Google Scholar] [CrossRef] [PubMed]
- Chiu, S.; Sievenpiper, J.L.; De Souza, R.J.; Cozma, A.I.; Mirrahimi, A.; Carleton, A.J.; Ha, V.; Di Buono, M.; Jenkins, A.L.; Leiter, L.A.; et al. Effect of fructose on markers of non-alcoholic fatty liver disease (NAFLD): A systematic review and meta-analysis of controlled feeding trials. Eur. J. Clin. Nutr. 2014, 68, 416–423. [Google Scholar] [CrossRef] [PubMed]
- David Wang, D.; Sievenpiper, J.L.; De Souza, R.J.; Cozma, A.I.; Chiavaroli, L.; Ha, V.; Mirrahimi, A.; Carleton, A.J.; Di Buono, M.; Jenkins, A.L.; et al. Effect of fructose on postprandial triglycerides: A systematic review and meta-analysis of controlled feeding trials. Atherosclerosis 2014, 232, 125–133. [Google Scholar] [CrossRef] [PubMed] [Green Version]
- Cust, A.E.; Skilton, M.R.; van Bakel, M.M.E.; Halkjaer, J.; Olsen, A.; Agnoli, C.; Psaltopoulou, T.; Buurma, E.; Sonestedt, E.; Chirlaque, M.D.; et al. Total dietary carbohydrate, sugar, starch and fibre intakes in the European Prospective Investigation into Cancer and Nutrition. Eur. J. Clin. Nutr. 2009, 63 (Suppl. 4), S37–S60. [Google Scholar] [CrossRef] [PubMed] [Green Version]
- Public Health England; The Food Standards Agency. National Diet and Nutrition Survey Results from Years 1, 2, 3 and 4 (Combined) of the Rolling Programme (2008/2009–2011/2012); Public Health England: London, UK, 2014. Available online: https://www.gov.uk/government/uploads/system/uploads/attachment_data/file/310995/NDNS_Y1_to_4_UK_report.pdf (accessed on 7 June 2018).
- Lluch, A.; Maillot, M.; Gazan, R.; Vieux, F.; Delaere, F.; Vaudaine, S.; Darmon, N. Individual Diet Modeling Shows How to Balance the Diet of French Adults with or without Excessive Free Sugar Intakes. Nutrients 2017, 9, 162. [Google Scholar] [CrossRef] [PubMed]
- Ruiz, E.; Rodriguez, P.; Valero, T.; Ávila, J.M.; Aranceta-Bartrina, J.; Gil, Á.; González-Gross, M.; Ortega, R.M.; Serra-Majem, L.; Varela-Moreiras, G. Dietary intake of individual (Free and intrinsic) sugars and food sources in the Spanish population: Findings from the ANIBES study. Nutrients 2017, 9, 275. [Google Scholar] [CrossRef] [PubMed]
- Sette, S.; Le Donne, C.; Piccinelli, R.; Arcella, D.; Turrini, A.; Leclercq, C. The third Italian National Food Consumption Survey, INRAN-SCAI 2005-06—Part 1: Nutrient intakes in Italy. Nutr. Metab. Cardiovasc. Dis. 2011, 21, 922–932. [Google Scholar] [CrossRef] [PubMed]
- Newens, K.J.; Walton, J. A review of sugar consumption from nationally representative dietary surveys across the world. J. Hum. Nutr. Diet. 2016, 29, 225–240. [Google Scholar] [CrossRef] [PubMed]
- Linseisen, J.; Schulze, M.B.; Saadatian-Elahi, M.; Kroke, A.; Miller, A.B.; Boeing, H. Quantity and quality of dietary fat, carbohydrate, and fiber intake in the German EPIC cohorts. Ann. Nutr. Metab. 2003, 47, 37–46. [Google Scholar] [CrossRef] [PubMed]
- Marangoni, F.; Brignoli, O.; Cricelli, C.; Poli, A. Lifestyle and specific dietary habits in the Italian population: Focus on sugar intake and association with anthropometric parameters—The LIZ (Liquidi e Zuccheri nella popolazione Italiana) study. Eur. J. Nutr. 2017, 56, 1685–1691. [Google Scholar] [CrossRef] [PubMed]
- Sluik, D.; Engelen, A.I.; Feskens, E.J. Fructose consumption in the Netherlands: The Dutch national food consumption survey 2007–2010. Eur. J. Clin. Nutr. 2015, 69, 475–481. [Google Scholar] [CrossRef] [PubMed]
- Marriott, B.P.; Cole, N.; Lee, E. National Estimates of Dietary Fructose Intake Increased from 1977 to 2004 in the United States. J. Nutr. 2009, 139, 1228S–1235S. [Google Scholar] [CrossRef] [PubMed] [Green Version]
- Zhou, B.F.; Stamler, J.; Dennis, B.; Moag-Stahlberg, A.; Okuda, N.; Robertson, C.; Zhao, L.; Chan, Q.; Elliott, P. Nutrient intakes of middle-aged men and women in China, Japan, United Kingdom, and United States in the late 1990s: The INTERMAP Study. J. Hum. Hypertens. 2003, 17, 623–630. [Google Scholar] [CrossRef] [PubMed]
- Wang, Z.; Uchida, K.; Ohnaka, K.; Morita, M.; Toyomura, K.; Kono, S.; Ueki, T.; Tanaka, M.; Kakeji, Y.; Maehara, Y.; et al. Sugars, sucrose and colorectal cancer risk: The Fukuoka colorectal cancer study. Scand. J. Gastroenterol. 2014, 49, 581–588. [Google Scholar] [CrossRef] [PubMed]
- Saido, M.; Asakura, K.; Masayasu, S.; Sasaki, S. Relationship Between Dietary Sugar Intake and Dental Caries Among Japanese Preschool Children with Relatively Low Sugar Intake (Japan Nursery School SHOKUIKU Study): A Nationwide Cross-Sectional Study. Matern. Child Health J. 2016, 20, 556–566. [Google Scholar] [CrossRef] [PubMed]
- Science and Technology Agency. Standard Tables of Food Composition in Japan-2015-(Seventh Revised Edition); National Printing Bureau: Tokyo, Japan, 2015. (In Japanese)
- Science and Technology Agency. Standard Tables of Food Composition in Japan-2015-(Seventh Revised Edition) Addendum-2016; National Printing Bureau: Tokyo, Japan, 2016. (In Japanese)
- Ministry of Health, Labour and Welfare of Japan. The National Health and Nutrition Survey in Japan. 2013. Available online: http://www.mhlw.go.jp/bunya/kenkou/eiyou/h25-houkoku.html (accessed on 7 June 2018).
- US Department of Agriculture. Composition of Foods Raw, Processed, Prepared USDA National Nutrient Database for Standard Reference, Release 28. 2015. Available online: http://www.ars.usda.gov/ba/bhnrc/ndl (accessed on 7 June 2018).
- Public Health England. McCance and Widdowson’s The Composition of Foods integrated dataset (CoFIDS). Available online: https://www.gov.uk/government/publications/composition-of-foods-integrated-dataset-cofid (accessed on 7 June 2018).
- Food Standards Australia New Zealand. NUTTAB 2010 Food Composition Database. Available online: http://www.foodstandards.gov.au/science/monitoringnutrients/nutrientables/Pages/default.aspx (accessed on 7 June 2018).
- Food and Agriculture Organization of the United Nations. Carbohydrates in Human Nutrition: Report of a Joint FAO/WHO Expert Consultation: Food and Agriculture Organization. Available online: http://www.fao.org/docrep/W8079E/W8079E00.htm (accessed on 7 June 2018).
- Rand, W.M.; Pennington, J.A.T.; Murphy, P.; Klensin, J.C. Compiling Data for Food Composition Data Bases; United Nations University Press: Tokyo, Japan, 1991. [Google Scholar]
- Yamazawa, K. The Free Sugars of Arrowheads. Bull. Tokai Women’s Jr. Coll. 1982, 8, 21–29. (In Japanese) [Google Scholar]
- Ishiwata, H.; Yano, S.; Okuda, S.; Kotani, T.; Tsuji, K. Analysis of contents of fatty acids, sterols, saccharides and dietary fibers in confectioneries on the market. Nippon Eiyo Shokuryo Gakkaishi 1988, 41, 415–422. (In Japanese) [Google Scholar] [CrossRef]
- Yamamoto, S.; Taniguchi, H.; Sarukura, N.; Tsao, H.; Tseng, A.; Takeichi, H. Development of a Food Composition Database of Monosaccharides and Disaccharides in Sweet Snacks and Beverages. J. Jpn. Diet. Assoc. 2009, 52, 314–317. (In Japanese) [Google Scholar]
- Takeichi, H.; Wakikawa, N.; Taniguchi, H.; Sarukura, N.; Tsao, H.; Tseng, A.; Yamamoto, S. Concentrations of Monosaccharides and Disaccharides in Commercial Sweet Snacks. J. Jpn. Diet. Assoc. 2010, 53, 23–26. (In Japanese) [Google Scholar]
- Yoshikawa, K.; Murata, Y.; Murao, R.; Inagaki, K.; Terashita, T.; Shishiyama, J. Preparation of Tables of Sugars in Food and Survey of Daily Sugar Intake. Food Hyg. Saf. Sci. 1993, 34, 55–62. (In Japanese) [Google Scholar] [CrossRef] [Green Version]
- Masuda, T.; Kawano, A.; Kitahara, K.; Nagashima, K.; Aikawa, Y.; Arai, S. Quantitative determination of sugars and myo-inositol in citrus fruits grown in Japan using high-performance anion-exchange chromatography. J. Nutr. Sci. Vitaminol. (Tokyo) 2003, 49, 64–68. [Google Scholar] [CrossRef] [PubMed]
- Yu, X.; Xu, B.; Sawamura, M. Determination of Sugar and Organic Acid Contents in Yuzu Juices from Different Districts of Japan by HPLC. J. Jpn. Soc. Hortic. Sci. 2004, 73, 293–298. (In Japanese) [Google Scholar] [CrossRef]
- Tanaka, H.; Date, C.; Okazaki, K.; Yoshikawa, K.; Baba, A.; Hayashi, M.; Tanaka, Y.; Ishii, R.; Shoji, H.; Owada, K. The contents of sucrose, fructose, glucose, maltose, lactose and sorbitol in daily foods -sugar composition of daily foods-. Jpn. J. Public Health 1983, 30, 607–618. (In Japanese) [Google Scholar]
- Ishii, Y. Sugar Components of Some Dry Fruits. Nippon Eiyo Shokuryo Gakkaishi 1983, 36, 53–55. (In Japanese) [Google Scholar] [CrossRef]
- Oku, K.; Sawatani, I.; Chaen, H.; Fukuda, S.; Kurimoto, M. Trehalose Content in Foods. Nippon Shokuhin Kagaku Kogaku Kaishi 1998, 45, 381–384. (In Japanese) [Google Scholar] [CrossRef]
- Yoshida, H.; Sugahara, T.; Hayashi, J. Studies on Free Sugars, Free Sugar alcohols and Organic Acids of Edible Mushrooms. Nippon Shokuhin Kogyo Gakkaishi 1982, 29, 451–459. (In Japanese) [Google Scholar] [CrossRef]
- Wu, M.C.; Chen, C.S. Variation of Sugars Distribution in Various Parts of Pitaya (Hylocereus undatus Britt. et Rose). Food Preserv. Sci. 1998, 24, 17–22. [Google Scholar] [CrossRef]
- Hase, S.; Yasui, T. Studies on Determination of Starch in Agricultural Products Part 2 Determination of starch in pulse and its processed products. Rep. Natl. Food Res. Inst. 1980, 36, 104–109. (In Japanese) [Google Scholar]
- Wamg, P.S.; Igarashi, O.; Fujimaki, M. Determination of Starch in Meat Products. Nippon Shokuhin Kogyo Gakkaish 1964, 11, 329–342. (In Japanese) [Google Scholar] [CrossRef]
- World Health Organization. Guideline: Sugars Intake for Adults and Children; WHO: Geneva, Switzerland, 2015; Available online: http://apps.who.int/iris/bitstream/10665/149782/1/9789241549028_eng.pdf?ua=1 (accessed on 7 June 2018).
- Mok, A.; Ahmad, R.; Rangan, A.; Louie, J.C.Y. Intake of free sugars and micronutrient dilution in Australian adults. Am. J. Clin. Nutr. 2018, 107, 94–104. [Google Scholar] [CrossRef] [PubMed] [Green Version]
- Louie, J.C.Y.; Moshtaghian, H.; Boylan, S.; Flood, V.M.; Rangan, A.M.; Barclay, A.W.; Brand-Miller, J.C.; Gill, T.P. A systematic methodology to estimate added sugar content of foods. Eur. J. Clin. Nutr. 2015, 69, 154–161. [Google Scholar] [CrossRef] [PubMed]
- Asakura, K.; Uechi, K.; Sasaki, Y.; Masayasu, S.; Sasaki, S. Estimation of sodium and potassium intakes assessed by two 24 h urine collections in healthy Japanese adults: A nationwide study. Br. J. Nutr. 2014, 112, 1195–1205. [Google Scholar] [CrossRef] [PubMed]
- Asakura, K.; Uechi, K.; Masayasu, S.; Sasaki, S. Sodium sources in the Japanese diet: Difference between generations and sexes. Public Health Nutr. 2016, 19, 2011–2023. [Google Scholar] [CrossRef] [PubMed]
- Asakura, K.; Sasaki, S. School lunches in Japan: Their contribution to healthier nutrient intake among elementary-school and junior high-school children. Public Health Nutr. 2017, 20, 1523–1533. [Google Scholar] [CrossRef] [PubMed]
- Asakura, K.; Sasaki, S. SFA intake among Japanese schoolchildren: Current status and possible intervention to prevent excess intake. Public Health Nutr. 2017, 20, 3247–3256. [Google Scholar] [CrossRef] [PubMed]
- Murakami, K.; Okubo, H.; Livingstone, M.B.E.; Fujiwara, A.; Asakura, K.; Uechi, K.; Sugimoto, M.; Wang, H.-C.; Masayasu, S.; Sasaki, S. Adequacy of Usual Intake of Japanese Children Aged 3–5 Years: A Nationwide Study. Nutrients 2018, 10, 1150. [Google Scholar] [CrossRef] [PubMed]
- Yokoyama, T. Theory and Application of Statistical Methods to Estimate the Distribution of Usual Intakes of a Nutrient in a Population: For the Appropriate Use of Dietary Reference Intakes. Jpn. J. Nutr. Diet. 2013, 71, S7–S14. (In Japanese) [Google Scholar] [CrossRef]
- Dodd, K.W.; Guenther, P.M.; Freedman, L.S.; Subar, A.F.; Kipnis, V.; Midthune, D.; Tooze, J.A.; Krebs-Smith, S.M. Statistical Methods for Estimating Usual Intake of Nutrients and Foods: A Review of the Theory. J. Am. Diet. Assoc. 2006, 106, 1640–1650. [Google Scholar] [CrossRef] [PubMed]
- Nusser, S.; Carriquiry, A.; Dodd, K.; Fuller, W. A semiparametric transformation approach to estimating usual daily intake distributions. J. Am. Stat. Assoc. 1996, 91, 1440–1449. [Google Scholar] [CrossRef]
- Ministry of Health, Labour and Welfare of Japan. Dietary Reference Intakes for Japanese. 2015. Available online: http://www.mhlw.go.jp/stf/seisakunitsuite/bunya/0000208970.html (accessed on 7 June 2018). (In Japanese)
- Azaïs-Braesco, V.; Sluik, D.; Maillot, M.; Kok, F.; Moreno, L.A. A review of total & added sugar intakes and dietary sources in Europe. Nutr. J. 2017, 16, 6. [Google Scholar] [CrossRef] [PubMed]
- Guelinckx, I.; Ferreira-Pêgo, C.; Moreno, L.A.; Kavouras, S.A.; Gandy, J.; Martinez, H.; Bardosono, S.; Abdollahi, M.; Nasseri, E.; Jarosz, A.; et al. Intake of water and different beverages in adults across 13 countries. Eur. J. Nutr. 2015, 54, 45–55. [Google Scholar] [CrossRef] [PubMed] [Green Version]
- Guelinckx, I.; Iglesia, I.; Bottin, J.H.; De Miguel-Etayo, P.; González-Gil, E.M.; Salas-Salvadó, J.; Kavouras, S.A.; Gandy, J.; Martinez, H.; Bardosono, S.; et al. Intake of water and beverages of children and adolescents in 13 countries. Eur. J. Nutr. 2015, 54, 69–79. [Google Scholar] [CrossRef] [PubMed] [Green Version]
- O’Neil, C.E.; Keast, D.R.; Fulgoni, V.L.; Nicklas, T.A. Food sources of energy and nutrients among adults in the US: NHANES 2003-2006. Nutrients 2012, 4, 2097–2120. [Google Scholar] [CrossRef] [PubMed]
- Sluik, D.; van Lee, L.; Engelen, A.I.; Feskens, E.J.M. Total, Free, and Added Sugar Consumption and Adherence to Guidelines: The Dutch National Food Consumption Survey 2007-2010. Nutrients 2016, 8, 70. [Google Scholar] [CrossRef] [PubMed]
- Sette, S.; Le Donne, C.; Piccinelli, R.; Mistura, L.; Ferrari, M.; Leclercq, C. The third National Food Consumption Survey, INRAN-SCAI 2005–06: Major dietary sources of nutrients in Italy. Int. J. Food Sci. Nutr. 2013, 64, 1014–1021. [Google Scholar] [CrossRef] [PubMed]
- Gibson, S.; Francis, L.; Newens, K.; Livingstone, B. Associations between free sugars and nutrient intakes among children and adolescents in the UK. Br. J. Nutr. 2016, 116, 1265–1274. [Google Scholar] [CrossRef] [PubMed]
- Lei, L.; Rangan, A.; Flood, V.M.; Louie, J.C.Y. Dietary intake and food sources of added sugar in the Australian population. Br. J. Nutr. 2016, 115, 868–877. [Google Scholar] [CrossRef] [PubMed] [Green Version]
- Ministry of Health, Labour and Welfare of Japan. Summary of Situation Related to Daycare Centers. 2016. Available online: http://www.mhlw.go.jp/stf/houdou/0000176137.html (accessed on 7 June 2018). (In Japanese)
- Ministry of Education, Culture, Sports, Science and Technology of Japan. School Health Statistics Survey. 2014. Available online: http://www.mext.go.jp/component/b_menu/other/__icsFiles/afieldfile/2015/03/27/1356103_3.pdf (accessed on 7 June 2018). (In Japanese)
- Ministry of Health, Labour and Welfare of Japan. National Growth Survey on Preschool Children. 2010. Available online: http://www.mhlw.go.jp/toukei/list/73-22.html (accessed on 7 June 2018). (In Japanese)
- Lanigan, J.A.; Wells, J.C.K.; Lawson, M.S.; Cole, T.J.; Lucas, A. Number of days needed to assess energy and nutrient intake in infants and young children between 6 months and 2 years of age. Eur. J. Clin. Nutr. 2004, 58, 745–750. [Google Scholar] [CrossRef] [PubMed] [Green Version]
- Sasaki, S.; Takahashi, T.; Iitoi, Y.; Iwase, Y.; Kobayashi, M.; Ishihara, J.; Akabane, M.; Tsugane, S. Food and Nutrient Intakes Assessed with Dietary Records for the Validation Study of a Self-administered Food Frequency Questionnaire in JPHC Study Cohort l. J. Epidemiol. 2003, 13, S23–S50. [Google Scholar] [CrossRef] [PubMed]
- Tani, Y.; Asakura, K.; Sasaki, S.; Hirota, N.; Notsu, A.; Todoriki, H.; Miura, A.; Fukui, M.; Date, C. The influence of season and air temperature on water intake by food groups in a sample of free-living Japanese adults. Eur. J. Clin. Nutr. 2015, 69, 907–913. [Google Scholar] [CrossRef] [PubMed]
- Livingstone, M.B.E.; Black, A.E. Markers of the validity of reported energy intake. J. Nutr. 2003, 133, 895S–920S. [Google Scholar] [CrossRef] [PubMed]
- Yasui, T.; Furukawa, T.; Hase, S. High Performance Liquid Chromatographic Determination of Saccharides in Dairy Products. Nippon Shokuhin Kogyo Gakkaishi 1980, 27, 358–362. (In Japanese) [Google Scholar] [CrossRef]
- Tsuji, M.; Komiyama, Y. Sugar composition and water activity of confectionary in Yamanashi prefecture and the other prefecture. Rep. Inst. Wine Food Technol. Yamanashi Prefect. 1986, 18, 75–85. (In Japanese) [Google Scholar]
- Ishiguro, K.; Date, Y. Sugars Content of Drinks and Ice-Cakes on Market: Separative Determination of Glucose, Fructose and Sucrose by Gaschromctography. Jpn. J. Nutr. Diet. 1980, 38, 71–77. (In Japanese) [Google Scholar] [CrossRef]
- Greenfield, H.; Southgate, D. Food Composition Data: Production, Management and Use; Food and Agriculture Organization of the United Nations: Rome, Italy, 2003. [Google Scholar]
- Yasui, A. Outline of Standard Tables of Food Composition in Japan 2015 (Seventh Revised Edition). Jpn. J. Nutr. Diet. 2016, 74, 81–88. (In Japanese) [Google Scholar] [CrossRef]
- US Department of Agriculture. USDA Database for the Added Sugars Content of Selected Foods, Release 1. Available online: https://www.ars.usda.gov/northeast-area/beltsville-md-bhnrc/beltsville-human-nutrition-research-center/nutrient-data-laboratory/docs/usda-database-for-the-added-sugars-content-of-selected-foods-release-1/ (accessed on 7 June 2018).
- Hase, S.; Kawamura, S.; Tada, M.; Yoneyama, S.; Kanaya, K. Studies on Determination of Starch in Agricultural Products Part 3 Cross-Check of the Enzymatic Method for Starch Determination. Rep. Natl. Food Res. Inst. 1980, 36, 110–114. (In Japanese) [Google Scholar]
- National Food Institute Technical University of Denmark. Frida Food Data Version 2. Available online: https://frida.fooddata.dk/index.php?lang=en (accessed on 7 June 2018).

| Toddlers a | Preschool Children a | Schoolchildren b | Adults c | |
|---|---|---|---|---|
| Data collection period | October to December 2015 | October to December 2015 | November to December 2014 | February to March 2013 |
| Population characteristics | ||||
| Number of participants | 373 | 380 | 1190 d | 392 |
| Age | 18–35 months | 3–6 years | 8–14 years | 20–69 years |
| Study setting | Nursery facilities (n = 315) | Nursery facilities (n = 315) | Elementary schools (n = 14) and junior high schools (n = 13) | 199 welfare facilities (for aged <60 years) and neighbors or acquaintances of the dietitians of welfare facilities (aged ≥60 years) |
| Study area e | 24 of 47 prefectures | 24 prefectures | 12 prefectures | 20 study areas f |
| Recruitment | Four boys and four girls aged 18–23 months and 24–35 months (16 children in total) | Two boys and two girls aged 3, 4, 5 and 6 years (16 children in total) | 30 children in each of third and fifth grades of elementary school and 30 children in the second grade of junior high school (90 children in total) | Two men and two women from each of five 10-year age groups (20–29, 30–39, 40–49, 50–59 and 60–69 years, 20 participants in total) |
| Exclusion criteria | Under diet therapy by a doctor or a dietitian at the time of the study; having particular dietary habits (such as vegetarian); or having guardians (mothers in almost all cases) whose occupation was dietitians or medical doctors | Under diet therapy by a doctor or a dietitian at the time of the study; having particular dietary habits (such as vegetarian); or having guardians (mothers in almost all cases) whose occupation was dietitians or medical doctors | None | Dietitian; not living in the prefecture in which the facility was located or its adjacent prefectures; under diet therapy by a doctor or a dietitian at the time of the study or within one year before the study; pregnant or lactating women; or history of educational admission for diabetes mellitus |
| Characteristics of DR * | ||||
| Number of days | 1 day: one weekday with a uniformed lunch provided by facilities | 3 days: two weekdays with a uniformed lunch provided by facilities and one weekend day without a uniformed lunch provided by facilities | 3 days: two weekdays with a uniformed lunch provided by schools and one weekend day without a uniformed lunch provided by schools | 4 days: three weekdays and one weekend day |
| Toddlers (Aged 18–35 Months) a | Preschool Children (Aged 3–6 Years) b | Schoolchildren (Aged 8–14 Years) b | Adults (Aged 20-69 Years) b | |||||||||||||
|---|---|---|---|---|---|---|---|---|---|---|---|---|---|---|---|---|
| Boys (n = 183) | Girls (n = 185) c | Boys (n = 186) | Girls (n = 190) c | Boys (n = 435) | Girls (n = 480) c | Men (n = 196) | Women (n = 196) c | |||||||||
| Mean | SD | Mean | SD | Mean | SD | Mean | SD | Mean | SD | Mean | SD | Mean | SD | Mean | SD | |
| Absolute Value (g/day) | ||||||||||||||||
| Available carbohydrate | 151.7 | 28.9 | 141.9 ** | 29.2 | 188.1 | 28.0 | 173.9 *** | 25.8 | 295.2 | 63.2 | 258.2 *** | 39.7 | 293.3 | 62.5 | 238.8 *** | 43.2 |
| Starch | 61.1 | 22.5 | 55.6 * | 19.8 | 116.4 | 21.1 | 107.8 *** | 19.7 | 206.0 | 50.4 | 176.3 *** | 30.3 | 203.4 | 48.3 | 153.8 *** | 31.5 |
| Total sugar | 47.5 | 16.4 | 46.1 | 16.9 | 57.5 | 12.6 | 53.0 *** | 10.6 | 68.7 | 19.7 | 64.1 *** | 15.8 | 62.2 | 24.0 | 64.5 | 20.4 |
| Sucrose | 19.5 | 9.6 | 18.2 | 9.0 | 25.0 | 6.5 | 22.9 *** | 4.9 | 29.3 | 10.8 | 27.7 | 8.4 | 31.5 | 15.6 | 34.0 | 12.9 |
| Fructose | 7.8 | 4.3 | 7.6 | 5.4 | 10.0 | 3.7 | 9.3 | 2.7 | 11.1 | 3.8 | 10.3 ** | 4.0 | 10.1 | 4.3 | 9.9 | 4.0 |
| Naturally occurring Sugar | 30.1 | 11.9 | 27.9 | 9.8 | 30.0 | 5.8 | 27.3 *** | 5.5 | 35.9 | 10.1 | 33.8 *** | 8.1 | 26.5 | 11.5 | 28.8 * | 11.3 |
| Free sugar | 17.4 | 11.9 | 18.2 | 12.7 | 27.4 | 9.3 | 25.6 * | 7.1 | 32.8 | 13.6 | 30.3 ** | 10.3 | 35.7 | 19.0 | 35.7 | 13.7 |
| Energy-Adjusted Value (% of Energy) | ||||||||||||||||
| Available carbohydrate | 54.2 | 6.4 | 54.4 | 6.4 | 53.0 | 2.9 | 52.9 | 2.8 | 52.5 | 3.2 | 51.7 *** | 3.1 | 50.5 | 6.3 | 51.0 | 3.8 |
| Starch | 32.9 | 6.9 | 32.5 | 6.4 | 32.8 | 3.7 | 32.8 | 3.0 | 36.6 | 4.2 | 35.3 *** | 3.4 | 35.1 | 5.6 | 33.0 *** | 4.6 |
| Total sugar | 17.0 | 5.3 | 17.5 | 5.2 | 16.2 | 2.9 | 16.1 | 2.8 | 12.3 | 2.9 | 12.8 ** | 2.6 | 10.7 | 4.0 | 13.6 *** | 3.4 |
| Sucrose | 6.9 | 3.2 | 6.9 | 3.2 | 7.0 | 1.6 | 6.9 | 1.2 | 5.2 | 1.6 | 5.5 ** | 1.4 | 5.4 | 2.4 | 7.1 *** | 2.2 |
| Fructose | 2.8 | 1.5 | 2.9 | 1.8 | 2.8 | 1.0 | 2.9 | 0.8 | 2.0 | 0.6 | 2.1 * | 0.7 | 1.8 | 0.8 | 2.1 *** | 0.8 |
| Naturally occurring sugar | 10.8 | 4.3 | 10.7 | 3.4 | 8.5 | 1.7 | 8.4 | 1.6 | 6.4 | 1.5 | 6.8 *** | 1.3 | 4.6 | 1.8 | 6.1 *** | 2.1 |
| Free sugar | 6.1 | 4.0 | 6.9 | 4.4 | 7.6 | 2.2 | 7.7 | 1.9 | 5.8 | 2.1 | 6.0 | 1.9 | 6.1 | 3.2 | 7.4 *** | 2.4 |
| ≥10% of energy intake from free sugar (%) | 15.3 | 21.1 | 12.9 | 11.6 | 4.1 | 3.1 | 8.7 | 13.3 | ||||||||
| ≥5% of energy intake from free sugar (%) | 51.4 | 59.5 | 90.9 | 92.1 | 61.6 | 68.8* | 55.6 | 87.8 *** | ||||||||
| Nutrients | Food Groups cd | Toddlers (Aged 18–35 Months) (n = 368) | Preschool Children (Aged 3–6 Years) (n = 376) | Schoolchildren (Aged 8–14 Years) (n = 915) | Adults (Aged 20–69 Years) (n = 392) |
|---|---|---|---|---|---|
| Available carbohydrate | Rice and grains | 42.5 | 39.3 | 46.4 | 44.5 |
| Confectionaries | 11.7 | 13.5 | 10.0 | 9.7 | |
| Fruits | 8.4 | 6.3 | 3.2 | 3.2 | |
| Dairy products | 8.0 | 5.1 | 4.5 | 1.7 | |
| Bread | 4.7 | 7.1 | 8.1 | 6.9 | |
| Noodle | 2.6 | 5.2 | 6.6 | 8.1 | |
| Others | 22.1 | 23.4 | 21.1 | 25.8 | |
| Starch | Rice and grains | 65.4 | 58.8 | 62.3 | 61.2 |
| Confectionaries | 11.3 | 11.3 | 7.7 | 7.8 | |
| Bread | 6.9 | 10.0 | 10.6 | 9.2 | |
| Noodle | 4.1 | 7.7 | 8.8 | 11.4 | |
| Others | 12.4 | 12.3 | 10.6 | 10.4 | |
| Total sugar | Dairy products | 22.7 | 15.6 | 17.5 | 6.1 |
| Fruits | 20.9 | 16.9 | 10.0 | 10.3 | |
| Confectionaries | 14.5 | 19.6 | 17.6 | 17.5 | |
| Vegetables | 10.8 | 9.7 | 13.1 | 14.3 | |
| Sugar-sweetened beverages e | 8.9 | 11.0 | 9.4 | 11.5 | |
| Sugars and jams | 6.9 | 7.1 | 9.2 | 13.2 | |
| Seasonings | 5.6 | 6.4 | 9.0 | 10.9 | |
| Others | 9.7 | 13.6 | 14.1 | 16.2 | |
| Sucrose | Confectionaries | 27.3 | 32.5 | 29.0 | 26.2 |
| Fruits | 24.9 | 18.0 | 12.0 | 11.2 | |
| Sugars and jams | 16.3 | 15.5 | 21.5 | 24.0 | |
| Sugar-sweetened beverages e | 9.3 | 10.3 | 8.7 | 11.6 | |
| Vegetables | 7.7 | 6.3 | 7.6 | 6.6 | |
| Others | 14.5 | 17.4 | 21.2 | 20.4 | |
| Fructose | Fruits | 39.3 | 30.8 | 18.6 | 17.1 |
| Vegetables | 27.5 | 24.6 | 37.9 | 37.7 | |
| Sugar-sweetened beverages e | 9.9 | 13.5 | 12.2 | 10.7 | |
| Bread | 5.4 | 7.7 | 10.5 | 10.7 | |
| Fruit juices | 5.1 | 7.7 | 3.5 | 2.7 | |
| Seasonings | 3.5 | 5.1 | 7.0 | 8.0 | |
| Others | 9.2 | 10.7 | 10.3 | 13.1 | |
| Naturally occurring sugar | Dairy products | 33.5 | 25.9 | 27.9 | 10.9 |
| Fruits | 30.6 | 28.0 | 16.1 | 17.8 | |
| Vegetables | 16.8 | 17.9 | 23.8 | 29.8 | |
| Seasonings | 3.4 | 4.7 | 7.6 | 9.3 | |
| Bread | 3.0 | 5.9 | 7.5 | 8.6 | |
| Others | 12.6 | 17.7 | 17.1 | 23.6 | |
| Free sugar | Confectionaries | 33.5 | 34.4 | 30.3 | 26.2 |
| Sugars and jams | 22.0 | 17.9 | 23.6 | 26.5 | |
| Sugar-sweetened beverages e | 16.3 | 18.4 | 14.7 | 15.6 | |
| Seasonings | 12.5 | 11.6 | 14.3 | 15.9 | |
| Others | 15.7 | 17.7 | 17.1 | 15.9 |
© 2018 by the authors. Licensee MDPI, Basel, Switzerland. This article is an open access article distributed under the terms and conditions of the Creative Commons Attribution (CC BY) license (http://creativecommons.org/licenses/by/4.0/).
Share and Cite
Fujiwara, A.; Murakami, K.; Asakura, K.; Uechi, K.; Sugimoto, M.; Wang, H.-C.; Masayasu, S.; Sasaki, S. Estimation of Starch and Sugar Intake in a Japanese Population Based on a Newly Developed Food Composition Database. Nutrients 2018, 10, 1474. https://doi.org/10.3390/nu10101474
Fujiwara A, Murakami K, Asakura K, Uechi K, Sugimoto M, Wang H-C, Masayasu S, Sasaki S. Estimation of Starch and Sugar Intake in a Japanese Population Based on a Newly Developed Food Composition Database. Nutrients. 2018; 10(10):1474. https://doi.org/10.3390/nu10101474
Chicago/Turabian StyleFujiwara, Aya, Kentaro Murakami, Keiko Asakura, Ken Uechi, Minami Sugimoto, Han-Chieh Wang, Shizuko Masayasu, and Satoshi Sasaki. 2018. "Estimation of Starch and Sugar Intake in a Japanese Population Based on a Newly Developed Food Composition Database" Nutrients 10, no. 10: 1474. https://doi.org/10.3390/nu10101474