Social and Emotional Fears and Worries Influencing the Quality of Life of Female Celiac Disease Patients Following a Gluten-Free Diet


Abstract
:1. Introduction
2. Materials and Methods
2.1. Ethics Approval Statement
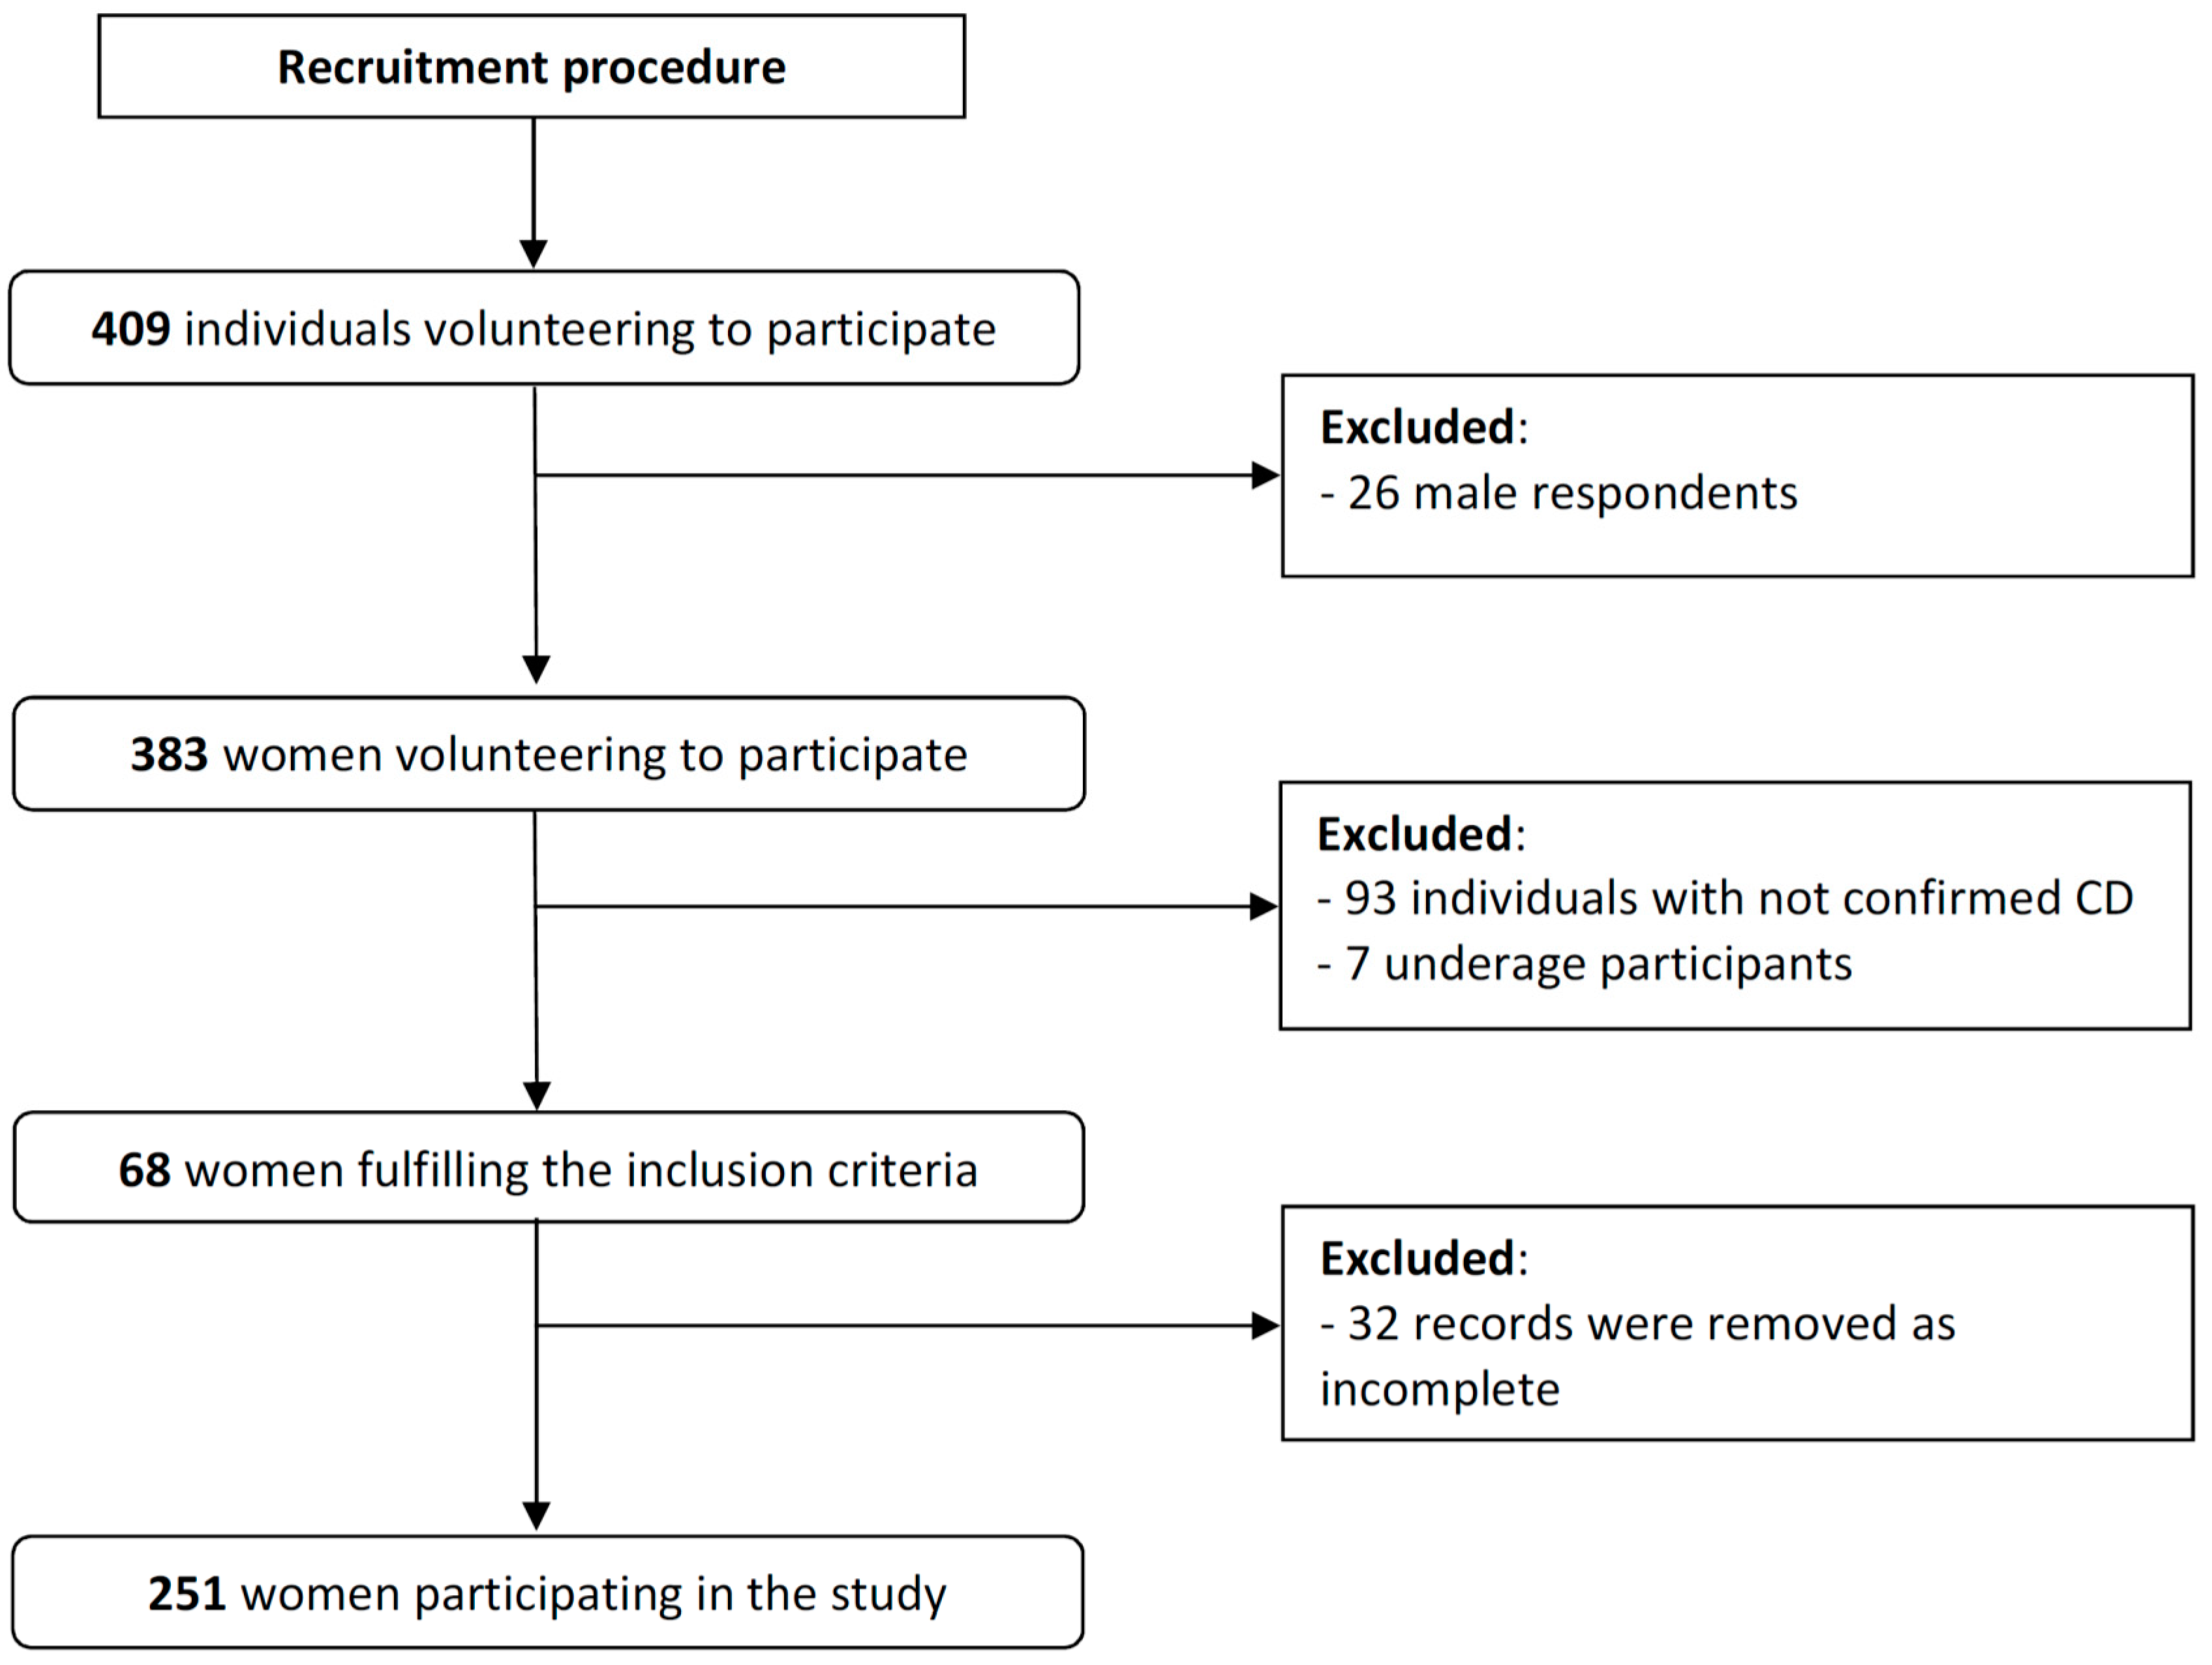
2.2. Participants
- -
- women;
- -
- aged ≥ 18 years old;
- -
- CD diagnosed and biopsy-confirmed by a physician;
- -
- declared regular meal preparation at home;
- -
- declared regular purchase of GF products.
- -
- any data missing in the completed QoL questionnaires;
- -
- lack of informed consent to participate.
2.3. Study Design
2.4. Statistical Analysis
3. Results
3.1. Characteristics of the Analyzed Group of Patients
3.2. Descriptive Statistics for the CDQ
3.3. Social and Emotional Fears and Worries Influencing the QoL of Female CD Patients Following a GFD
4. Discussion
4.1. The Influence of CD Duration and Gender on the QoL of Patients
4.2. The Influence of GFD Adherence and BMI on the QoL of Patients
4.3. The Influence of Sociodemographic Characteristics on the QoL of Patients
4.4. Limitations of the Study and Future Perspectives for the Research
5. Conclusions
- The economic status of a CD patient could be one of the most important factors influencing their social and emotional fears and worries.
- Although the low economic status of CD patients may lead to a lower QoL in terms of social and emotional fears and worries, it does not reduce the purchasing of GF products to improve mood.
- It may be supposed that low economic status may lead some CD patients to choose to relieve stress by purchasing GF products instead of other products.
Author Contributions
Funding
Conflicts of Interest
References
- Rubio-Tapia, A.; Murray, J.A. Celiac disease. Curr. Opin. Gastroenterol. 2010, 26, 116–122. [Google Scholar] [CrossRef] [PubMed]
- Häuser, W.; Stallmach, A.; Caspary, W.F.; Stein, J. Predictors of reduced health-related quality of life in adults with coeliac disease. Aliment. Pharmacol. Ther. 2007, 25, 569–578. [Google Scholar] [CrossRef] [PubMed]
- Dickson, B.C.; Streutker, C.J.; Chetty, R. Coeliac disease: An update for pathologists. J. Clin. Pathol. 2006, 59, 1008–1016. [Google Scholar] [CrossRef] [PubMed]
- Parzanese, I.; Qehajaj, D.; Patrinicola, F.; Aralica, M.; Chiriva-Internati, M.; Stifter, S.; Elli, L.; Grizzi, F. Celiac disease: From pathophysiology to treatment. World J. Gastrointest. Pathophysiol. 2017, 8, 27–38. [Google Scholar] [CrossRef] [PubMed]
- Ciacci, C.; Ciclitira, P.; Hadjivassiliou, M.; Kaukinen, K.; Ludvigsson, J.F.; McGough, N.; Sanders, D.S.; Woodward, J.; Leonard, J.N.; Swift, G.L. The gluten-free diet and its current application in coeliac disease and dermatitis herpetiformis. United Eur. Gastroenterol. J. 2015, 3, 121–135. [Google Scholar] [CrossRef] [PubMed]
- Hvas, C.L.; Jensen, M.D.; Reimer, M.C.; Riis, L.B.; Rumessen, J.J.; Skovbjerg, H.; Teisner, A.; Wildt, S. Celiac disease: Diagnosis and treatment. Dan. Med. J. 2015, 62, 5051. [Google Scholar]
- Fera, T.; Cascio, B.; Angelini, G.; Martini, S.; Guidetti, C.S. Affective disorders and quality of life in adult coeliac disease patients on a gluten-free diet. Eur. J. Gastroenterol. Hepatol. 2003, 15, 1287–1292. [Google Scholar] [CrossRef] [PubMed]
- Makharia, G.K. Current and Emerging Therapy for Celiac Disease. Front. Med. (Lausanne) 2014, 1, 6. [Google Scholar] [CrossRef] [PubMed]
- Zarkadas, M.; Cranney, A.; Case, S.; Molloy, M.; Switzer, C.; Graham, I.D.; Butzner, J.D.; Rashid, M.; Warren, R.E.; Burrows, V. The impact of a gluten-free diet on adults with coeliac disease: Results of a national survey. J. Hum. Nutr. Diet. 2006, 19, 41–49. [Google Scholar] [CrossRef] [PubMed]
- Zarkadas, M.; Dubois, S.; MacIsaac, K.; Cantin, I.; Rashid, M.; Roberts, K.C.; La Vieille, S.; Godefroy, S.; Pulido, O.M. Living with coeliac disease and a gluten-free diet: A Canadian perspective. J. Hum. Nutr. Diet. 2013, 26, 10–23. [Google Scholar] [CrossRef] [PubMed]
- Cross, C. Gluten-free industry is healthy, but is the food? CMAJ 2013, 185, 610. [Google Scholar] [CrossRef] [PubMed]
- Ludvigsson, J.F.; Bai, J.C.; Biagi, F.; Card, T.R.; Ciacci, C.; Ciclitira, P.J.; Green, P.H.; Hadjivassiliou, M.; Holdoway, A.; van Heel, D.A.; et al. Diagnosis and management of adult coeliac disease: Guidelines from the British Society of Gastroenterology. Gut 2014, 63, 1210–1228. [Google Scholar] [CrossRef] [PubMed] [Green Version]
- Samasca, G.; Sur, G.; Lupan, I.; Deleanu, D. Gluten-free diet and quality of life in celiac disease. Gastroenterol. Hepatol. Bed Bench. 2014, 7, 139–143. [Google Scholar] [PubMed]
- Pechey, R.; Monsivais, P. Supermarket Choice, Shopping Behavior, Socioeconomic Status, and Food Purchases. Am. J. Prev. Med. 2015, 49, 868–877. [Google Scholar] [CrossRef] [PubMed]
- Mącik, R.; Mącik, D.; Nalewajek, M. Consumer preferences for retail format choice—Case of polish consumers. In Proceedings of the Active Citizenship by Knowledge Management & Innovation Proceedings of the Management, Knowledge and Learning International Conference, Zadar, Croatia, 19–21 June 2013. [Google Scholar]
- Olewnik-Mikołajewska, A.; Guzek, D.; Głąbska, D.; Gutkowska, K. Consumer behaviors toward novel functional and convenient meat products in Poland. J. Sens. Stud. 2016, 31, 193–205. [Google Scholar] [CrossRef]
- Rodríguez Almagro, J.; Rodríguez Almagro, D.; Solano Ruiz, C.; Siles González, J.; Hernández Martínez, A. The experience of living with a gluten-free diet: An integrative review. Gastroenterol. Nurs. 2018, 41, 189–200. [Google Scholar] [CrossRef] [PubMed]
- Pouchot, J.; Despujol, C.; Malamut, G.; Ecosse, E.; Coste, J.; Cellier, C. Validation of a French Version of the Quality of Life “Celiac Disease Questionnaire”. PLoS ONE 2014, 9, e96346. [Google Scholar] [CrossRef] [PubMed]
- Häuser, W.; Gold, J.; Stallmach, A.; Caspary, W.F.; Stein, J. Development and validation of the Celiac Disease Questionnaire (CDQ), a disease-specific health-related quality of life measure for adult patients with celiac disease. J. Clin. Gastroenterol. 2007, 41, 157–166. [Google Scholar] [CrossRef] [PubMed]
- Tovoli, F.; Granito, A.; Negrini, G.; Guidetti, E.; Faggiano, C.; Bolondi, L. Long term effects of gluten-free diet in non-celiac wheat sensitivity. Clin. Nutr. 2017. [Google Scholar] [CrossRef] [PubMed]
- DeVellis, R.F. Scale Development; Sage Publications: Newbury Park, NJ, USA, 1991. [Google Scholar]
- Regulation (EU) No 828/2014 of 30 July 2014 on the Requirements for the Provision of Information to Consumers on the Absence or Reduced Presence of Gluten in Food. Official Journal of the European Union L 228/5. Available online: https://eur-lex.europa.eu/eli/reg_impl/2014/828/oj (accessed on 29 September 2018).
- Van Hees, N.J.; Van der Does, W.; Giltay, E.J. Coeliac disease, diet adherence and depressive symptoms. J. Psychosom. Res. 2013, 74, 155–160. [Google Scholar] [CrossRef] [PubMed]
- Kautto, E.; Rydén, P.J.; Ivarsson, A.; Olsson, C.; Norström, F.; Högberg, L.; Carlsson, A.; Hagfors, L.; Hörnell, A. What happens to food choices when a gluten-free diet is required? A prospective longitudinal population-based study among Swedish adolescent with coeliac disease and their peers. J. Nutr. Sci. 2014, 3, e2. [Google Scholar] [CrossRef] [PubMed]
- Leffler, D.A.; Dennis, M.; Edwards George, J.B.; Jamma, S.; Magge, S.; Cook, E.F.; Schuppan, D.; Kelly, C.P. A simple validated gluten-free diet adherence survey for adults with celiac disease. Clin. Gastroenterol. Hepatol. 2009, 7, 530.e2–536.e2. [Google Scholar] [CrossRef] [PubMed]
- WHO. Body Mass Index—BMI. Available online: http://www.euro.who.int/en/health-topics/disease-prevention/nutrition/a-healthy-lifestyle/body-mass-index-bmi (accessed on 10 August 2018).
- Kline, P.A. (Ed.) Computing test-reliability. In Handbook of Test Construction: Introduction to Psychometric Design; Methuen & Co.: New York, NY, USA, 1986; pp. 118–132. [Google Scholar]
- Everitt, B.S. The Cambridge Dictionary of Statistics, 2nd ed.; Cambridge University Press: Cambridge, UK, 2002. [Google Scholar]
- Kurppa, K.; Collin, P.; Mäki, M.; Kaukinen, K. Celiac disease and health-related quality of life. Expert Rev. Gastroenterol. Hepatol. 2011, 5, 83–90. [Google Scholar] [CrossRef] [PubMed]
- Ciacci, C.; D’Agate, C.; De Rosa, A.; Franzese, C.; Errichiello, S.; Gasperi, V.; Pardi, A.; Quagliata, D.; Visentini, S.; Greco, L. Self-rated quality of life in celiac disease. Dig. Dis. Sci. 2003, 48, 2216–2220. [Google Scholar] [CrossRef] [PubMed]
- Wagner, G.; Berger, G.; Sinnreich, U.; Grylli, V.; Schober, E.; Huber, W.D.; Karwautz, A. Quality of life in adolescents with treated coeliac disease: Influence of compliance and age at diagnosis. J. Pediatr. Gastroenterol. Nutr. 2008, 47, 555–561. [Google Scholar] [CrossRef] [PubMed]
- Rubio-Tapia, A.; Rahim, M.W.; See, J.A.; Lahr, B.D.; Wu, T.T.; Murray, J.A. Mucosal recovery and mortality in adults with celiac disease after treatment with a gluten-free diet. Am. J. Gastroenterol. 2010, 105, 1412–1420. [Google Scholar] [CrossRef] [PubMed]
- Corrao, G.; Corazza, G.R.; Bagnardi, V.; Brusco, G.; Ciacci, C.; Cottone, M.; Sategna Guidetti, C.; Usai, P.; Cesari, P.; Pelli, M.A.; et al. Mortality in patients with coeliac disease and their relatives: A cohort study. Lancet 2001, 358, 356–361. [Google Scholar] [CrossRef]
- Casellas, F.; Rodrigo, L.; Vivancos, J.L.; Riestra, S.; Pantiga, C.; Baudet, J.S.; Junquera, F.; Puig Diví, V.; Abadia, C.; Papo, M.; et al. Factors that impact health-related quality of life in adults with celiac disease: A multicenter study. World J. Gastroenterol. 2008, 14, 46–52. [Google Scholar] [CrossRef] [PubMed]
- Carvalho, M.A.; Silva, I.B.; Ramos, S.B.; Coelho, L.F.; Gonçalves, I.D.; Figueiredo Neto, J.A. Quality of life of hypertensive patients and comparison of two instruments of HRQOL measure. Arq. Bras. Cardiol. 2012, 98, 442–451. [Google Scholar] [CrossRef] [PubMed]
- Gijsberts, C.M.; Agostoni, P.; Hoefer, I.E.; Asselbergs, F.W.; Pasterkamp, G.; Nathoe, H.; Appelman, Y.E.; de Kleijn, D.P.; den Ruijter, H.M. Gender differences in health-related quality of life in patients undergoing coronary angiography. Open Heart 2015, 2, 000231. [Google Scholar] [CrossRef] [PubMed]
- De la Cruz, M.S.D.; Lai, Z.; Goodrich, D.E.; Kilbourne, A.M. Gender Differences in Health-Related Quality of Life in Patients with Bipolar Disorder. Arch. Womens Ment. Health 2013, 16, 317–323. [Google Scholar] [CrossRef] [PubMed]
- Theethira, T.G.; Dennis, M. Celiac disease and the gluten-free diet: Consequences and recommendations for improvement. Dig. Dis. 2015, 33, 175–182. [Google Scholar] [CrossRef] [PubMed]
- Viljamaa, M.; Collin, P.; Huhtala, H.; Sievänen, H.; Mäki, M.; Kaukinen, K. Is coeliac disease screening in risk groups justified? A fourteen-year follow-up with special focus on compliance and quality of life. Aliment. Pharmacol. Ther. 2005, 22, 317–324. [Google Scholar] [CrossRef] [PubMed] [Green Version]
- Hopman, E.G.; Koopman, H.M.; Wit, J.M.; Mearin, M.L. Dietary compliance and health-related quality of life in patients with coeliac disease. Eur. J. Gastroenterol. Hepatol. 2009, 21, 1056–1061. [Google Scholar] [CrossRef] [PubMed]
- Hallert, C.; Grännö, C.; Grant, C.; Hultén, S.; Midhagen, G.; Ström, M.; Svensson, H.; Valdimarsson, T.; Wickström, T. Quality of life of adult coeliac patients treated for 10 years. Scand. J. Gastroenterol. 1998, 33, 933–938. [Google Scholar] [CrossRef] [PubMed]
- Seminerio, J.L.; Koutroubakis, I.E.; Ramos-Rivers, C.; Hashash, J.G.; Dudekula, A.; Regueiro, M.; Baidoo, L.; Barrie, A.; Swoger, J.; Schwartz, M.; et al. Impact of Obesity on the Management and Clinical Course of Patients with Inflammatory Bowel Disease. Inflamm. Bowel Dis. 2015, 21, 2857–2863. [Google Scholar] [CrossRef] [PubMed]
- Slagboom, J.; Asscher, V.; Meijer, L.; Waars, S.; Van der Meulen-de Jong, A.; Maljaars, J. P299 Relation of body mass index and health outcomes in elderly patients with inflammatory bowel disease (IBD). J. Crohn’s Colitis 2018, 12, S251–S252. [Google Scholar] [CrossRef] [Green Version]
- Greuter, T.; Porchet, F.; Fournier, N.; Biedermann, L.; Schreiner, P.; Scharl, M.; Schoepfer, A.; Safroneeva, E.; Straumann, A.; Rogler, G.; et al. P192 Extreme body mass indices are frequent in inflammatory bowel disease patients and are associated with higher disease activity in Crohn’s disease, but not in ulcerative colitis: A cross-sectional analysis of the Swiss IBD cohort study. J. Crohn’s Colitis 2018, 12, S195. [Google Scholar] [CrossRef]
- Ul-Haq, Z.; Mackay, D.F.; Fenwick, E.; Pell, J.P. Meta-analysis of the association between body mass index and health-related quality of life among adults, assessed by the SF-36. Obesity 2013, 21, 322–327. [Google Scholar] [CrossRef] [PubMed]
- Sherwin, L.B.; Ozoji, O.M.; Boulineaux, C.M.; Joseph, P.V.; Fourie, N.H.; Abey, S.K.; Zhang, X.; Henderson, W.A. Gender and Weight Influence Quality of Life in Irritable Bowel Syndrome. J. Clin. Med. 2017, 6, 103. [Google Scholar] [CrossRef] [PubMed]
- Rajpoot, P.; Makharia, G.K. Problems and challenges to adaptation of gluten free diet by Indian patients with celiac disease. Nutrients 2013, 5, 4869–4879. [Google Scholar] [CrossRef] [PubMed]
- Singh, J.; Whelan, K. Limited availability and higher cost of gluten-free foods. J. Hum. Nutr. Diet. 2011, 24, 479–486. [Google Scholar] [CrossRef] [PubMed]
- Pourhoseingholi, M.A.; Rostami-Nejad, M.; Barzegar, F.; Rostami, K.; Volta, U.; Sadeghi, A.; Honarkar, Z.; Salehi, N.; Asadzadeh-Aghdaei, H.; Baghestani, A.R.; et al. Economic burden made celiac disease an expensive and challenging condition for Iranian patients. Gastroenterol. Hepatol. Bed Bench 2017, 10, 258–262. [Google Scholar] [PubMed]
- Davenport, K.; Houston, J.E.; Griffiths, M.D. Excessive eating and compulsive buying behaviours in women: An empirical pilot study examining reward sensitivity, anxiety, impulsivity, self-esteem and social desirability. Int. J. Ment. Health Addict. 2012, 10, 474–489. [Google Scholar] [CrossRef]
- Comino, I.; Fernández-Bañares, F.; Esteve, M.; Ortigosa, L.; Castillejo, G.; Fambuena, B.; Ribes-Koninckx, C.; Sierra, C.; Rodríguez-Herrera, A.; Salazar, J.C.; et al. Fecal Gluten Peptides Reveal Limitations of Serological Tests and Food Questionnaires for Monitoring Gluten-Free Diet in Celiac Disease Patients. Am. J. Gastroenterol. 2016, 111, 1456–1465. [Google Scholar] [CrossRef] [PubMed] [Green Version]
- Moreno, M.D.L.; Rodríguez-Herrera, A.; Sousa, C.; Comino, I. Biomarkers to Monitor Gluten-Free Diet Compliance in Celiac Patients. Nutrients 2017, 9, 46. [Google Scholar] [CrossRef] [PubMed]
- Ciacci, C.; Cirillo, M.; Cavallaro, R.; Mazzacca, G. Long-term follow-up of celiac adults on gluten-free diet: Prevalence and correlates of intestinal damage. Digestion 2002, 66, 178–185. [Google Scholar] [CrossRef] [PubMed]
- Muhammad, H.; Reeves, S.; Ishaq, S.; Mayberry, J.; Jeanes, Y.M. Adherence to a Gluten Free Diet Is Associated with Receiving Gluten Free Foods on Prescription and Understanding Food Labelling. Nutrients 2017, 9, 705. [Google Scholar] [CrossRef] [PubMed]
- Bardella, M.T.; Fredella, C.; Saladino, V.; Trovato, C.; Cesana, B.M.; Quatrini, M.; Prampolini, L. Gluten intolerance: Gender- and age-related differences in symptoms. Scand. J. Gastroenterol. 2005, 40, 15–19. [Google Scholar] [CrossRef] [PubMed]
- Meyer, S.; Rosenblum, S. Activities, Participation and Quality of Life Concepts in Children and Adolescents with Celiac Disease: A Scoping Review. Nutrients 2017, 9, 929. [Google Scholar] [CrossRef] [PubMed]


| Characteristics | Category | Number of Respondents (%) |
|---|---|---|
| CD duration | Over 3 years | 130 (45.0) |
| Below 3 years | 138 (55.0) | |
| GFD adherence 1 | 1 | 2 (0.8) |
| 2 | 31 (12.4) | |
| 3 | 26 (10.4) | |
| 4 | 185 (73.7) | |
| 0 | 7 (2.8) | |
| BMI (kg/m2) 2 | <18.5—underweight | 38 (15.3) |
| 18.5–24.9—normal weight | 165 (66.3) | |
| 25–29.9—overweight | 46 (18.5) | |
| Place of residence | Village | 49 (19.5) |
| Town up to 100,000 residents | 72 (28.7) | |
| Cities over 100,000 residents | 130 (51.8) | |
| Educational level | Primary and secondary | 61 (24.3) |
| Postgraduate | 57 (22.7) | |
| University degree | 133 (53.0) | |
| Economic status | Very bad | 5 (2.0) |
| Bad | 18 (7.2) | |
| Average | 119 (47.4) | |
| Good | 84 (33.5) | |
| Very good | 25 (10.0) |
| Characteristics | Measure | Emotional (7–49) | Social (7–49) | Worries (5–35) | |
|---|---|---|---|---|---|
| Score | Mean ± SD | 27.2 ± 9.6 | 36.1 ± 9.7 | 19.6 ± 6.1 | |
| 95% CI | (26.2–28.2) | (34.9–37.3) | (19.6–20.4) | ||
| Median | 26.0 1 | 38.0 1 | 19.0 1 | ||
| Min–max | 7.0–49.0 | 8.0–49.0 | 6.0–35.0 | ||
| 25th–75th | 22–33 | 29–45 | 14–24 | ||
| Data quality | Floor effect | % | 1 | 0 | 0 |
| Ceiling effect | % | 1 | 20 | 2 | |
| Scaling assumptions | Item internal consistency | Item-scale correlation (corrected for overlap) | 0.41–0.66 | 0.38–0.74 | 0.25–0.48 |
| Pearson item-scale correlation ≥ 30% 2 | 100% | 100% | 80% | ||
| Internal consistency reliability | Cronbach’s alpha | 0.88 | 0.88 | 0.74 | |
| Categories | Mean ± SD | Median (min–max) | p-Value 1 | |
|---|---|---|---|---|
| CD duration | Over 3 years | 27.1 ± 7.8 | 27.0 (7.0–47.0) | 0.8851 |
| Below 3 years | 27.2 ± 8.3 | 26.0 (11.0–49.0) | ||
| GFD adherence 3 | 1 | 26.0 ± 1.4 | 26.0 (25.0–27.0) 2 | 0.6714 |
| 2 | 27.1 ± 8.5 | 24.5 (18.0–48.0) 2 | ||
| 3 | 25.2 ± 6.9 | 23.0 (14.0–42.0) | ||
| 4 | 27.5 ± 8.2 | 27.0 (7.0–49.0) | ||
| 0 | 23.6 ± 7.0 | 22.0 (15.0–35.0) | ||
| BMI category | Underweight | 25.7 ± 9.0 | 25.0 (7.0–43.0) | 0.5127 |
| Normal weight | 27.3 ± 8.1 | 27.0 (11.0–49.0) 2 | ||
| Overweight | 27.8 ± 7.2 | 27.0 (14.0–48.0) | ||
| Place of residence | Village | 28.5 ± 6.7 | 29.0 (13.0–49.0) | 0.5299 |
| Town up to 100,000 residents | 26.2 ± 9.1 | 23.5 (7.0–48.0) | ||
| Town over 100,000 residents | 27.2 ± 7.9 | 26.0 (11.0–46.0) | ||
| Educational level | Primary and Secondary | 25.1 ± 7.6 | 23.0 (7.0–43.0) 2 | 0.0594 |
| Postgraduate | 25.9 ± 8.0 | 25.0 (11.0–48.0) | ||
| University degree | 28.6 ± 8.1 | 28.0 (11.0–49.0) | ||
| Economic status | Very bad and bad | 21.5 ± 7.3 | 21.0 (11.0–42.0) 2 | 0.0015 |
| Average | 26.5 ± 7.8 | 25.0 (7.0–49.0) | ||
| Good and very good | 29.1 ± 7.8 | 28.0 (13.0–46.0) | ||
| Categories | Mean ± SD | Median (min–max) | p-Value 1 | |
|---|---|---|---|---|
| CD duration | Over 3 years | 35.2 ± 9.6 | 36.0 (8.0–49.0) 2 | 0.2012 |
| Below 3 years | 36.9 ± 9.7 | 39.0 (14.0–49.0) 2 | ||
| GFD adherence 3 | 1 | 36.5 ± 14.9 | 36.0 (26.0–47.0) 2 | 0.2526 |
| 2 | 38.1 ± 9.6 | 41.0 (14.0–49.0) 2 | ||
| 3 | 34.8 ± 10.8 | 37.0 (14.0–49.0) | ||
| 4 | 36.2 ± 9.5 | 38.0 (8.0–49.0) | ||
| 0 | 30.3 ± 10.4 | 27.0 (17.0–46.0) | ||
| BMI category | Underweight | 35.9 ± 10.8 | 38.5 (8.0–49.0) 2 | 0.5055 |
| Normal weight | 36.5 ± 9.1 | 38.0 (14.0–49.0) 2 | ||
| Overweight | 35.1 ± 11.0 | 39.0 (11.0–49.0) 2 | ||
| Place of residence | Village | 37.4 ± 9.1 | 40.5 (17.0–49.0) 2 | 0.2662 |
| Town up to 100,000 residents | 34.2 ± 9.5 | 33.0 (15.0–49.0) 2 | ||
| Town over 100,000 residents | 36.7 ± 9.9 | 39.0 (8.0–49.0) 2 | ||
| Educational level | Primary and Secondary | 33.9 ± 10.6 | 33.0 (8.0–49.0) 2 | 0.3328 |
| Postgraduate | 35.8 ± 9.4 | 39.0 (11.0–49.0) 2 | ||
| University degree | 37.3 ± 9.3 | 39.0 (14.0–49.0) 2 | ||
| Economic status | Very bad and bad | 28.9 ± 11.2 | 27.0 (8.0–48.0) | 0.0023 |
| Average | 35.7 ± 9.6 | 37.0 (11.0–49.0) 2 | ||
| Good and very good | 38.2 ± 8.7 | 40.0 (16.0–49.0) 2 | ||
| Categories | Mean ± SD | Median (min–max) | p-Value 1 | |
|---|---|---|---|---|
| CD duration | Over 3 years | 19.1 ± 6.5 | 18.0 (7.0–35.0) 2 | 0.3352 |
| Below 3 years | 20.0 ± 6.7 | 20.0 (6.0–35.0) 2 | ||
| GFD adherence 3 | 1 | 18.0 ± 2.8 | 18.0 (16.0–20.0) 2 | 0.2462 |
| 2 | 21.0 ± 7.1 | 21.0 (8.0–34.0) 2 | ||
| 3 | 19.1 ± 7.7 | 18.0 (8.0–34.0) | ||
| 4 | 19.7 ± 6.3 | 19.0 (7.0–35.0) | ||
| 0 | 14.3 ± 8.9 | 13.0 (6.0–33.0) 2 | ||
| BMI category | Underweight | 19.8 ± 7.0 | 19.0 (8.0–35.0) | 0.7485 |
| Normal weight | 19.6 ± 6.4 | 19.0 (6.0–35.0) 2 | ||
| Overweight | 19.5 ± 7.2 | 20.0 (7.0–33.0) | ||
| Place of residence | Village | 20.2 ± 7.2 | 20.0 (8.0–35.0) | 0.0816 |
| Town up to 100,000 residents | 18.1 ± 6.0 | 18.0 (6.0–33.0) | ||
| Town over 100,000 residents | 20.2 ± 6.6 | 20.0 (7.0–35.0) | ||
| Educational level | Primary and Secondary | 18.7 ± 6.9 | 17.5 (8.0–35.0) 2 | 0.7919 |
| Postgraduate | 19.7 ± 6.4 | 20.0 (6.0–34.0) | ||
| University degree | 19.9 ± 6.6 | 19.0 (8.0–35.0) 2 | ||
| Economic status | Very bad and bad | 14.8 ± 5.1 | 15.0 (6.0–24.0) | 0.0015 |
| Average | 19.3 ± 6.7 | 19.0 (7.0–34.0) 2 | ||
| Good and very good | 20.9 ± 6.3 | 21.0 (8.0–35.0) | ||
| Categories | Mean ± SD 4 | Median (Min–Max) | p-Value 1 | |
|---|---|---|---|---|
| CD duration | Over 3 years | 4.2 ± 1.8 | 3.0 (1.0–7.0) 2 | 0.7272 |
| Below 3 years | 4.2 ± 1.9 | 4.0 (1.0–7.0) 2 | ||
| GFD adherence 3 | 1 | 5.0 ± 0.0 | 5.0 (5.0–5.0) 2 | 0.1981 |
| 2 | 4.8 ± 1.8 | 5.5 (2.0–7.0) 2 | ||
| 3 | 3.9 ± 1.9 | 3.0 (1.0–7.0) 2 | ||
| 4 | 4.2 ± 1.9 | 4.0 (1.0–7.0) 2 | ||
| 0 | 3.1 ± 1.8 | 3.0 (2.0–7.0) 2 | ||
| BMI category | Underweight | 4.4 ± 2.0 | 4.0 (1.0–7.0) 2 | 0.3959 |
| Normal weight | 4.2 ± 1.9 | 4.0 (1.0–7.0) 2 | ||
| Overweight | 4.0 ± 1.9 | 3.0 (1.0–7.0) 2 | ||
| Place of residence | Village | 4.4 ± 1.9 | 4.0 (1.0–7.0) 2 | 0.2567 |
| Town up to 100,000 residents | 3.9 ± 1.8 | 3.0 (1.0–7.0) 2 | ||
| Town over 100,000 residents | 4.3 ± 1.9 | 4.0 (1.0–7.0) 2 | ||
| Educational level | Primary and Secondary | 4.4 ± 1.8 | 4.0 (1.0–7.0) 2 | 0.4635 |
| Postgraduate | 3.9 ± 1.7 | 3.0 (1.0–7.0) 2 | ||
| University degree | 4.2 ± 2.0 | 4.0 (1.0–7.0) 2 | ||
| Economic status | Very bad and bad | 3.2 ± 1.7 | 3.0 (1.0–6.0) 2 | 0.0029 |
| Average | 4.0 ± 1.8 | 3.0 (1.0–7.0) 2 | ||
| Good and very good | 4.6 ± 1.9 | 5.0 (1.0–7.0) 2 | ||
| Categories | Mean ± SD 4 | Median (min–max) | p-Value 1 | |
|---|---|---|---|---|
| CD duration | Over 3 years | 3.9 ± 1.5 | 4.0 (1.0–7.0) 2 | 0.7936 |
| Below 3 years | 3.9 ± 1.7 | 3.0 (1.0–7.0) 2 | ||
| GFD adherence 3 | 1 | 5.0 ± 0.0 | 5.0 (5.0–5.0) 2 | 0.2695 |
| 2 | 3.9 ± 1.6 | 3.5 (1.0–7.0) 2 | ||
| 3 | 3.3 ± 1.4 | 3.0 (1.0–7.0) 2 | ||
| 4 | 4.1 ± 1.7 | 4.0 (1.0–7.0) 2 | ||
| 0 | 3.1 ± 1.4 | 3.0 (2.0–6.0) 2 | ||
| BMI category | Underweight | 4.1 ± 1.8 | 4.0 (1.0–7.0) 2 | 0.5132 |
| Normal weight | 4.0 ± 1.6 | 3.0 (1.0–7.0) 2 | ||
| Overweight | 3.7 ± 1.6 | 3.0 (1.0–7.0) 2 | ||
| Place of residence | Village | 4.4 ± 1.7 | 4.0 (1.0–7.0) 2 | 0.0847 |
| Town up to 100,000 residents | 4.0 ± 1.6 | 3.0 (1.0–7.0) 2 | ||
| Town over 100,000 residents | 3.8 ± 1.6 | 3.0 (1.0–7.0) 2 | ||
| Educational level | Primary and Secondary | 4.1 ± 1.6 | 3.5 (1.0–7.0) 2 | 0.3801 |
| Postgraduate | 3.6 ± 1.7 | 3.0 (1.0–7.0) 2 | ||
| University degree | 4.0 ± 1.6 | 4.0 (1.0–7.0) 2 | ||
| Economic status | Very bad and bad | 3.2 ± 1.2 | 3.0 (1.0–7.0) 2 | 0.0605 |
| Average | 3.8 ± 1.6 | 3.0 (1.0–7.0) 2 | ||
| Good and very good | 4.2 ± 1.7 | 4.0 (1.0–7.0) 2 | ||
© 2018 by the authors. Licensee MDPI, Basel, Switzerland. This article is an open access article distributed under the terms and conditions of the Creative Commons Attribution (CC BY) license (http://creativecommons.org/licenses/by/4.0/).
Share and Cite
Zysk, W.; Głąbska, D.; Guzek, D. Social and Emotional Fears and Worries Influencing the Quality of Life of Female Celiac Disease Patients Following a Gluten-Free Diet. Nutrients 2018, 10, 1414. https://doi.org/10.3390/nu10101414
Zysk W, Głąbska D, Guzek D. Social and Emotional Fears and Worries Influencing the Quality of Life of Female Celiac Disease Patients Following a Gluten-Free Diet. Nutrients. 2018; 10(10):1414. https://doi.org/10.3390/nu10101414
Chicago/Turabian StyleZysk, Wioleta, Dominika Głąbska, and Dominika Guzek. 2018. "Social and Emotional Fears and Worries Influencing the Quality of Life of Female Celiac Disease Patients Following a Gluten-Free Diet" Nutrients 10, no. 10: 1414. https://doi.org/10.3390/nu10101414
APA StyleZysk, W., Głąbska, D., & Guzek, D. (2018). Social and Emotional Fears and Worries Influencing the Quality of Life of Female Celiac Disease Patients Following a Gluten-Free Diet. Nutrients, 10(10), 1414. https://doi.org/10.3390/nu10101414