
The Use of Remotely Sensed Rainfall for Managing Drought Risk: A Case Study of Weather Index Insurance in Zambia

 , and
, and
Abstract
:
1. Introduction
2. Data and Methods
2.1. Representation of Agricultural Drought Using the Joint UK Land Environment Simulator (JULES)
2.2. TAMSAT and TAMSAT Rainfall Ensembles
2.2.1. The TAMSAT Method
2.2.2. TAMSAT Rainfall Ensembles
2.3. Crop Yield Loss Data
- Information on farmer experience collected via semi-structured interviews. Inevitably these focus on the “worst years”, which farmers’ remember, and there is a bias towards recent years,
- Feedback from field staff of distribution channels, including agricultural extension agencies and suppliers of agricultural inputs, and
- A simple yield stress model, relating rainfall deviation and multiplicative crop yield factors to calculated yield deviations for cotton for different historical years (based on FAO crop yield stress factors), supplemented by occurrence of droughts reported in the scientific literature.
3. Results and Discussion
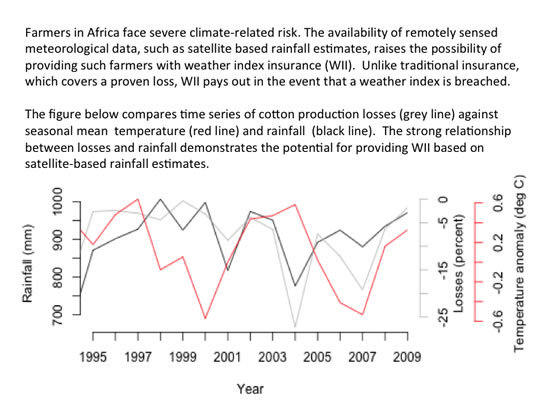
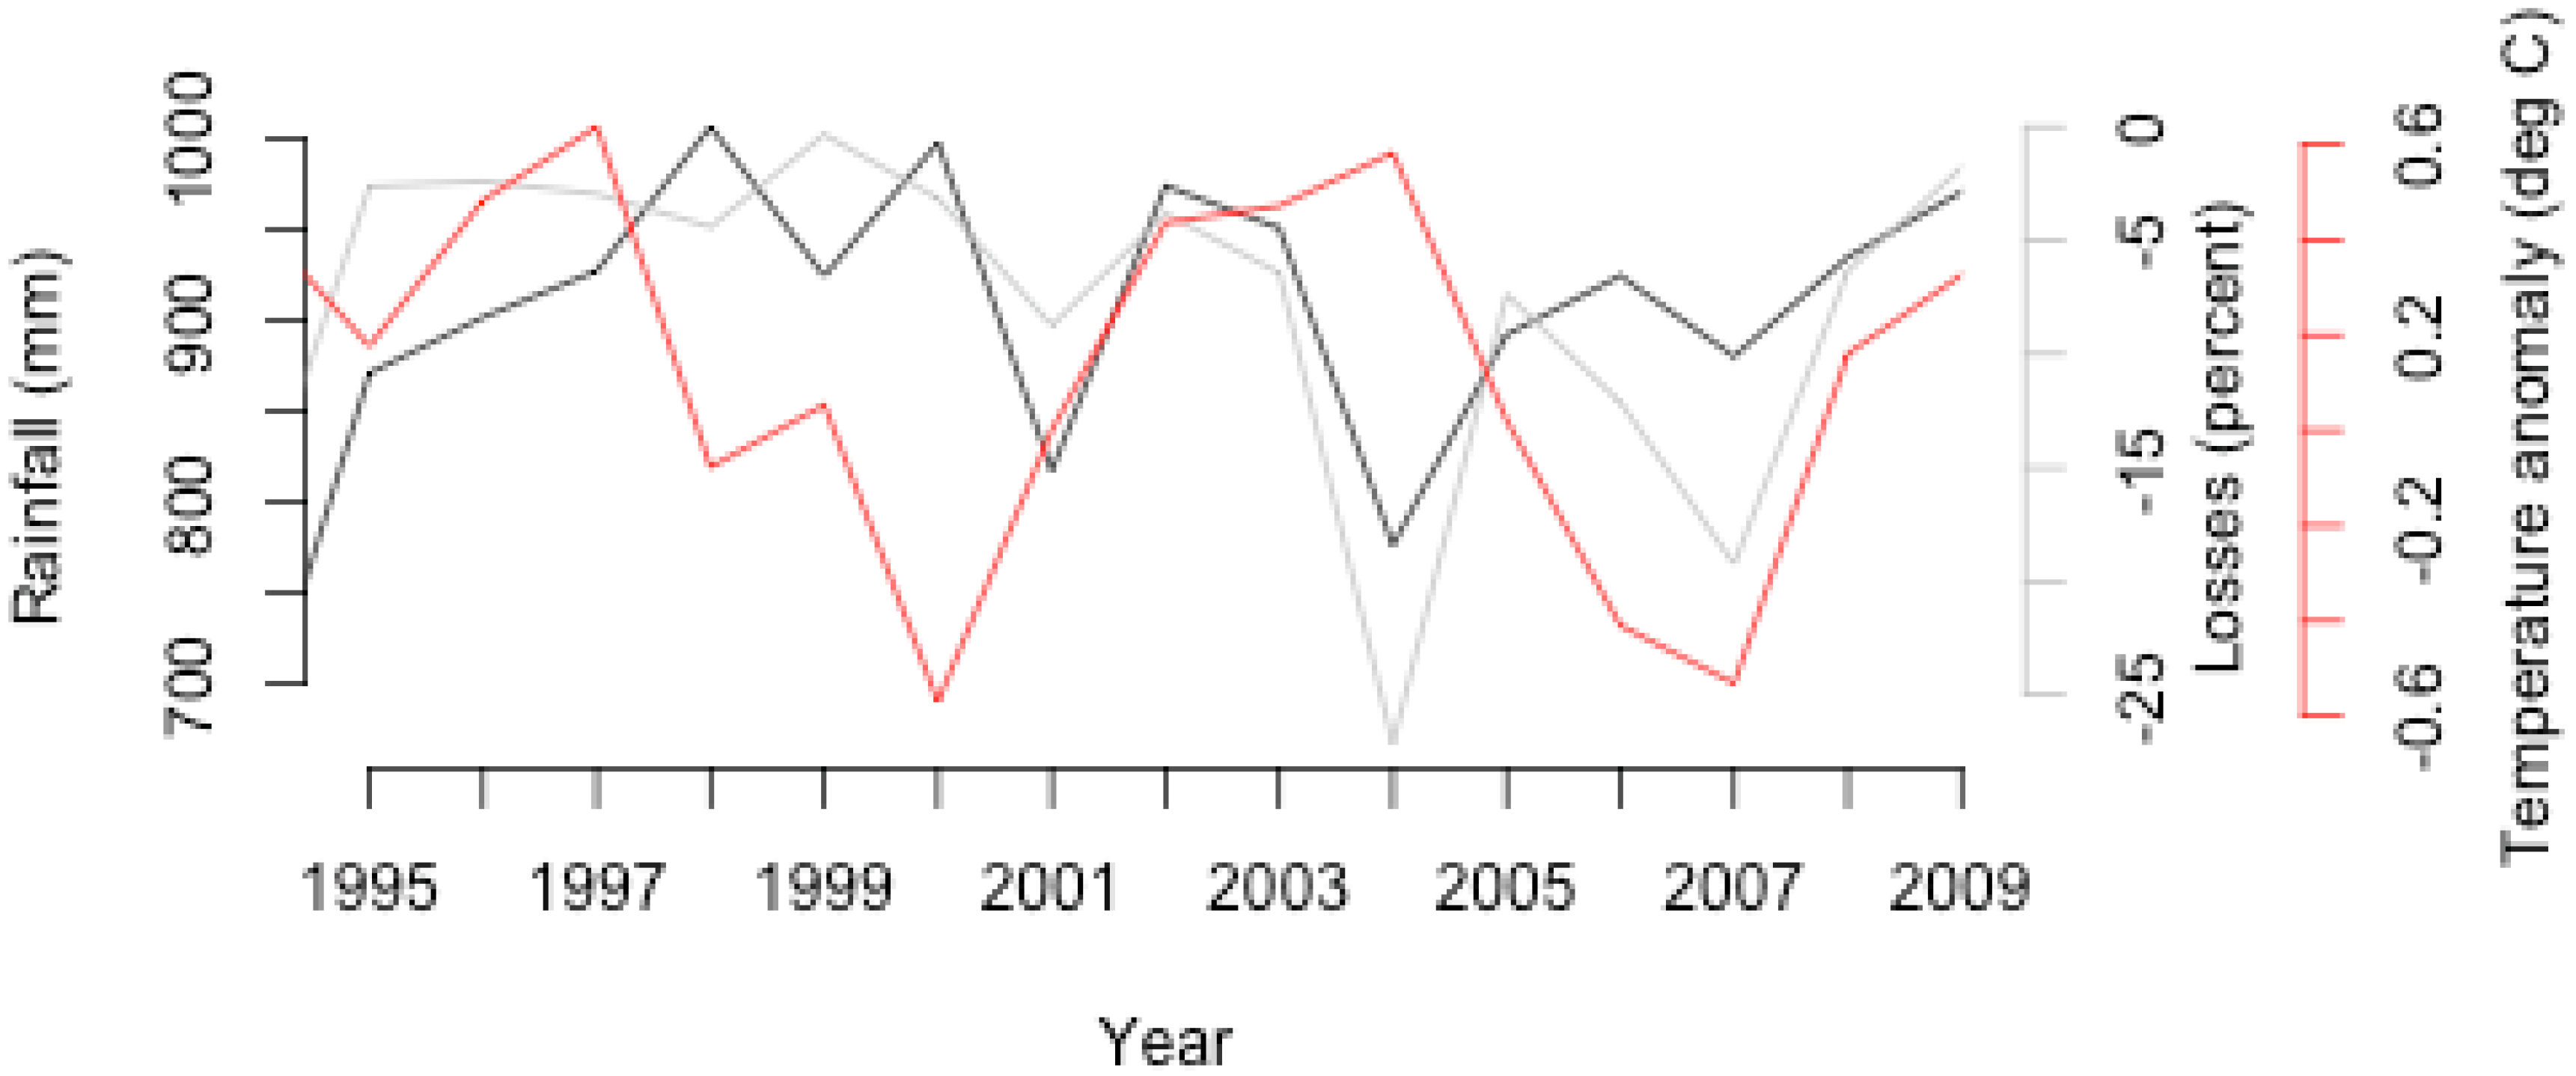
3.1. Association between Cotton Yield and Rainfall
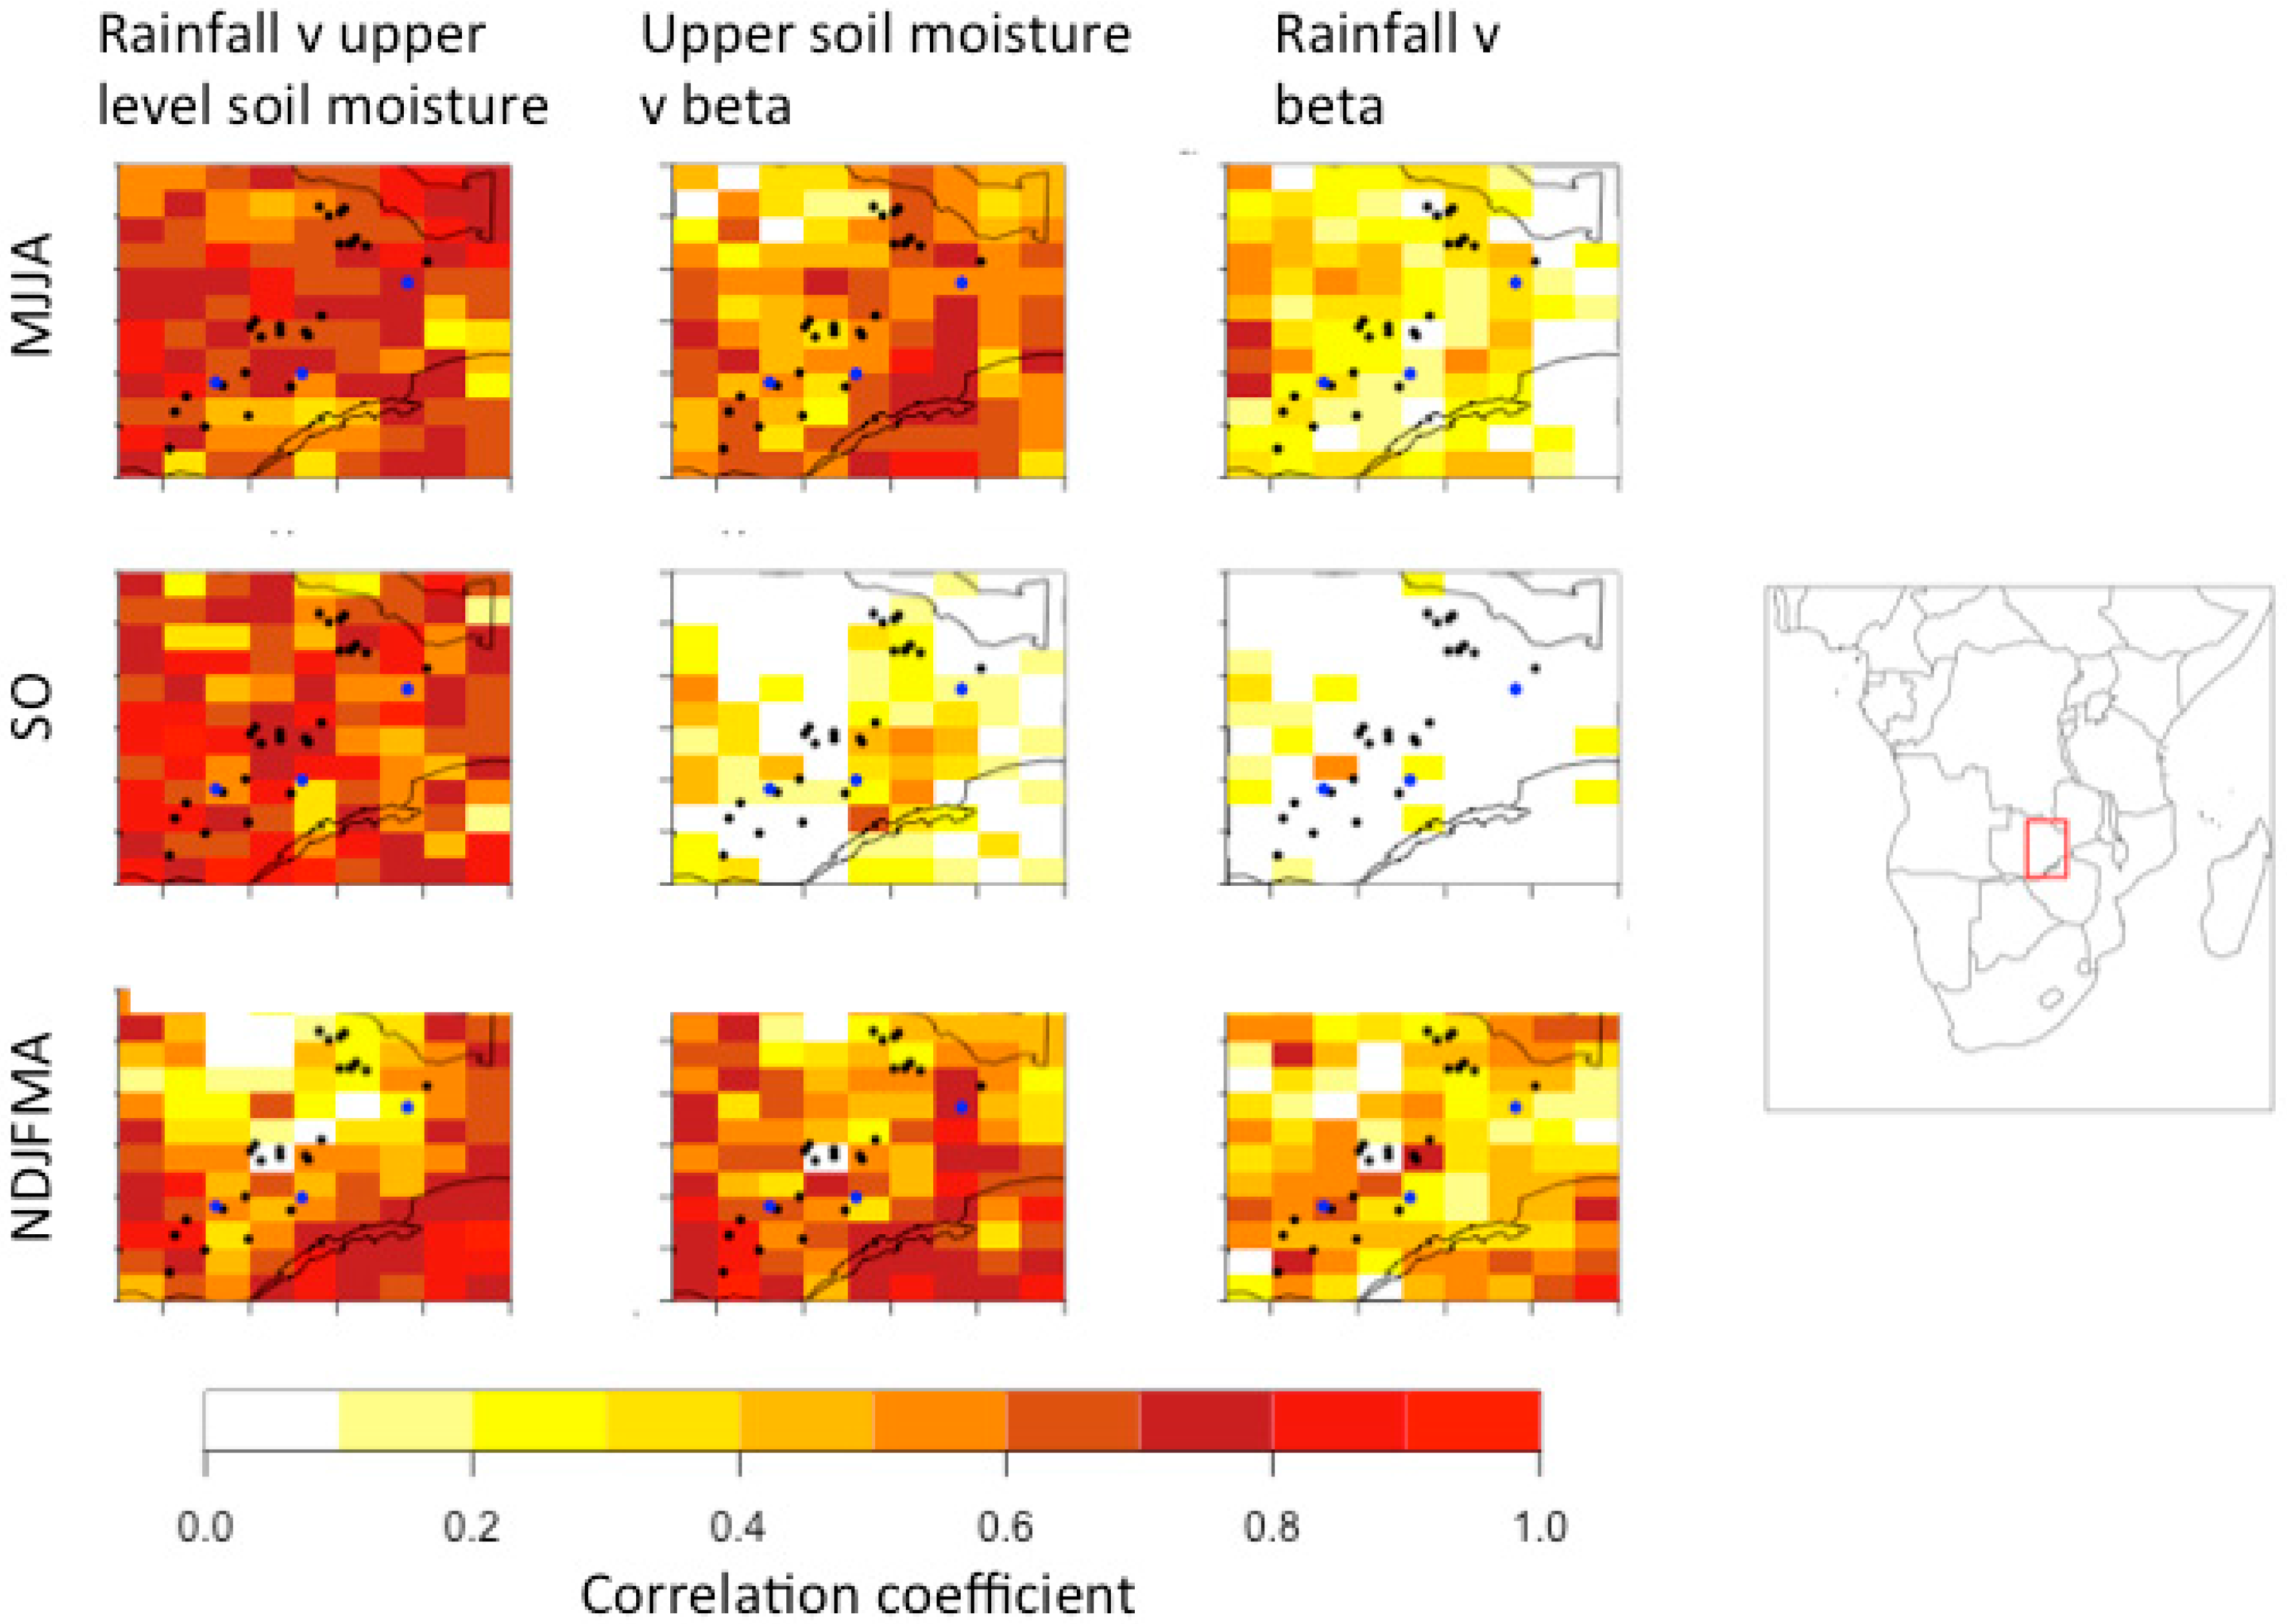
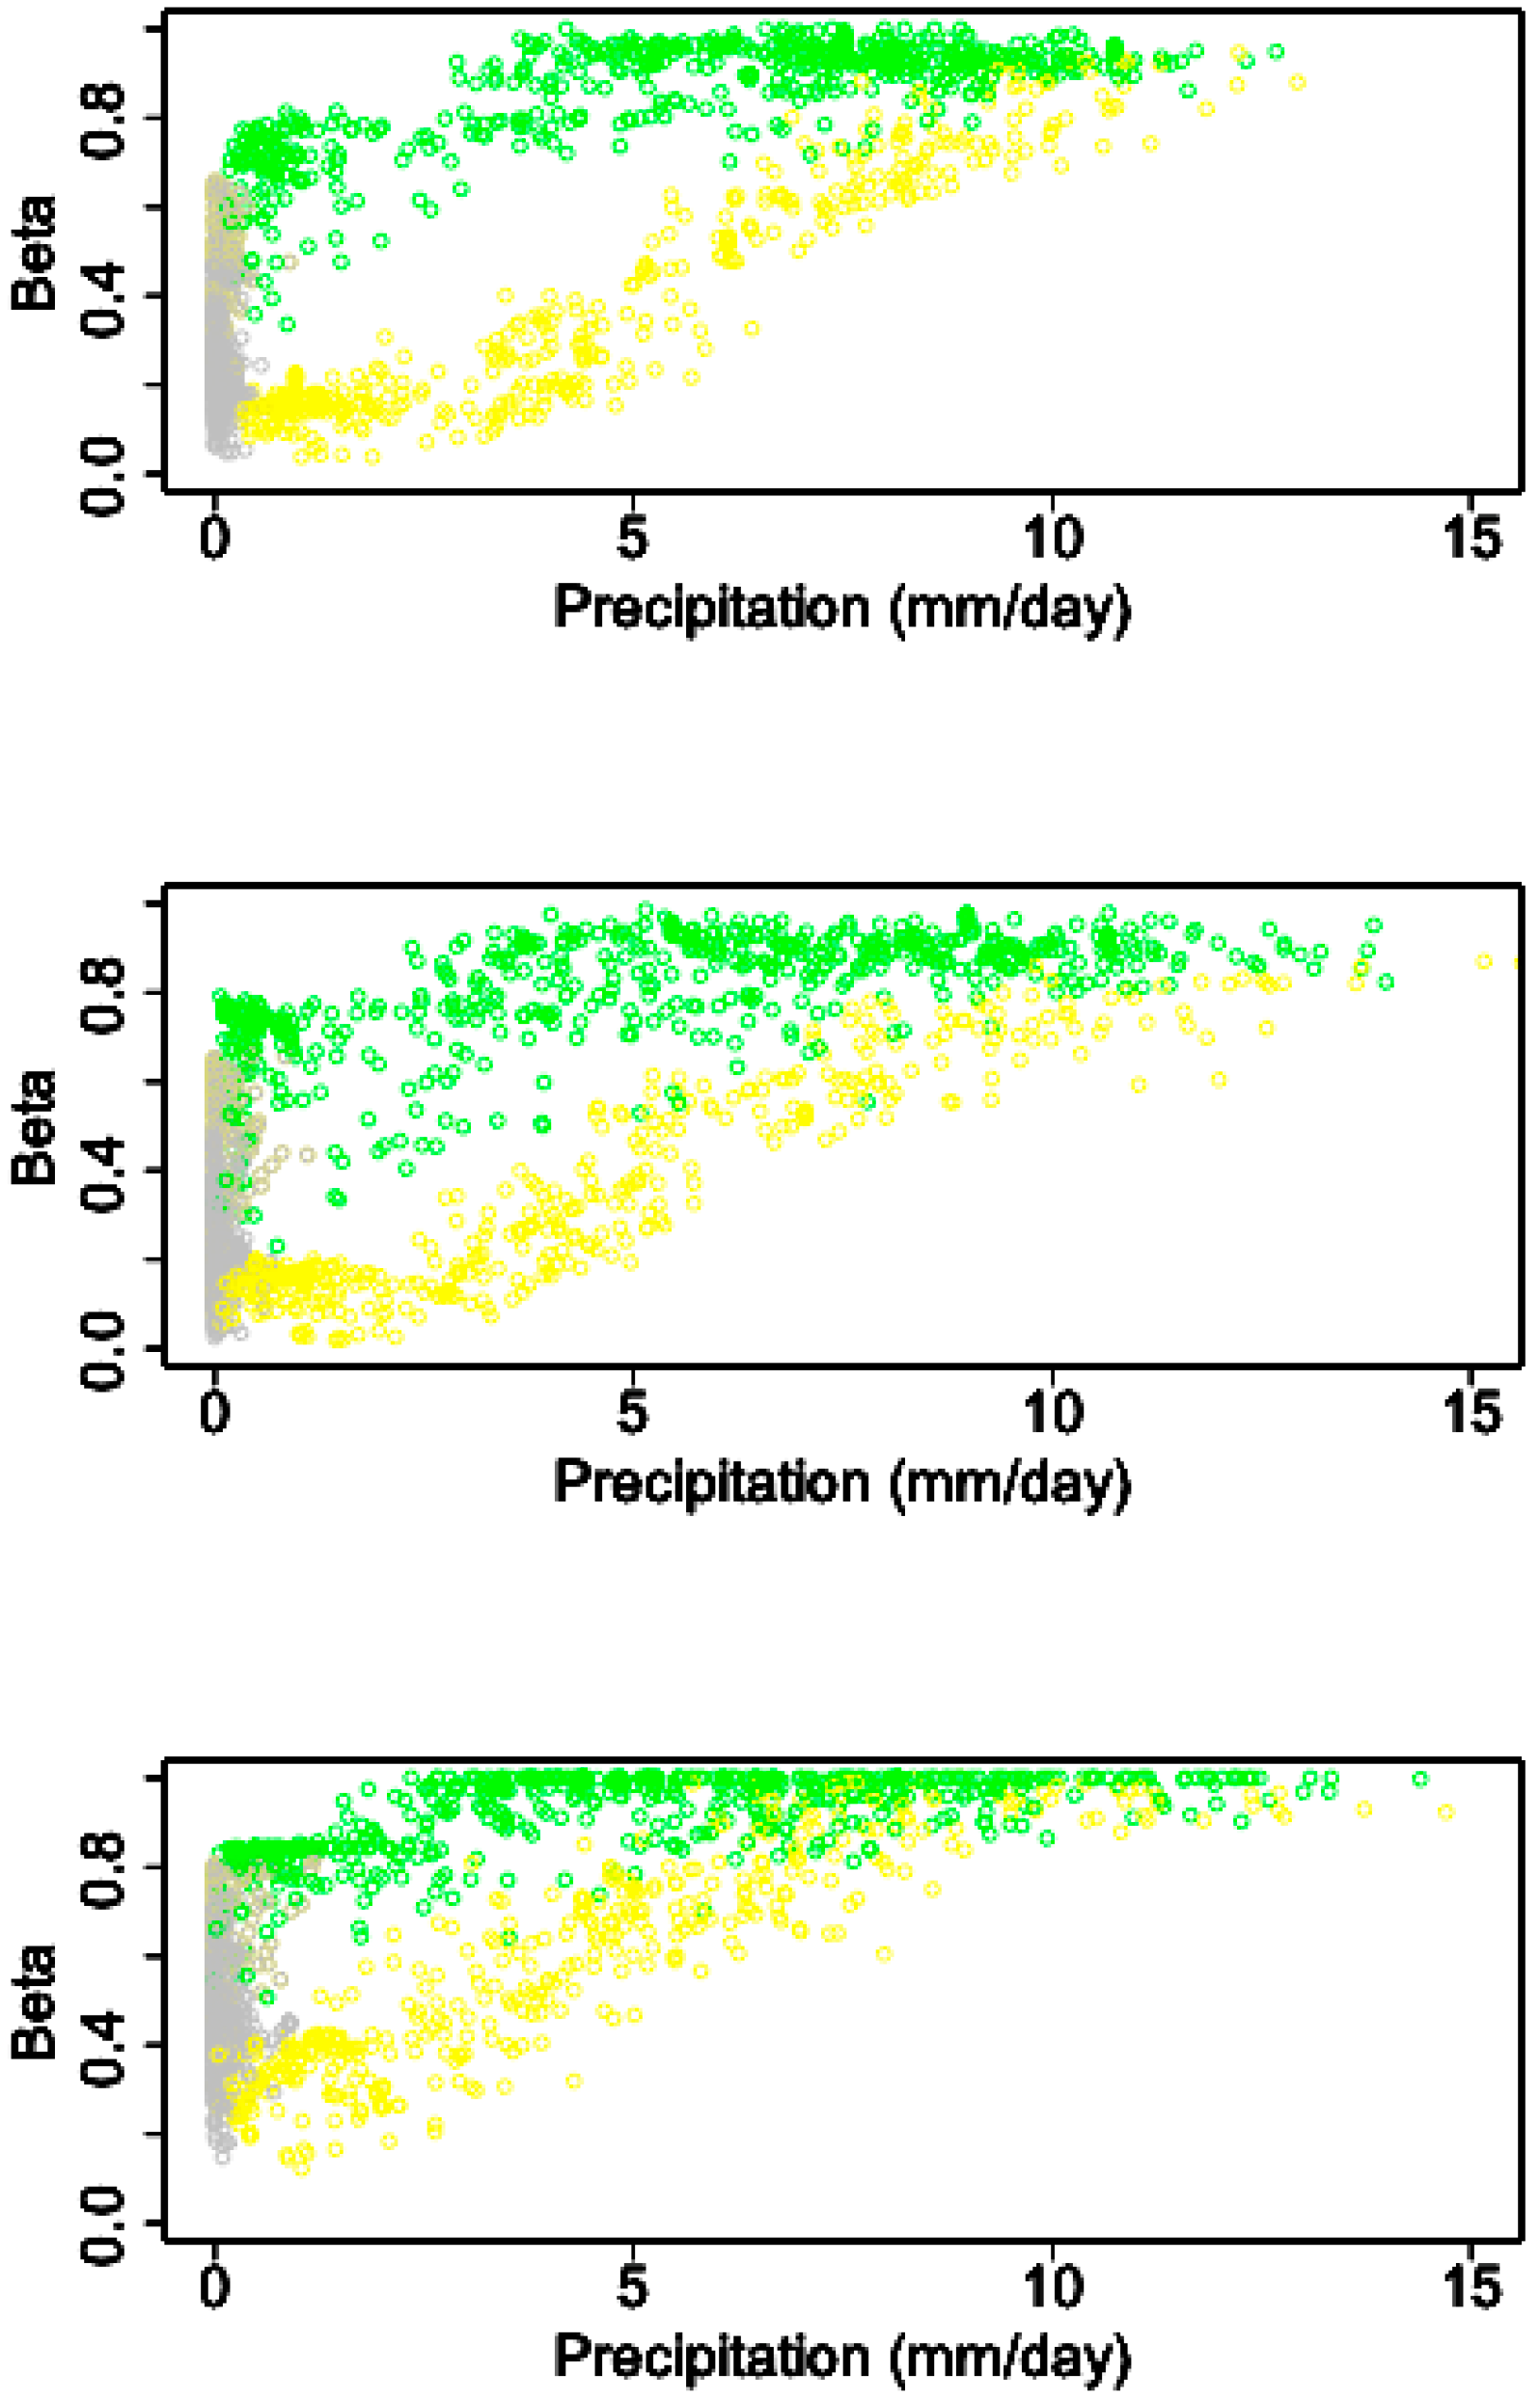
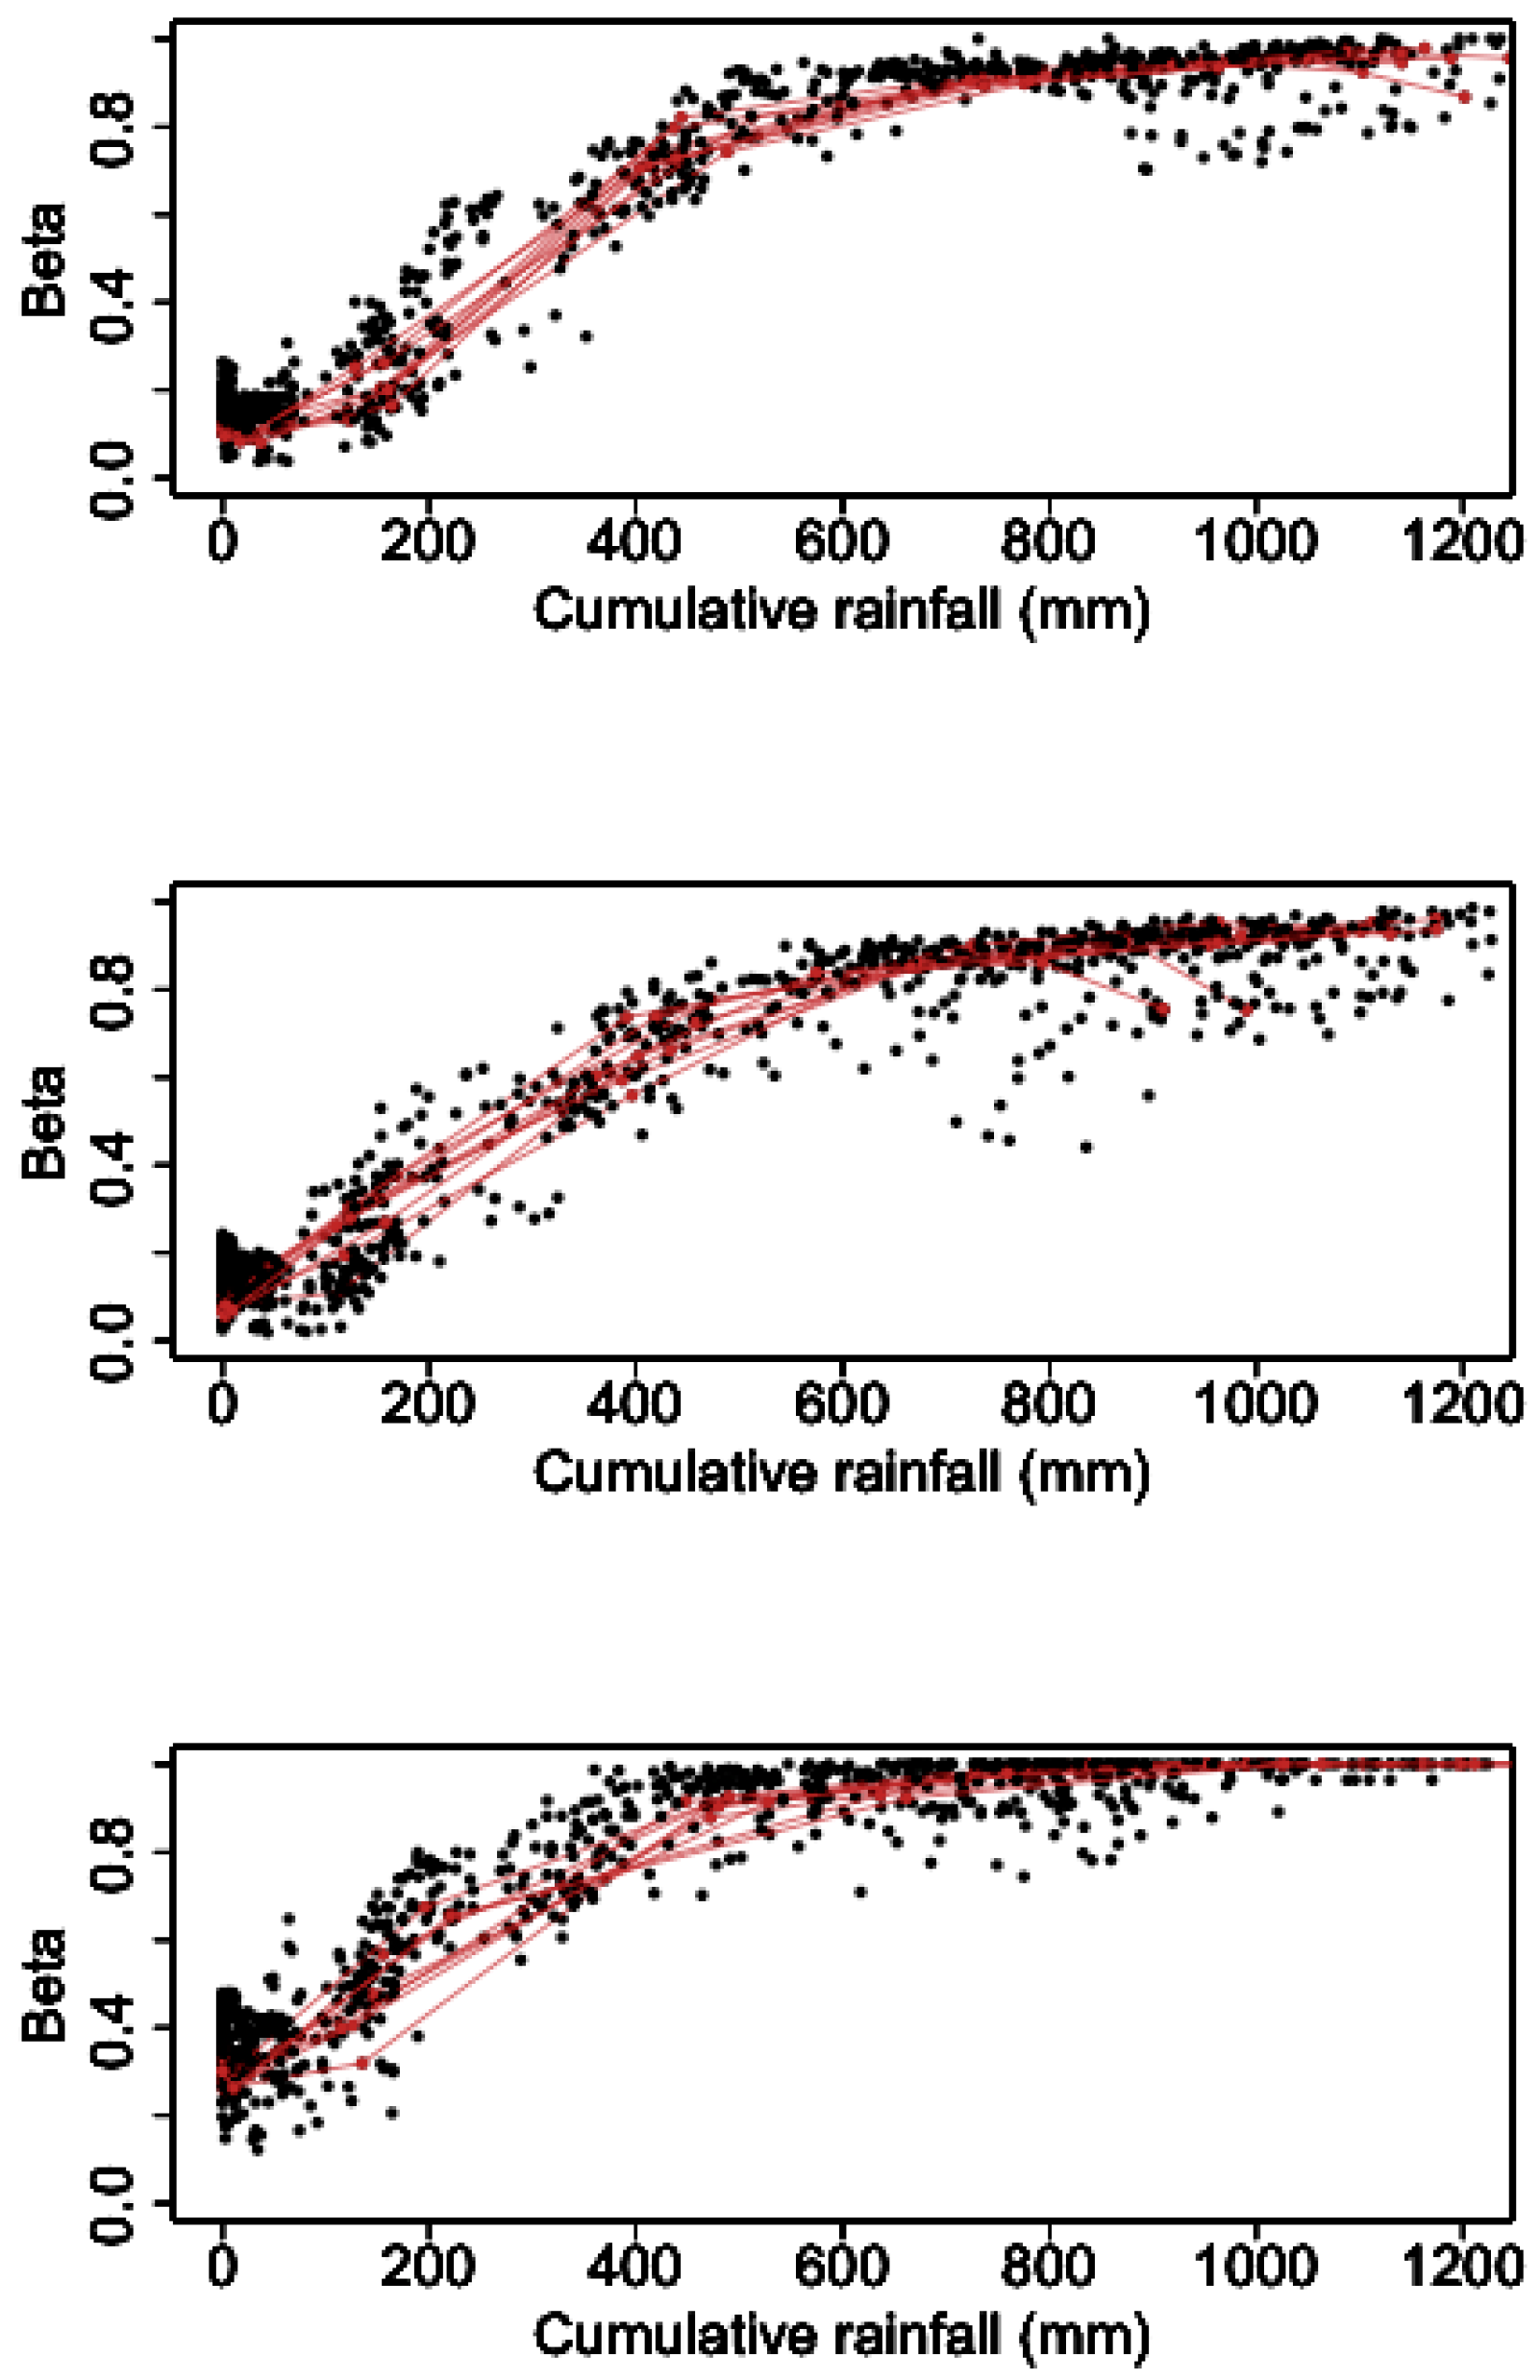
3.2. The Association between Rainfall and Soil Moisture
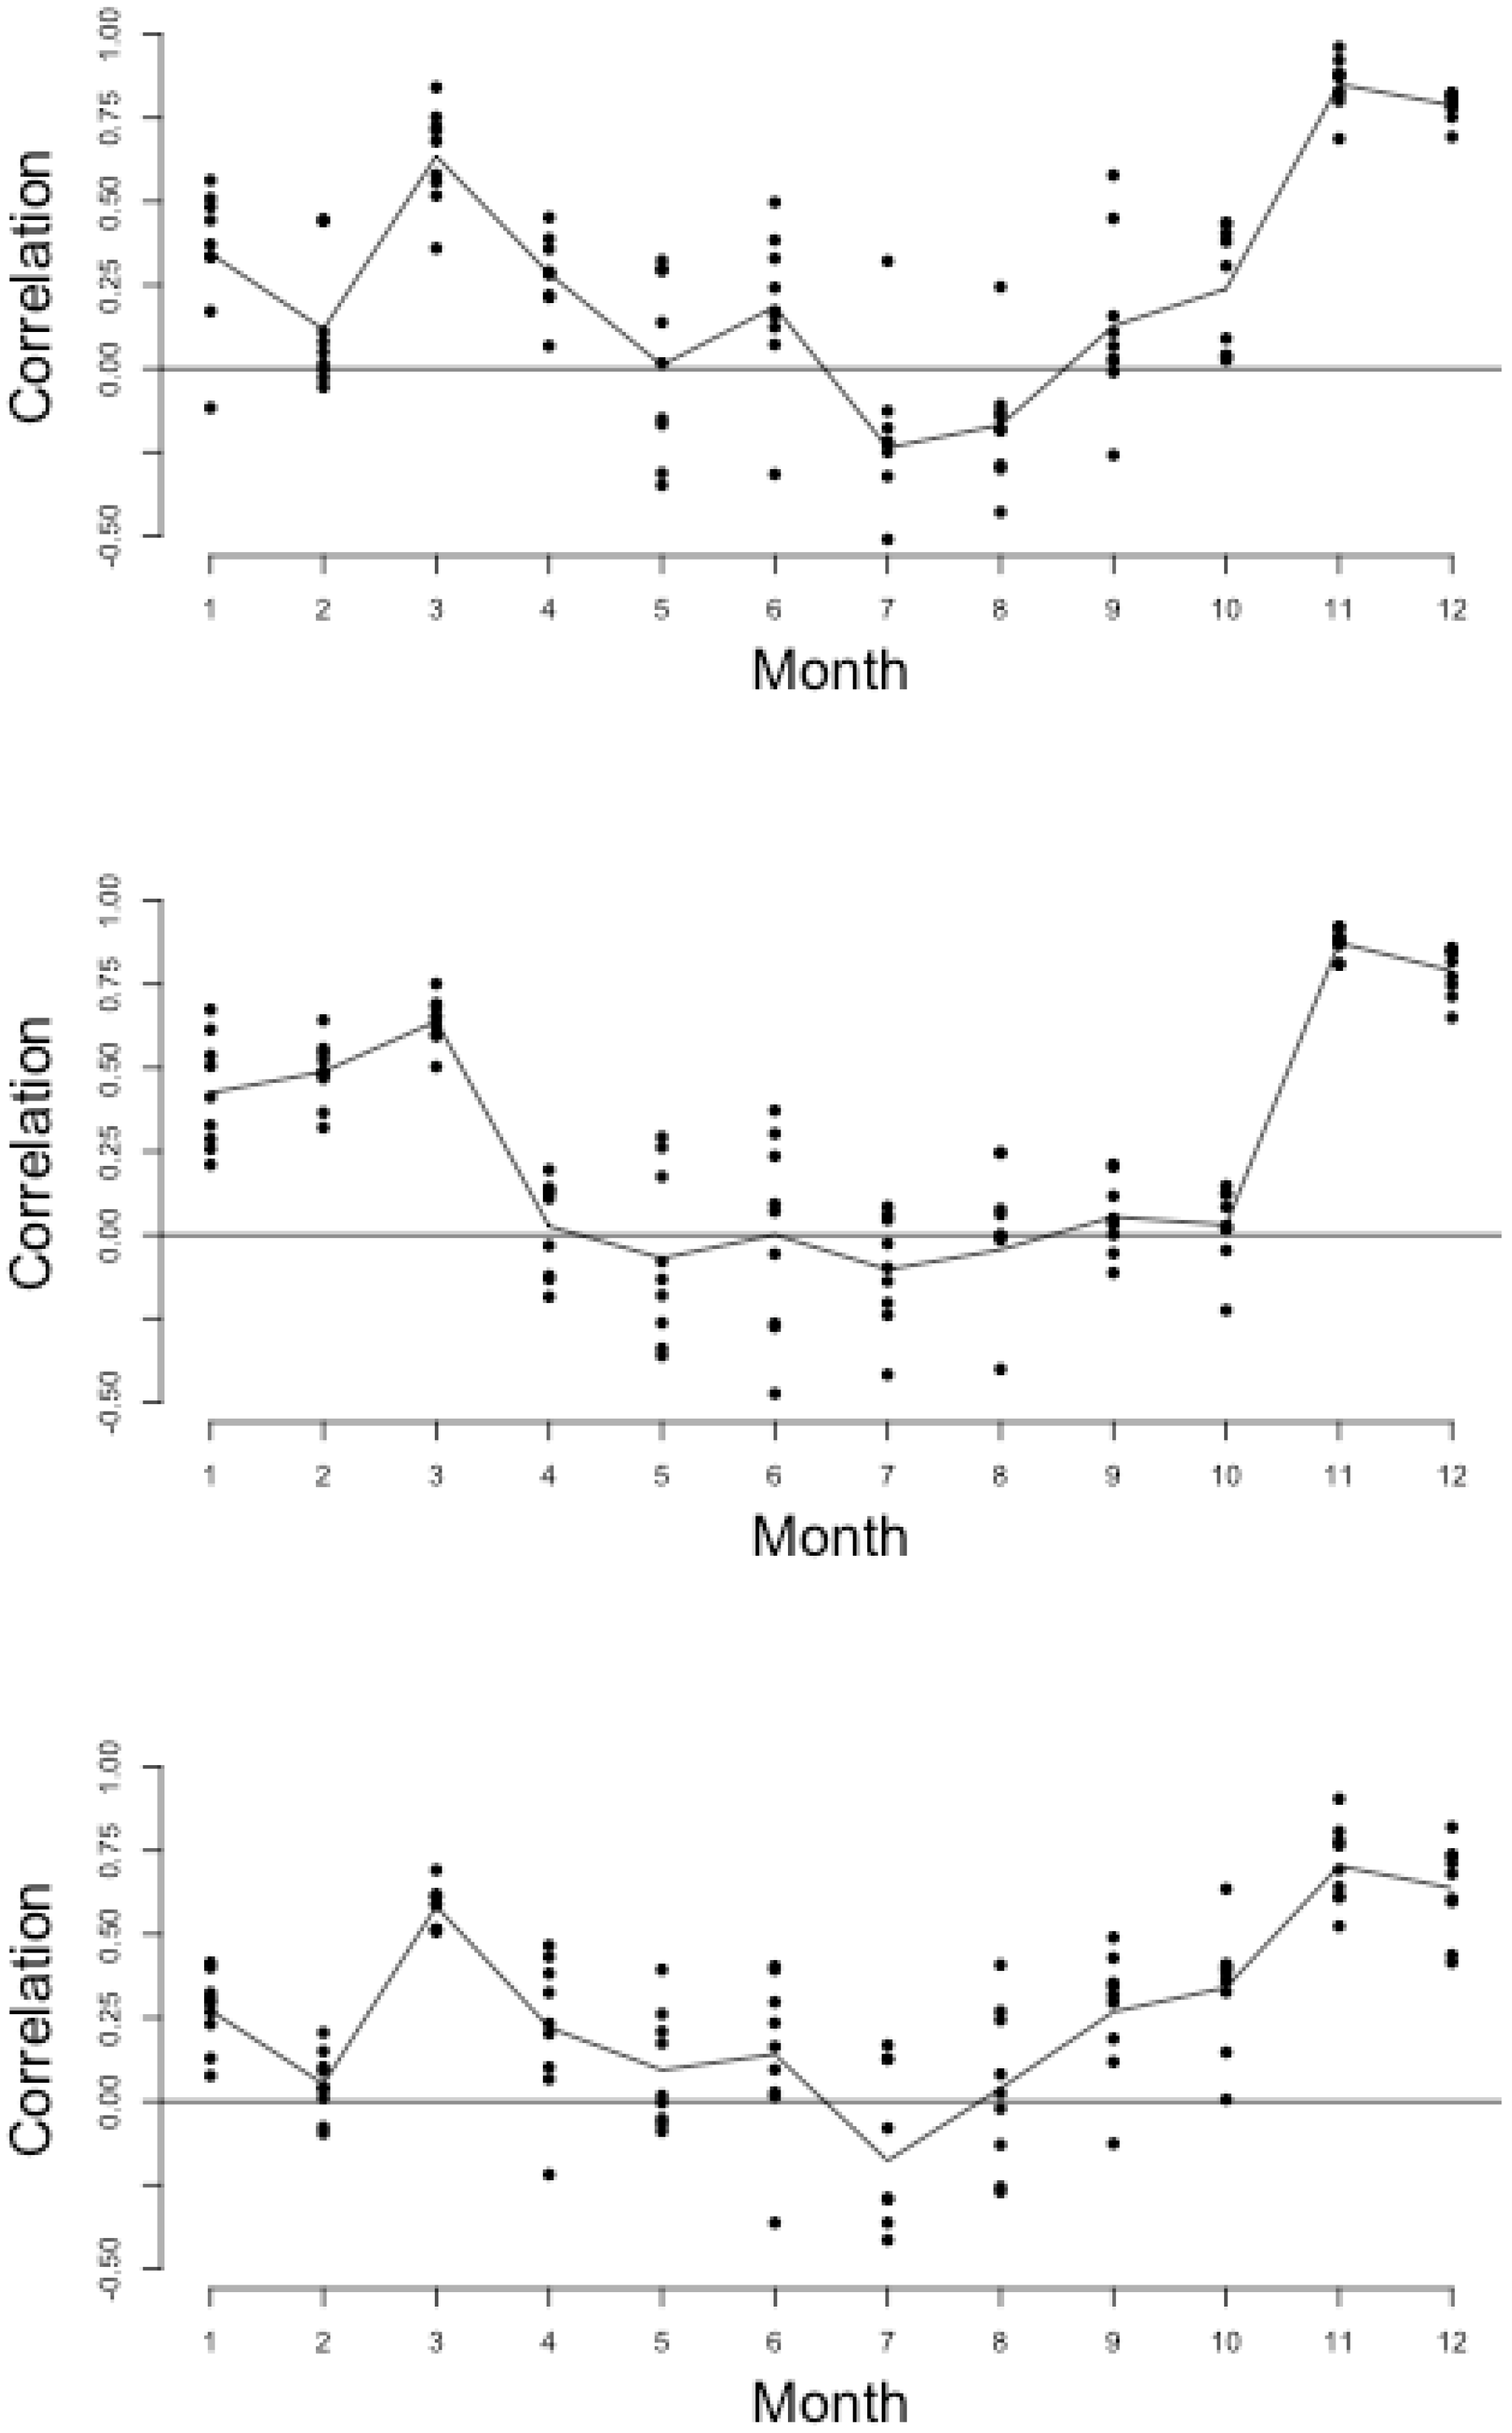
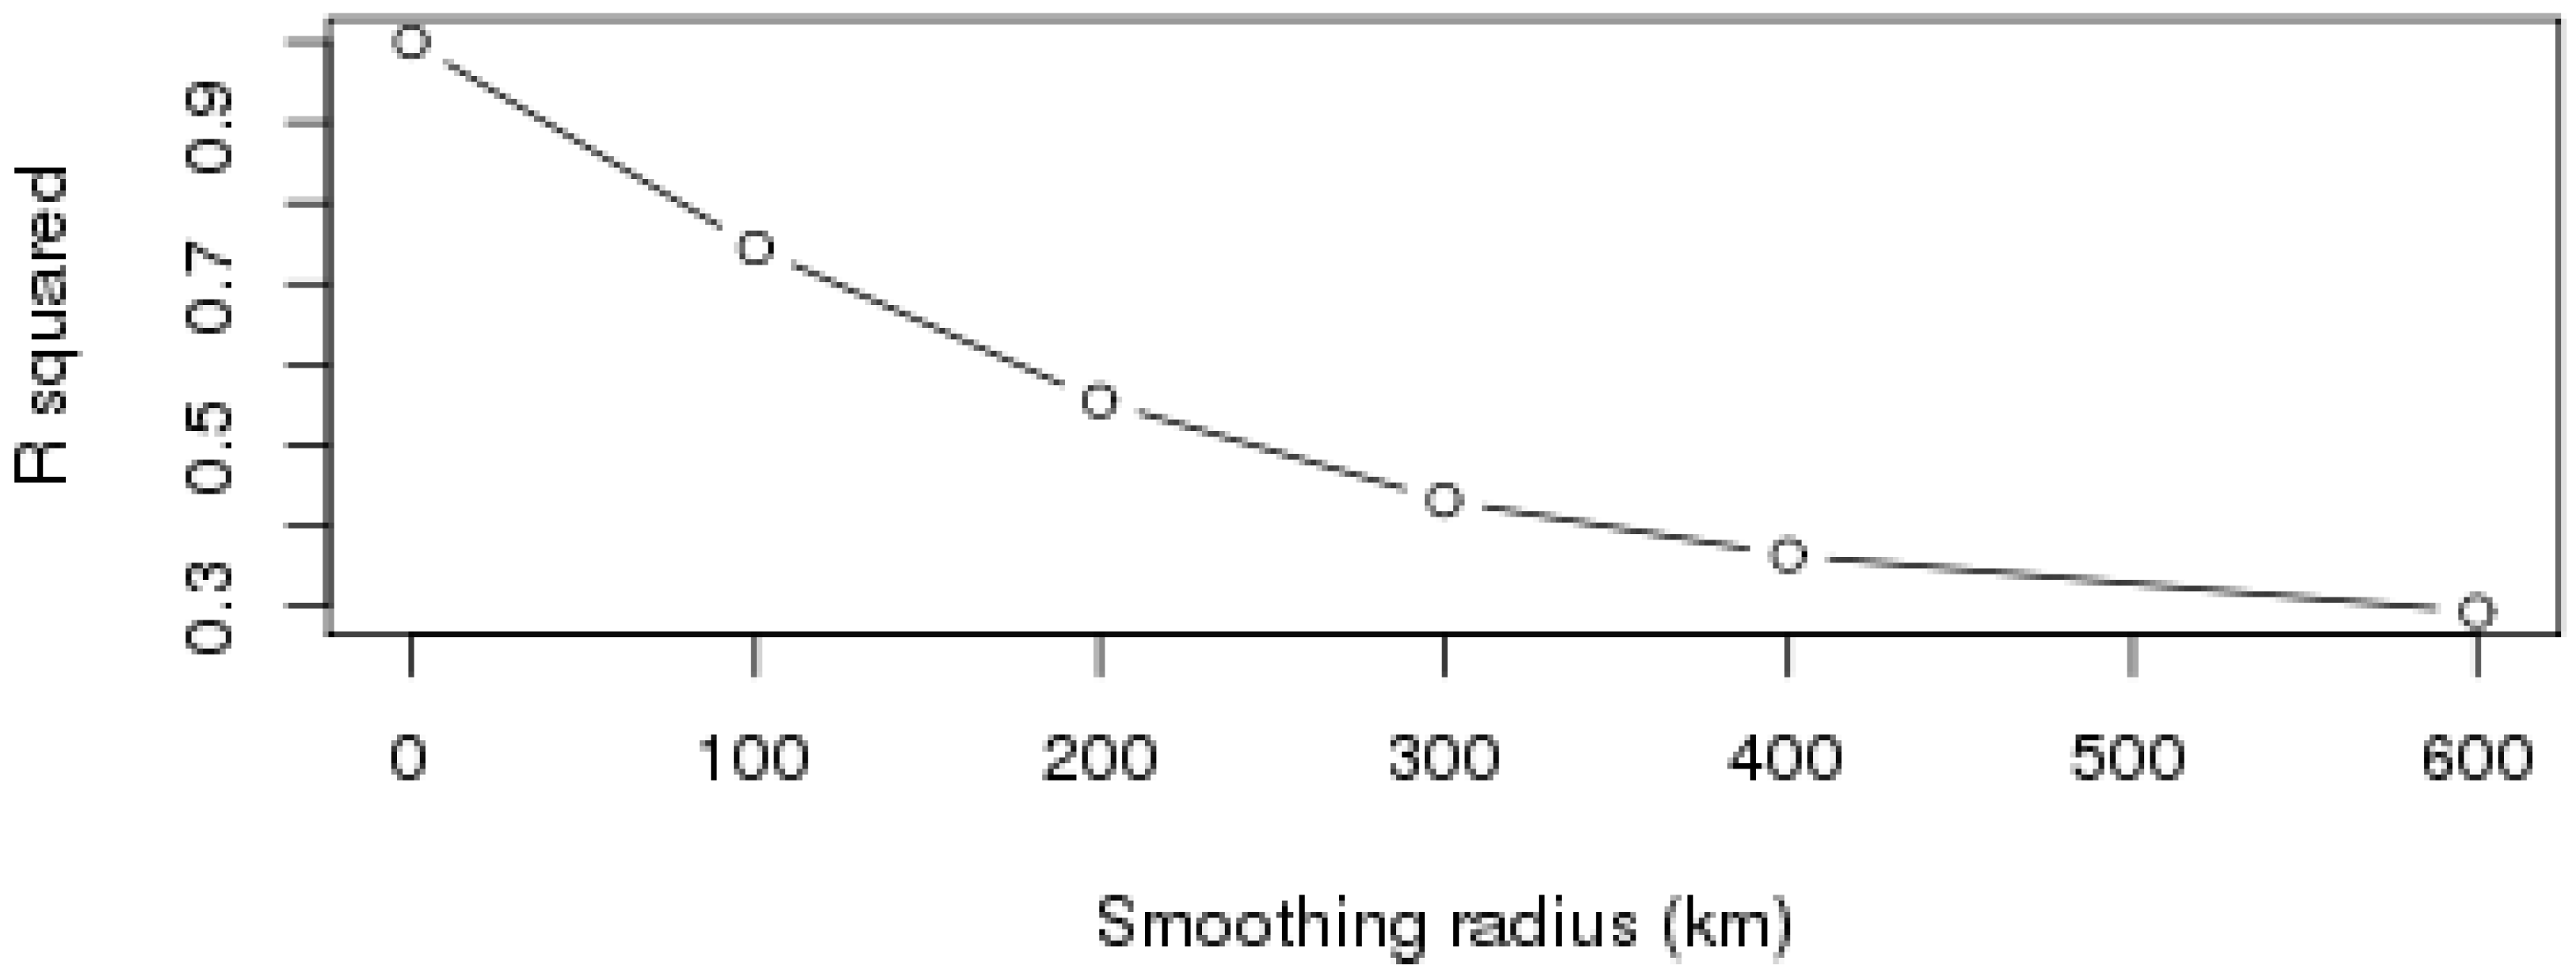
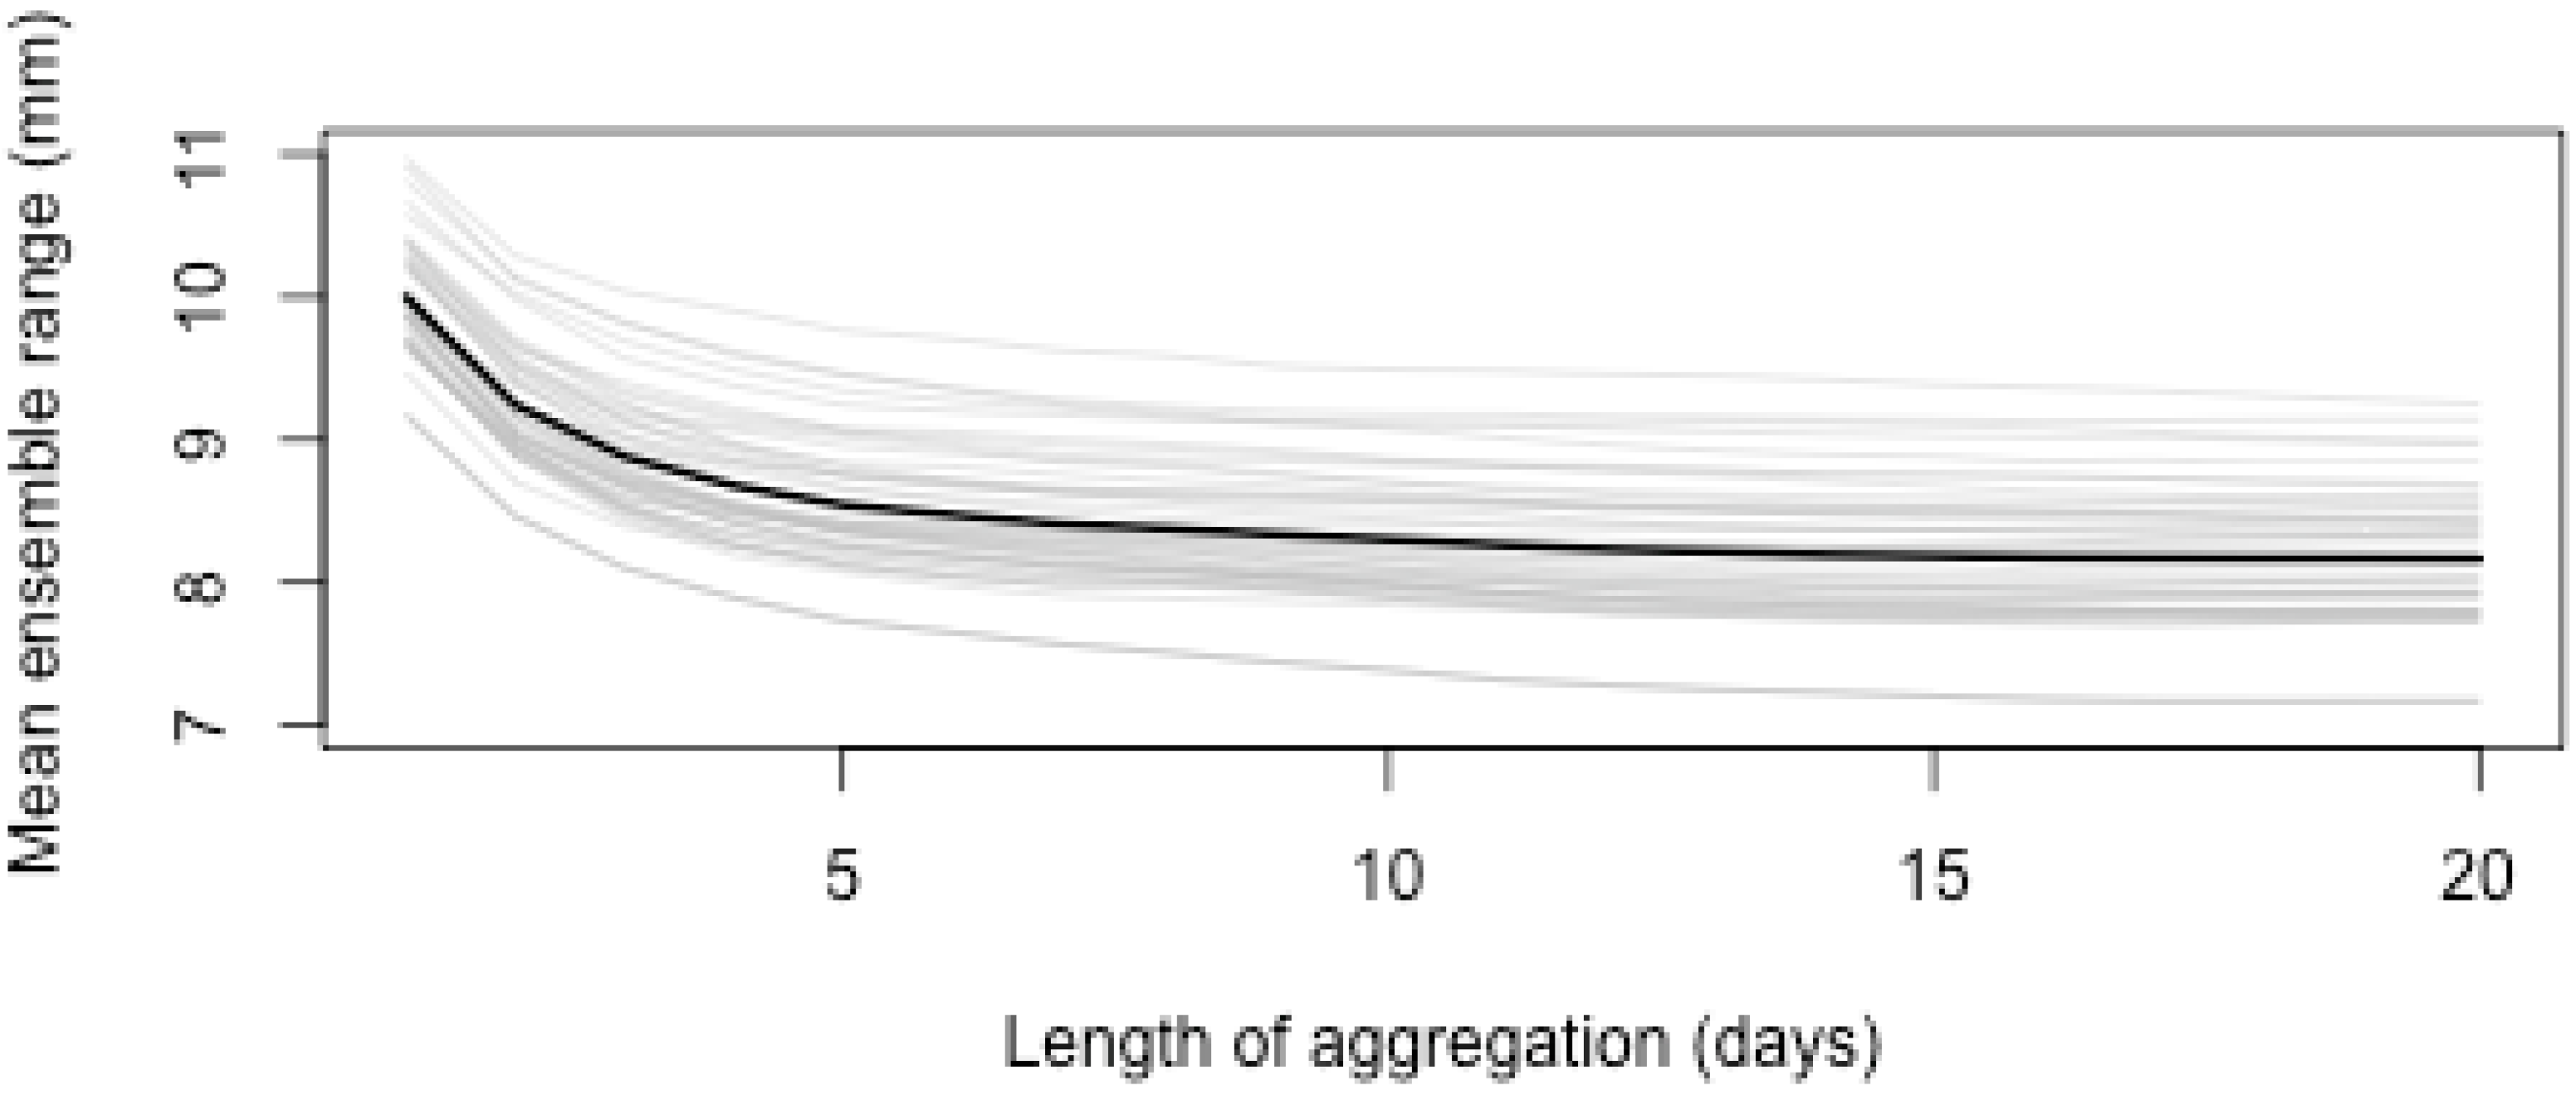
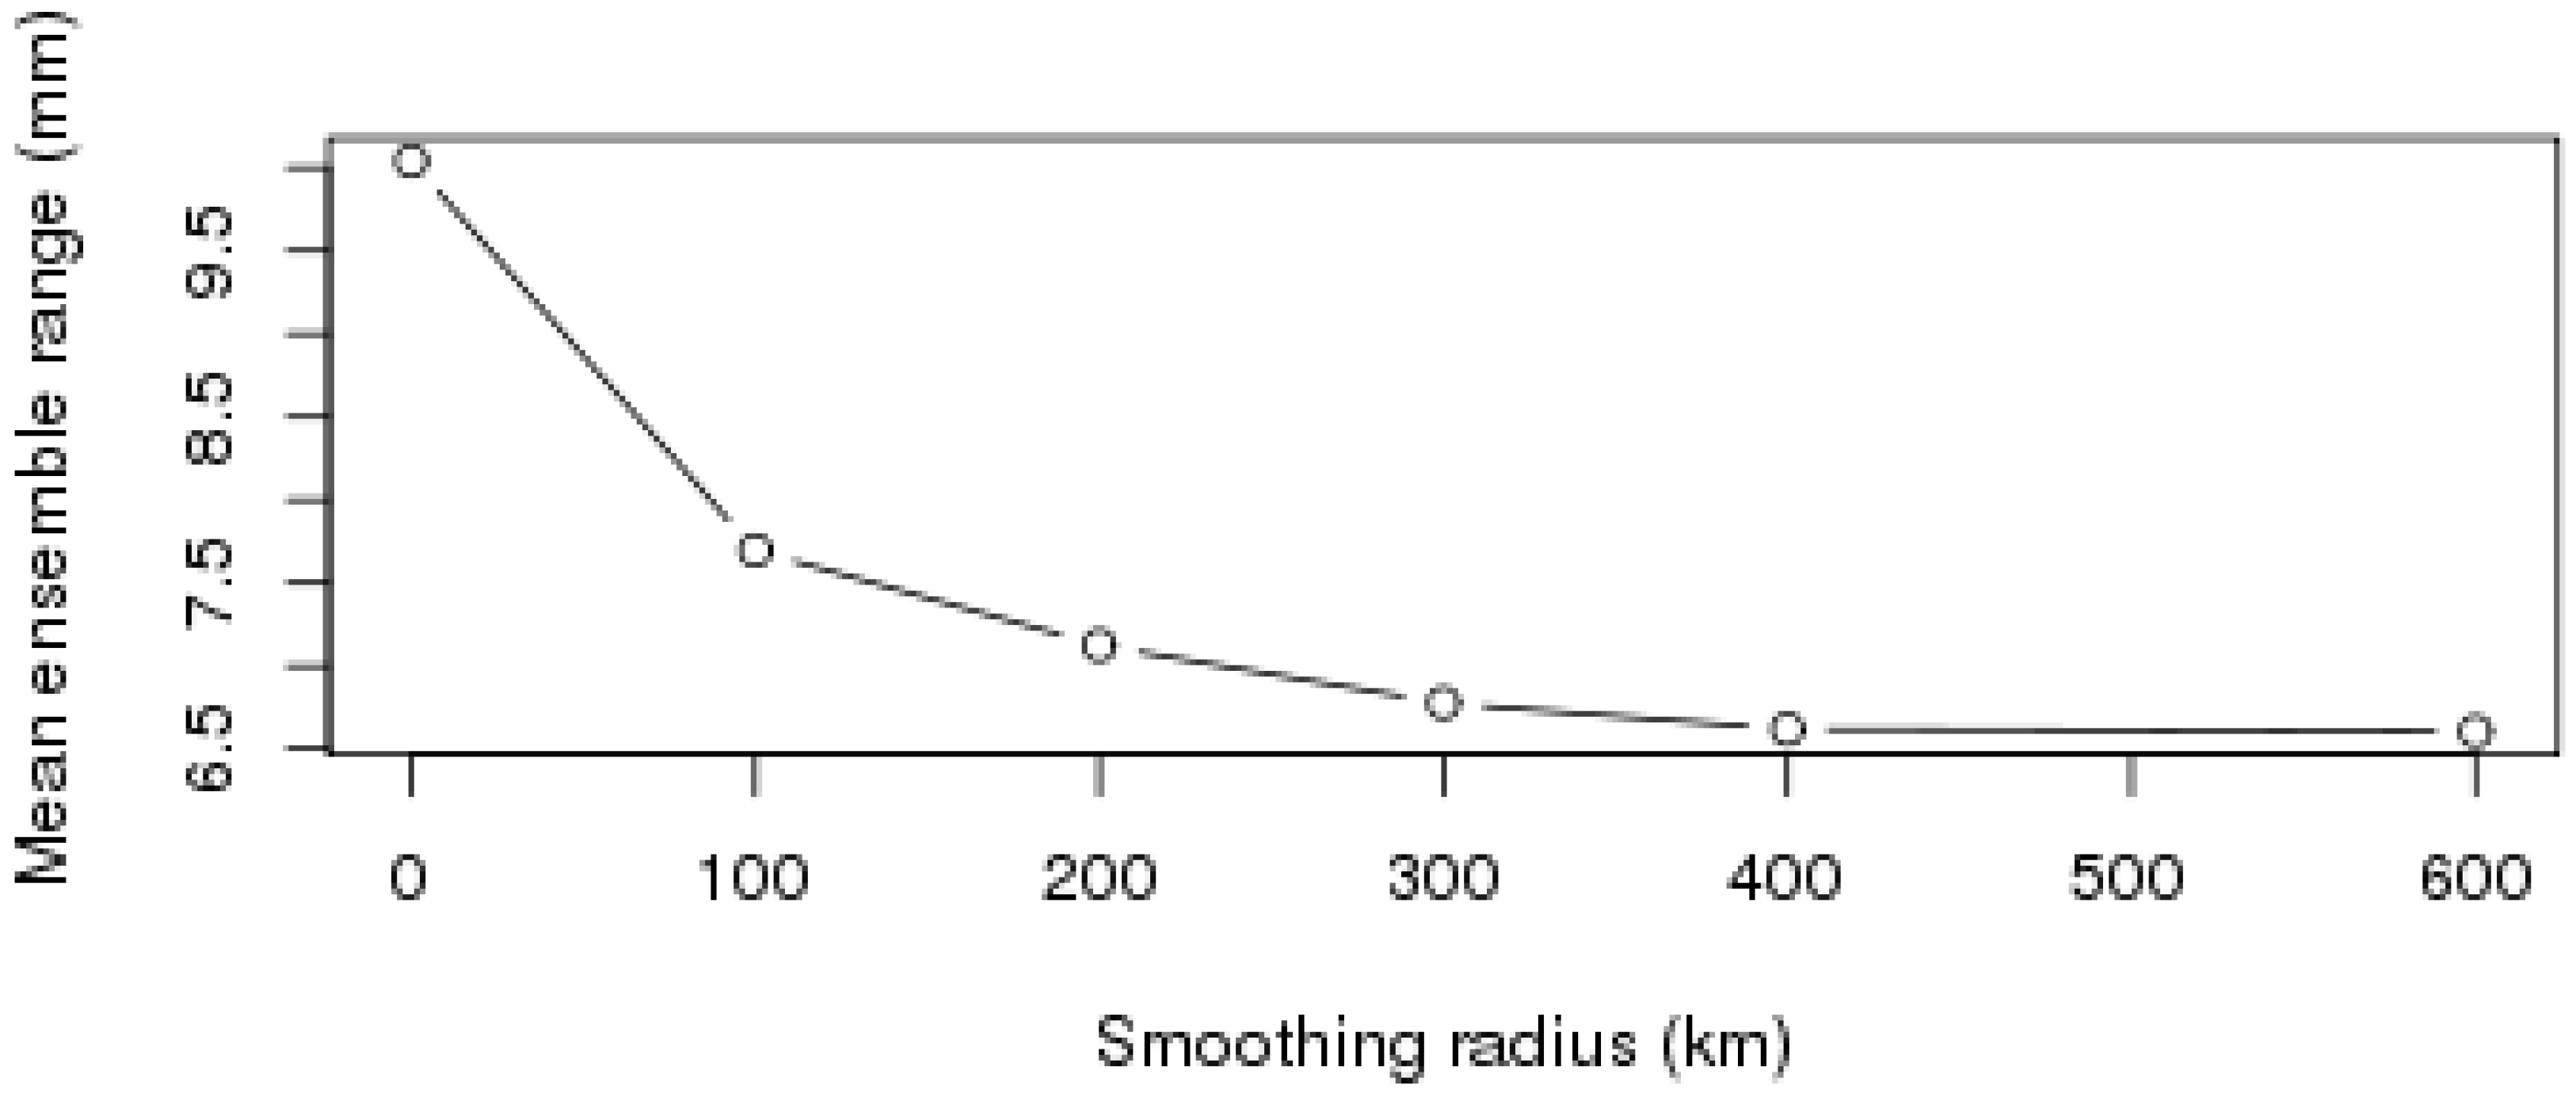
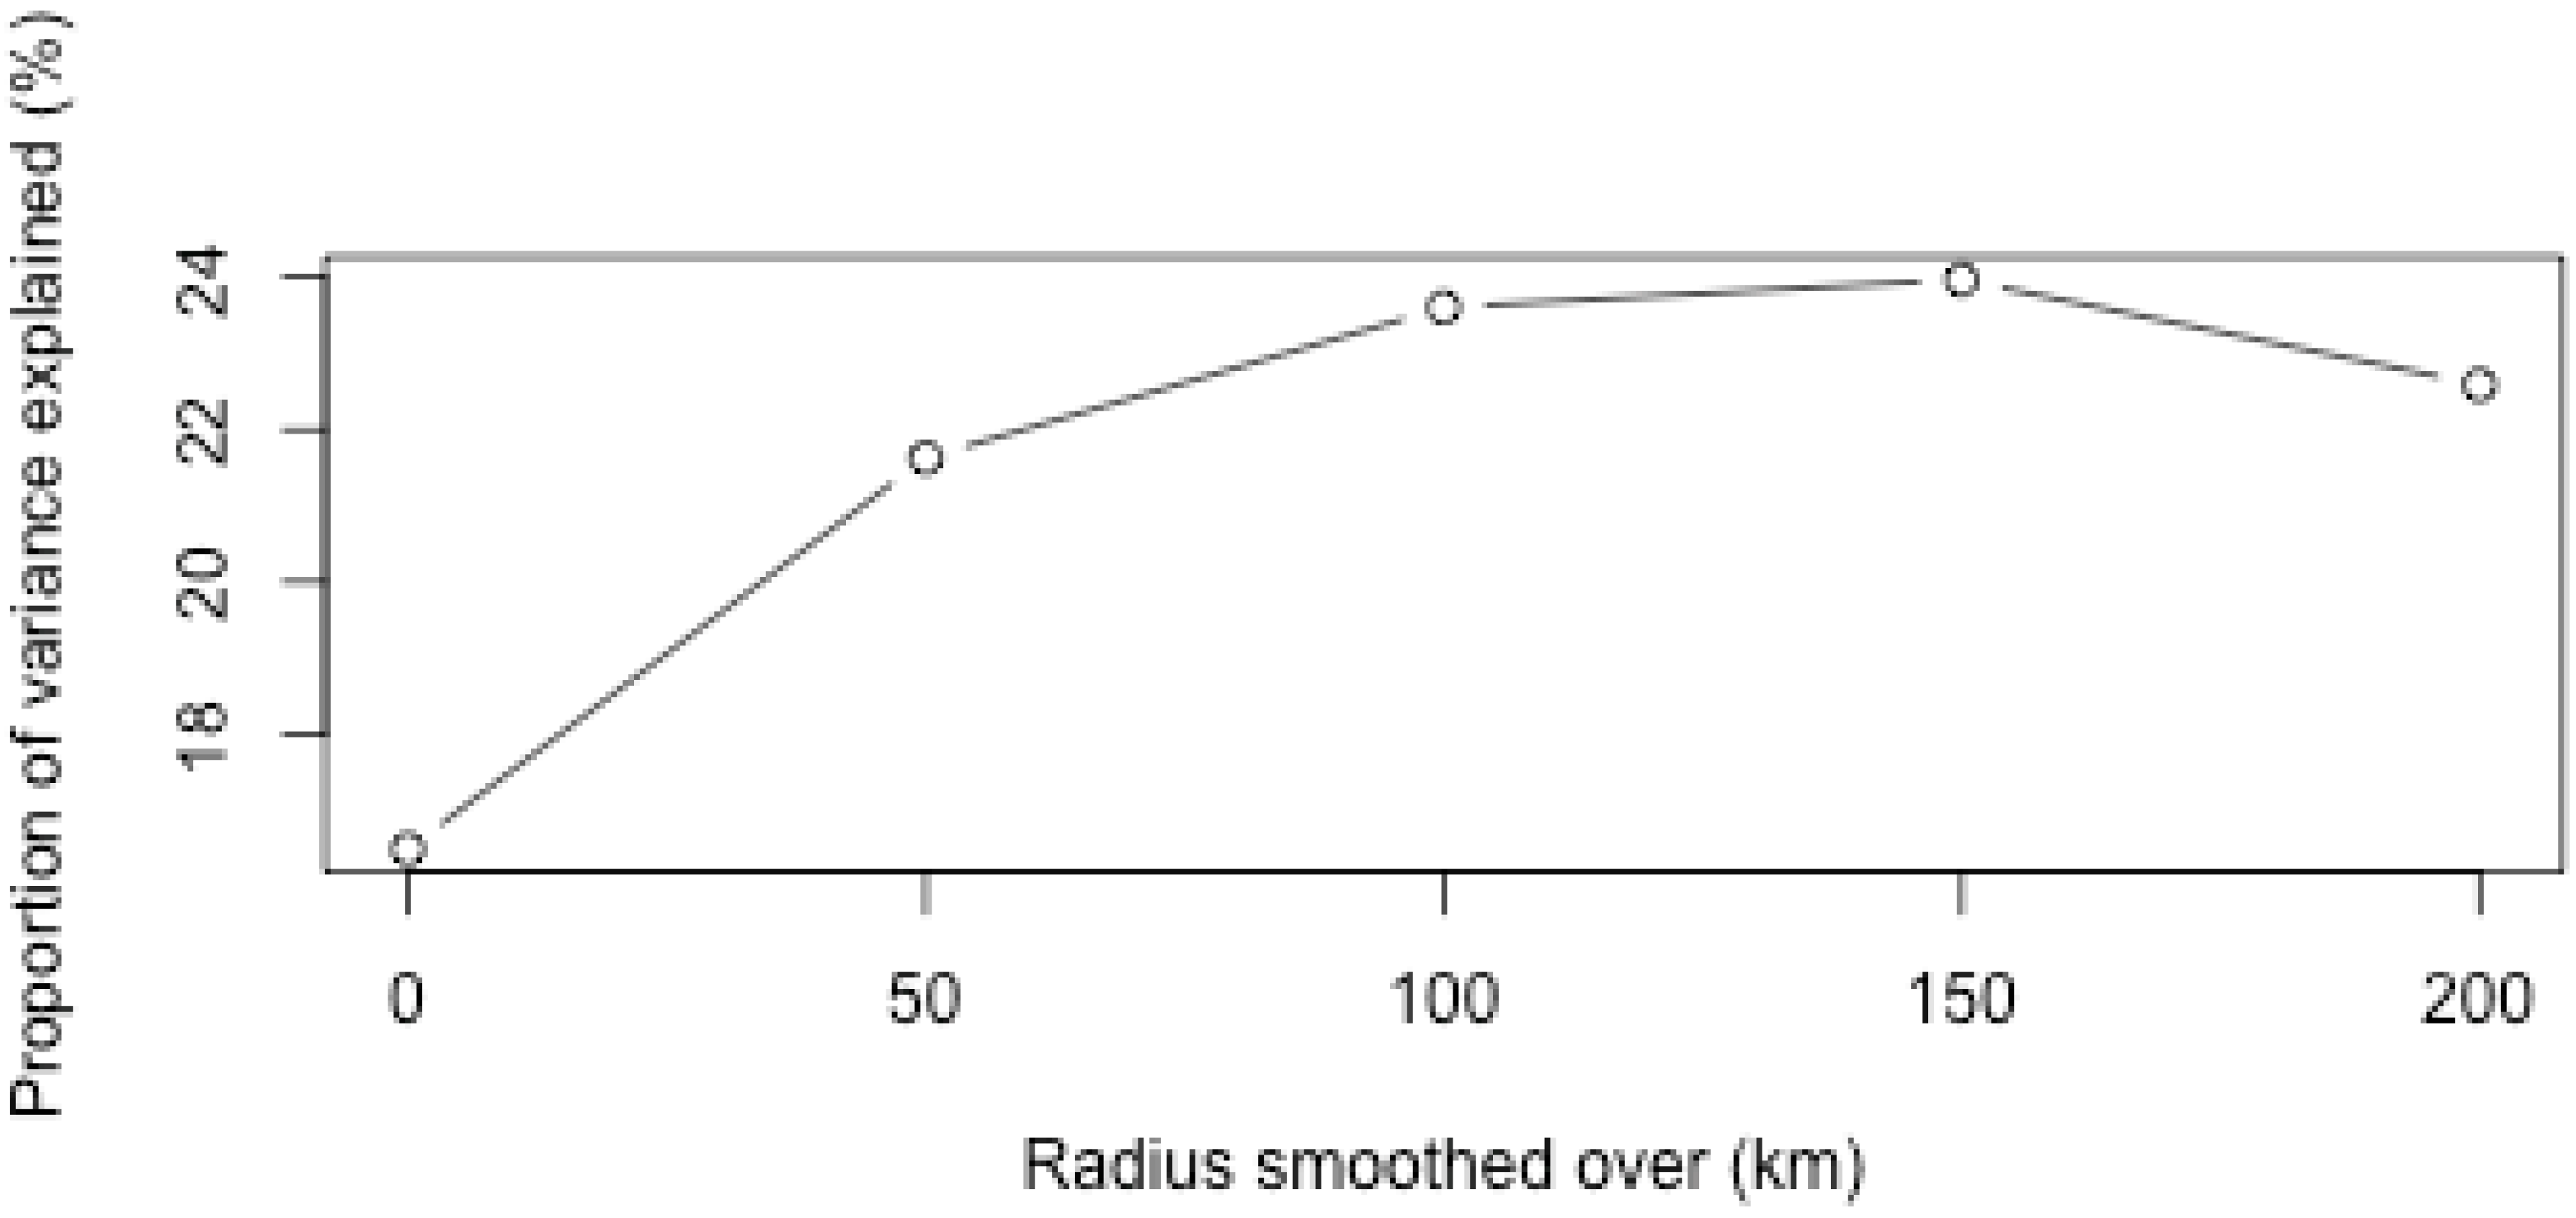
3.3. Aggregation of Remotely Sensed Rainfall in Time and Space
4. Discussion
5. Conclusions
- In Zambia, cotton production losses are associated with rainfall variability and specifically, total seasonal rainfall amount.
- There is a significant relationship between meteorological and agricultural drought on all spatial scales and throughout southern, central, and eastern Zambia.
- The high skill of satellite based rainfall estimates in the region opens up the possibility of expanding drought WII to a national level, provided that indices are carefully chosen to be skillfully reproduced by the satellite estimation methodology, representative of local conditions, and strongly linked to variability in soil moisture.
Acknowledgments
Author Contributions
Conflicts of Interest
References
- Boyd, E.; Cornforth, R.J.; Lamb, P.J.; Tarhule, A.; Lélé, M.I.; Brouder, A. Building resilience to face recurring environmental crisis in African Sahel. Nat. Clim. Chang. 2013, 3, 631–638. [Google Scholar] [CrossRef]
- Cornforth, R.J. Weathering drought in Africa. Appropr. Technol. 2013, 40, 26–28. [Google Scholar]
- Tarnavsky, E.; Grimes, D.; Maidment, R.; Black, E.; Allan, R.P.; Stringer, M.; Chadwick, R.; Kayitakire, F. Extension of the TAMSAT satellite-based rainfall monitoring over Africa and from 1983 to Present. J. Appl. Meteorol. Climatol. 2014, 53, 2805–2822. [Google Scholar] [CrossRef]
- Novella, N.S.; Thiaw, W.M. African rainfall climatology version 2 for famine early warning systems. J. Appl. Meteorol. Climatol. 2013, 52, 588–606. [Google Scholar] [CrossRef]
- Funk, C.; Peterson, P.; Landsfeld, M.; Pedreros, D.; Verdin, J.; Shukla, S.; Husak, G.; Rowland, J.; Harrison, L.; Hoell, A.; et al. The climate hazards infrared precipitation with stations—A new environmental record for monitoring extremes. Sci. Data 2015, 2, 150066. [Google Scholar] [CrossRef] [PubMed]
- Hegerl, G.C.; Black, E.; Allan, R.P.; Ingram, W.J.; Polson, D.; Trenberth, K.E.; Chadwick, R.S.; Arkin, P.A.; Sarojini, B.B.; Becker, A. Challenges in quantifying changes in the global water cycle. Bull. Am. Meteorol. Soc. 2014, 96, 1097–1115. [Google Scholar] [CrossRef]
- Dinku, T.; Chidzambwa, S.; Ceccato, P.; Connor, S.J.; Ropelewski, C.F. Validation of high-resolution satellite rainfall products over complex terrain. Int. J. Remote Sens. 2008, 29, 4097–4110. [Google Scholar] [CrossRef]
- Dinku, T.; Ceccato, P.; Grover-Kopec, E.; Lemma, M.; Connor, S.J.; Ropelewski, C.F. Validation of satellite rainfall products over East Africa’s complex topography. Int. J. Remote Sens. 2007, 28, 1503–1526. [Google Scholar] [CrossRef]
- Dinku, T.; Ceccato, P.; Connor, S.J. Challenges of satellite rainfall estimation over mountainous and arid parts of east Africa. Int. J. Remote Sens. 2011, 32, 5965–5979. [Google Scholar] [CrossRef]
- Maidment, R.I.; Grimes, D.I.F.; Allan, R.P.; Greatrex, H.; Rojas, O.; Leo, O. Evaluation of satellite-based and model re-analysis rainfall estimates for Uganda. Meteorol. Appl. 2013, 20, 308–317. [Google Scholar] [CrossRef]
- Milford, J.R.; McDougall, V.D.; Dugdale, G. Rainfall estimation from cold cloud duration: Experience of the TAMSAT group in West Africa. In Validation Problems of Rainfall Estimation by Satellite in Intertropical Africa; ORSTROM: Niamey, Niger, 1994; pp. 13–29. [Google Scholar]
- Dugdale, G.; McDougall, V.; Milford, J. Rainfall estimates in the Sahel from cold cloud statistics: Accuracy and limitations of operational systems. In Proceedings of the International Workshop, Niamey, Niger, 18–23 February 1991; pp. 65–74.
- Waller, J.A.; Dance, S.L.; Lawless, A.S.; Nichols, N.K.; Eyre, J.R. Representativity error for temperature and humidity using the Met Office high-resolution model. Q. J. R. Meteorol. Soc. 2014, 140, 1189–1197. [Google Scholar] [CrossRef]
- Hess, U.; Richter, K.; Stoppa, A. Weather risk management for agriculture and agri-business in developing countries. In Climate Risk and the Weather Market, financial Risk Management with Weather Hedges; Risk Books: London, UK, 2002. [Google Scholar]
- Barnett, B.J.; Mahul, O. Weather index insurance for agriculture and rural areas in lower-income countries. Am. J. Agric. Econ. 2007, 89, 1241–1247. [Google Scholar] [CrossRef]
- Brown, M.E.; Osgood, D.E.; Carriquiry, M.A. Science-based insurance. Nat. Geosci. 2011, 4, 213–214. [Google Scholar] [CrossRef]
- Greatrex, H.; Grimes, D.; Wheeler, T. Advances in the stochastic modeling of satellite-derived rainfall estimates using a sparse calibration dataset. J. Hydrometeorol. 2014, 15, 1810–1831. [Google Scholar] [CrossRef]
- Teo, C.-K.; Grimes, D.I.F. Stochastic modelling of rainfall from satellite data. J. Hydrol. 2007, 346, 33–50. [Google Scholar] [CrossRef]
- Grimes, D.I.F. An ensemble approach to uncertainty estimation for satellite-based rainfall estimates. In Hydrological Modelling and the Water Cycle; Springer: Berlin, Germany, 2008; pp. 145–162. [Google Scholar]
- Javaid, I. Application of insecticides on cotton in Zambia: Timing of spray applications. Int. J. Pest Manag. 1990, 36, 1–9. [Google Scholar] [CrossRef]
- Jamali, S.; Seaquist, J.; Ardö, J.; Eklundh, L. Investigating temporal relationships between rainfall, soil moisture and MODIS-derived NDVI and EVI for six sites in Africa. In Proceedings of the 34th International Symposium on Remote Sensing of Environment, Sydney, Australia, 10–15 April 2011.
- Seneviratne, S.I.; Corti, T.; Davin, E.L.; Hirschi, M.; Jaeger, E.B.; Lehner, I.; Orlowsky, B.; Teuling, A.J. Investigating soil moisture-climate interactions in a changing climate: A review. Earth-Sci. Rev. 2010, 99, 125–161. [Google Scholar] [CrossRef]
- Reddy, K.R.; Hodges, H.F.; Reddy, V.R. Temperature effects on cotton fruit retention. Agron. J. 1992, 84, 26–30. [Google Scholar] [CrossRef]
- Brown, P. Cotton Heat Stress; College of Agriculture and Life Sciences, University of Arizona: Tucson, AZ, USA, 2008. [Google Scholar]
- Traore, B.; Corbeels, M.; van Wijk, M.T.; Rufino, M.C.; Giller, K.E. Effects of climate variability and climate change on crop production in southern Mali. Eur. J. Agron. 2013, 49, 115–125. [Google Scholar] [CrossRef]
- Best, M.J.; Pryor, M.; Clark, D.B.; Rooney, G.G.; Essery, R.L.H.; Ménard, C.B.; Edwards, J.M.; Hendry, M. A.; Porson, A.; Gedney, N.; et al. The Joint UK Land Environment Simulator (JULES), model description–Part 1: Energy and water fluxes. Geosci. Model Dev. 2011, 4, 677–699. [Google Scholar] [CrossRef]
- Clark, D.B.; Mercado, L.M.; Sitch, S.; Jones, C.D.; Gedney, N.; Best, M.J.; Pryor, M.; Rooney, G.G.; Essery, R.L.H.; Blyth, E.; et al. The Joint UK Land Environment Simulator (JULES), model description–Part 2: Carbon fluxes and vegetation dynamics. Geosci. Model Dev. 2011, 4, 701–722. [Google Scholar] [CrossRef]
- Dumedah, G.; Walker, J.P. Intercomparison of the JULES and CABLE land surface models through assimilation of remotely sensed soil moisture in southeast Australia. Adv. Water Resour. 2014, 74, 231–244. [Google Scholar] [CrossRef]
- Blyth, E.; Gash, J.; Lloyd, A.; Pryor, M.; Weedon, G.P.; Shuttleworth, J. Evaluating the JULES land surface model energy fluxes using FLUXNET data. J. Hydrometeorol. 2010, 11, 509–519. [Google Scholar] [CrossRef]
- Essery, B.R.L.H. The impact of new land surface physics on the GCM simulation of climate and climate sensitivity. Clim. Dyn. 1999, 15, 183–203. [Google Scholar]
- Van Genuchten, M.T.; Wierenga, P.J. Mass transfer studies in sorbing porous media I. Analytical solutions. Soil Sci. Soc. Am. J. 1976, 40, 473–480. [Google Scholar] [CrossRef]
- Johannes Dolman, A.; Gregory, D. The parametrization of rainfall interception in GCMs. Q. J. R. Meteorol. Soc. 1992, 118, 455–467. [Google Scholar] [CrossRef]
- Weedon, G.P.; Balsamo, G.; Bellouin, N.; Gomes, S.; Best, M.J.; Viterbo, P. The WFDEI meteorological forcing data set: Watch forcing data methodology applied to ERA-Interim reanalysis data. Water Resour. Res. 2014, 50, 7505–7514. [Google Scholar] [CrossRef]
- Maidment, R.I.; Grimes, D.; Allan, R.P.; Tarnavsky, E.; Stringer, M.; Hewison, T.; Roebeling, R.; Black, E. The 30 year TAMSAT African Rainfall Climatology and Time series (TARCAT) data set. J. Geophys. Res. Atmos. 2014, 119, 10619–10644. [Google Scholar] [CrossRef]
- Thorne, V.; Coakeley, P.; Grimes, D.; Dugdale, G. Comparison of TAMSAT and CPC rainfall estimates with raingauges, for southern Africa. Int. J. Remote Sens. 2001, 22, 1951–1974. [Google Scholar] [CrossRef]
- Dugdale, G.; Milford, J.R. Rainfall estimation over the Sahel using METEOSAT Thermal Infrared data. In Proceedings of the ISLSCP Conference, Rome, Italy, 2–6 December 1985.
- Huffman, G.J.; Adler, R.F.; Morrissey, M.M.; Bolvin, D.T.; Curtis, S.; Joyce, R.; McGavock, B.; Susskind, J. Global precipitation at one-degree daily resolution from multisatellite observations. J. Hydrometeorol. 2001, 2, 36–50. [Google Scholar] [CrossRef]
- Todd, M.C.; Kidd, C.; Kniveton, D.; Bellerby, T.J. A combined satellite infrared and passive microwave technique for estimation of small-scale rainfall. J. Atmos. Ocean. Technol. 2001, 18, 742–755. [Google Scholar] [CrossRef]
- Laurent, H.; Jobard, I.; Toma, A. Validation of satellite and ground-based estimates of precipitation over the Sahel. Atmos. Res. 1998, 47, 651–670. [Google Scholar] [CrossRef]
- Tucker, M.R.; Sear, C.B. A comparison of Meteosat rainfall estimation techniques in Kenya. Meteorol. Appl. 2001, 8, 107–117. [Google Scholar] [CrossRef]
- Chadwick, R.S.; Grimes, D.I.F.; Saunders, R.W.; Francis, P.N.; Blackmore, T.A. The TAMORA algorithm: Satellite rainfall estimates over West Africa using multi-spectral SEVIRI data. Adv. Geosci. 2010, 25, 3–9. [Google Scholar] [CrossRef]
- Jobard, I.; Chopin, F.; Berges, J.C.; Roca, R. An intercomparison of 10-day satellite precipitation products during West African monsoon. Int. J. Remote Sens. 2011, 32, 2353–2376. [Google Scholar] [CrossRef]
- Kalinda, T.; Bwalya, R. An assessment of the growth opportunities and constraints in Zambia’s cotton industry. Asian J. Bus. Stud. 2014, 6, 63–75. [Google Scholar]
- Sarker, J.R. Weather index insurance for agriculture in Bangladesh: Significance of implementation and some challenges. Eur. J. Bus. Manag. 2013, 5, 74–79. [Google Scholar]
- Norton, M.T.; Turvey, C.; Osgood, D. Quantifying spatial basis risk for weather index insurance. J. Risk Financ. 2012, 14, 20–34. [Google Scholar] [CrossRef]


© 2016 by the authors; licensee MDPI, Basel, Switzerland. This article is an open access article distributed under the terms and conditions of the Creative Commons Attribution (CC-BY) license (http://creativecommons.org/licenses/by/4.0/).
Share and Cite
Black, E.; Tarnavsky, E.; Maidment, R.; Greatrex, H.; Mookerjee, A.; Quaife, T.; Brown, M. The Use of Remotely Sensed Rainfall for Managing Drought Risk: A Case Study of Weather Index Insurance in Zambia. Remote Sens. 2016, 8, 342. https://doi.org/10.3390/rs8040342
Black E, Tarnavsky E, Maidment R, Greatrex H, Mookerjee A, Quaife T, Brown M. The Use of Remotely Sensed Rainfall for Managing Drought Risk: A Case Study of Weather Index Insurance in Zambia. Remote Sensing. 2016; 8(4):342. https://doi.org/10.3390/rs8040342
Chicago/Turabian StyleBlack, Emily, Elena Tarnavsky, Ross Maidment, Helen Greatrex, Agrotosh Mookerjee, Tristan Quaife, and Matthew Brown. 2016. "The Use of Remotely Sensed Rainfall for Managing Drought Risk: A Case Study of Weather Index Insurance in Zambia" Remote Sensing 8, no. 4: 342. https://doi.org/10.3390/rs8040342
APA StyleBlack, E., Tarnavsky, E., Maidment, R., Greatrex, H., Mookerjee, A., Quaife, T., & Brown, M. (2016). The Use of Remotely Sensed Rainfall for Managing Drought Risk: A Case Study of Weather Index Insurance in Zambia. Remote Sensing, 8(4), 342. https://doi.org/10.3390/rs8040342