Article

Glacial Lake Changes in the Donglin Tsangpo Watershed of China–Nepal Economic Corridor from 2016 to 2024

1
Department of Spatial Information Technology Application, Changjiang River Scientific Research Institute, Wuhan 430010, China
2
Wuhan Center for Intelligent Drainage Engineering Technology Research, Wuhan 430010, China
*
Author to whom correspondence should be addressed.
Remote Sens. 2026, 18(9), 1445; https://doi.org/10.3390/rs18091445
Submission received: 16 March 2026 / Revised: 29 April 2026 / Accepted: 30 April 2026 / Published: 6 May 2026
(This article belongs to the Special Issue Mapping the Blue: Remote Sensing in Water Resource Management)

Highlights

What are the main findings?
  • Glacial lakes in the Donglin Tsangpo Watershed expanded significantly from 2016 to 2024, with the number increasing from 43 to 56 and total area expanding by 24.16% (from 3.97 to 4.94 km2). The growth was driven by the emergence of small lakes (0.02–0.05 km2) and an upward shift in elevation, with new lakes forming above 5300 m.
  • This expansion coincided with pronounced positive thermal anomalies, a persistent liquid rainfall surplus, and shifting surface energy balances—where heightened longwave radiation effectively compensated for reduced shortwave radiation—alongside increased melt-day frequency.
What are the implications of the main findings?
  • These findings suggest that glacial lake development is highly sensitive to recent climatic changes and glacier retreat, particularly at mid-to-high elevations.
  • The upward expansion of glacier-contact lakes signals increased downstream hazard potential, emphasizing the need for ongoing monitoring and risk assessment in this climate-sensitive transboundary region.

Abstract

Glacial lake dynamics in high-mountain regions serve as a sensitive proxy for cryospheric responses to climate warming. This study utilizes multi-temporal Sentinel-2 imagery and digital elevation model (DEM) data to quantify glacial lake evolution in the Donglin Tsangpo Watershed, a strategically important section of the China–Nepal Economic Corridor, from 2016 to 2024. The results show a significant expansion in both the number (from 43 to 56) and total area (from 3.97 km2 to 4.94 km2, +24.43%) of glacial lakes, primarily driven by the rapid emergence of very small lakes (0.02–0.05 km2) and a clear upward shift in elevation distribution, with new lakes forming above 5300 m and extending to elevations exceeding 5500 m. Analysis of Moderate Resolution Imaging Spectroradiometer (MODIS) land surface temperature (LST) reveals that this expansion coincided with pronounced positive thermal anomalies, particularly the 2020 extreme warm event (daytime +3.88 °C, nighttime +1.61 °C). Mechanistic analysis using the ERA5-Land reanalysis dataset further demonstrates that persistent positive downward longwave radiation (LW) anomalies (peaking at +10.71 W/m2 in 2021) effectively compensated for reduced shortwave input, inhibiting nocturnal refreezing and extending the effective ablation period. Furthermore, a rising liquid-to-solid precipitation ratio and extreme melt-day anomalies (up to +39.36 days) provided intensified hydrothermal inputs, driving the pronounced expansion of glacier-contact lakes despite non-linear interannual responses. This study also estimates individual lake volumes, identifying a transition toward rapid lake development that elevates potential downstream hazard exposure. These findings provide a high-resolution dataset and a robust physical framework for transboundary environmental monitoring and risk assessment in this climate-sensitive region.

1. Introduction

Glacial lakes in high-mountain regions have undergone rapid expansion and evolution under ongoing climate warming and are widely recognized as sensitive indicators of cryospheric change [1,2,3]. Driven by accelerated glacier retreat and mass loss [4,5,6], these lakes are increasingly forming and enlarging across newly deglaciated terrain, fundamentally reshaping alpine hydrological and geomorphological systems [7,8,9]. Consequently, the spatiotemporal dynamics of glacial lakes—including changes in quantity, area, and elevation distribution—provide critical insights into the response of the cryosphere to climatic forcing and associated environmental transformations in High Mountain Asia (HMA).
Recent advances in satellite remote sensing have enabled long-term monitoring of glacial lake expansion and morphological evolution at regional to continental scales [10,11,12]. However, growing evidence indicates that glacial lake development is highly heterogeneous, reflecting the combined influence of large-scale climatic forcing and local topographic controls [13,14,15]. In particular, the vertical distribution of glacial lakes—often constrained by the equilibrium line altitude (ELA) and thermal thresholds—serves as a key indicator of the differential sensitivity of glacier–lake systems to atmospheric warming [16,17,18]. Therefore, quantifying variations in glacial lake quantities and area across elevation gradients is essential for understanding the feedback mechanisms linking glacier retreat, lake expansion, and climate variability, including both temperature and precipitation influences [19,20,21].
Although previous studies have significantly advanced our understanding at the HMA scale, regional assessments often obscure substantial local variability, particularly in complex high-relief environments. The central Himalayas represent one of the most dynamic subregions within HMA, characterized by strong climatic gradients, active glacier dynamics, and increasing downstream exposure to glacial hazards. Within this context, the Donglin Tsangpo Watershed (DTW), located along the China–Nepal border, constitutes a critical yet understudied transboundary basin. Its pronounced elevation range, extensive high-altitude glaciation, and strategic infrastructure setting make it highly sensitive to both climatic forcing and cryospheric change [22,23,24].
Previous studies in adjacent regions have provided a foundation for mapping glacial lake evolution [25,26,27,28]. However, detailed watershed-scale investigations in the DTW remain limited. In particular, the combined effects of elevation-dependent processes and key climatic drivers—such as temperature variability, radiative forcing, precipitation dynamics, and melt conditions—have not been systematically quantified at high spatial and temporal resolution. Addressing this gap is essential for advancing process-level understanding and improving hazard assessment in data-sparse transboundary watershed regions.
To address these limitations, this study presents a comprehensive analysis of glacial lake dynamics in the DTW from 2016 to 2024 by integrating multi-source remote sensing datasets. Specifically, the objectives are to: (1) quantify temporal changes in glacial lake number and total area; (2) characterize spatial patterns, including horizontal distribution and elevation-dependent variability; and (3) investigate the coupled influence of key environmental drivers, including temperature, radiation, precipitation, and melt conditions, on glacial lake evolution. By bridging large-scale observations with watershed-scale analysis, this study provides a robust basis for long-term monitoring and transboundary glacial lake hazard assessment in the central Himalayas.

2. Materials and Methods

2.1. Study Area

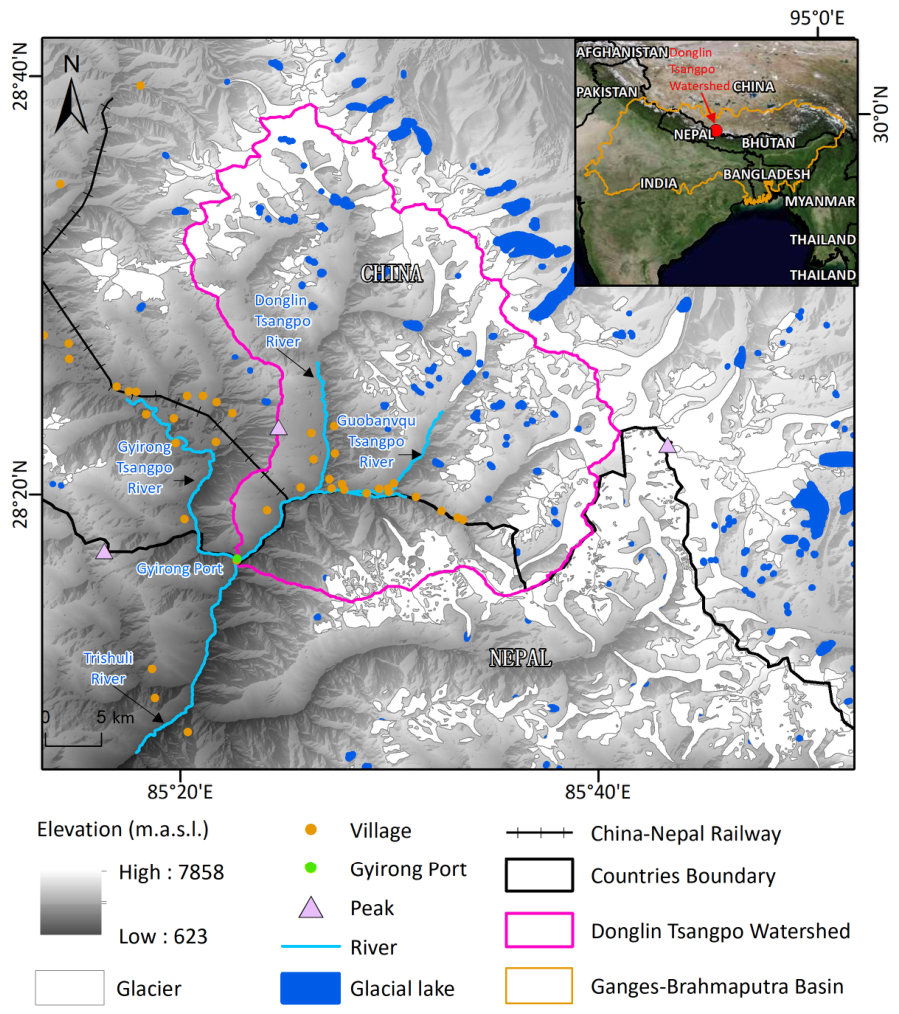
The study area is the Donglin Tsangpo Watershed (DTW), a transboundary basin located between Gyirong County in China and Bagmati Province in Nepal, within the central Himalayas (Figure 1). The Donglin Tsangpo River originates from glaciated peaks on the southern slope of the Himalayas and flows southward to its confluence with the Gyirong Tsangpo near the China–Nepal border at Gyirong Port. Downstream in Nepal, the combined flow forms the Bhote Koshi River, which constitutes a major headwater tributary of the Trishuli River within the Ganges Basin.
The DTW is characterized by a pronounced elevation gradient, ranging from approximately 590 m to 7360 m a.s.l., which supports extensive glaciation in its headwaters. Similar to the adjacent Gyirong Tsangpo watershed—which contained approximately 614 km2 of glacier area in 1988 [22]—the DTW represents a glacier-influenced hydrological system. Glacial meltwater plays a critical role in sustaining downstream ecosystems and supporting subsistence agriculture (e.g., highland barley and maize) distributed across alluvial fans and river terraces [29,30].
The hydroclimatic regime of the DTW is primarily governed by the Indian Ocean Summer Monsoon (IOSM), resulting in pronounced vertical climatic zonation [31]. Climatic conditions transition from a cold semi-arid plateau monsoon regime in the glacierized headwaters to a humid subtropical mountain monsoon climate toward the China–Nepal border [22,32]. This altitudinal gradient drives strong spatial variability in precipitation, increasing from approximately 300–600 mm in the upper basin to 1000–3000 mm in the lower valleys [33]. Correspondingly, mean annual temperature exhibits a clear lapse-rate pattern, with average values of approximately 3.5 °C in high-altitude regions [22]. These coupled topo-climatic gradients exert a fundamental control on glacier mass balance and the spatiotemporal evolution of glacial lakes within the watershed.
The watershed is also situated within a strategically important corridor of the China–Nepal Economic Corridor, encompassing key infrastructure such as the planned China–Nepal Railway and downstream hydropower systems. As a major tributary basin of the Trishuli River, the DTW supports critical energy infrastructure, including the Upper Trishuli hydropower cascade. These assets are concentrated in steep, high-relief valleys, making them particularly vulnerable to glacial lake outburst floods (GLOFs) originating from upstream glacierized regions.
On 8 July 2025, a GLOF event occurred within the DTW near the Gyirong Port, triggering a cross-border debris flow [24]. The event generated a high-energy flood with substantial sediment transport capacity, resulting in severe downstream impacts, including infrastructure damage and reported casualties. This event underscores the significant hazard potential associated with glacial lakes in transboundary high-mountain basins and highlights the necessity for systematic monitoring of their evolution.
However, due to complex terrain and limited accessibility, in situ observations within the watershed remain sparse. In this context, satellite remote sensing provides an effective and practical approach for monitoring glacial lake dynamics and associated hazards across large and remote mountainous regions.
Figure 1. Study area and distribution of environmental monitoring stations. Data sources [34,35,36,37].
Remotesensing 18 01445 g001

2.2. Experimental Data

2.2.1. Sentinel-2 Data

Sentinel-2 is a multi-satellite Earth observation mission operated under the Copernicus Programme, designed to provide high-resolution optical imagery for land surface monitoring. The mission initially consisted of two satellites (Sentinel-2A, launched in 2015, and Sentinel-2B, launched in 2017) and has been recently extended with the launch of Sentinel-2C in 2024 to ensure data continuity and long-term operational stability. The multispectral instrument (MSI) onboard Sentinel-2 acquires 13 spectral bands spanning the visible (VIS), near-infrared (NIR), and shortwave infrared (SWIR) regions, with spatial resolutions ranging from 10 to 60 m and a revisit time of approximately 5 days at the equator (2–3 days at mid-latitudes). Sentinel-2 data are distributed at Level-1C (top-of-atmosphere reflectance) and Level-2A (surface reflectance after atmospheric correction).
In this study, Sentinel-2 Level-2A imagery from 2016 to 2024 was used to ensure radiometric consistency and minimize atmospheric effects. The high spatial resolution and multispectral capability, particularly the inclusion of NIR and SWIR bands, make Sentinel-2 data well suited for the identification and delineation of glacial lakes in complex high-mountain environments.

2.2.2. DEM Data

Elevation data was obtained from the Copernicus Digital Elevation Model (COP-DEM), provided by the European Space Agency (ESA). The dataset offers near-global coverage at spatial resolutions of 30 m and 90 m and is derived from the WorldDEM product with additional editing to improve terrain representation and water body consistency.
The COP-DEM provides high positional accuracy, with horizontal accuracy (CE90) better than 6 m and vertical accuracy (LE90) better than 4 m. Although it is technically a digital surface model (DSM), its application in this study is appropriate given the high-elevation alpine environment of the DTW (>4000 m), where vegetation cover and anthropogenic structures are minimal. Under such conditions, the DSM closely approximates the natural terrain surface. The dataset has been widely applied in high-mountain cryospheric studies and has demonstrated sufficient accuracy for topographic and geomorphological analyses [38].
In this study, the DEM was used to derive elevation and slope for analyzing the spatial distribution and elevation dependence of glacial lakes.

2.2.3. Land Surface Temperature Data

Land surface temperature (LST) data were obtained from the MOD11A2 product derived from the Moderate Resolution Imaging Spectroradiometer (MODIS) onboard the Terra satellite. This product provides 8-day composite LST data at a spatial resolution of 1 km.
For this study, MODIS LST data from 2016 to 2024 were aggregated to annual means for both daytime and nighttime conditions. Temperature anomalies were calculated relative to the multi-year mean to quantify interannual variability in thermal conditions. These data provide a consistent basis for analyzing temperature-driven glacier melt processes and their influence on glacial lake evolution.

2.2.4. Climate Reanalysis Data

To further characterize climatic controls, reanalysis data from the ERA5 dataset provided by the European Centre for Medium-Range Weather Forecasts (ECMWF) were utilized. ERA5 offers physically consistent atmospheric and surface variables with high temporal resolution, making it suitable for long-term climate analysis.
In this study, ERA5 data from 1950 to 2024 were used to establish a climatological baseline (1950–2010) and to calculate anomalies for the study period (2016–2024). Key variables included total precipitation (TP), rainfall, melt-related indicators (melt days), and surface radiation components (shortwave and longwave radiation). Precipitation anomalies represent variability in both rainfall and snowfall contributions, corresponding to direct hydrological inputs to glacial lakes [39,40]. Melt-day anomalies were used to quantify the frequency of temperature conditions favorable for surface melting, serving as an indicator of meltwater availability. Radiation variables were analyzed to assess surface energy balance, particularly the compensatory relationship between shortwave and longwave radiation.
All datasets described above were integrated within a unified analytical framework to extract glacial lakes and quantify their spatiotemporal dynamics and climatic controls.

2.3. Method

This study employs a multi-source spatiotemporal coupling framework to extract glacial lake inventories and analyze their evolution. The framework is designed to address key challenges in high-mountain remote sensing, including spectral confusion in deep valleys and terrain-induced shadow effects.

2.3.1. Workflow Overview

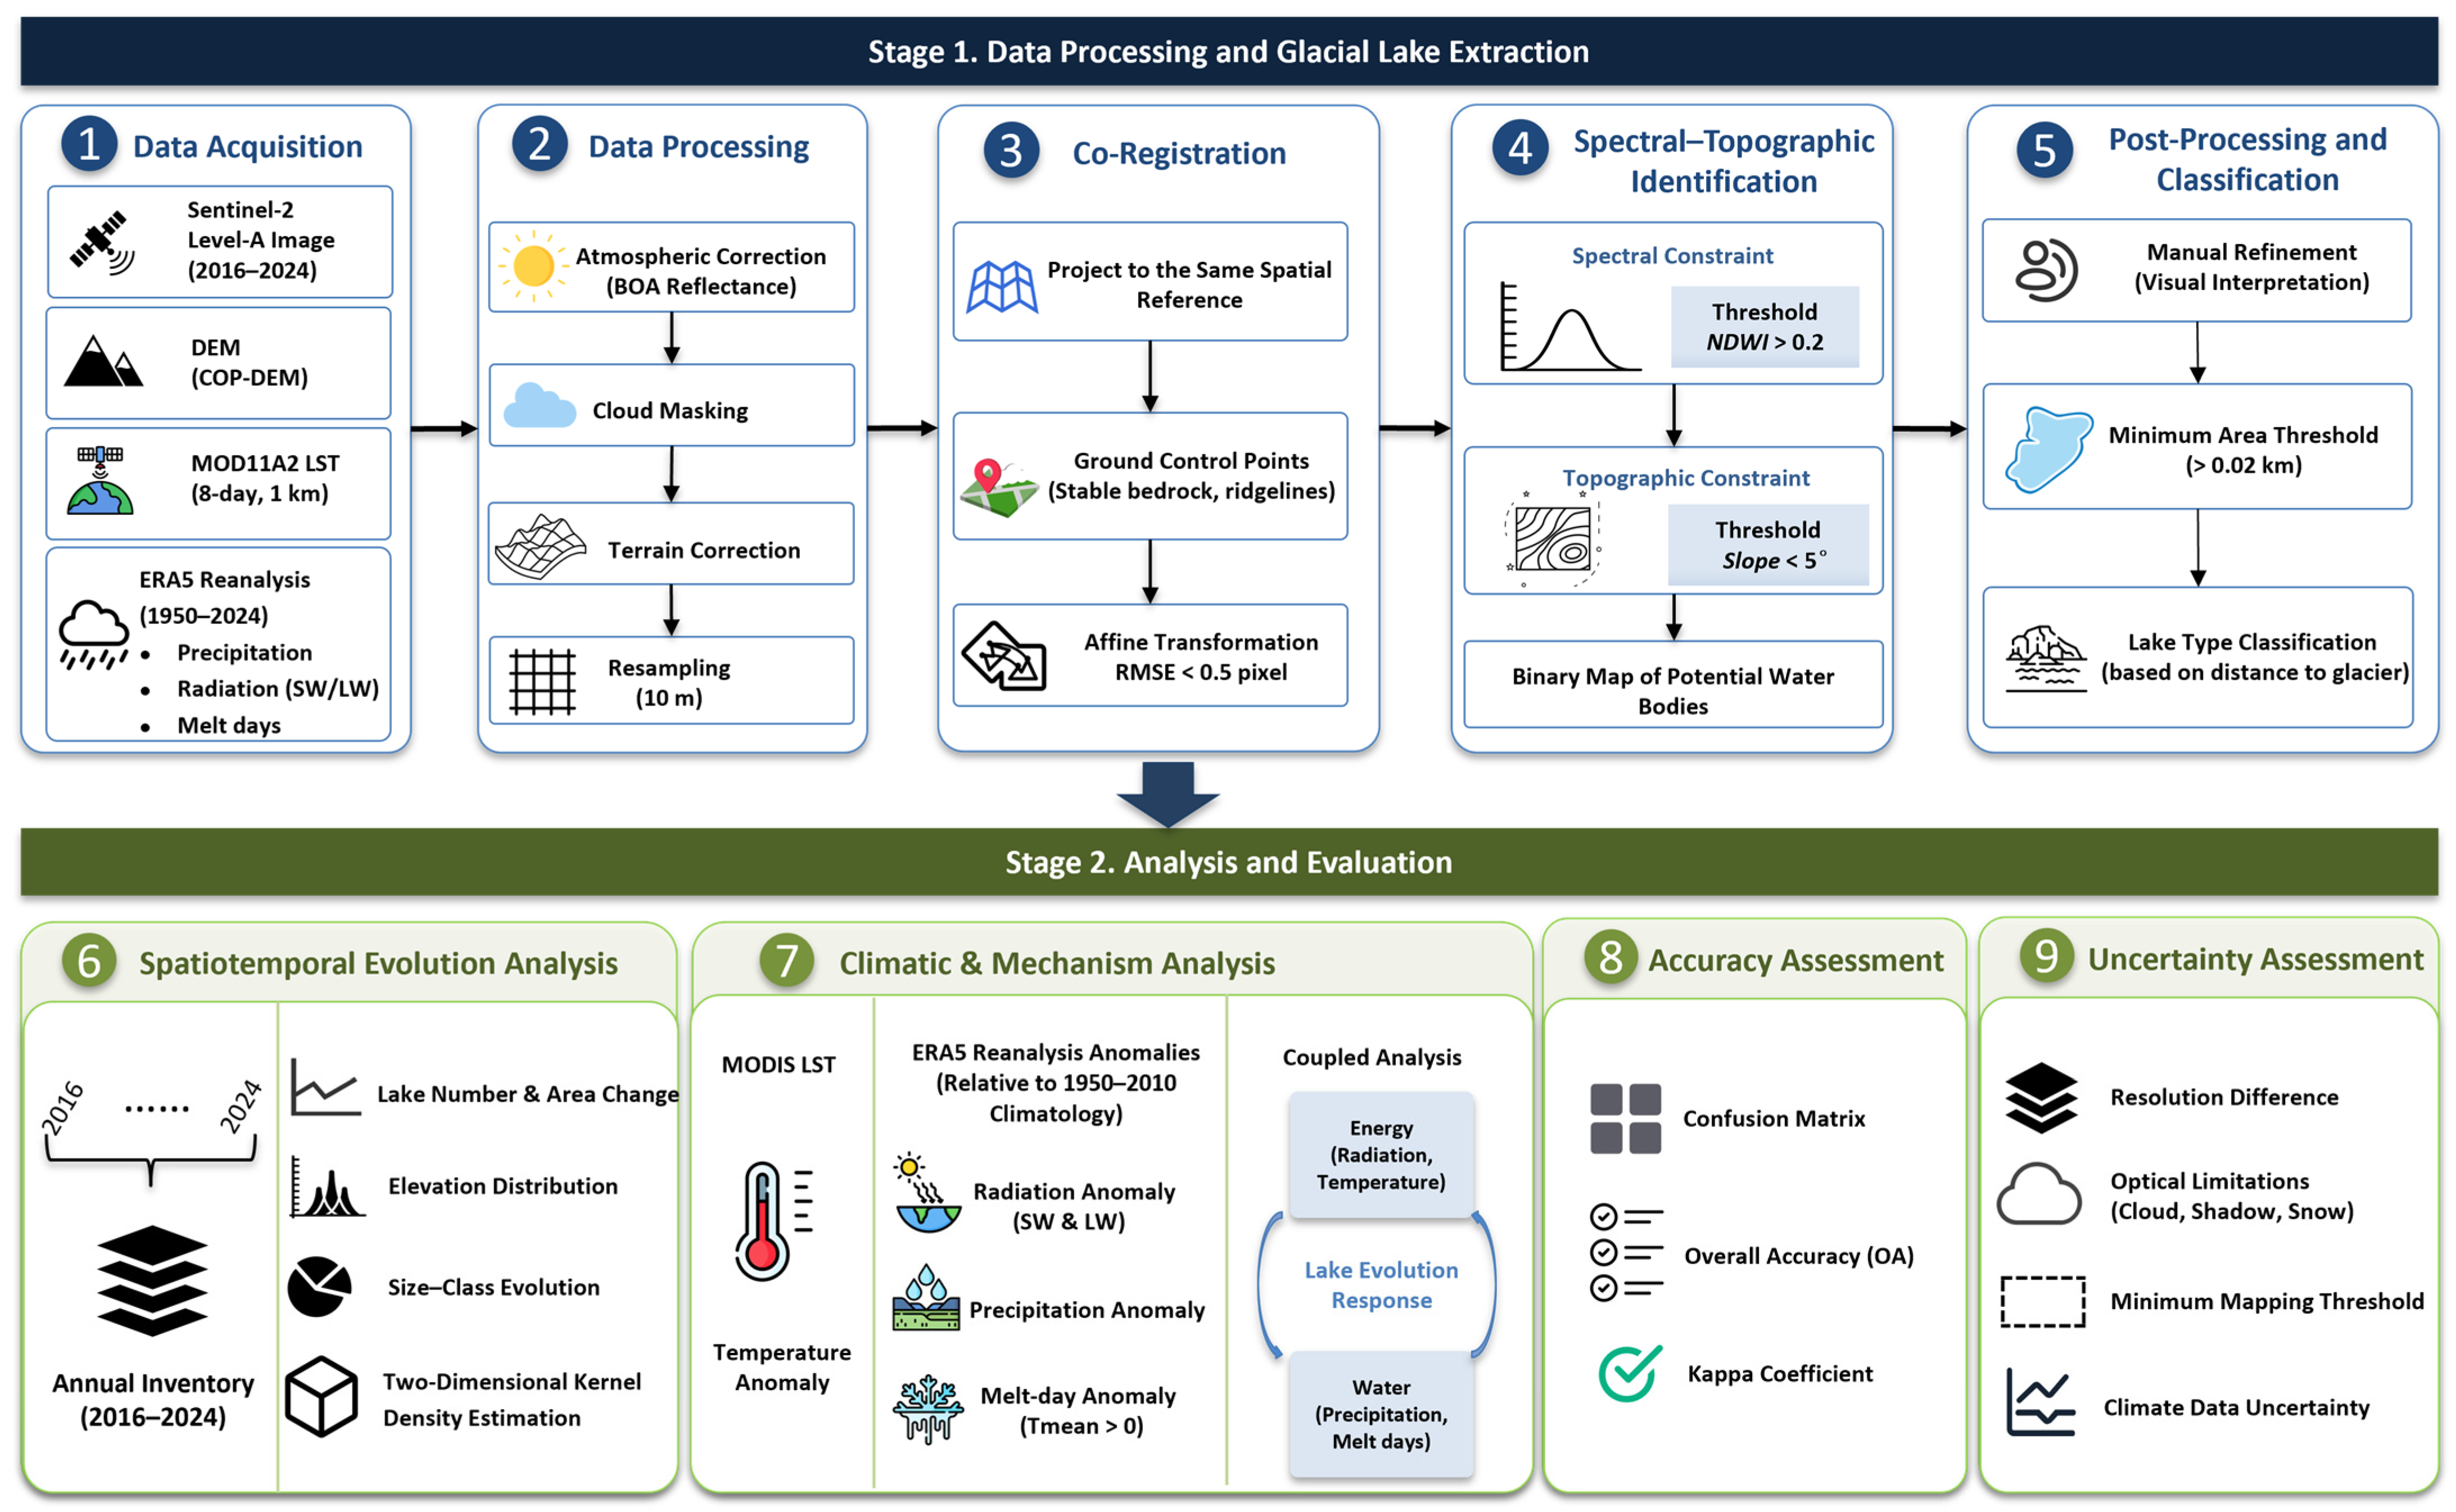
The workflow consists of two major stages (Figure 2):
(a)
Data processing and glacial lake extraction, including data processing, co-registration, spectral–topographic identification, post-processing and classification;
(b)
Analysis and evaluation, including spatiotemporal evolution analysis, climatic and mechanism analysis, accuracy assessment and uncertainty assessment.

2.3.2. Data Processing

Sentinel-2 Level-2A imagery was used directly to ensure atmospherically corrected surface reflectance. Cloud-contaminated pixels were masked, and terrain correction was applied to reduce illumination effects in high-relief areas.
To ensure interannual consistency, a dynamic image selection strategy was adopted. Cloud-free images from the post-monsoon period (mid-September to early October) were prioritized. All selected images were visually inspected to ensure ice-free lake conditions. In cases of early freezing, the nearest preceding cloud-free image was used.
All datasets were resampled and reprojected to the Asia North Albers Equal Area Conic projection to ensure spatial consistency and accurate area estimation.

2.3.3. Data Co-Registration

Precise co-registration was performed using stable ground control features (e.g., ridgelines and exposed bedrock). An affine transformation was applied to align multi-temporal datasets, achieving a root mean square error (RMSE) of less than 0.5 pixels. This step is critical for reliable multi-year change detection.

2.3.4. Spectral–Topographic Constraint-Based Identification

A coupled spectral–topographic constraint (CSTC) approach was used to identify glacial lakes:
  • Spectral Constraint: Water bodies were initially detected using the Normalized Difference Water Index ( N D W I ) [41]:
    N D W I = B G B N I R B G + B N I R
    where B G and B N I R correspond to Sentinel-2 Bands 3 and 8. A sensitivity analysis was conducted using N D W I thresholds ranging from 0.0 to 0.4 (interval = 0.05). The results were evaluated against high-resolution imagery and manually digitized lake boundaries. A threshold of 0.2 provided the optimal balance between minimizing spectral noise (e.g., shadows and ice) and accurately delineating water extent [41,42,43]. Therefore, pixels with N D W I > 0.2 were classified as water, with further refinement through visual interpretation to account for complex terrain effects.
  • Topographic Constraint: To reduce misclassification caused by mountain shadows, slope filtering based on COP-DEM was applied [44]. Slope is calculated as:
    s l o p e = a r c t a n z x 2 + z y 2
    where z x and z y represent the rates of change in the east–west direction and the north–south direction, respectively. Pixels were classified as water only when: N D W I > 0.2 and s l o p e < 5 ° .

2.3.5. Post-Processing and Classification

To reduce classification noise, an area threshold of 0.02 km2 was applied to exclude mixed pixels and small artifacts [2,17,43]. Then, the results were manually validated and refined using Google Earth high-resolution imagery, including the removal of false positives and correction of ambiguous lake boundaries. This procedure ensures the geometric accuracy and thematic reliability of the final glacial lake inventory.
Post-processed glacial lakes were classified based on their spatial relationship to glaciers using the Euclidean distance between the lake centroid and the nearest glacier boundary. The distance between two points P 1 = ( x 1 , y 1 , z 1 ) and P 2 = ( x 2 , y 2 , z 2 ) is defined as:
d P 1 , P 2 = x 2 x 1 2 + y 2 y 1 2 + z 2 z 1 2
Lakes were categorized as:
(1)
Glacier-contact lakes ( d P 1 , P 2 = 0 ),
(2)
Near-glacier-fed lakes ( 0 < d P 1 , P 2 0.5   k m ),
(3)
Far-glacier-fed lakes ( 0.5 < d P 1 , P 2 2   k m ) [41].

2.3.6. Spatiotemporal Evolution Analysis

(1) Annual glacial lake inventories.
Annual glacial lake inventories (2016–2024) were used to quantify changes in lake quantities, area, and elevation distribution [45]. The annual growth rate is calculated as:
R = A t + 1 A t A t × 100 %
where A t + 1 and A t represent the total glacial lake area in consecutive years.
(2) Two-Dimensional Kernel Density Estimation.
To characterize the joint distribution and identify clustering patterns of glacial lakes within the elevation–growth rate space, two-dimensional kernel density estimation (2D KDE) was applied [46]. As a non-parametric method, 2D KDE estimates the probability density function without prior assumptions. For n independent data points X , the density estimator f x is defined as:
f x = 1 n h 2 i = 1 n K x X i h
K u = 1 2 π e x p 1 2 u 2
where K denotes the Gaussian kernel function and h is the bandwidth (smoothing parameter). This approach yields a continuous density surface that highlights the altitudinal intensity of lake expansion.

2.3.7. Climatic and Mechanism Analysis

To comprehensively investigate the climatic controls on glacial lake evolution, a multi-scale analytical framework was adopted by integrating ERA5 reanalysis data and MODIS land surface temperature (LST). ERA5 variables, including precipitation, radiation components, and melt-day indicators, were analyzed using a long-term climatological baseline (1950–2010) to quantify deviations from background climate conditions and to characterize large-scale atmospheric forcing. In contrast, MODIS LST data were used to derive temperature anomalies relative to the study-period mean (2016–2024), with a focus on capturing high-resolution interannual variability in surface thermal conditions.
This combination of long-term and short-term anomaly frameworks enables a complementary interpretation of climatic drivers, distinguishing between persistent climatic trends and contemporaneous thermal fluctuations.
(1) Temperature Relative Variability.
MODIS LST data were used to derive temperature anomalies. The average temperature is calculated as:
T ¯ = n = 1 N T n N
where N represents the total quantities of years, T n is the average daytime/nighttime temperature for October of the year n , and T ¯ represents the average daytime/nighttime temperature for the N years.
Temperature anomalies ( T ) are defined as:
T = T n T ¯
In this study, temperature anomalies were calculated relative to the multi-year mean over the study period (2016–2024).
(2) Melt Conditions and Meltwater Availability.
To better represent melt processes in high-elevation environments, melt-day anomalies were derived from ERA5 air temperature data. A melt day is defined as a day with mean air temperature exceeding 0 °C. The annual number of melt days was compared with the 1951–2010 baseline to quantify melt-day anomalies [47].
This metric provides a physically meaningful indicator of potential ablation duration, which is particularly important in high-mountain regions where mean temperatures remain low but episodic melting can still occur.
(3) Precipitation and Hydrological Inputs.
Total precipitation anomalies (TP anomalies) and liquid rainfall anomalies were calculated from ERA5 data as:
P = P n P ¯
R = R n R ¯
where P n and R n are the annual total precipitation and total rainfall and P ¯ and R ¯ are the climatological mean (1951–2010).
Precipitation influences glacial lake evolution through multiple pathways, including direct water input, thermal forcing from rainfall, and rain-on-snow (ROS) processes that enhance snowmelt and runoff [39,40]. These effects are particularly significant in high-elevation environments, where episodic precipitation can substantially increase meltwater availability.
(4) Radiation Components and Surface Energy Balance.
Surface energy balance was assessed using ERA5-derived downward shortwave (SW) and longwave (LW) radiation anomalies relative to the 1951–2010 baseline. SW anomalies represent variations in incoming solar radiation, while LW anomalies reflect downward atmospheric emission associated with cloud cover, temperature, and humidity. Their joint analysis enables identification of radiative compensation effects, where reduced SW input may be offset by enhanced LW radiation, sustaining melt under low-insolation conditions [48].
(5) Coupled Energy–Hydrological Framework.
Climatic drivers were analyzed within a coupled framework: (1) energy drivers, including temperature anomalies and radiation components, and (2) hydrological inputs, including precipitation and melt-day anomalies. This framework enables differentiation between thermally driven melt, hydrologically enhanced melt, and their combined effects on glacier mass loss and lake expansion.
(6) Data Integration and Uncertainty Considerations.
MODIS LST and ERA5 reanalysis data were used in a complementary manner, representing surface thermal conditions and atmospheric forcing, respectively. Despite differences in spatial resolution, their integration provides a consistent basis for interpreting glacier–lake–climate interactions, with associated uncertainties considered in the analysis.

2.3.8. Accuracy Assessment

Classification accuracy was evaluated using a confusion matrix constructed from reference samples derived from high-resolution satellite imagery and expert manual interpretation. By comparing the predicted classes with the reference data on a pixel-by-pixel basis, we calculated standard performance metrics, including overall accuracy ( O A ), the Kappa coefficient, and class-specific producer’s and user’s accuracies [49], to provide a comprehensive assessment of the classification reliability. O A is calculated as:
O A = i = 1 k n i i N
where n i i is the number of correctly classified pixels in class i , k is the total number of classes, and N is the total number of validation pixels. The Kappa coefficient ( K a p p a ), which accounts for agreement occurring by chance, is defined as:
K a p p a = N i = 1 k n i i i = 1 k n i + n + i N 2 i = 1 k n i + n + i
where n i + and n + i are the marginal totals for the i -th row and i -th column, respectively.
Producer’s accuracy measures the proportion of real-world features that are correctly identified by the classifier, thereby reflecting the omission error (the probability that a glacial lake pixel is missed). Conversely, user’s accuracy represents the probability that a pixel classified on the map actually represents that category on the ground, indicating the commission error (the probability that other land covers are incorrectly identified as glacial lakes). These class-specific metrics are essential for ensuring that the observed expansion in glacial lake area is not an artifact of classification bias or noise.

2.3.9. Uncertainty Assessment of Glacial Lake Area

Uncertainty ( U A ) in glacial lake area primarily arises from image resolution and mixed pixels along lake boundaries. U A was quantified using a perimeter-based approach [50,51,52]:
U A = P × r 2
where P is the total perimeter of the glacial lakes and r is the spatial resolution of the Sentinel-2 imagery (10 m). The relative error E is expressed as:
E = P A × 100 %
where A is the total area of the glacial lakes. A boundary uncertainty of 0.5 pixels (5 m) was assumed based on manual refinement, providing a conservative estimate of delineation error.

3. Results

3.1. Accuracy of Glacial Lake Mapping

To evaluate the reliability of the extracted glacial lake inventory, a confusion matrix analysis was conducted using high-resolution reference data. The O A reached 95.2%, with a Kappa coefficient of 0.93. The producer’s and user’s accuracies for the glacial lake class were 94.8% and 97.2%, respectively, indicating robust discrimination of water bodies from shadows and debris-covered ice.
Boundary uncertainty analysis shows a mean positional error of 5.2 m, consistent with the 10 m spatial resolution of Sentinel-2. The inclusion of a 5° slope constraint reduced commission errors in high-relief terrain by 12.5% compared to NDWI-only extraction.

3.2. Distribution and Dynamics of Glacial Lakes

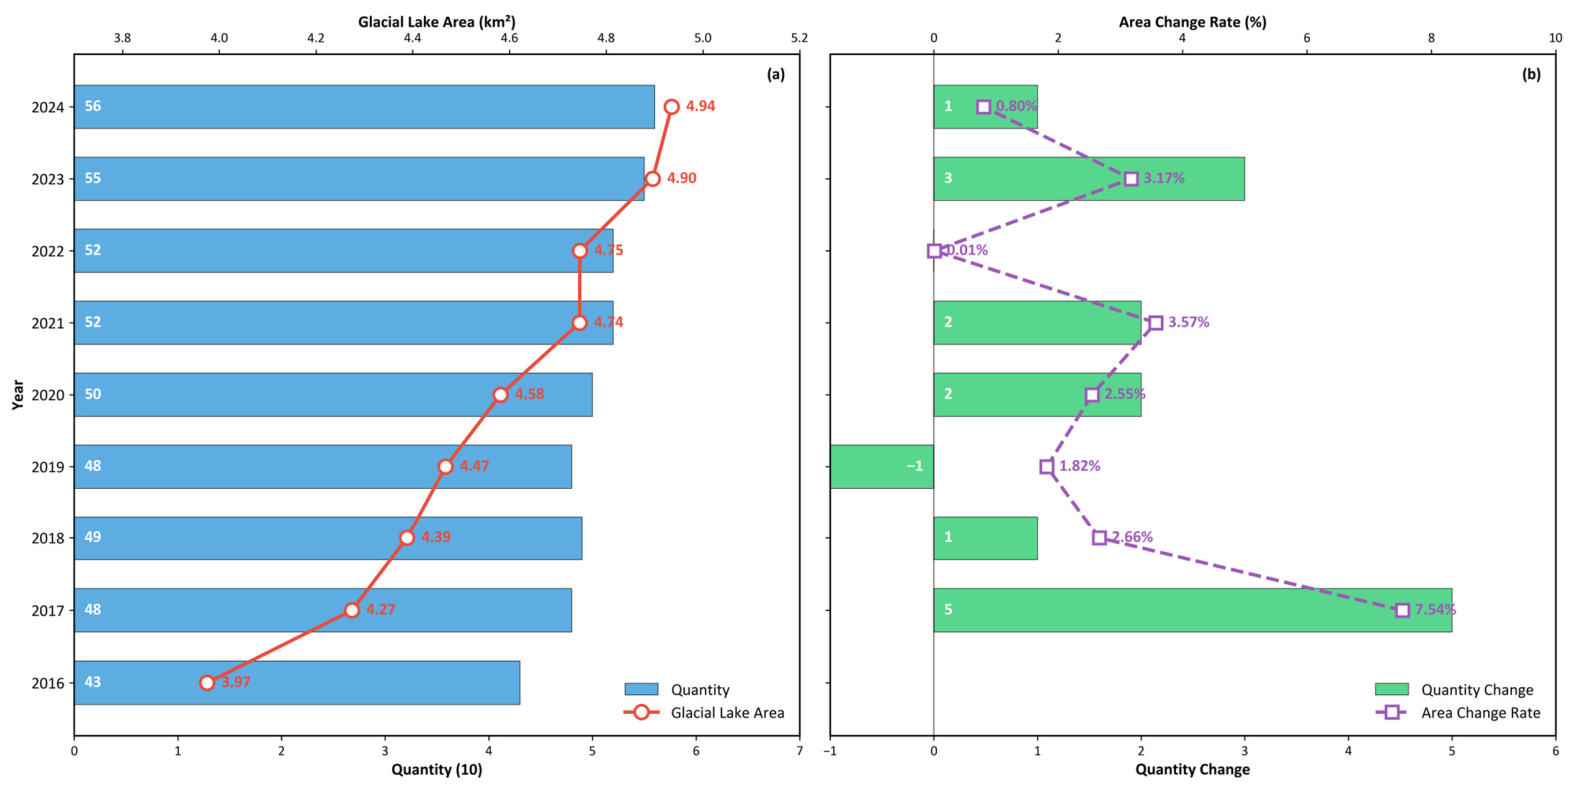
In 2024, a total of 56 glacial lakes were identified, with a combined area of 4.94 km2 and a mean area of 0.09 km2; the largest lake reached 2.60 km2 (Figure 3). Glaciers and associated lakes exhibit a NW–SE alignment in the northeastern sector, with lakes primarily distributed along glacier margins, reflecting strong topographic and structural controls.
From 2016 to 2024, both lake quantities and area increased consistently. The quantities of lakes rose from 43 to 56 (+30.23%), with 15 new lakes formed and 2 lost. Total area expanded from 3.97 km2 to 4.94 km2 (+24.43%), corresponding to an average annual growth rate of 3.02%. Area increased by 0.61 km2 during 2016–2020 and 0.35 km2 during 2020–2024, indicating a deceleration in recent growth.
Interannual variability is evident, with alternating phases of rapid expansion and relative stability. The largest increase occurred in 2016–2017 (+0.30 km2; +7.54%), while minimal change was observed in 2022. In some years (e.g., 2019), area growth occurred without an increase in lake quantities, indicating expansion of existing lakes rather than new formation.
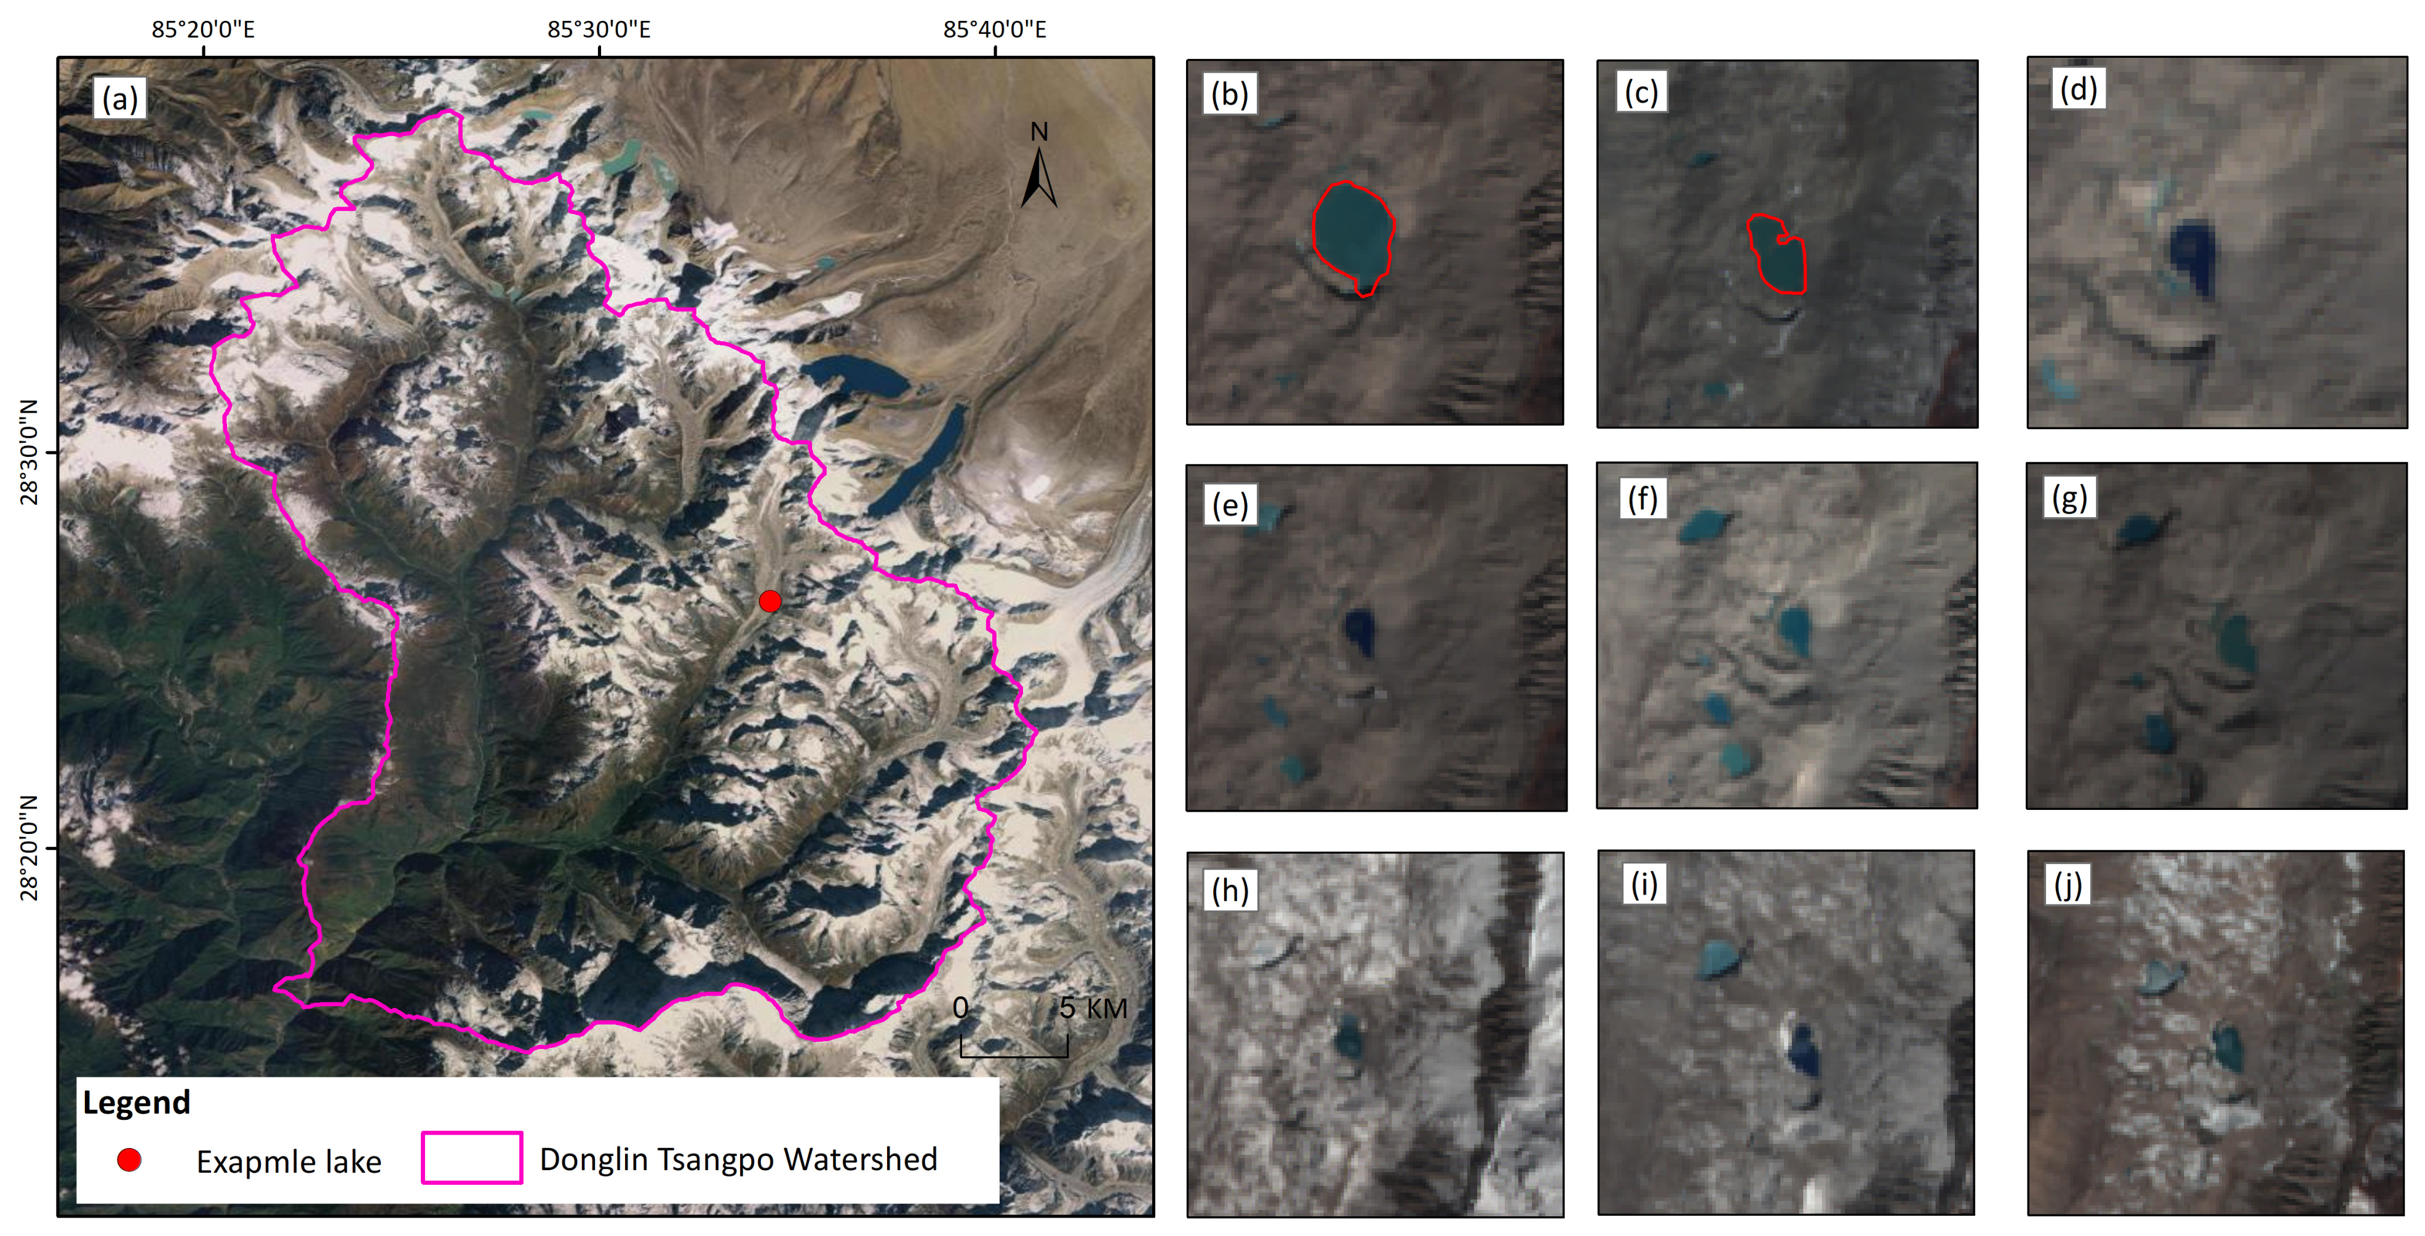
Figure 4 shows the spatiotemporal evolution of a representative glacial lake (85.572°E, 28.437°N) from 2016 to 2024. The lake area decreased from 0.04 km2 in 2016 to 0.024 km2 in 2017 and fell below 0.02 km2 after 2018. No geomorphological evidence of breach-related processes—such as downstream channel scouring, debris-flow deposition, or channel widening—is observed, indicating that the shrinkage was not associated with a glacial lake outburst event. Instead, the decline is likely driven by gradual drainage processes (e.g., subsurface seepage or slow outlet discharge), potentially coupled with a negative water balance.

3.3. Changes in the Scale of Glacial Lakes

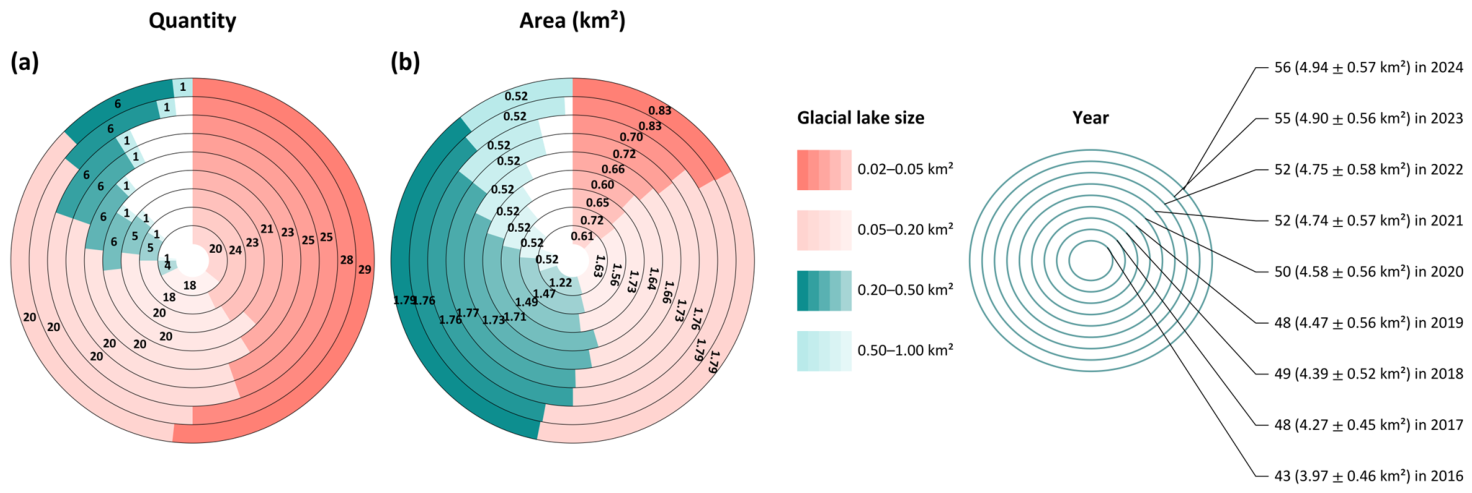
To analyze size-dependent variations, glacial lakes were classified into four categories based on surface area derived from annual inventories [52]: very small (0.02–0.05 km2), small (0.05–0.20 km2), medium (0.20–0.50 km2), and large (0.50–1.00 km2). Changes from 2016 to 2024 are summarized in Table 1 and Figure 5.
The evolution of glacial lakes shows clear scale-dependent differences during 2016–2024. Very small lakes (0.02–0.05 km2) exhibit the most pronounced increase, with a net gain of nine lakes, accounting for 69.23% of newly formed lakes. Their total area increased by 36.5%. This class also shows strong interannual variability, including a decline in 2019.
Small lakes (0.05–0.20 km2) show moderate growth, with increases of 11.1% in quantities and 9.6% in area. Most of this growth occurred during 2016–2020, with two additional lakes, contributing 30.77% of total lake increases. After 2020, the quantities of small lakes remained stable at 20.
Medium lakes (0.20–0.50 km2) exhibit substantial growth, with increases of 50% in quantities and 47.2% in area.
In contrast, large lakes (0.50–1.00 km2) remain nearly unchanged, with no variation in quantities and only a 1.4% increase in area.

3.4. Changes in the Elevation Distribution of Glacial Lakes

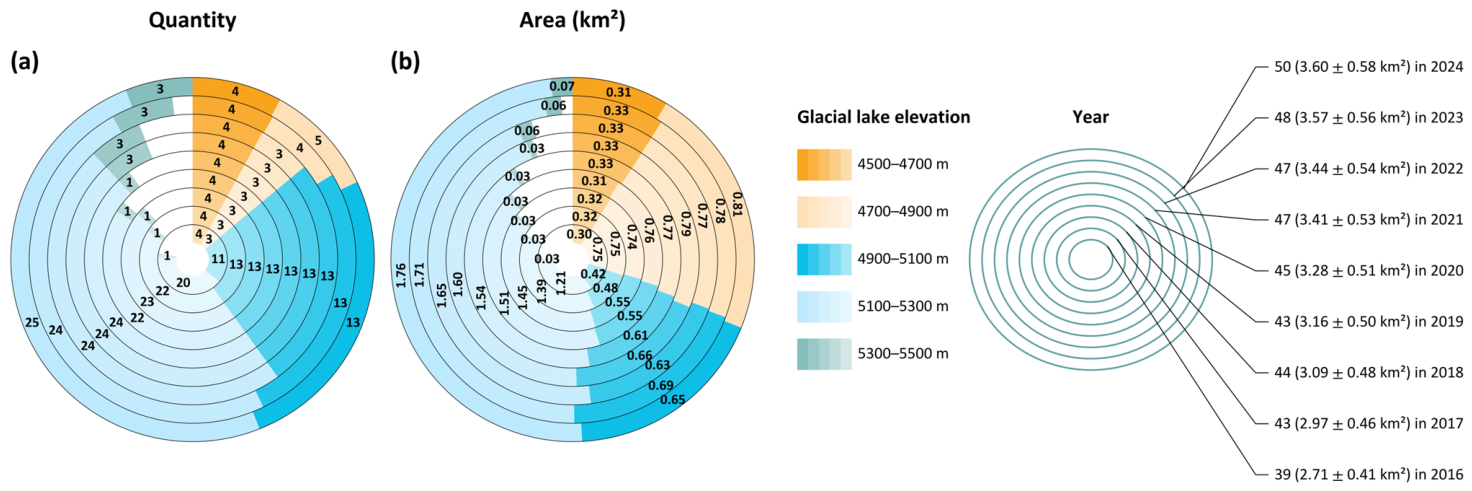
Glacial lakes in the study area are distributed between 4354 and 5511 m. The elevation range was divided into 200 m intervals to analyze altitudinal variations (Table 2; Figure 6 and Figure 7).
The elevation distribution of glacial lakes shows a clear concentration in the mid-altitude range (Table 2). In both 2016 and 2024, most lakes are distributed between 4900 and 5300 m, where lake quantities increased from 31 to 38, while total area changed from 2.87 km2 to 2.42 km2. The 5100–5300 m band contains the highest quantity of lakes, increasing from 20 to 25, with area expanding from 1.41 km2 to 1.77 km2.
At higher elevations (>5300 m), lake occurrence remains limited but shows expansion, with lake quantities increasing from one to four and total area from 0.07 km2 to 0.10 km2. Notably, lakes above 5500 m appeared in 2024 (0.02 km2), whereas none were present in 2016.
At mid–low elevations (4700–4900 m), lake quantities increased from three to five, accompanied by an area increase from 0.33 km2 to 0.81 km2. In contrast, the 4500–4700 m band shows no change in lake quantities (four lakes), while total area decreased from 0.55 km2 to 0.31 km2.
Below 4500 m, lake quantities increased slightly from four to five, while total area expanded markedly from 0.14 km2 to 1.29 km2, making it the second-largest elevation band in terms of area in 2024.
Overall, increases in lake quantity are mainly concentrated above 4900 m, whereas area changes exhibit stronger variability across elevation bands.
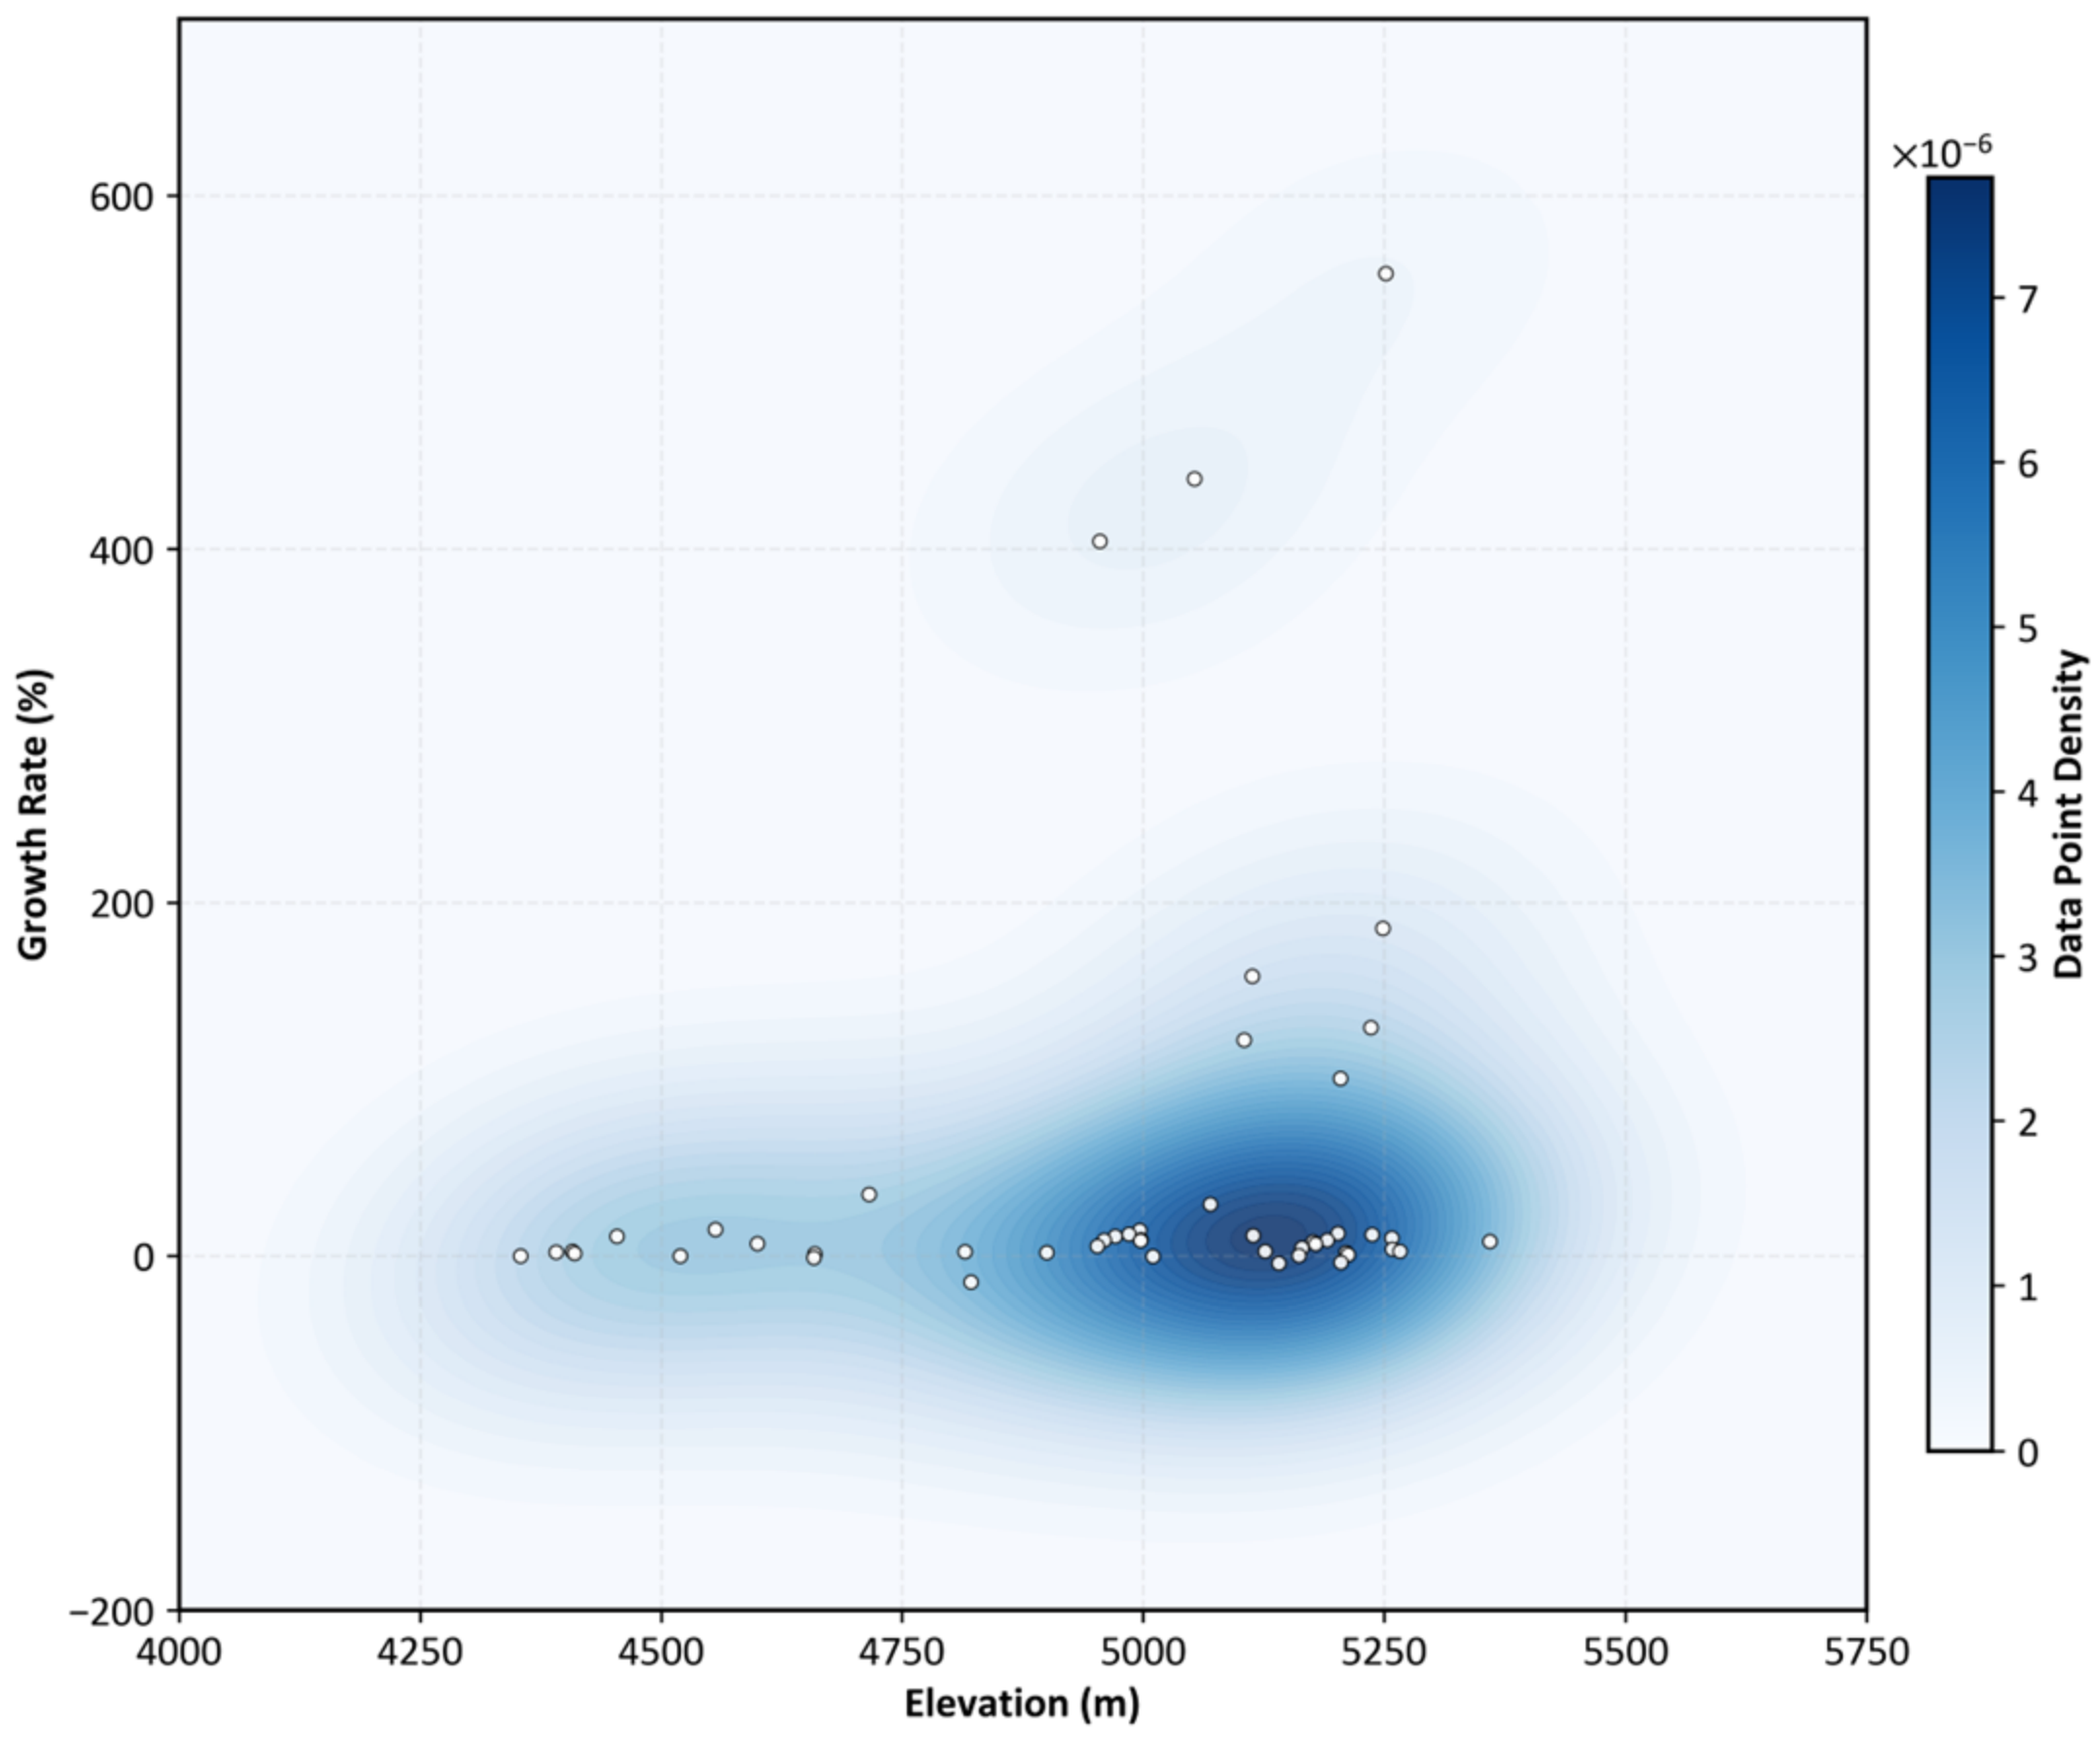
The joint distribution of glacial lakes in elevation–growth rate space, derived from 2D KDE, reveals pronounced altitudinal differences in expansion intensity (Figure 7). The white circles are the growth rate at different elevation, and the color is the kernel density distribution. Darker colours indicate a higher density of data points, while brighter colours correspond to fewer observations. The maximum density reaches 7.73 × 10⁻⁶, with high-density clusters (density > 5.0 × 10⁻⁶) concentrated between 5000 and 5300 m, corresponding to growth rates of 8–130%. Growth rates exceeding 100% are mainly distributed between 5100 and 5300 m. Representative lakes at around 5252 m, 5053 m, and 4955 m exhibit expansion rates of 556%, 440%, and 404%, respectively, while high growth rates are also observed near and above 5300 m. In contrast, lakes below 4800 m show limited changes, with growth rates generally < 10%.

3.5. Changes in the Locations of Glacial Lakes and Glaciers

As shown in Table 3, glacier-contact lakes dominate the study area. Among newly formed lakes in 2024 (relative to 2016), glacier-contact lakes account for nine cases (69.23%), while near-glacier-fed and far-glacier-fed lakes each account for two cases. The only disappearing lake belongs to the far-glacier-fed category and is located within the river channel.
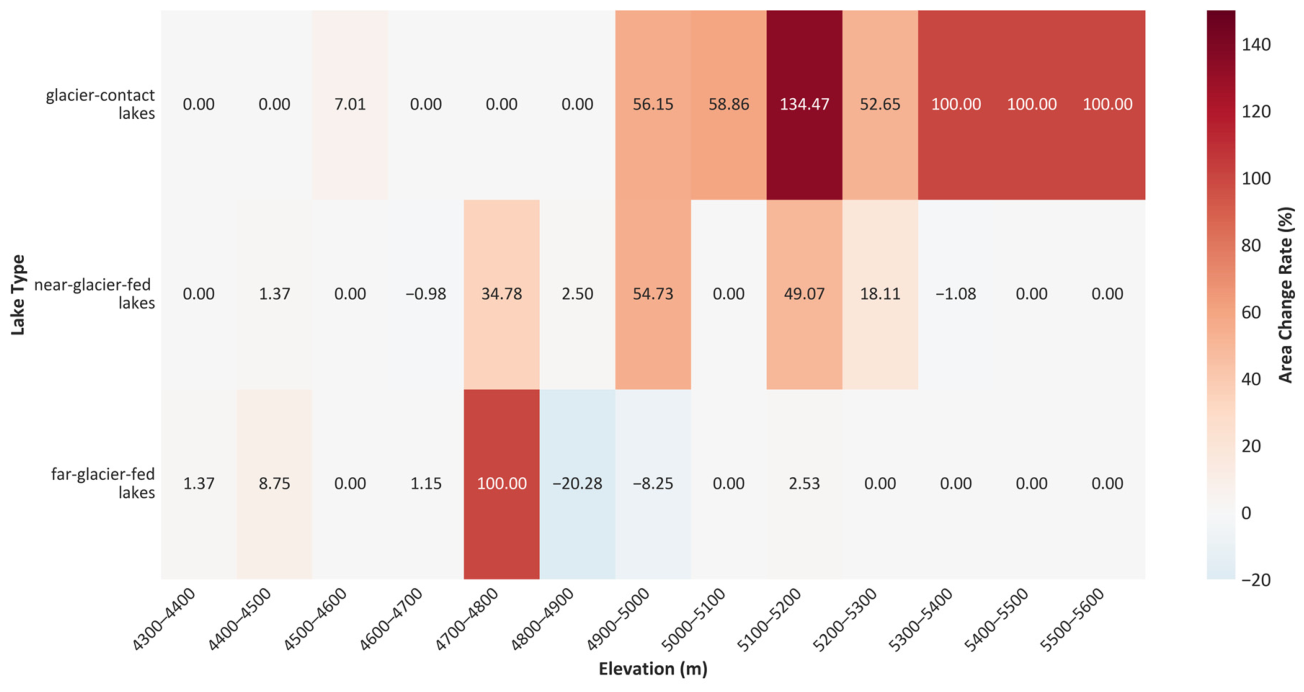
Figure 8 shows that lake expansion is most pronounced at 5100–5200 m, with an area increase of 134.5%. In addition, glacier-contact lakes are observed at higher elevations in 2024 compared to 2016. Specifically, no glacier-contact lakes were identified above 5300 m in 2016, whereas new lakes appear in the 5300–5400 m, 5400–5500 m, and 5500–5600 m elevation bands by 2024.
Above 5000 m, lake area is primarily composed of glacier-contact and near-glacier-fed lakes. Near-glacier-fed lakes also exhibit notable increases in area, including an increase of approximately 49% at 5100–5200 m. Glacier-contact lakes show consistently high area increases across multiple elevation bands above 5000 m.
Between 4500 and 5000 m, all three lake types are present. Far-glacier-fed lakes first appear at 4800–4900 m and show relatively large variability in area change, including both increases and decreases across adjacent elevation bands. Near-glacier-fed lakes also exhibit variable changes within this elevation range.
Below 4500 m, far-glacier-fed lakes dominate. Within the 4300–4500 m range, both the quantities of lakes and the magnitude of area change remain relatively small, with area increases ranging from +1.37% to +8.75%.
Overall, the magnitude of area change decreases from glacier-contact lakes to near-glacier-fed lakes and further to far-glacier-fed lakes.

4. Discussion

4.1. Reliability and Uncertainty of Glacial Lake Mapping

Sentinel-2 Level-2A imagery acquired during the post-monsoon period (August–October) was selected, when seasonal snow cover is generally reduced and glacial lakes approach their relatively stable annual extent. Despite these preprocessing strategies, uncertainties remain, particularly for small glacial lakes near the minimum mapping threshold (0.02 km2), where mixed pixels along lake boundaries and terrain shadow effects may introduce both omission and commission errors.
To mitigate these issues, an NDWI-based automatic extraction approach was integrated with DEM-derived slope constraints, followed by manual refinement through high-resolution visual inspection. As a result, the classification performance achieved high accuracy, indicating reliable discrimination of water bodies from spectrally similar features such as terrain shadows and debris-covered ice. These results confirm that the mapping framework is robust in complex mountainous environments and provides a reliable basis for subsequent spatiotemporal analysis.
Given the higher sensitivity of small glacial lakes to both climatic variability and classification uncertainty, we further assessed mapping stability for lakes close to the 0.02 km2 threshold. The interannual consistency of mapped lake area exhibited strong agreement across the 2016–2024 period ( R 2 = 0.92 ), suggesting that the observed temporal variations are primarily driven by actual cryospheric changes rather than classification uncertainty or methodological noise.
Based on a perimeter-dependent error propagation model, the total lake area uncertainty at the watershed scale ranged from ±0.28 km2 (2016) to ±0.35 km2 (2024). The average relative uncertainty for individual glacial lake area estimates was approximately 7.01%, which is within the typical uncertainty range reported in previous remote sensing-based glacial lake mapping studies. Overall, the uncertainty analysis indicates that the derived dataset is sufficiently reliable for detecting interannual and long-term glacial lake changes.

4.2. Relationships Between Glacial Lake Locations and Glacial Lake Changes

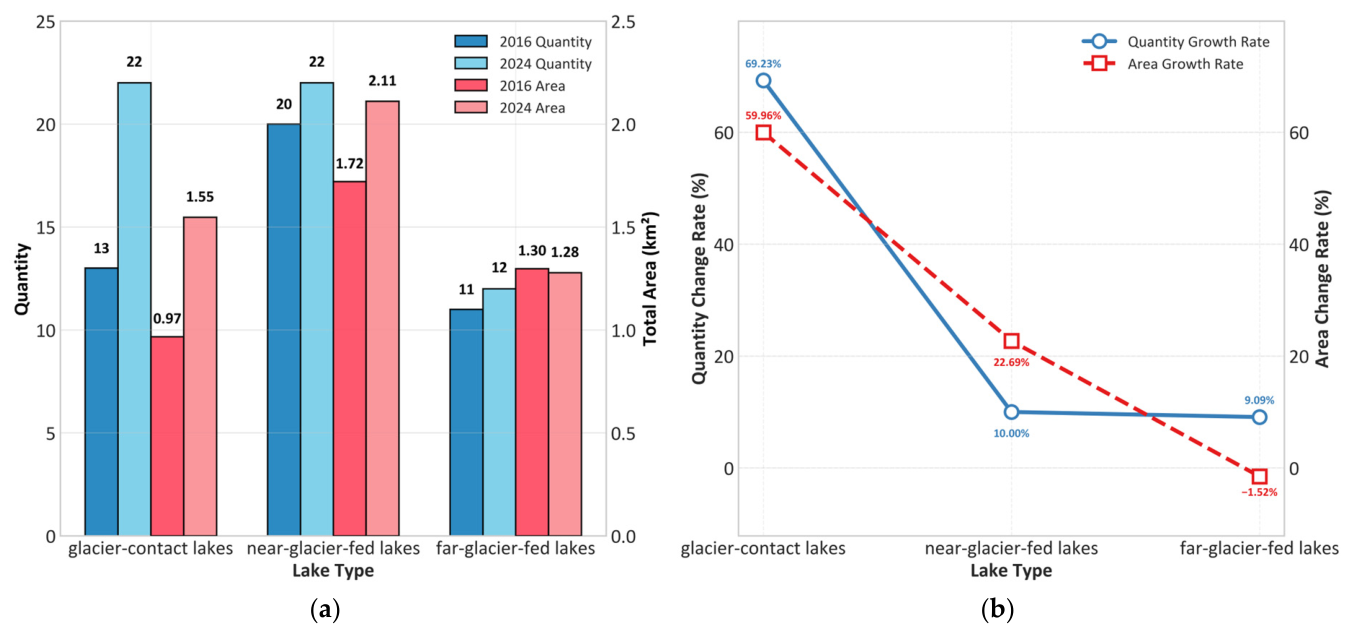
Glacier–lake evolution in the DTW is closely associated with the spatial connectivity between glacial lakes and their parent glaciers, which reflects differences in meltwater supply and hydrological coupling conditions. Figure 9 demonstrates a clear gradient in lake evolution intensity, with glacier-contact lakes showing the most rapid expansion, followed by near-glacier-fed lakes, while far-glacier-fed lakes remain relatively stable or slightly declining. This spatial pattern reflects a progressive weakening of direct glacier meltwater influence with increasing glacier–lake separation distance.
Between 2016 and 2024, glacier-contact lakes increased substantially in both quantities (13 to 22, +69.23%) and area (0.97 km2 to 1.55 km2, +59.79%). This rapid expansion is primarily driven by glacier retreat and thinning, which promotes the development of overdeepened proglacial basins and enhances direct meltwater accumulation. These lakes therefore represent the most dynamic component of the glacial lake system and respond rapidly to changes in glacier terminus position.
Near-glacier-fed lakes also show sustained but moderate growth, increasing in quantities from 20 to 22 (10.00%) and in area from 1.72 km2 to 2.11 km2 (22.69%). The higher area growth relative to lake quantities suggests that expansion of existing lakes dominates over the formation of new lakes, likely driven by persistent seasonal meltwater inflow through proglacial drainage systems.
In contrast, far-glacier-fed lakes exhibit relatively stable or slightly declining behavior, with lake quantities increasing marginally from 11 to 12 (9.09%) but total area decreasing slightly from 1.297 km2 to 1.278 km2 (−1.52%). This pattern indicates weak coupling with glacier meltwater sources, with lake evolution increasingly controlled by local hydrological balance, including evaporation, seepage, and limited external inflow.
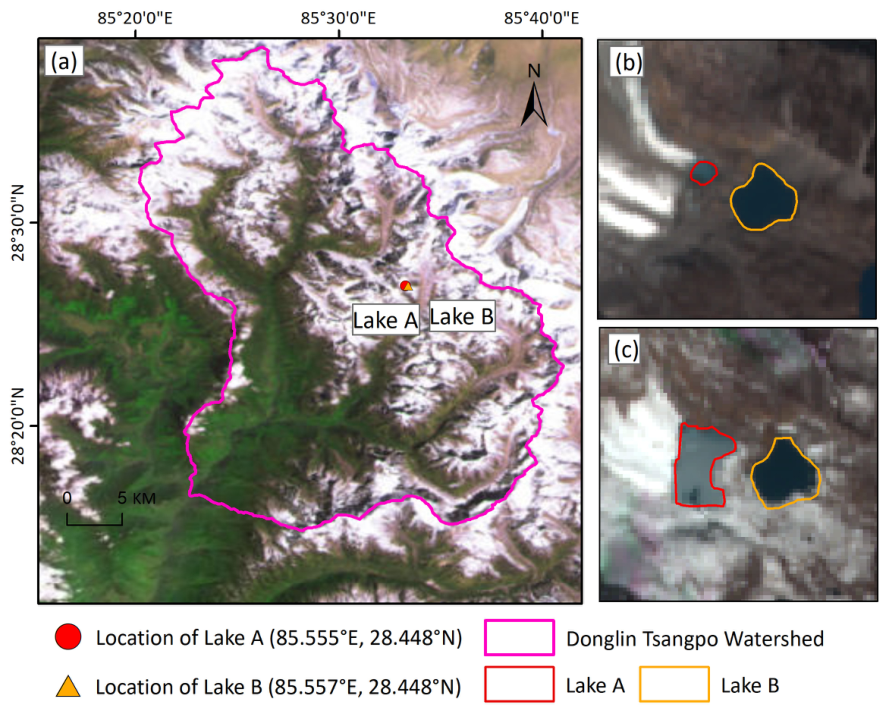
To further illustrate these contrasting evolution patterns, Figure 10 presents representative examples of a glacier-contact lake and a near-glacier-fed lake. As shown in Figure 10b,c, the glacier-contact lake (Lake A) exhibits a pronounced expansion in both areal extent and shoreline complexity over the study period, directly reflecting intensified glacier retreat and increased meltwater supply from adjacent ice masses. In comparison, the near-glacier-fed lake (Lake B) shows more moderate changes, characterized by gradual shoreline expansion driven primarily by indirect meltwater input through proglacial channels. This visual comparison provides direct observational evidence supporting the quantitative results, confirming that glacier proximity plays a fundamental role in controlling the magnitude and rate of lake expansion.
Overall, the consistency between the statistical results (Figure 9) and the spatially explicit examples (Figure 10) highlights that glacier–lake connectivity serves as a primary structural control on lake evolution. Lakes in direct or near-glacier contact are more responsive to glacier retreat and exhibit significantly higher expansion potential, whereas distal lakes are more strongly regulated by local hydrological conditions.

4.3. Climatic Controls on Glacial Lake Evolution

Glacial lake evolution in the DTW is governed by coupled climatic forcing, involving radiative energy balance, thermal conditions, and hydrological inputs, which together regulate glacier meltwater production and lake dynamics. To further interpret the observed glacial lake changes, MODIS-derived temperature, ERA5-derived radiation and hydrological variables were analyzed (Figure 11, Figure 12 and Figure 13).
1. Thermal forcing and melt efficiency
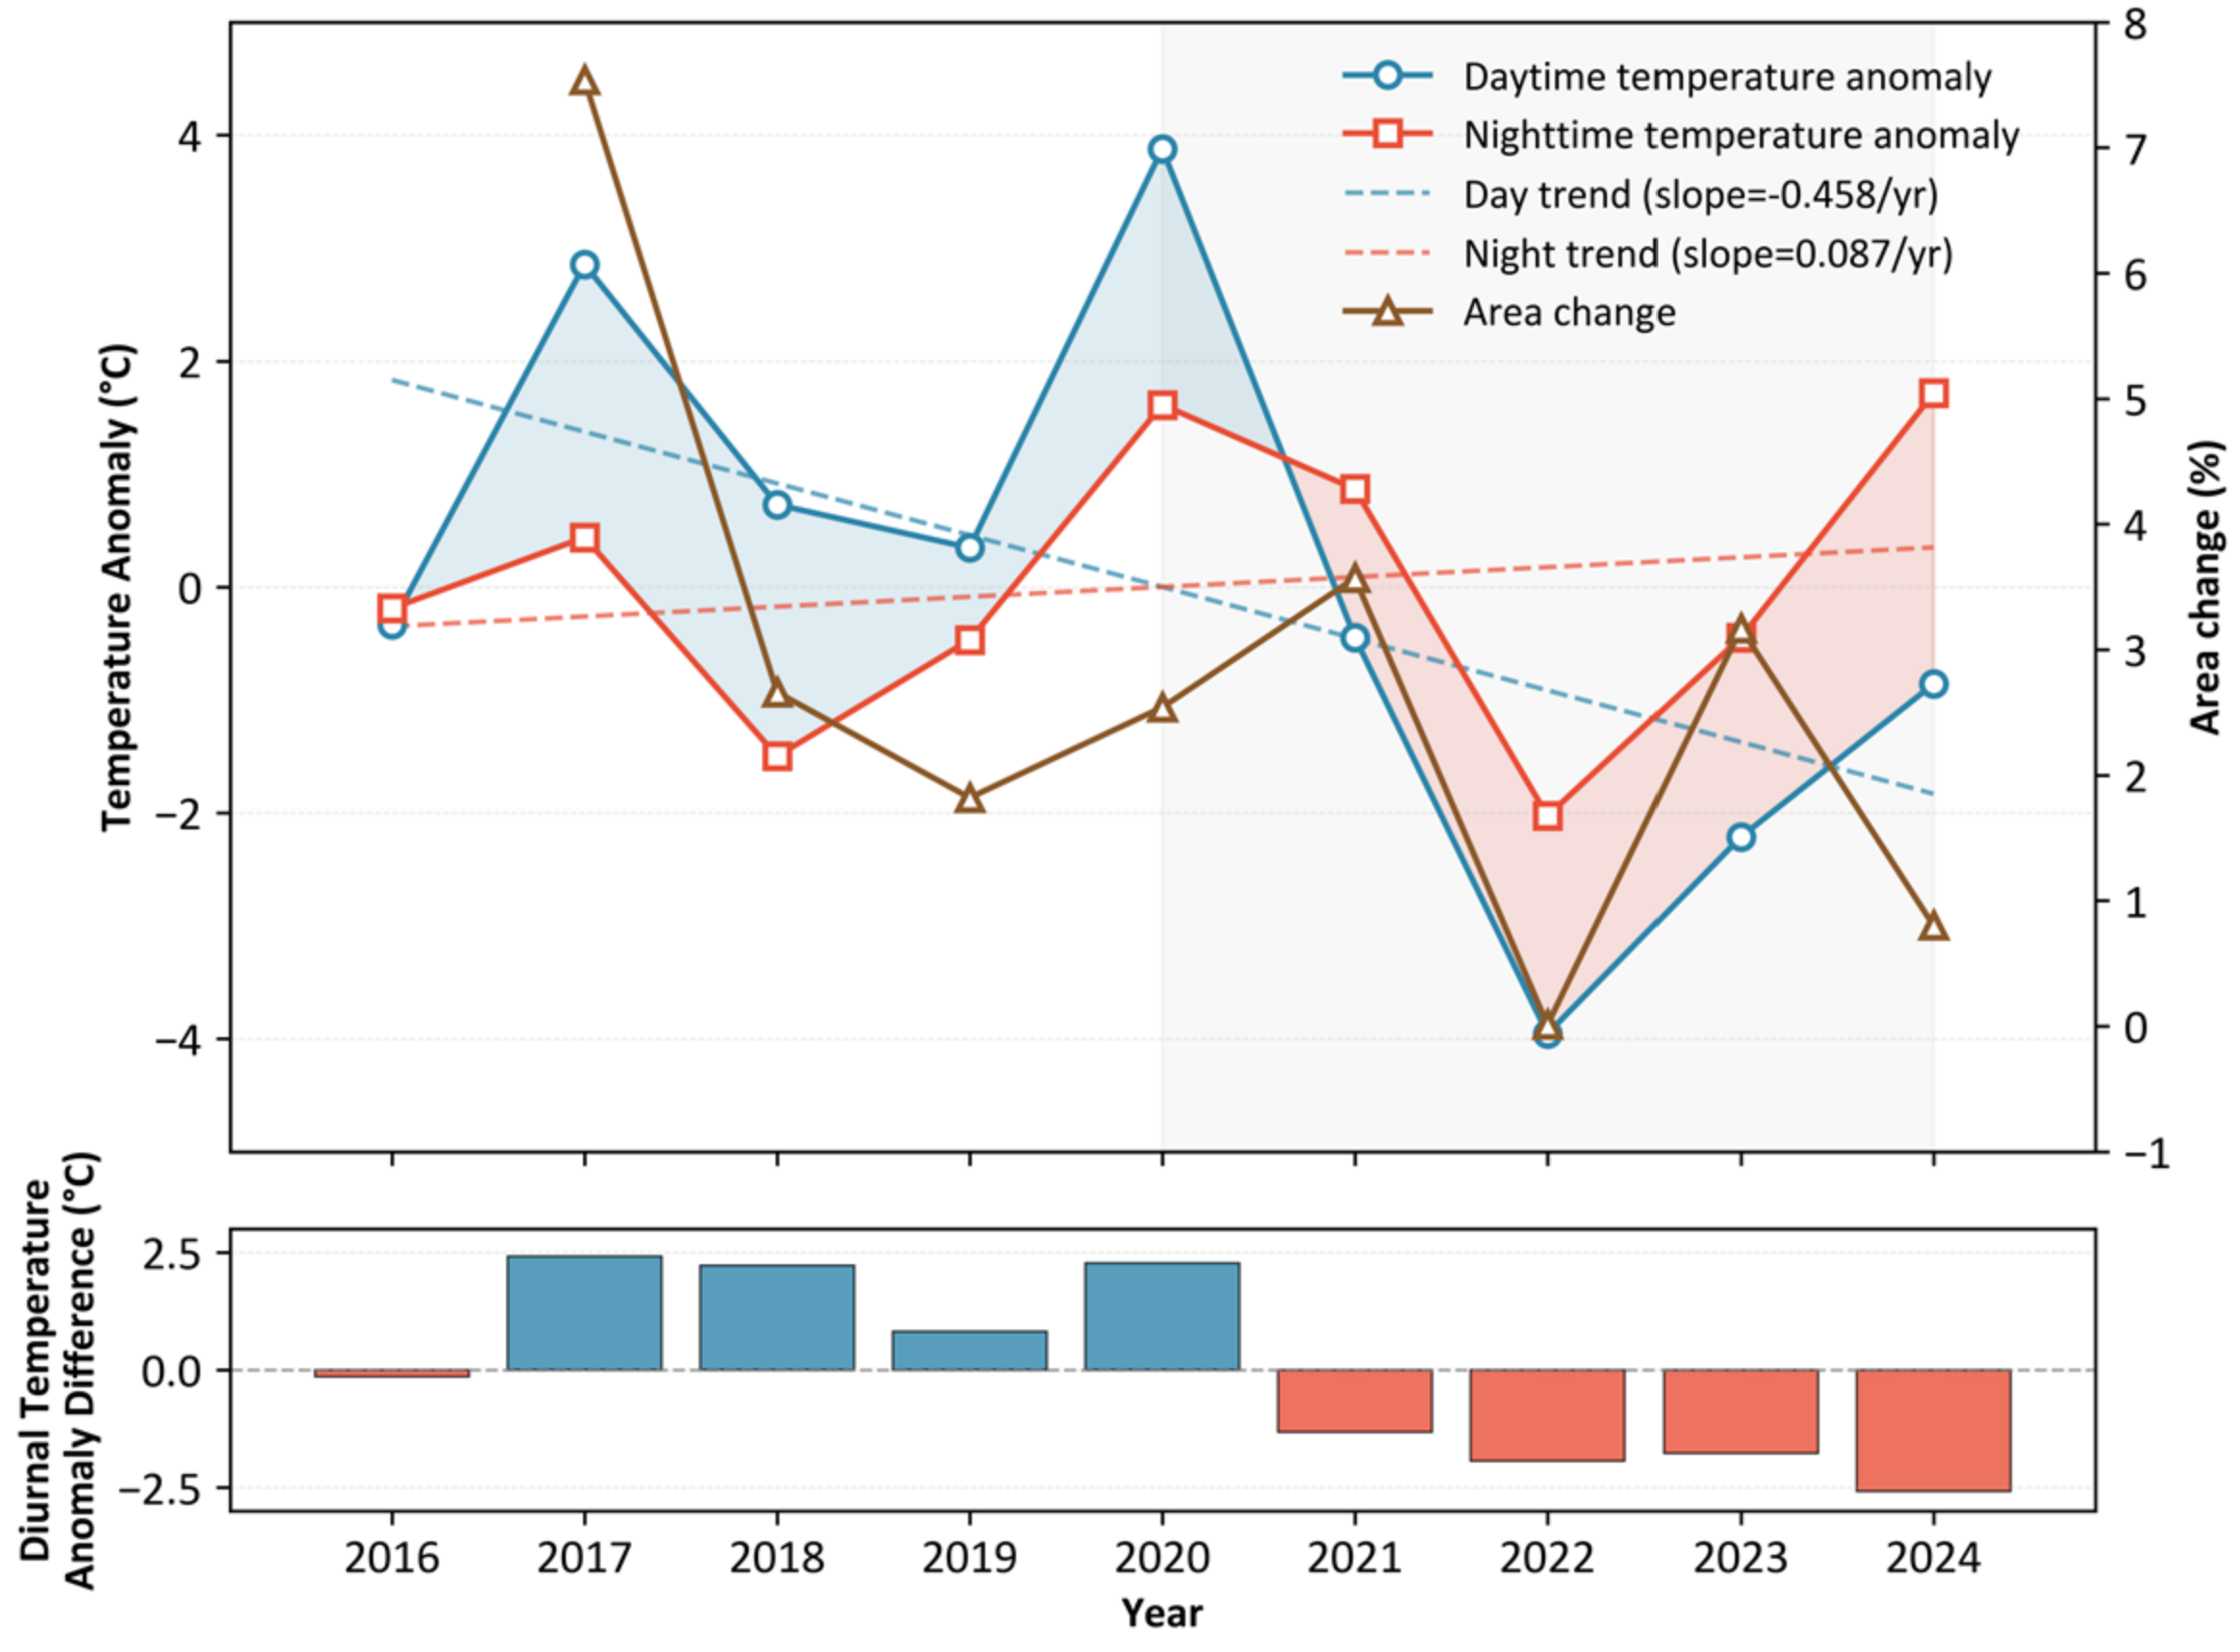
Figure 11 illustrates pronounced interannual variability in MODIS-derived daytime and nighttime land surface temperature (LST) anomalies during 2016–2024, calculated relative to the 2016–2024 mean baseline. Distinct warm phases are observed in 2017 and 2020, while a cooler period occurs during 2022–2023.
Daytime temperature anomalies primarily influence the intensity of surface melt, whereas nighttime anomalies affect the persistence of melt by modulating refreezing processes. For example, the strong warming event in 2020 (daytime +3.88 °C; nighttime +1.61 °C) likely enhanced meltwater production by both intensifying daytime melting and reducing nocturnal refreezing. Such conditions may favor a longer effective ablation period and contribute to sustained meltwater supply.
In contrast, negative temperature anomalies during 2022–2023 correspond to reduced melt conditions and are broadly consistent with the observed slowdown in glacial lake expansion.
The lower panel of Figure 11 shows the difference between daytime and nighttime temperature anomalies ( T D a y T N i g h t ), which provides additional insight into the diurnal structure of thermal forcing. Positive values indicate relatively stronger daytime warming, while negative values suggest relatively stronger nighttime warming. The tendency toward more negative values after 2021 may indicate an increasing influence of nighttime warming, which could reduce energy loss through refreezing.
Overall, these results suggest that glacier melt in the DTW is influenced not only by the magnitude of temperature anomalies, but also by their diurnal characteristics and temporal persistence.
2. Radiative forcing provides and energy balance
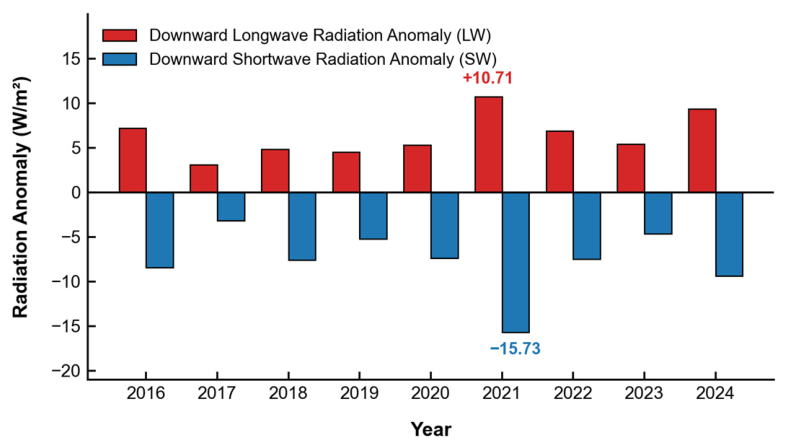
Figure 12 presents the interannual variability of shortwave (SW) and longwave (LW) radiation anomalies during 2016–2024, derived relative to the 1950–2010 climatological baseline. A consistent contrast is observed, with negative SW anomalies (mean −7.686 W m−2) and positive LW anomalies (mean +6.358 W m−2, peaking at +10.711 W m−2 in 2021).
The negative SW anomalies likely reflect reduced incoming solar radiation associated with increased cloud cover, while the positive LW anomalies indicate enhanced downward atmospheric radiation under humid and cloudy conditions. The co-occurrence of these signals suggests a cloud-influenced radiative regime in which reduced solar input may be partly offset by increased longwave radiation.
Although the net effect on glacier energy balance cannot be directly quantified here, this configuration may help sustain melt processes over extended periods, even when solar radiation is reduced. In this context, longwave radiation may play an increasingly important role in maintaining background melt energy, contributing to continued meltwater production.
3. Hydrological forcing and climate–melt decoupling
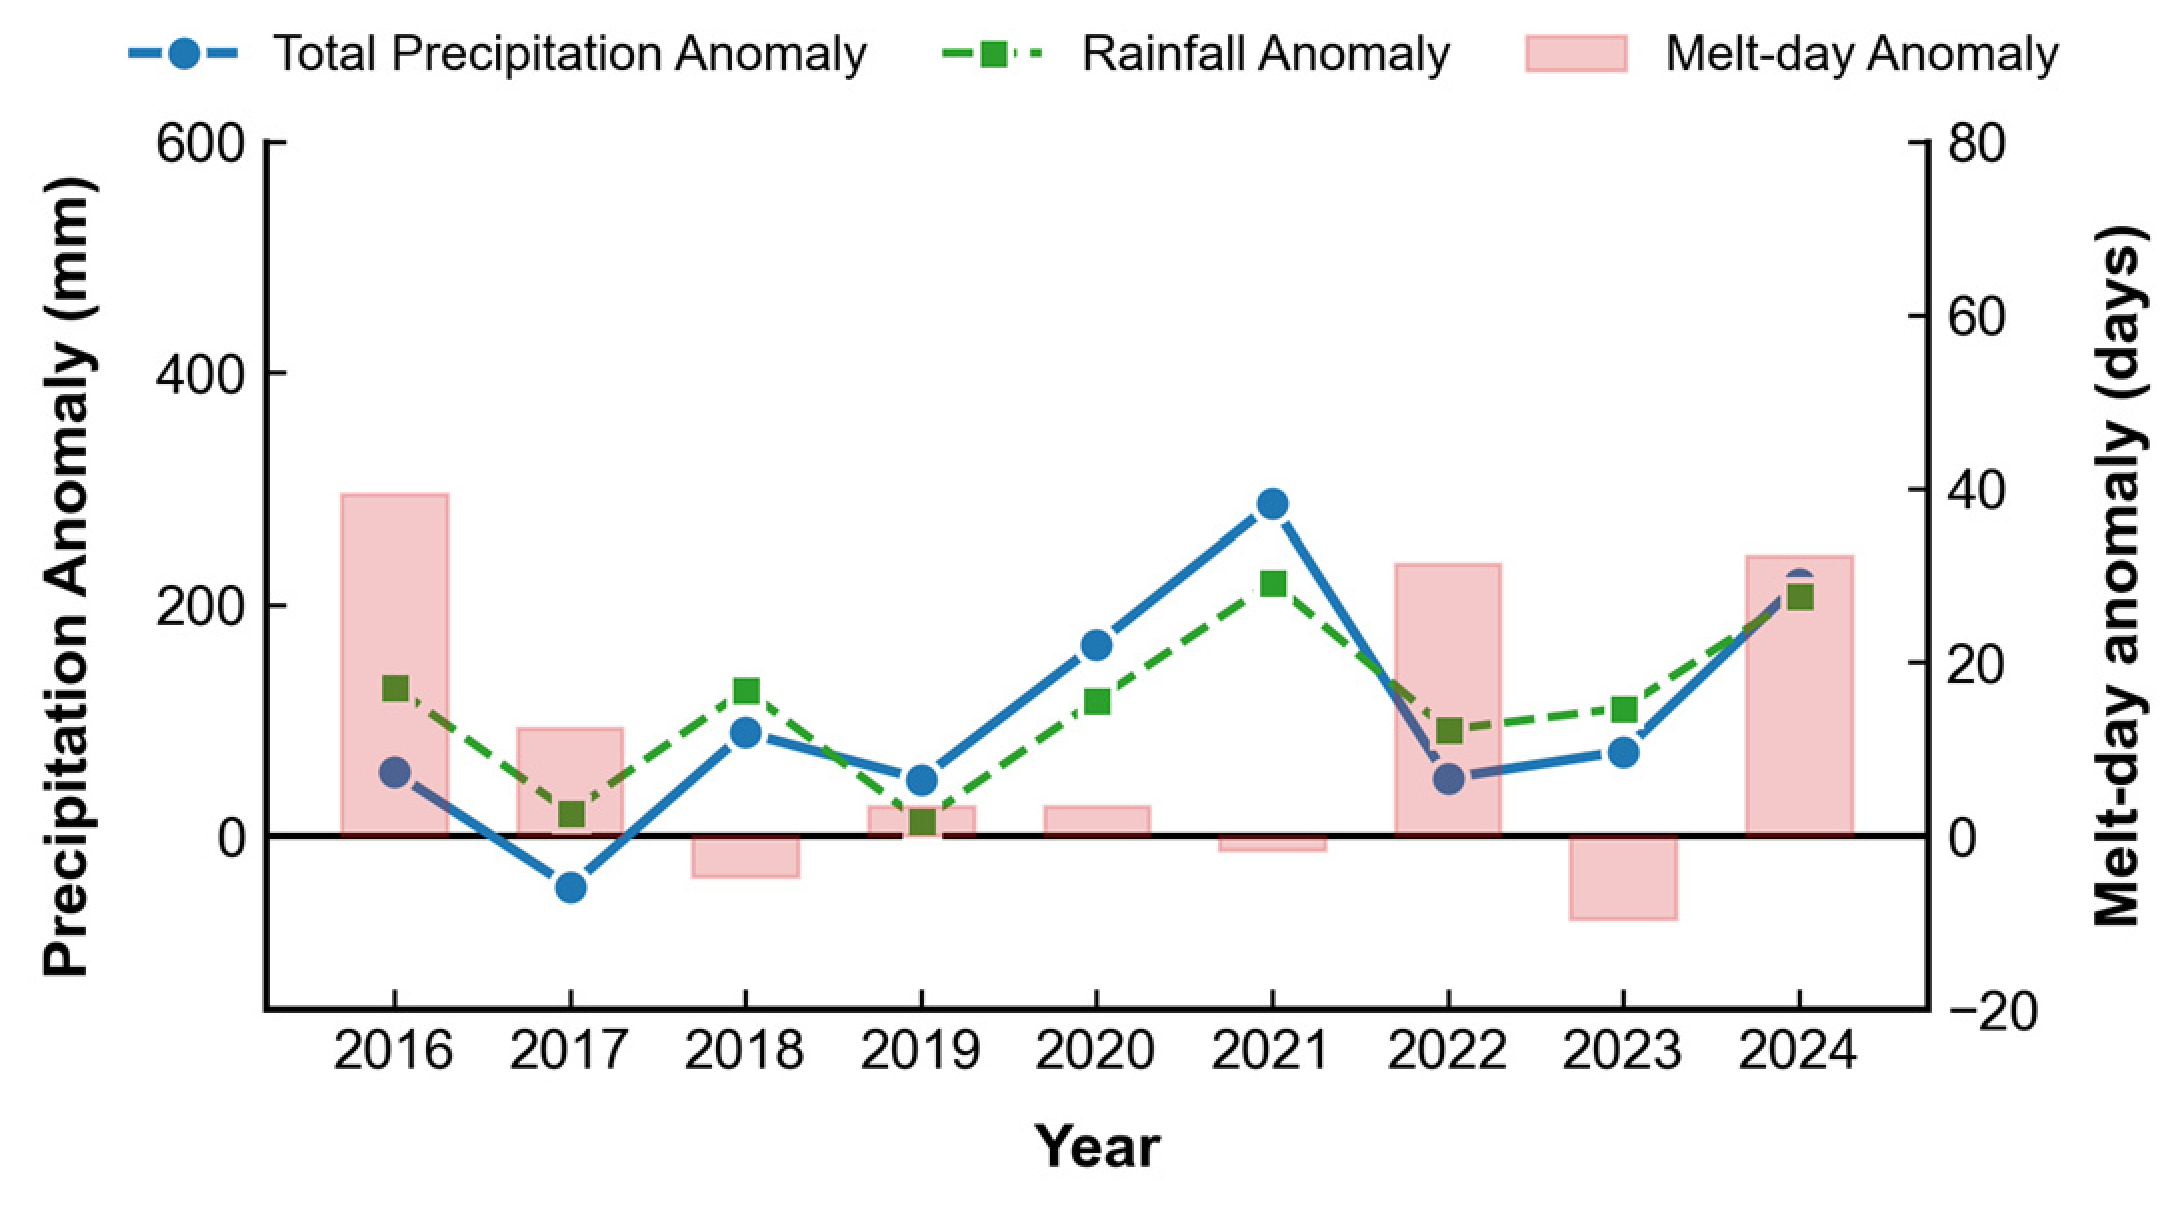
Figure 13 presents the anomalies of total precipitation (TP), liquid rainfall, and melt days derived from the ERA5-Land dataset, calculated relative to a long-term baseline (1950–2010). The results show notable interannual variability and highlight the key hydrological drivers. Notably, liquid rainfall anomalies remained consistently positive throughout the 2016–2024 period, with significant peaks observed in 2021 (+219.55 mm) and 2024 (+208.19 mm). Concurrently, melt-day anomalies reached extreme peaks in years such as 2016 (+39.36 days) and 2024 (+32.36 days), aligning with phases of accelerated glacial lake expansion.
An important observation is the increased occurrence of liquid precipitation. In some years, such as 2017, although the TP anomaly was negative (−43.95 mm), the liquid rainfall anomaly remained positive (+20.32 mm). This suggests that regional warming may have contributed to a shift in the phase of precipitation from snowfall to rainfall, resulting in a continued supply of liquid water to the lake systems. In 2021, despite a slightly negative melt-day anomaly, the surplus rainfall likely contributed to surface runoff, which could have enhanced glacier termini erosion and supported lake expansion.
These findings suggest that liquid rainfall may represent a more consistent and influential driver of glacial lake dynamics in the DTW than total precipitation alone. The interaction between persistent rainfall surplus and melt-day anomalies—whether through synchronized reinforcement or compensatory driving during melt-decoupling periods—appears to exert a complex and multifaceted influence on lake evolution.
4. Integrated climatic control on lake evolution
The observed 24.43% increase in total glacial lake area potentially reflects the complex interplay of thermal, radiative, and hydrological processes. Periods of notable lake expansion (e.g., 2017, 2020, and 2021) frequently align with positive temperature anomalies or significant liquid precipitation events. However, the varying response observed in years such as 2024—where substantial rainfall did not trigger a proportional expansion—suggests a more nuanced climate–melt relationship. This implies that while climatic forcing remains the primary driver, the resulting glacier meltwater production and lake surface growth may be modulated by non-linear feedback mechanisms or local glaciological constraints.
The year 2021 was a pivotal year characterized by the maximum liquid rainfall anomaly (+219.55 mm) and a record-high downward longwave radiation anomaly during the study period. While these hydroclimatic forcings coincided with a robust expansion of glacial lakes, the annual area growth rate in 2021 (approximately 3.5%) did not reach the historical peak observed in 2017 (approximately 7.5%), despite the latter having lower precipitation. Furthermore, a similar decoupling is evident in 2024, where a substantial rainfall surplus failed to trigger an accelerated expansion rate. These discrepancies suggest that while extreme liquid rainfall serves as a primary source of hydrological and thermal input, the resulting lake surface expansion is not linearly synchronized with precipitation magnitude. The relatively decoupled expansion rate in 2021, when compared to its record moisture input, could potentially be linked to the concurrent negative minimum in shortwave radiation, which may have constrained the contribution of direct solar-induced melting. This suggests a complex, non-linear mechanism where glacial lake response is potentially modulated by the shifting balance between liquid water supply and solar energy influx, alongside other local glaciological constraints.

4.4. Implications for GLOF Hazard Assessment and Monitoring

Although this study does not explicitly simulate glacial lake outburst flood (GLOF) processes, the observed expansion patterns of glacial lakes provide important implications for regional hazard assessment. In particular, the rapid growth of glacier-contact lakes suggests increasing water storage potential in proglacial basins, which may enhance long-term susceptibility to moraine dam instability under continued glacier retreat and permafrost degradation.
In the absence of in situ bathymetric data, lake volume was estimated using the widely applied area–volume scaling relationship (V = c A γ ) [53]. Based on empirical parameters ( c 0.15 , γ 1.3 ) for alpine glacial lakes, the total estimated water volume of the lake cluster is approximately 4.36 × 10⁵ m3, although this estimate is subject to uncertainties inherent in scaling-based approaches and potential underestimation of deep proglacial basins. Considering that many glacier-contact lakes are likely to have steep bedrock-controlled basins, actual water depths may reach several tens of meters, implying that the true water storage could be higher than the current estimate suggests.
Statistical analysis reveals a highly skewed distribution of lake volumes, where the largest lake alone contributes approximately 15% of total storage (0.65 × 10⁵ m3). The mean volume (0.08 × 10⁵ m3) is substantially higher than the median (0.03 × 10⁵ m3), indicating that regional water storage and potential hazard are concentrated in a limited quantity of relatively large lakes, while most lakes remain small.
From a hazard perspective, although the total estimated water volume is moderate compared with major GLOF-prone basins in High Mountain Asia, flood magnitude cannot be inferred from volume alone. The DTW is characterized by extreme topographic relief, large elevation differences between lake basins and downstream valleys, and steep valley gradients. These conditions strongly enhance gravitational potential energy conversion during breach events, leading to rapid flow acceleration.
Such terrain amplification effects imply that even lakes with moderate water volume may generate high-magnitude downstream impacts. Once dam failure occurs, the large head difference between high-elevation lakes and deeply incised valleys can produce strong hydraulic gradients, promoting rapid discharge acceleration, enhanced erosion, and significant sediment entrainment. As a result, the dynamic impact of a potential outburst flood may be substantially greater than what volume-based estimates alone would suggest.
Given these combined factors, the clustering of rapidly expanding glacier-contact lakes in upper catchments highlights an evolving and spatially heterogeneous hazard landscape. These lakes, due to their direct glacier connectivity and favorable topographic setting for rapid drainage, should be prioritized in future monitoring and early warning systems.
The updated glacial lake inventory developed in this study provides a baseline for future GLOF hazard assessment and process-based flood modeling. Future work could benefit from integrating optical and SAR remote sensing to improve detection under cloud cover and to monitor potential deformation signals associated with moraine dam instability, as well as coupling remotely sensed lake dynamics with physically based dam breach and flood routing models.

4.5. Limitations, Data Uncertainty, and Future Research Directions

Several sources of uncertainty should be considered when interpreting the results of this study, arising from both observational constraints and the subsequent process-based analysis.
First, uncertainties are primarily associated with the remote sensing-based lake mapping. Although Sentinel-2 imagery provides relatively high spatial resolution (10 m) suitable for regional-scale analysis, it imposes inherent limitations on the detection of very small glacial lakes. The minimum mapping threshold of 0.02 km2 inevitably excludes smaller or short-lived water bodies and may introduce boundary uncertainties due to mixed pixels along lake margins. These effects are particularly relevant in steep and shadowed terrain, where spectral confusion between water, ice, and terrain shadow can occur. While manual refinement reduces misclassification, some degree of omission and geometric uncertainty remains unavoidable.
Second, the reliance on optical imagery constrains observations under persistent cloud cover and seasonal snow conditions, potentially resulting in temporal gaps or inconsistencies in lake detection. Although a post-monsoon image selection strategy was adopted to minimize these effects, interannual differences in data availability may still influence the completeness of the lake inventory.
Third, uncertainties also arise from the use of multi-source climatic datasets. MODIS LST and ERA5 reanalysis data differ in both spatial resolution and physical representation, with LST reflecting surface thermal conditions and ERA5 representing near-surface atmospheric states. In addition, ERA5-derived precipitation, radiation, and melt-day indicators are provided at relatively coarse spatial resolution and may not fully resolve localized orographic effects and complex energy balance processes in high-mountain environments. The use of different climatological baselines (short-term internal baseline for LST and long-term baseline for ERA5) further introduces methodological inconsistencies, although this approach is intended to distinguish relative variability from long-term climatic anomalies.
Finally, the climatic analysis presented here represents a simplified interpretation of glacier–climate interactions. Key processes such as glacier mass balance, subsurface hydrology, debris cover effects, and detailed surface energy flux partitioning are not explicitly resolved. In particular, the inferred roles of radiative compensation and precipitation–melt decoupling are based on indirect indicators and should be interpreted as indicative rather than fully quantified mechanisms.
Furthermore, glacier–lake interactions involve additional processes that are not explicitly represented in this study, including glacier mass balance, subsurface hydrology, ice dynamics, and detailed surface energy flux partitioning. These processes may influence meltwater production and lake evolution, and their effects are implicitly reflected rather than explicitly quantified in the present analysis.
Future research could help to reduce these uncertainties through improvements in both observational capability and process representation. On the observational side, the integration of higher-resolution optical imagery and synthetic aperture radar (SAR) data may improve the detection of small and short-lived glacial lakes, particularly under cloud-affected conditions. The use of higher-resolution DEMs and, where available, targeted in situ observations (e.g., lake bathymetry and dam characteristics) could further improve the characterization of lake geometry and surrounding terrain.
On the process side, coupling remote sensing observations with glacier mass balance models and physically based energy balance or hydrological models may provide a more explicit representation of glacier–lake interactions. Such approaches could help to better constrain the relative roles of radiative forcing, thermal conditions, and hydrological inputs in influencing meltwater production and lake evolution.
Overall, these developments would contribute to a more robust and process-consistent framework for monitoring glacial lake dynamics and may support more reliable hazard assessments in data-sparse, high-mountain environments.

5. Conclusions

By integrating multi-source datasets, including Sentinel-2 imagery, MODIS land surface temperature (LST), and ERA5-Land reanalysis data, this study presents a high-resolution assessment of glacial lake evolution in the Donglin Tsangpo Watershed (DTW), a key transboundary region of the China–Nepal Economic Corridor, during 2016–2024.
The results reveal a rapid and systematic expansion of glacial lakes, with the total number increasing from 43 to 56 and the total area expanding by 24.16% (from 3.97 km2 to 4.94 km2), indicating a pronounced cryospheric response to recent climate warming. This expansion is primarily driven by the rapid emergence of small glacial lakes (0.02–0.05 km2) and a clear upward shift in elevation distribution, with new lakes forming above 5300 m and extending to elevations exceeding 5500 m, reflecting intensified glacier retreat at higher elevations.
In addition to these spatial trends, the evolution of glacial lakes is modulated by glacier–lake connectivity. Glacier-contact lakes exhibited the most pronounced expansion, followed by near- and far-glacier-fed lakes, highlighting the critical role of meltwater supply pathways in regulating lake growth.
Climatic analysis indicates that lake expansion broadly coincided with periods of positive thermal anomalies, including the pronounced warming event in 2020 (daytime +3.88 °C; nighttime +1.61 °C), which likely contributed to enhanced melt intensity and a longer effective ablation period. ERA5-Land data further suggest that persistent positive longwave radiation anomalies may have partly offset reductions in shortwave radiation, reflecting a cloud-influenced radiative regime that could reduce nocturnal energy loss.
In combination with variations in precipitation input and melt-day conditions, these radiative–thermal–hydrological factors appear to have jointly influenced glacier mass loss and meltwater availability, thereby contributing to the observed patterns of glacial lake expansion.
From a hazard perspective, the transition toward rapid lake expansion indicates a potential increase in downstream exposure in this high-relief environment. Although the estimated total lake volume remains moderate compared to major GLOF-prone basins in High Mountain Asia, steep topographic gradients and confined valley morphology may substantially amplify flow energy and impact during potential outburst events.
Overall, glacial lake evolution in the DTW can be interpreted as a coupled response to radiative, thermal, hydrological, and glaciological processes, rather than temperature alone. The consistency between observed spatial patterns and climatic variability supports a physically grounded interpretation of glacier–lake interactions. The dataset and analytical framework developed in this study provide a useful basis for transboundary environmental monitoring, hydrodynamic modeling, and GLOF risk assessment in rapidly changing high-mountain regions.


Author Contributions

Conceptualization, Z.C.; methodology, Z.C.; software, Z.C. and C.C.; validation, C.C.; formal analysis, Z.C.; investigation, Z.C.; resources, C.C.; data curation, C.C.; writing—original draft preparation, Z.C.; writing—review and editing, D.X.; visualization, Y.J.; supervision, Z.C.; project administration, Z.C.; funding acquisition, Z.C. and D.X. All authors have read and agreed to the published version of the manuscript.

Funding

This work was supported by the Fundamental Research Funds for the Central Public Welfare Research Institutes (NO. CKSF2025727/KJ and NO.CKSF2026391/KJ).

Data Availability Statement

All the experimental data can be downloaded online. The glacier inventory data for Nepal are available at the National Cryosphere Desert Data Center (http://www.ncdc.ac.cn) under the DOI: https://www.doi.org/10.12072/ncdc.Westdc.db0024.2021. The glacier inventory data for the Chinese territory were obtained from the Second Chinese Glacier Inventory (CGI-2). Detailed methodologies and dataset characteristics are documented in Guo et al. (2015) [35] (https://doi.org/10.3189/2015JoG14J209). The raw data can be accessed through the National Tibetan Plateau/Third Pole Environment Data Center. The glacial lake inventory of High Mountain Asia (HMA) was provided by the National Cryosphere Desert Data Center (http://www.ncdc.ac.cn). The dataset is identified by the permanent digital identifier https://www.doi.org/10.12072/casnw.064.2019.db. Spatial data for villages, the China–Nepal railway, national boundaries, and rivers were obtained from OpenStreetMap.

Conflicts of Interest

The authors declare that they have no conflicts of interest.

References

  1. Zhang, G.; Yao, T.; Xie, H.; Wang, W.; Yang, W. An inventory of glacial lakes in the Third Pole region and their changes in response to global warming. Glob. Planet. Change 2015, 131, 148–157. [Google Scholar] [CrossRef]
  2. Shugar, D.H.; Burr, A.; Haritashya, U.K.; Kargel, J.S.; Watson, C.S.; Kennedy, M.C.; Bevington, A.R.; Betts, R.A.; Harrison, S.; Strattman, K. Rapid worldwide growth of glacial lakes since 1990. Nat. Clim. Change 2020, 10, 939–945. [Google Scholar] [CrossRef]
  3. Yang, M.; Ge, Y.; Zhang, J.; Li, F.; Su, L.; Qin, D. Spaciotemporal distribution characteristics of glacial lakes and the factors influencing the Southeast Tibetan Plateau from 1993 to 2023. Sci. Rep. 2025, 15, 1966. [Google Scholar] [CrossRef]
  4. Minowa, M.; Schaefer, M.; Skvarca, P. Effects of topography on dynamics and mass loss of lake-terminating glaciers in southern Patagonia. J. Glaciol. 2023, 69, 1580–1597. [Google Scholar] [CrossRef]
  5. Wang, X.; Siegert, F.; Zhou, A.G.; Franke, J. Glacier and glacial lake changes and their relationship in the context of climate change, Central Tibetan Plateau 1972–2010. Glob. Planet. Change 2013, 111, 246–257. [Google Scholar] [CrossRef]
  6. Khadka, N.; Chen, X.; Sharma, S.; Xue, D.; Rahaman, M.M. Climate change and its impacts on glaciers and glacial lakes in Nepal Himalayas. Reg. Environ. Change 2023, 23, 143. [Google Scholar] [CrossRef]
  7. Carrivick, J.L.; Tweed, F.S. Proglacial lakes: Character, behaviour and geological importance. Quat. Sci. Rev. 2013, 78, 34–52. [Google Scholar] [CrossRef]
  8. Hugonnet, R.; McNabb, R.; Berthier, E.; Menounos, B.; Nuth, C.; Eckert, N.; Farinotti, D.; Huss, M.; Denzinger, I.; Voigt, L.; et al. Accelerated global glacier mass loss in the early twenty-first century. Nature 2021, 592, 726–731. [Google Scholar] [CrossRef]
  9. Immerzeel, W.W.; Lutz, A.F.; Andrade, M.; Bahl, A.; Biemans, H.; Bolch, T.; Hyde, S.; Brumby, S.; Davies, B.J.; Elmore, A.C.; et al. Importance and vulnerability of the world’s water towers. Nature 2020, 577, 364–369. [Google Scholar] [CrossRef]
  10. Brun, F.; Berthier, E.; Wagnon, P.; Kääb, A.; Treichler, D. A spatially resolved estimate of High Mountain Asia glacier mass balances from 2000 to 2016. Nat. Geosci. 2017, 10, 668–673. [Google Scholar] [CrossRef]
  11. Zhang, M.; Chen, F.; Zhao, H.; Wang, J.; Wang, N. Recent changes of glacial lakes in the High Mountain Asia and its potential controlling factors analysis. Remote Sens. 2021, 13, 3757. [Google Scholar] [CrossRef]
  12. Viani, C.; Machguth, H.; Huggel, C.; Godio, A.; Franco, D.; Perotti, L.; Giardino, M. Potential future lakes from continued glacier shrinkage in the Aosta Valley Region (Western Alps, Italy). Geomorphology 2020, 355, 107068. [Google Scholar] [CrossRef]
  13. Zhang, T.; Wang, W.; An, B.; Wang, Y.; Yao, T. Ice thickness and morphological analysis reveal the future glacial lake distribution and formation probability in the Tibetan Plateau and its surroundings. Glob. Planet. Change 2022, 216, 103923. [Google Scholar] [CrossRef]
  14. Yang, K.; Hou, J.; Wang, J.; He, Y.; Gao, Y.; Wang, M. A new finding on the prevalence of rapid water warming during lake ice melting on the Tibetan Plateau. Sci. Bull. 2021, 66, 2358–2361. [Google Scholar] [CrossRef]
  15. Zhang, T.; Wang, W.; An, B. Heterogeneous changes in global glacial lakes under coupled climate warming and glacier thinning. Commun. Earth Environ. 2024, 5, 374. [Google Scholar] [CrossRef]
  16. Mountain Research Initiative EDW Working Group. Elevation-dependent warming in mountain regions of the world. Nat. Clim. Change 2015, 5, 424–430. [Google Scholar] [CrossRef]
  17. Nie, Y.; Sheng, Y.; Liu, Q.; Liu, L.; Gao, J.; Dadson, S.; Zhang, Y. A regional-scale assessment of Himalayan glacial lake changes using satellite observations from 1990 to 2015. Remote Sens. Environ. 2017, 189, 1–13. [Google Scholar] [CrossRef]
  18. Mohanty, L.; Maiti, S.; Dixit, A. Spatio-temporal assessment of regional scale evolution and distribution of glacial lakes in Himalaya. Front. Earth Sci. 2023, 10, 1038777. [Google Scholar] [CrossRef]
  19. Harrison, S.; Kargel, J.S.; Huggel, C.; Reynolds, J.; Shugar, D.H.; Betts, R.A.; Emmer, A.; Glasser, N.; Haritashya, U.K.; Klimeš, J.; et al. Climate change and the global pattern of moraine-dammed glacial lake outburst floods. Cryosphere 2018, 12, 1195–1209. [Google Scholar] [CrossRef]
  20. Zhang, G.; Yao, T.; Xie, H.; Yang, K.; Zhu, L.; Shum, C.K.; Bolch, T.; Yi, S.; Allen, S.; Jiang, L.; et al. Response of Tibetan Plateau lakes to climate change: Trends, patterns, and mechanisms. Earth-Sci. Rev. 2020, 208, 103269. [Google Scholar] [CrossRef]
  21. Yao, T.; Thompson, L.; Chen, D.; Piao, S.; Wang, Y. Third Pole climate warming and cryosphere system changes. WMO Bull. 2020, 69, 38–44. [Google Scholar]
  22. Jiang, S.; Nie, Y.; Liu, Q.; Wang, J.; Liu, L.; Hassan, J.; Tan, J.; Xu, X. Glacier change, supraglacial debris expansion and glacial lake evolution in the Gyirong River Basin, Central Himalayas, between 1988 and 2015. Remote Sens. 2018, 10, 986. [Google Scholar] [CrossRef]
  23. Dou, X.; Fan, X.; Wang, X.; Yan, W.; Nie, Y. Spatio-temporal evolution of glacial lakes in the Tibetan Plateau over the past 30 years. Remote Sens. 2023, 15, 416. [Google Scholar] [CrossRef]
  24. Li, X.; Zhang, H.; Mu, J.; Song, W.; Yang, Y.; Chai, F.; Linghu, S.; Fang, H. Remote sensing analysis of the 2025 glacial lake outburst flood event at the China-Nepal Gyirong Port. China Flood Drought Manag. 2025, 35, 58–64. (In Chinese) [Google Scholar] [CrossRef]
  25. Wang, X.; Ding, Y.; Liu, S.; Lu, A.; Guo, Z. Changes of glacial lakes and implications in Tian Shan, Central Asia, based on remote sensing data from 1990 to 2010. Environ. Res. Lett. 2013, 8, 044052. [Google Scholar] [CrossRef]
  26. Khanal, N.R.; Hu, J.M.; Mool, P. Glacial lake outburst flood risk in the Poiqu/Bhote Koshi/Sun Koshi River Basin in the Central Himalayas. Mt. Res. Dev. 2015, 35, 351–364. [Google Scholar] [CrossRef]
  27. Zhang, S.; Nie, Y.; Zhang, H. Glacial lake changes and risk assessment in Rongxer watershed of China–Nepal economic corridor. Remote Sens. 2024, 16, 725. [Google Scholar] [CrossRef]
  28. Peng, M.; Zhang, G.; Yu, J.; Wang, W.; Xu, F.; Rinzin, S. Potential threats of glacial lake changes to the Sichuan–Tibet Railway. J. Glaciol. 2024, 70, e76. [Google Scholar] [CrossRef]
  29. Shrestha, A.B.; Eriksson, M.; Mool, P.; Ghimire, P.; Pant, B.; Bajracharya, B. Glacial lake outburst flood risk assessment of Sun Koshi basin, Nepal. Geomat. Nat. Hazards Risk 2010, 1, 157–169. [Google Scholar] [CrossRef]
  30. Bhatt, D.; Maskey, S.; Babel, M.S.; Uhlenbrook, S.; Prasad, K.C. Climate trends and impacts on crop production in the Koshi River basin of Nepal. Reg. Environ. Change 2014, 14, 1291–1301. [Google Scholar] [CrossRef]
  31. Ding, Z.; Hu, H.; Cadotte, M.W.; Liu, J.; Hu, Y.; Zhao, C.; Si, X.; Chen, C.; Jiang, J.P.; Liang, J.; et al. Elevational patterns of bird functional and phylogenetic structure in the central Himalaya. Ecography 2021, 44, 1403–1417. [Google Scholar] [CrossRef]
  32. Jin, H.; Zhao, S.; Ding, Z.; Yang, Y.; Song, G.; Huang, S.; Liu, R.; Zhou, S.; Yang, L.; Zhou, Y. Seasonal elevational migration shapes temperate bird community in the Gyirong Valley, Central Himalayas. Biology 2026, 15, 138. [Google Scholar] [CrossRef] [PubMed]
  33. Peng, S. 1-km Monthly Precipitation Dataset for China (1901–2023); National Tibetan Plateau/Third Pole Environment Data Center: Beijing, China, 2020. [Google Scholar] [CrossRef]
  34. Liu, S.; Guo, W.; Xu, J. The Second Glacier Inventory Dataset of China (Version 1.0) (2006–2011); National Tibetan Plateau/Third Pole Environment Data Center: Beijing, China, 2012. [Google Scholar] [CrossRef]
  35. Guo, W.Q.; Liu, S.Y.; Xu, J.L.; Wu, L.Z.; Shangguan, D.H.; Yao, X.J.; Wei, J.F.; Bao, W.J.; Yu, P.C.; Liu, Q.; et al. The second Chinese glacier inventory: Data, methods and results. J. Glaciol. 2015, 61, 357–372. [Google Scholar] [CrossRef]
  36. Wu, L.Z. Glacial Catalogue Data Set of Nepal; National Cryosphere Desert Data Center: Lanzhou, China, 2021. [Google Scholar] [CrossRef]
  37. Wang, X.; Guo, X.Y.; Yang, C.D.; Liu, Q.H.; Wei, J.F.; Zhang, Y.; Liu, S.Y.; Zhang, Y.L.; Jiang, Z.L.; Tang, Z.G. Glacial Lake Inventory of High-Mountain Asia; National Cryosphere Desert Data Center: Lanzhou, China, 2021. [Google Scholar] [CrossRef]
  38. Ghannadi, M.A.; Alebooye, S.; Izadi, M.; Alizadeh, M. Vertical accuracy assessment of Copernicus DEM (case study: Tehran and Jam cities). ISPRS Ann. Photogramm. Remote Sens. Spat. Inf. Sci. 2023, 10, 209–214. [Google Scholar] [CrossRef]
  39. Dou, X.; Chen, Y.; Bao, A.; Li, W. Trends and spatial variations of rain-on-snow events over High Mountain Asia. J. Hydrol. 2022, 614, 128593. [Google Scholar] [CrossRef]
  40. Li, Y.; Sun, F.; Chen, Y.; Li, W.; Liu, S.Y. Unraveling the complexities of rain-on-snow events in High Mountain Asia. npj Clim. Atmos. Sci. 2025, 8, 118. [Google Scholar] [CrossRef]
  41. Wang, X.; Guo, X.Y.; Yang, C.D.; Liu, Q.H.; Wei, J.F.; Zhang, Y.; Liu, S.Y.; Zhang, Y.L.; Jiang, Z.L.; Tang, Z.G. Glacial lake inventory of high-mountain Asia in 1990 and 2018 derived from Landsat images. Earth Syst. Sci. Data 2020, 12, 2169–2182. [Google Scholar] [CrossRef]
  42. Fujita, K.; Sakai, A.; Nuimura, T.; Yamaguchi, S.; Sharma, R.R. Recent changes in Imja Glacial Lake and its damming moraine in the Nepal Himalaya revealed by in situ surveys and multi-temporal ASTER imagery. Environ. Res. Lett. 2009, 4, 045205. [Google Scholar] [CrossRef]
  43. Li, J.; Sheng, Y. An automated scheme for glacial lake dynamics mapping using Landsat imagery and digital elevation models: A case study in the Himalayas. Int. J. Remote Sens. 2012, 33, 5194–5213. [Google Scholar] [CrossRef]
  44. Chhetri, P.K.; Li, Y.; Gharehchahi, S.; Yao, X.J.; Liu, S.Y. Monitoring Glacial Lake Formation and GLOF Hazard in Kanchenjunga Conservation Area of Nepal (2010–2023). Phys. Chem. Earth Parts A/B/C 2025, 141, 104178. [Google Scholar] [CrossRef]
  45. Hansen, J.; Ruedy, R.; Sato, M.; Lo, K. Global surface temperature change. Rev. Geophys. 2010, 48, RG4004. [Google Scholar] [CrossRef]
  46. Silverman, B.W. Density Estimation for Statistics and Data Analysis; CRC Press: London, UK, 1986. [Google Scholar] [CrossRef]
  47. Hock, R. Temperature index melt modelling in mountain areas. J. Hydrol. 2003, 282, 104–115. [Google Scholar] [CrossRef]
  48. Hersbach, H.; Bell, B.; Berrisford, P.; Hirahara, S.; Horányi, A.; Muñoz-Sabater, J.; Nicolas, J.; Peubey, C.; Radu, R.; Schepers, D.; et al. The ERA5 global reanalysis. Q. J. R. Meteorol. Soc. 2020, 146, 1999–2049. [Google Scholar] [CrossRef]
  49. Olofsson, P.; Foody, G.M.; Herold, M.; Stehman, S.V.; Olsson, H.; Woodcock, C.E. Good practices for estimating area and assessing accuracy of land change. Remote Sens. Environ. 2014, 148, 42–57. [Google Scholar] [CrossRef]
  50. Huggel, C.; Kääb, A.; Haeberli, W.; Itten, K.I. Remote sensing based assessment of hazards from glacier lake outbursts: A case study in the Swiss Alps. Can. Geotech. J. 2002, 39, 316–330. [Google Scholar] [CrossRef]
  51. Salerno, F.; Thakuri, S.; D’Agata, C.; Smiraglia, C.; Tartari, G.; Viviano, G. Glacial lake distribution in the Mount Everest region: Uncertainty of measurement and conditions of formation. Glob. Planet. Change 2012, 92, 30–39. [Google Scholar] [CrossRef]
  52. Zhang, G.; Bolch, T.; Allen, S.; Linsbauer, A.; Chen, F.; Wang, W. Glacial lake evolution and glacier–lake interactions in the Poiqu River basin, central Himalaya, 1964–2017. J. Glaciol. 2019, 65, 347–365. [Google Scholar] [CrossRef]
  53. Cook, S.J.; Quincey, D.J. Estimating the volume of Alpine glacier lakes. Earth Surf. Dynam. Discuss. 2015, 3, 559–575. [Google Scholar] [CrossRef]
Figure 2. Workflow of glacial lake extraction and evolution assessment.
Remotesensing 18 01445 g002
Figure 3. Changes in glacial lake quantities and total area from 2016 to 2024: (a) the number in glacial lake quantities and total area; (b) the change in glacial lake quantities and total area.
Remotesensing 18 01445 g003
Figure 4. Spatiotemporal evolution of a representative glacial lake from 2016 to 2024: (a) location; (bj) annual changes from 2016 to 2024.
Remotesensing 18 01445 g004
Figure 5. Quantities and area of glacial lakes by size class from 2016 to 2024: (a) lake quantities; (b) total area. Colors denote size classes, and concentric rings represent years (2016–2024, inner to outer).
Remotesensing 18 01445 g005
Figure 6. Quantities and area of glacial lakes by elevation from 2016 to 2024: (a) lake quantity; (b) total area. Colors denote elevation bands, and concentric rings represent years (2016–2024, inner to outer).
Remotesensing 18 01445 g006
Figure 7. Area change rates of glacial lakes by elevation band.
Remotesensing 18 01445 g007
Figure 8. Area change rates of glacial lakes at different elevations in 2024 compared to 2016.
Remotesensing 18 01445 g008
Figure 9. Quantities, area, and changes of glacial lakes by type. (a) Temporal changes in quantity and area between 2016 and 2024. (b) Comparison of area and area expansion rates between glacier-contact lakes, near-glacier-fed lakes, and far-glacier-fed lakes.
Remotesensing 18 01445 g009
Figure 10. Comparison of changes in two representative glacial lakes: (a) location of the two lakes in the DTW; (b) and (c) lake extents in 2016 and 2024 for each respective lake.
Remotesensing 18 01445 g010
Figure 11. Interannual variations in daytime and nighttime surface temperature anomalies from 2016 to 2024.
Remotesensing 18 01445 g011
Figure 12. Interannual variations in downward shortwave (SW) and longwave (LW) radiation anomalies from 2016 to 2024.
Remotesensing 18 01445 g012
Figure 13. Interannual variations in precipitation and melt-day anomalies from 2016 to 2024.
Remotesensing 18 01445 g013
Table 1. Quantities of different scales of glacial lakes from 2016–2024 (surveyed every five years).
Area (km2)Quantity
201620202024
0.02–0.05202329
0.05–0.20182020
0.20–0.50466
0.50–1.00111
Table 2. Quantities and area of different elevations of glacial lakes in 2016 and 2024.
ElevationQuantityArea (km2)
2016202420162024
<4500450.141.29
4500–4700440.550.31
4700–4900350.330.81
4900–510011131.460.65
5100–530020251.411.77
5300–5500130.070.08
>5500010.000.02
Table 3. Quantities, area, and change rates of different types of glacial lakes in 2016 and 2024.
Quantity Area (km2)
20162024Change20162024Change
Glacier-contact lakes132290.971.550.58
Near-glacier-fed lakes202221.722.110.39
Far-glacier-fed lakes101221.301.28−0.02
Disclaimer/Publisher’s Note: The statements, opinions and data contained in all publications are solely those of the individual author(s) and contributor(s) and not of MDPI and/or the editor(s). MDPI and/or the editor(s) disclaim responsibility for any injury to people or property resulting from any ideas, methods, instructions or products referred to in the content.