1. Introduction
Humanity’s capacity to manage water resources in the twenty-first century depends on our ability to observe the water cycle across the full range of spatial and temporal scales at which it operates. The governing equations of hydrology, including infiltration [
1], unsaturated flow [
2], evapotranspiration [
3,
4], and groundwater dynamics [
5], were largely in place before the first satellites reached orbit. However, large-scale application of these processes in hydrology equations was limited by a common challenge: they had to be applied as if the land surface was homogeneous, because no practical mechanism existed for observing parameter fields across continental or global extents. Remote sensing gave hydrologic science a sense of scale never before possible.
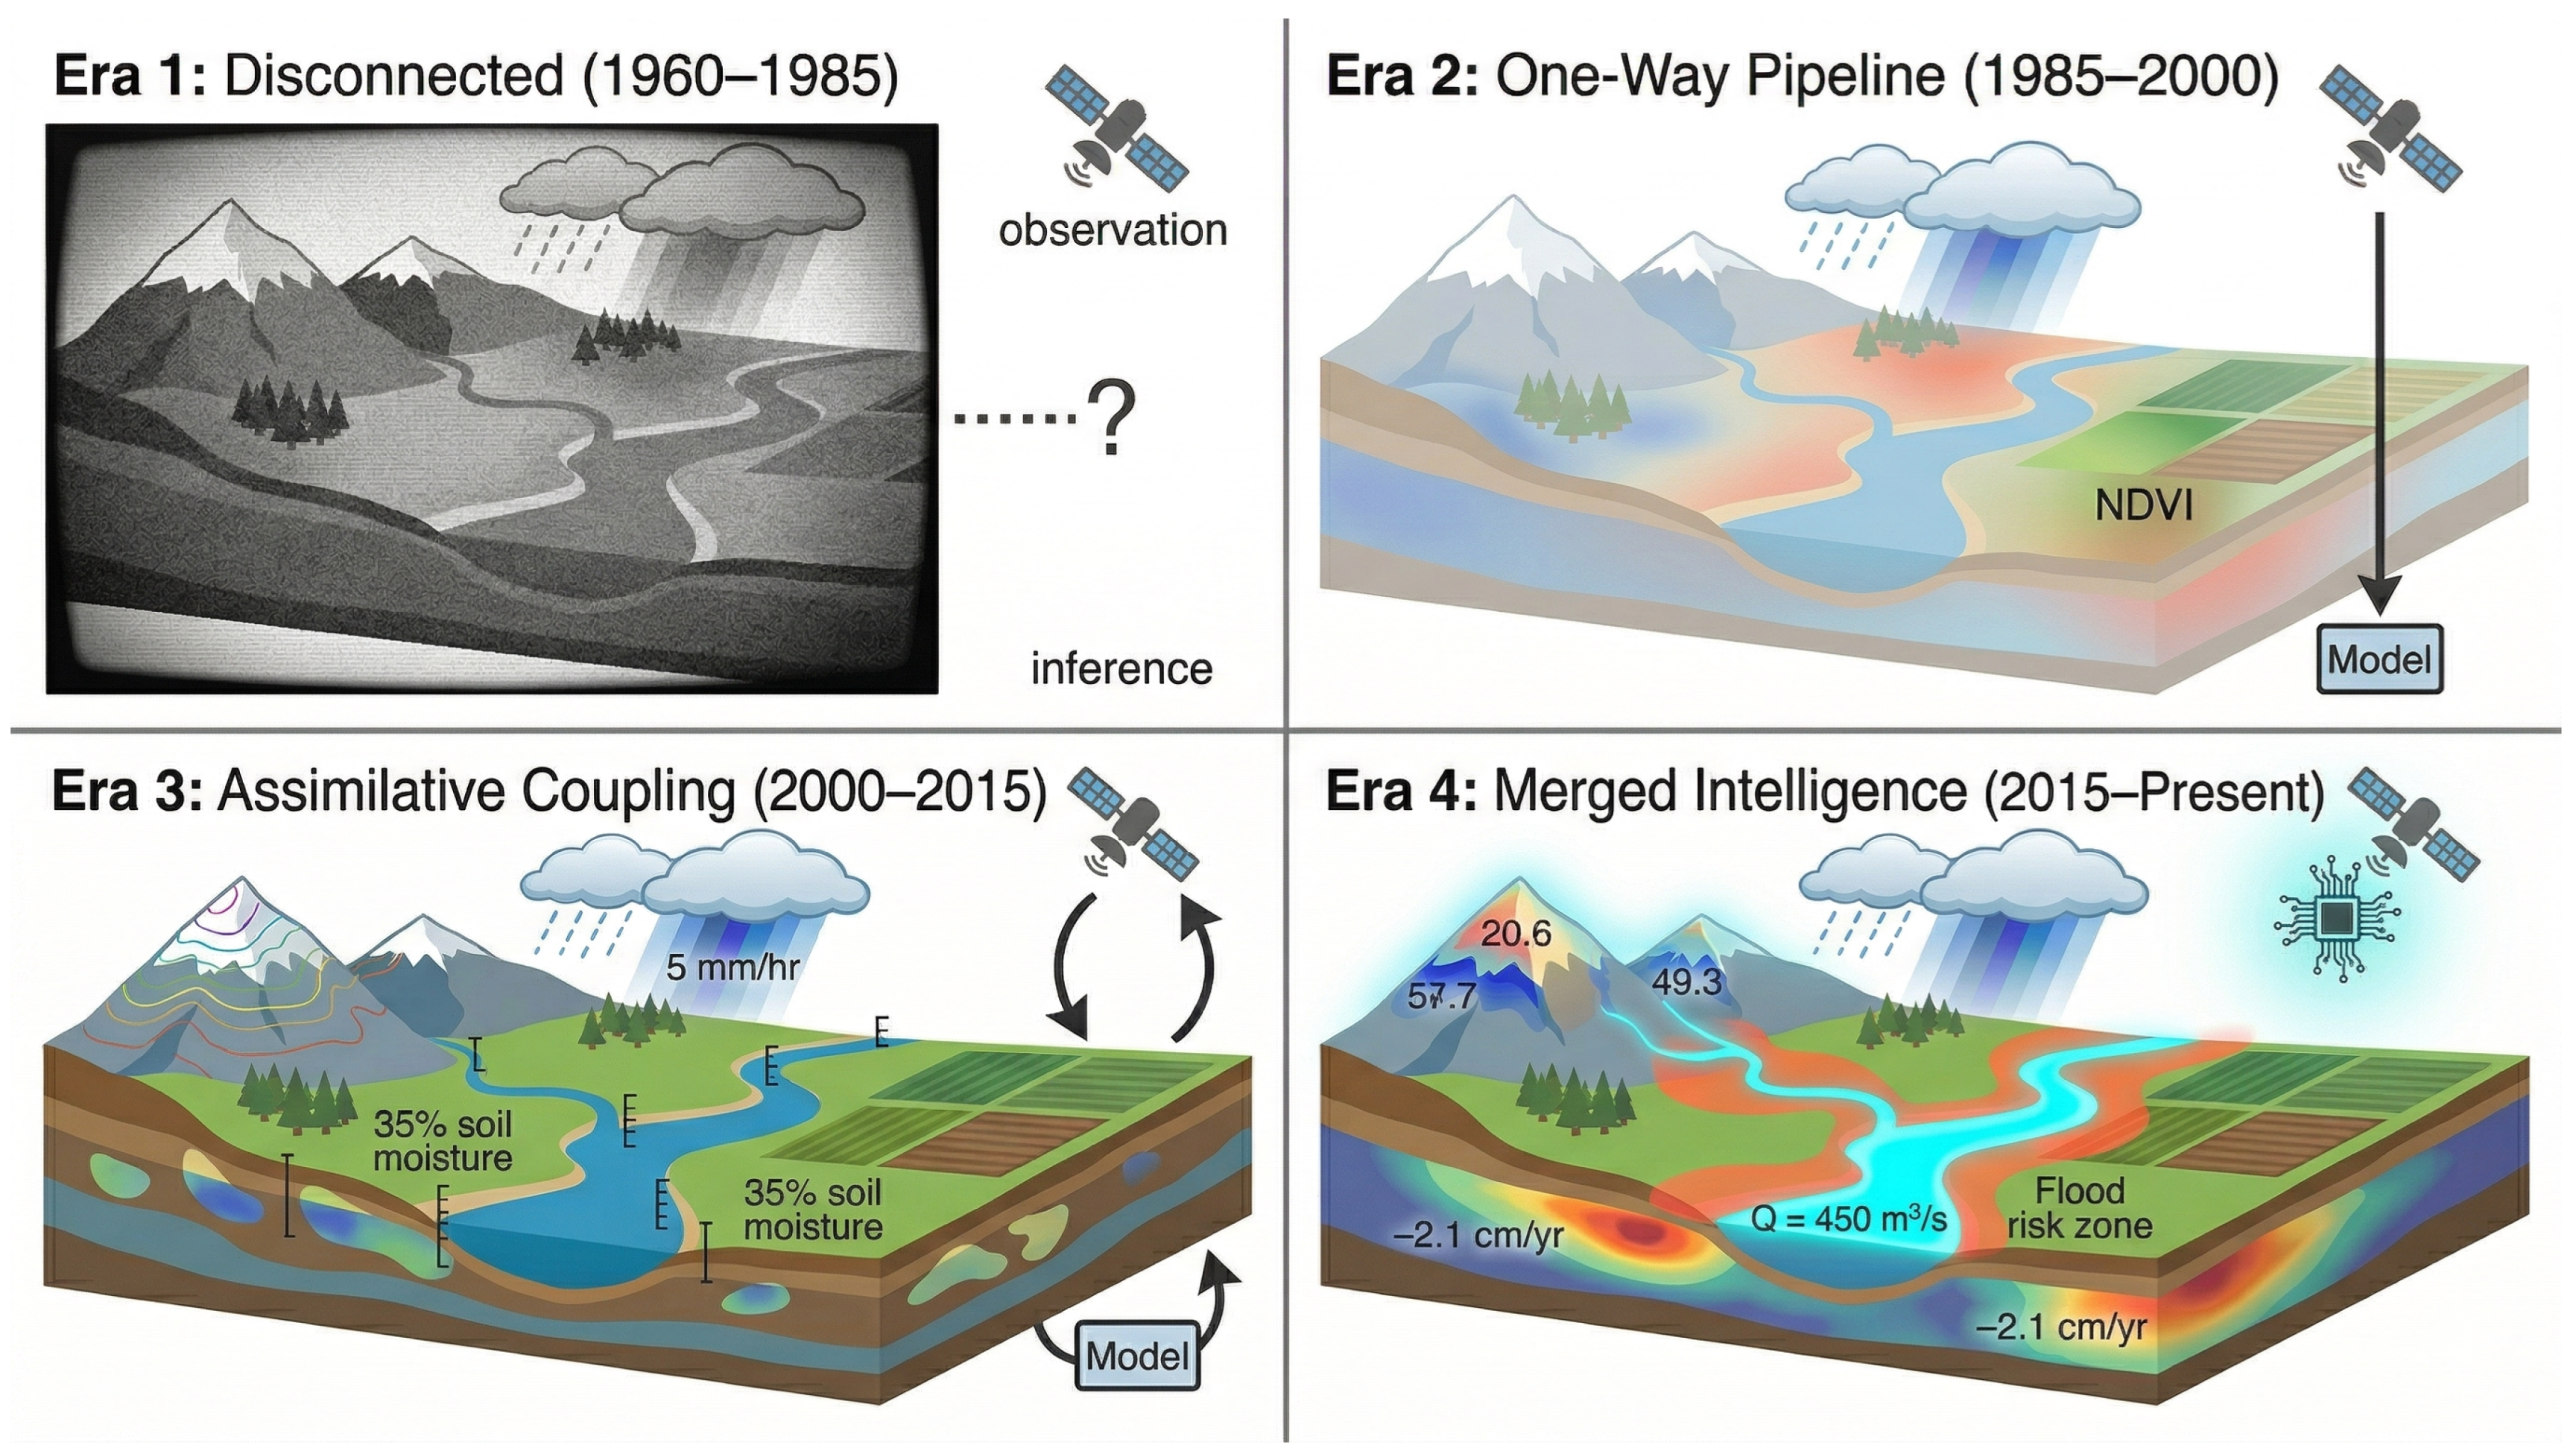
The organizing paradigm of this review is the observation-to-inference arc: the progressive tightening of the coupling between remote sensing observations and hydrologic inference. In the earliest applications (1960s–1980s), satellite imagery was a curiosity, consisting of manually interpreted photographs that illustrated what hydrologists already knew from ground stations. By the 1990s, calibrated retrieval algorithms had established a one-way pipeline: satellites produced data products (precipitation estimates, vegetation indices, snow maps) that were handed off to separate hydrologic models. After 2000, data assimilation created an assimilative relationship: models guided the interpretation of satellite signals, and satellite observations continuously corrected model states—a computational feedback loop that dramatically shortened the analytical distance between what the satellite measured and what the hydrologist needed to know. Today, deep learning systems are beginning to collapse this pipeline for specific applications. Looking ahead, these tools show promise for learning to predict hydrologic variables directly from raw satellite imagery with reduced reliance on explicit retrieval algorithms or process-based hydrologic models as intermediaries.
This arc, from observation disconnected from inference to observation merged with inference, provides a coherent narrative thread through six decades of technological change. The four eras presented in this review are distinguished by their position along this arc—that is, by how tightly observation and hydrologic inference are coupled—rather than primarily by technological milestones. Era 1 (1960–1985) is the era of disconnected observation: satellites provide imagery with no integration into operational hydrology. Era 2 (1985–2000) introduces the one-way pipeline: calibrated retrieval algorithms transform satellite signals into data products that are then fed to separate hydrologic models. Era 3 (2000–2015) features assimilative coupling: models guide the interpretation of satellite signals while satellite observations simultaneously correct model states, creating a computational feedback loop. Era 4 (2015–present) shows observation and inference progressively merging: deep learning systems learn to predict hydrologic variables more directly from satellite data, reducing the number of intermediate steps.
Figure 1 provides a graphical overview of how the relationship between satellite observation and hydrologic inference evolves across the four eras.
Table 1 illustrates how the role of remote sensing in hydrology has evolved across the four stages of the arc, and
Table 2 summarizes the key satellite missions and sensors that define each era. While these missions provide technological signposts for each era, the eras themselves are defined by these shifts in analytical coupling.
Previous reviews of remote sensing in hydrology are numerous and substantive, but they are organized differently. Sheffield et al. [
6] and McCabe et al. [
7] catalog sensor capabilities by water cycle variable and platform type. Zhang et al. [
8], Li et al. [
9], Adams et al. [
10], Tsang et al. [
11], and Ibrahim et al. [
12] provide in-depth treatment of individual water cycle components: evapotranspiration, water quality, groundwater, and snow water equivalent, respectively. Schumann et al. [
13] come closest to this paper’s approach, tracing six chronological breakthroughs in flood remote sensing, but their scope is limited to a single sub-domain. Saha and Pal [
14] review machine learning methods applied to RS-hydrology problems, but without the historical context that makes those methods comprehensible as a paradigm shift rather than a toolkit expansion. Lettenmaier et al. [
15] provide the most historically grounded perspective, documenting the emergence of scientific literature on remote sensing of water in the journal Water Resources Research over its first 50 years. Published in 2015, their account misses the deep learning revolution that has reshaped the field.
The present review does not replace these specialist contributions but rather adds to them. Rather than comprehensively reviewing all applications of remote sensing in hydrology, it uses the observation-to-inference arc as an organizing framework, selecting key missions, algorithms, and applications that illustrate each era’s dominant analytical paradigm. It defers to prior reviews for technical depth on individual sensors, retrieval algorithms, and water cycle components, and complements them with a narrative synthesis organized by era rather than by variable. It also contextualizes the specialist literature within the broader story of how remote sensing became integral to hydrology and water resource management, and where that integration is heading. In doing so, this review traces how each era’s technological advances translated into increasingly actionable water management capabilities: from experimental imagery with no operational utility, through calibrated products that inform reservoir operations and drought monitoring, to AI-driven early warning systems with the potential to protect hundreds of millions of people from floods. A companion review [
16] traces the parallel arc on the GIS side, documenting how geographic information systems evolved from standalone mapping tools to tightly coupled hydrologic modeling platforms; together, the two papers span the full landscape of digital spatial hydrology.
This review proceeds as follows:
Section 2 covers the early satellite observation era (1960–1985).
Section 3 addresses the development of calibrated RS products and their first integration with hydrologic models (1985–2000).
Section 4 examines the operational RS infrastructure era (2000–2015).
Section 5 reviews the current convergence of machine learning, AI, and remote sensing in hydrology (2015–present).
Section 6 presents the four-level AI vision for Earth observation in hydrology.
Section 7 discusses persistent challenges, and
Section 8 offers conclusions.
2. Early Satellite Observations and Hydrologic Relevance (1960–1985)
The space age opened hydrology’s eyes to the synoptic view. For the first time, it became possible to see an entire river basin, an entire storm system, and an entire snow field in a single frame. But on the observation-to-inference arc, this era represents the starting point: observation fully disconnected from inference. For the first quarter-century of satellite Earth observation, this view remained almost entirely disconnected from quantitative hydrologic practice. Satellites showed hydrologists what they could already measure on the ground; they did not yet produce data that could substitute for or improve upon ground-based networks.
2.1. The First Hydrologic Remote Sensing
One of the earliest research papers to apply satellite imagery to a water resources problem was that of Barnes and Bowley [
17], who used Television InfraRed Observation Satellite (TIROS) and Environmental Science Services Administration (ESSA) weather satellite photographs to map snow cover distribution. Snow was the natural first hydrologic application of spaceborne observations; its high albedo contrast with surrounding terrain made it visible even in the crudest imagery, and its spatial extent was the single most important variable for seasonal streamflow forecasting in snowmelt-dominated basins across the western United States and much of the world. The Barnes and Bowley paper demonstrated that satellites could delineate the areal extent of a snow field far more completely than any ground-based observation network. However, the imagery was qualitative, the spatial resolution was coarse, and converting what the satellite saw into the snow water equivalent that hydrologists needed required assumptions and ground-truth data that satellite imagery alone could not provide. Rango and Martinec [
18] later demonstrated that snow accumulation could be derived from satellite-observed depletion curves, establishing an early quantitative link between satellite imagery and operational snowmelt forecasting.
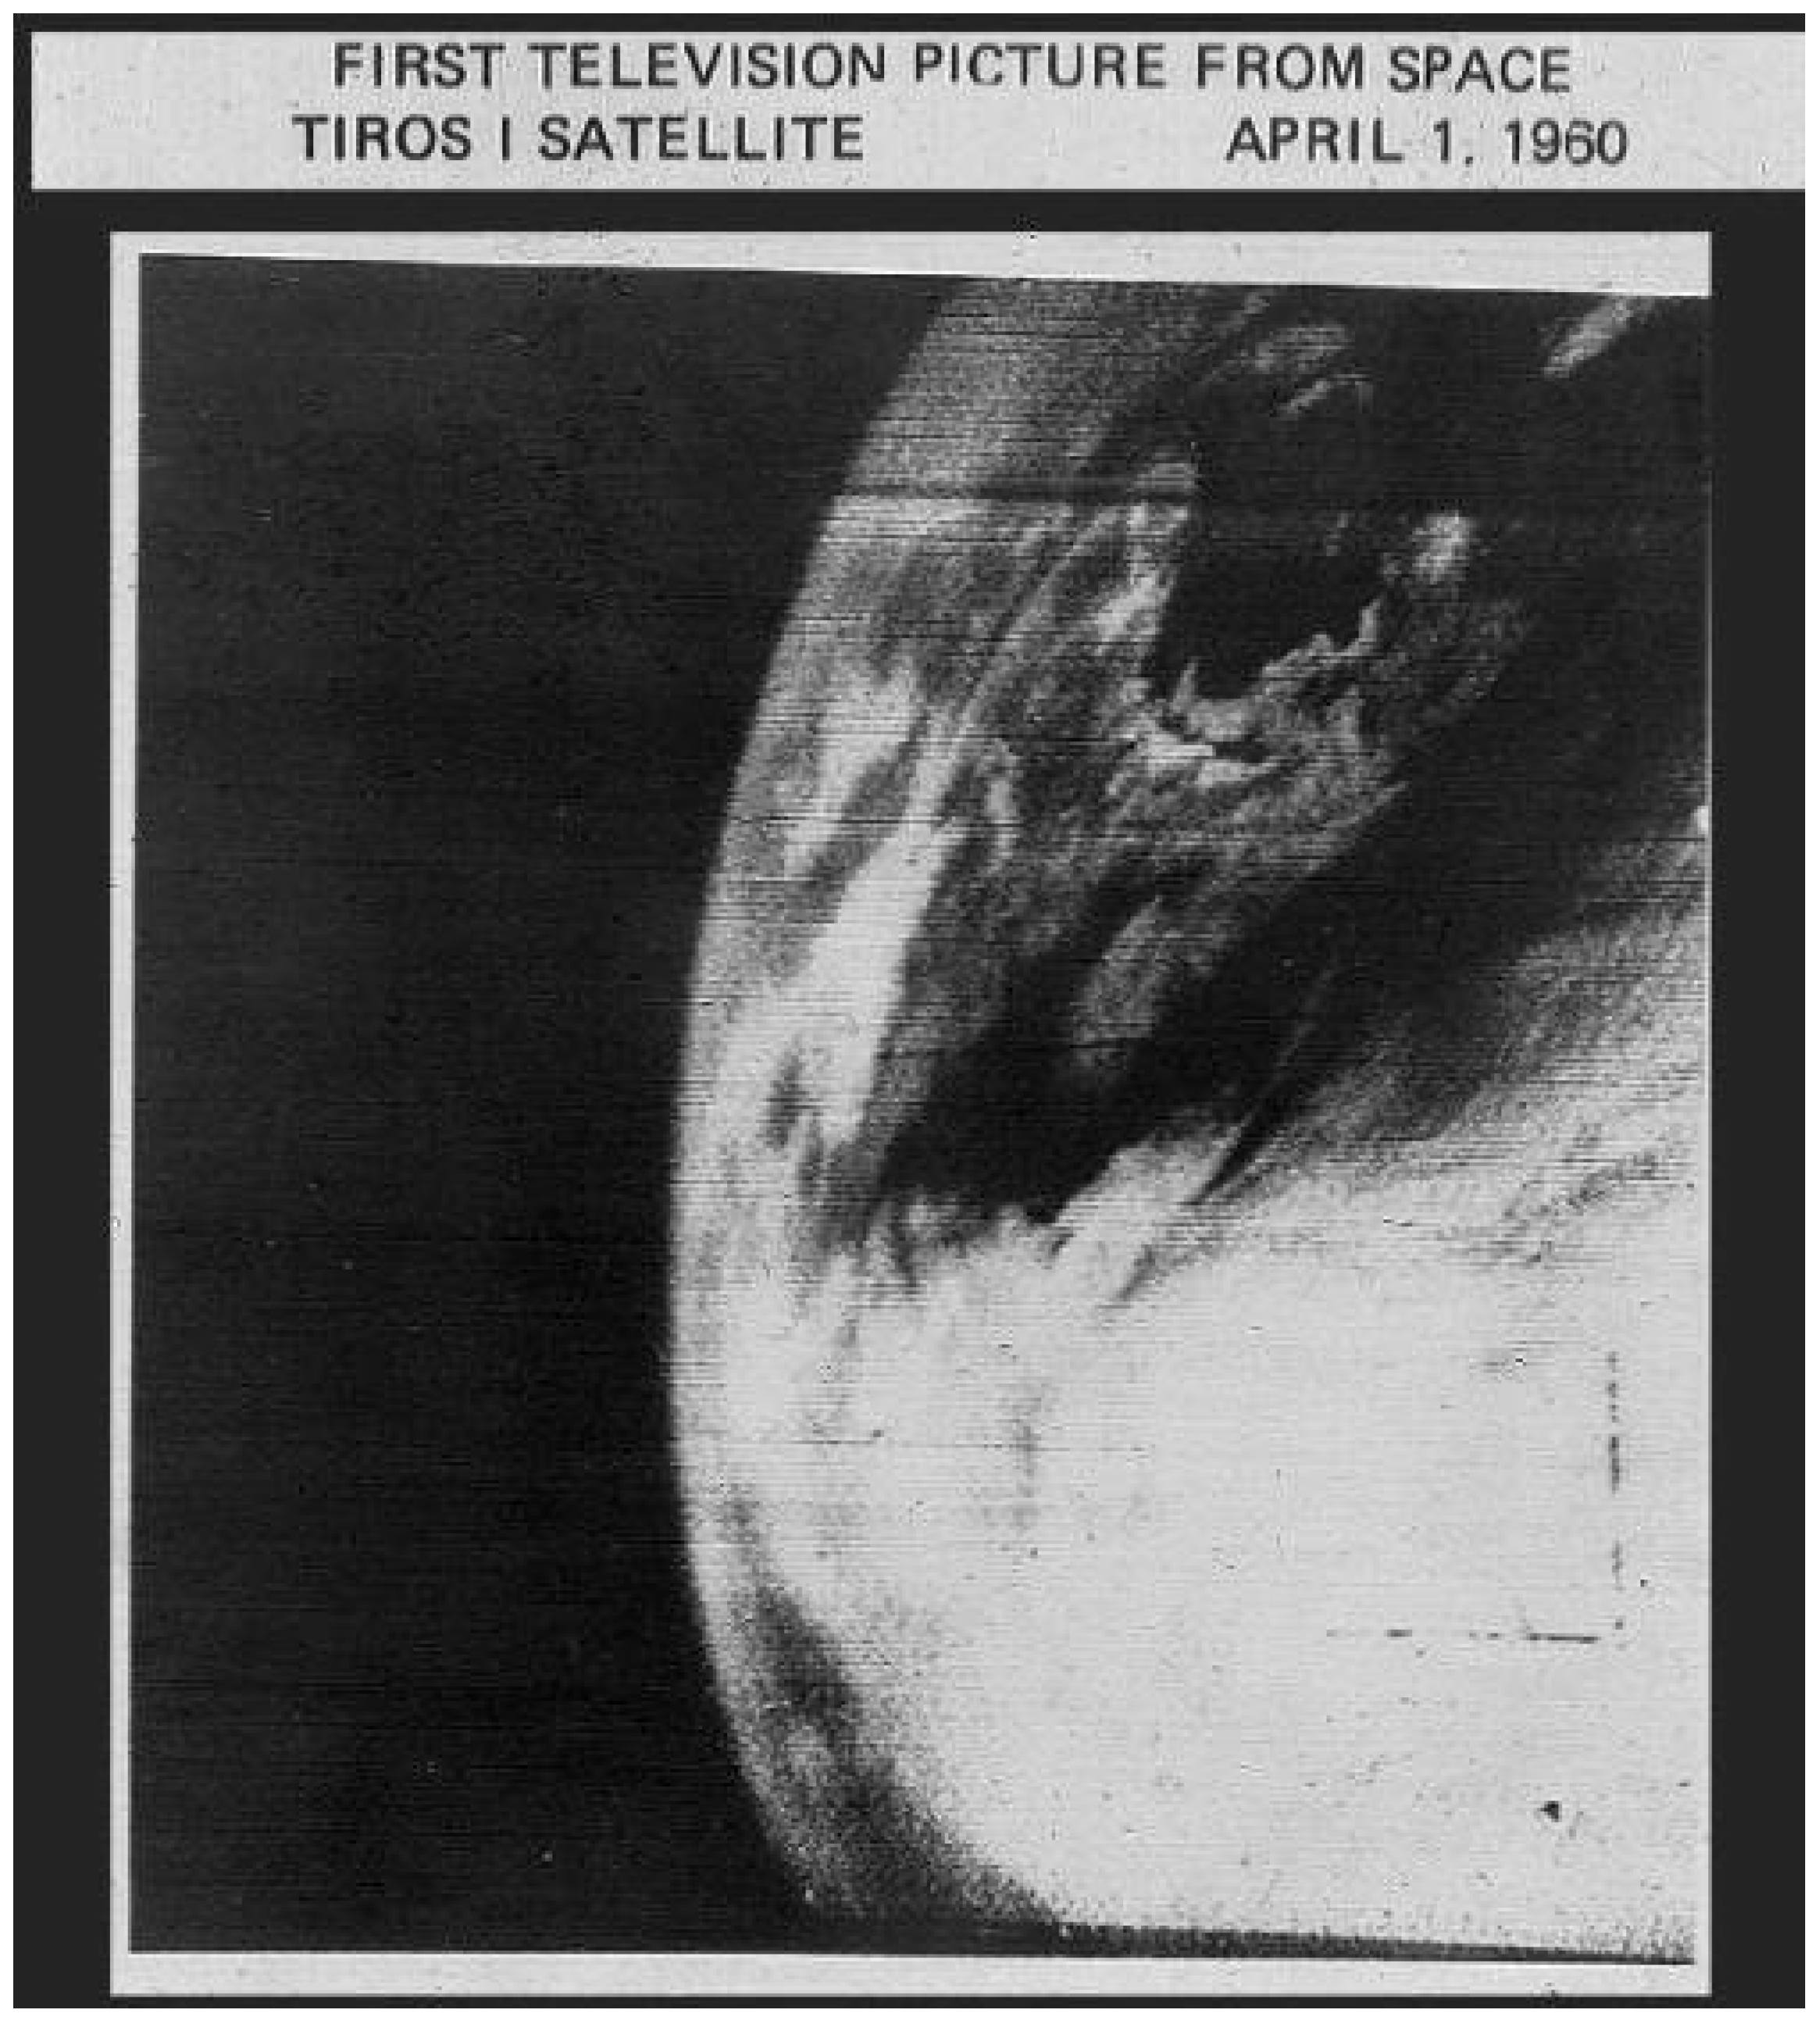
The TIROS series (
Figure 2), launched in 1960, was designed for meteorological observation but provided the first spaceborne views of cloud systems, ice fields, and land surfaces relevant to hydrology. The Nimbus series (1964–1978) advanced the observational frontier by carrying experimental sensors across the electromagnetic spectrum, including the first spaceborne microwave instruments that would later become central to the retrieval of precipitation, soil moisture, and snow water equivalent. Geostationary Operational Environmental Satellite (GOES), operational from 1975, enabled continuous monitoring of cloud-top temperatures at temporal resolutions sufficient to estimate rainfall rates through the GOES Precipitation Index (GPI) approach of Arkin [
19], which correlated cold cloud-top area with surface rainfall, a crude but revolutionary step toward satellite-based precipitation monitoring.
2.2. Landsat: The First Look at the Land Surface
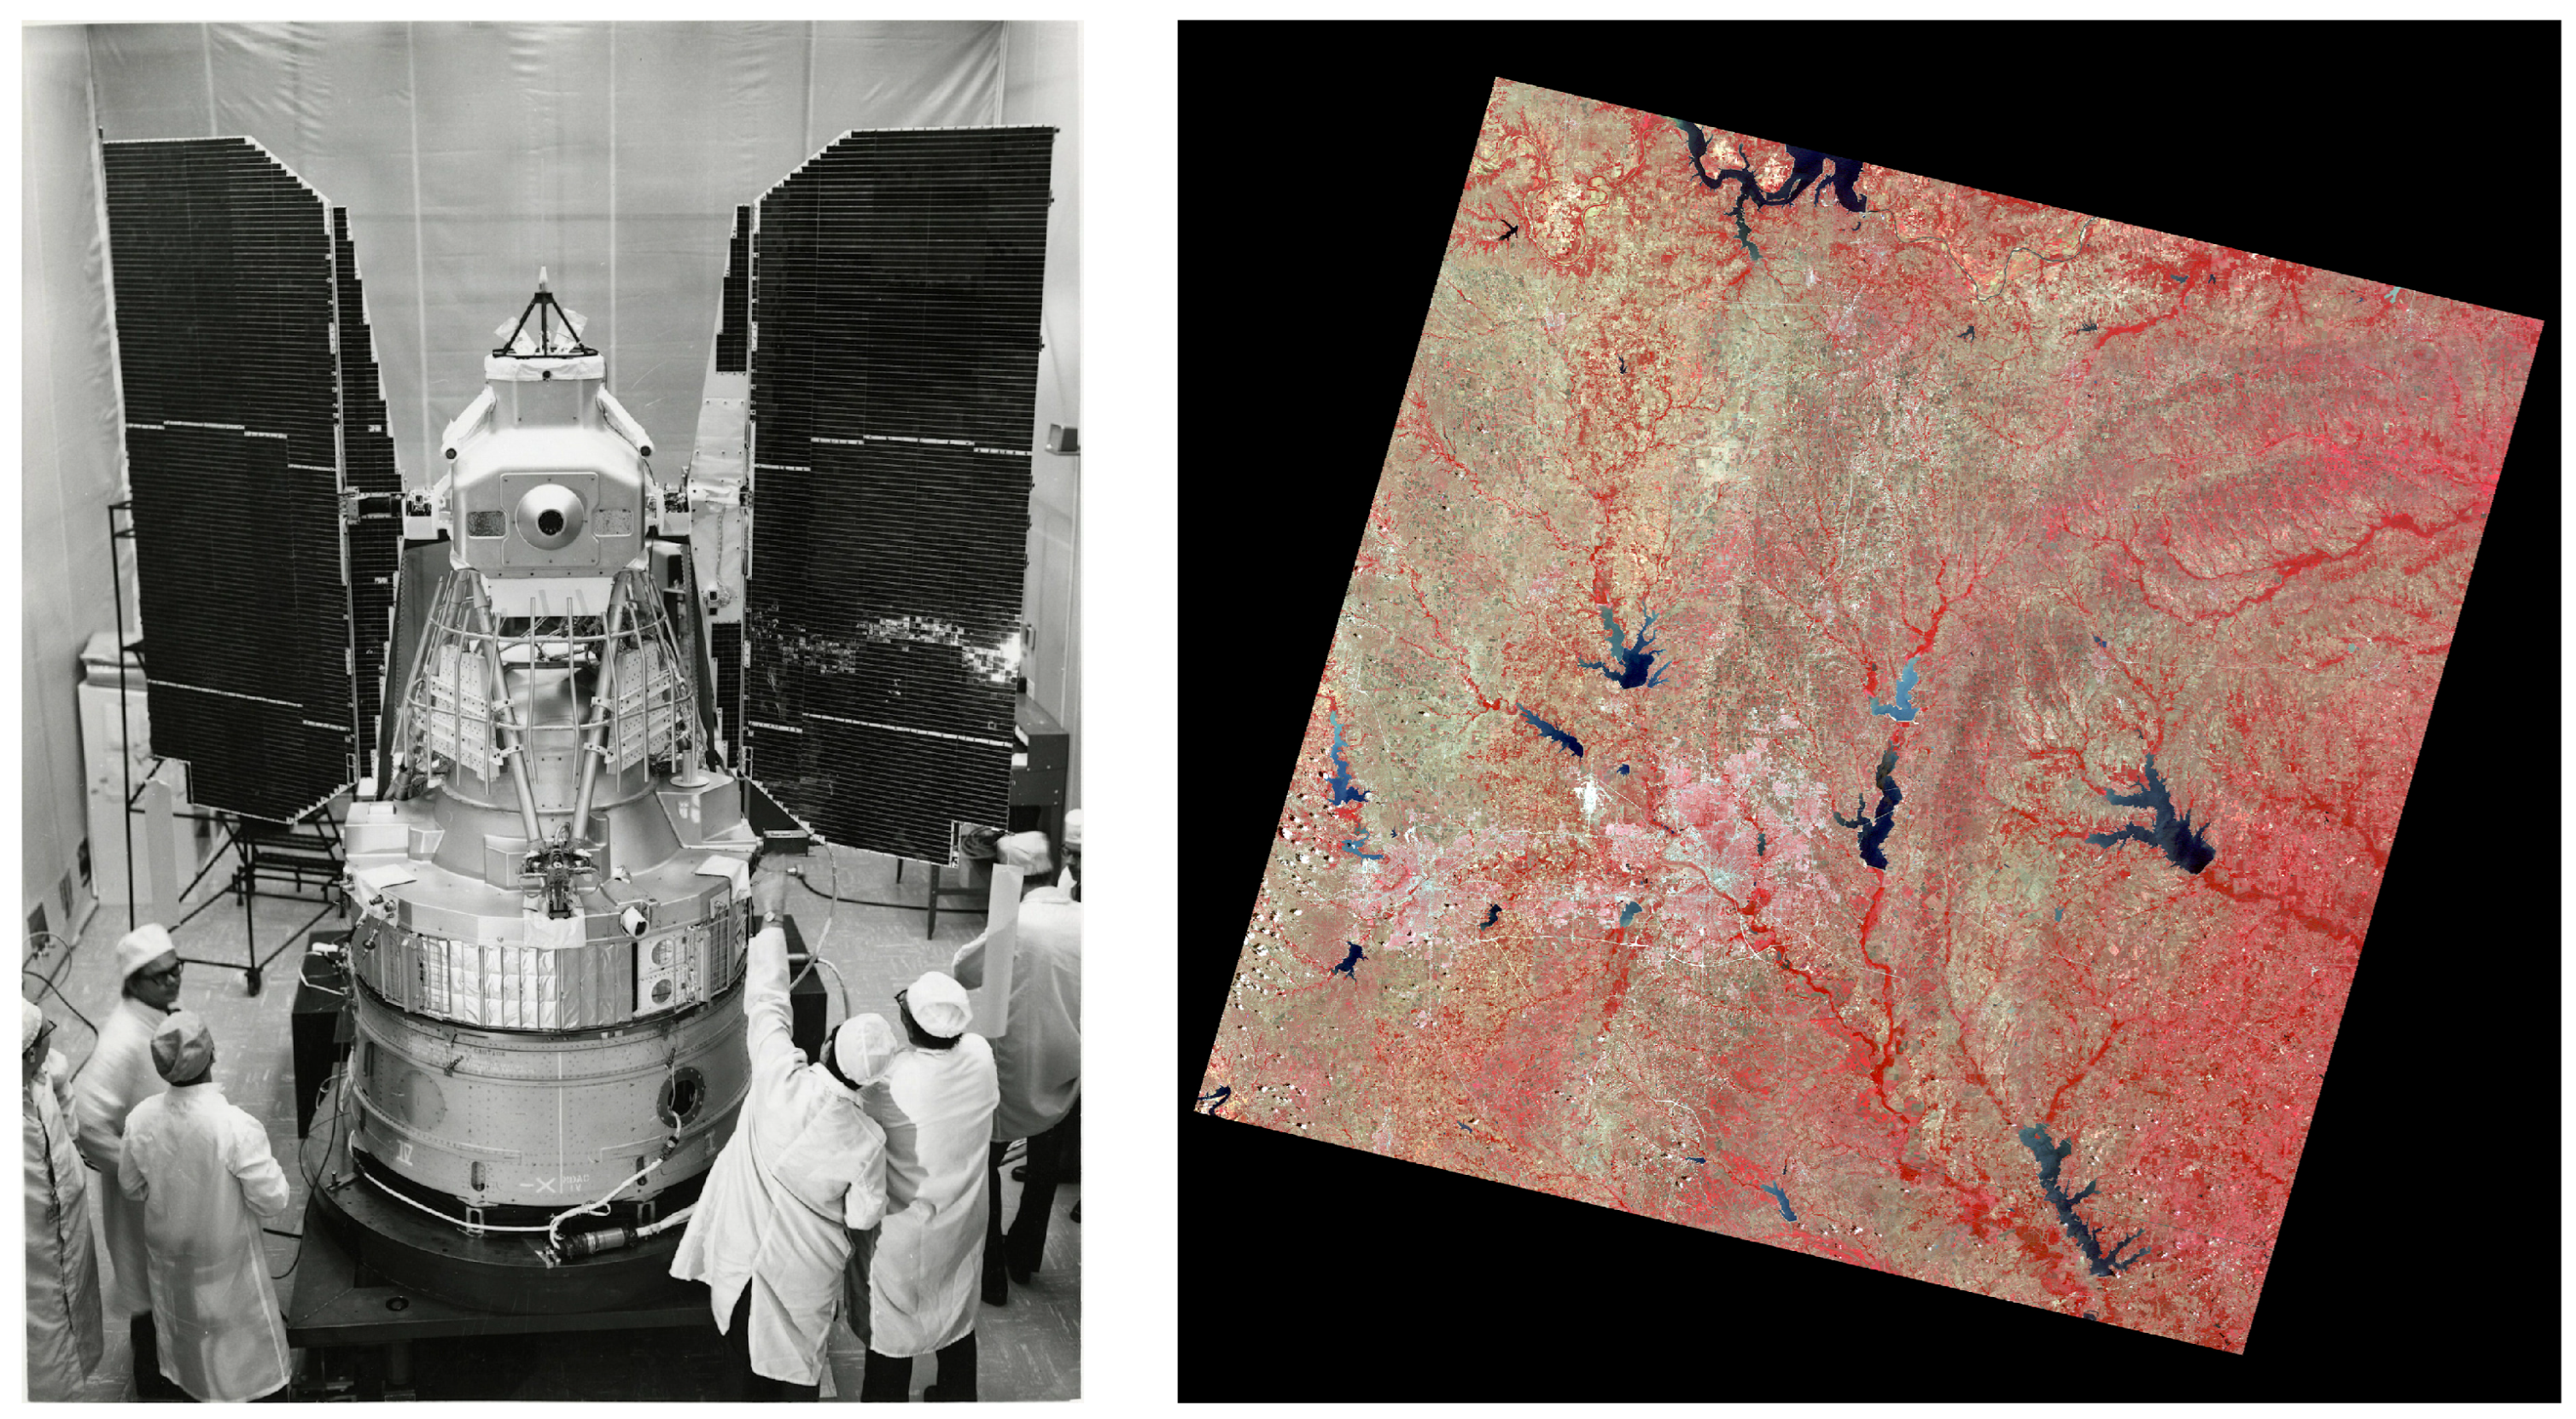
The launch of ERTS-1 (
Figure 3), later renamed Landsat 1, in 1972 marks the single most important event in the history of remote sensing for terrestrial hydrology. For the first time, a satellite was designed specifically to observe the land surface at a spatial resolution (approximately 80 m for the Multispectral Scanner) sufficient to distinguish individual land cover types, agricultural fields, water bodies, and geological features. The Landsat program, extended through Landsat 2 (1975), 3 (1978), 4 (1982), and 5 (1984, remarkably operational until 2013), established the 30 m, multi-spectral, 16-day repeat observation paradigm that remains the backbone of civilian Earth observation. But in this era, Landsat data were expensive, difficult to process, and required specialized expertise to interpret. Their hydrologic applications were largely limited to land cover classification for runoff estimation (enabling the SCS Curve Number method [
20] to be applied spatially) and to the visual identification of surface water bodies. Landsat did not yet produce the calibrated, science-ready data products that would transform hydrology in later decades.
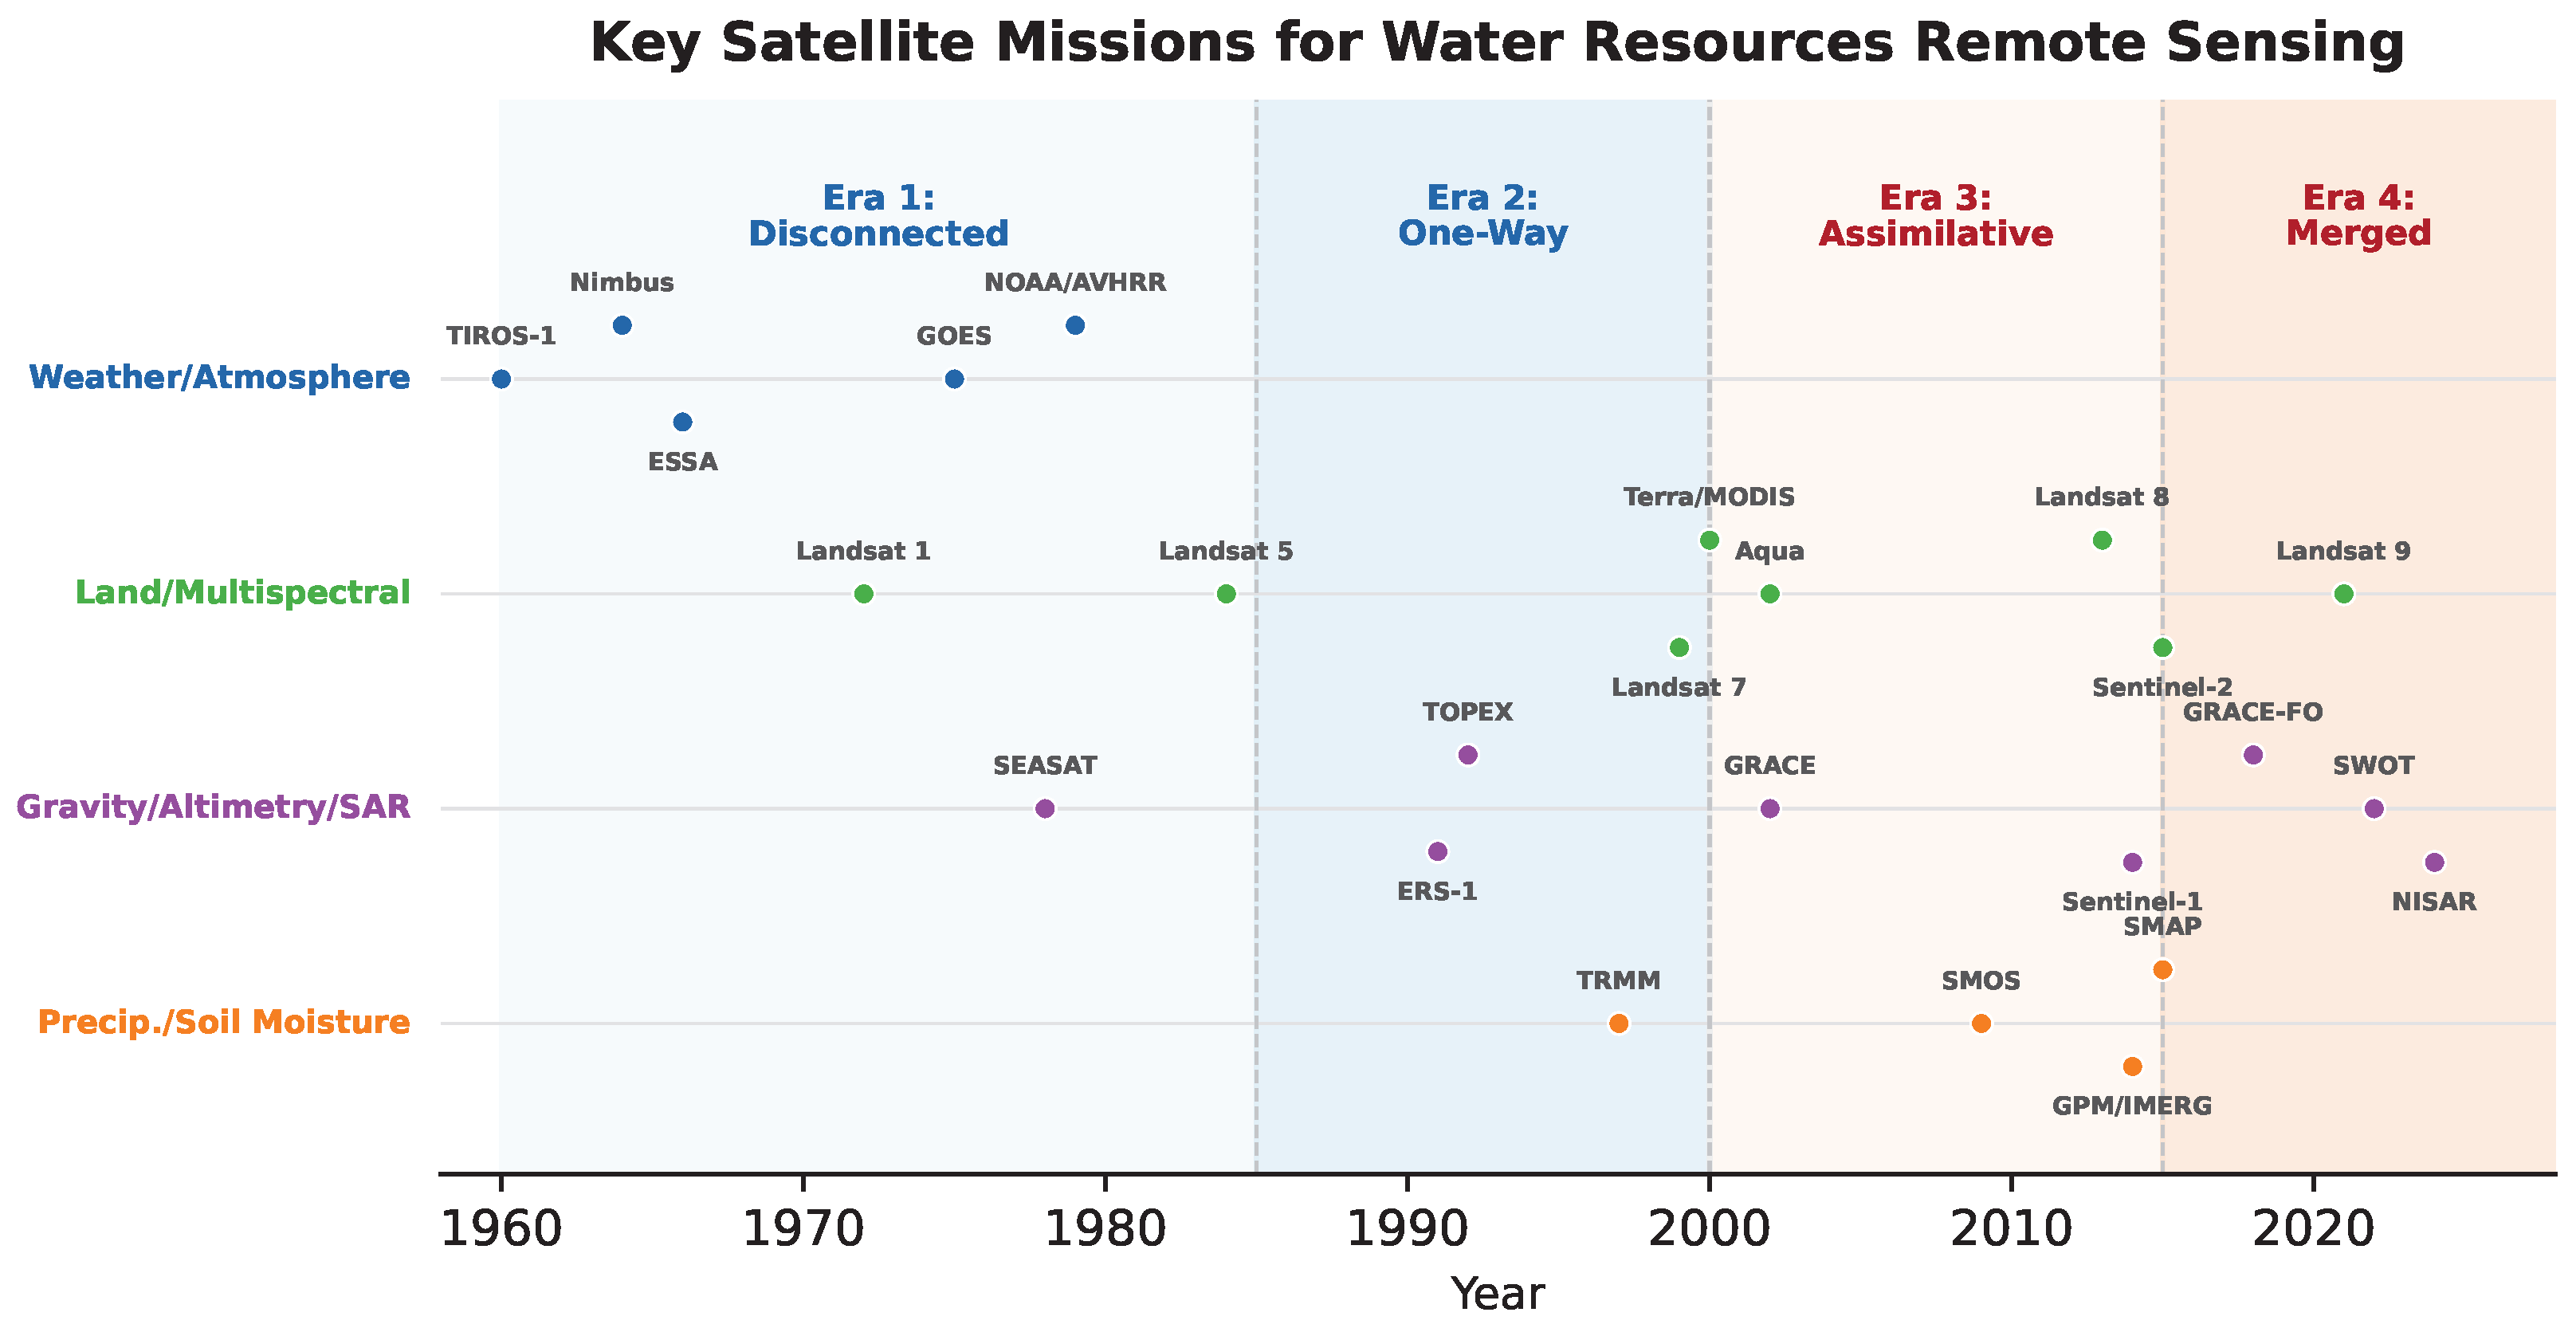
Figure 4 provides a visual timeline of the key satellite missions discussed in this review.
2.3. Early Microwave Foundations
The theoretical foundations for microwave remote sensing of hydrologic variables were established during this era, even though operational applications would not emerge until later. Njoku and Kong [
23] developed a theory for passive microwave remote sensing of near-surface soil moisture. Dobson et al. [
24] characterized the microwave dielectric behavior of wet soil, establishing the physical basis for soil moisture retrieval that would underpin Soil Moisture and Ocean Salinity (SMOS) and Soil Moisture Active Passive (SMAP) decades later. Tsang et al. [
25] provided a comprehensive theoretical framework for microwave remote sensing that remains a foundational reference. Chang et al. [
26] demonstrated the retrieval of snow water equivalent from passive microwave brightness temperatures, and Warren and Wiscombe [
27] developed spectral albedo models for snow that enabled quantitative optical snow remote sensing.
SEASAT (1978), though operational for only 99 days before a power failure, proved consequential despite its brief life. It carried the first spaceborne synthetic aperture radar (SAR) and radar altimeter, demonstrating that radar could image the ocean surface, measure wave heights, and detect surface topography through clouds and at night. The hydrologic implications were not fully realized at the time, but SEASAT established the technical foundation for SAR-based flood mapping, InSAR-based surface deformation measurement, and radar altimetry for river and lake level monitoring, all of which would become operational capabilities in subsequent eras.
2.4. The Observation-to-Inference Arc in Era 1
In this era, the coupling between remote sensing and hydrologic inference was minimal. Satellites produced images; hydrologists looked at them. The data were qualitative, the processing was manual, and the connection to operational water management was tenuous. Remote sensing was, to the hydrology community, a curiosity, a promising but unproven technology pursued by a small cohort of specialists working at the intersection of atmospheric science, electrical engineering, and geography. As noted by Lettenmaier et al. [
15], very few research papers applying remote sensing to water resources appeared in the literature during this entire era. Observations existed, but hydrologic inference remained firmly grounded in gauge networks, field campaigns, and process-based models. The two were structurally disconnected.
3. Calibrated Remote Sensing (RS) Products and First Model Integration (1985–2000)
The second era represents the first major advance along the observation-to-inference arc: the transition from disconnected observation to RS data integration within inference models. Remote sensing evolved from a qualitative imaging capability into a quantitative data source for hydrology. The critical advance was not a single sensor or mission but a conceptual shift: the development of retrieval and processing algorithms that converted raw satellite radiances into physically meaningful, calibrated data products. Examples of these products include Normalized Difference Vegetation Index (NDVI) for vegetation, land surface temperature maps, precipitation estimates, and snow cover fraction. Now there were datasets that hydrologists could use without understanding the underlying radiative physics. For the first time, satellite observations could be incorporated into hydrologic workflows as numerical inputs rather than merely as qualitative illustrations.
3.1. Advanced Very High Resolution Radiometer (AVHRR) and the Vegetation-Evapotranspiration (ET) Connection
AVHRR, operational on National Oceanic and Atmospheric Administration (NOAA) polar-orbiting satellites from the early 1980s, was the workhorse sensor of this era for land surface applications. Its daily global coverage at approximately 1 km resolution enabled the first continuous satellite-derived records of vegetation dynamics through NDVI [
28]. While NDVI was not a direct hydrologic variable, it provided a window into evapotranspiration, the largest consumptive flux in the water balance over most land surfaces, because vegetation greenness correlates with transpiration rates, canopy conductance, and root-zone moisture availability.
Bastiaanssen et al. [
29] developed the Surface Energy Balance Algorithm for Land (SEBAL), which combined thermal infrared imagery with NDVI and surface temperature to estimate ET as the residual of the surface energy balance. Allen et al. [
30] refined this approach into Mapping EvapoTranspiration at high Resolution with Internalized Calibration (METRIC), adding an internal calibration procedure using reference ET from local weather stations. Su [
31] introduced the Surface Energy Balance System (SEBS). Panda et al. [
32] demonstrated that vegetation indices could also serve as inputs to neural network models for agricultural yield prediction, anticipating the later convergence of RS and machine learning. This vegetation-ET connection spawned a generation of remote sensing-based evapotranspiration estimation methods. All of these approaches shared a common architecture, applied in diverse operational settings from Idaho irrigation districts [
33] to global flux towers, and in irrigated basins of the Mediterranean [
34], that defines the Era 2 paradigm: satellite imagery entered a hand-crafted retrieval algorithm, which produced a data product (in this case, an ET map), which was then used independently by hydrologic modelers. The satellite observation was structurally separated from the hydrologic inference by a retrieval algorithm that required expert calibration and site-specific tuning.
Zhang et al. [
8] provide the definitive taxonomy of these methods, organizing them into (1) residual energy balance approaches, including SEBAL, METRIC, Atmosphere-Land Exchange Inverse (ALEXI); (2) Penman-Monteith-based approaches, including MODIS Global Evapotranspiration Product (MOD16), Priestley-Taylor-based approaches (PT-JPL); and (3) empirical methods. This taxonomy maps directly onto the observation-to-inference arc: the earlier methods required more expert intervention and site-specific calibration; the later ones increasingly automated the retrieval process, anticipating the AI-native retrieval algorithms that would emerge in Era 4. As used in this review, AI-native describes approaches in which machine learning constitutes the core algorithmic mechanism rather than serving as an add-on to an existing workflow. Where traditional pipelines require hand-crafted retrieval or physics-based modeling steps, AI-native approaches replace these with learned functions that map satellite observations to hydrologic variables end-to-end.
3.2. Radar Altimetry and Surface Water from Space
The launch of Ocean TOPography EXperiment (TOPEX)/Poseidon in 1992, a joint National Aeronautics and Space Administration (NASA)-Centre National d’Études Spatiales (CNES) mission designed for ocean surface topography, had an unanticipated hydrologic dividend: its radar altimeter could measure water surface elevations of large inland water bodies. Birkett [
35] demonstrated that TOPEX/Poseidon could monitor water levels in climatically sensitive lakes globally, including lakes, reservoirs, and very large rivers, with centimeter-level precision. This capability was exploited by a small but visionary community of hydrologists who recognized that if water surface elevation could be measured from space, river discharge could eventually be estimated from space as well. Bjerklie et al. [
36] developed methods for estimating discharge from satellite-observed river width and water-surface slope, establishing the theoretical framework that would be realized by the Surface Water and Ocean Topography (SWOT) mission two decades later [
37]. Leopold and Maddock’s [
38] hydraulic geometry relationships, originally derived from field measurements, provided the physical basis for relating satellite-observable quantities (width, slope) to the hydrologic variable of greatest operational interest (discharge).
The European Remote Sensing (ERS)-1 and ERS-2 satellites (1991, 1995) contributed SAR capability and additional radar altimetry. Radarsat-1 (1995) demonstrated operational SAR imaging for ice monitoring and flood mapping. Together with TOPEX/Poseidon, these missions established that active radar sensors, immune to cloud cover and capable of day/night operation, would play a central role in hydrologic remote sensing.
3.3. The Birth of Satellite Precipitation
The Tropical Rainfall Measuring Mission (TRMM), launched in 1997 as a joint NASA-Japan Aerospace Exploration Agency (JAXA) mission, was the first satellite specifically designed to measure precipitation. Carrying both a precipitation radar and a passive microwave imager, TRMM produced the first physically based, calibrated precipitation estimates from space. The TRMM Multi-satellite Precipitation Analysis (TMPA) [
39] combined TRMM observations with geostationary IR estimates and rain gauge data to produce quasi-global, three-hourly precipitation fields at 0.25-degree resolution. This dataset transformed hydrologic modeling in data-sparse regions where rain gauge networks were inadequate. TRMM and its associated Goddard Profiling Algorithm (GPROF) [
40] established the intellectual and technical foundation for the Global Precipitation Measurement (GPM) mission, which succeeded it in 2014.
3.4. InSAR and Subsurface Hydrology
InSAR emerged as an unexpected tool for groundwater hydrology when Amelung et al. [
41] demonstrated that it could detect land subsidence in Las Vegas caused by groundwater extraction. This made subsurface aquifer dynamics visible from space through their surface expression [
42]. On our conceptual arc, InSAR extended the reach of satellite observation into a domain previously accessible only through borehole networks, and its later fusion with Gravity Recovery and Climate Experiment (GRACE) gravimetry would exemplify the multi-source observation strategies of Era 3.
3.5. The Observation-to-Inference Arc in Era 2
Era 2 established the fundamental paradigm that would dominate operational remote sensing in hydrology for the next two decades: satellite → retrieval algorithm → data product → model input. The coupling between observation and inference tightened significantly. Satellite data could be used directly in hydrologic models as quantitative inputs rather than qualitative illustrations, but the two domains remained as structurally separate disciplines connected by a pipeline of expert-curated retrieval algorithms. The retrieval and conversion workflows and algorithms are the bottleneck. Developing, calibrating, and validating these for a new sensor, variable, or region requires years of specialized effort. Breaking this bottleneck, replacing hand-crafted retrieval algorithms with learned functions, is what the AI revolution of Era 4 will eventually accomplish.
4. The Operational Remote Sensing Infrastructure Era (2000–2015)
On the observation-to-inference arc, Era 3 marks the transition from one-way transfer to tighter coupling. If Era 2 established the satellite → retrieval → product → model pipeline, Era 3 made it tighter: satellite observations began continuously updating model states through data assimilation, and the evolving needs of hydrologic models increasingly shaped the design of new satellite missions and data products. Between 2000 and 2015, remote sensing transitioned from a research capability used by specialists to a standard operational infrastructure for hydrology. Three converging developments drove this transformation: a constellation of flagship missions that together observed every major component of the water cycle; the decision by NASA, European Space Agency (ESA), and other agencies to distribute science-ready data products free of charge; and cloud computing platforms that made petabytes of satellite imagery accessible to anyone with a web browser.
4.1. The Water Cycle from Orbit: EOS and Beyond
NASA’s EOS strategy, with the launch of Terra in 1999 and Aqua in 2002, changed the relationship between remote sensing and hydrology. What mattered most was an institutional decision: EOS missions would produce peer-reviewed science data products distributed freely through standardized data systems. MODIS, carried on both Terra and Aqua, became the defining instrument of the era, producing operational global products for snow cover [
43,
44], vegetation indices, land surface temperature, evapotranspiration [
45], and leaf area index at daily to 16-day temporal resolution and 250 m to 1 km spatial resolution.
Lettenmaier et al. [
15] document the consequence: a steep acceleration in the number of water resources-focused remote sensing research papers beginning around 2005. They attribute this acceleration directly to the availability of free, calibrated MODIS products that hydrologists could use without developing their own retrieval algorithms. The EOS strategy lowered the barrier so that hydrologists did not need to be remote sensing specialists to benefit from satellite observations, a friction reduction that, at a much larger scale, the AI revolution would later extend.
ET estimation matured significantly during this era. Mu et al. [
45] developed the MODIS global terrestrial evapotranspiration product (MOD16) using the Penman-Monteith equation with MODIS-derived inputs. Fisher et al. [
46] introduced the Priestley-Taylor Jet Propulsion Laboratory (PT-JPL) algorithm. Miralles et al. [
47] developed the Global Land Evaporation Amsterdam Model (GLEAM), which inferred ET from satellite soil moisture observations. Vinukollu et al. [
48] provided the first multi-model, multi-sensor ensemble ET estimates. These products enabled, for the first time, continuous global monitoring of the largest consumptive water flux at the land surface.
4.2. GRACE: Weighing the Water Cycle from Space
GRACE, launched in 2002, introduced an entirely new observational paradigm: measuring changes in the Earth’s gravity field to infer changes in terrestrial water storage. By tracking variations in the distance between twin satellites following each other in low Earth orbit, GRACE could detect monthly changes in total water mass at spatial scales of approximately 200–300 km [
49]. GRACE changed hydrologic practice by providing an estimate of total terrestrial water storage change that integrates all components of the water balance: surface water, soil moisture, snow, ice, and groundwater.
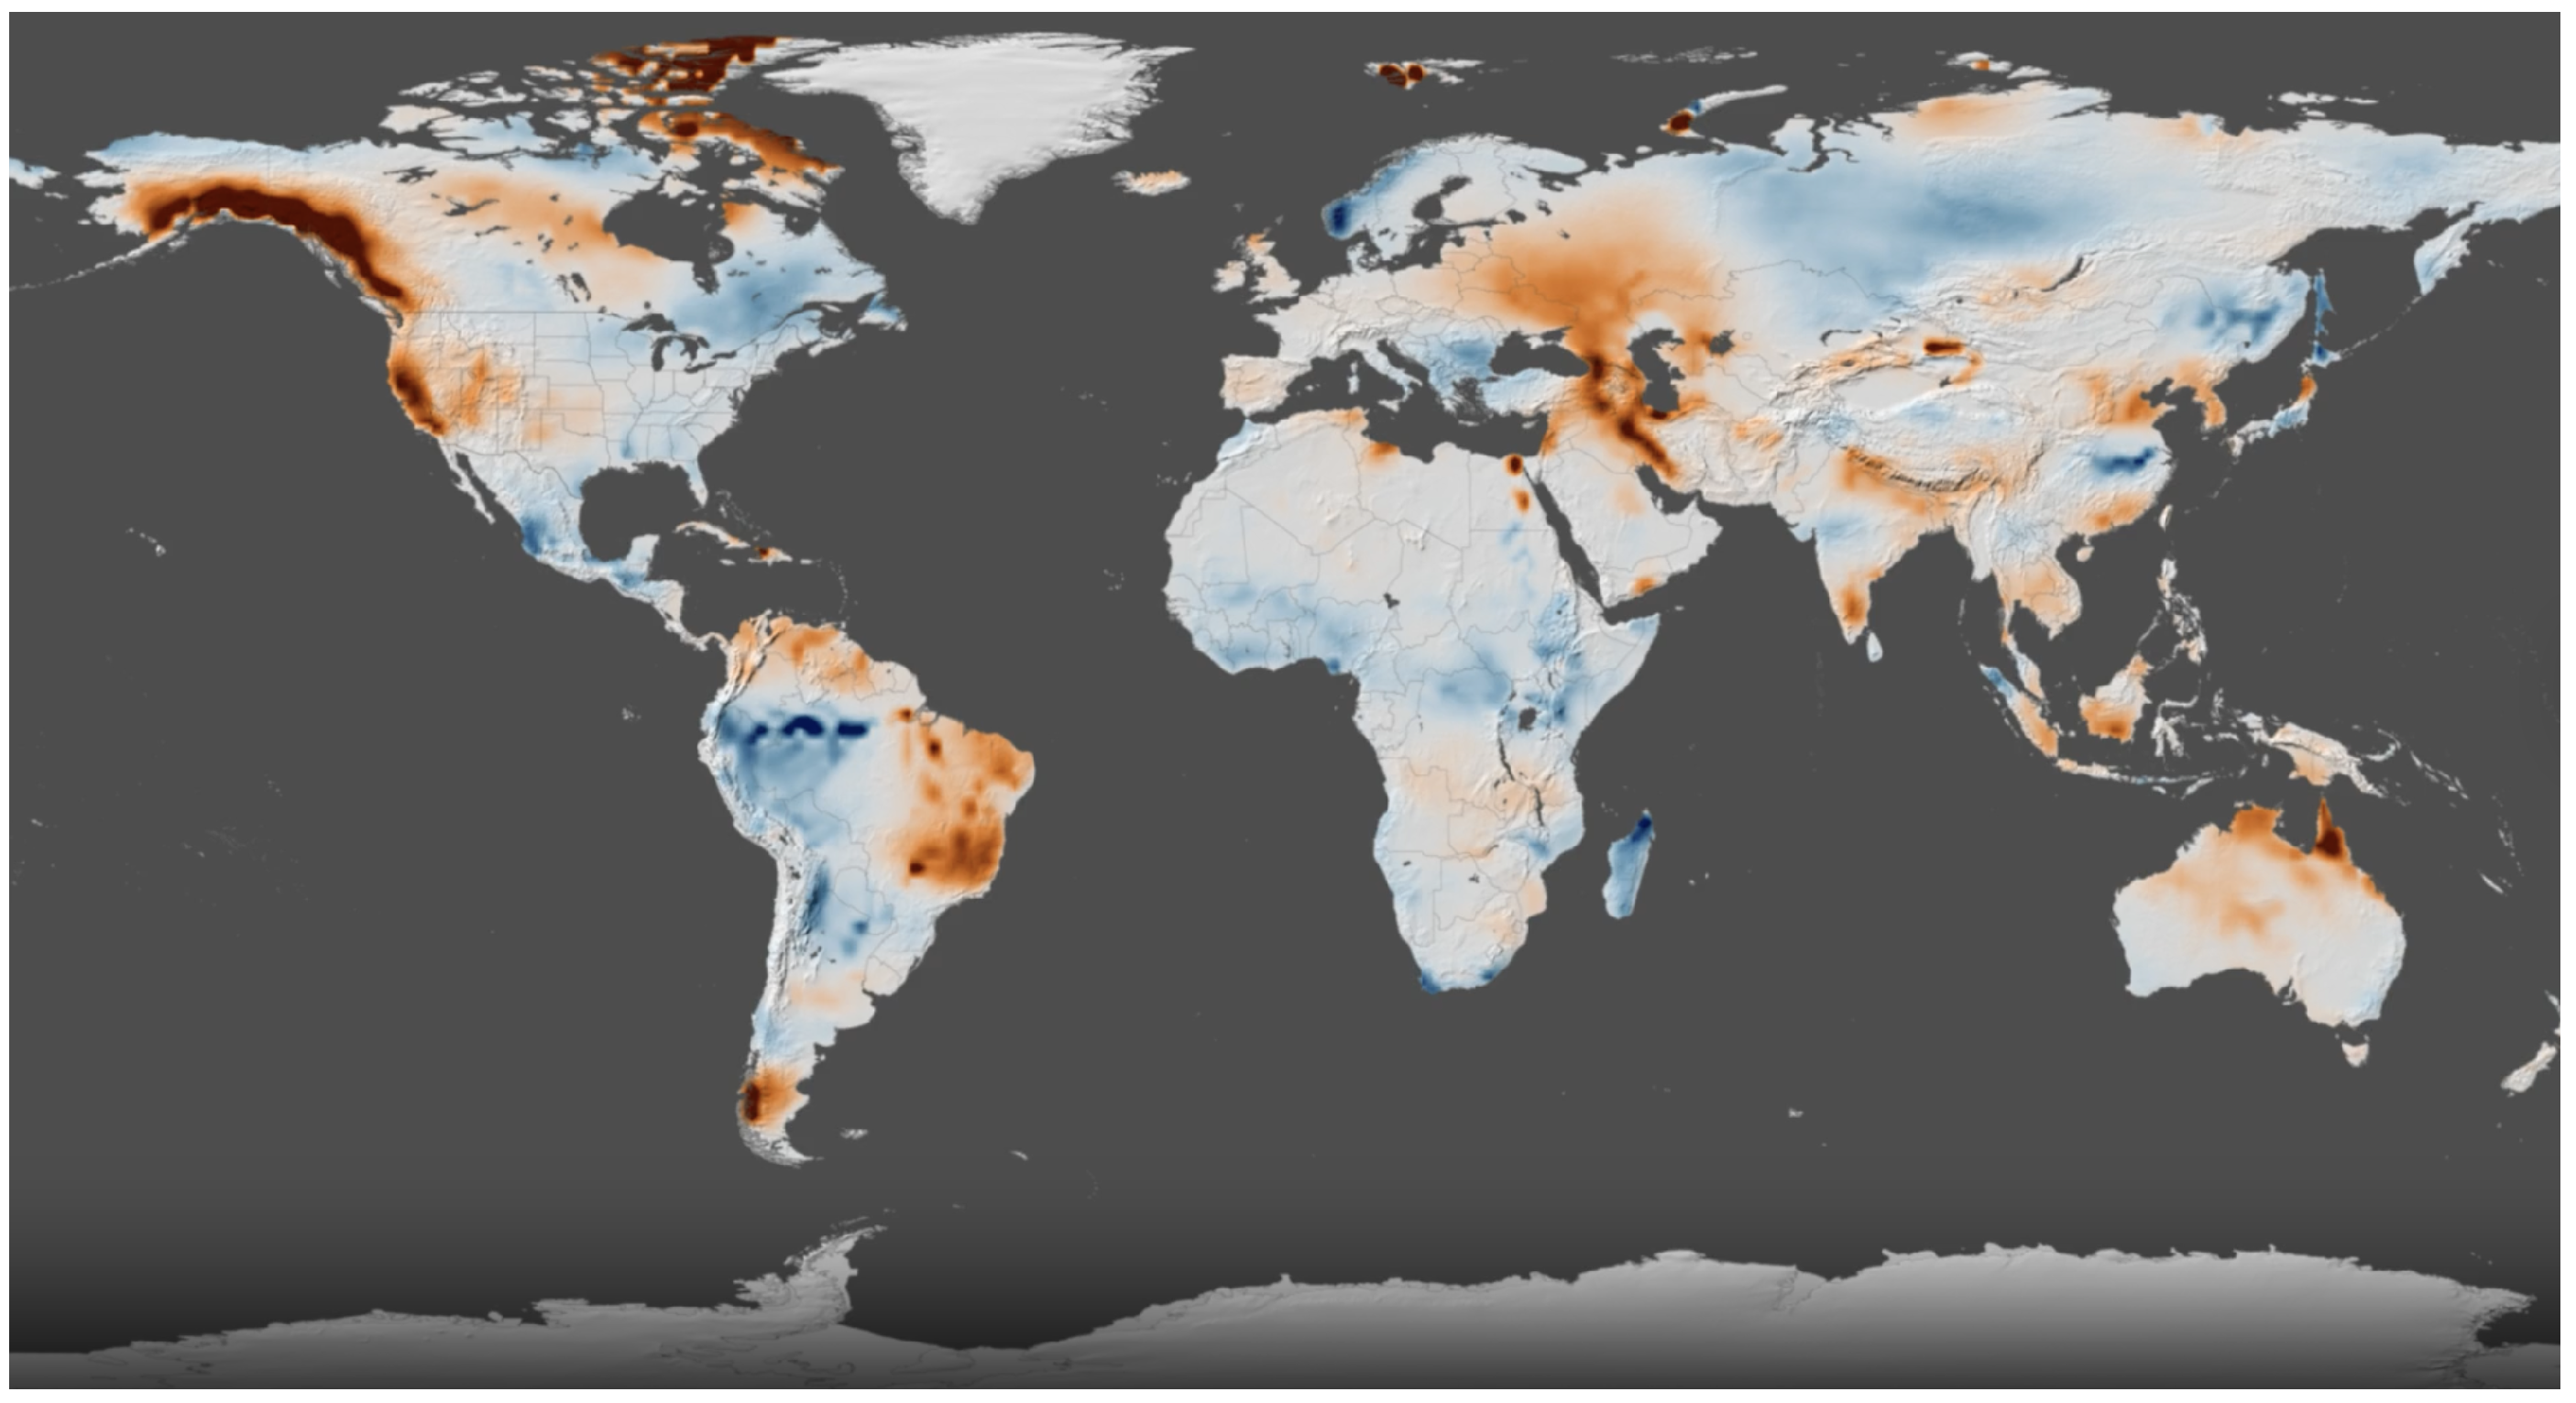
The groundwater applications of GRACE were particularly revolutionary. By comparing current gravity data with a long-term average, scientists can generate anomaly maps, such as
Figure 5, revealing where groundwater storage has been depleted or replenished at continental scales invisible to ground-based monitoring networks. Rodell et al. [
50] used GRACE data combined with modeled soil moisture and surface water to isolate groundwater depletion in India, revealing aquifer depletion rates invisible to the sparse in-situ monitoring network. Famiglietti et al. [
51] applied the same approach to California’s Central Valley. Scanlon et al. [
52] provided ground-referencing of GRACE-derived groundwater storage changes. These studies demonstrated that satellite observations could detect and quantify subsurface water dynamics. Subsequent work has continued to refine GRACE-based groundwater assessment, including multi-method comparisons of satellite-derived and in-situ storage estimates in California’s Central Valley [
53] and open-source web tools for regional GRACE data analysis [
54], a capability that no previous remote-sensing technology had provided. Adams et al. [
10] and Ibrahim et al. [
12] provide comprehensive reviews of how GRACE and complementary RS techniques have advanced groundwater monitoring. Voss et al. [
55] extended GRACE-based groundwater assessment to the Tigris–Euphrates–Western Iran region, revealing depletion rates with direct implications for transboundary water management in the Middle East. Richey et al. [
56] subsequently quantified renewable groundwater stress globally using GRACE, identifying aquifers where extraction rates exceed natural recharge.
GRACE also enabled closure of the water balance equation from space. Lettenmaier et al. [
15] note that, with satellite-based estimates of precipitation (TRMM/GPM), evapotranspiration (MODIS), and total water storage change (GRACE), each major term in the water balance,
, could be independently estimated from orbit. The one missing piece was river discharge (Q), which would have to wait for the SWOT mission. This observation-based closure of the water balance represented a conceptual milestone for the arc: for the first time, satellite observations were not merely feeding into models as one-way inputs but were directly constraining the fundamental accounting equation of hydrology. The possibility of monitoring the global water cycle from space without reliance on ground-based networks was no longer merely theoretical.
4.3. GPM: Global Precipitation from Space
The GPM mission, launched in 2014 as the successor to TRMM, extended satellite precipitation measurement to near-global coverage (65°N to 65°S) with improved sensitivity to light rain and falling snow. The Integrated Multi-satellitE Retrievals for GPM (IMERG) [
58] algorithm merged observations from a constellation of passive microwave and geostationary IR sensors to produce half-hourly precipitation estimates at 0.1-degree resolution, the highest-resolution, most temporally dense global precipitation dataset ever produced from satellites. IMERG would later become a key input to the Google Flood Forecasting system [
59], completing a trajectory along the arc from TRMM’s expert-dependent retrieval algorithms to a satellite precipitation product that feeds directly into AI-based operational prediction.
4.4. Soil Moisture from Dedicated Missions
The SMOS mission, launched by ESA in 2009 [
60], and the SMAP mission, launched by NASA in 2015 [
61], were the first satellites dedicated to measuring soil moisture from space. Both operated at L-band microwave frequencies, which penetrate the top few centimeters of soil and are sensitive to its dielectric properties, and hence its moisture content. SMAP’s active radar instrument ceased functioning in July 2015, limiting the mission’s soil moisture retrieval to approximately 40 km resolution rather than the originally planned 9 km; this limitation has been partially mitigated through multi-mission fusion with SMOS [
62]. These missions provided the first globally consistent, satellite-derived soil moisture products, filling a critical gap in the water balance observation system. Multi-sensor blending efforts [
63,
64] and comprehensive validation campaigns [
65,
66] established the reliability of satellite soil moisture products for hydrologic applications.
4.5. Snow Remote Sensing at Scale
Snow remote sensing advanced on two fronts during this era. Optically, MODIS snow cover products [
43] provided daily global maps of snow-covered area at 500 m resolution, leveraging the strong spectral contrast of snow in visible and shortwave infrared bands. The Normalized Difference Snow Index (NDSI), building on Dozier’s [
67] earlier work, became the standard algorithm. Frei et al. [
68] reviewed the full suite of satellite-derived snow products, and Sturm et al. [
69] articulated the economic and scientific case for global snow monitoring, estimating the annual economic value of snow-derived water at over one trillion dollars globally.
Microwave approaches to snow water equivalent (SWE) estimation, however, remained challenging. Chang et al.’s [
26] passive microwave algorithm provided SWE estimates but with significant uncertainties related to grain size assumptions, vegetation effects, and sub-pixel heterogeneity. Tsang et al. [
11] review the state of the art in high-frequency radar approaches to SWE measurement, arguing that active microwave at X/Ku bands provides the most physically grounded path to high-resolution global SWE mapping, a capability that remains a critical gap in the hydrologic observation system.
4.6. Surface Water Mapping and the Sentinel Revolution
The ESA Sentinel constellation, with Sentinel-1 (SAR, 2014) and Sentinel-2 (optical, 2015), provided the first free, open-access, high-resolution imagery with systematic global coverage and rapid revisit times. For flood mapping, Sentinel-1’s C-band SAR capability, cloud-penetrating, day/night operational, and with 12-day revisit (6 days with both satellites), transformed flood remote sensing from an opportunistic, post-event capability to a systematic, near-real-time monitoring tool. Schumann et al. [
13] document how this transformation represented one of the most consequential breakthroughs in satellite flood monitoring. Operational flood mapping using multi-temporal Sentinel-1 SAR imagery has achieved overall accuracies exceeding 96% in case studies such as the 2017 Bangladesh monsoon floods [
70].
Perhaps the most striking demonstration of what the operational RS infrastructure enabled came from global-scale surface water mapping. Pekel et al. [
71], using three million Landsat images spanning 1984–2015 and processed on Google Earth Engine, mapped the entire planet’s surface water dynamics at 30 m resolution over 32 years, documenting 4.6 million km
2 that exhibited water at some point during the study period, including 115,000 km
2 of new permanent water and 173,000 km
2 of permanent water loss.
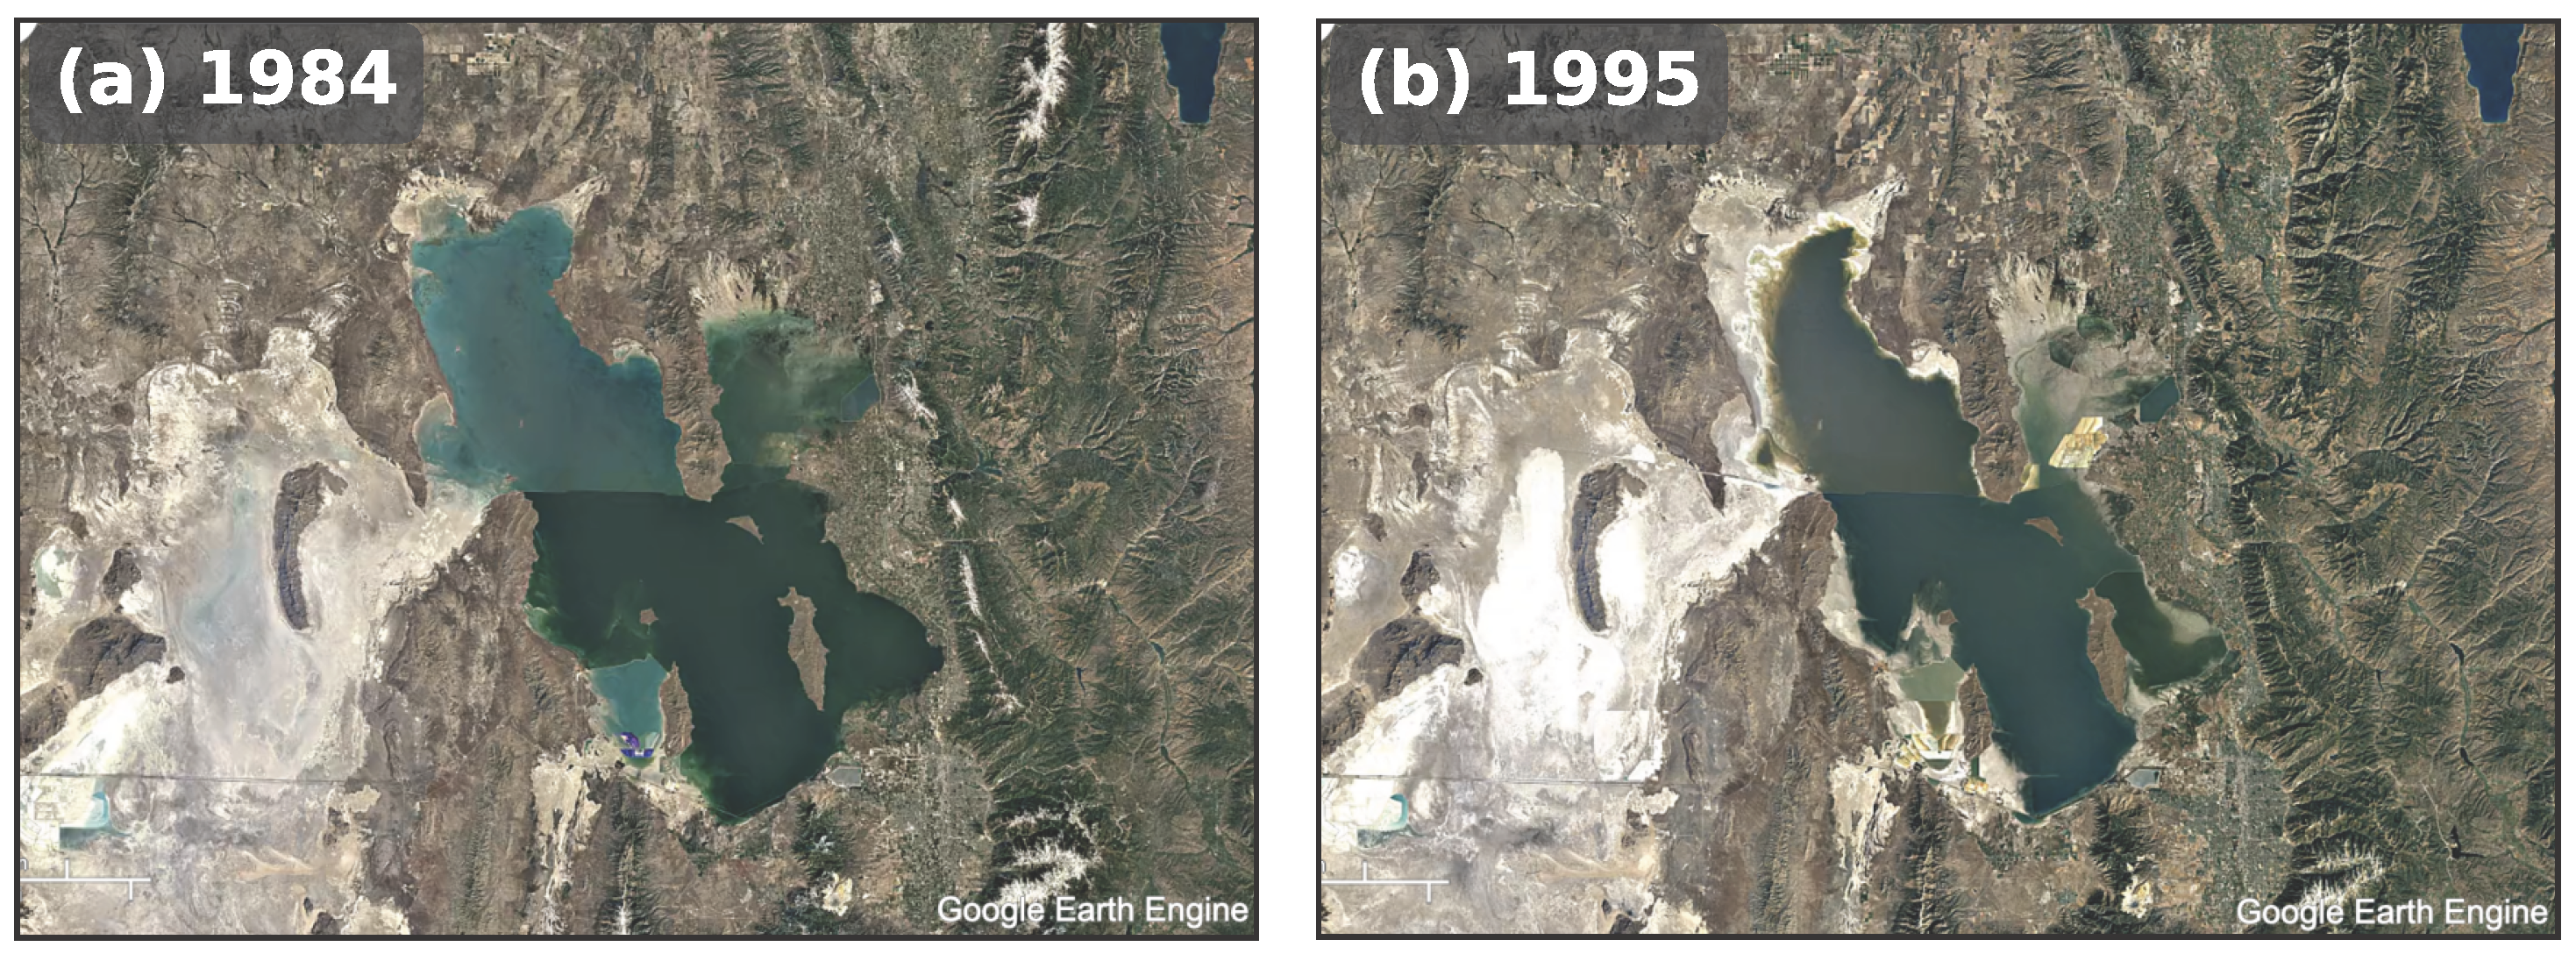
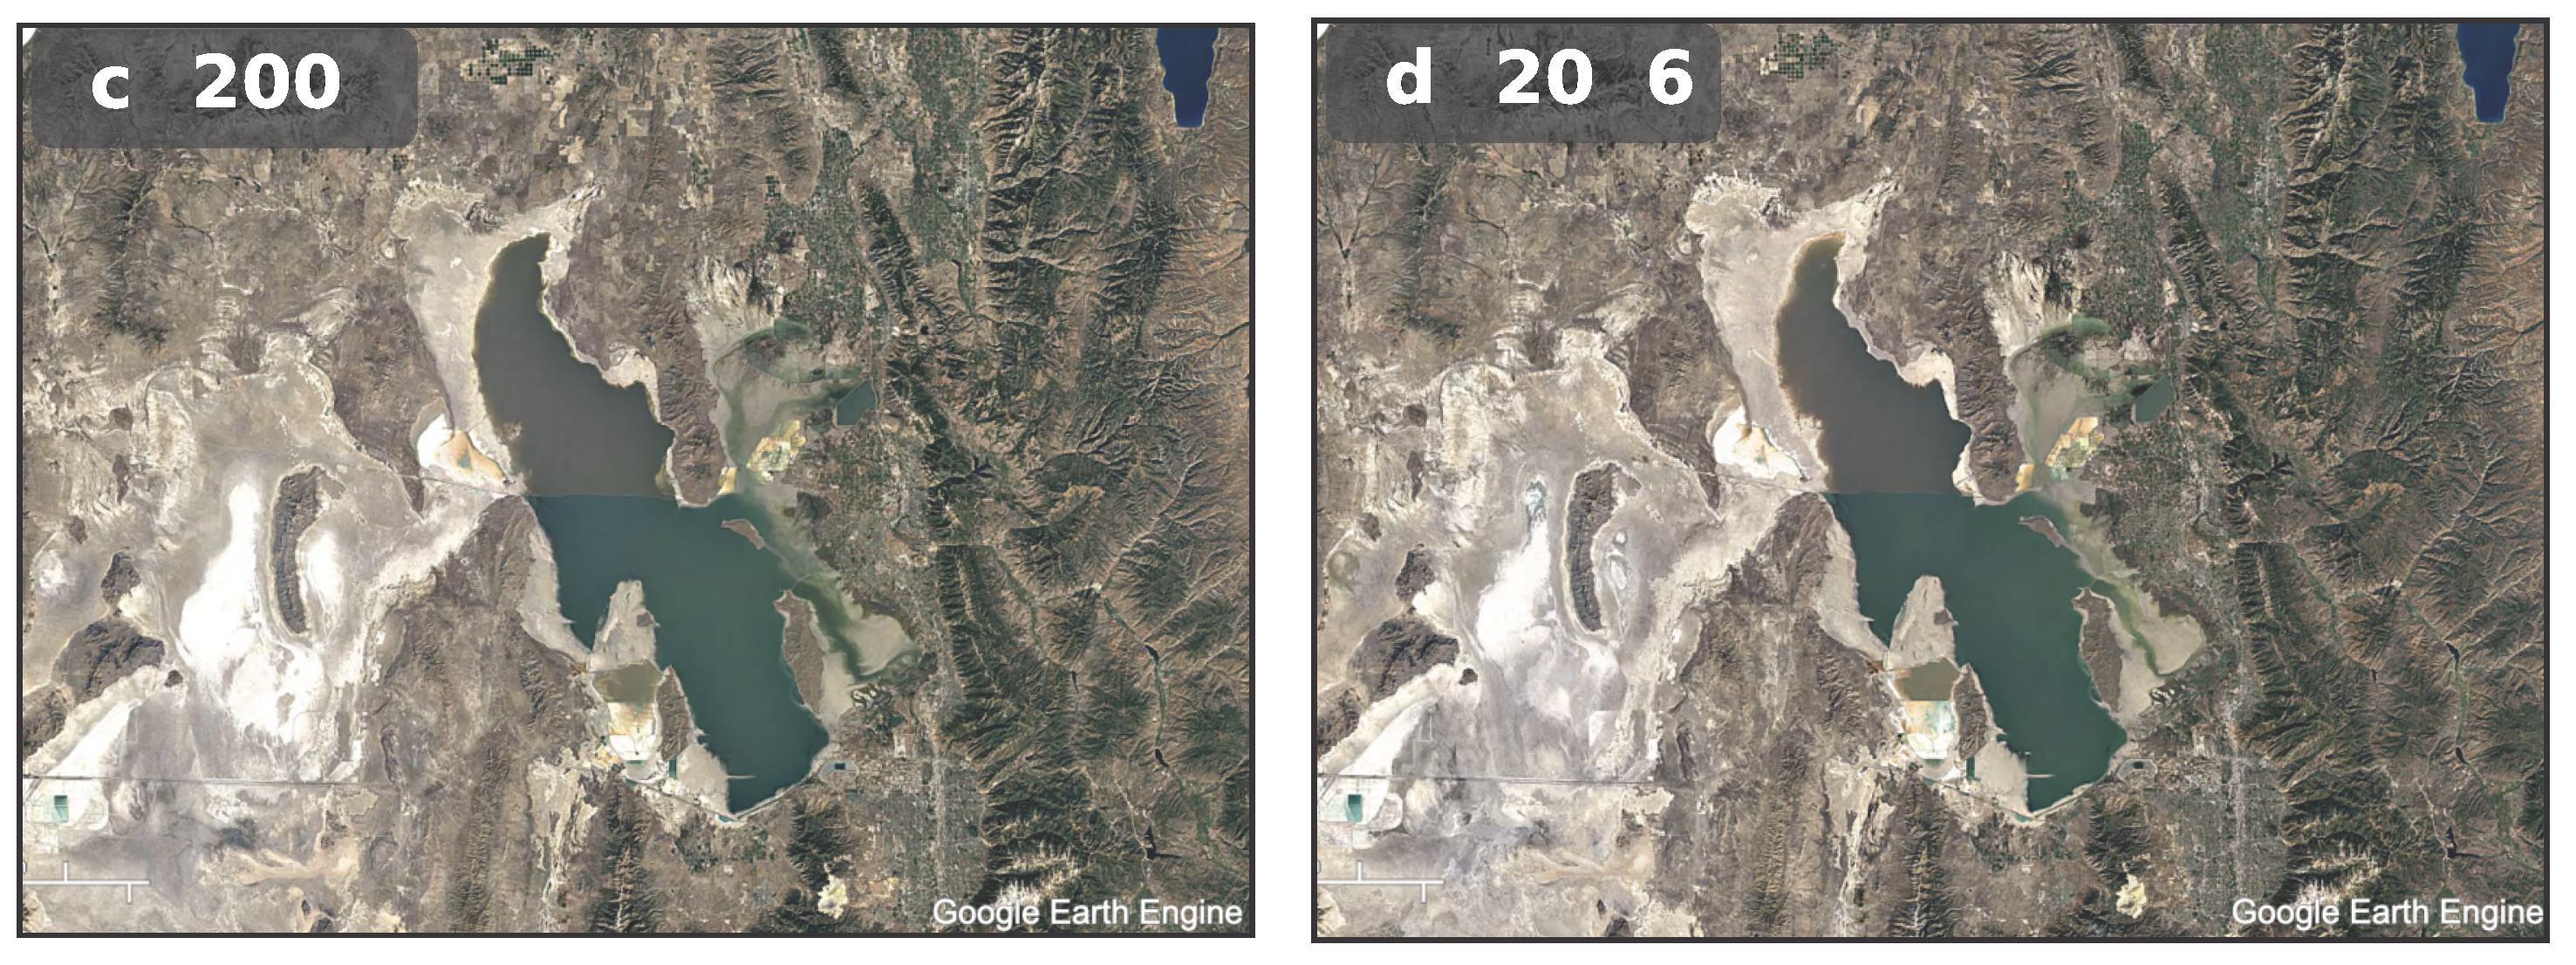
Figure 6 illustrates the power of this dataset at a regional scale: the progressive shrinkage of Great Salt Lake in Utah over three decades reveals the severity of water stress in the western United States in a way that no point measurement or summary statistic can convey. Donchyts et al. [
72] provided a complementary analysis of land-water conversions using the Deltares Aqua Monitor, also on Google Earth Engine (GEE). These studies exemplify a capability that would have been inconceivable a decade earlier: a single research team, using freely available data and cloud computing, could characterize the behavior of every significant water body on Earth.
4.7. Cloud Computing: The Great Equalizer
GEE [
74] deserves special attention in the narrative of this era because it did more than provide computational infrastructure. It changed who could conduct large-scale remote sensing and hydrological analysis. By co-locating a multi-petabyte archive of satellite imagery with high-performance computing accessible through a JavaScript or Python API, GEE eliminated the data download, storage, and processing bottlenecks that had previously restricted planetary-scale analysis to a handful of well-resourced institutions. The global surface water mapping of Pekel et al. [
71], the global forest change mapping of Hansen et al. [
75], and hundreds of hydrologic studies at continental-to-global scales were enabled directly by this platform.
Sheffield et al. [
6] emphasize the equity implications of these developments: for water resources professionals in developing countries, where hydrologic data are sparsest, and management needs most acute, the combination of freely available satellite products and cloud computing platforms represented a major advance. In the language of the arc, GEE and similar platforms (Microsoft Planetary Computer, Amazon Web Services Open Data) removed a friction point between observation and inference: the computational and institutional barriers that had prevented most hydrologists from working directly with satellite data at scale.
4.8. Multi-Source Data Fusion: Combining Observation Modes
A defining characteristic of Era 3 was the maturation of multi-source data fusion, the systematic combination of observations from different sensor types, spectral bands, and orbital geometries to produce water information products superior to any single source. Optical–SAR sensor fusion, for example, has enabled dense surface water time series even through persistent cloud cover [
76]. IMERG exemplifies this approach, merging passive microwave, active radar, and geostationary infrared observations into a unified precipitation product. For groundwater, the combination of GRACE gravimetric observations (providing large-scale mass change) with InSAR surface deformation measurements (providing high-resolution spatial detail) enabled characterization of aquifer systems at scales from individual well fields to continental basins. Neither observation alone could accomplish this [
10]. Multi-sensor blending of soil moisture retrievals from active and passive microwave instruments [
63,
64] produced more reliable long-term records than any single sensor.
For flood mapping, the fusion of Sentinel-1 SAR (cloud-penetrating, day/night) with Sentinel-2 optical imagery (higher spectral information, vegetation context) and Light Detection and Ranging (LiDAR)-derived terrain data enabled rapid, accurate inundation extent mapping even under persistent cloud cover. This trend toward multi-source fusion is accelerating in Era 4, where deep learning models can ingest heterogeneous data streams (optical, SAR, thermal, microwave, and gravimetric) simultaneously, learning complementary information content that hand-crafted fusion algorithms struggle to exploit.
4.9. RS-GIS Integration and Operational Water Management
The operational impact of Era 3’s RS infrastructure depended critically on its integration with GIS platforms and decision-support systems that translated satellite-derived data products into actionable water management information. The Group on Earth Observations Global Water Sustainability (GEOGlOWS) European Centre for Medium-Range Weather Forecasts (ECMWF) Global Streamflow Forecast [
77], built on GIS-native geofabrics and fed by satellite-derived meteorological forcings, provides 15-day streamflow forecasts for every river reach on Earth, information directly consumed by national water agencies for reservoir operations, flood preparedness, and drought early warning. The Tethys Platform [
78] provides a web application framework for deploying GIS-enabled hydrologic decision-support tools that integrate satellite-derived products with local management contexts. Famine Early Warning Systems Network (FEWS NET) routinely combines MODIS-derived vegetation indices, satellite precipitation estimates, and GRACE water storage anomalies within a GIS framework to issue food security and drought alerts for sub-Saharan Africa and other vulnerable regions. These examples illustrate a critical point for the observation-to-inference arc: the value of satellite observations for water resource management has always depended not only on the quality of RS products but also on the GIS and decision-support infrastructure that connect them to management actions. This principle was recognized early in the subsurface domain: Becker [
79] argued that satellite observations of surface expressions of groundwater become most useful when combined with numerical modeling and GIS, and Jha et al. [
80] catalogued six major application areas where RS-GIS integration had advanced groundwater hydrology, from aquifer exploration to recharge estimation and pollution hazard assessment. Their reviews anticipated the tighter RS-GIS coupling that would become standard practice in Era 3 and beyond.
4.10. The Observation-to-Inference Arc in Era 3
By 2015, the coupling between remote sensing and hydrologic inference had tightened dramatically. Data assimilation (continuously updating model states using satellite observations) had become standard practice in operational hydrology [
81,
82]. Satellite precipitation drove real-time flood models. GRACE water storage anomalies constrained continental water balance estimates. MODIS snow products initialized snowmelt forecasts. The relationship was no longer a one-way pipeline (satellite → product → model input) but assimilative: models informed the interpretation of satellite signals (a land surface model is needed to disaggregate a GRACE gravity anomaly into groundwater, soil moisture, and snow components), and satellite observations in turn corrected model states through formal data assimilation. The feedback loop was computational, not physical (the satellite knew nothing of the model), but the analytical distance between observation and inference had narrowed dramatically. Remote sensing had become an operational infrastructure for hydrology, analogous to the role that GIS had assumed for spatial data management. McCabe et al. [
7], called explicitly for a
radical rethinking of hydrological monitoring, sensing that the current paradigm, while powerful, was approaching the limits of what the traditional observation → retrieval algorithm → data product → model input architecture could deliver.
5. Machine Learning, AI, and the Merger of Observation and Inference (2015–Present)
The fourth era represents the culmination of the observation-to-inference arc: the merger of observation and inference into a single computation. Several new and updated systems were deployed during this period, including SWOT, Gravity Recovery and Climate Experiment Follow-On (GRACE-FO), Ice, Cloud, and Land Elevation Satellite 2 (ICESat-2), and CubeSat constellations, significantly advancing observational capability. However, what distinguishes this era from the third is not primarily new satellite missions, but a fundamental change in how satellite data are used. Deep learning has begun to collapse the multi-step pipeline of retrieval algorithms, data products, and process-based models that characterized the first three eras, replacing it with end-to-end systems that predict hydrologic variables directly from raw or lightly processed satellite observations.
5.1. The LSTM Paradigm Shift
A series of papers from the Kratzert-Nearing group laid the intellectual foundation for this era, demonstrating that deep learning could outperform calibrated process-based hydrologic models at their own core task: predicting streamflow from meteorological inputs.
Kratzert et al. [
83] provided the first systematic application of LSTM networks to rainfall-runoff modeling, testing on 241 Catchment Attributes and Meteorology for Large-sample Studies (CAMELS) catchments against Sacramento Soil Moisture Accounting (SAC-SMA) + Snow-17, the U.S. operational benchmark. The LSTM achieved competitive performance without any physical equations, learning to capture long-term hydrological storage effects, such as snow accumulation, soil moisture dynamics, and groundwater memory, through its cell memory architecture. Machine learning has also been applied to extend sparse groundwater monitoring networks using Earth observation data as predictive inputs [
84]. Kratzert et al. provided a hydrological interpretation of the LSTM cell state as an analog to catchment storage, demonstrating that the network’s internal representations corresponded to physically meaningful quantities.
Kratzert et al. [
85] delivered a paradigm-breaking result. A single Entity-Aware LSTM (EA-LSTM), trained on 531 CAMELS basins simultaneously, significantly outperformed both regionally calibrated and individually calibrated process-based models, including SAC-SMA, Variable Infiltration Capacity (VIC), FUSE, Hydrologiska Byrans Vattenbalansavdelning (HBV), and mesoscale Hydrologic Model (mHM). The EA-LSTM used 27 static catchment attributes, many derived from satellite products (elevation from SRTM, vegetation from MODIS, climate from satellite-merged datasets), to differentiate catchments via an input-gate conditioning mechanism. The critical implication was that data-driven models improved with more diverse training basins, while traditional models degraded with regional calibration. This inverted the conventional wisdom that hydrologic models perform best when calibrated to individual catchments, and it suggested that the observation record contained transferable hydrological information that traditional approaches had failed to extract.
Nearing et al. [
86] provided a philosophical counterpart, opening with Kelvin’s
Two Clouds speech and Beven’s (1987) call for a paradigm shift. Their core argument was provocative: the success of deep learning models demonstrated that scale-relevant theories of watershed behavior could have been derived from existing observational data, but the hydrology community had failed to discover them. The regularization imposed by process-based models, including their mathematical structure, parameter constraints, and built-in assumptions, was not protecting against overfitting but was, in fact, a bad theory that limited predictive performance. The implication for the observation-to-inference arc is clear: the multi-step pipeline of retrieval algorithms, data products, and process-based models that characterized Eras 2 and 3 was, in at least some cases, actively degrading the information content of the satellite observations it processed. This result marked the inflection point of the arc: the moment when collapsing the distance between observation and inference became not just possible but potentially superior to maintaining it.
5.2. From Research to Operations: Google Flood Forecasting
The transition from research to operations happened fast. Nevo et al. [
59] described Google’s end-to-end flood warning system, deployed during the 2021 monsoon season across India and Bangladesh, covering 470,000 km
2 and reaching over 350 million people. The system’s four-subsystem architecture, data validation, LSTM-based stage forecasting, inundation modeling, and alert distribution, used IMERG satellite-derived precipitation as a key input, creating a direct RS-to-operational-prediction pipeline that sent over 100 million flood alerts during its first operational season.
The Google flood system is the clearest current example of what the observation-to-inference arc has been trending toward for the past six decades. Satellite precipitation observations (IMERG) feed directly into a machine learning model (LSTM) that produces an operational hydrologic prediction (flood stage and inundation extent) distributed as actionable intelligence to vulnerable populations, with no traditional retrieval algorithm or process-based hydrologic model anywhere in the pipeline. The observation-to-inference coupling is essentially complete.
5.3. SWOT: Closing the Water Balance from Orbit
The SWOT mission, launched in December 2022, represents the culmination of decades of work toward measuring river discharge from space. Unlike previous radar altimeters that measured water surface elevation along a narrow ground track, SWOT’s Ka-band Radar Interferometer (KaRIn) measures two-dimensional water surface elevation and slope across a 120 km swath, enabling estimation of river discharge through hydraulic relationships without requiring in-situ gauge data.
Andreadis et al. [
87], in the first comprehensive assessment of SWOT’s river discharge estimation capability, evaluated measurements across 654 river reaches globally during the first 15 months of operation (March 2023–July 2024). The results demonstrate that SWOT can estimate discharge for rivers wider than approximately 100 m, which is the minimum width for which official SWOT discharge products are generated. For approximately two-thirds of global river reaches, discharge accuracy is better than 30%, with temporal variations captured within about 15%. Early comparisons with in-situ gauges show a median correlation of 0.73 but also a median magnitude bias of approximately 50%, indicating that the technology is still maturing. Despite these limitations, SWOT represents a historic milestone: for the first time, large river discharge across the global domain can be estimated from space without ground-based infrastructure. Complementary work has addressed the challenge of predicting when satellite acquisitions coincide with flood events, enabling more systematic flood map synthesis [
88]. Combined with satellite precipitation (GPM/IMERG), evapotranspiration (MODIS, GLEAM), and total water storage (GRACE-FO), the water balance equation
can now, in principle and for large water systems, be closed entirely from orbit. SWOT thus demonstrates that the observational foundation for satellite-derived hydrologic inference is now substantially in place for large water systems, even as ground-based discharge measurements remain valuable for calibration, validation, and coverage of smaller rivers.
5.4. Deep Learning Meets Earth Observation
Shen [
89] provided the first comprehensive bridge between the deep learning and water resources communities, reviewing Deep Learning (DL) architectures (Convolutional Neural Networks (CNNs), LSTMs, autoencoders) and mapping them onto four categories of hydrologic applications: extracting hydrologic variables from remote sensing, dynamic hydrologic modeling, learning complex data distributions, and generating synthetic data. Shen’s review coincides with the water resources community’s beginning to take deep learning seriously as more than a niche technique.
Reichstein et al. [
90] articulated the conceptual framework that has since guided much of the field: deep learning should not replace process understanding but augment it through hybrid approaches that couple physical models with learned components. Their five identified challenges, interpretability, physical consistency, complex/uncertain data, limited labels, and computational demand, remain the field’s active research frontiers. The framework they articulated maps directly onto the AI vision we present in
Section 6: physics-informed approaches operate at Levels 2–3, while the aspiration to fully learned Earth system models points toward Level 4.
5.5. CubeSats and Commercial Constellations
The Era 4 observational landscape also differs from its predecessors in how data are acquired. Commercial CubeSat constellations, led by Planet Labs, now provide daily global imagery at 3–5 m resolution [
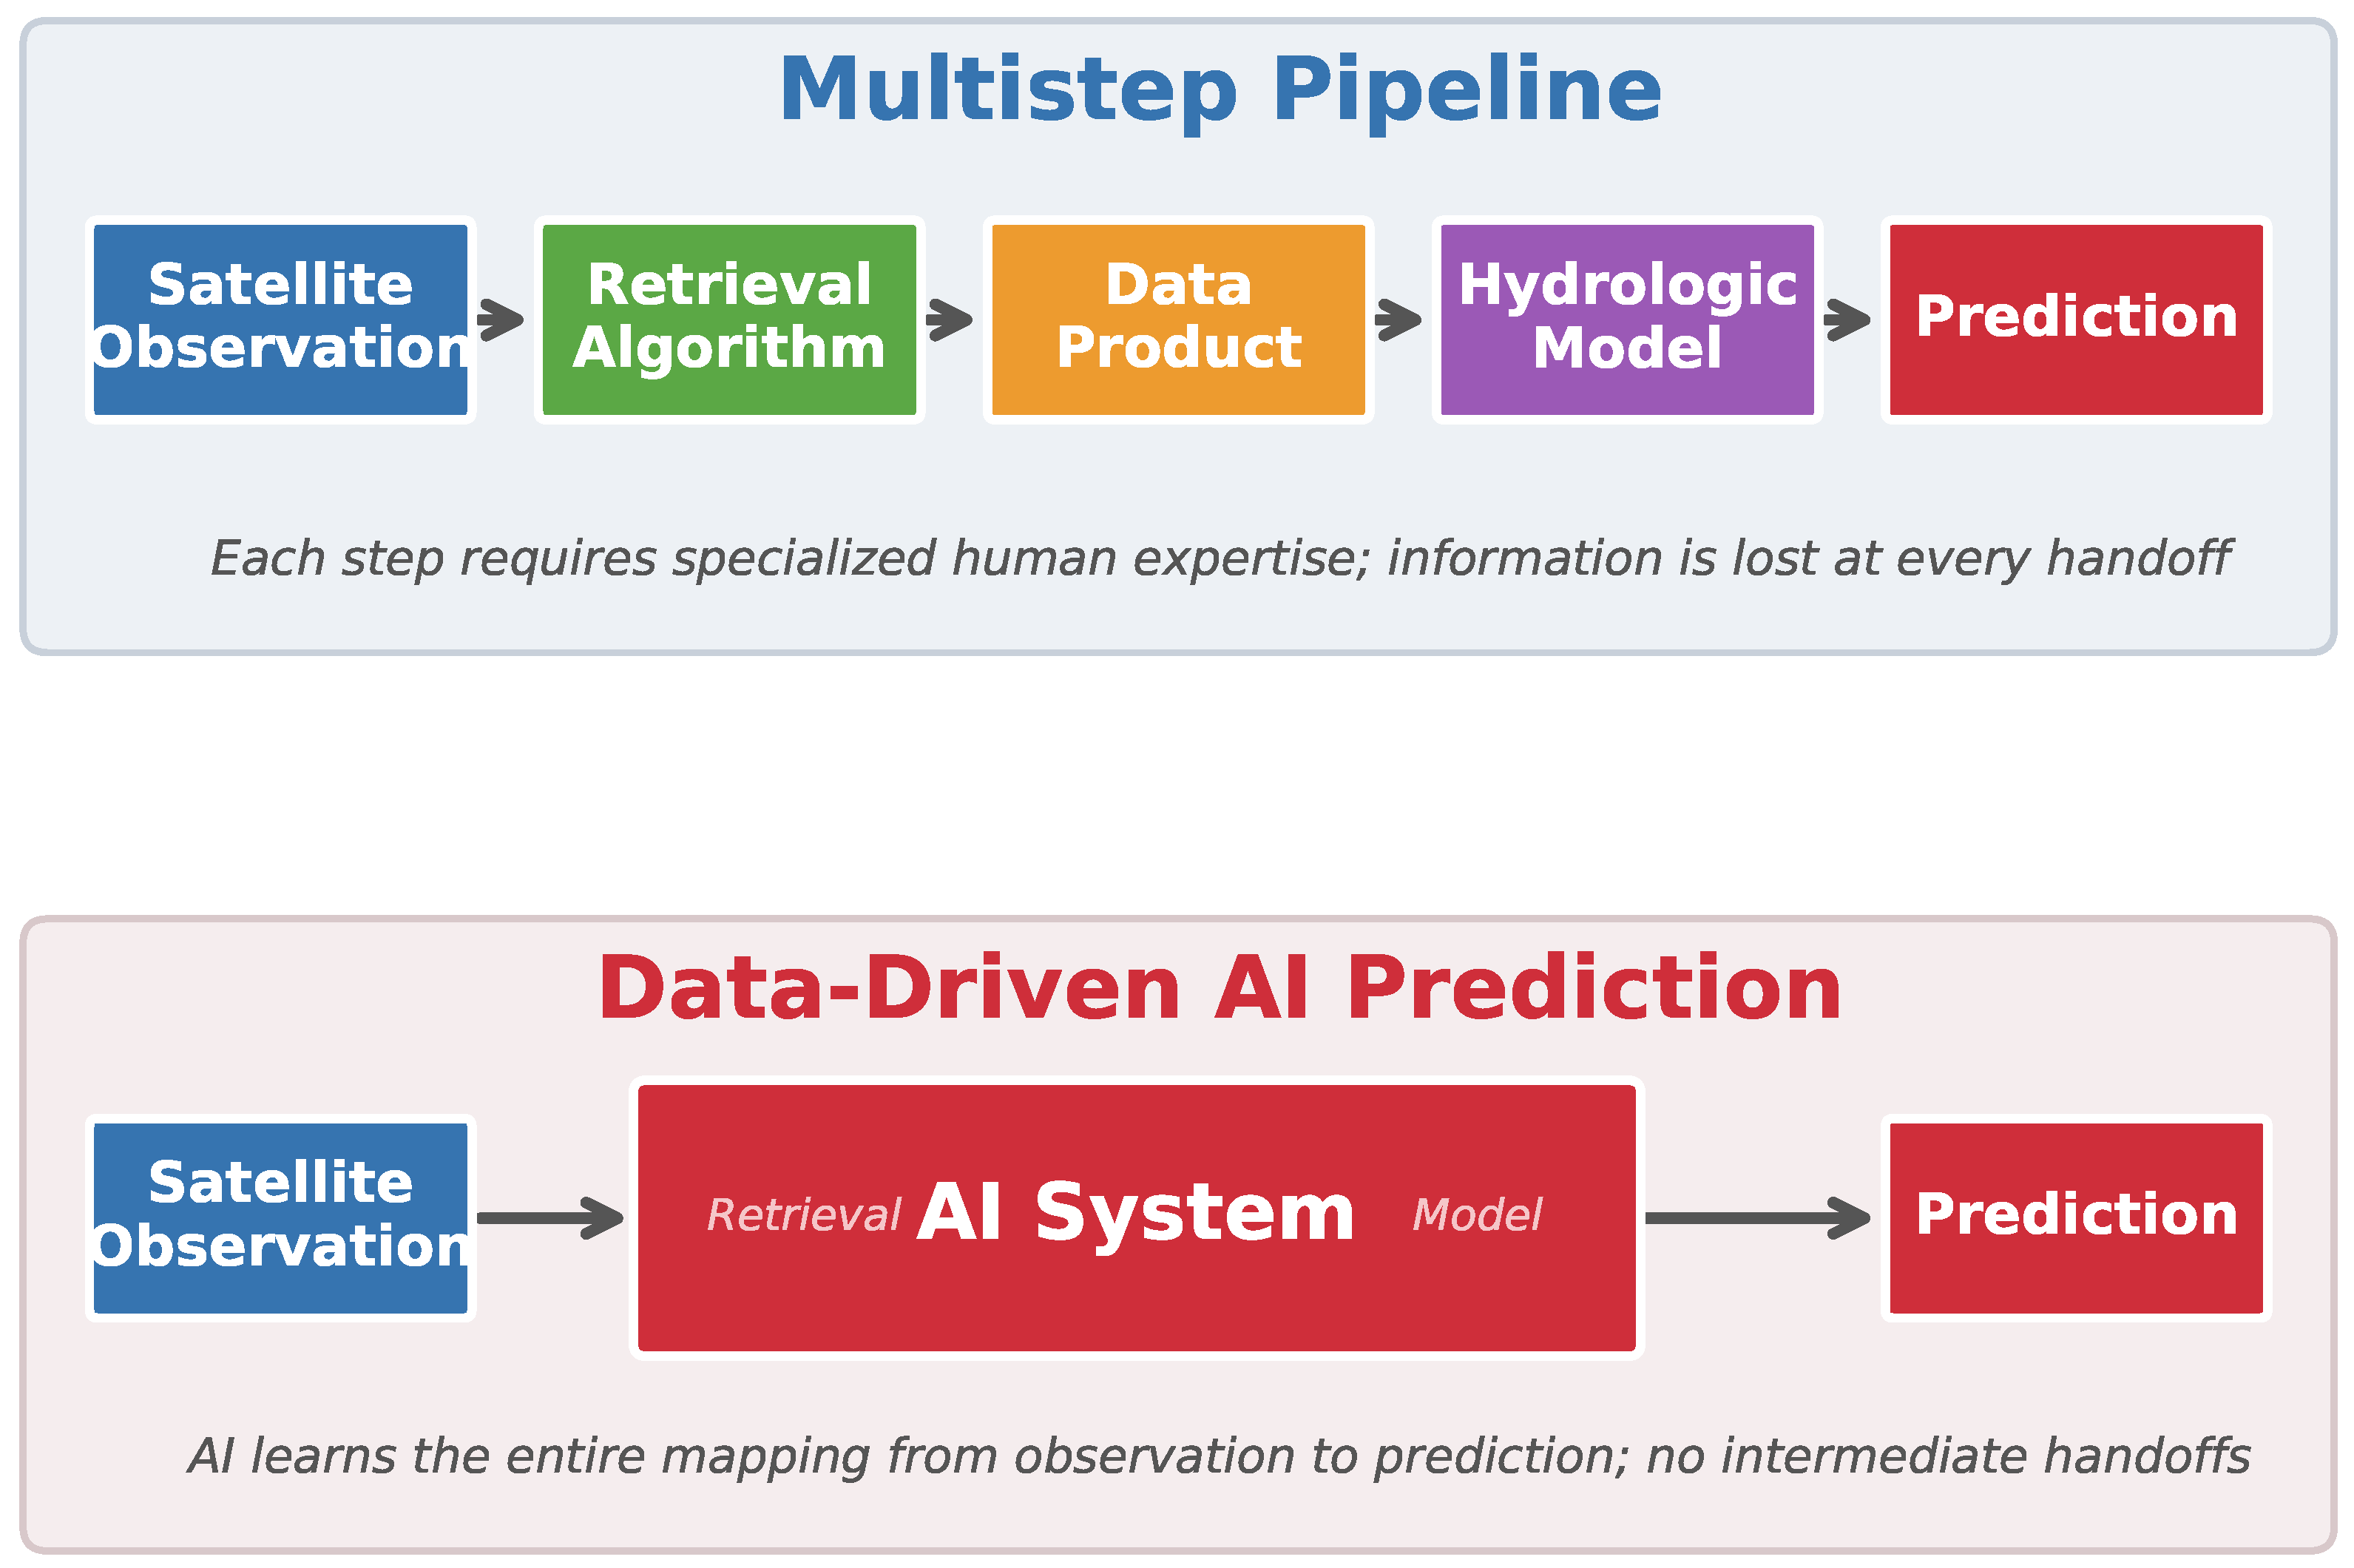
7], enabling monitoring of rapid phenomena such as flood progression, reservoir filling, and irrigation withdrawals that 16-day Landsat revisits miss entirely. The resulting data volumes, however, exceed human analytical capacity, creating a self-reinforcing dynamic along the arc: the explosion of observation drives the need for AI-based inference, which in turn makes the observations more valuable by extracting hydrologic meaning at a pace no human team could match. This dynamic is driving a fundamental shift in how remote sensing and hydrology are practiced: the traditional multistep pipeline that has served the community for decades is giving way to integrated, data-driven AI approaches that collapse the entire chain from satellite observation to hydrologic prediction (
Figure 7).
5.6. International and Multinational Water Observation Initiatives
The tightening of the observation-to-inference arc in Era 4 is not confined to any single nation or agency. The European Commission’s Destination Earth (DestinE) initiative, implemented by ECMWF, ESA, and EUMETSAT, is constructing digital twins of the Earth system that assimilate satellite observations directly into high-fidelity climate and weather models [
91]. This is a direct institutional embodiment of the arc’s trajectory from observation to inference. Japan’s GCOM-W satellite and co-leadership of the GPM mission provide critical microwave observations of the global water cycle, while JAXA’s Today’s Earth system integrates these observations into global hydrological simulations. China’s Gaofen constellation delivers high-resolution SAR and hyperspectral imagery increasingly coupled with deep learning for flood detection and inland water monitoring. India’s Water Resources Information System (India-WRIS) fuses satellite-derived precipitation, soil moisture, and reservoir storage with ground telemetry for operational water management, and the jointly developed NASA-ISRO NISAR mission extends L/S-band SAR coverage for soil moisture and wetland hydrology. At the multinational scale, the GEO Global Water Sustainability initiative (GEOGLOWS) [
77], hosted at ECMWF, now delivers 15-day streamflow forecasts for seven million river reaches worldwide—a system that would be inconceivable without the satellite observation infrastructure built across the preceding eras. Collectively, these initiatives demonstrate that the coupling of satellite observation and hydrologic inference is accelerating across institutional and geographic boundaries.
5.7. The Observation-to-Inference Arc in Era 4
As
Figure 7 illustrates, the transition from the multistep pipeline to data-driven AI prediction represents the central methodological transformation now underway. The observation-to-inference arc has reached its tightest coupling yet. Deep learning systems trained on satellite archives learn to predict hydrologic variables such as streamflow, flood extent, and water storage changes directly from raw or lightly processed imagery, bypassing the chain of retrieval algorithms, data products, and process-based models. Observation and inference are merging. LSTMs predict streamflow from meteorological forcings, including satellite-derived precipitation. The Google flood system converts IMERG rainfall estimates into operational flood alerts. Foundation models pre-trained on satellite imagery can be fine-tuned for any downstream hydrologic task. The boundary between
what the satellite sees and
what the hydrologist knows is dissolving.
6. Toward AI-Native Earth Observation for Water Intelligence
The trajectory described in
Section 2,
Section 3,
Section 4 and
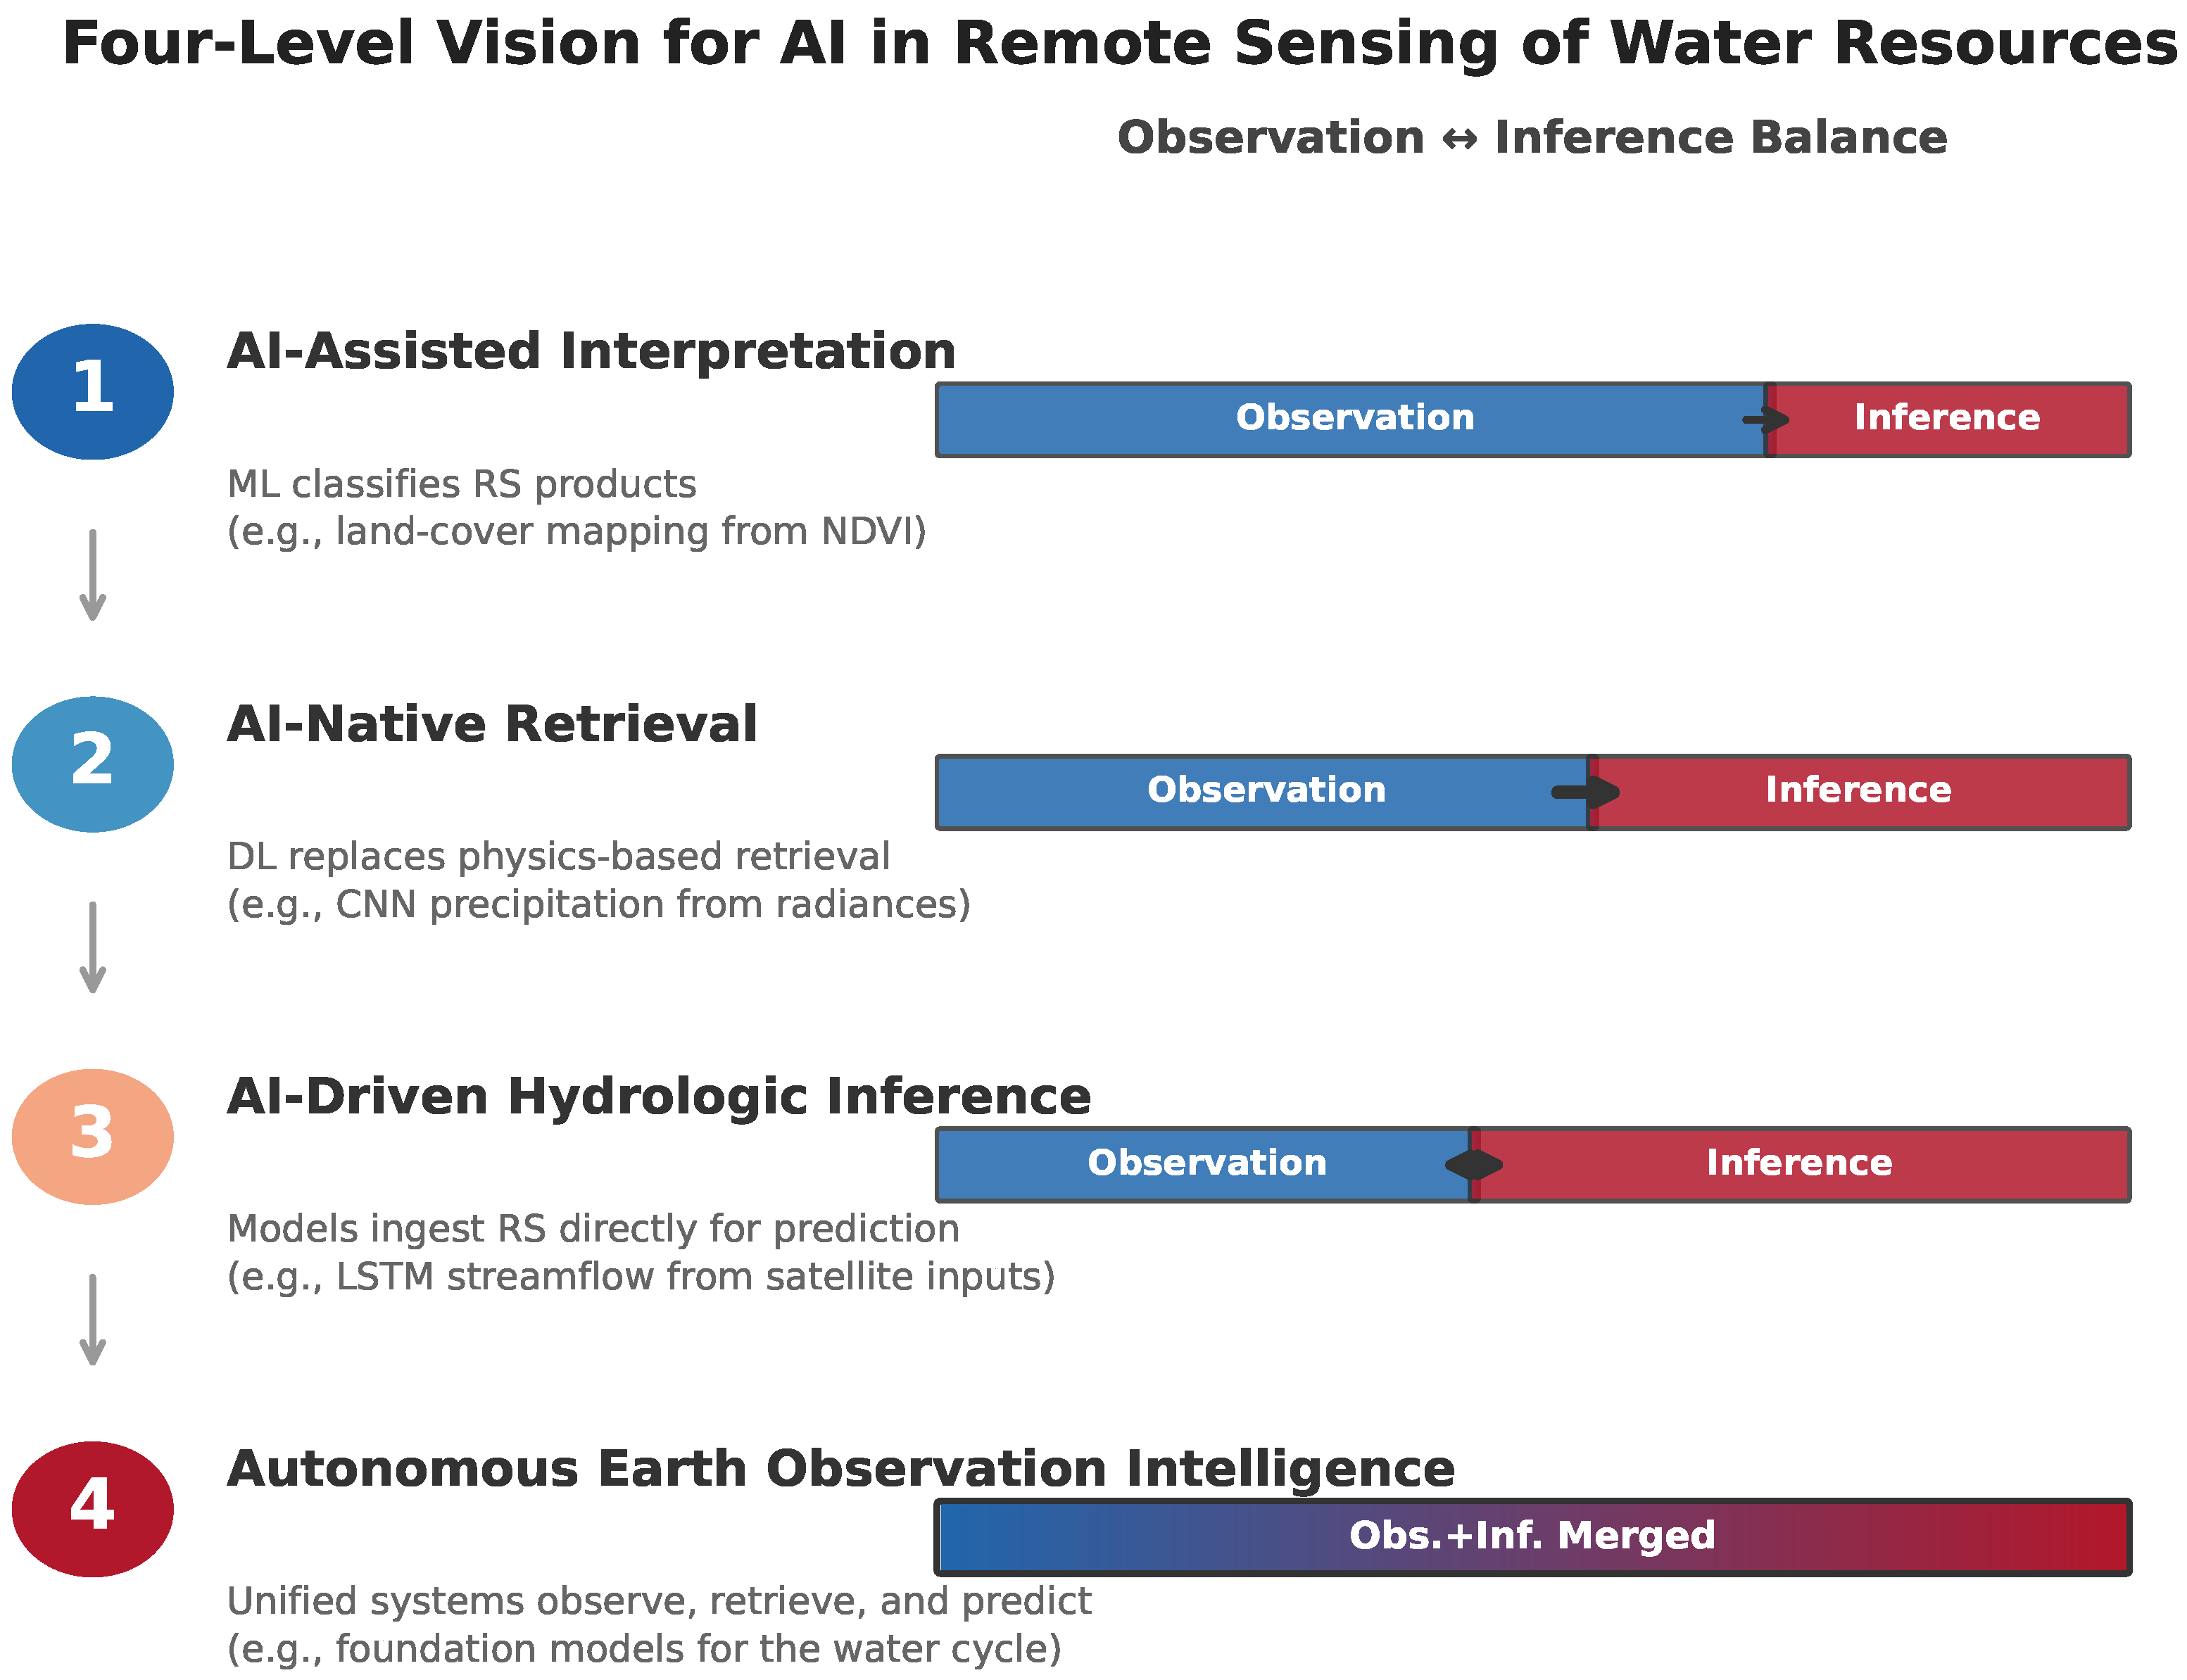
Section 5 points toward a future in which the distinction between observing the water cycle and understanding it gradually dissolves. The four-level vision presented below describes a research trajectory, not a predetermined outcome. Levels 1 and 2 reflect current operational practice and near-term trends supported by published results. Levels 3 and 4 represent the direction suggested by the observation-to-inference arc: increasingly tight coupling between what satellites observe and what hydrologists infer. Whether and when fully autonomous Earth observation intelligence (Level 4) becomes reality remains an open research question; the vision is offered as a framework for understanding where the arc may lead, not as a prediction of where it must go.
Figure 8 illustrates the four-level vision for the future of AI in remote sensing of water resources, showing the progressive shift from observation-dominated to inference-dominated computation.
6.1. Level 1: AI-Assisted RS Interpretation
At the first level, the established workflow of satellite acquisition, application of the retrieval algorithm, and data product generation remains intact, but AI assists at each step. Automated cloud masking, atmospheric correction, and quality flagging reduce the burden of manual preprocessing. Machine learning classifiers delineate water bodies, identify flooded areas, and detect change more rapidly and consistently than manual or rule-based approaches. Google’s Dynamic World land cover product [
92], which provides near-real-time, global land cover classification from Sentinel-2 imagery using a deep learning model, exemplifies this level. The retrieval algorithms and data product architectures remain human-designed; AI accelerates their execution and extends their applicability.
The barrier this level removes is the expertise barrier: the specialized knowledge required to process raw satellite imagery into usable hydrologic information. A water resources professional who lacks remote sensing training can access AI-processed products without understanding the underlying radiometry, atmospheric physics, or sensor calibration.
6.2. Level 2: AI-Native Retrieval Algorithms
At the second level, AI replaces the hand-crafted retrieval algorithms that have defined the satellite-to-data-product pipeline since Era 2. Rather than developing physics-based or empirical band-ratio algorithms for each variable (ET, water quality, SWE, soil moisture), machine learning models learn the retrieval function end-to-end from paired satellite observations and ground truth measurements. The algorithm is the AI model.
Current examples include Machine Learning (ML)-based evapotranspiration estimation that replaces hand-tuned energy balance models, deep learning water quality retrieval that replaces empirical band ratios, and neural network precipitation estimation from satellite microwave brightness temperatures. Li et al. [
9] document the growing adoption of ML for water quality retrieval, noting that learned models often outperform empirical and semi-analytical approaches, particularly for complex, multi-parameter retrieval problems. Shen [
89] highlights precipitation estimation from deep stacked denoising autoencoders as an example of end-to-end learned retrieval.
This level removes the retrieval algorithm bottleneck: the years of specialized effort required to design, calibrate, and validate a new retrieval algorithm for each sensor, variable, and region. AI-native retrieval generalizes across sensors and geographies, learning from data patterns rather than from hand-coded physical relationships.
6.3. Level 3: AI-Driven Hydrologic Inference from RS
At the third level, AI systems trained on massive satellite archives directly predict hydrologic state variables and fluxes (discharge, flood extent, groundwater change, drought severity) from raw or lightly processed RS data, bypassing both traditional retrieval algorithms and traditional hydrologic models. The Kratzert-Nearing LSTM trilogy serves as the intellectual foundation for this level. Google’s flood forecasting system [
59] is its most operationally mature example.
The distinction between Level 2 and Level 3 is consequential. Level 2 replaces the retrieval algorithm while preserving the data-product-to-model-input architecture: AI produces a better ET estimate, which still feeds into a separate hydrologic model. Level 3 aims to collapse the entire pipeline: AI learns increasingly direct mappings from satellite observations to hydrologic predictions, reducing or potentially eliminating the need for separate retrieval algorithms and process-based models. Current systems at this level, such as Google’s flood forecasting platform, still incorporate significant domain knowledge and physics-based constraints, but they demonstrate the direction of the trajectory: observation and inference moving toward a single, tightly coupled computation.
This level removes the model intermediary: the requirement that satellite observations pass through a process-based hydrologic model before becoming actionable hydrologic intelligence.
6.4. Level 4: Autonomous Earth Observation Intelligence
At the fourth and most ambitious level, the trajectory of the observation-to-inference arc suggests the possibility of AI agents that autonomously select, acquire, process, and reason over satellite observations to generate actionable water management intelligence with minimal human intervention. At this level, the AI would not merely process satellite data; it would determine what to observe, how to process it, and what it means. No system operates at this level today, and significant scientific and engineering challenges remain, but the direction of progress from Levels 1 through 3 points toward this convergence.
Geospatial foundation models are large-scale neural networks pre-trained on massive, unlabeled satellite archives and fine-tuned for specific downstream tasks. These represent the architectural precursor to Level 4. Hsu et al. [
93] evaluate NASA-IBM’s Prithvi foundation model, pre-trained on Harmonized Landsat-Sentinel 2 (HLS) imagery with six spectral bands and temporal sequence processing capability. Unlike task-specific models, foundation models can be rapidly adapted for any downstream application, such as flood mapping, water body delineation, crop stress detection, and snow cover classification, with minimal additional labeled data. The shift from task-specific ML to general-purpose geospatial AI mirrors the broader trajectory of AI from narrow to general capability.
At the convergence point of the observation-to-inference arc, Level 4 envisions AI agents reasoning simultaneously over satellite observations and geospatial data structures, not as separate data sources requiring different software tools, but as a unified information space. LLM-based multi-agent systems could, in principle, autonomously query, interpret, and act on satellite-derived forcings to generate decision-ready streamflow intelligence. In this scenario, the human user specifies a water management question in natural language; the AI system determines what data to access, how to process it, and what the results mean. Whether such systems can achieve the reliability, interpretability, and uncertainty quantification required for operational water management remains to be demonstrated.
This level would remove the human-in-the-loop: the requirement that expert practitioners mediate between raw observations and actionable intelligence through specialized software. Whether and when this is desirable—given the importance of physical interpretability and the societal consequences of water management decisions—is itself an open question that the community will need to address alongside the technical challenges.
6.5. The Convergence
The observation-to-inference arc described in this review does not exist in isolation; it parallels the broader coupling of geospatial information systems with hydrologic models that has occurred over the same six decades. At Levels 3 and 4, these parallel arcs converge. An AI system that reasons directly over satellite imagery to predict streamflow simultaneously does the work of a remote sensing specialist (interpreting the imagery), a GIS specialist (organizing the spatial data), and a hydrologic modeler (computing the prediction). The three disciplines that evolved separately over six decades are merging into a single computational paradigm.
7. Discussion
7.1. The Observation-to-Inference Arc as an Organizing Lens
The evolution from Barnes and Bowley’s manual snow mapping to Google’s automated flood forecasting can be read as a single extended process of tightening the coupling between what satellites observe and what hydrologists infer. Each era moved the field one step closer to eliminating the boundary between remote sensing and hydrologic modeling: from RS as illustration to RS as data source to RS as operational infrastructure to RS as intelligence substrate. This framing invites a retrospective reinterpretation of what might otherwise seem like a series of independent technological advances: SEBAL, GRACE, IMERG, LSTMs, and foundation models. Each is, in this view, a step in a continuous convergence.
The framing also has predictive value. Under this lens, the most promising near-term advances are those that further reduce the translation cost between satellite observations and hydrologic inference: physics-informed ML architectures that encode conservation laws while learning from satellite data, foundation models pre-trained on multi-decadal observation archives, and agent frameworks with genuine domain understanding of water systems.
7.2. Persistent Challenges
Several challenges cut across all four eras and remain unresolved.
7.2.1. Mission Continuity and Inter-Calibration
The hydrologic observation record from space is fragmented across missions with different orbits, spectral bands, spatial resolutions, and calibration standards. GRACE operated from 2002 to 2017; GRACE-FO launched in 2018, leaving a data gap. Landsat’s 30 m record is the longest continuous Earth observation dataset, but cross-calibration between sensors (MSS, TM, ETM+, OLI) remains non-trivial. AI models trained on one mission’s data may not transfer cleanly to another mission’s data without careful domain adaptation.
7.2.2. Calibration and Validation at Scale
As remote sensing products are used to make hydrologic predictions at continental and global scales, the validation challenge becomes acute. Ground truth for ET, soil moisture, SWE, and surface water extent is available only at sparse points or small-area locations. The CAMELS dataset [
94,
95], while invaluable for benchmarking, covers only the conterminous United States. Extending AI-based hydrologic prediction to ungauged regions globally, the regions where satellite observations are most needed, requires new approaches to validation that do not depend on the ground-based networks that are absent in those regions.
7.2.3. Equity of Access
Sheffield et al. [
6] emphasize that satellite RS matters most in data-poor developing regions, yet the AI systems now processing that data are concentrated in well-resourced institutions. Cloud computing platforms have democratized data access, but the computational resources, training datasets, and technical expertise required to develop and deploy AI models remain unevenly distributed. The observation-to-inference arc is tightening globally, but the benefits are accruing disproportionately. Yet the technology has proven its value precisely in these settings: satellite-derived observations have enabled groundwater modeling in data-sparse regions of West Africa where no alternative data sources exist [
96].
7.2.4. Interpretability and Governance
As AI systems assume greater analytical agency in hydrologic prediction, maintaining explicit linkages to physical conservation laws and observable system states becomes essential to practitioners’, regulators’, and the public’s trust. Nearing et al. [
86] frame this as the tension between
episteme (scientific understanding) and
techne (practical prediction capability). The hydrology community must develop frameworks for governing AI-based hydrologic predictions that ensure accountability without sacrificing the performance gains that motivated the AI transition. Reichstein et al. [
90] advocate hybrid approaches that constrain AI models with known physical laws, thereby preserving interpretability while leveraging learned representations.
7.2.5. The Snow Water Equivalent Gap
Despite decades of research, accurate, high-resolution, global SWE monitoring from space remains an unsolved problem. Passive microwave approaches [
26] provide global coverage but at coarse resolution with significant uncertainties. Active radar approaches [
11] offer higher resolution, but no dedicated spaceborne mission currently exists. Given that snowmelt provides water supply for over one billion people globally [
69], this gap represents one of the most consequential unmet needs in the hydrologic observation system.
7.3. Commercial vs. Public Missions
The proliferation of commercial CubeSat constellations raises questions about the sustainability of the observation side of the arc. Commercial platforms offer temporal density that government missions cannot match, but their data policies and continuity guarantees differ fundamentally from the free, open, long-term archives that enabled landmark studies such as the Pekel et al. [
71] global surface water mapping. A sustainable observation-to-inference system will likely require both public missions providing calibrated, long-term baseline records and commercial constellations providing high-frequency observations for operational monitoring.
7.4. From Observation to Management: Closing the Decision Gap
The observation-to-inference arc traces the scientific and technological integration of remote sensing with hydrology, but the ultimate measure of that integration’s value is its impact on water resource management decisions. Each era has further shortened the distance between satellite observation and management action. In Era 1, satellite images were curiosities with no operational role. In Era 2, satellite-derived ET products began informing irrigation scheduling and reservoir evaporation estimates. In Era 3, GRACE-based groundwater depletion monitoring influenced policy debates over aquifer management in India and California; satellite precipitation products drove operational flood forecasting models; and MODIS-derived drought indices became standard inputs to famine early warning systems. In Era 4, the Google flood forecasting system [
59] demonstrates that the entire chain from satellite observation to management-relevant alert can be automated, delivering actionable flood warnings to over 350 million people.
A significant gap remains between what is technically possible and what is operationally deployed. Many national water agencies, particularly in developing countries, lack the institutional capacity to incorporate satellite-derived products into their decision workflows, even when those products are freely available. The AI vision articulated in
Section 6 will only realize its water management potential if accompanied by investments in institutional capacity, data literacy, and the governance frameworks needed to legitimize satellite-derived and AI-generated information in regulatory and operational contexts. The most important advances in the next decade may be institutional rather than algorithmic: building bridges between what satellites can see and what water managers need to know.
8. Conclusions
The integration of satellite remote sensing with hydrologic science over six decades has been a story of steadily tightening coupling between observation and inference. Put simply, the arc traces how far the satellite pixel must travel through human-designed analytical steps before it becomes a hydrologic prediction—and that distance has been shrinking across the eras until, in the current era, end-to-end AI threatens to eliminate it entirely. Manual interpretation of grainy satellite photographs gave way to calibrated retrieval algorithms; retrieval algorithms gave way to standardized operational data products assimilated into models; and those products are now giving way to AI systems that learn to predict hydrologic variables directly from satellite imagery, collapsing the multi-step pipeline into a single computation.
The four milestones that define this trajectory are: (1) the first satellite observations of snow, precipitation, and land surface from TIROS, Landsat, and GOES (1960–1985), which demonstrated the observational potential of the synoptic view but remained disconnected from operational hydrology; (2) the calibrated retrieval algorithm era (1985–2000), in which SEBAL, METRIC, TRMM, and radar altimetry established the satellite → retrieval → product → model pipeline; (3) the operational infrastructure era (2000–2015), in which MODIS, GRACE, GPM, Sentinel, SMOS, SMAP, and Google Earth Engine created a global, freely accessible, continuously operating observation system linked to hydrologic models through data assimilation, in which models guided satellite interpretation and satellite observations corrected model states; and (4) the current era (2015–present), in which LSTMs, foundation models, and end-to-end AI systems are merging observation and inference into a single computational paradigm.
The four-level AI vision articulated in
Section 6, from AI-assisted RS interpretation through autonomous Earth observation intelligence, describes a plausible and technically grounded path from where the field stands today to a future in which the analytical power of six decades of satellite-hydrology integration is accessible to any water resources practitioner, anywhere, through an intelligent system that understands both what the satellite sees and what the water does.
Our companion GIS paper [
16], “Mapping Water: A Brief History of GIS in Hydrology and a Path Toward AI-Native Modeling” (published in
Water), and this RS paper together tell complementary stories of digital spatial water science. One traces how we represent and manage water data on the ground; the other traces how we observe water from space. The GIS coupling arc and the RS observation-to-inference arc converge at the same endpoint: AI systems that reason directly over geospatial hydrologic data, both modeled and observed, without requiring the traditional software intermediaries that have defined both fields for their entire histories. The line between seeing the water cycle and understanding it is about to dissolve.