Figure 1.
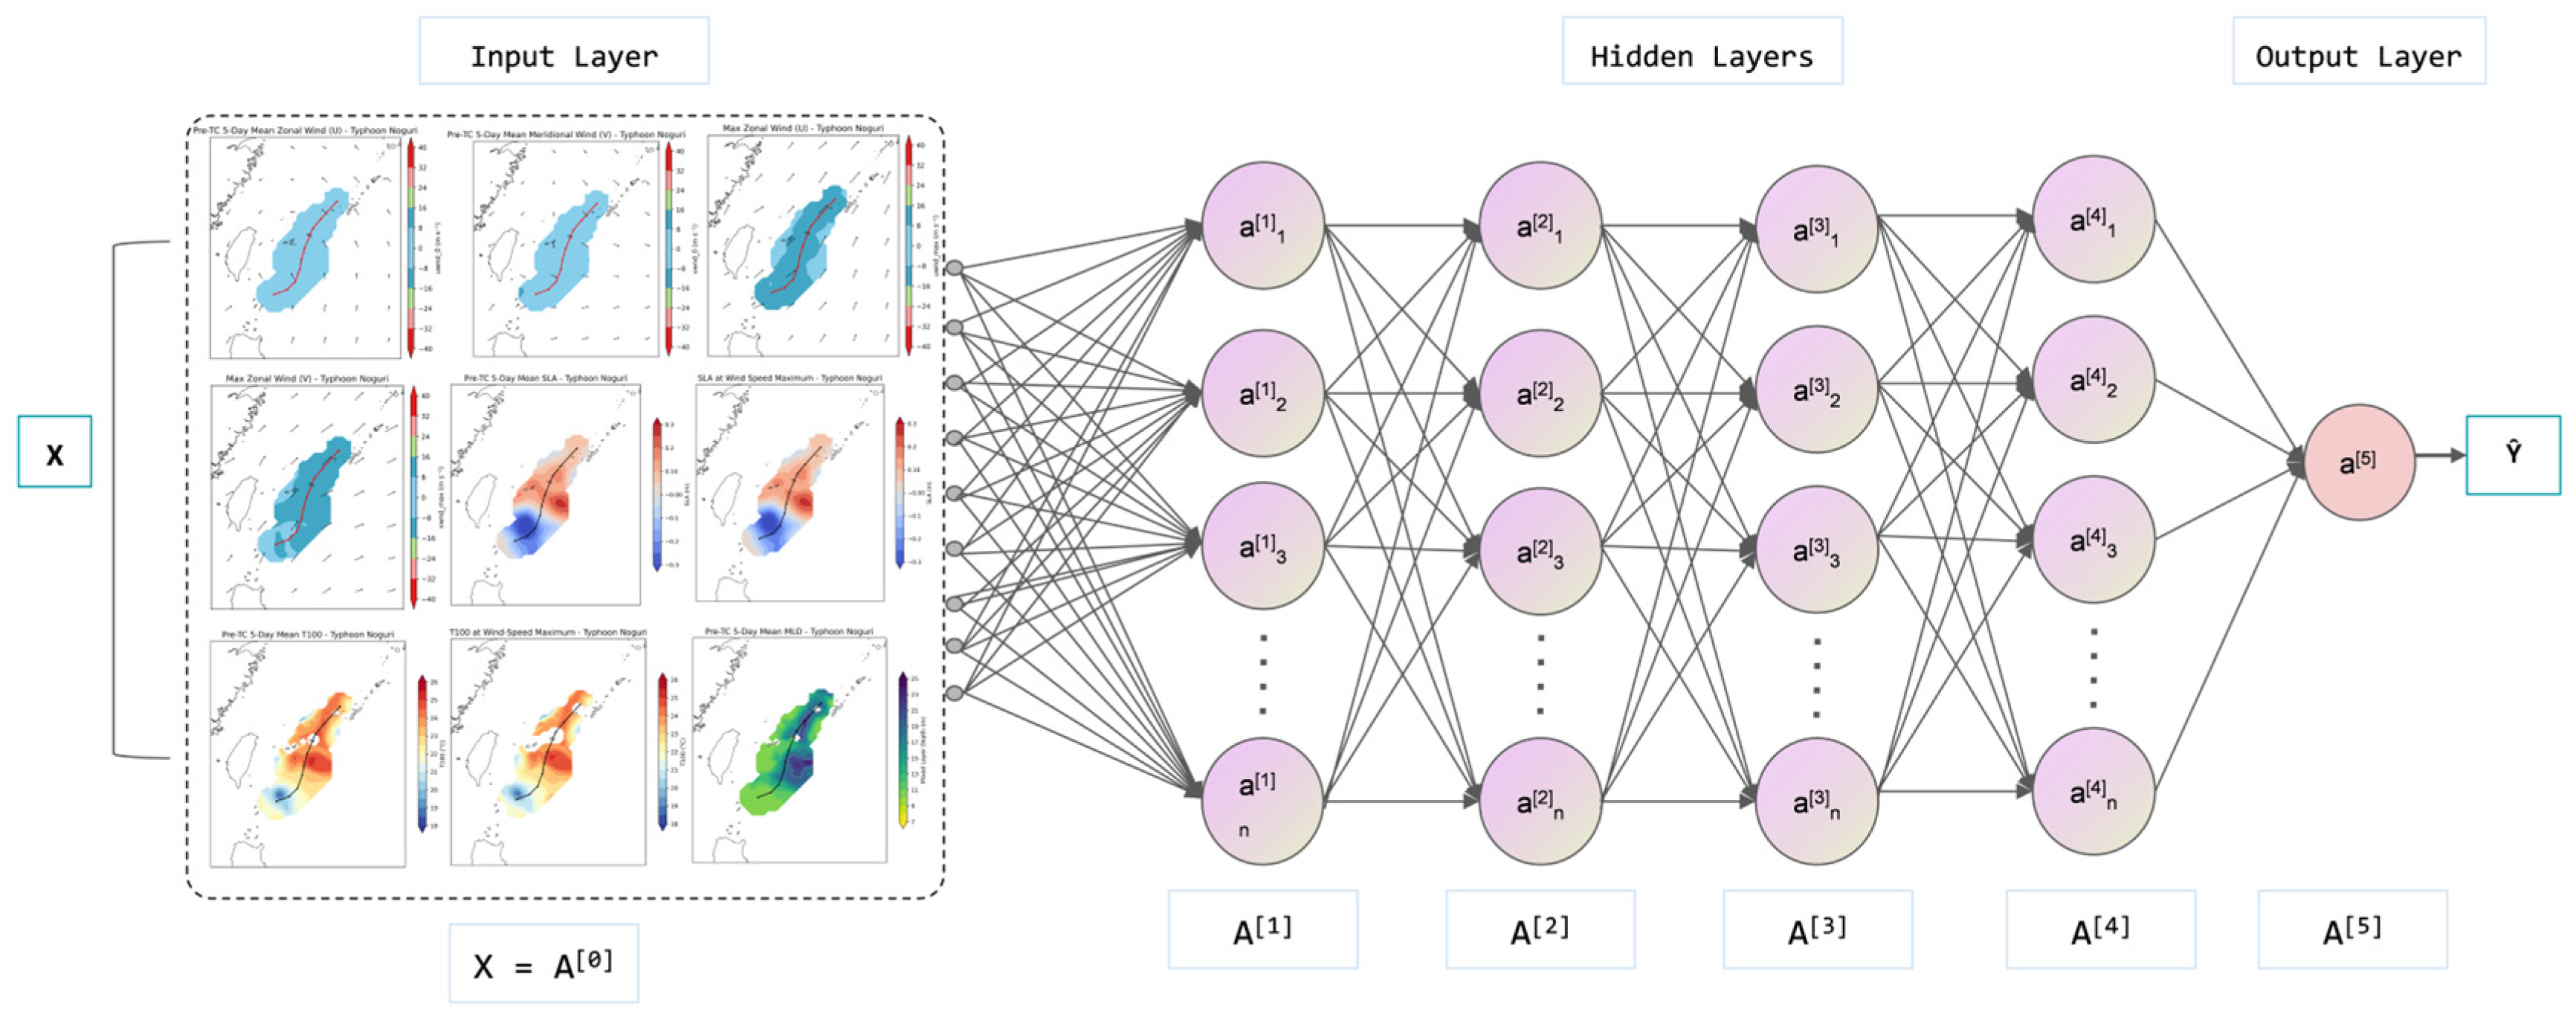
Schematic diagram of the MLP model architecture.
Figure 1.
Schematic diagram of the MLP model architecture.
Figure 2.
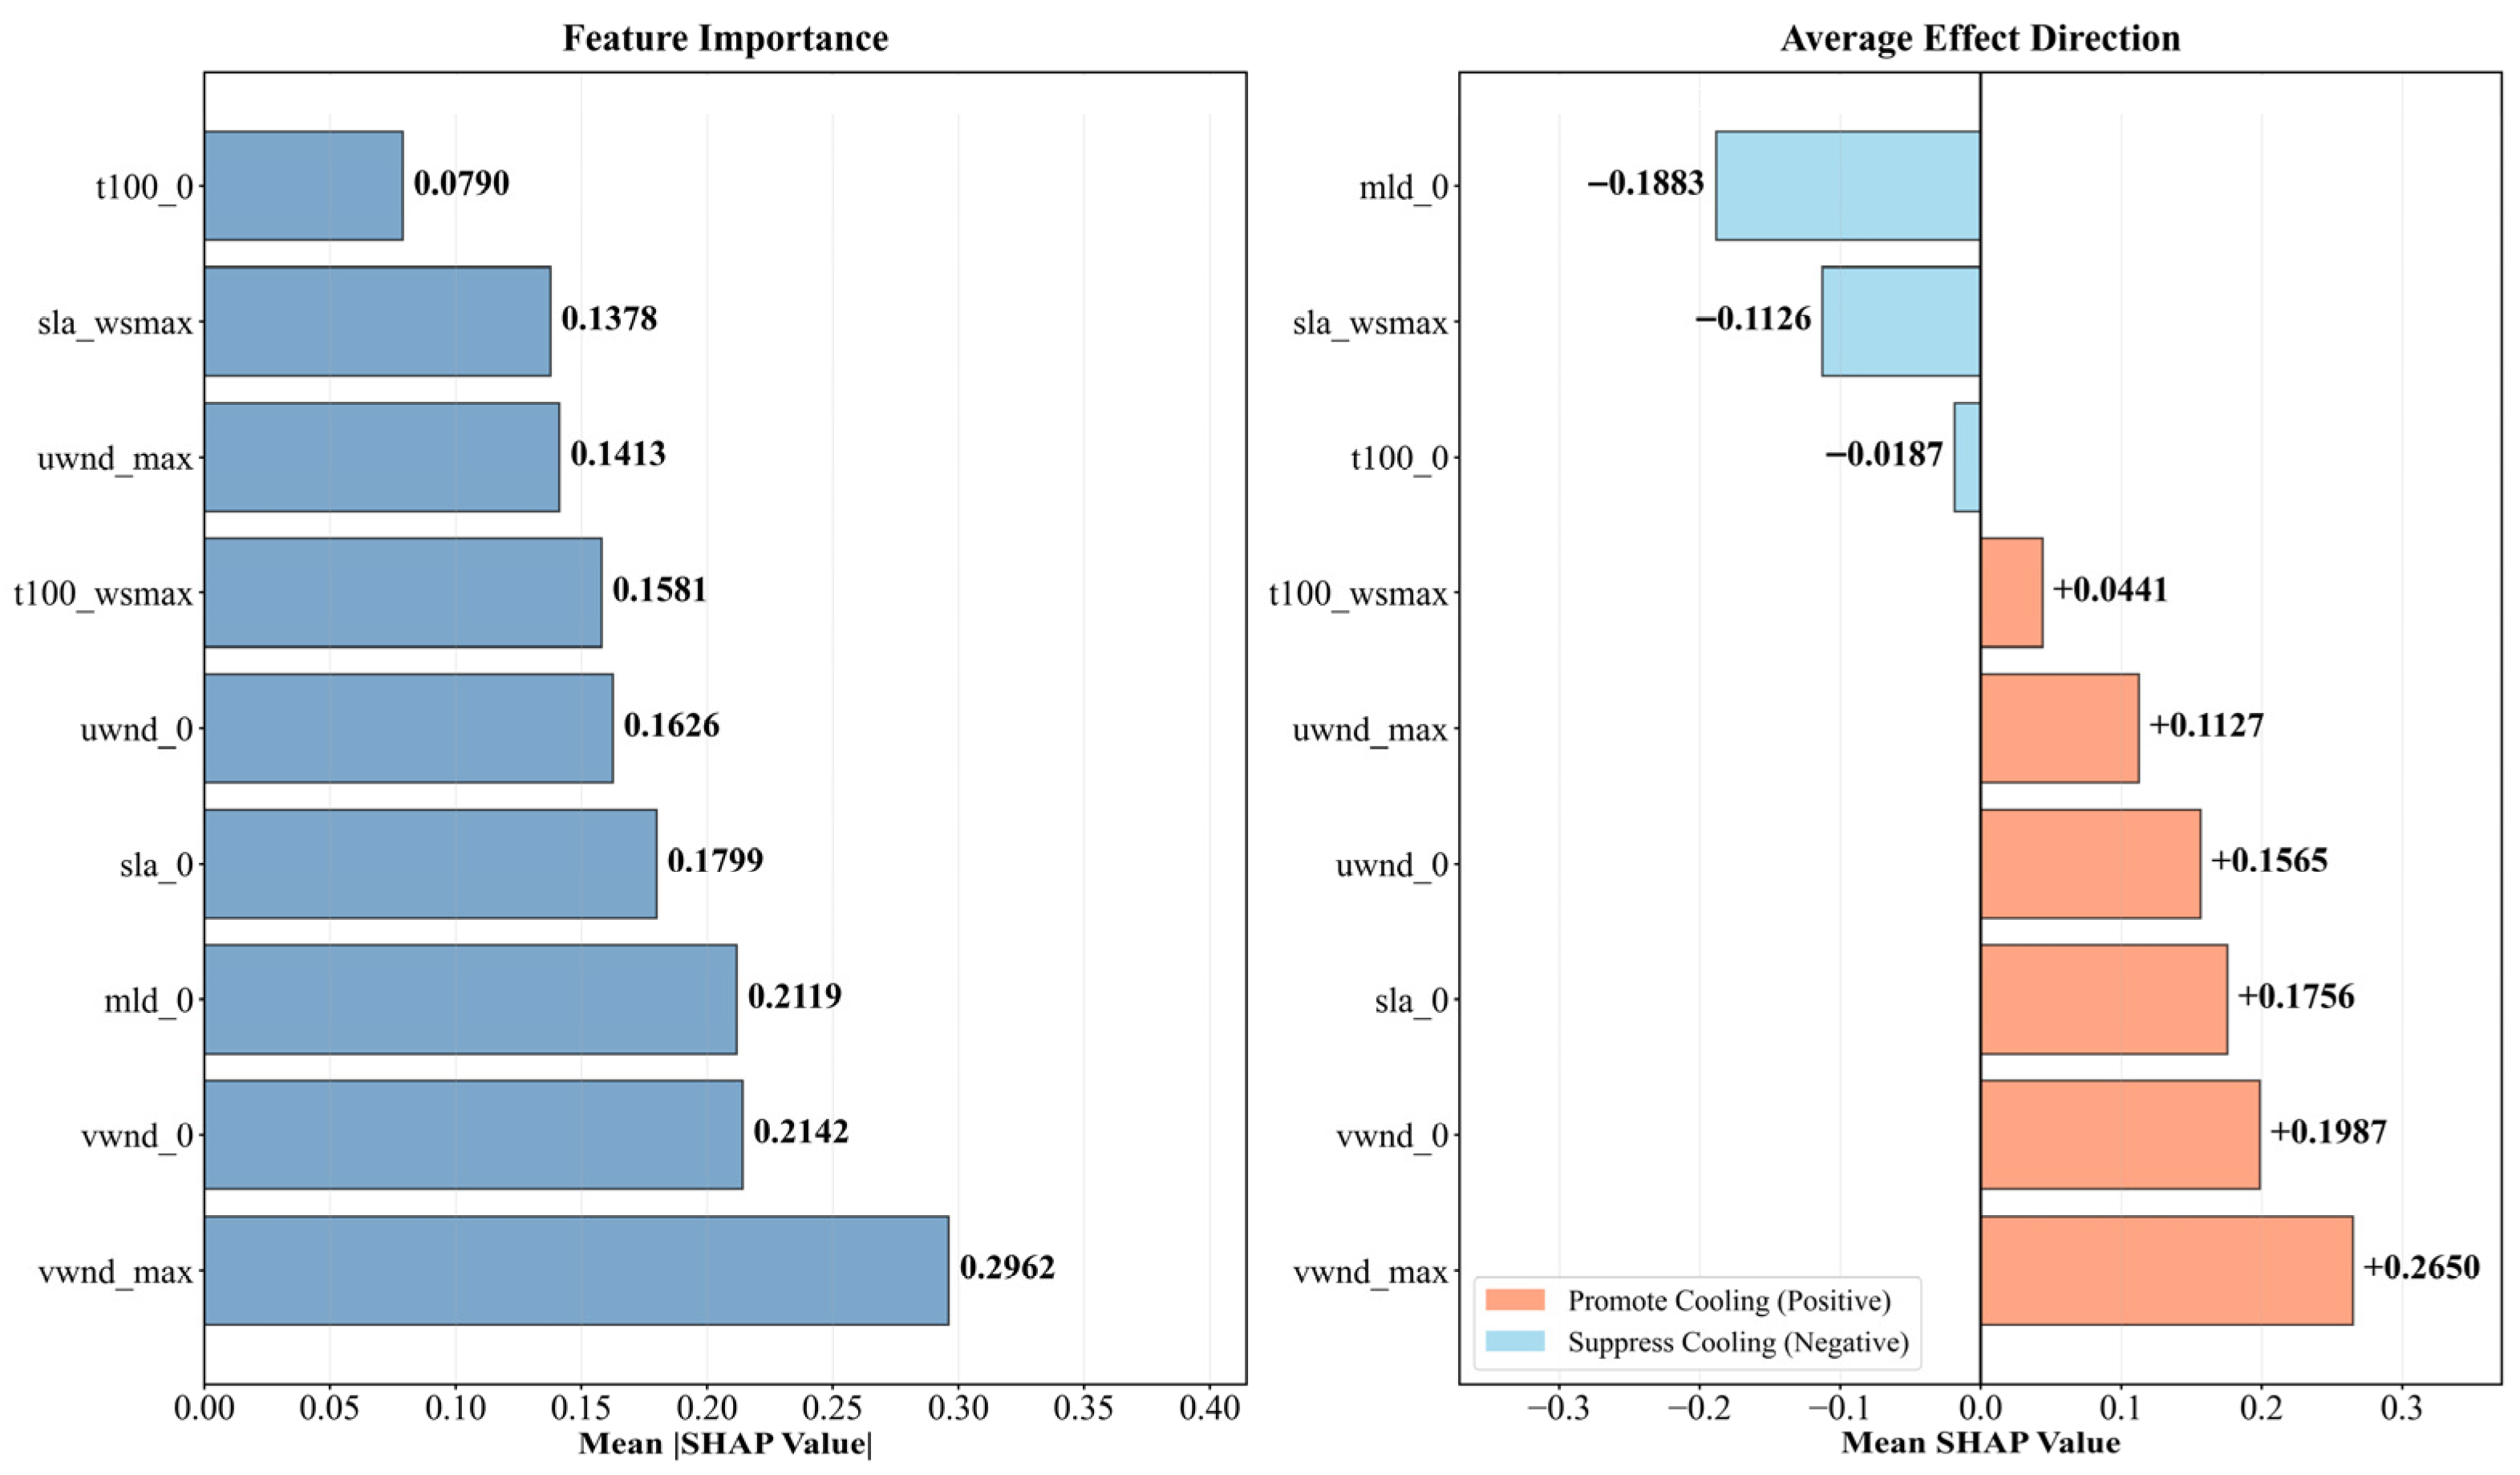
Summary of Feature Importance.
Figure 2.
Summary of Feature Importance.
Figure 3.
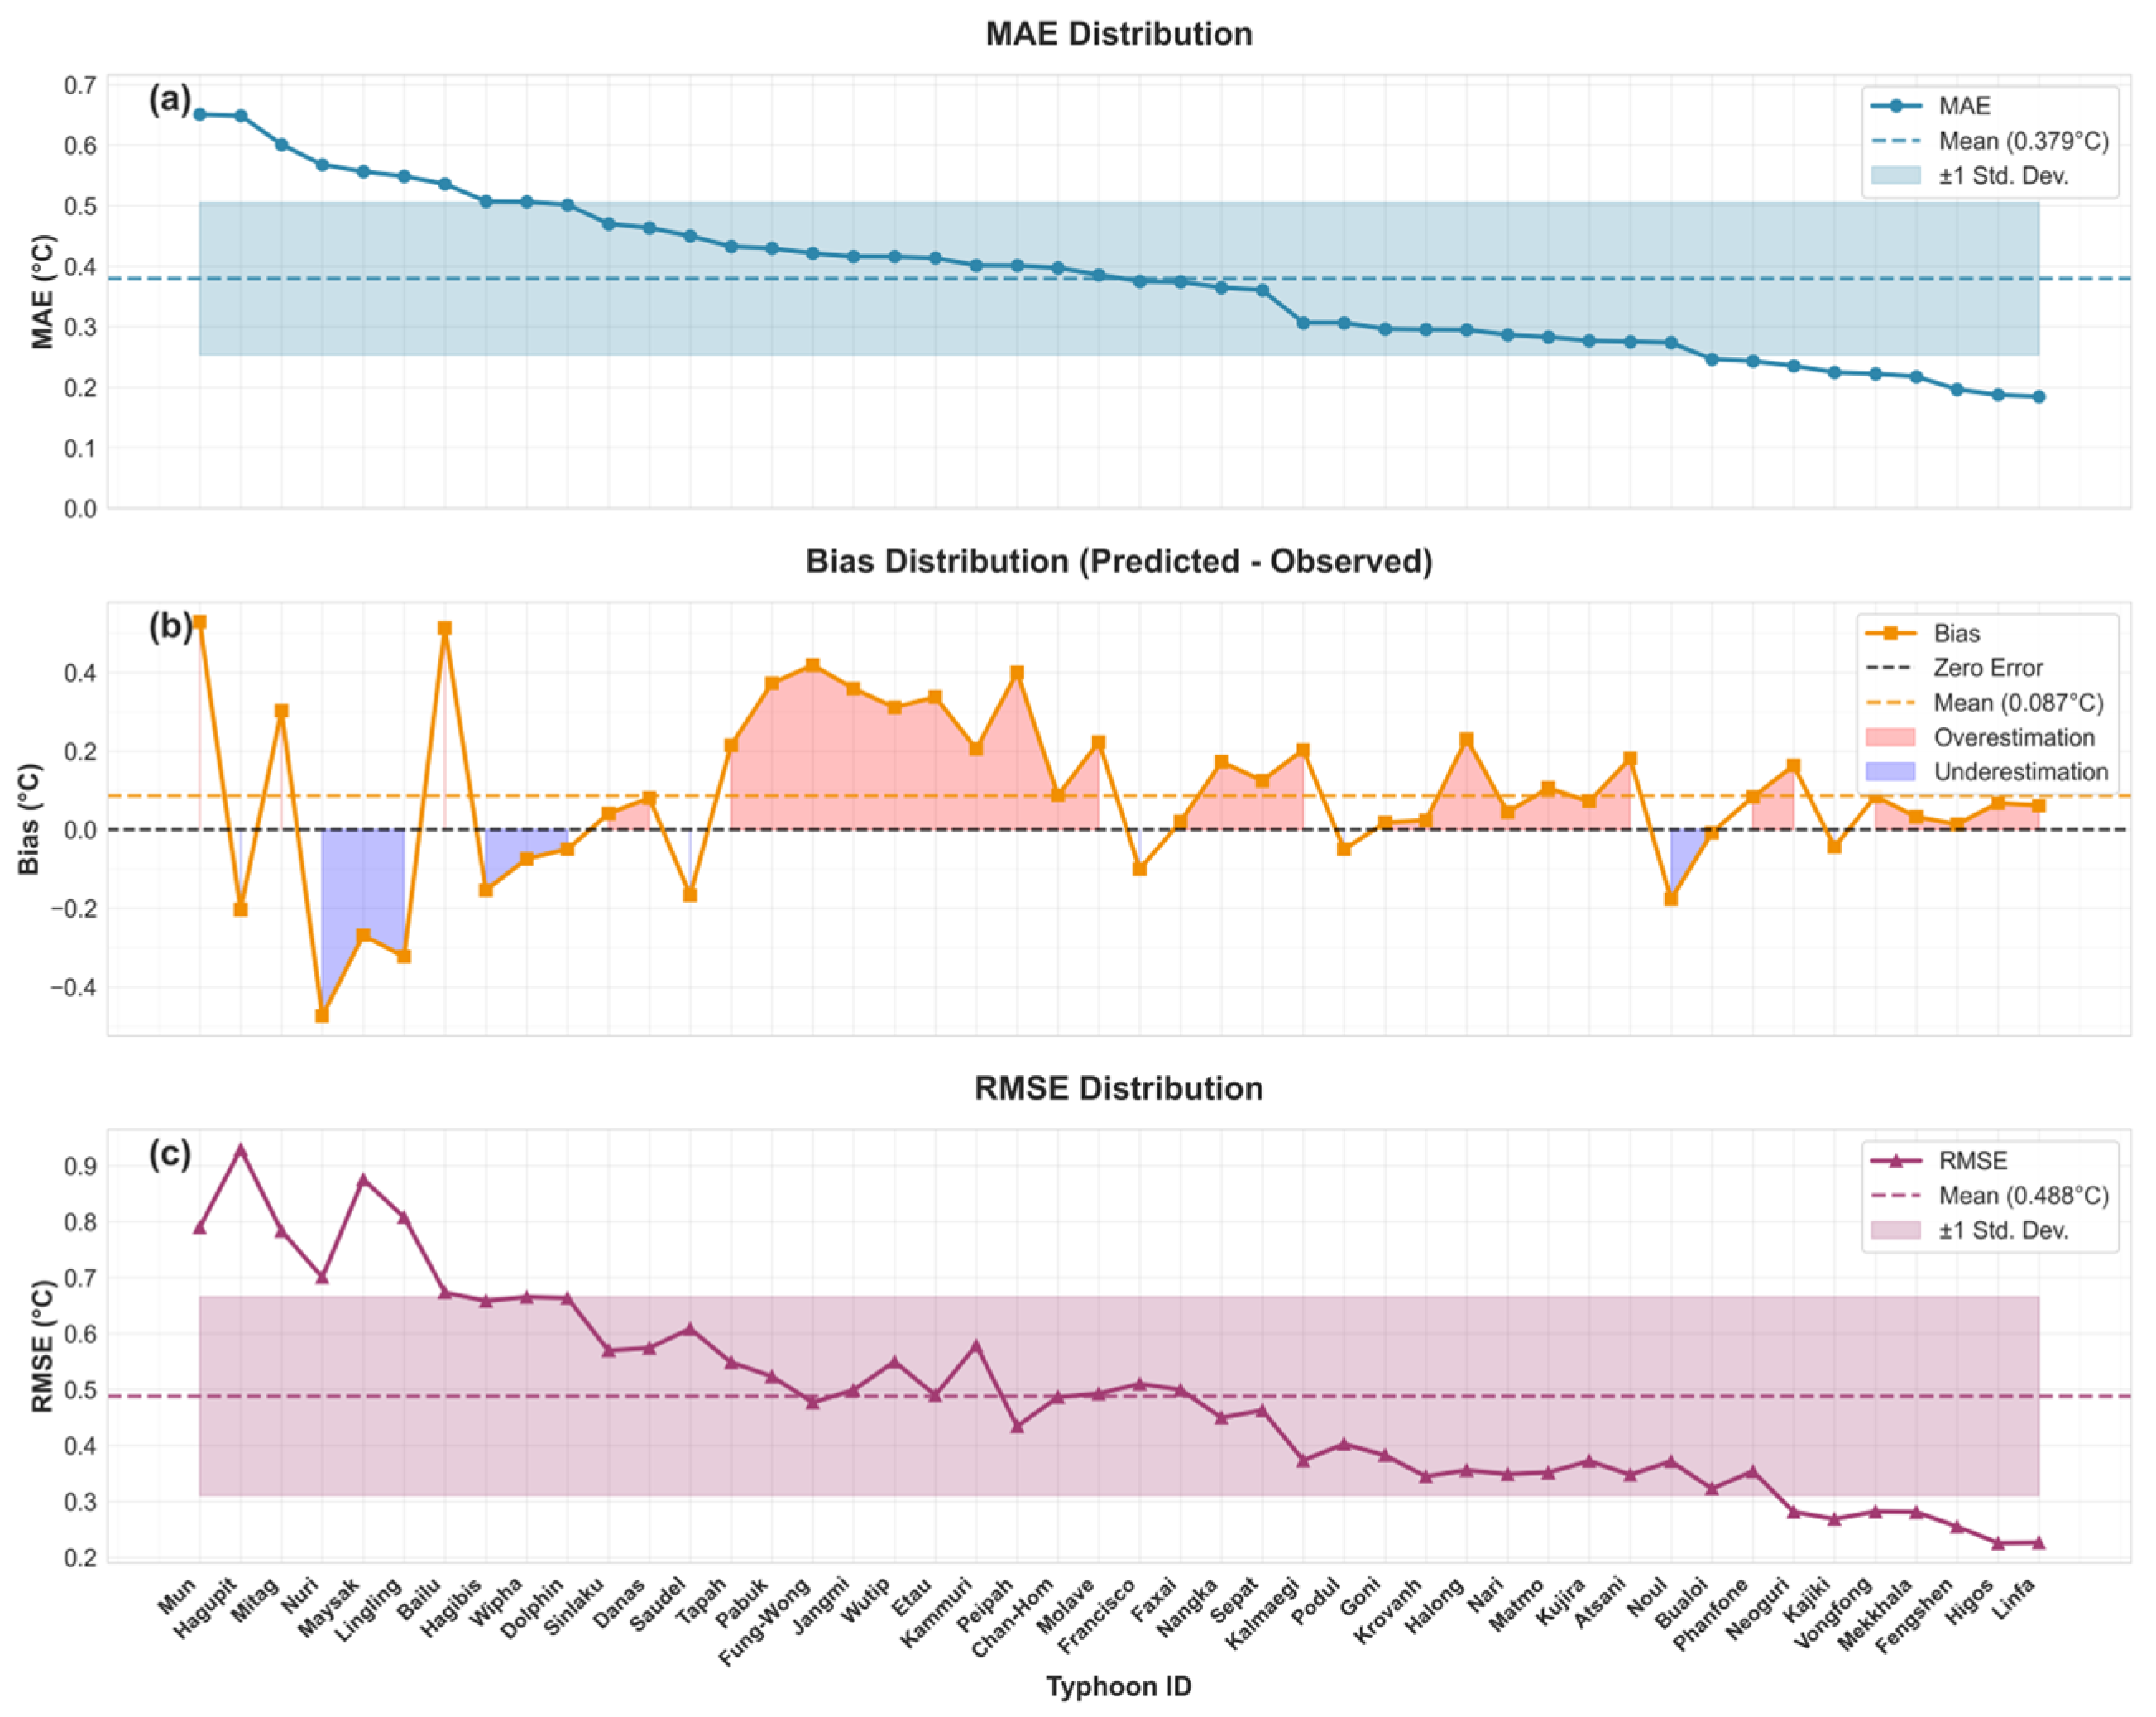
Sequence distribution of SSC prediction errors: (a) MAE, (b) Bias, (c) RMSE. Typhoons are sorted in descending order based on their MAE values. The solid line represents the error value for each typhoon, the dashed line indicates the mean value, and the shaded area denotes the range of mean ± one standard deviation. In panel (b), the red and blue shadings represent the regions of overestimation and underestimation, respectively.
Figure 3.
Sequence distribution of SSC prediction errors: (a) MAE, (b) Bias, (c) RMSE. Typhoons are sorted in descending order based on their MAE values. The solid line represents the error value for each typhoon, the dashed line indicates the mean value, and the shaded area denotes the range of mean ± one standard deviation. In panel (b), the red and blue shadings represent the regions of overestimation and underestimation, respectively.
Figure 4.
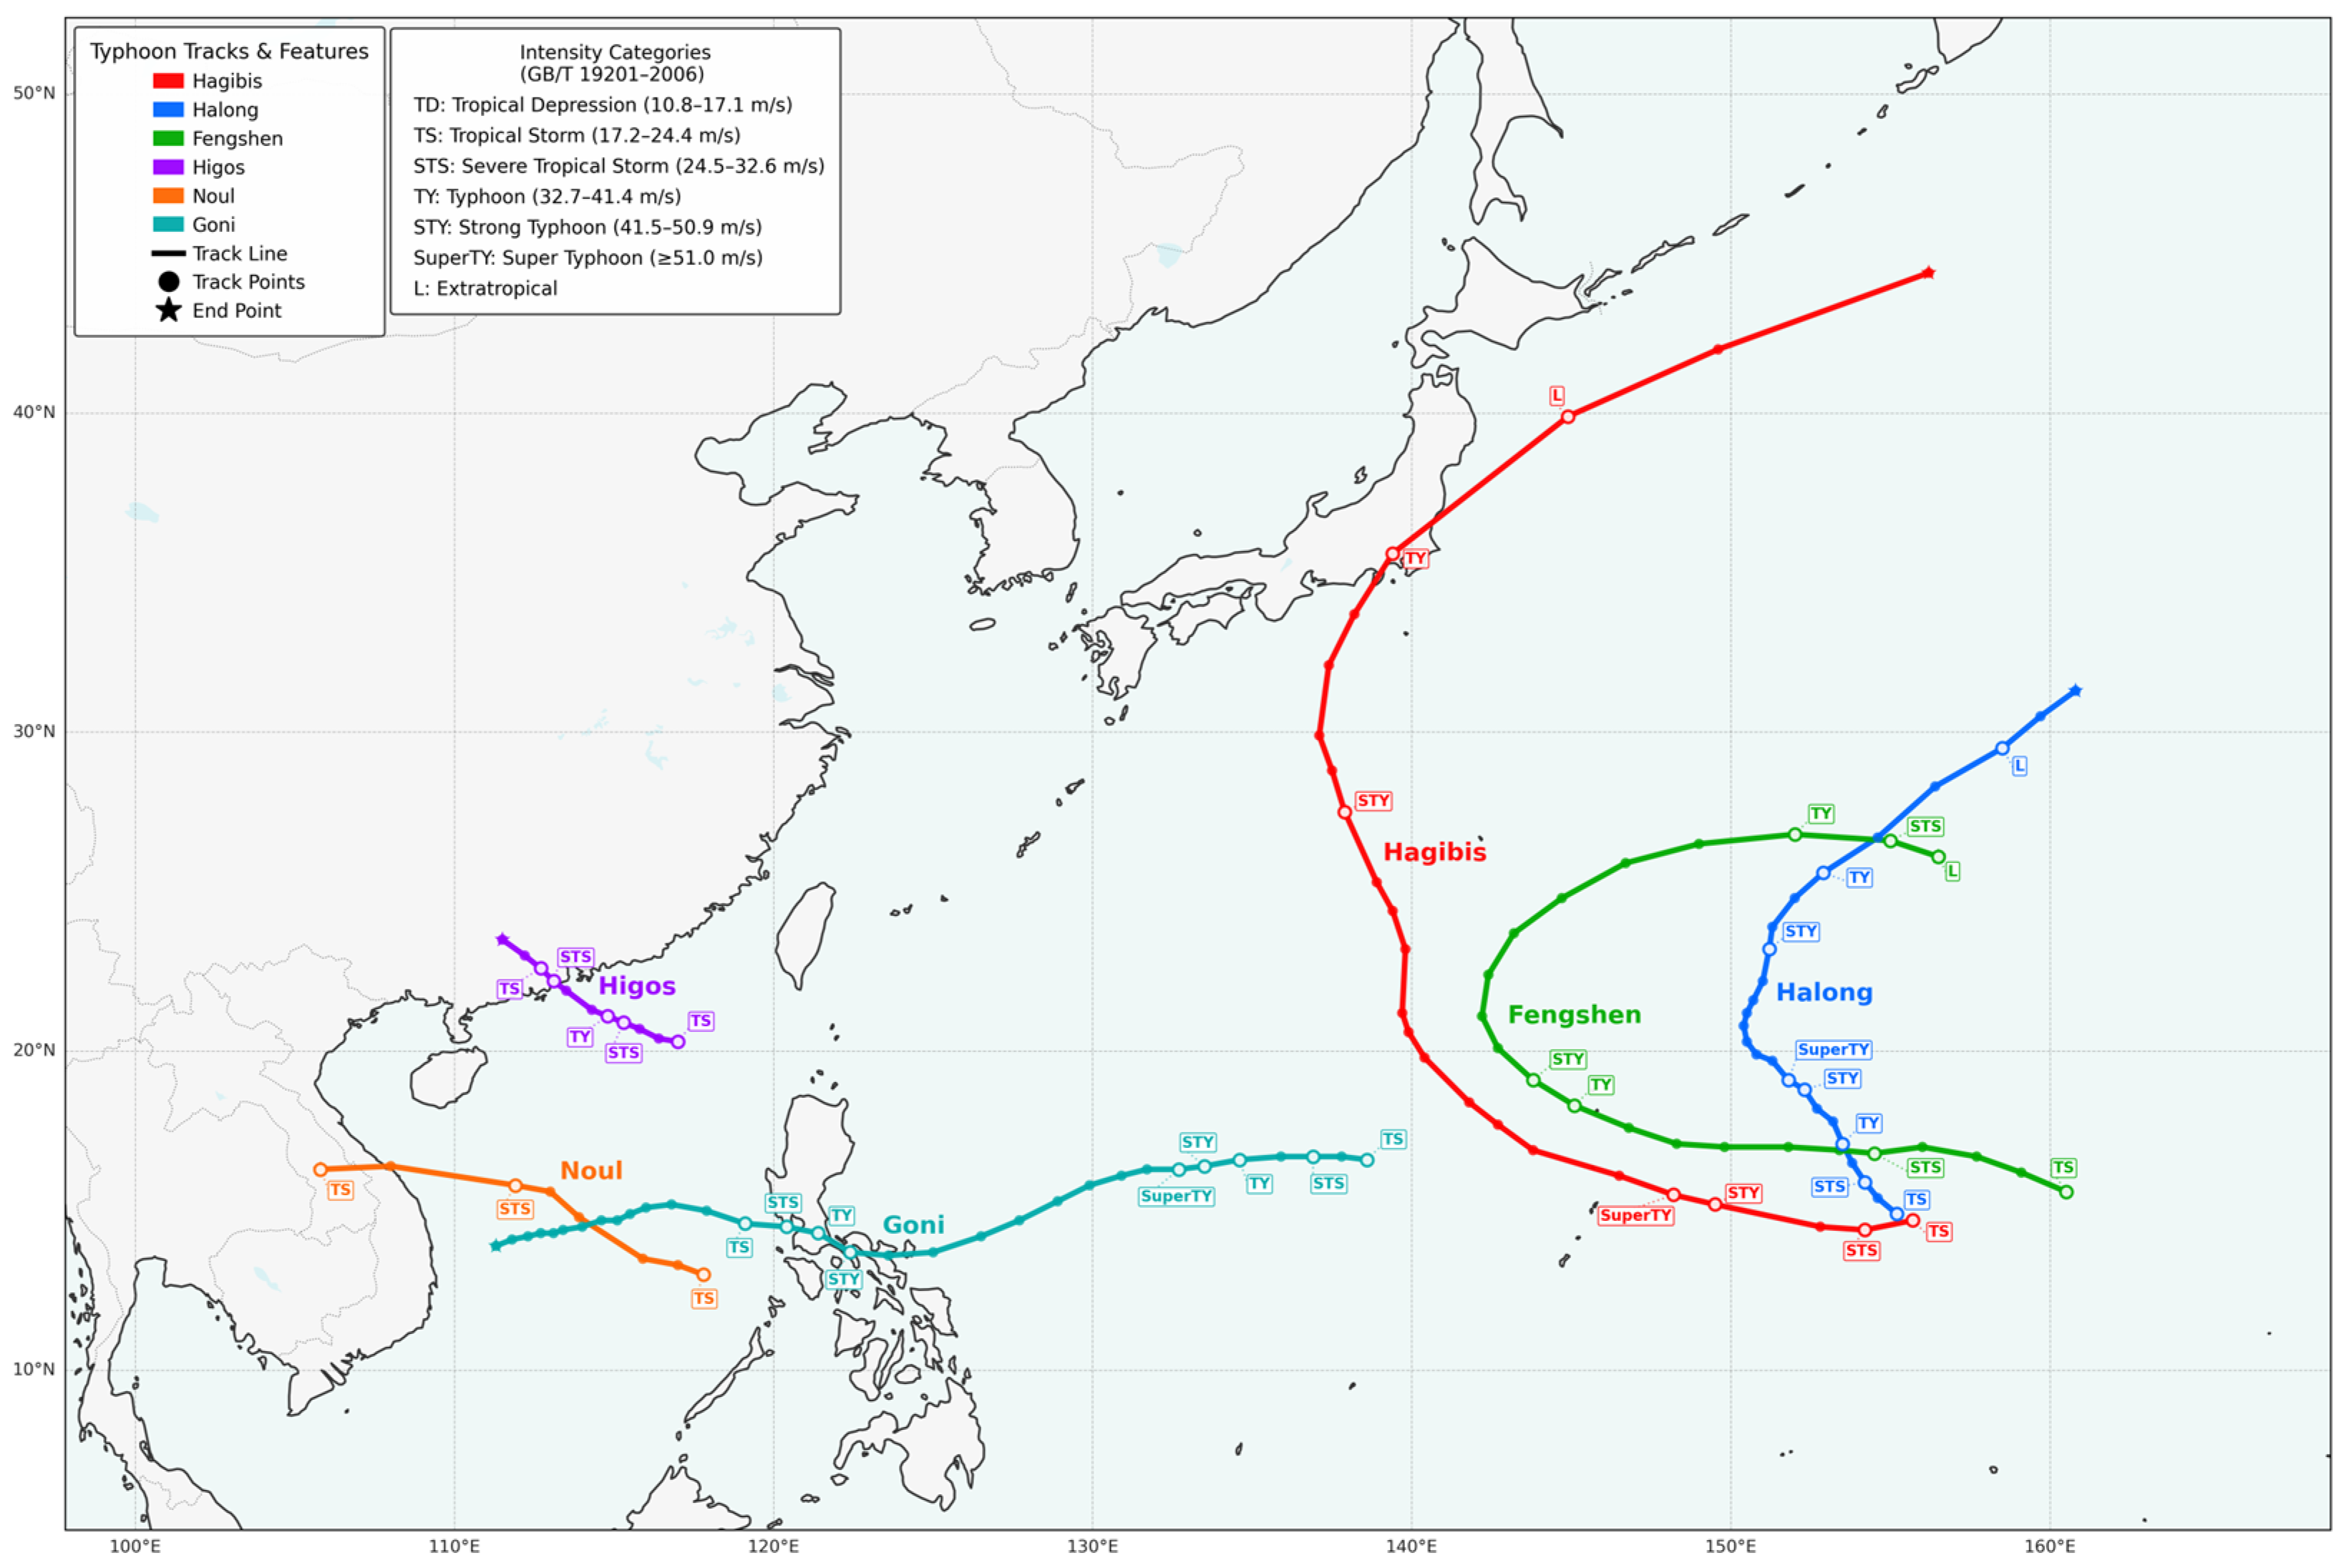
Map of western Pacific typhoon tracks during 2019–2020, showing the best-track trajectories of six named typhoons (Hagibis, Halong, Fengshen, Higos, Noul, and Goni) at 6 h intervals. Each typhoon is represented by a distinct color, with track points marked by solid circles and endpoints indicated by stars. White circles connected by dashed lines mark key transition nodes in intensity classification, with labels indicating intensity categories [
42].
Figure 4.
Map of western Pacific typhoon tracks during 2019–2020, showing the best-track trajectories of six named typhoons (Hagibis, Halong, Fengshen, Higos, Noul, and Goni) at 6 h intervals. Each typhoon is represented by a distinct color, with track points marked by solid circles and endpoints indicated by stars. White circles connected by dashed lines mark key transition nodes in intensity classification, with labels indicating intensity categories [
42].
Figure 5.
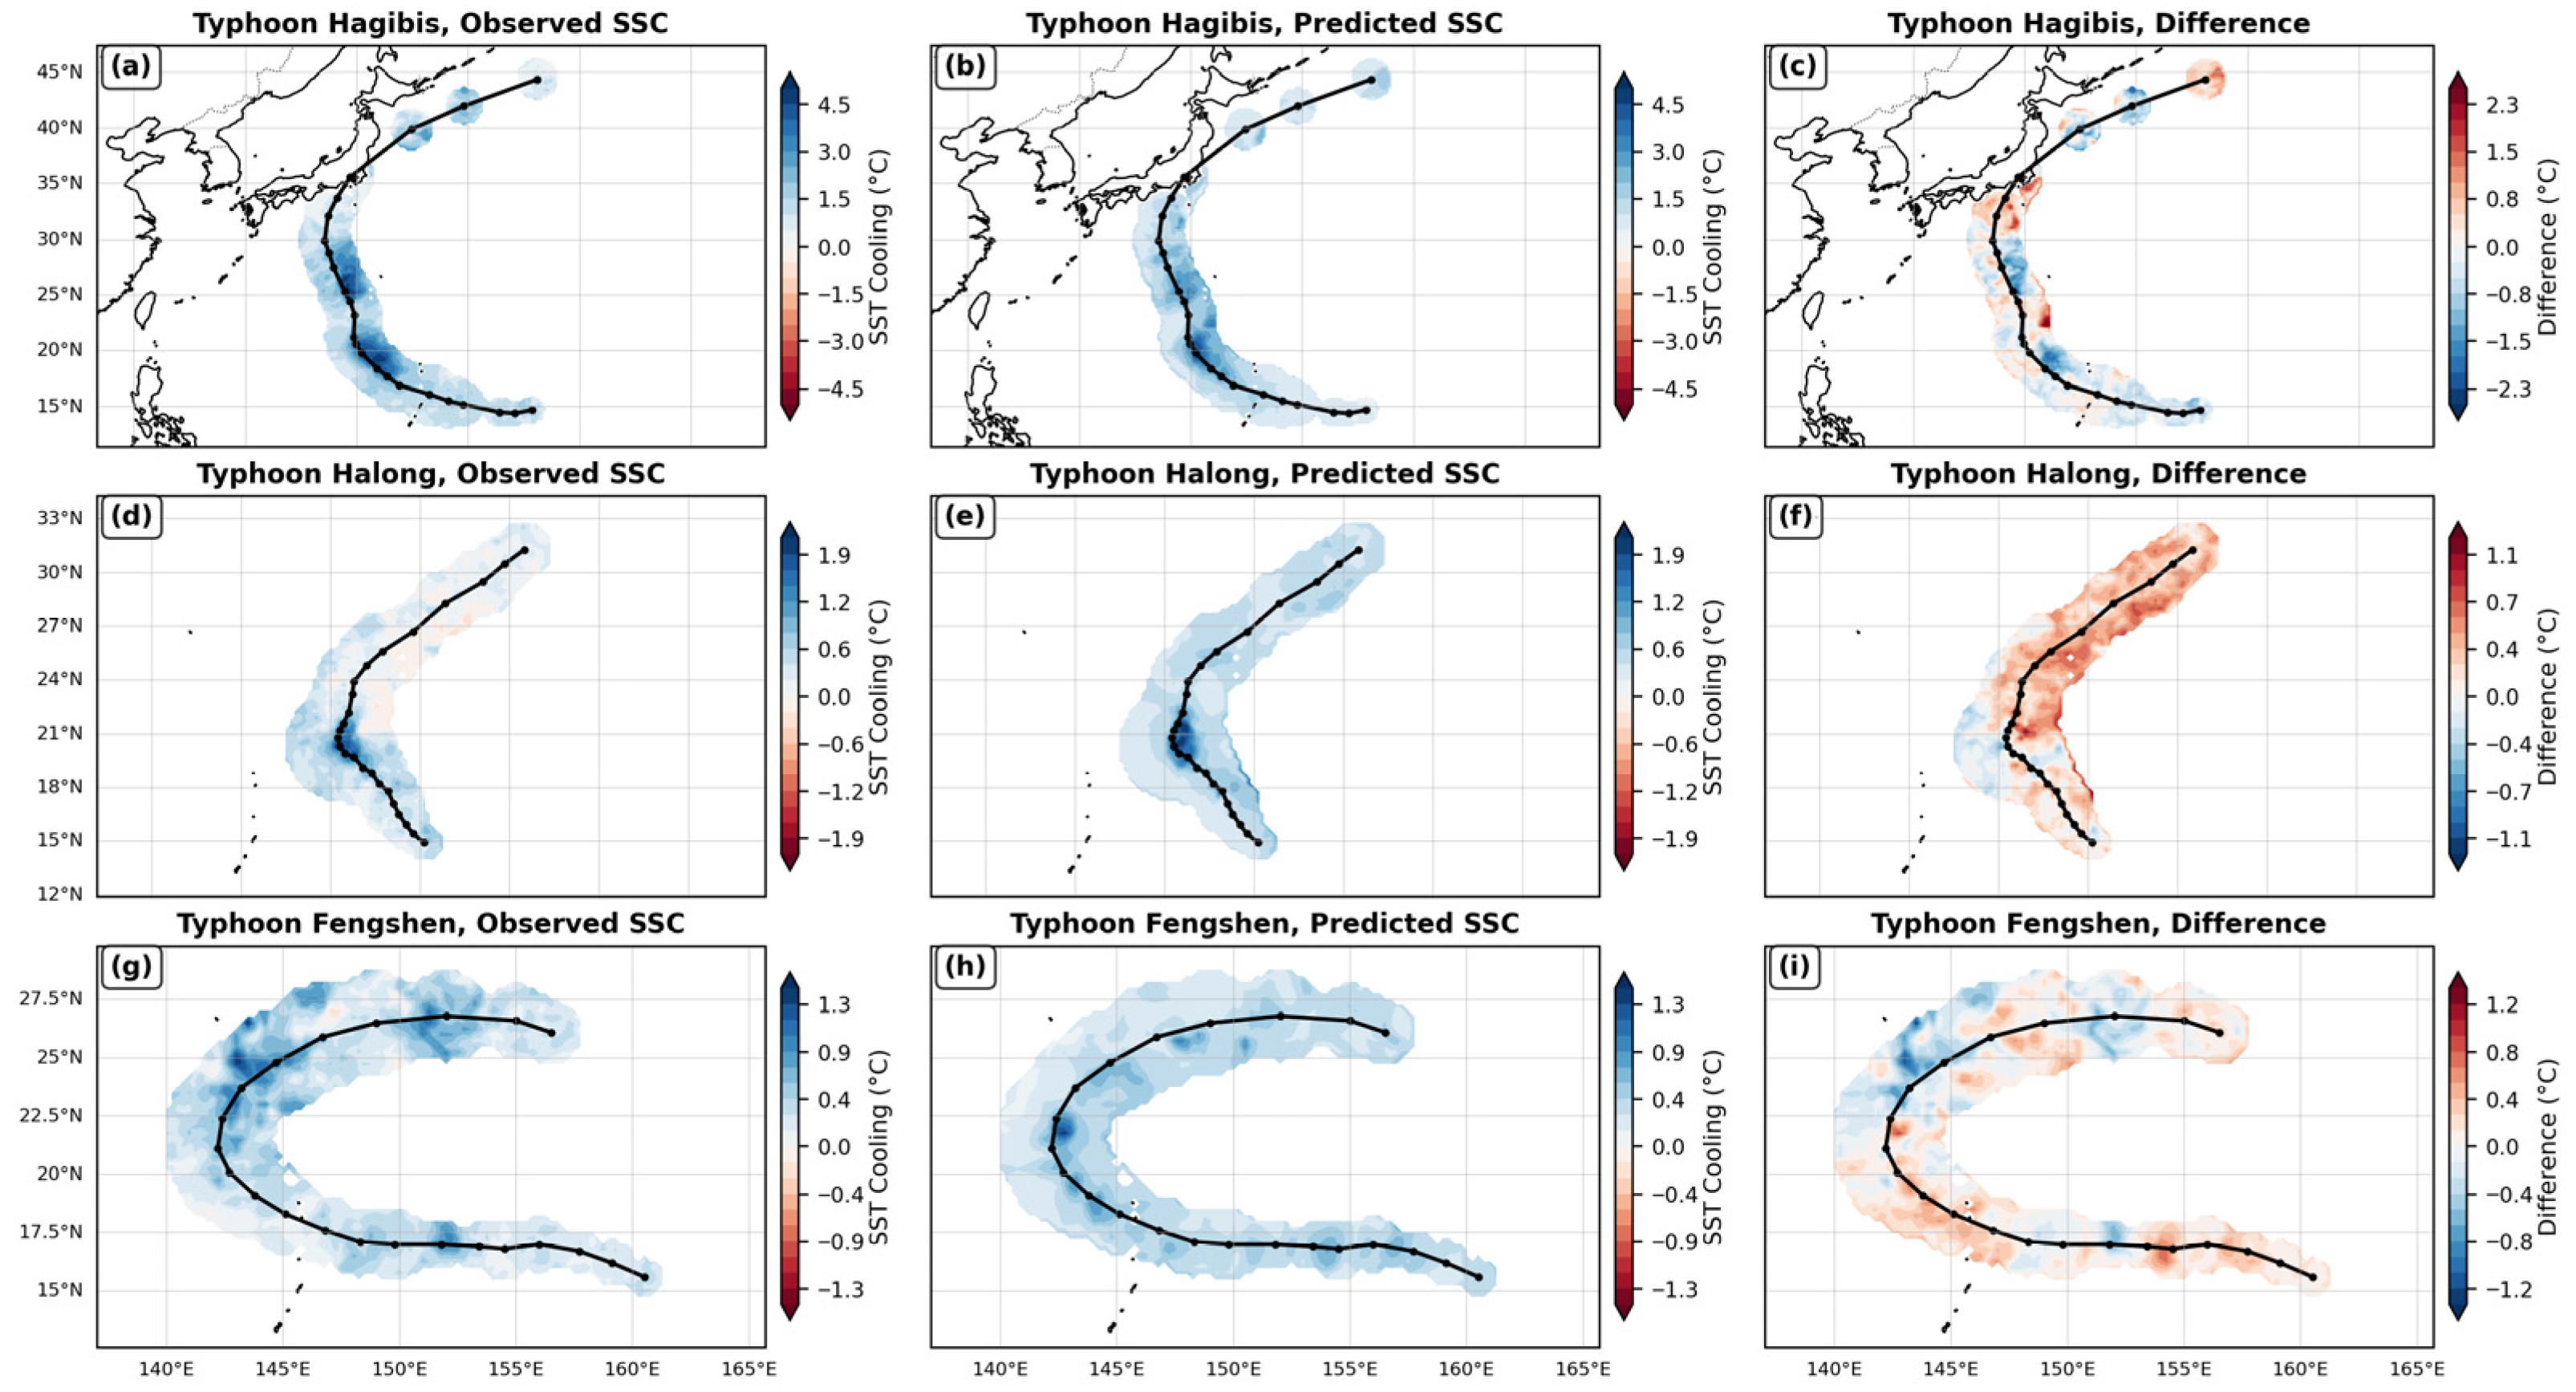
Comparison of observed, predicted, and differential SSC induced by typhoons in 2019: (a–c) Hagibis, (d–f) Halong, (g–i) Fengshen. The first column shows observed SSC, the second column shows model-predicted SSC, and the third column shows the difference between prediction and observation (predicted minus observed).
Figure 5.
Comparison of observed, predicted, and differential SSC induced by typhoons in 2019: (a–c) Hagibis, (d–f) Halong, (g–i) Fengshen. The first column shows observed SSC, the second column shows model-predicted SSC, and the third column shows the difference between prediction and observation (predicted minus observed).
Figure 6.
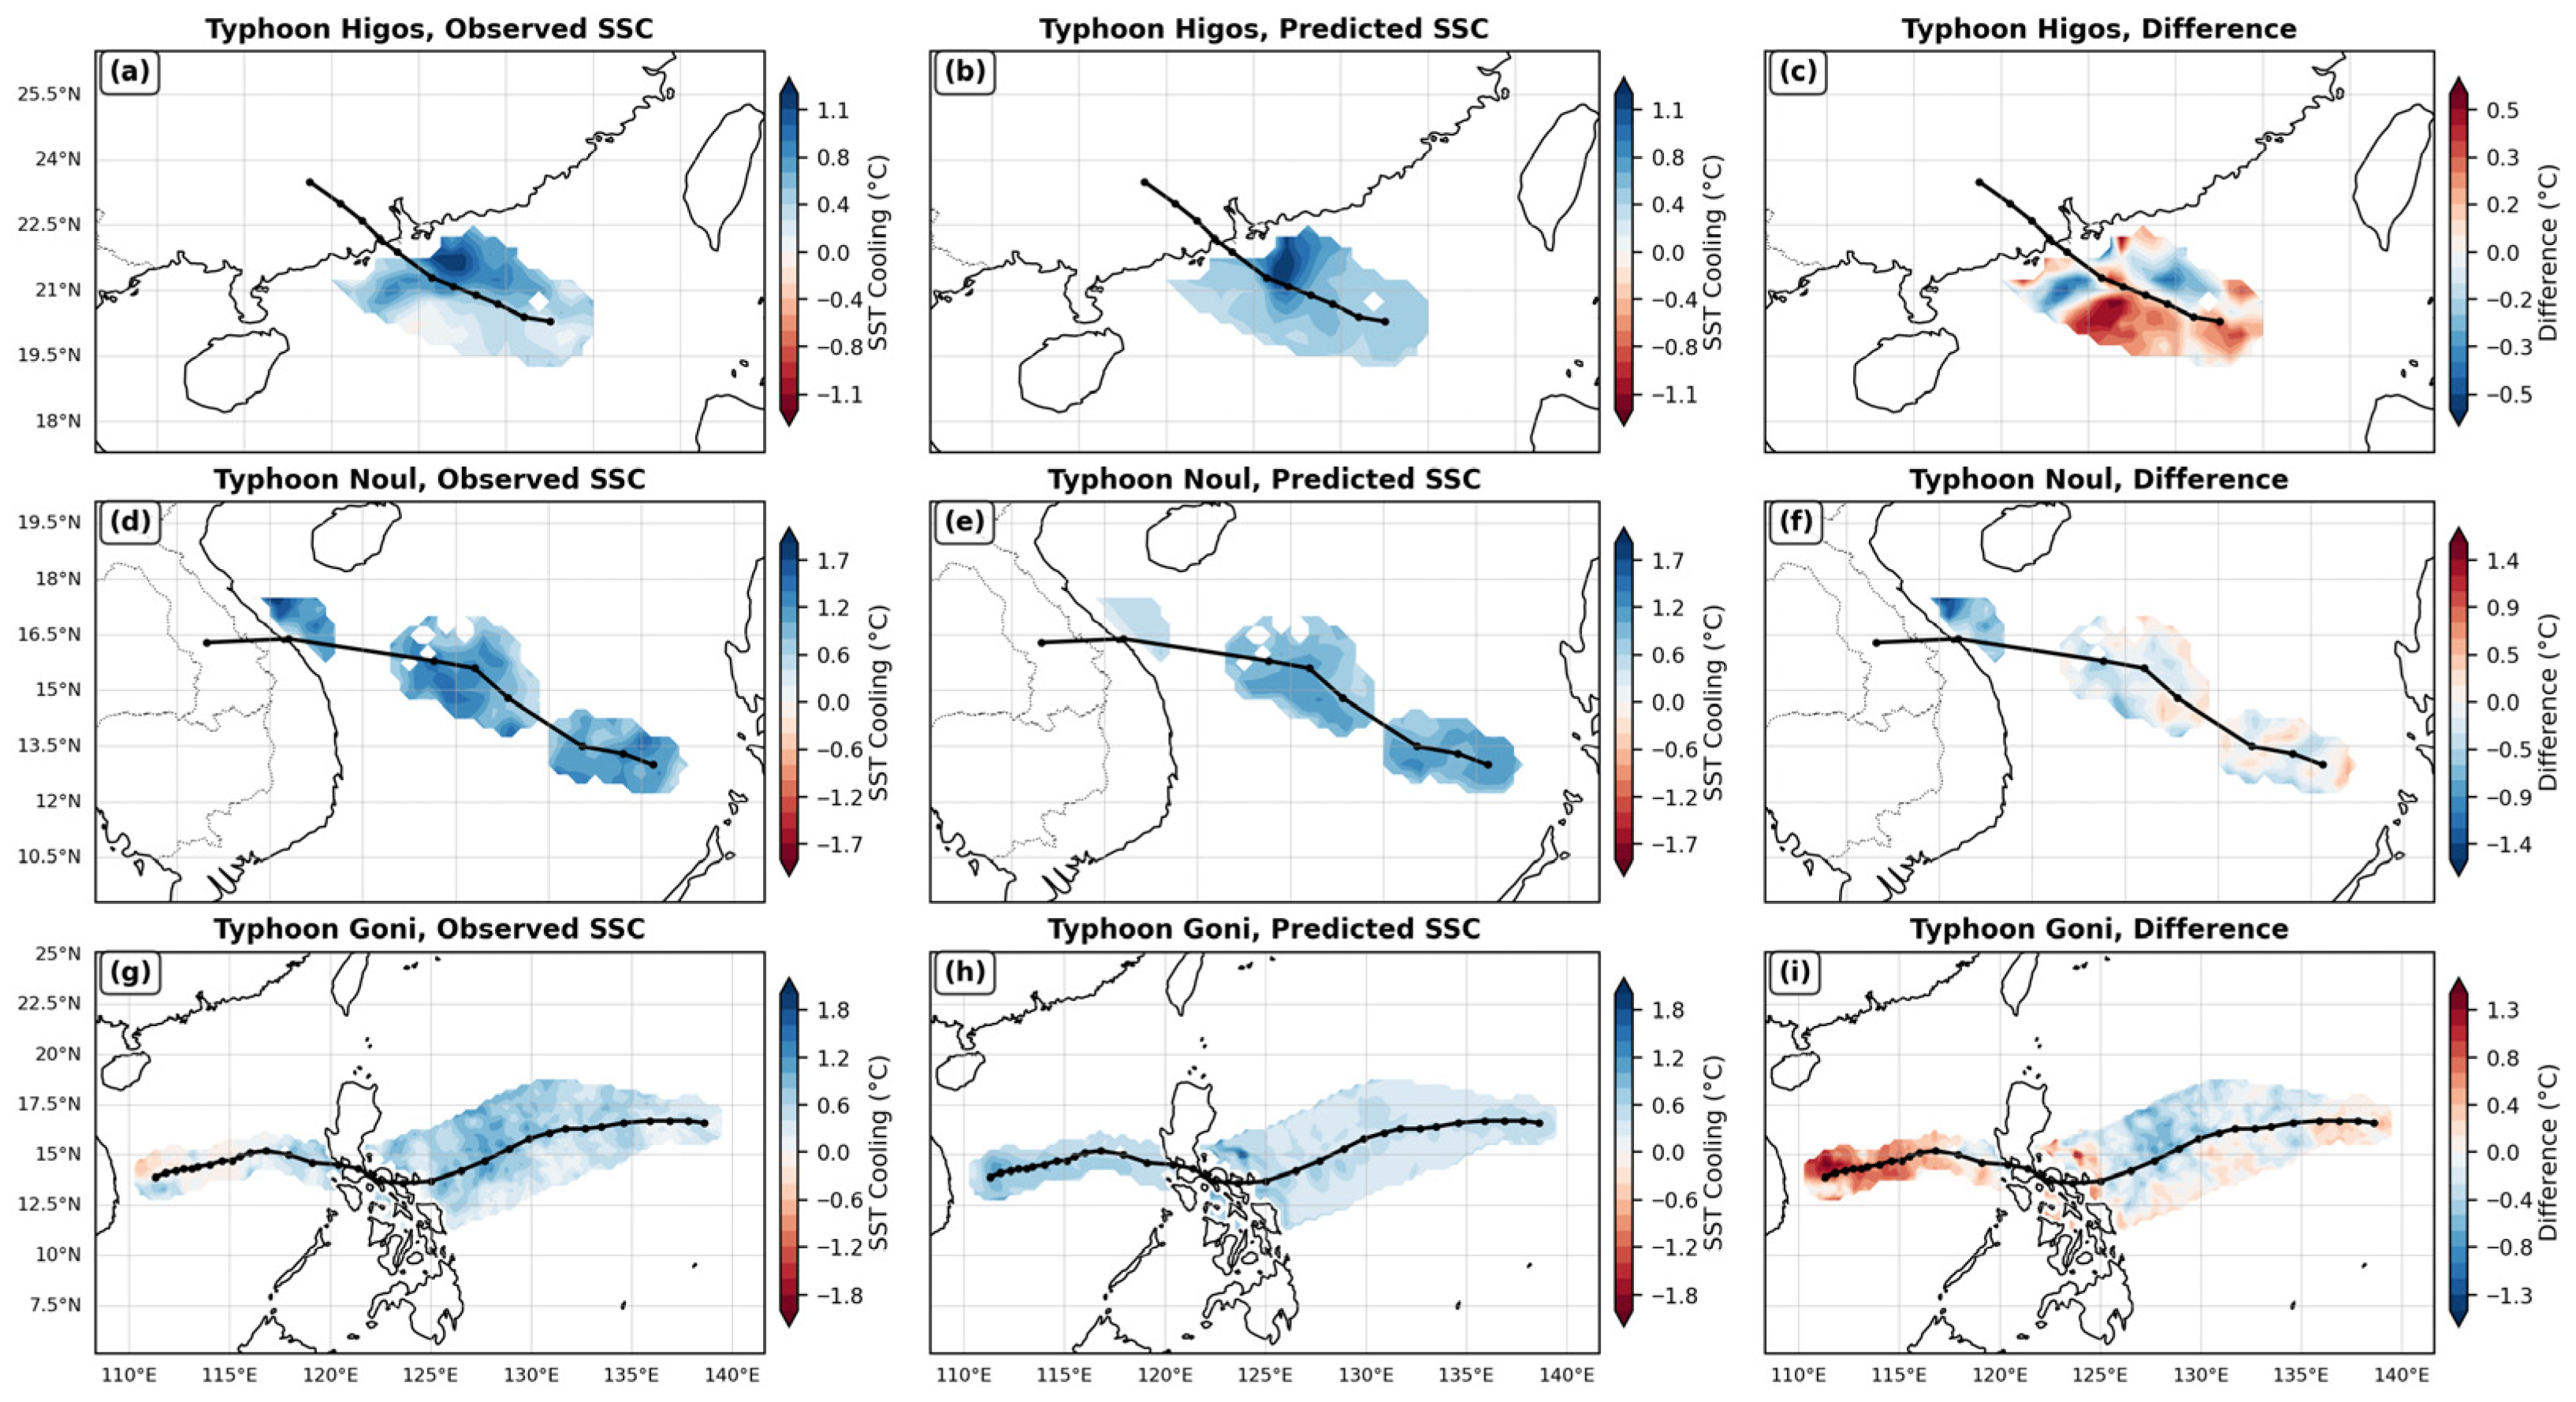
Comparison of observed, predicted, and differential SSC induced by typhoons in 2020: (a–c) Higos, (d–f) Noul, (g–i) Goni. The first column shows observed SSC, the second column shows neural network-predicted SSC, and the third column shows the difference between prediction and observation (predicted minus observed).
Figure 6.
Comparison of observed, predicted, and differential SSC induced by typhoons in 2020: (a–c) Higos, (d–f) Noul, (g–i) Goni. The first column shows observed SSC, the second column shows neural network-predicted SSC, and the third column shows the difference between prediction and observation (predicted minus observed).
Figure 7.
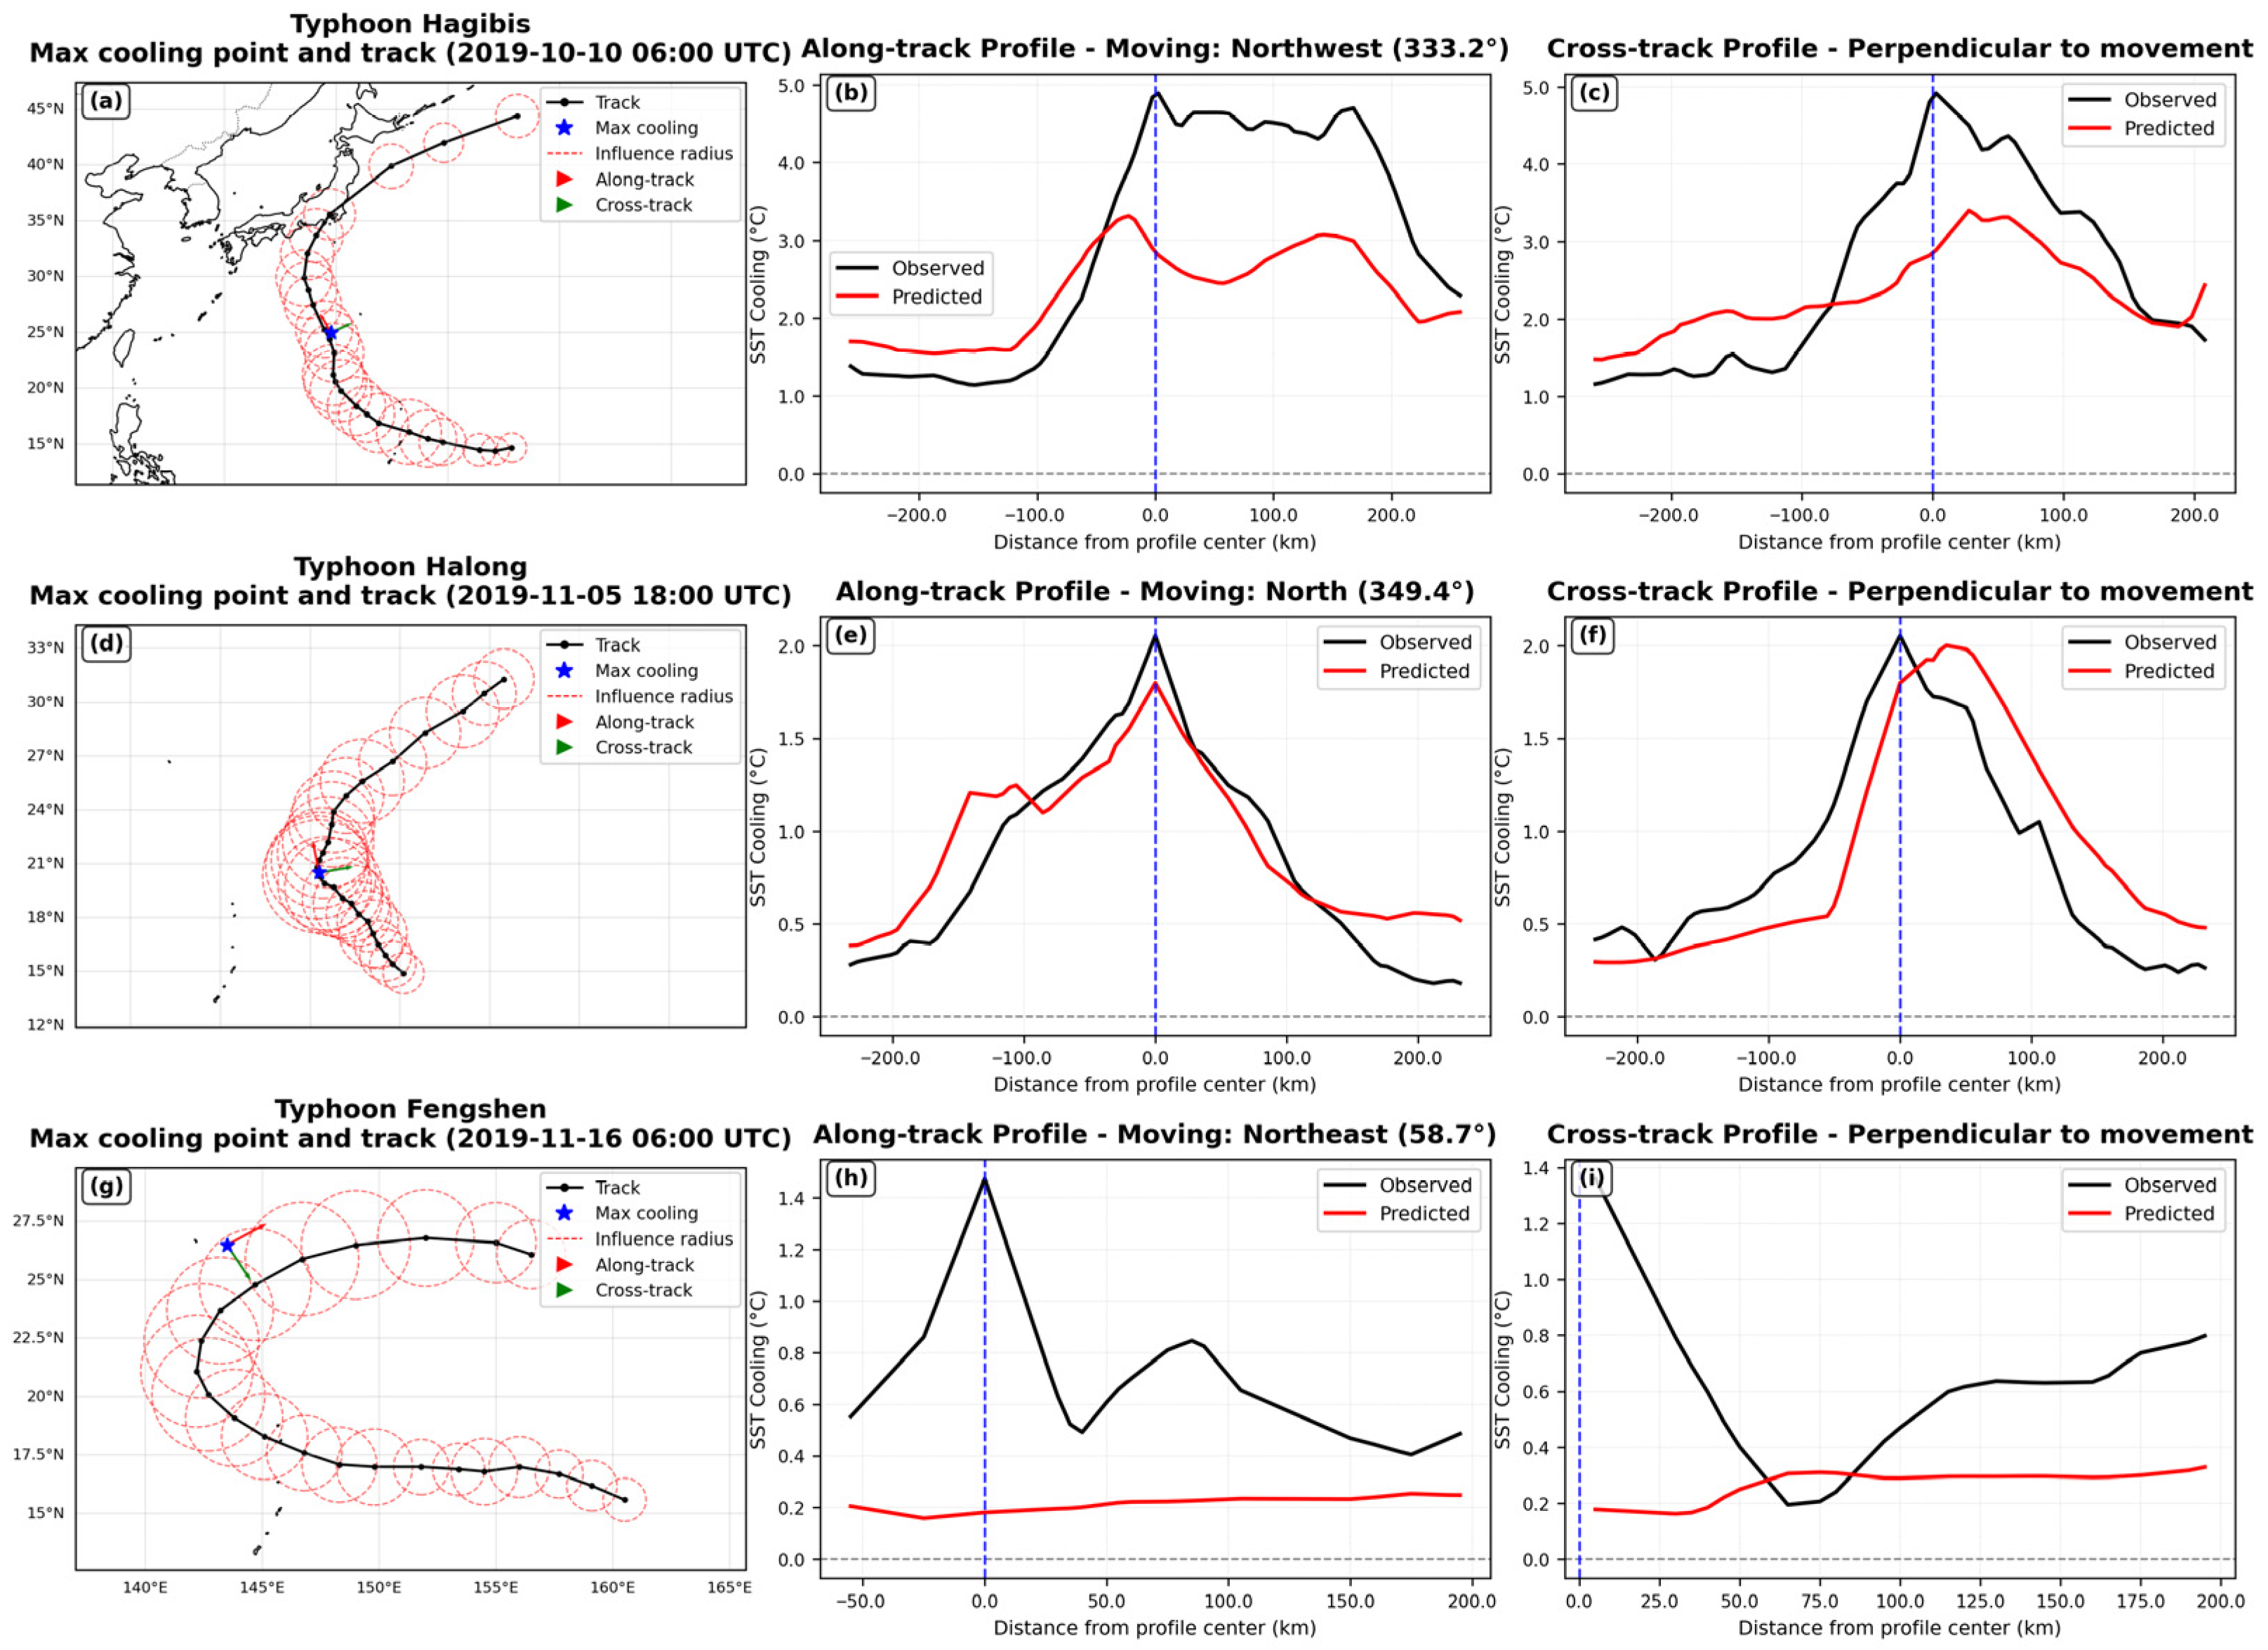
Cooling analysis at the maximum SSC point during Typhoons Hagibis, Halong, and Fengshen in 2019: Along-track and cross-track profiles. (a,d,g) Typhoon track maps showing the typhoon movement path and profile center locations; (b,e,h) SSC profiles along the typhoon movement direction; (c,f,i) SSC profiles perpendicular to the typhoon movement direction. Blue dotted lines indicate the location of the profile center.
Figure 7.
Cooling analysis at the maximum SSC point during Typhoons Hagibis, Halong, and Fengshen in 2019: Along-track and cross-track profiles. (a,d,g) Typhoon track maps showing the typhoon movement path and profile center locations; (b,e,h) SSC profiles along the typhoon movement direction; (c,f,i) SSC profiles perpendicular to the typhoon movement direction. Blue dotted lines indicate the location of the profile center.
Figure 8.
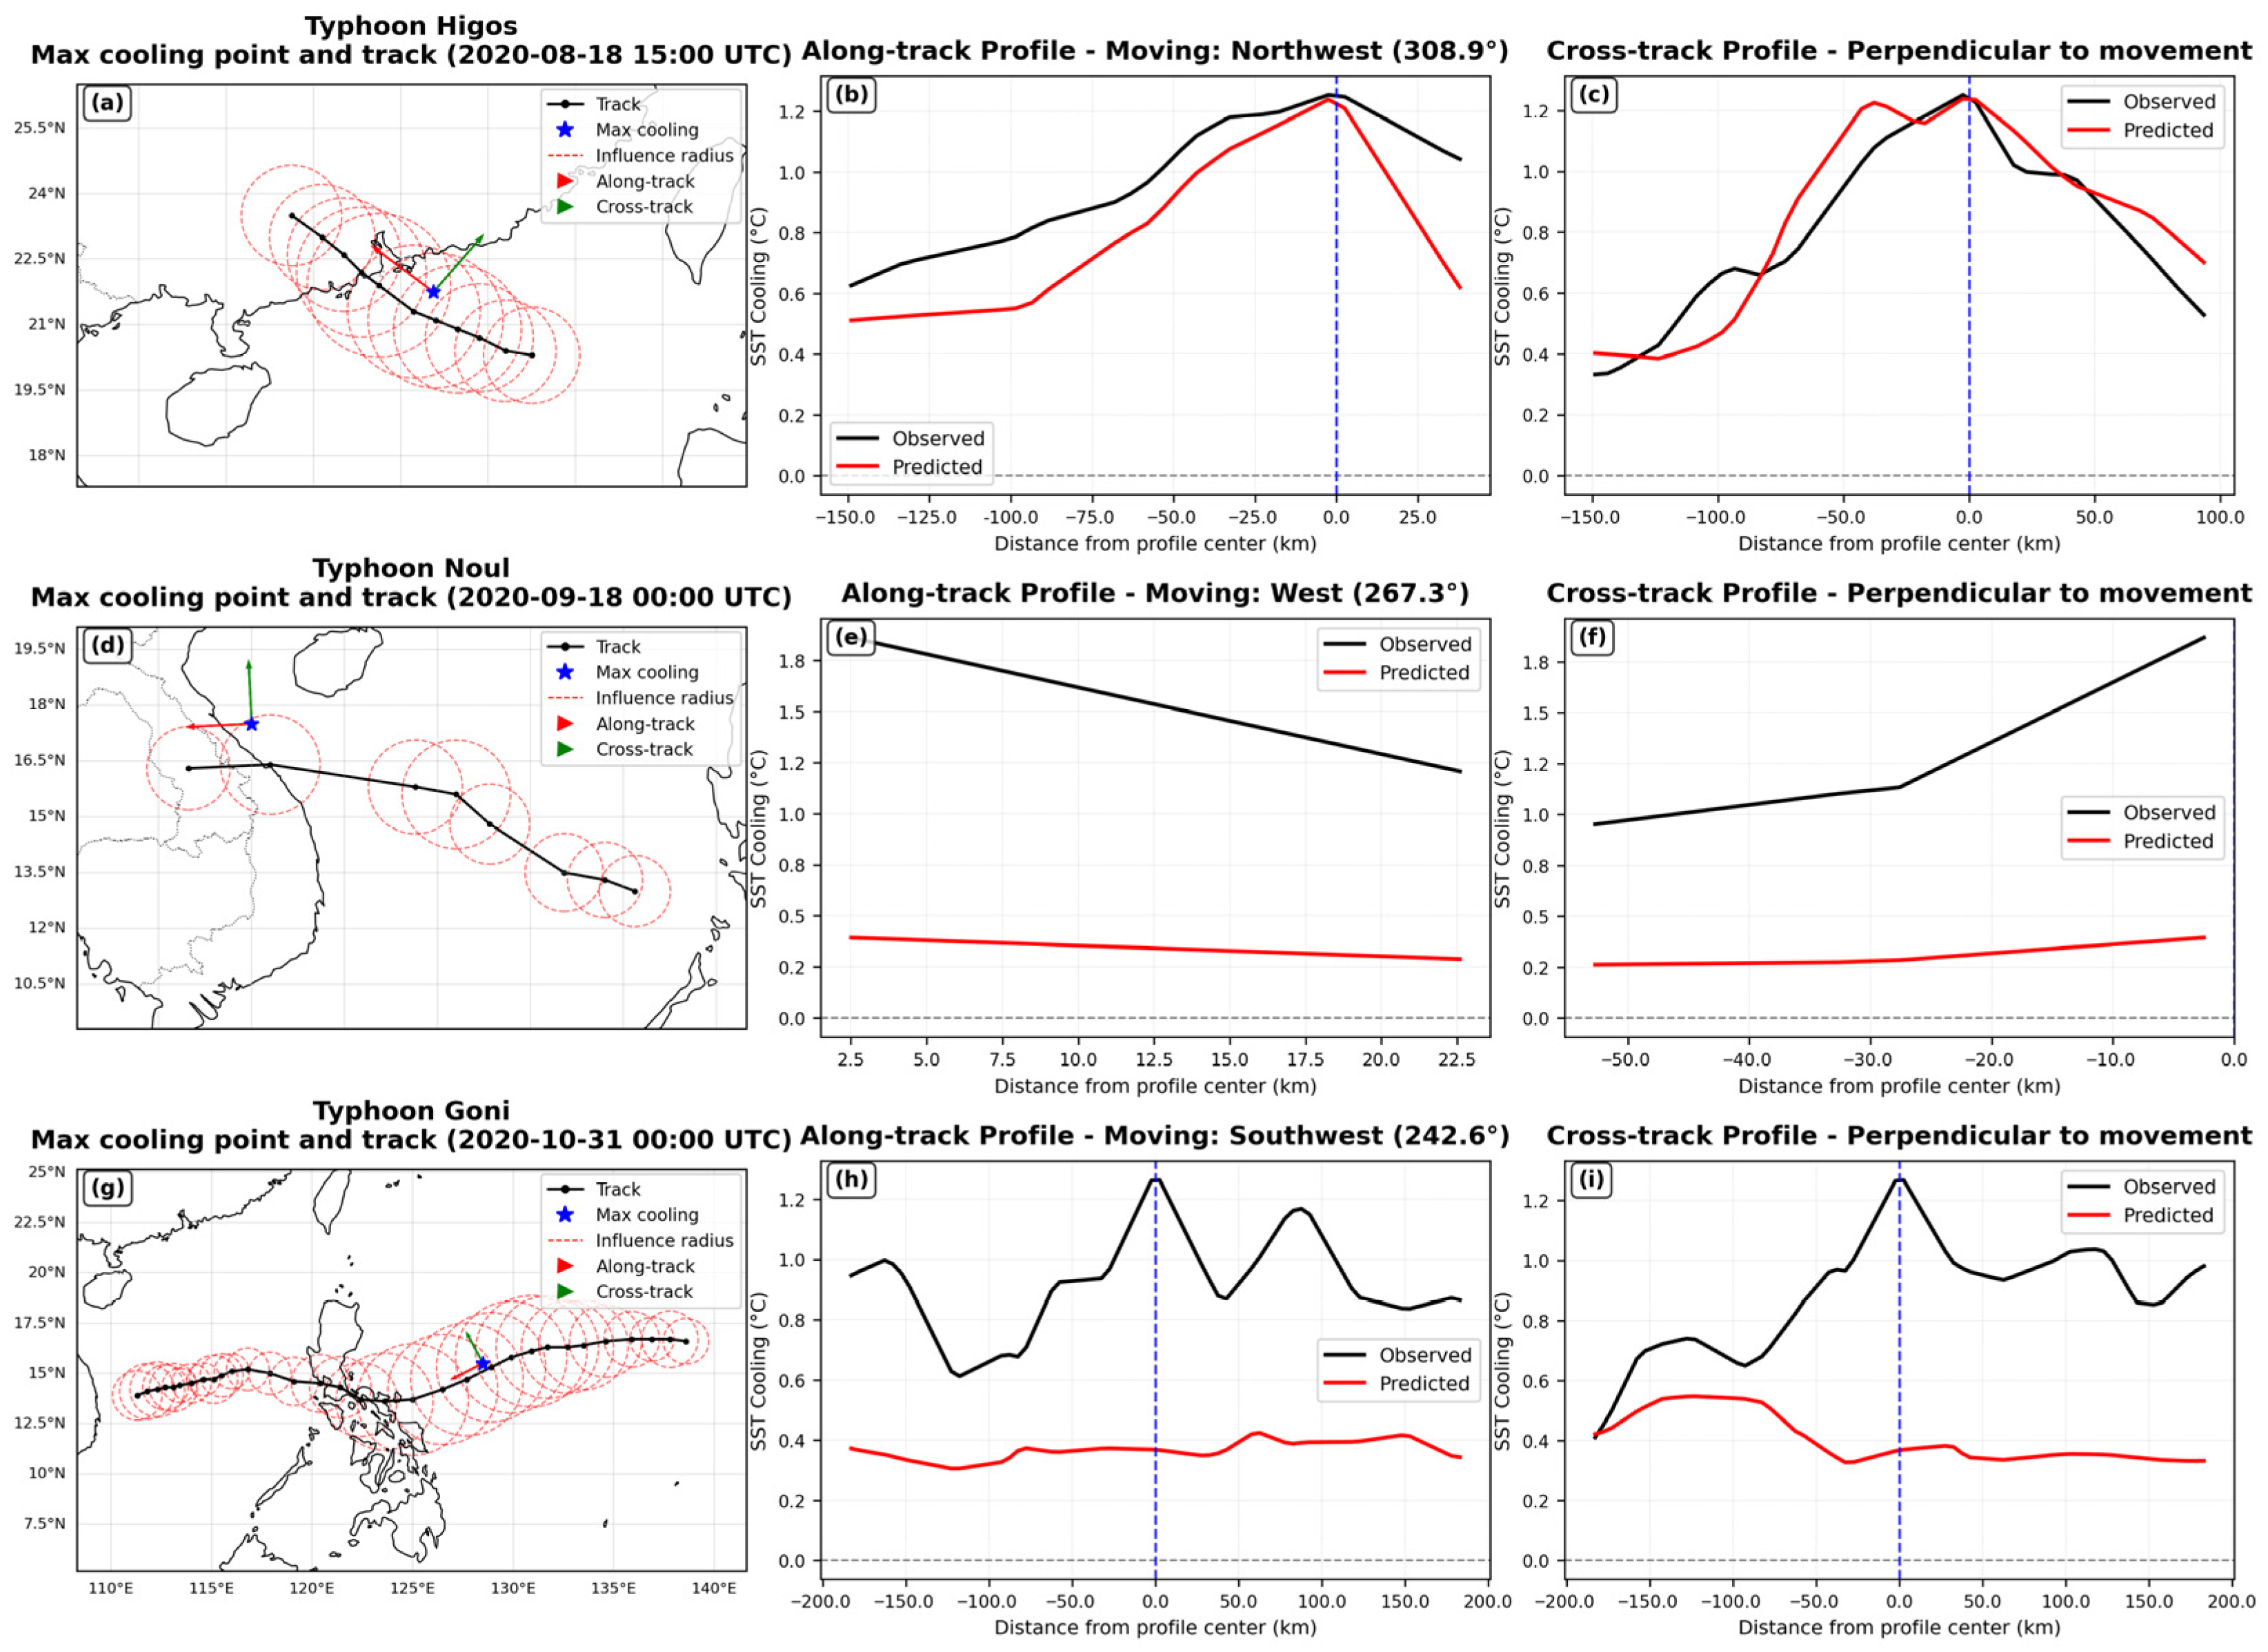
Cooling analysis at the maximum SSC point during Typhoons Higos, Noul, and Goni in 2020: Along-track and cross-track profiles. (a,d,g) Typhoon track maps showing the typhoon movement path and profile center locations; (b,e,h) SSC profiles along the typhoon movement direction; (c,f,i) SSC profiles perpendicular to the typhoon movement direction. Blue dotted lines indicate the location of the profile center.
Figure 8.
Cooling analysis at the maximum SSC point during Typhoons Higos, Noul, and Goni in 2020: Along-track and cross-track profiles. (a,d,g) Typhoon track maps showing the typhoon movement path and profile center locations; (b,e,h) SSC profiles along the typhoon movement direction; (c,f,i) SSC profiles perpendicular to the typhoon movement direction. Blue dotted lines indicate the location of the profile center.
Figure 9.
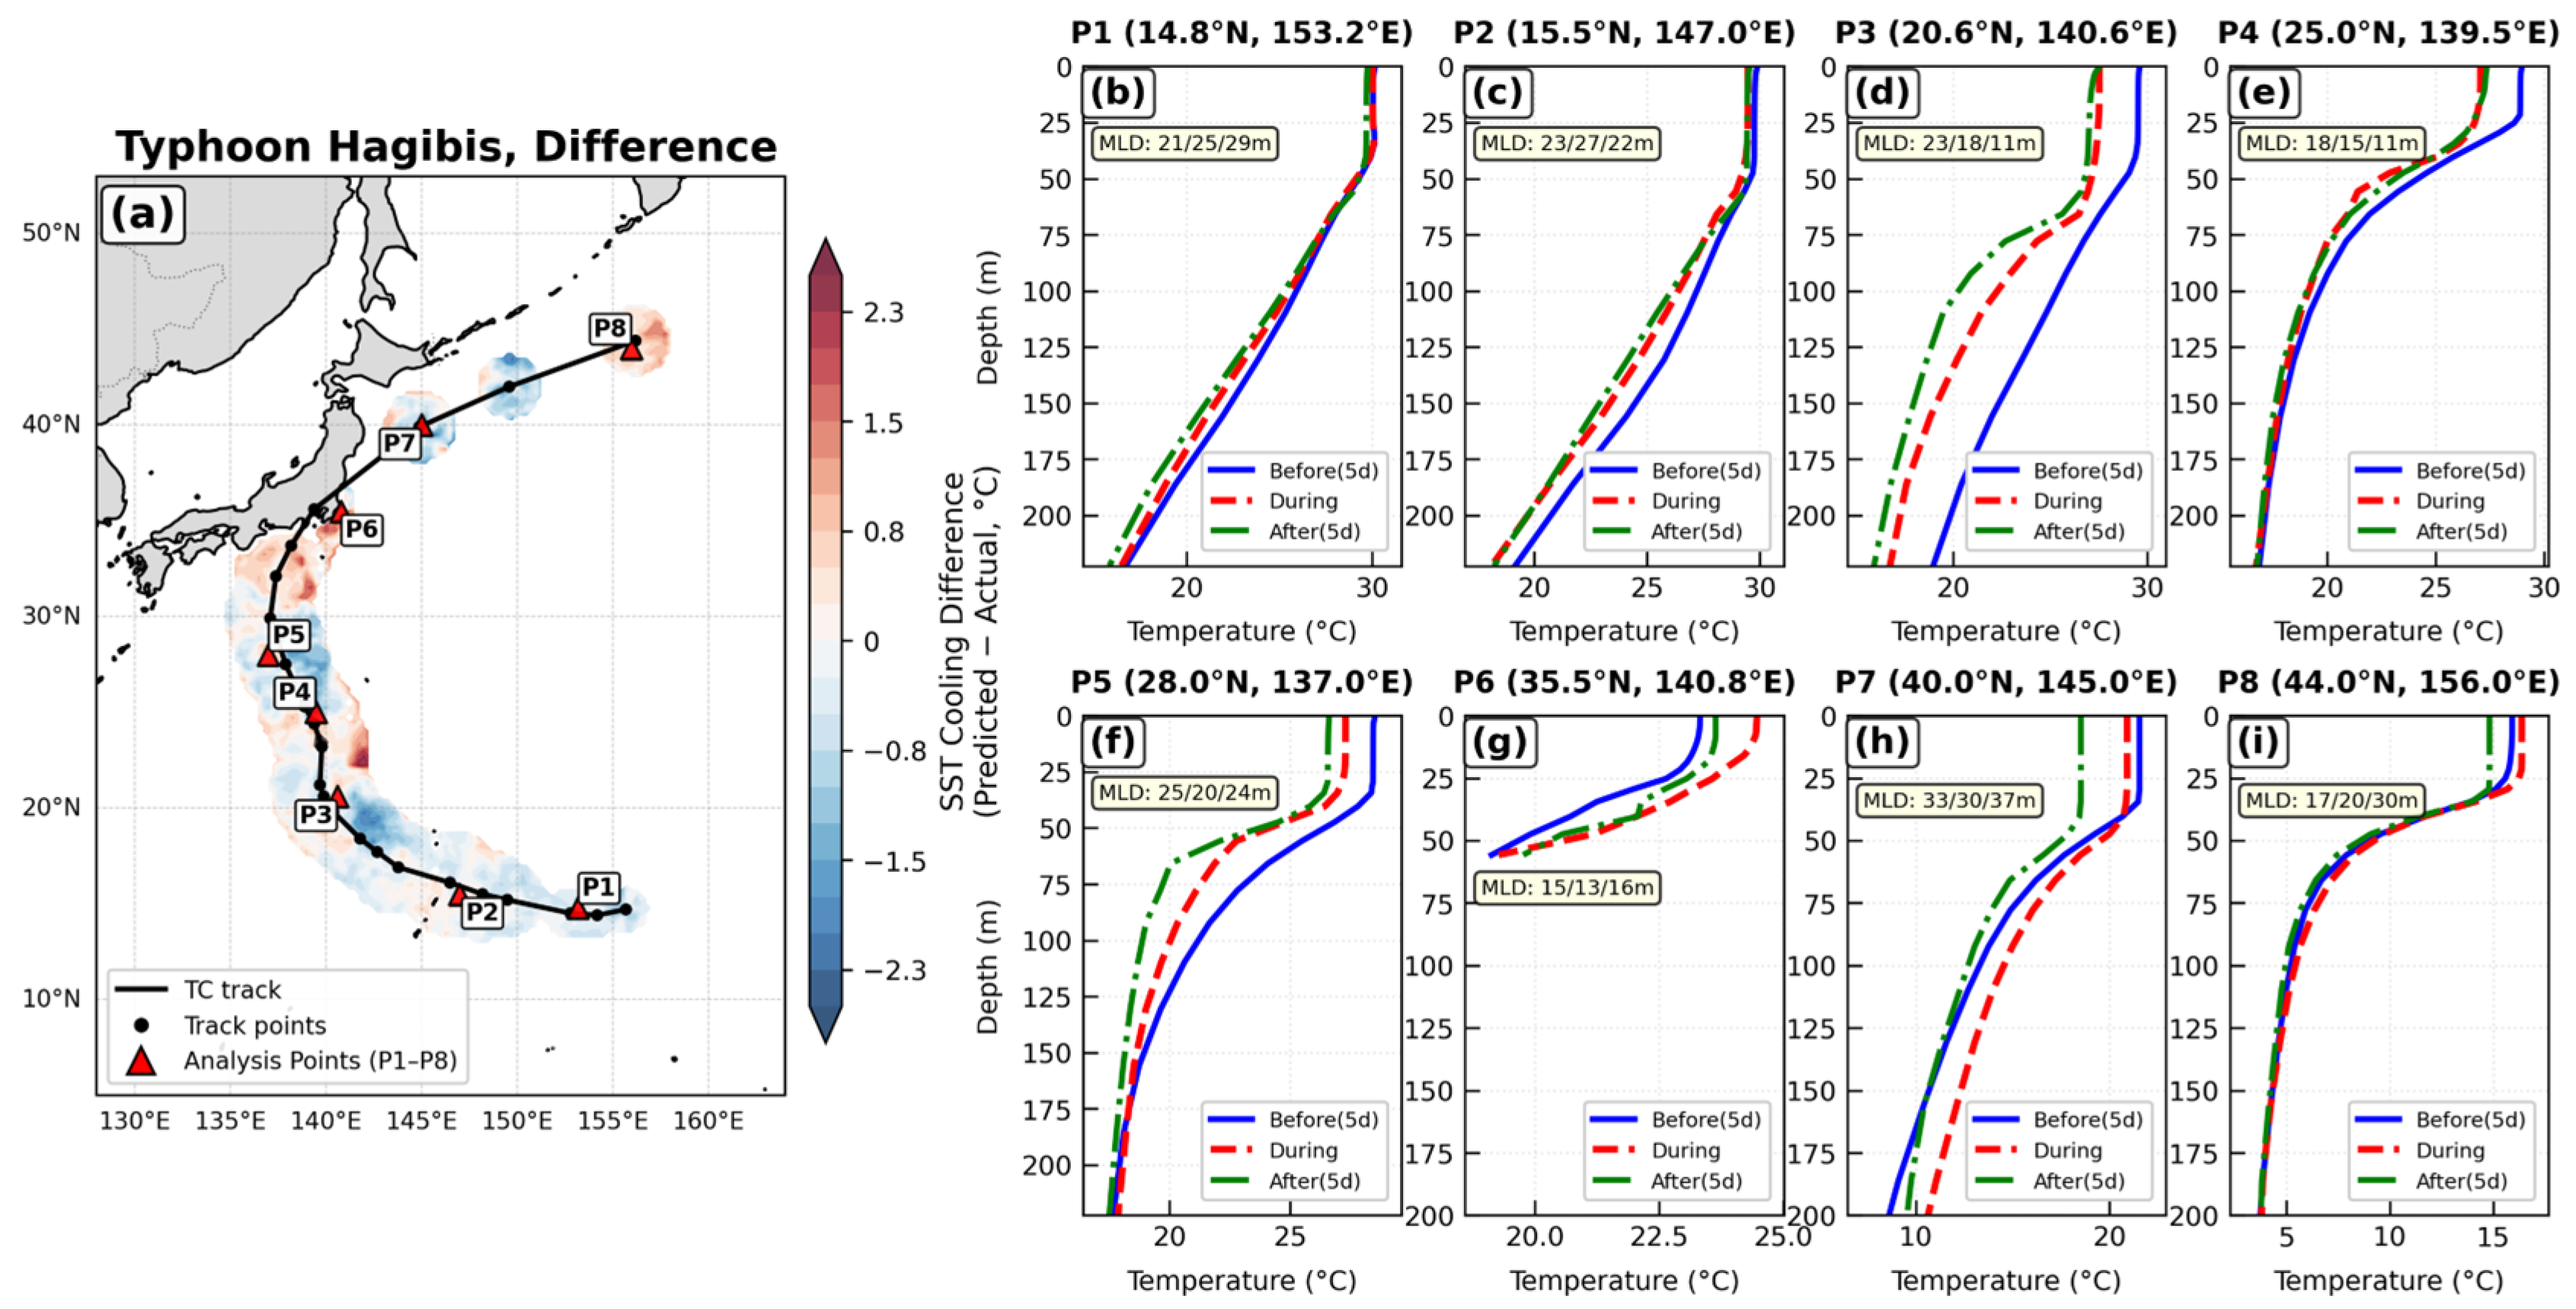
Difference between observed and model-predicted SSC for Typhoon Hagibis (2019) (a), and upper ocean temperature profiles (b–i) at locations indicated by the red triangles in (a). Solid, dashed, and dotted lines represent vertical temperature profiles before, during, and after the typhoon, respectively.
Figure 9.
Difference between observed and model-predicted SSC for Typhoon Hagibis (2019) (a), and upper ocean temperature profiles (b–i) at locations indicated by the red triangles in (a). Solid, dashed, and dotted lines represent vertical temperature profiles before, during, and after the typhoon, respectively.
Figure 10.
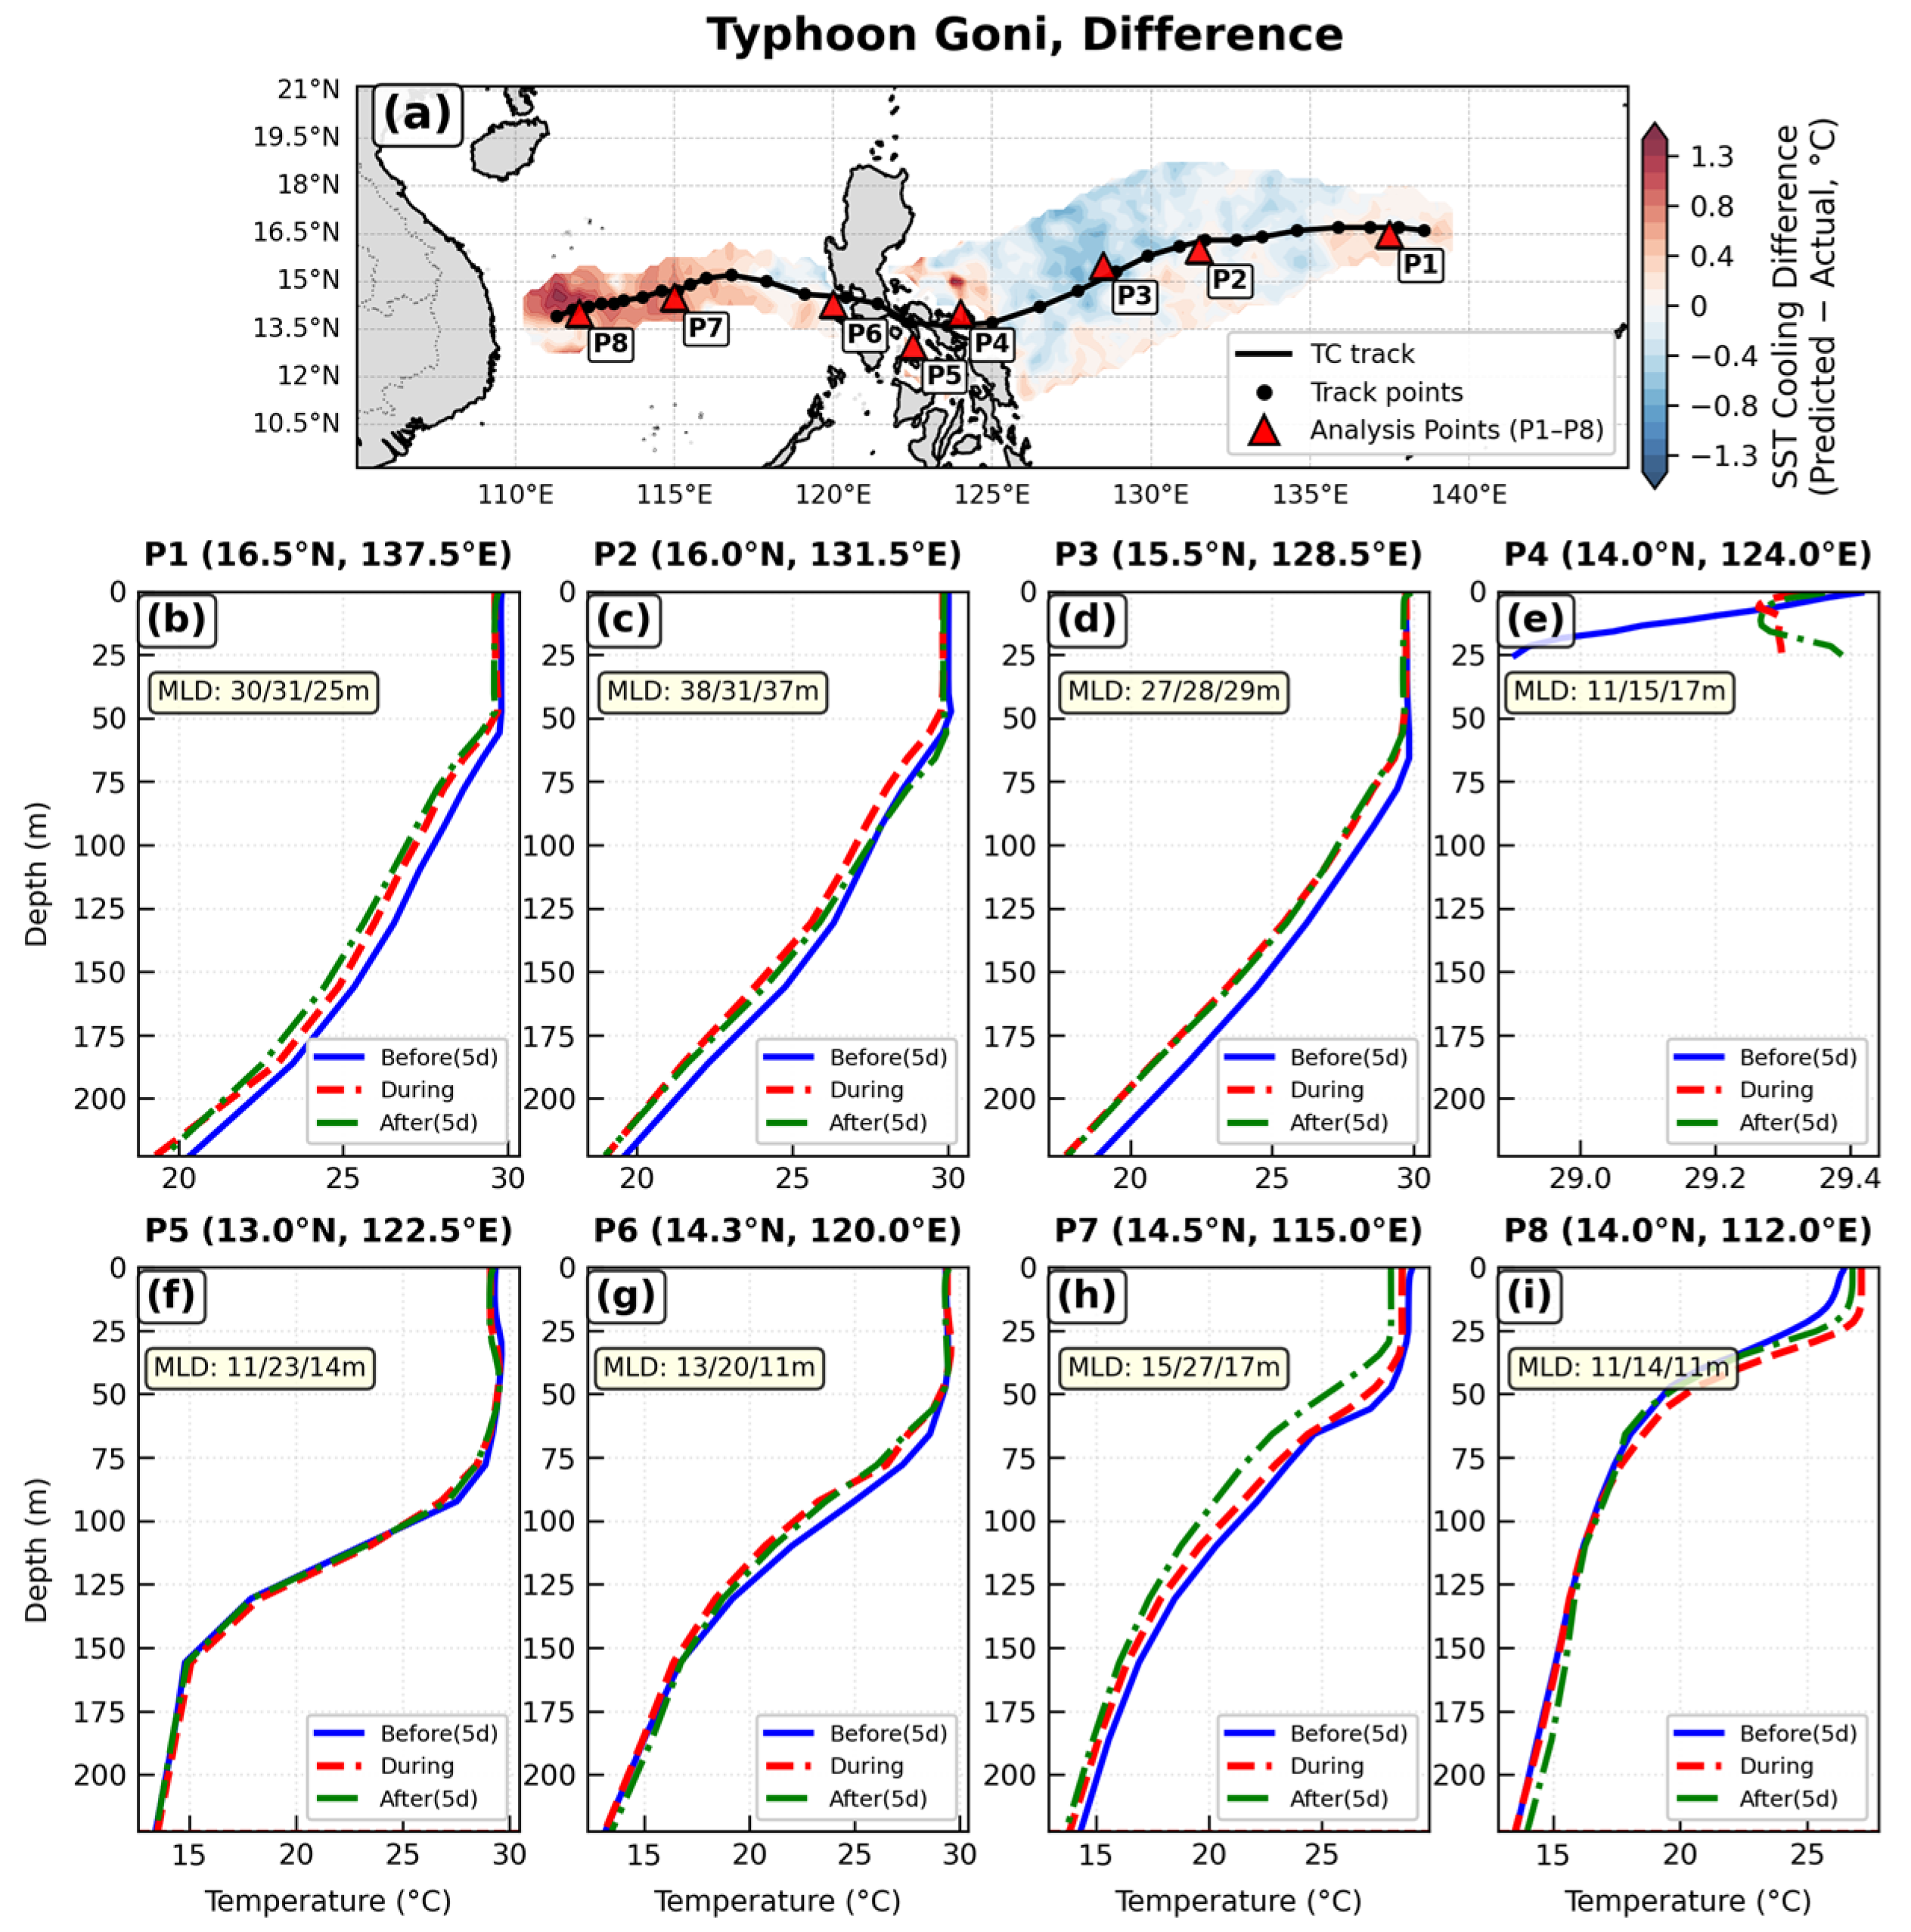
Difference between observed and model-predicted SSC for Typhoon Goni (2020) (a), and upper ocean temperature profiles (b–i) at locations indicated by the red triangles in (a). Solid, dashed, and dotted lines represent vertical temperature profiles before, during, and after the typhoon, respectively.
Figure 10.
Difference between observed and model-predicted SSC for Typhoon Goni (2020) (a), and upper ocean temperature profiles (b–i) at locations indicated by the red triangles in (a). Solid, dashed, and dotted lines represent vertical temperature profiles before, during, and after the typhoon, respectively.
Figure 11.
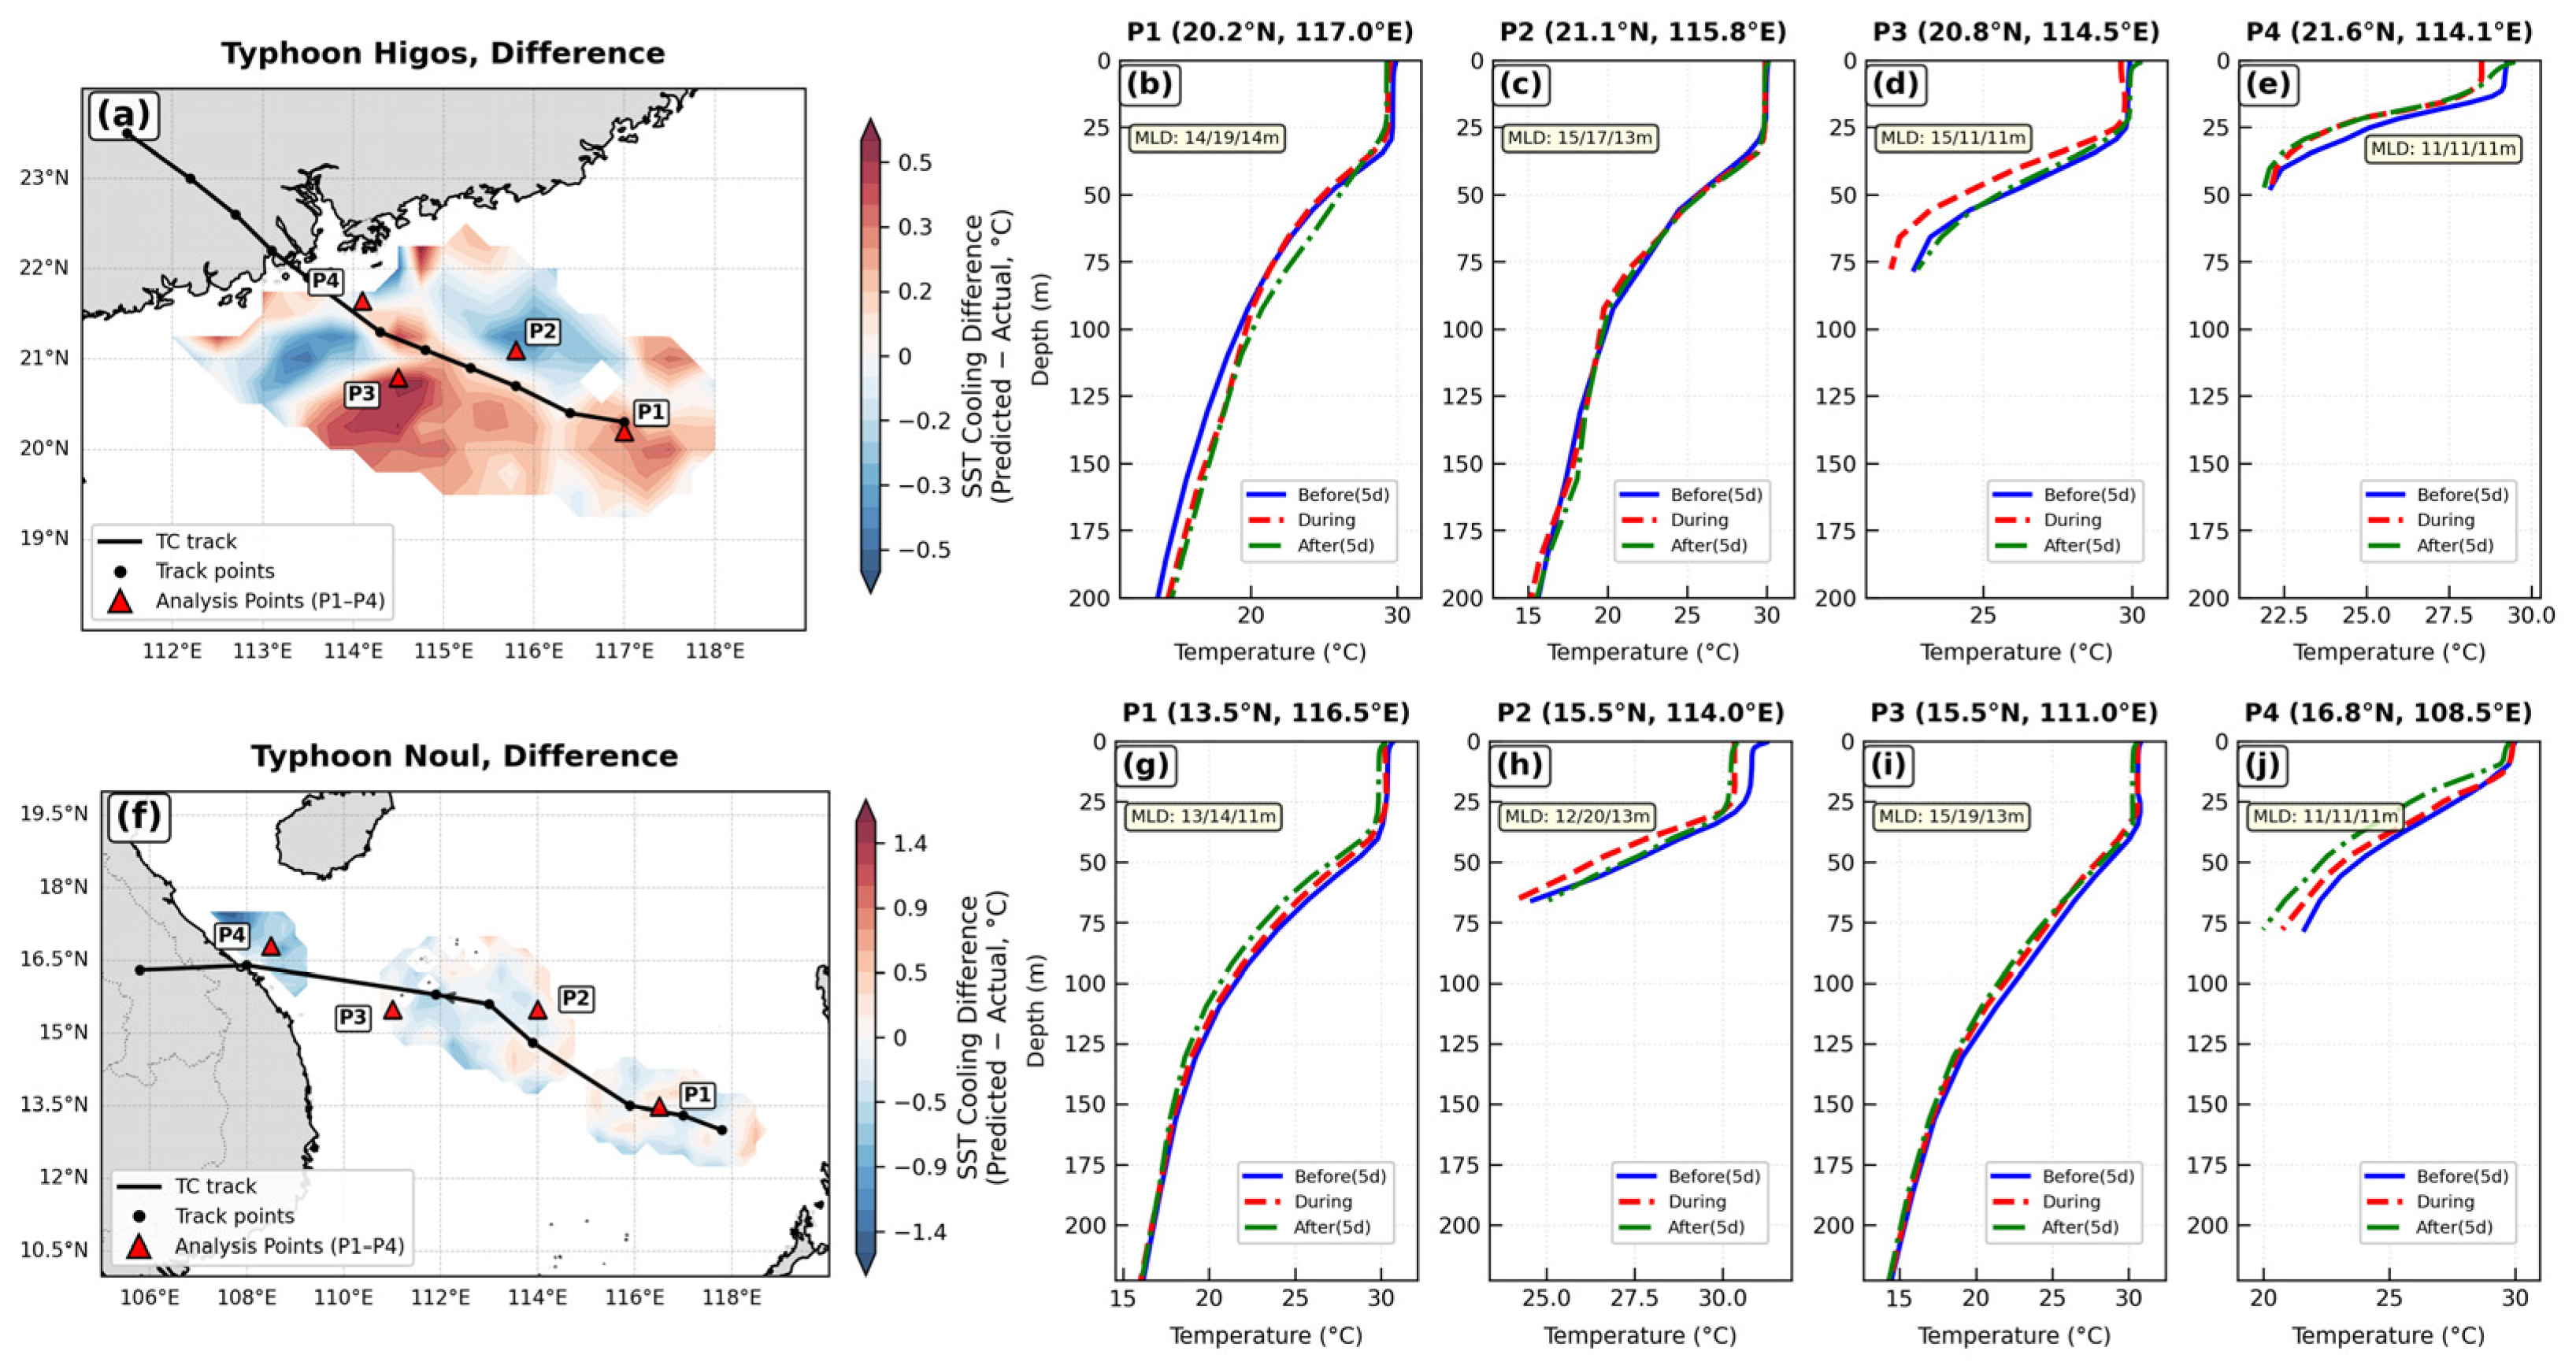
Difference between observed and model-predicted SSC for Typhoon Higos (2020) (a), and upper ocean temperature profiles (b–e) at locations indicated by the red triangles in (a); and difference between observed and model-predicted SSC for Typhoon Noul (2020) (f), and upper ocean temperature profiles (g–j) at locations indicated by the red triangles in (f). Solid, dashed, and dotted lines represent vertical temperature profiles before, during, and after the typhoon, respectively.
Figure 11.
Difference between observed and model-predicted SSC for Typhoon Higos (2020) (a), and upper ocean temperature profiles (b–e) at locations indicated by the red triangles in (a); and difference between observed and model-predicted SSC for Typhoon Noul (2020) (f), and upper ocean temperature profiles (g–j) at locations indicated by the red triangles in (f). Solid, dashed, and dotted lines represent vertical temperature profiles before, during, and after the typhoon, respectively.
Figure 12.
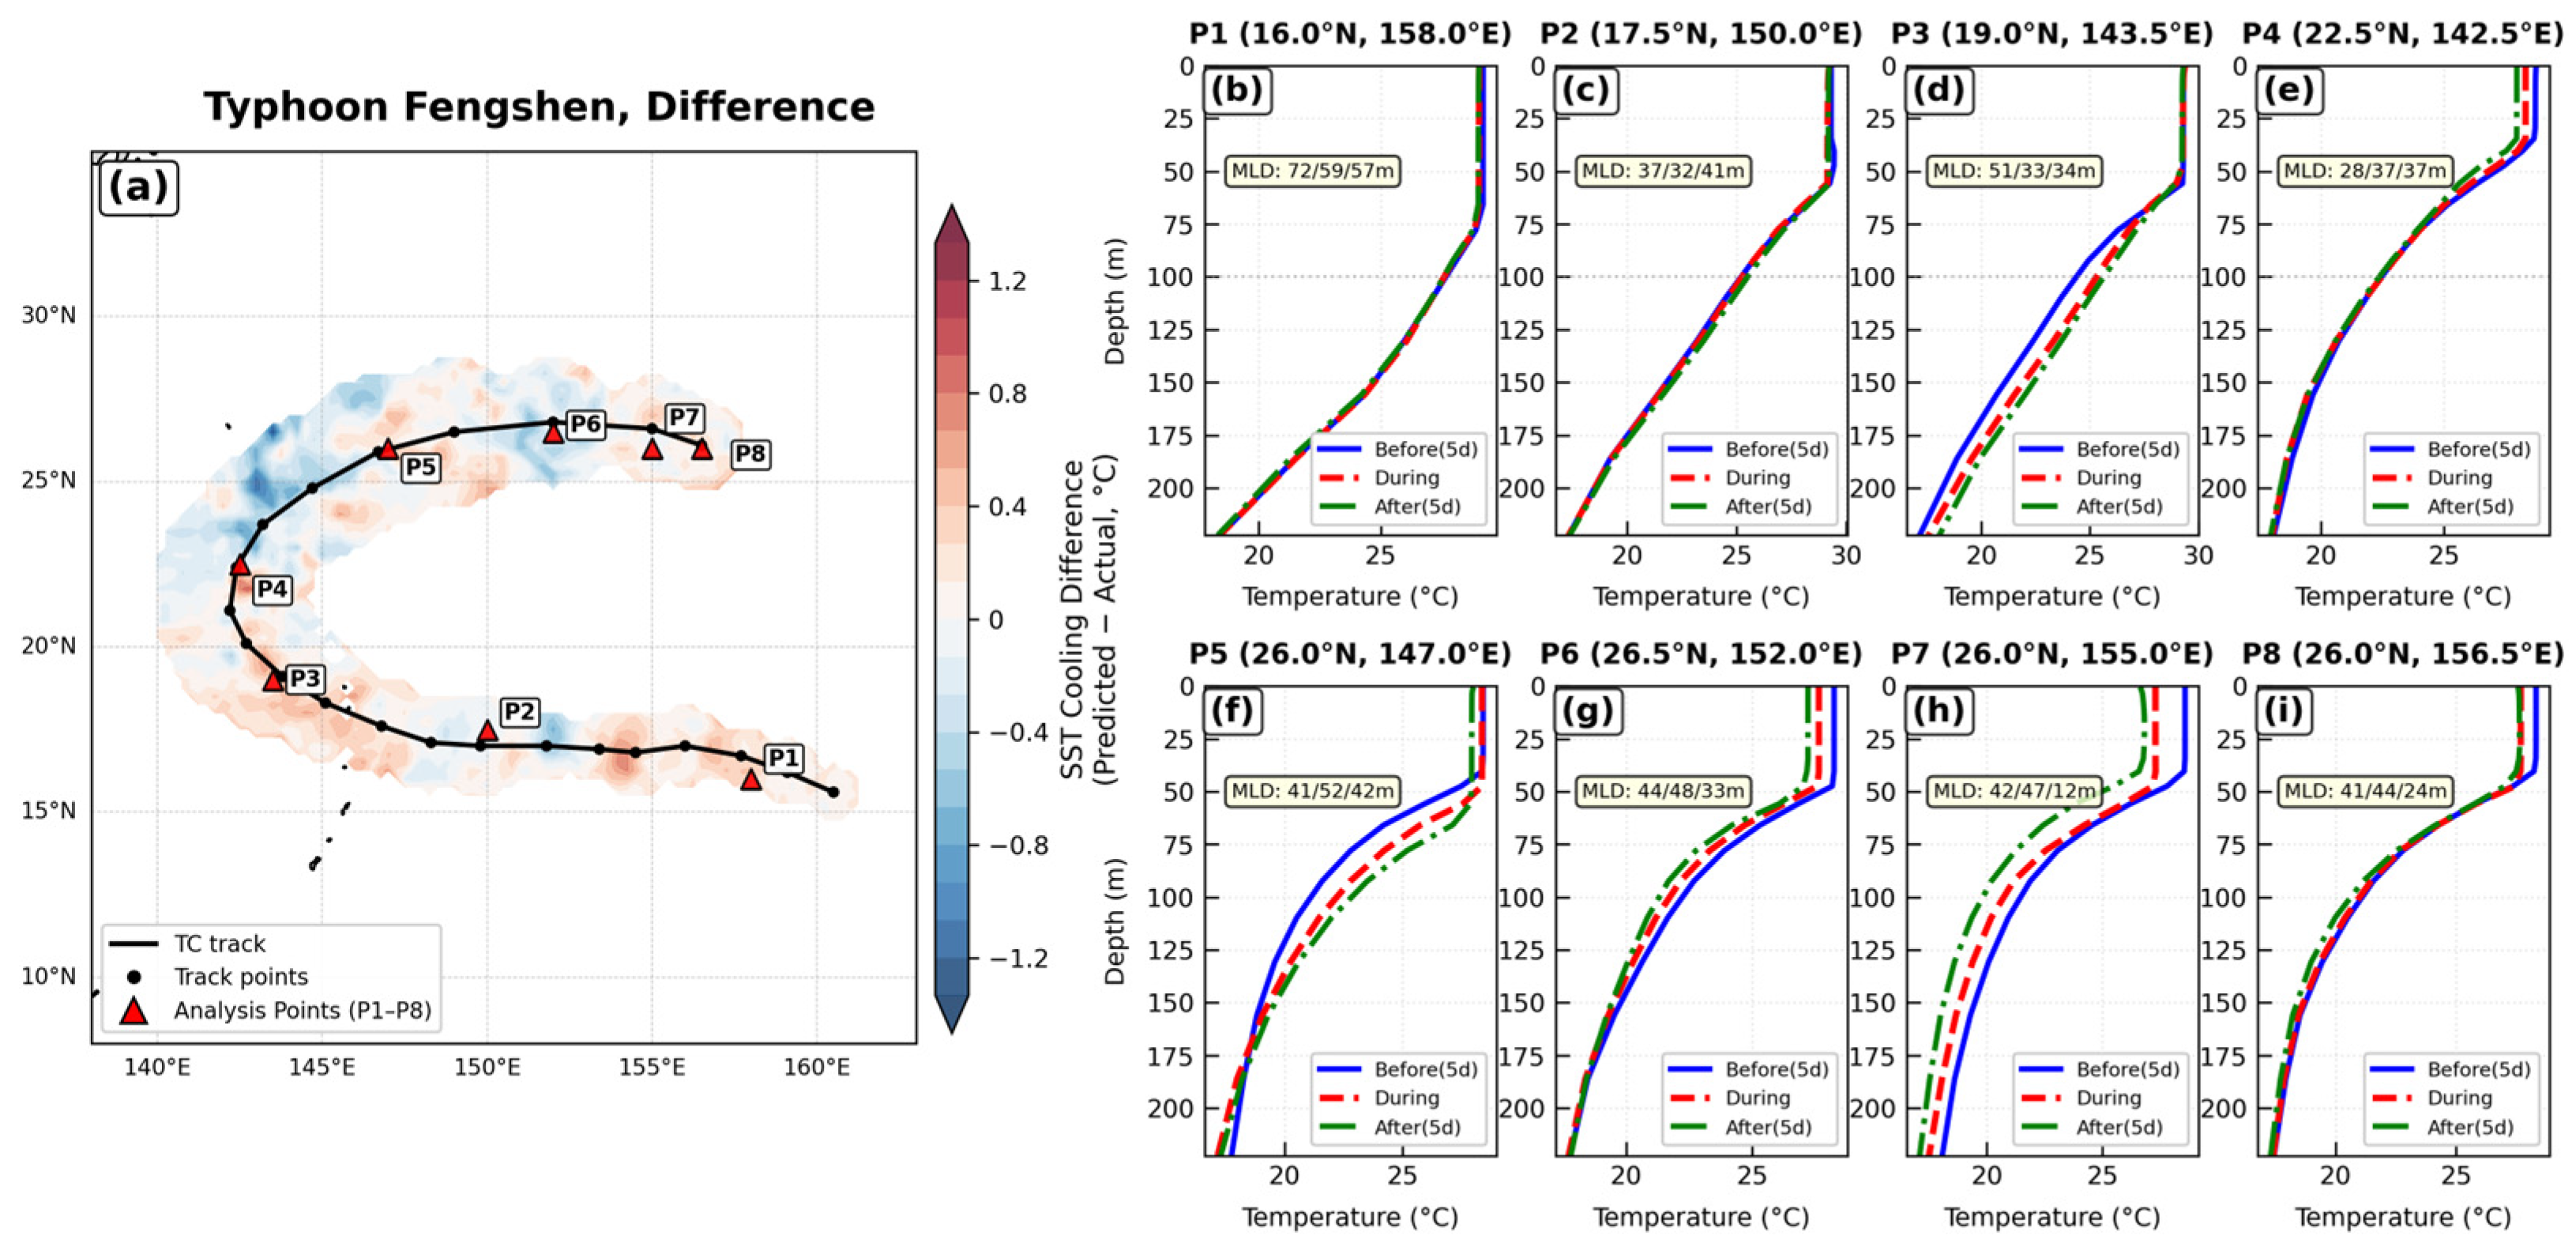
Difference between observed and model-predicted SSC for Typhoon Fengshen (2019) (a), and upper ocean temperature profiles (b–i) at locations indicated by the red triangles in (a). Solid, dashed, and dotted lines represent vertical temperature profiles before, during, and after the typhoon, respectively.
Figure 12.
Difference between observed and model-predicted SSC for Typhoon Fengshen (2019) (a), and upper ocean temperature profiles (b–i) at locations indicated by the red triangles in (a). Solid, dashed, and dotted lines represent vertical temperature profiles before, during, and after the typhoon, respectively.
Figure 13.
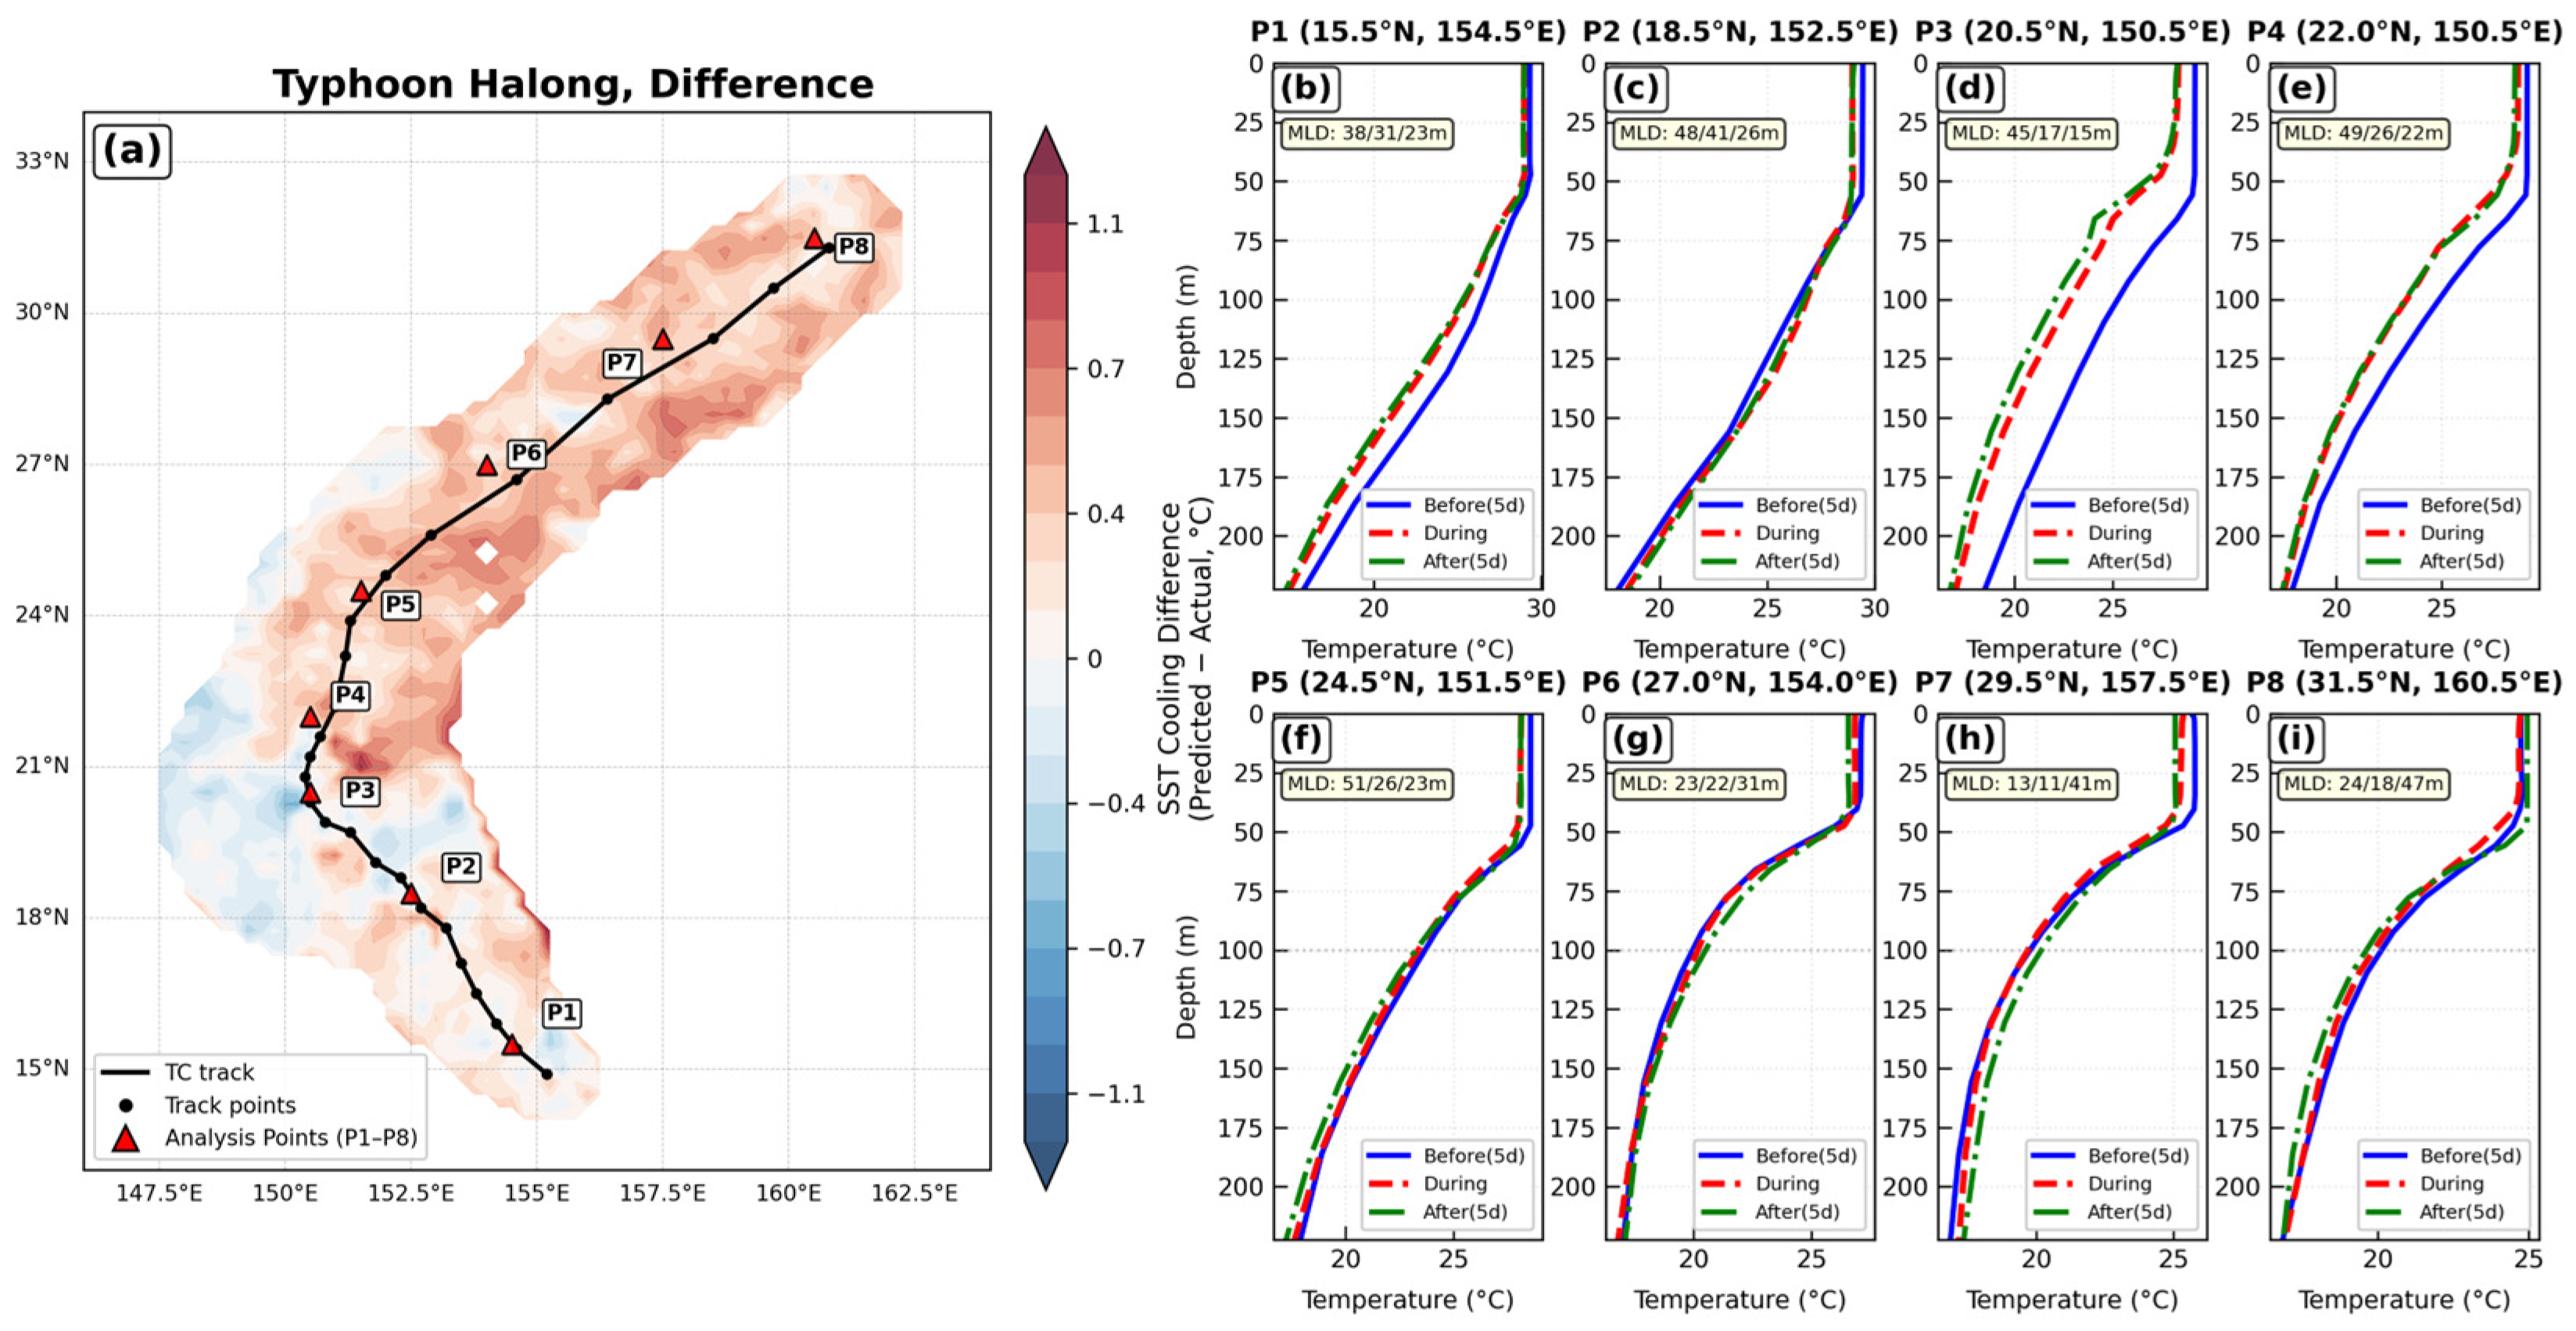
Difference between observed and model-predicted SSC for Typhoon Halong (2019) (a), and upper ocean temperature profiles (b–i) at locations indicated by the red triangles in (a). Solid, dashed, and dotted lines represent vertical temperature profiles before, during, and after the typhoon, respectively.
Figure 13.
Difference between observed and model-predicted SSC for Typhoon Halong (2019) (a), and upper ocean temperature profiles (b–i) at locations indicated by the red triangles in (a). Solid, dashed, and dotted lines represent vertical temperature profiles before, during, and after the typhoon, respectively.
Figure 14.
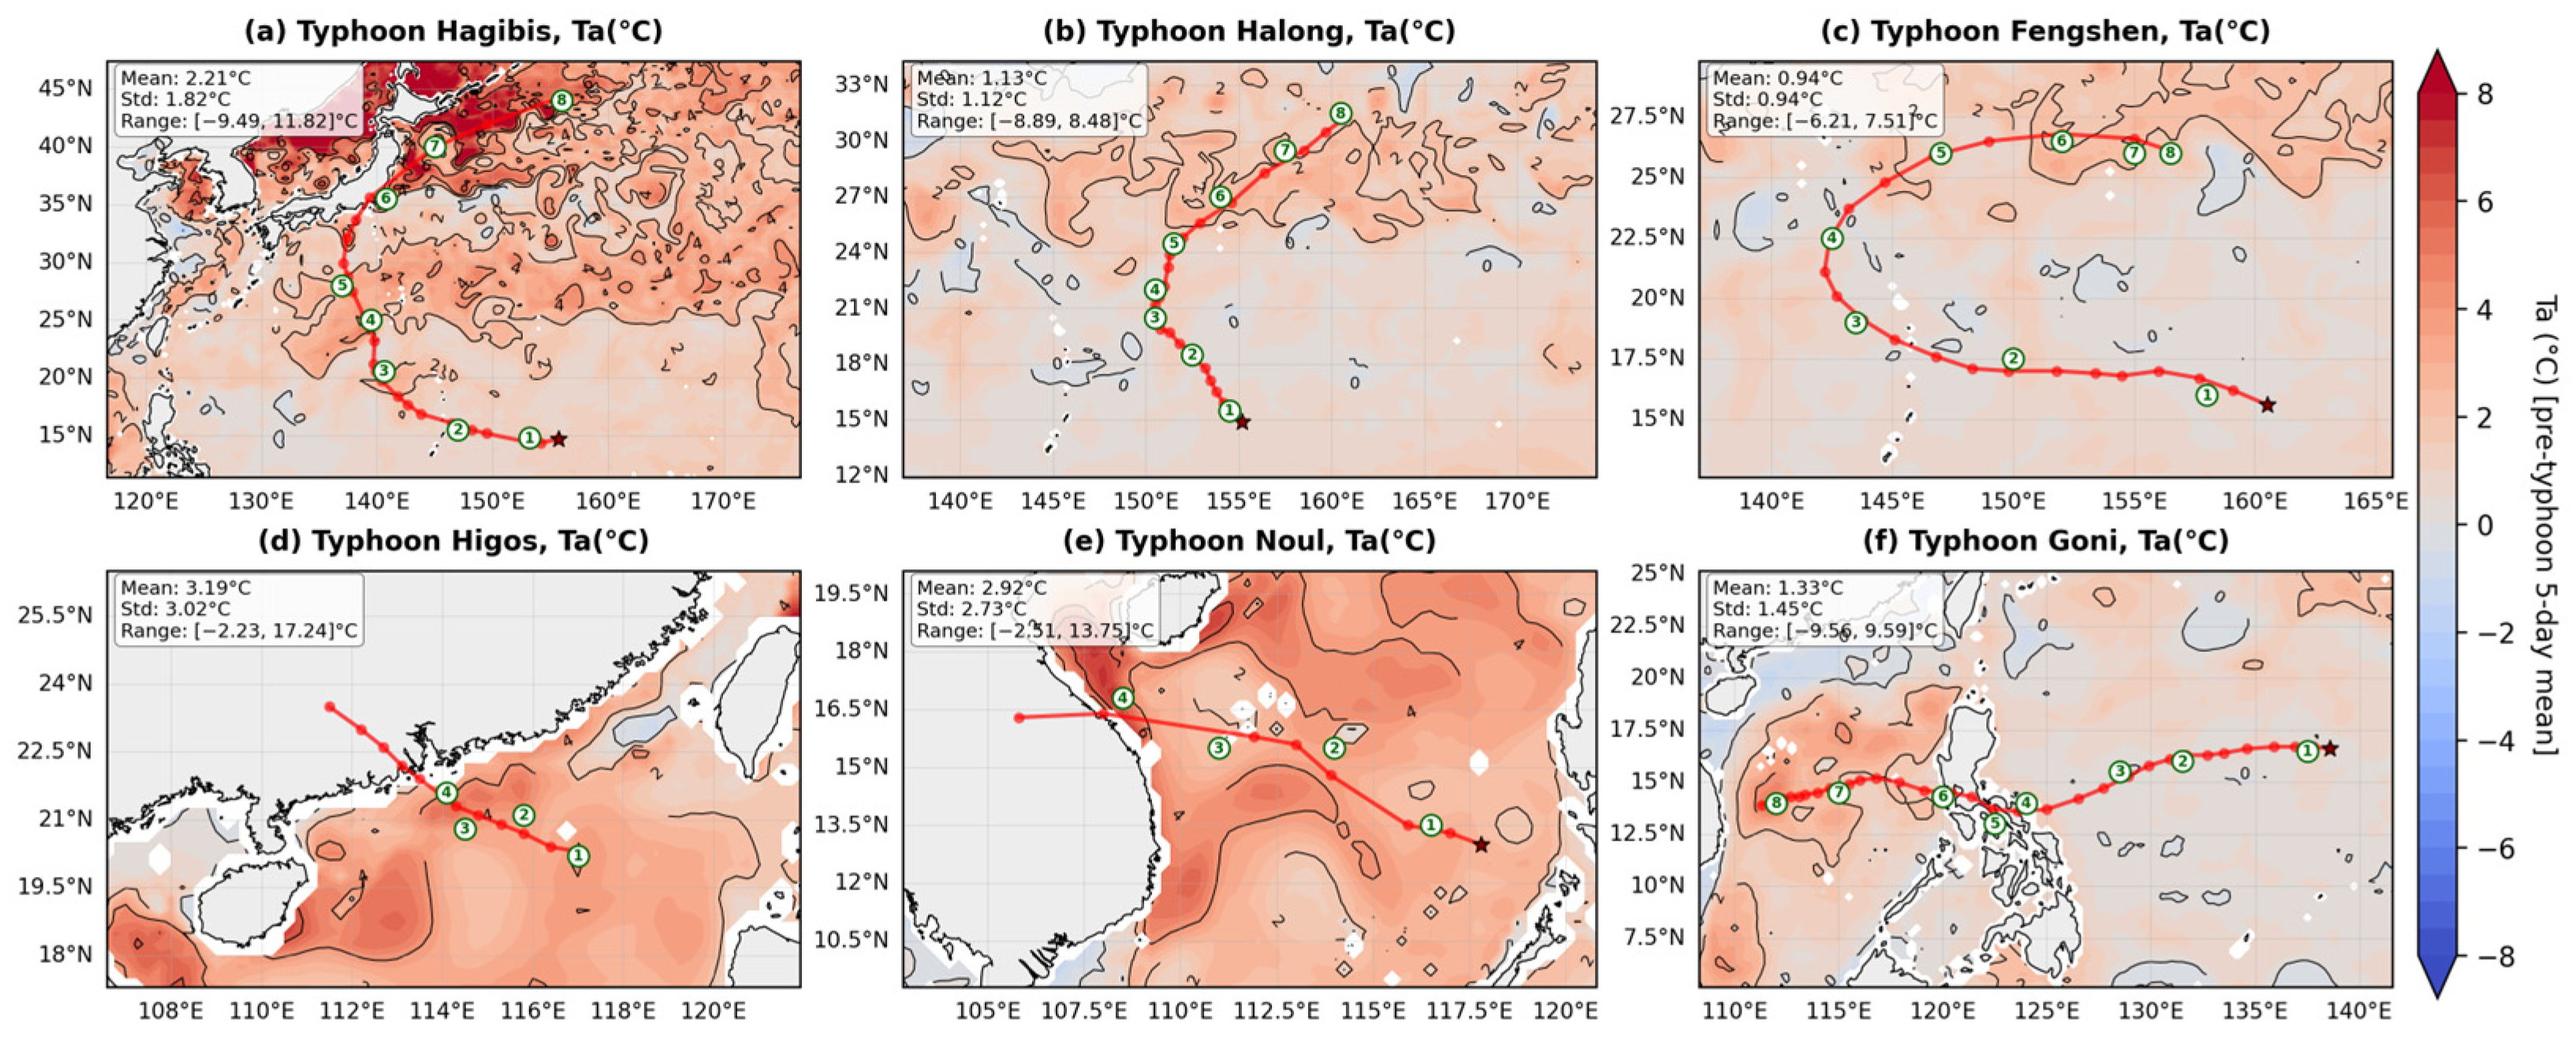
Spatial distribution of the pre-typhoon 5-day average temperature anomaly () for each typhoon. Selected points are marked by white circles with green numbers. (a) Hagibis; (b) Halong; (c) Fengshen; (d) Higos; (e) Noul; (f) Goni.
Figure 14.
Spatial distribution of the pre-typhoon 5-day average temperature anomaly () for each typhoon. Selected points are marked by white circles with green numbers. (a) Hagibis; (b) Halong; (c) Fengshen; (d) Higos; (e) Noul; (f) Goni.
Figure 15.
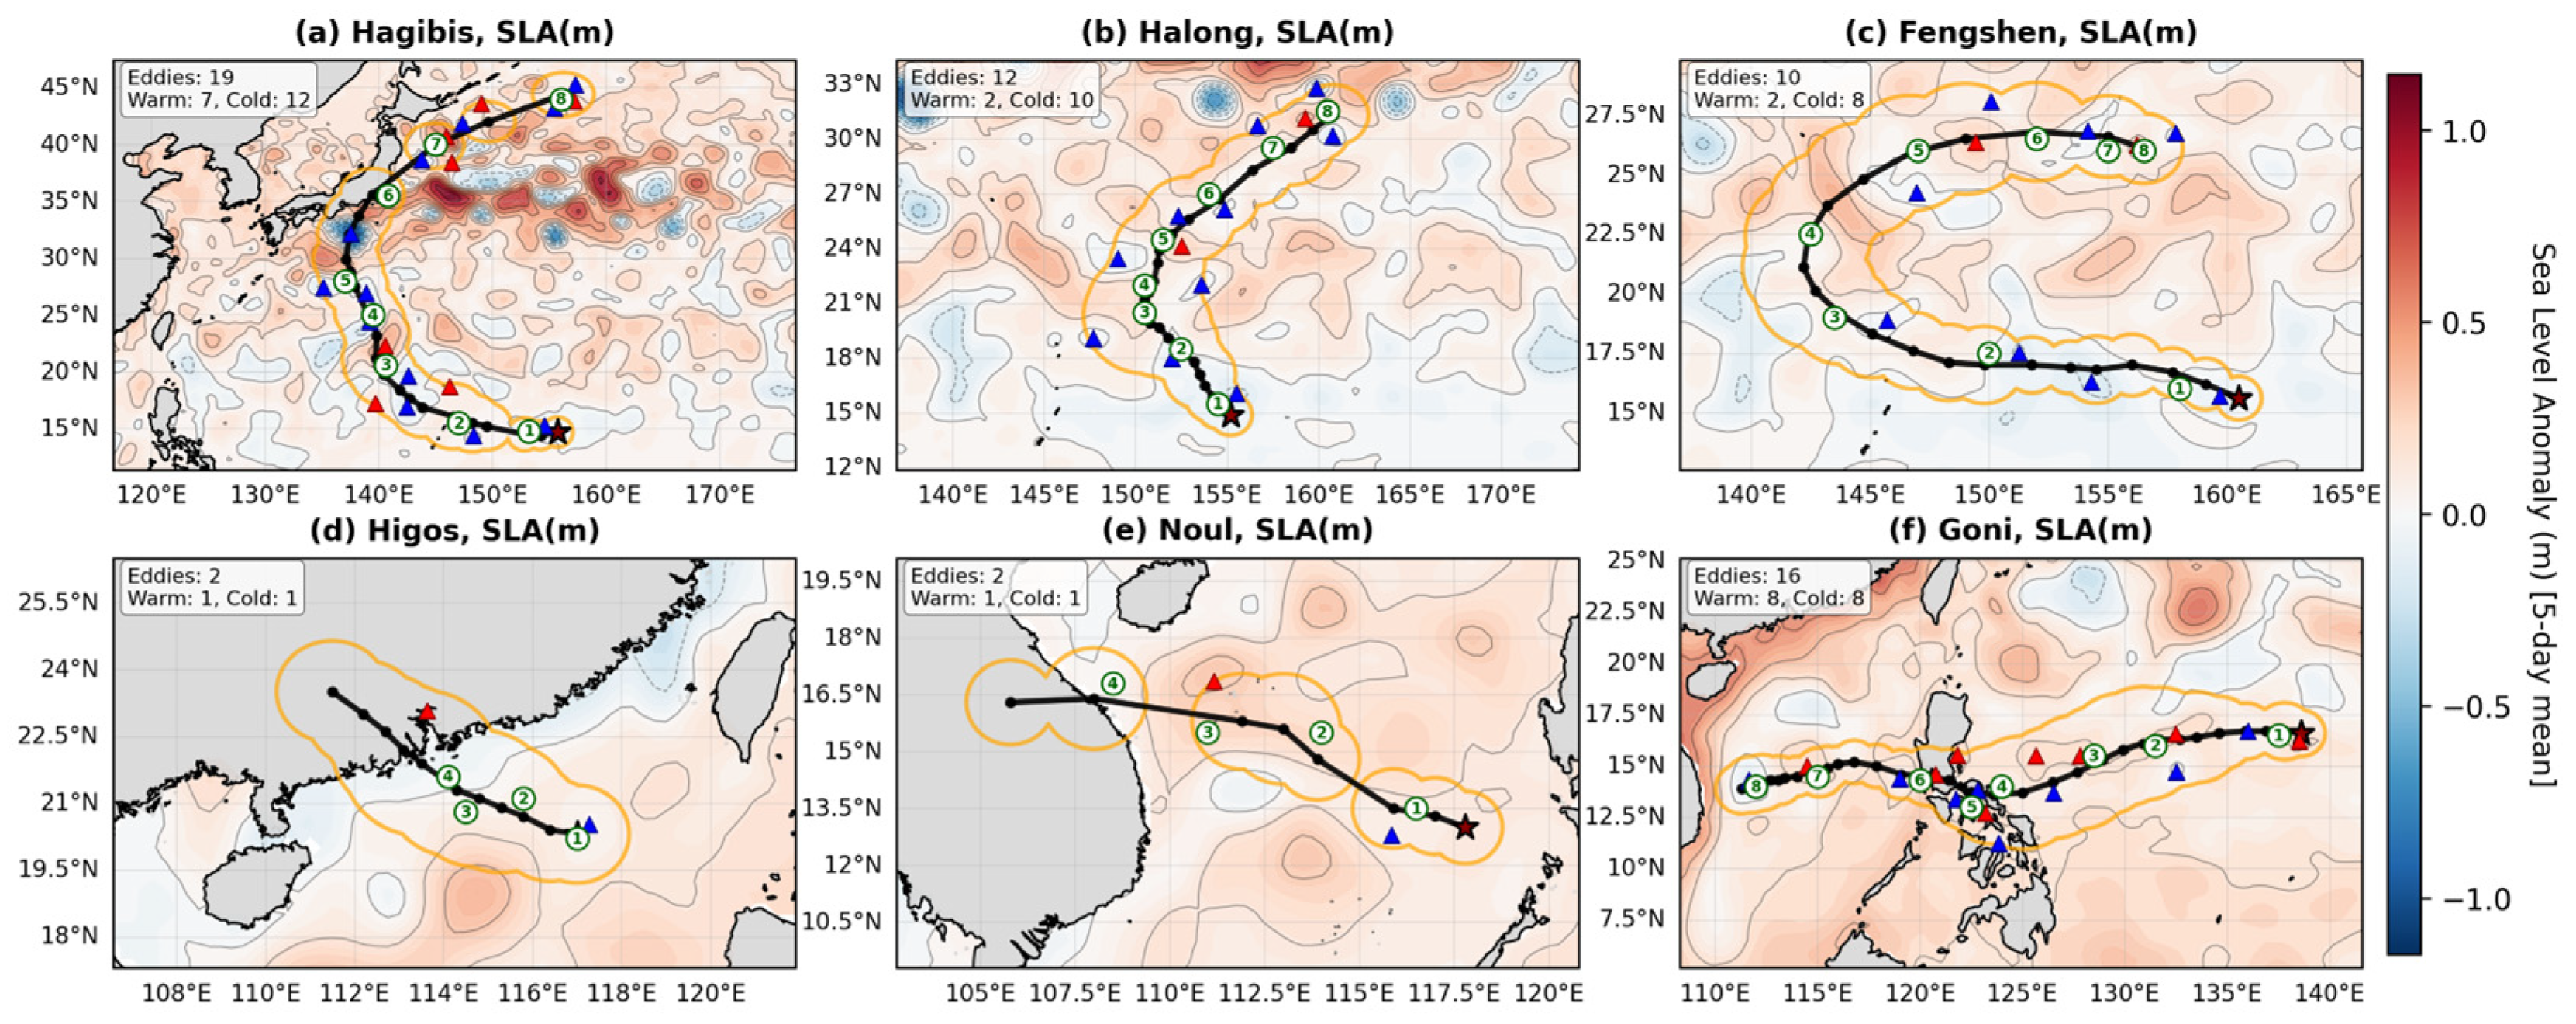
The observed SLA field averaged over the 5 days before each typhoon transit. The orange boundary line denotes the Category 8 wind circle. Background mesoscale eddies within this radius are identified and marked (warm eddies: red triangles; cold eddies: blue triangles). White circles with green numbers mark the selected points. (a) Hagibis; (b) Halong; (c) Fengshen; (d) Higos; (e) Noul; (f) Goni.
Figure 15.
The observed SLA field averaged over the 5 days before each typhoon transit. The orange boundary line denotes the Category 8 wind circle. Background mesoscale eddies within this radius are identified and marked (warm eddies: red triangles; cold eddies: blue triangles). White circles with green numbers mark the selected points. (a) Hagibis; (b) Halong; (c) Fengshen; (d) Higos; (e) Noul; (f) Goni.
Figure 16.
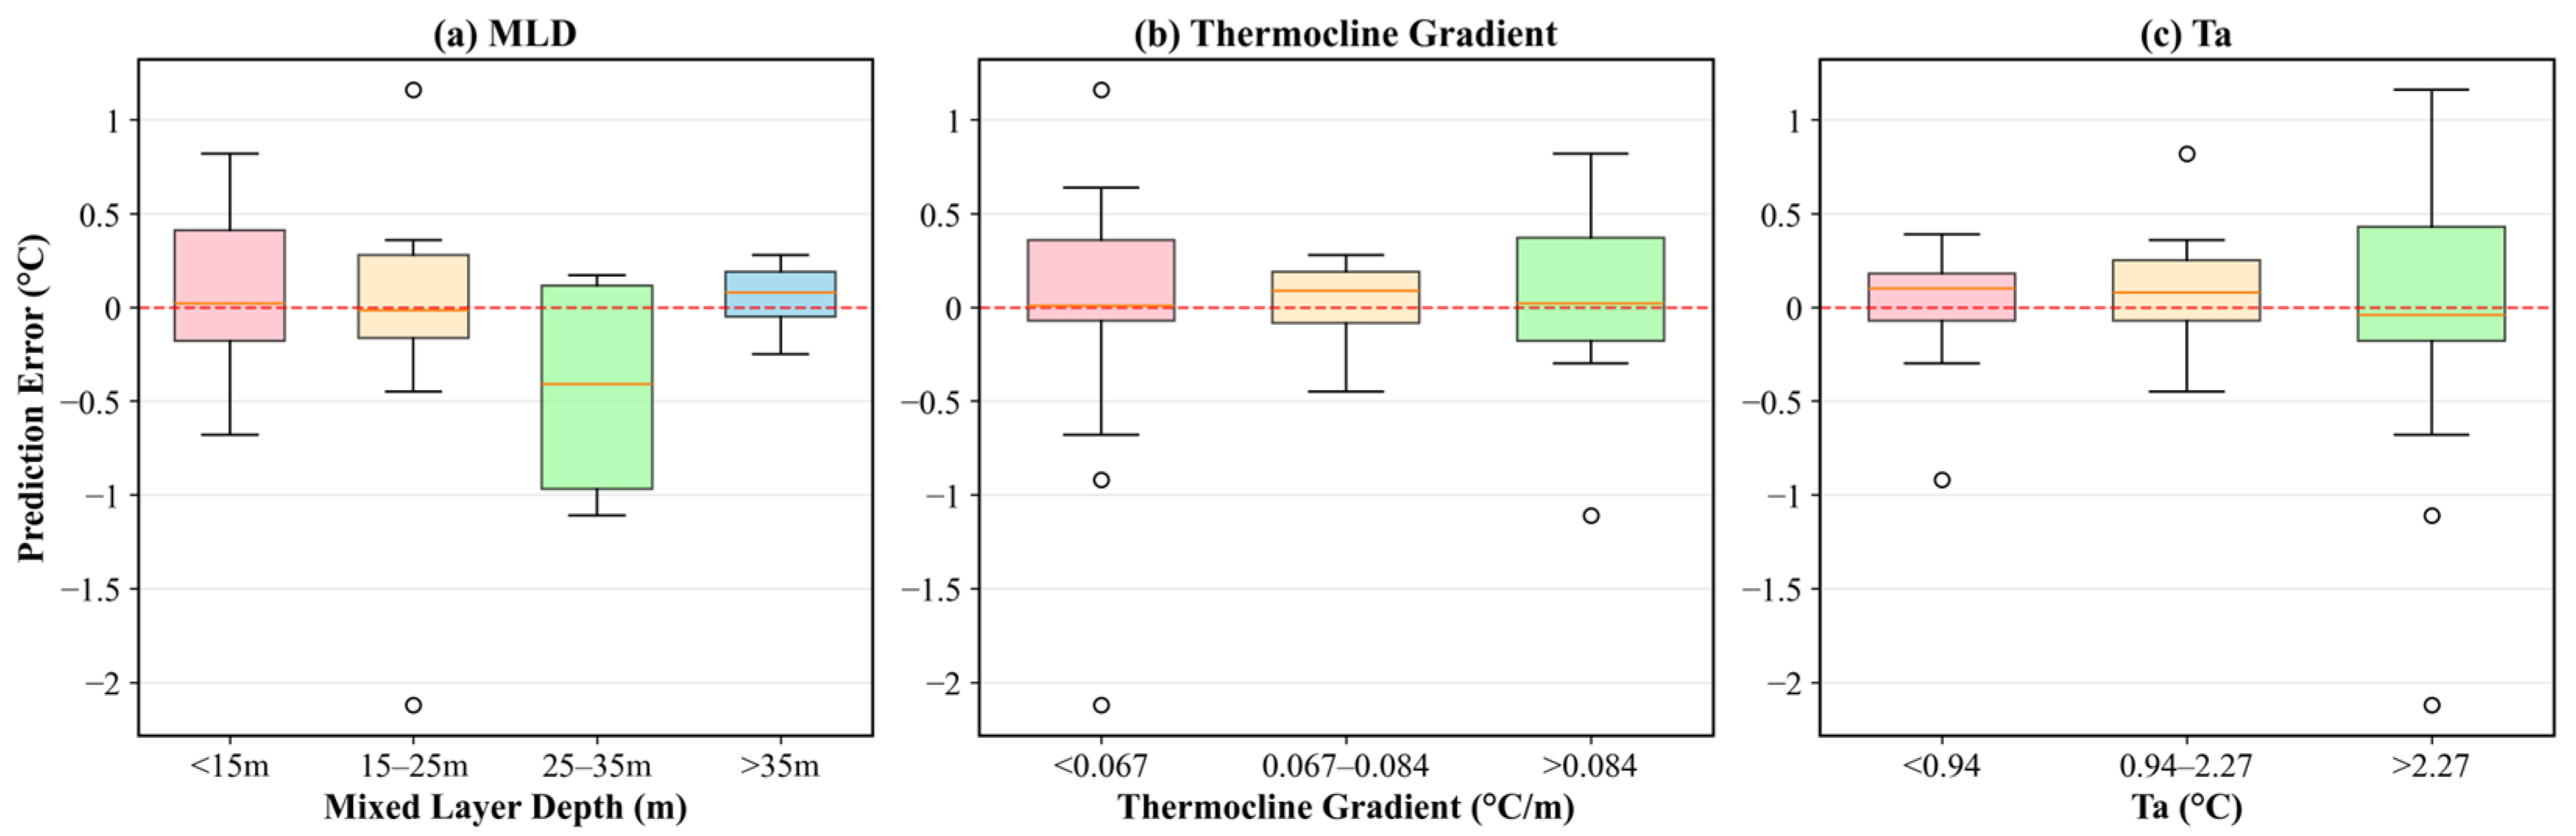
Box plot distribution of prediction errors under different marine environmental parameters. The red dotted line indicates the zero-error reference line.
Figure 16.
Box plot distribution of prediction errors under different marine environmental parameters. The red dotted line indicates the zero-error reference line.
Table 1.
Multi-source data products information.
Table 1.
Multi-source data products information.
| Data Type | Product Name | Source Institution | Temporal Resolution | Spatial Resolution |
|---|
| Tropical Cyclone Data | Satellite Analysis Tropical Cyclone Scale Dataset (Version 3.0) | Shanghai Typhoon Institute, China Meteorological Administration | 6-hourly | - |
| Sea Surface Temperature | MW_IR Optimal Interpolation (OI) Daily SST | Remote Sensing Systems | Daily | ~9 km |
| Sea Surface Wind | Cross-Calibrated Multi-Platform (CCMP) v3.1 | Remote Sensing Systems | 6-hourly | 0.25° × 0.25° |
| Sea Level Anomaly | SEALEVEL_GLO_PHY_L4_MY_008_047 (DUACS) | Copernicus Marine Service | Daily | 0.125° × 0.125° |
| Ocean Temperature | GLOBAL_MULTIYEAR_PHY_001_030 (GLORYS12V1) | Copernicus Marine Service | Daily | 0.083° × 0.083° |
| Mixed Layer Depth |
Table 2.
Summary of input features used in the MLP model.
Table 2.
Summary of input features used in the MLP model.
| Feature | Unit | Temporal Definition | Physical Meaning |
|---|
| uwnd_0, vwnd_0 | m/s | Average of 5 days before | Background wind stress |
| sla_0 | m | Average of 5 days before | Background mesoscale eddy activity |
| mld_0 | m | Average of 5 days before | Upper ocean heat capacity and stratification |
| t100_0 | °C | Average of 5 days before | Subsurface thermal reserve |
| uwnd_max, vwnd_max | m/s | At peak composite wind speed moment | Peak wind stress forcing |
| sla_wsmax | m | At peak composite wind speed moment | Peak dynamic height anomaly |
| t100_wsmax | °C | At peak composite wind speed moment | Subsurface thermal condition during peak forcing |
Table 3.
Prediction performance of different models on the test set.
Table 3.
Prediction performance of different models on the test set.
| Model | MAE (°C) | RMSE (°C) | Bias (°C) |
|---|
| LR | 0.484 | 0.587 | 0.265 |
| RF | 0.429 | 0.534 | 0.204 |
| MLP | 0.379 | 0.488 | 0.087 |
Table 4.
Initial ocean state parameters and SSC prediction errors at selected points during the passage of Typhoon Hagibis.
Table 4.
Initial ocean state parameters and SSC prediction errors at selected points during the passage of Typhoon Hagibis.
| Point | Latitude | Longitude | Observed Cooling (°C) | Predicted Cooling (°C) | Prediction Error (°C) | MLD (m) | Thermocline Gradient (°C/m) |
|---|
| P1 | 14.8 | 153.2 | 1.19 | 0.74 | −0.45 | 21 | 0.0711 |
| P2 | 15.5 | 147.0 | 1.14 | 1.07 | −0.07 | 23 | 0.0569 |
| P3 | 20.6 | 140.6 | 4.22 | 4.23 | +0.01 | 23 | 0.0607 |
| P4 | 25.0 | 139.5 | 4.96 | 2.84 | −2.12 | 18 | 0.0521 |
| P5 | 28.0 | 137.0 | 1.19 | 2.35 | +1.16 | 25 | 0.0626 |
| P6 | 35.5 | 140.8 | 1.02 | 1.22 | +0.20 | 15 | 0.1132 |
| P7 | 40.0 | 145.0 | 1.75 | 0.65 | −1.11 | 33 | 0.0899 |
| P8 | 44.0 | 156.0 | 1.09 | 1.05 | −0.04 | 17 | 0.1394 |
Table 5.
Initial ocean state parameters and SSC prediction errors at selected points during the passage of Typhoon Goni.
Table 5.
Initial ocean state parameters and SSC prediction errors at selected points during the passage of Typhoon Goni.
| Point | Latitude | Longitude | Observed Cooling (°C) | Predicted Cooling (°C) | Prediction Error (°C) | MLD (m) | Thermocline Gradient (°C/m) |
|---|
| P1 | 16.5 | 137.5 | 0.31 | 0.48 | 0.17 | 30 | 0.0470 |
| P2 | 16 | 131.5 | 0.54 | 0.50 | −0.04 | 38 | 0.0554 |
| P3 | 15.5 | 128.5 | 1.29 | 0.37 | −0.92 | 27 | 0.0524 |
| P4 | 14 | 124 | 0.46 | 0.46 | 0 | 11 | nan |
| P5 | 13 | 122.5 | 0.60 | 0.99 | 0.39 | 11 | 0.1121 |
| P6 | 14.3 | 120 | 0.80 | 0.51 | −0.3 | 13 | 0.1098 |
| P7 | 14.5 | 115 | −0.14 | 0.67 | 0.82 | 15 | 0.1055 |
| P8 | 14 | 112 | 0.03 | 0.67 | 0.64 | 11 | 0.0408 |
Table 6.
Initial ocean state parameters and SSC prediction errors at selected points during the passage of Typhoon Higos.
Table 6.
Initial ocean state parameters and SSC prediction errors at selected points during the passage of Typhoon Higos.
| Point | Latitude | Longitude | Observed Cooling (°C) | Predicted Cooling (°C) | Prediction Error (°C) | MLD (m) | Thermocline Gradient (°C/m) |
|---|
| P1 | 20.2 | 117.0 | 0.07 | 0.45 | +0.37 | 14 | 0.0926 |
| P2 | 21.1 | 115.8 | 0.70 | 0.52 | −0.18 | 15 | 0.0926 |
| P3 | 20.8 | 114.5 | 0.21 | 0.72 | +0.51 | 15 | 0.0846 |
| P4 | 21.6 | 114.1 | 0.81 | 0.74 | −0.08 | 11 | 0.2214 |
Table 7.
Initial ocean state parameters and SSC prediction errors at selected points during the passage of Typhoon Noul.
Table 7.
Initial ocean state parameters and SSC prediction errors at selected points during the passage of Typhoon Noul.
| Point | Latitude | Longitude | Observed Cooling (°C) | Predicted Cooling (°C) | Prediction Error (°C) | MLD (m) | Thermocline Gradient (°C/m) |
|---|
| P1 | 13.5 | 116.5 | 0.96 | 0.98 | +0.02 | 13 | 0.0865 |
| P2 | 15.5 | 114.0 | 0.80 | 0.62 | −0.18 | 12 | nan |
| P3 | 15.5 | 111.0 | 0.78 | 0.60 | −0.18 | 15 | 0.0934 |
| P4 | 16.8 | 108.5 | 1.22 | 0.54 | −0.68 | 11 | 0.0663 |
Table 8.
Initial ocean state parameters and SSC prediction errors at selected points during the passage of Typhoon Fengshen.
Table 8.
Initial ocean state parameters and SSC prediction errors at selected points during the passage of Typhoon Fengshen.
| Point | Latitude | Longitude | Observed Cooling (°C) | Predicted Cooling (°C) | Prediction Error (°C) | MLD (m) | Thermocline Gradient (°C/m) |
|---|
| P1 | 16.0 | 158.0 | 0.27 | 0.45 | +0.18 | 72 | 0.0501 |
| P2 | 17.5 | 150.0 | 0.37 | 0.29 | −0.07 | 37 | 0.0813 |
| P3 | 19.0 | 143.5 | 0.33 | 0.53 | +0.21 | 51 | 0.0893 |
| P4 | 22.5 | 142.5 | 0.70 | 0.80 | +0.10 | 28 | 0.0676 |
| P5 | 26.0 | 147.0 | 0.20 | 0.28 | +0.08 | 41 | 0.0755 |
| P6 | 26.5 | 152.0 | 0.54 | 0.41 | −0.13 | 44 | 0.0768 |
| P7 | 26.0 | 155.0 | 0.16 | 0.23 | +0.08 | 42 | 0.0742 |
| P8 | 26.0 | 156.5 | 0.30 | 0.49 | +0.19 | 41 | 0.0755 |
Table 9.
Initial ocean state parameters and SST cooling prediction errors at selected points during the passage of Typhoon Halong.
Table 9.
Initial ocean state parameters and SST cooling prediction errors at selected points during the passage of Typhoon Halong.
| Point | Latitude | Longitude | Observed Cooling (°C) | Predicted Cooling (°C) | Prediction Error (°C) | MLD (m) | Thermocline Gradient (°C/m) |
|---|
| P1 | 15.5 | 154.5 | 0.25 | 0.40 | +0.15 | 38 | 0.0727 |
| P2 | 18.5 | 152.5 | 0.65 | 0.60 | −0.05 | 48 | 0.0659 |
| P3 | 20.5 | 150.5 | 2.05 | 1.80 | −0.25 | 45 | 0.0727 |
| P4 | 22.0 | 150.5 | 0.47 | 0.66 | +0.19 | 49 | 0.0799 |
| P5 | 24.5 | 151.5 | 0.17 | 0.45 | +0.28 | 51 | 0.0805 |
| P6 | 27.0 | 154.0 | 0.13 | 0.38 | +0.25 | 23 | 0.0700 |
| P7 | 29.5 | 157.5 | 0.05 | 0.48 | +0.43 | 13 | 0.0661 |
| P8 | 31.5 | 160.5 | 0.08 | 0.44 | +0.36 | 24 | 0.0600 |