1. Introduction
China’s commitment to carbon neutrality, carbon peaking and sustainable development has created an urgent need for energy transition [
1,
2]. As the costs of solar and wind power generation continue to dip, China is pursuing increasingly stringent emission reduction targets, leading to rapid growth in installed capacity and power generation from these renewable sources. However, further integration of renewable energy is constrained by the limited capacity of the power grid to accommodate its variable output. Thus, energy storage systems are becoming a critical component of the power system, as they facilitate the grid integration of renewable energy and support its wider adoption [
3,
4].
Gravity energy storage (GES) in goafs presents a promising solution, offering advantages such as a low levelized cost and storage, high capacity, and a small land footprint [
5]. Current GES concepts for goafs include underground pumped storage [
6], gravity-enhanced compressed air energy storage [
7], solid gravity energy storage [
8], and compressed earth-block gravity energy storage [
9]. For instance, a technology patented by Gravity Power (in the USA) uses a large underground piston that is hydraulically lifted to store energy; its release drives water through turbines [
10]. A significant portion of the system’s cost is dominated by excavation (accounting for approximately 57% of the total cost) [
11]. Goafs can be used for GES not only to construct GES systems at low cost but also to realize the reuse of closed mining areas and help resource-based cities achieve energy transition and upgrading. The economic revitalization of post-mining regions is a priority for countries like the United States [
12], the United Kingdom [
13], and Canada [
14] aiming to mitigate the long-term socioeconomic impacts of a declining mining industry [
15]. However, goaf areas are often associated with persistent features such as underground voids, rock fractures, and under-compacted caved rock blocks, which can lead to geological hazards. For example, in parts of Xuzhou, Jiangsu Province, multiple geological hazards (e.g., slope instability) occurred after mine closure when rainfall and surface loading conditions changed [
16]. The construction and operation of gravity energy storage facilities will inevitably induce significant changes in surface loading, which imply a need for a safe and stable geological environment; therefore, the screening of goaf areas suitable for gravity energy storage is of critical importance. To date, research on goaf-based gravity energy storage has mainly focused on a single aspect—either the assessment of potential scale or the assessment of economic benefit—while neglecting safety evaluation for the screening of suitable goaf areas and comprehensive assessment.
With respect to the assessment of the potential scale of gravity energy storage projects, most existing studies only consider the storage scale under vertical roadway mining and overlook the more common situation of inclined mining roadways. For instance, Asmae Berrada et al. only investigated a dynamic model of a gravity energy storage system using vertical shafts [
10]. Kropotin, P. et al. examined the potential cost and scale of gravity energy storage using unstable compressed soil blocks and vertical abandoned mine shafts [
9]. Likewise, Thomas Morstyn et al. assessed the development potential of abandoned mines in central England only under the assumption of vertical shafts, without considering economic and safety aspects [
17].
Regarding the assessment of the economic potential of gravity energy storage, researchers have mostly focused on economic feasibility while overlooking policy requirements with respect to storage scale and safety. For example, Asmae Berrada et al. primarily analyzed the LCOE of gravity energy storage systems, the optimal storage capacity, and the optimal charge–discharge schedule to maximize profit, without considering the minimum required scale of gravity energy storage systems [
18]. Tong et al. studied power control strategies for modular gravity energy storage systems; by optimizing operating modes, they improved system economics, yet they did not similarly consider system requirements and safety requirements [
19].
A gravity energy storage facility intended for long-term, stable operation must comprehensively account for its scale effect, economic effect, and safety effect, among which safety is key. Time-series InSAR technology, which is capable of long-term monitoring of surface deformation, has been increasingly used for the monitoring of surface deformation in mining areas [
20,
21] and landslide risk assessment [
22]. For example, Zhang Zhenjia et al. used time-series InSAR to support the assessment of photovoltaic development and construction in goaf areas [
23], and Chen Chen et al. used SBAS-InSAR to map surface subsidence risk in Xi’an [
24], using time-series InSAR to assess subsidence risk in goaf areas is a mature research direction. However, there remains a lack of an evaluation model for the suitability of goaf gravity energy storage development to screen goaf areas suitable for facility construction, as well as a further a lack of a comprehensive evaluation model and indicator system that incorporates factors such as storage scale and economic effect and that can adapt to arbitrary roadway orientations.
Therefore, to bridge this gap, this paper proposes a novel evaluation system that couples time-series InSAR with GIS to comprehensively assess the safe development potential of GES in goafs. The key innovation of this work is the first-time integration of SBAS-InSAR technology into a GES development potential assessment system for goafs, providing a more rational and reliable method to evaluate goaf subsidence stability and identify suitable areas for GES construction. Building on this safety and suitability analysis, the system then evaluates the GES scale and LCOE to deliver a comprehensive potential assessment. The proposed methodology is demonstrated through a case study of Yangquan City, where it is applied to assess GES potential based on subsidence risk, energy storage scale, and economic viability.
2. Methods
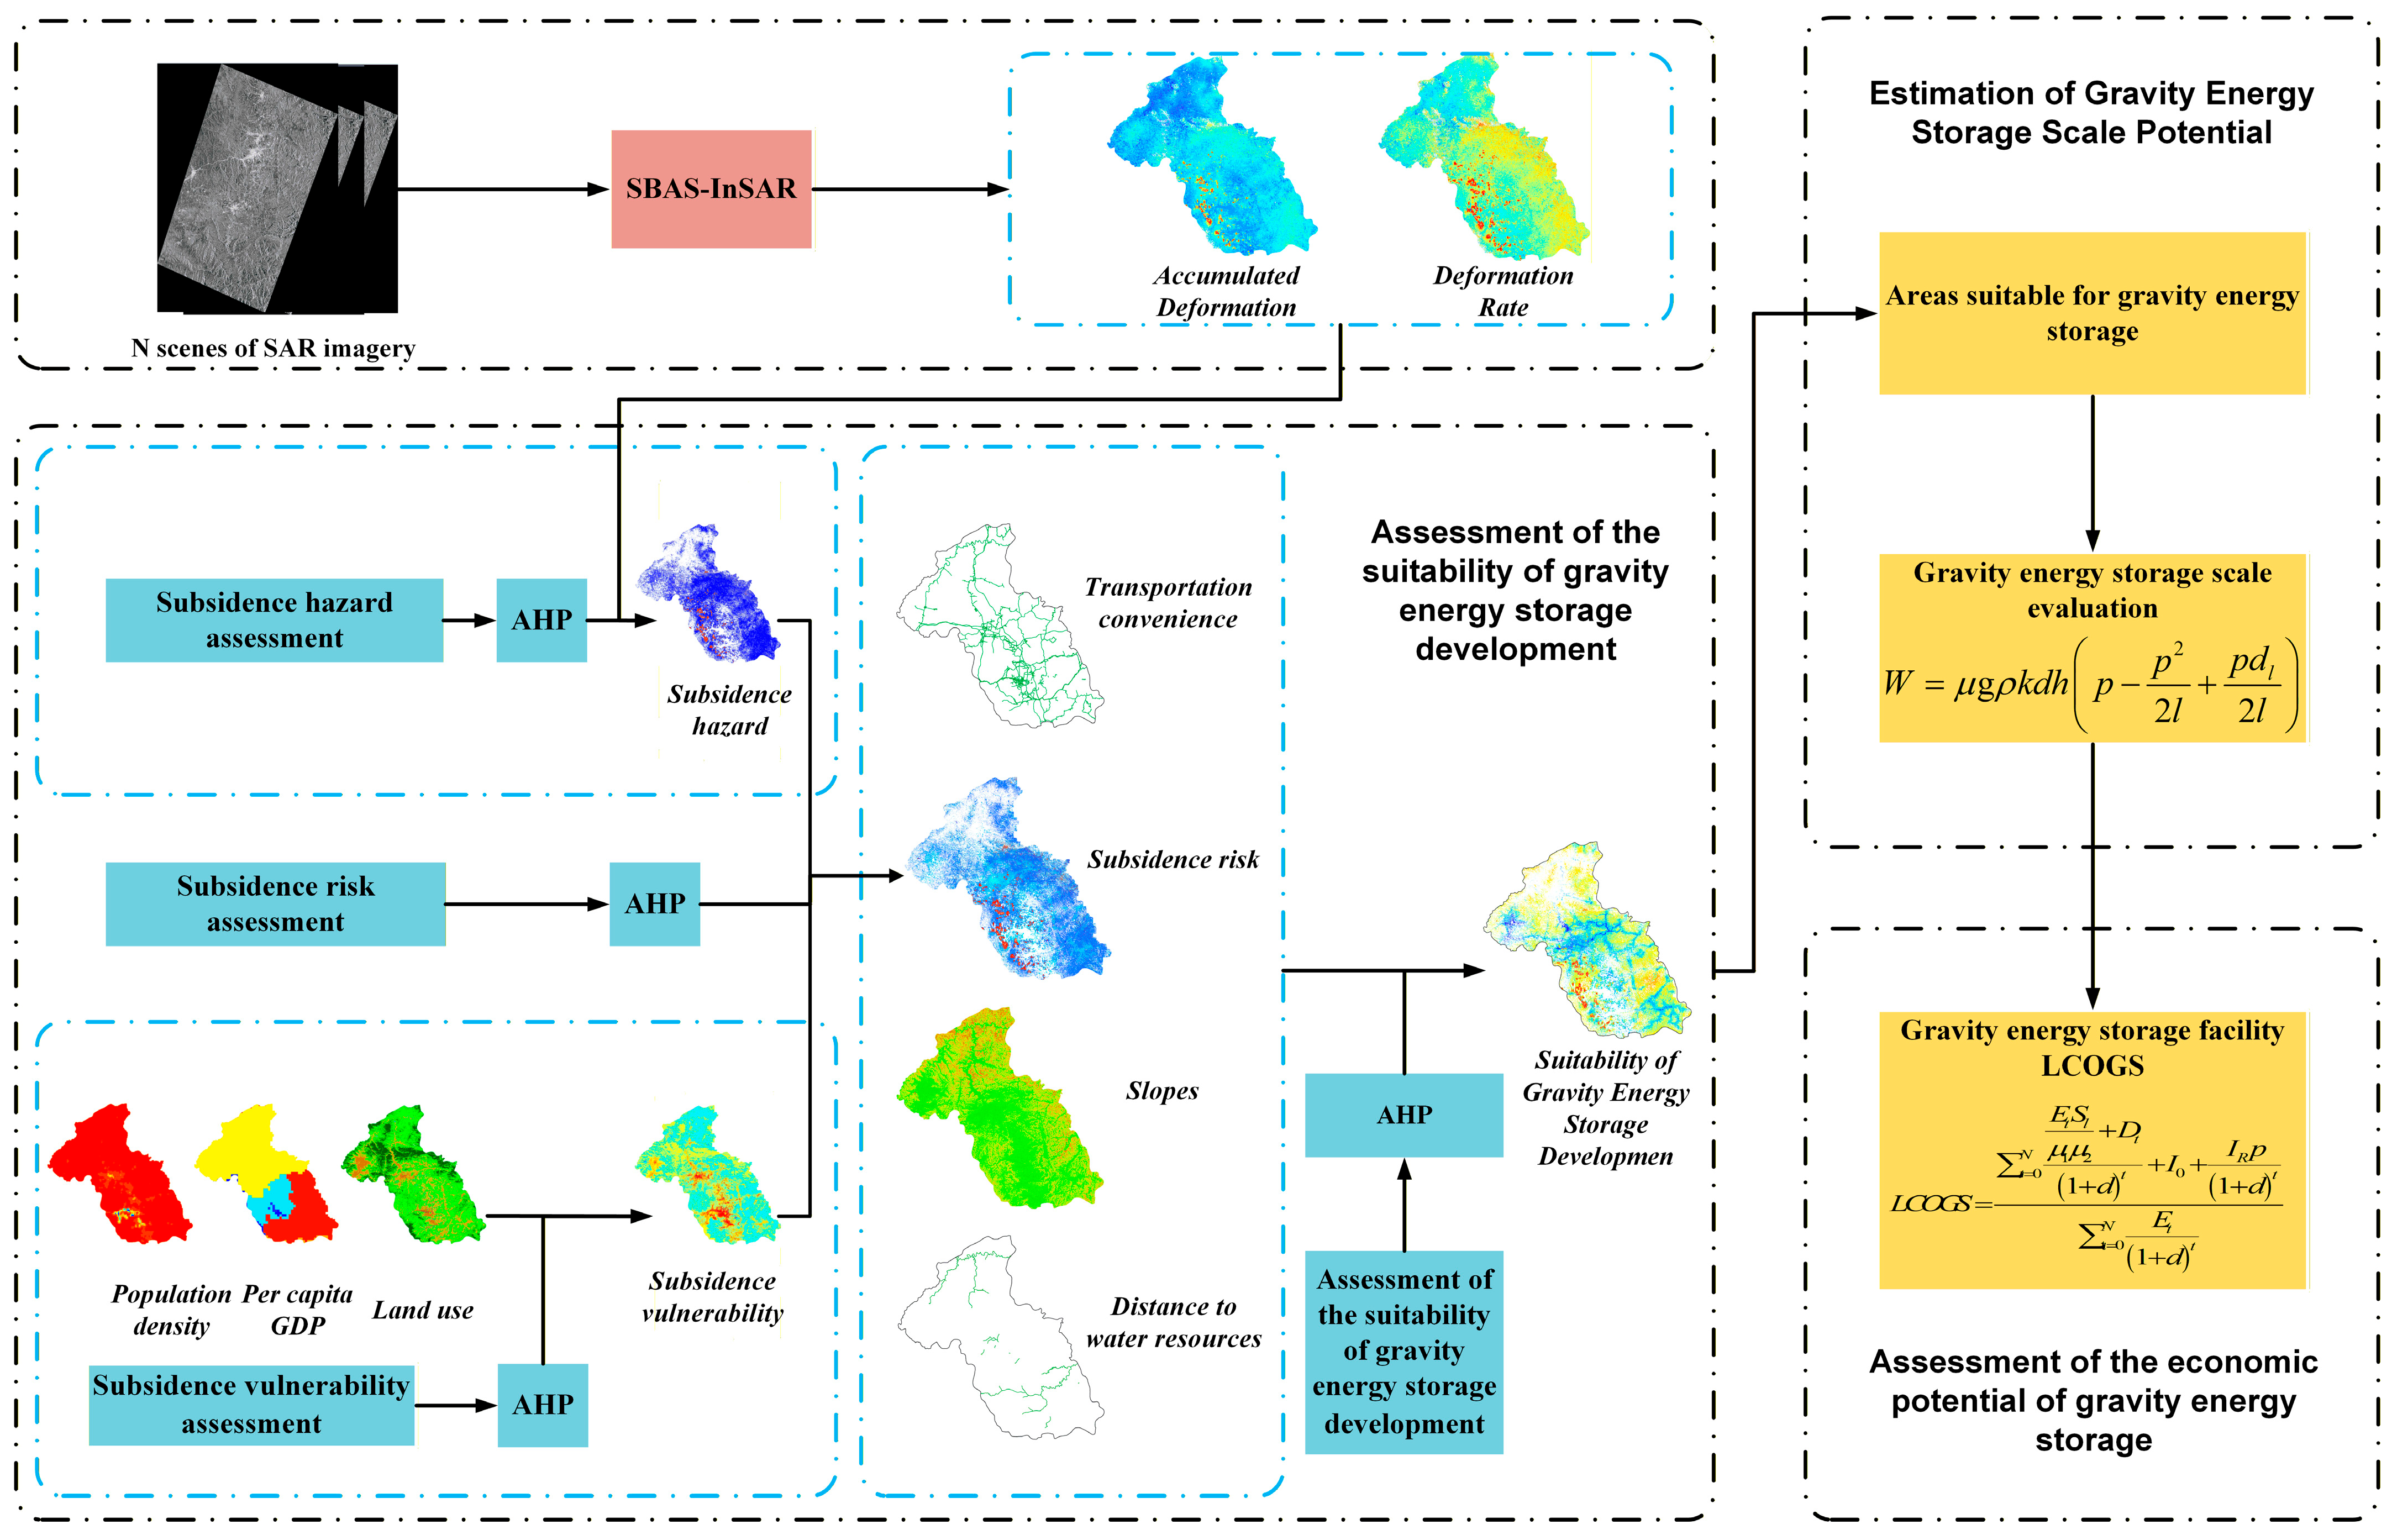
The overall flowchart of the method presented in this paper is shown in
Figure 1. First, the subsidence rate and cumulative deformation of goafs are derived using SBAS-InSAR technology to construct a subsidence risk assessment model based on the obtained deformation information. Subsequently, based on the subsidence risk assessment results and topography and geomorphology data, the GES development suitability of goafs is evaluated to identify suitable closed mining areas. Finally, the newly constructed GES scale model and mining-area data are used to evaluate the GES scale of goafs, and the power generation cost of goafs is evaluated with the LCOGS model to comprehensively assess the GES scale of goafs from multiple perspectives, such as safety, scale, and cost.
2.1. Study Area and Data Sources
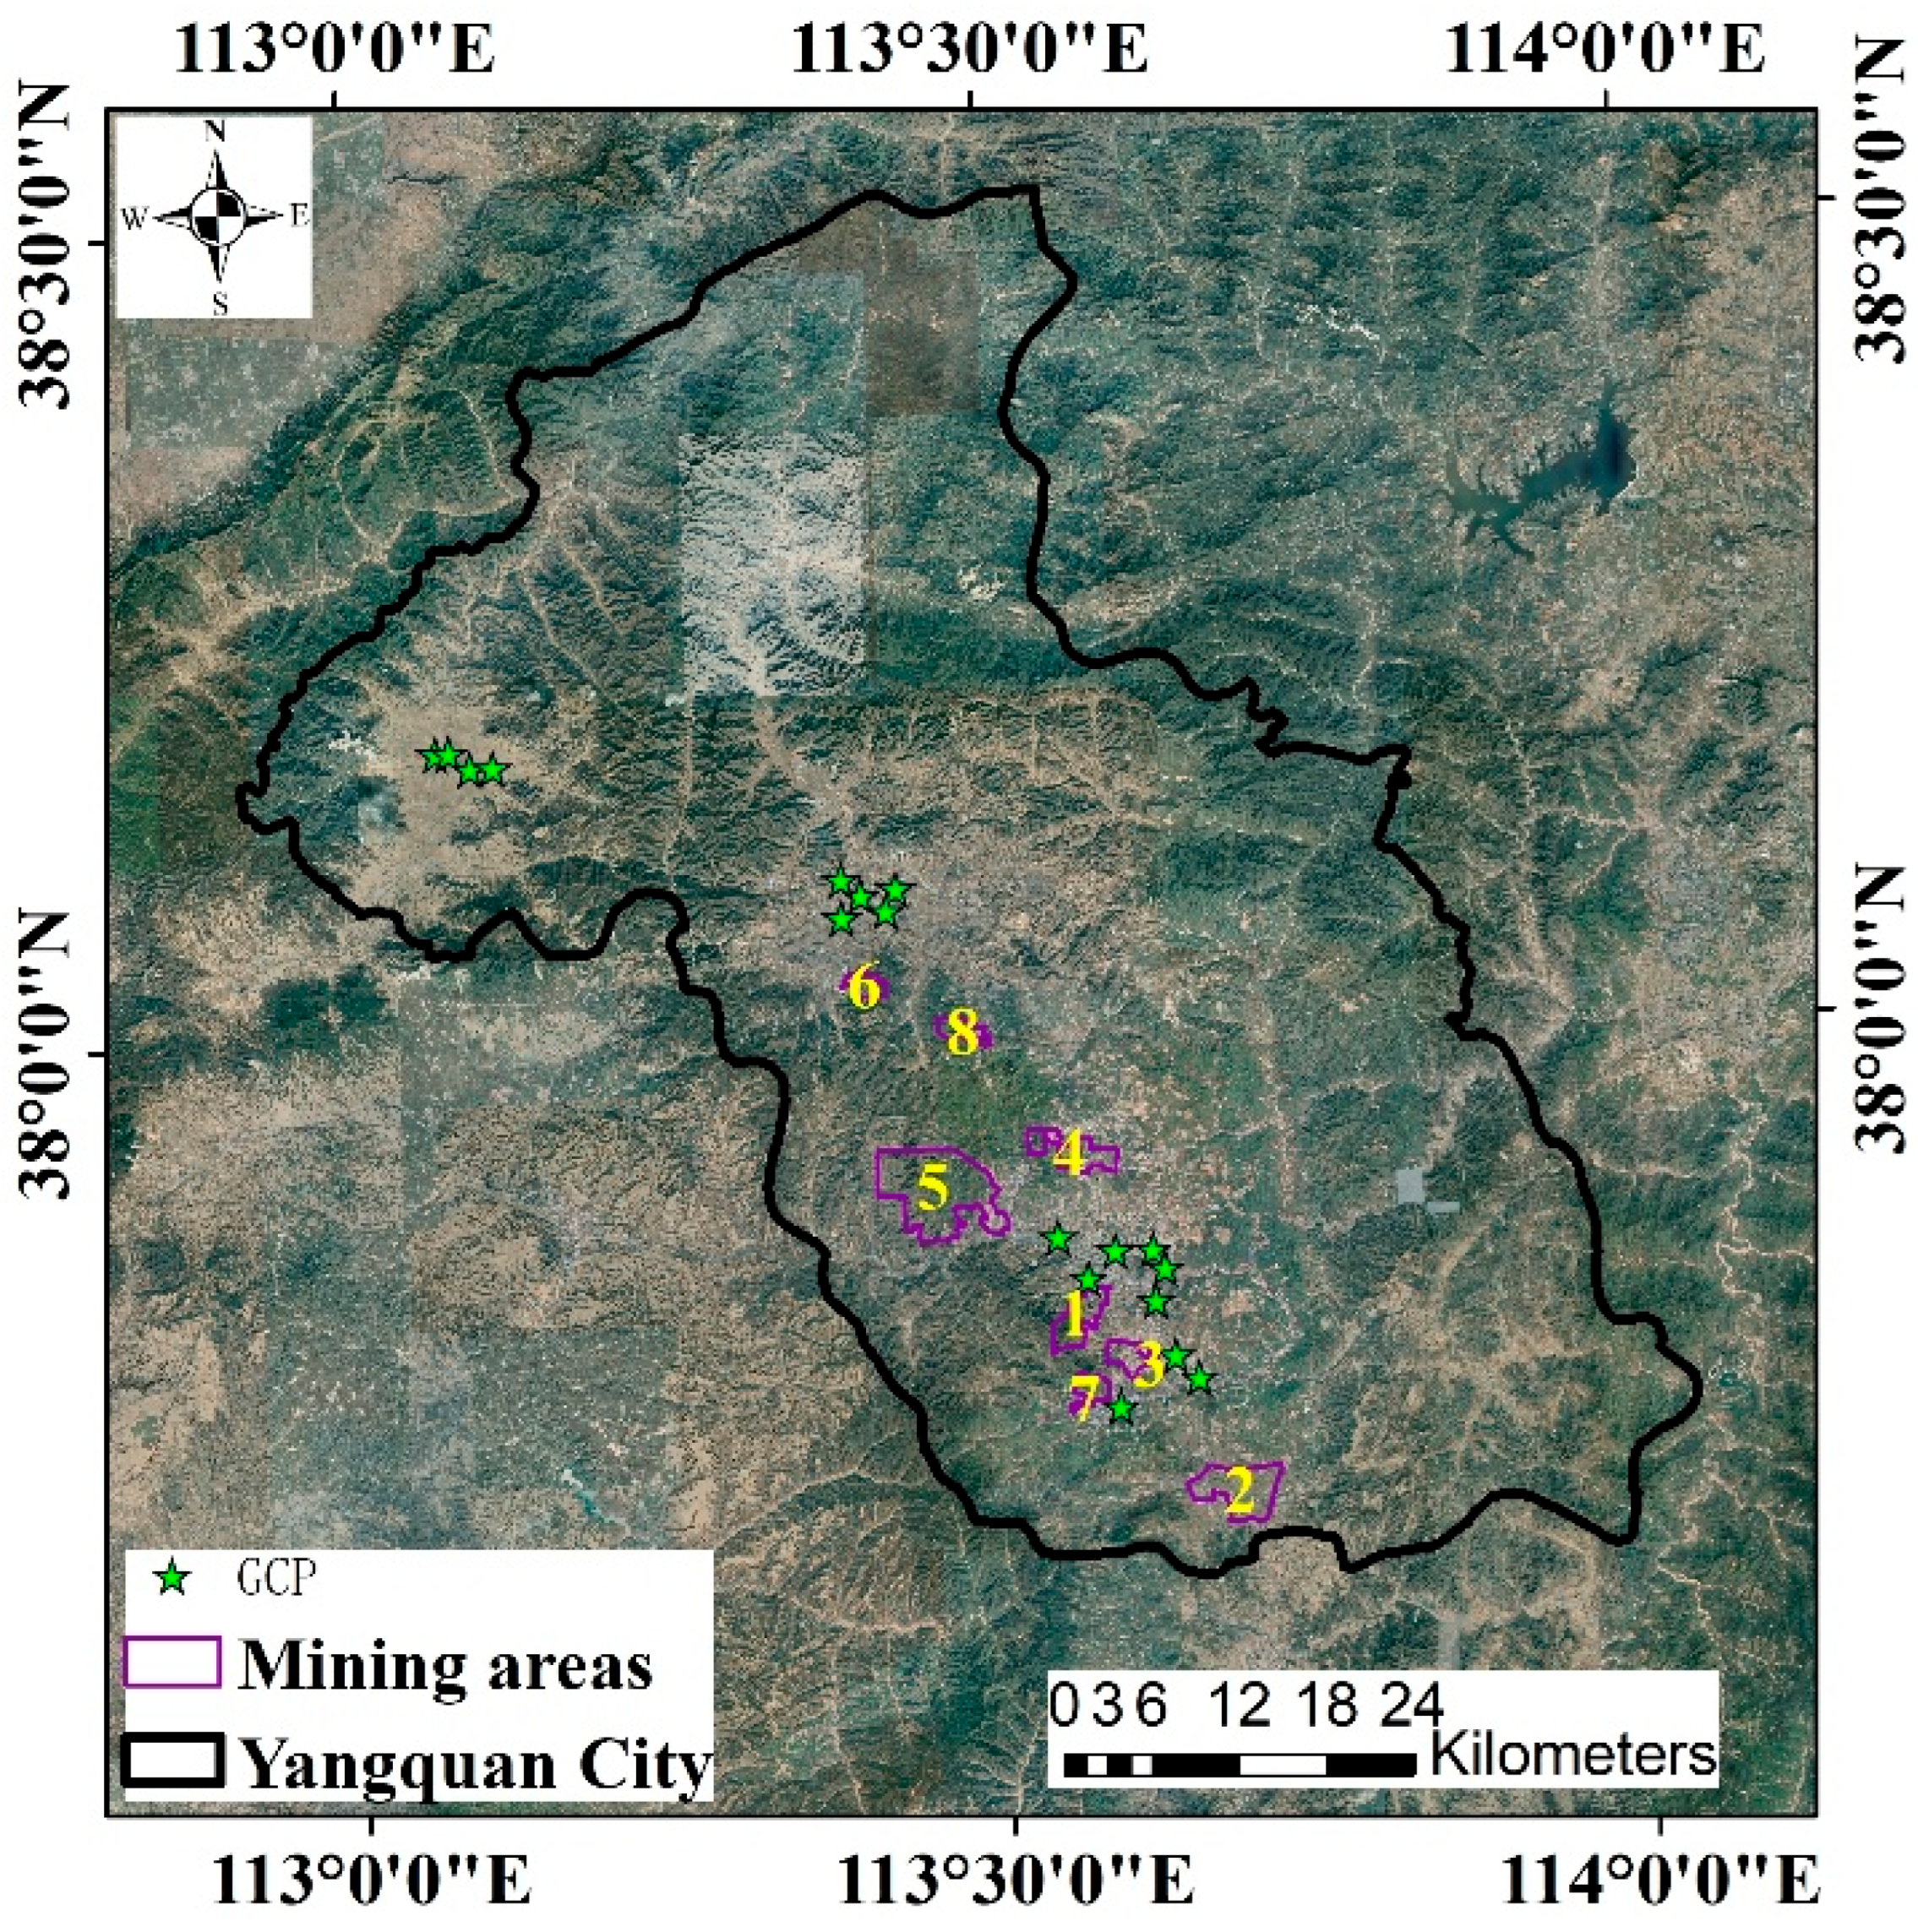
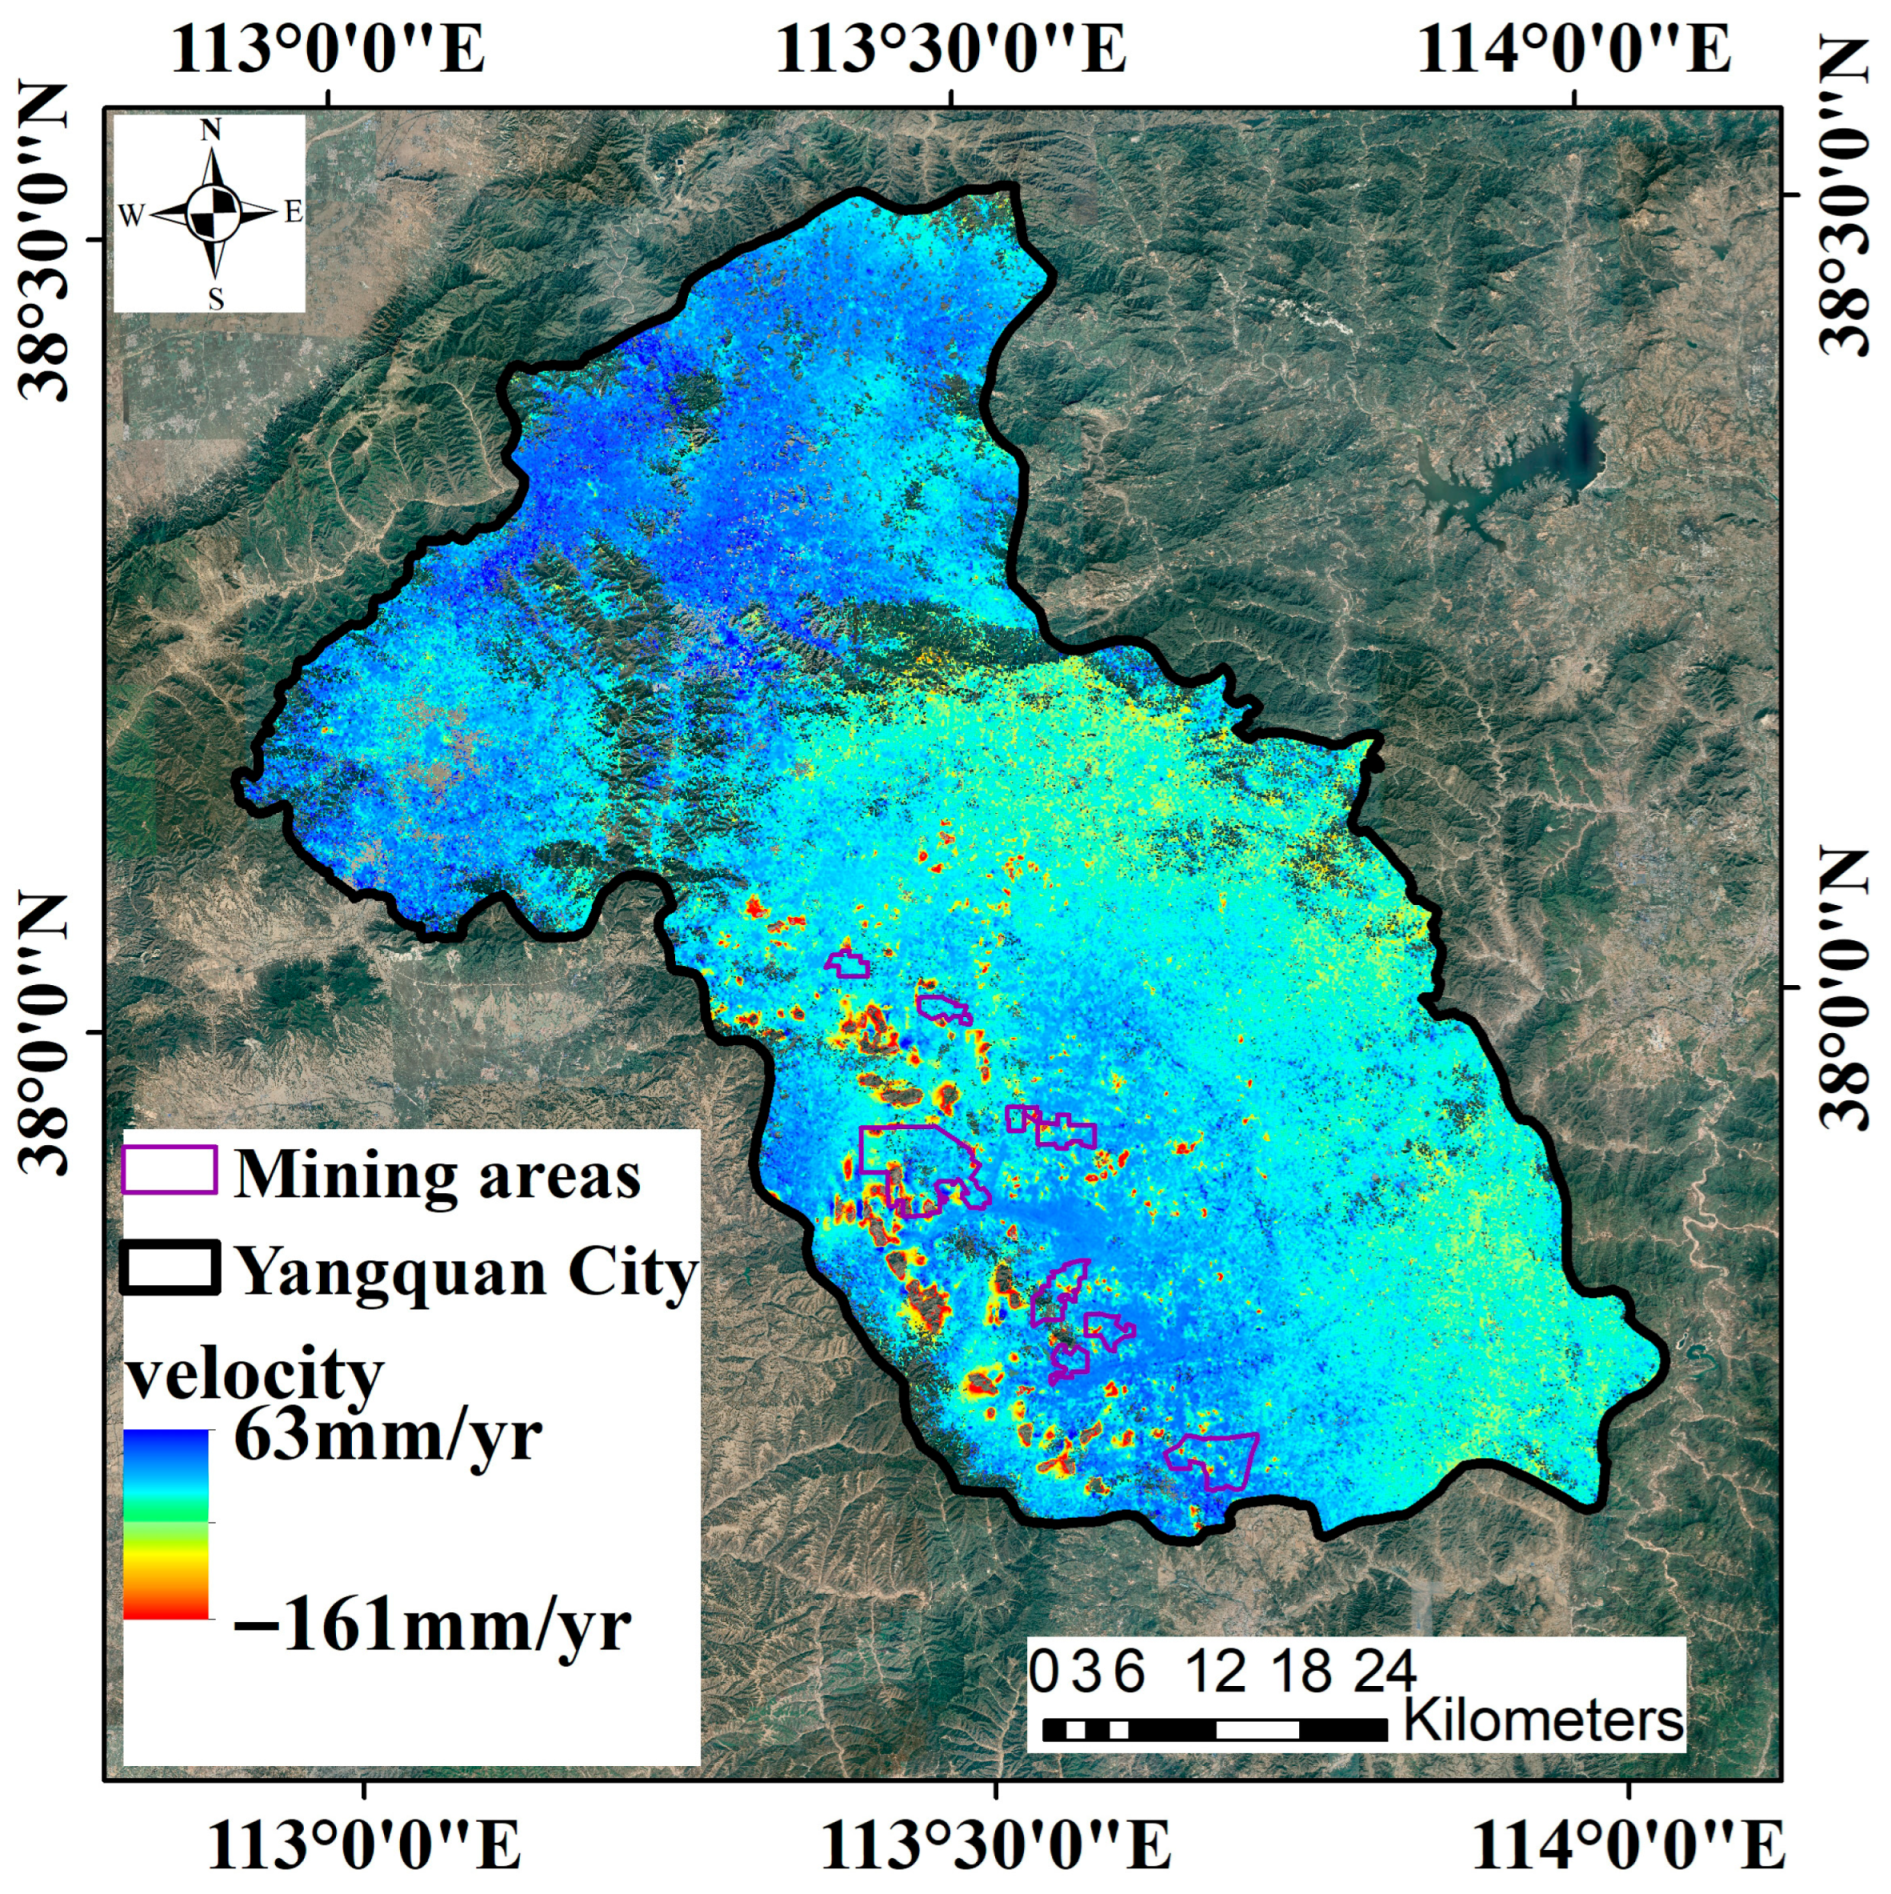
Yangquan City is an important mineral resource-based city in Shanxi Province and contains a large number of closed mining areas. Meanwhile, Yangquan City is one of the four cities in Shanxi Province that are explicitly required to deploy energy storage, indicating a strong demand for the construction of energy storage facilities. Therefore, assessing the development potential of goaf-based gravity energy storage in Yangquan City is of considerable significance. In this study, Yangquan City is selected as the study area. The study area and the spatial distribution of the eight closed mining areas are shown in
Figure 2, and the corresponding mine numbers are listed in
Table 1.
A total of 118 Sentinel-1A, ascending-track, IW-mode SLC scenes from two frames (Path 40, Frame 117 and Path 40, Frame 122) covering January 2021 to December 2022 were collected. The VV-polarized data were used to perform time-series deformation monitoring over the entirety of Yangquan City. All datasets used in this study are listed in
Table 2.
2.2. Evaluation of GES Development Suitability
As this study focuses on the evaluation of suitability for gravity energy storage development, a higher suitability score indicates that a goaf is more suitable for the construction of gravity energy storage facilities. In the evaluation system, the subsidence risk assessment of a goaf is used to characterize its subsidence risk; in principle, a higher subsidence risk score should correspond to a greater subsidence risk. However, to directly obtain the final suitability score in an intuitive manner, subsidence risk assessment is intentionally defined such that a lower score represents a higher subsidence risk. The quantitative criteria are provided in
Table 3. With this setting, the final evaluation ensures that a higher suitability score indicates a higher suitability for the construction of goaf-based gravity energy storage facilities.
2.2.1. Principle and Processing Steps of SBAS-InSAR Technology
Goafs are located in suburban areas with dense vegetation, leading to severe temporal decorrelation. To overcome the problem of temporal decorrelation and obtain ground deformation data with millimeter-level accuracy, this paper adopts SBAS-InSAR to obtain time-series surface deformation data of goafs. The basic principle of SBAS-InSAR is described as follows: The synthetic aperture radar (SAR) dataset in the study area is divided into several small subsets according to spatiotemporal thresholds. This ensures that the baselines between subsets are large, while the baseline within each subset is small, thereby reducing errors caused by spatiotemporal decorrelation. Finally, singular value decomposition (SVD) is used to solve each baseline subset; then, high-precision time-series deformation data are obtained [
32].
The specific operations are outlined as follows: First, all SAR images are co-registered using the precise orbit data (POEORB) provided by the European Space Agency (ESA), achieving a co-registration accuracy better than 1/8 pixel. Then, interferometry is performed. Assuming that InSAR images are acquired in the time period from
to
, arranged in chronological order, M interferometric pairs can be obtained according to the set spatiotemporal interferometric baseline thresholds. Suppose the j-th interferogram is obtained by differencing SAR images with imaging times of
and
; the phase at any point (
) in the interferogram can be expressed as follows:
where
represents the microwave wavelength;
and
represent the cumulative deformation in the upward radar line-of-sight (LOS) direction relative to the initial time (
) at times
and
, respectively (the cumulative deformation at time
is zero); and
and
represent the phases at times
and
, respectively.
Next, thresholds for the perpendicular baseline and temporal baseline are specified. When the baselines are smaller than these thresholds, the interferometric pairs can effectively alleviate spatiotemporal decorrelation. A coherence threshold greater than 0.3 is adopted; higher coherence generally leads to more reliable deformation estimates. An SRTM of 30 m DEM is used to remove the topographic phase, followed by four-look processing in the azimuth direction and Goldstein filtering to suppress interferometric noise [
33]. Polynomial fitting is applied to reduce orbital errors, and a polynomial model with an additional linear DEM term is used to remove topography-related atmospheric errors [
34]. Phase unwrapping is performed using the minimum-cost flow algorithm [
35], and finally, LOS time-series deformation data are derived via SVD [
32,
36].
2.2.2. Analytic Hierarchy Process (AHP)
This paper uses the AHP and expert knowledge to determine the importance and weights of each evaluation factor in the assessment of GES development suitability of mining areas [
37]. The AHP-based weighting scheme used in this study was mainly informed by previous evaluation research on physical energy storage in closed mines. In particular, Xiu’s master’s thesis on the optimal selection and feasibility of physical energy storage in closed mines adopted an expert panel of 20 specialists in the closed-mine field, including 12 university researchers, 5 enterprise practitioners, and 3 government-related personnel, providing a transparent reference basis for indicator ranking and weight design in the evaluation of mine-space energy storage [
38]. Based on that literature-derived weighting logic, the present study further adjusts the first-level weights according to the engineering characteristics of goaf-based gravity energy storage, especially the stronger requirements for geological safety under repeated loading and long-term operation. The specific steps are described as follows:
(1) Identify the evaluation object and evaluation factors, and construct a judgment matrix (
) defined as follows:
where
is an element in the judgment matrix, the values of which are shown in
Table 3.
(2) The weight vector (
W) and the maximum eigenvalue (
) of each judgment matrix (
) can be calculated using (3) and (4), respectively. The standardized evaluation indicator weights (
ω) can be obtained using (5).
where
n is the order of the judgment matrix and
i, j = 1, 2, …,
n.
(3) Conduct a consistency test on the rationality of the indicator weights. A consistency ratio (
CR) of less than 0.1 calculated using the equation indicates that the results meet the requirements and pass the test and that the calculated weights are reasonable; otherwise, the values in the judgment matrix need to be recalculated, and the above steps need to be repeated until the consistency test is passed:
where
is a random consistency index, with the specific
values shown in
Table 4.
2.2.3. Subsidence Risk Evaluation
Risk usually refers to the potential loss of life, property, and economic activities caused by a geological hazard in a specific area and time period; it is composed of both hazard and vulnerability [
39]. The equation for subsidence risk evaluation proposed in this paper is shown in (7), and the evaluation indicators and weights are shown in
Table 5.
where
denotes the subsidence risk value,
denotes the subsidence hazard, and
denotes the subsidence vulnerability. The indicators, weights, and quantitative scoring scheme used to compute
and
are summarized in
Table 5 and described below.
In this study, the vulnerability indicators and their scores were determined by referencing previous land-subsidence risk studies [
39,
40] and adjusting them to the siting objective of goaf-based GES. Following Hu et al. [
39] and Bhattarai and Kondoh [
40], population density and per capita GDP were retained as vulnerability indicators, while land-cover type was introduced to better reflect surface-use conflict and engineering accessibility in closed mining areas. Accordingly, land-cover type was assigned a weight of 0.60, and population density and per capita GDP were each assigned a weight of 0.20. Bare land was given the highest score, shrubland and sparse vegetation were assigned intermediate scores, cropland and forest received lower scores, and impervious surfaces were assigned the lowest score so that the ranking was consistent with expected exposure intensity and construction constraints. In addition, in contrast with the classification settings adopted in previous studies [
39,
40], population density and per capita GDP were both reclassified into five levels to better match the spatial heterogeneity of Yangquan. The specific weights and grading indicators are shown in
Table 5.
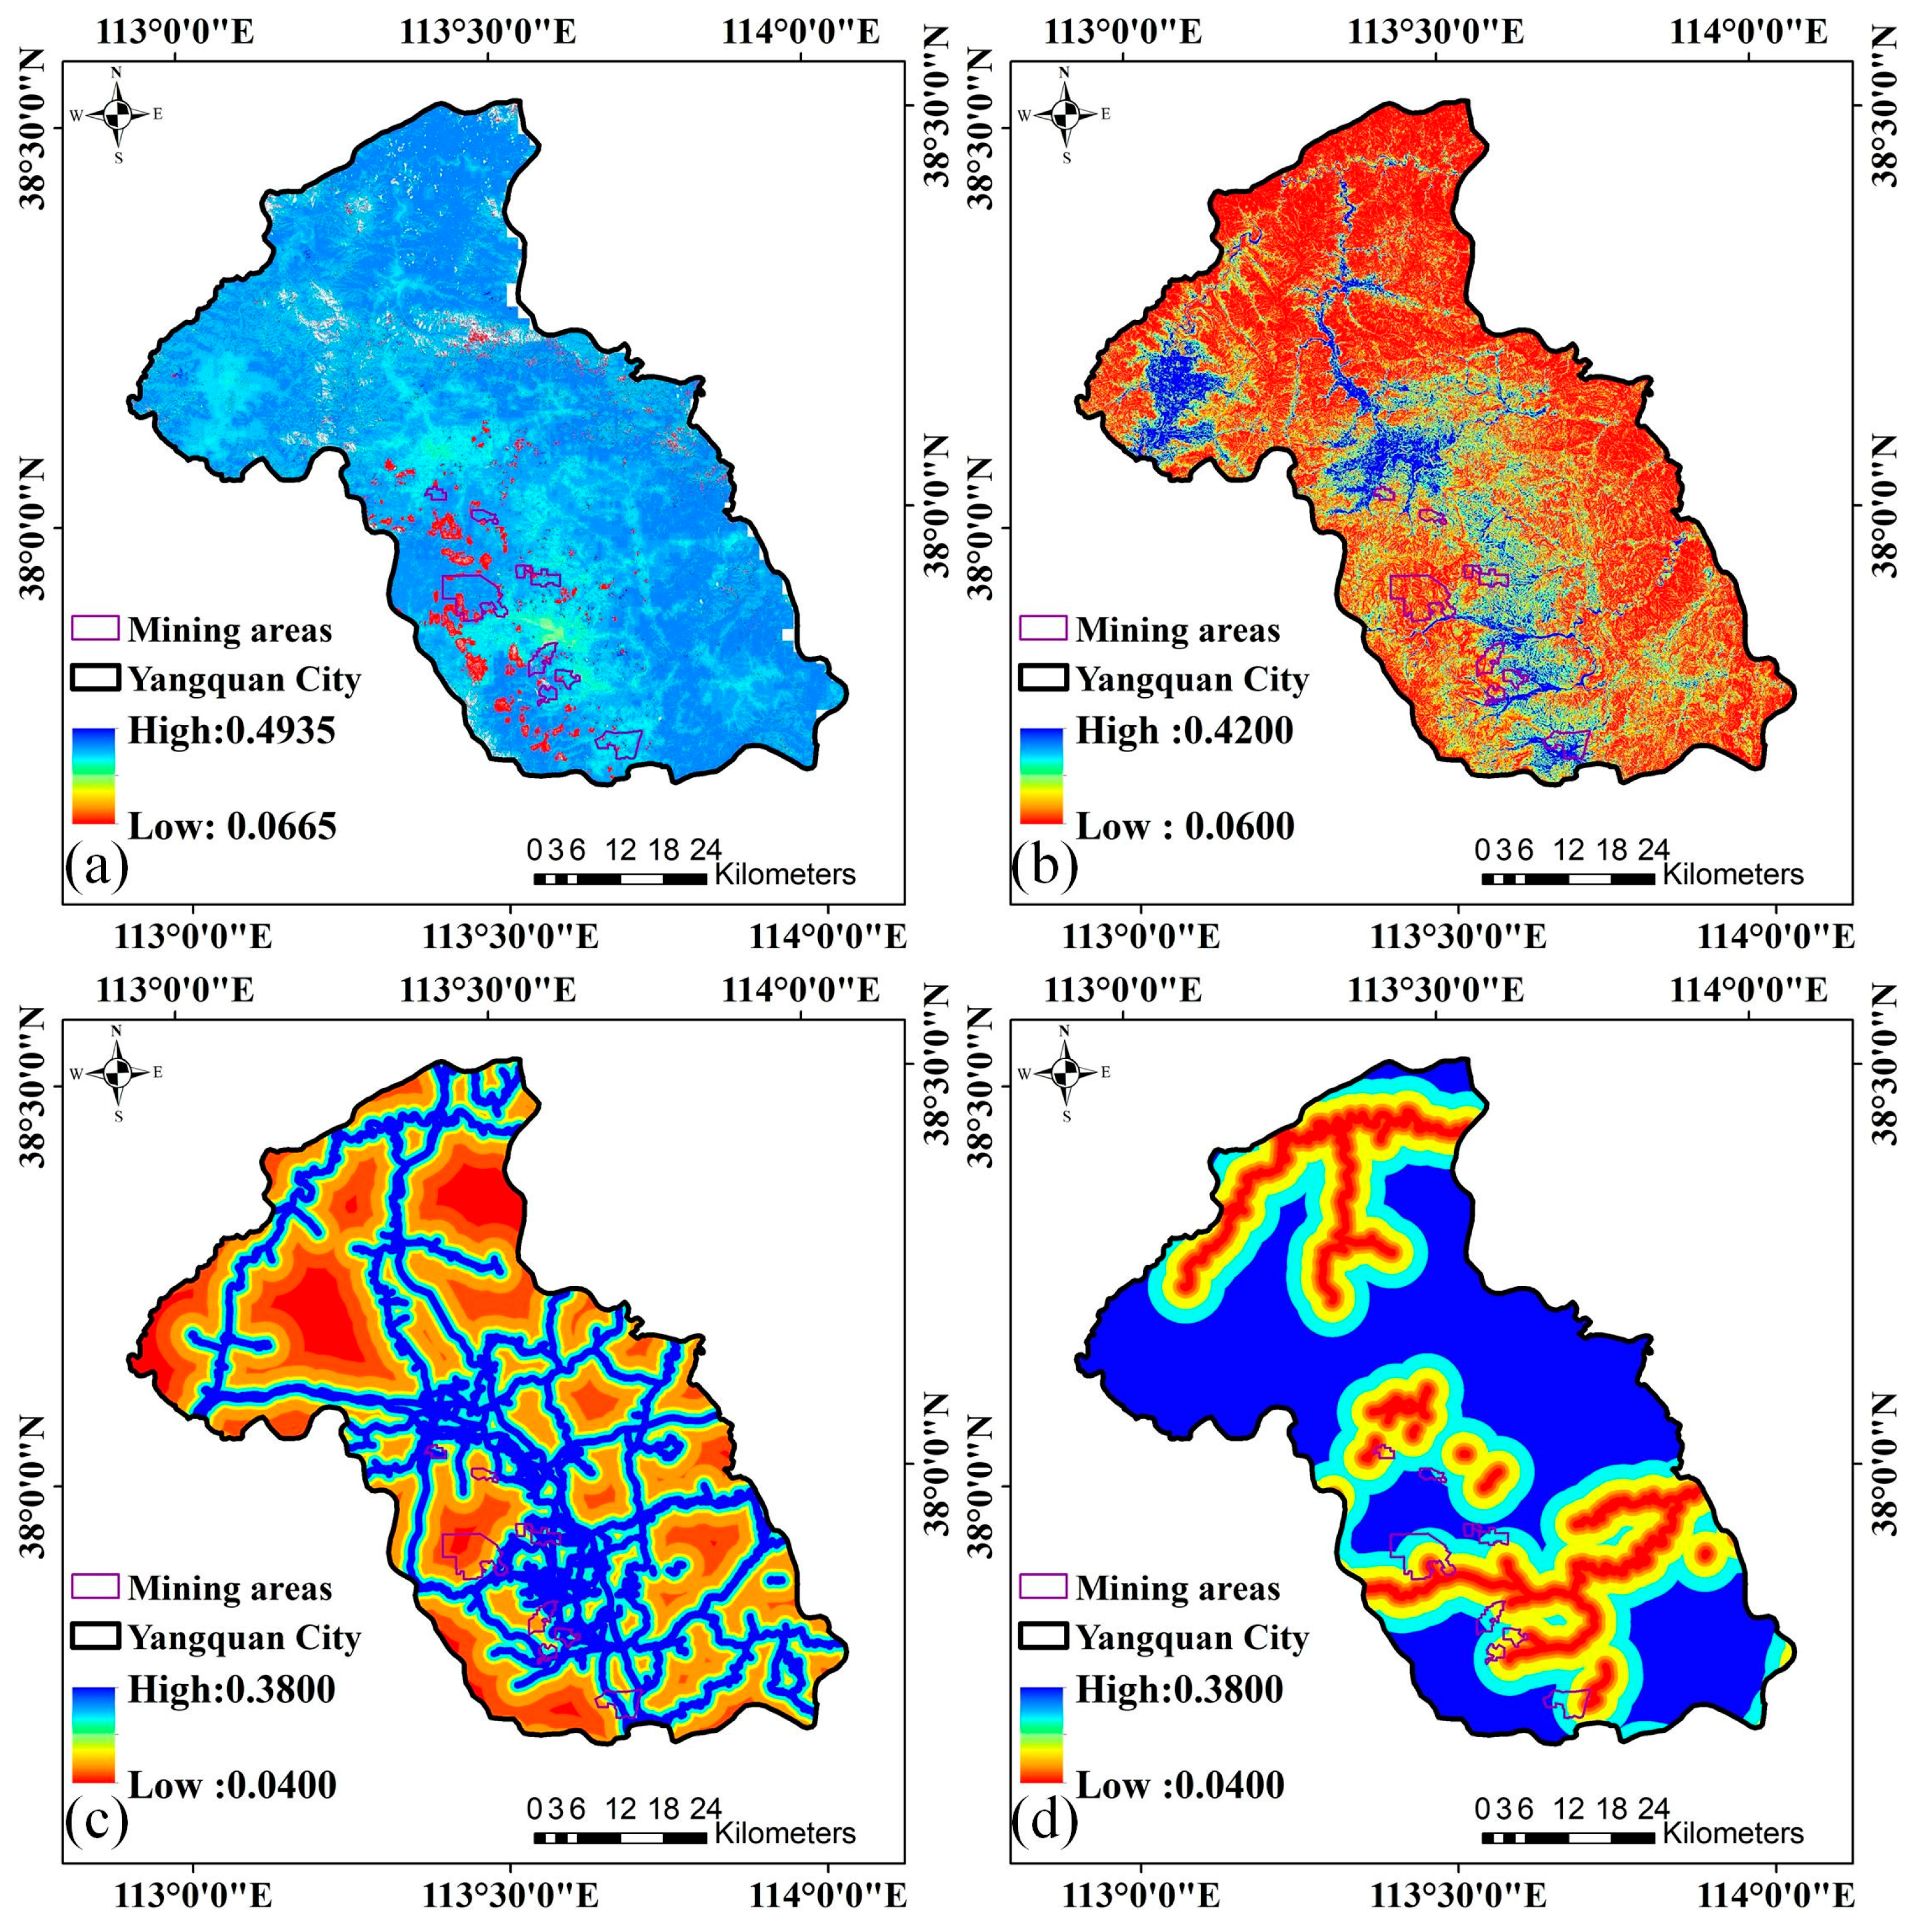
(1) Subsidence Hazard: The subsidence hazard is determined by two indicators—the subsidence rate and cumulative ground subsidence—with equal weights, and the cumulative subsidence and subsidence rate in goaf areas are graded and scored [
41]. Both the cumulative subsidence and subsidence rate of goafs are obtained by processing Sentinel-1A satellite data from January 2021 to December 2022 using SBAS-InSAR. The cumulative subsidence and subsidence rate are classified into four grades for quantitative assignment and weight determination (as shown in
Table 5), and the subsidence hazard score is obtained by multiplying the grade score of each indicator by the system-layer weight.
(2) Subsidence Vulnerability: The subsidence vulnerability is mainly determined by three indicators: land-cover type, population density, and per capita gross domestic product (GDP). The indicators are normalized via quantitative value assignment, and the subsidence vulnerability score is obtained by multiplying the grade score of each indicator by the system-layer weight.
The land-cover data used in this study are derived from the 30 m resolution land-cover product provided by the Aerospace Information Research Institute, Chinese Academy of Sciences [
26]. Six land-cover types are selected: cropland, forest, shrubland, sparse vegetation, bare land, and impervious surface, each of which is quantified and assigned a value (as shown in
Table 5). The suitability of the selected land-cover types for GES construction takes the following order: bare land > sparse vegetation = shrubland > cropland = forest > impervious surface.
Population density data are obtained from the WorldPop official website [
30]. The regional population density is divided into 5 grades, each of which is assigned a value (as shown in
Table 5).
Per capita GDP data are obtained from the Shanxi Provincial Bureau of Statistics Yearbook [
31]. The per capita GDP is divided into 5 grades, each of which is assigned a value (as shown in
Table 5).
2.2.4. Indicator Standardization and Weight Assignment
The GES development suitability of goafs is evaluated based on four evaluation indicators: geological safety, topography and geomorphology, transportation conditions, and GES demand of goafs. The specific equation for the evaluation of the GES development suitability of goafs is shown in (8), and the evaluation indicators and weights are shown in
Table 6.
where
represents the GES development suitability value of goafs;
represents the geological safety value of goafs;
represents the transportation condition value;
represents the GES demand of goafs;
represents the topography and geomorphology value; and
,
,
, and
represent the weights of geological safety, transportation conditions, GES demand, and topography and geomorphology, respectively, obtained using AHP.
Evaluation Factors and Standardized Weights
This work focuses on the site selection of GES facilities in goafs; geological safety is regarded as the most important factor, and the remaining three factors are ranked as topography and geomorphology > transportation > GES demand of goafs.
(1) Geological Safety
Geological safety is determined by the subsidence risk level. The results of the subsidence risk evaluation in
Section 2.2.3 are divided into four grades and quantitatively assigned values to achieve normalization (as shown in
Table 6), and the geological safety score is obtained by multiplying the grade score by the system-layer weight.
(2) Topography and Geomorphology
Topography and geomorphology are determined by the slope. The slope is calculated from the Shuttle Radar Topography Mission (SRTM) DEM with a spatial resolution of 30 m. Following Zhang et al.’s method for evaluating photovoltaic potential in goaf areas of Yangquan City, the slope is divided into five grades, each of which is quantitatively assigned a value to achieve normalization (as shown in
Table 6) [
23], and the topography and geomorphology score is obtained by multiplying the grade score by the system-layer weight.
(3) Transportation
Transportation is determined by transportation convenience, which is mainly based on road data provided by OpenStreetMap (OSM) [
28,
42]. In this study, all mapped roads were treated equally in the accessibility analysis, and no further distinction was made between heavy-duty mining roads and ordinary roads. Therefore, this indicator reflects general transportation accessibility rather than the carrying capacity of engineering transport routes. Buffer analysis is performed on the road vector data in ArcGIS 10.7; the results are divided into six grades according to different buffer-radius ranges, each of which is quantitatively assigned a value to achieve normalization (as shown in
Table 6), and the transportation score is obtained by multiplying the grade score by the system-layer weight.
(4) GES Demand of Goafs
The GES demand of goafs is determined by the distance from goafs to water sources. River vector data are provided by OSM [
29,
42]. Buffer analysis is performed on the river-vector data in ArcGIS; the results are divided into five grades according to different buffer-radius ranges, each of which is quantitatively assigned a value to achieve normalization (as shown in
Table 6), and the GES demand score is obtained by multiplying the grade score by the system-layer weight.
2.3. Evaluation of GES Scale Potential
Existing studies have constructed mining-area GES conversion models that mainly assume vertical mining roadways, using the equation expressed as follows [
17]:
where
denotes the round-trip electrical energy-conversion efficiency,
denotes the mass of the suspended weight,
denotes the density of the suspended weight,
denotes the gravitational acceleration,
denotes the available depth used to store energy, and
denotes the height of the suspended weight.
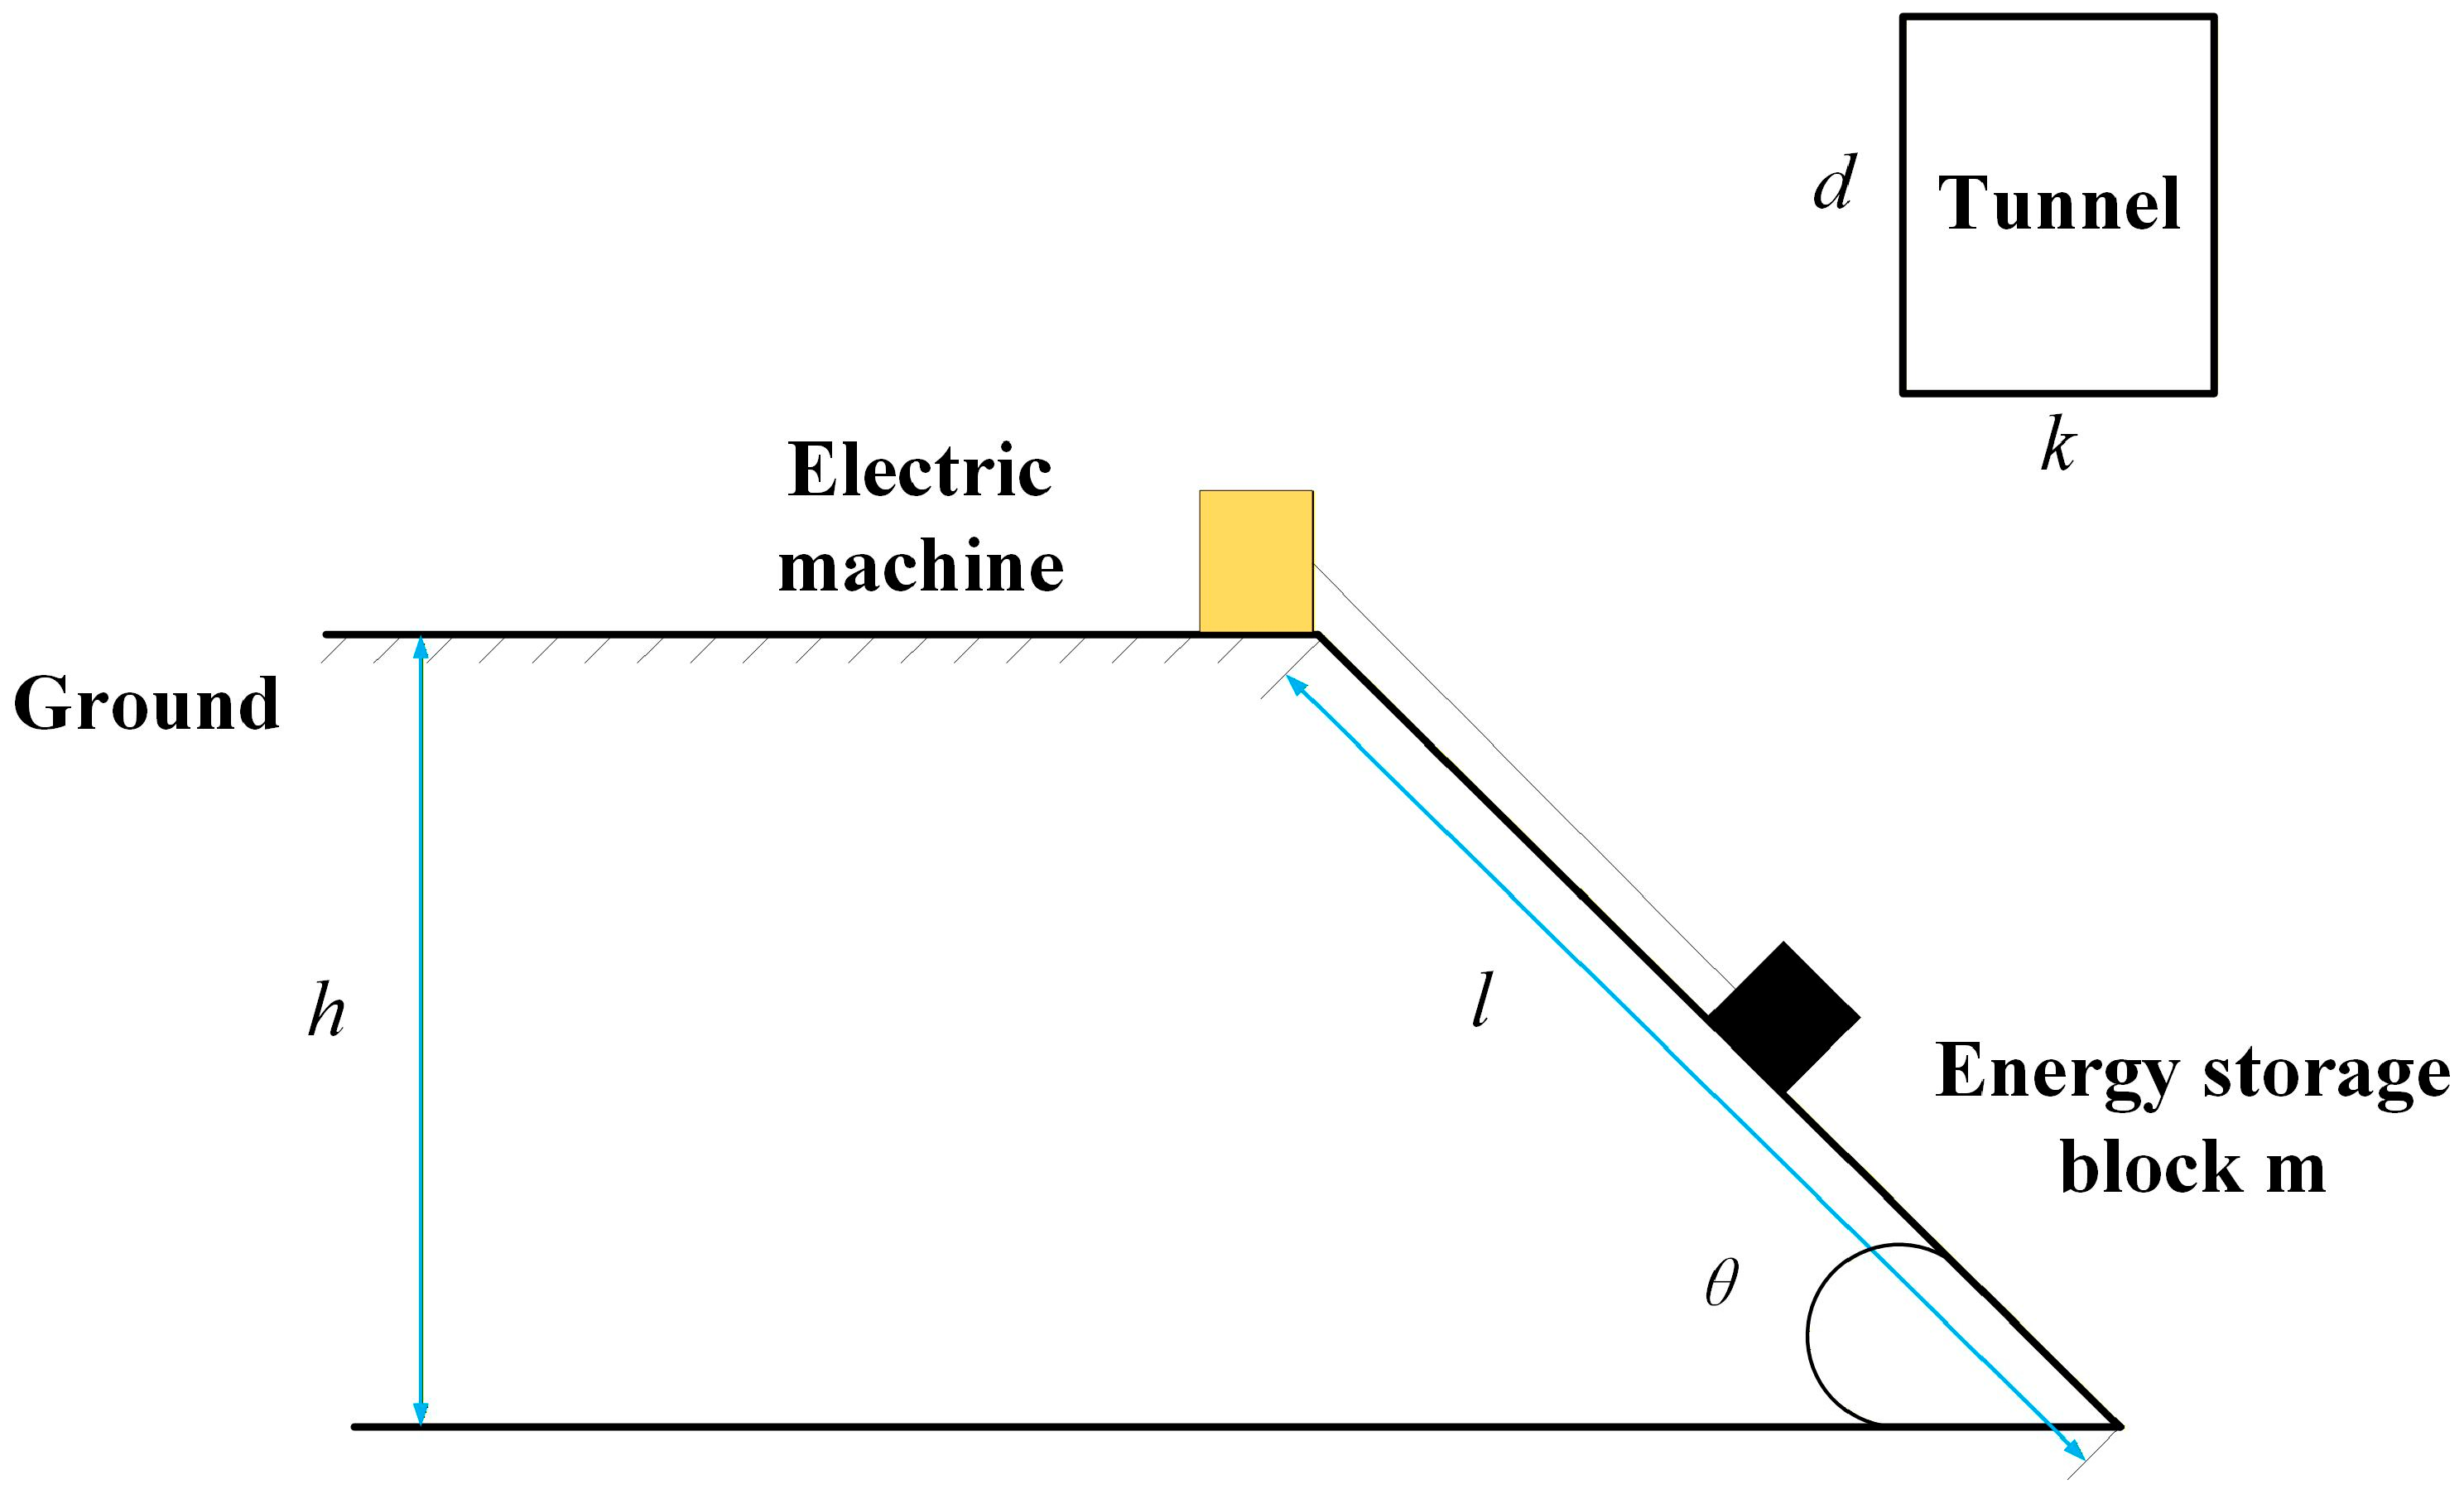
However, mining roadways can also be inclined, as shown in
Figure 3. This paper combines (9) with mining-area data to construct a GES scale model applicable to various scenarios, and the specific derivation process is illustrated as follows:
Since the mining roadway is inclined, there is a mining dip angle of
θ:
In the equation, denotes the mining dip angle, is the roadway mining depth, and is the roadway length; when = , the mine roadway is vertical.
This paper assumes that the selected energy storage weight unit is relatively small compared with the length and depth of the mining face; therefore, the impact of the center-of-gravity position of the GES unit on GES is neglected. The energy released by a single GES unit is given by
where
is the mass of the suspended weight and
is the height from which it falls (drop height).
When projected onto the direction along the roadway, the energy released by the GES unit to the bottom of the roadway is shown in the following equation:
where
denotes the distance—measured along the roadway direction—from the roadway floor to the gravity energy storage unit.
The mass of the GES unit can be calculated from its volume and density. Assuming that the height and width of the GES unit are the same as those of the roadway opening, the mass of the GES unit is
where
denotes the length of the gravity energy storage unit along the roadway direction,
is the density of the gravity energy storage unit,
is the width of the mine roadway, and
is the height of the mine roadway.
Therefore, when releasing the GES unit, if the release length along the roadway is a distance of
from the bottom of the roadway, the equation for calculating the energy released by the GES facility is expressed as follows:
Simplifying the equation yields
From the above equation, it is evident that, for a fixed goaf roadway (i.e., the values of , , and are fixed), the electrical energy released by goaf GES is jointly determined by four factors: , , , and .
2.4. Evaluation of the Economic Potential of Goaf GES
We evaluate the economic potential of goaf GES by calculating the levelized cost of gravity storage (
). The levelized cost of storage (
) for energy storage projects converts the costs of the project cycle over
N future years into current costs using a certain discount rate, thereby realizing the calculation of the average cost over the entire project cycle [
43,
44].
where
is the capital expenditure,
is the annual cost of expenditures,
is the discount rate, and
is the annual energy output.
This paper combines the goaf GES scale and peak–valley electricity prices to convert (16) into the
for goaf GES projects:
where
is the annual cost of electricity consumed to generate electricity,
is the annual running cost,
is the construction cost of the storage facility,
is the residual value of the storage facility, and
is the tax rate.
The power cost (
) for power generation in the t-th year is composed of the power generation (
) of the energy storage facility and the off-peak electricity price (
), and the equation is expressed as follows:
Therefore, the final
for goaf GES is shown in (19):
4. Discussion
4.1. Weight Sensitivity Analysis Based on Monte Carlo Simulation
In this study, the first-level weights were not set empirically from scratch but were derived by modifying the Yangquan goaf PV suitability framework of Zhang et al. according to the engineering characteristics of GES [
23]. In the work of Zhang et al., geological safety had already been assigned the highest first-level weight of 0.4150, which provided the baseline reference for this study [
23]. Compared with photovoltaic facilities, however, GES imposes larger static loading and repeated operational loading on the ground surface. Therefore, the weight of geological safety was increased from 0.4150 to 0.54, while the remaining first-level weights were adjusted to 0.24 for topography and geomorphology, 0.13 for transportation, and 0.09 for GES demand through pairwise comparison and consistency testing. To further test whether these modified weights were robust, a Monte Carlo analysis was conducted. Previous AHP–Monte Carlo studies have explicitly tested bounded perturbation levels of ±20% [
45], and uncertainty in AHP priorities can be represented by a triangular distribution of
, where
is the derived AHP weight and
is the uncertainty range under investigation [
46]. Following this logic, the initial weights in this study were treated as the most likely values and perturbed using a triangular distribution. The perturbation range was finally set to ±20% rather than a weaker disturbance level because a stronger disturbance scenario is more appropriate for testing the stability of a newly adjusted weighting scheme. Under this setting, the Monte Carlo mean remains close to the original suitability result, and 86.97% of the high-suitability area still maintains a probability of
> 0.8, indicating that the modified weighting scheme remains stable under relatively strong perturbation.
In each simulation, both the first-level weights and the second-level sub-weights were randomly perturbed, then normalized to preserve the completeness and comparability of the weighting system. A total of 1000 Monte Carlo runs were conducted, and the full suitability evaluation was recalculated in each run. This design enables a systematic assessment of how weight uncertainty propagates into GES suitability scores without introducing additional subjective adjustments.
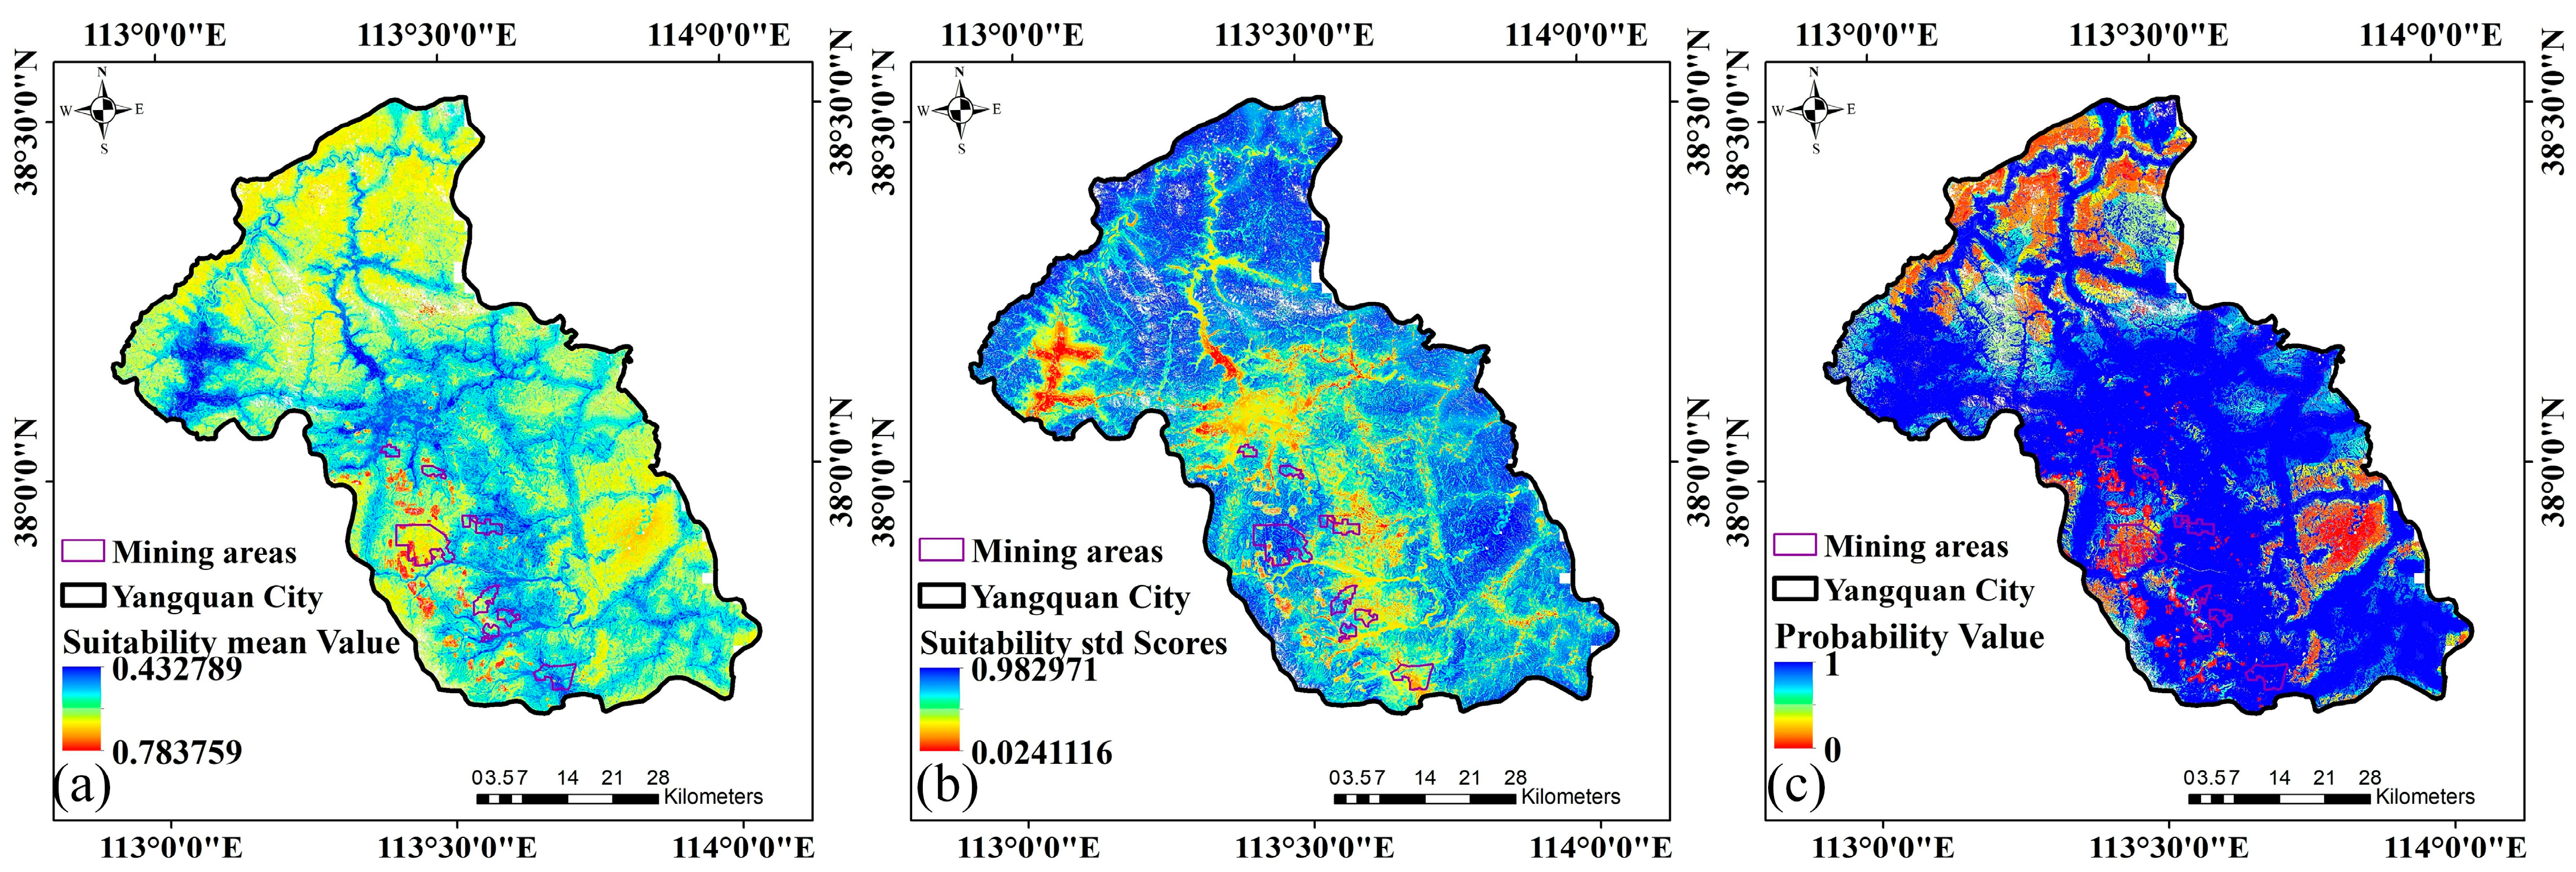
To comprehensively characterize the impact of weight uncertainty on evaluation outcomes, the mean and standard deviation of suitability scores across the 1000 simulations were analyzed, together with the occurrence probability of high-suitability areas (defined as regions with suitability scores exceeding 70% of the maximum score). The results are presented in
Figure 7. A comparison between
Figure 6 and
Figure 7a shows that the Monte Carlo mean is close to the result obtained using the initially assigned weights, indicating that the initial weighting scheme is reasonable. As shown in
Figure 7a–c, areas with higher suitability scores tend to exhibit smaller standard deviations, implying a higher probability of being consistently identified as high-suitability zones and a lower sensitivity to weight perturbations. In addition, 86.97% of the high-suitability area maintains a probability of
p > 0.8 of remaining classified as high suitability under the 1000 perturbed-weight scenarios. These findings suggest that high-suitability zones are not only spatially stable but also demonstrate low sensitivity in both score magnitude and occurrence probability, reflecting strong robustness to weight uncertainty. In contrast, weight uncertainty primarily affects transitional areas near suitability-class boundaries while exerting limited influence on the spatial distribution of the core priority zones. This stability is largely attributable to pronounced spatial gradients in key controlling factors (e.g., subsidence risk), which preserve a consistent spatial ranking of the most suitable areas under different weight combinations. Overall, the suitability assessment remains highly robust under weight uncertainty, providing reliable spatial decision support for the siting of goaf-based gravity energy storage facilities.
4.2. Analysis of GES Development Suitability of Goafs in Yangquan City
To enable a detailed evaluation, the GES development suitability was analyzed statistically for each mining area based on its boundaries. The mean, maximum, minimum, and standard deviation of the suitability scores were extracted and analyzed for this purpose. A mining area is considered more suitable for GES construction if it exhibits higher mean, maximum, and minimum scores, coupled with a lower standard deviation, indicating consistently high suitability across its extent.
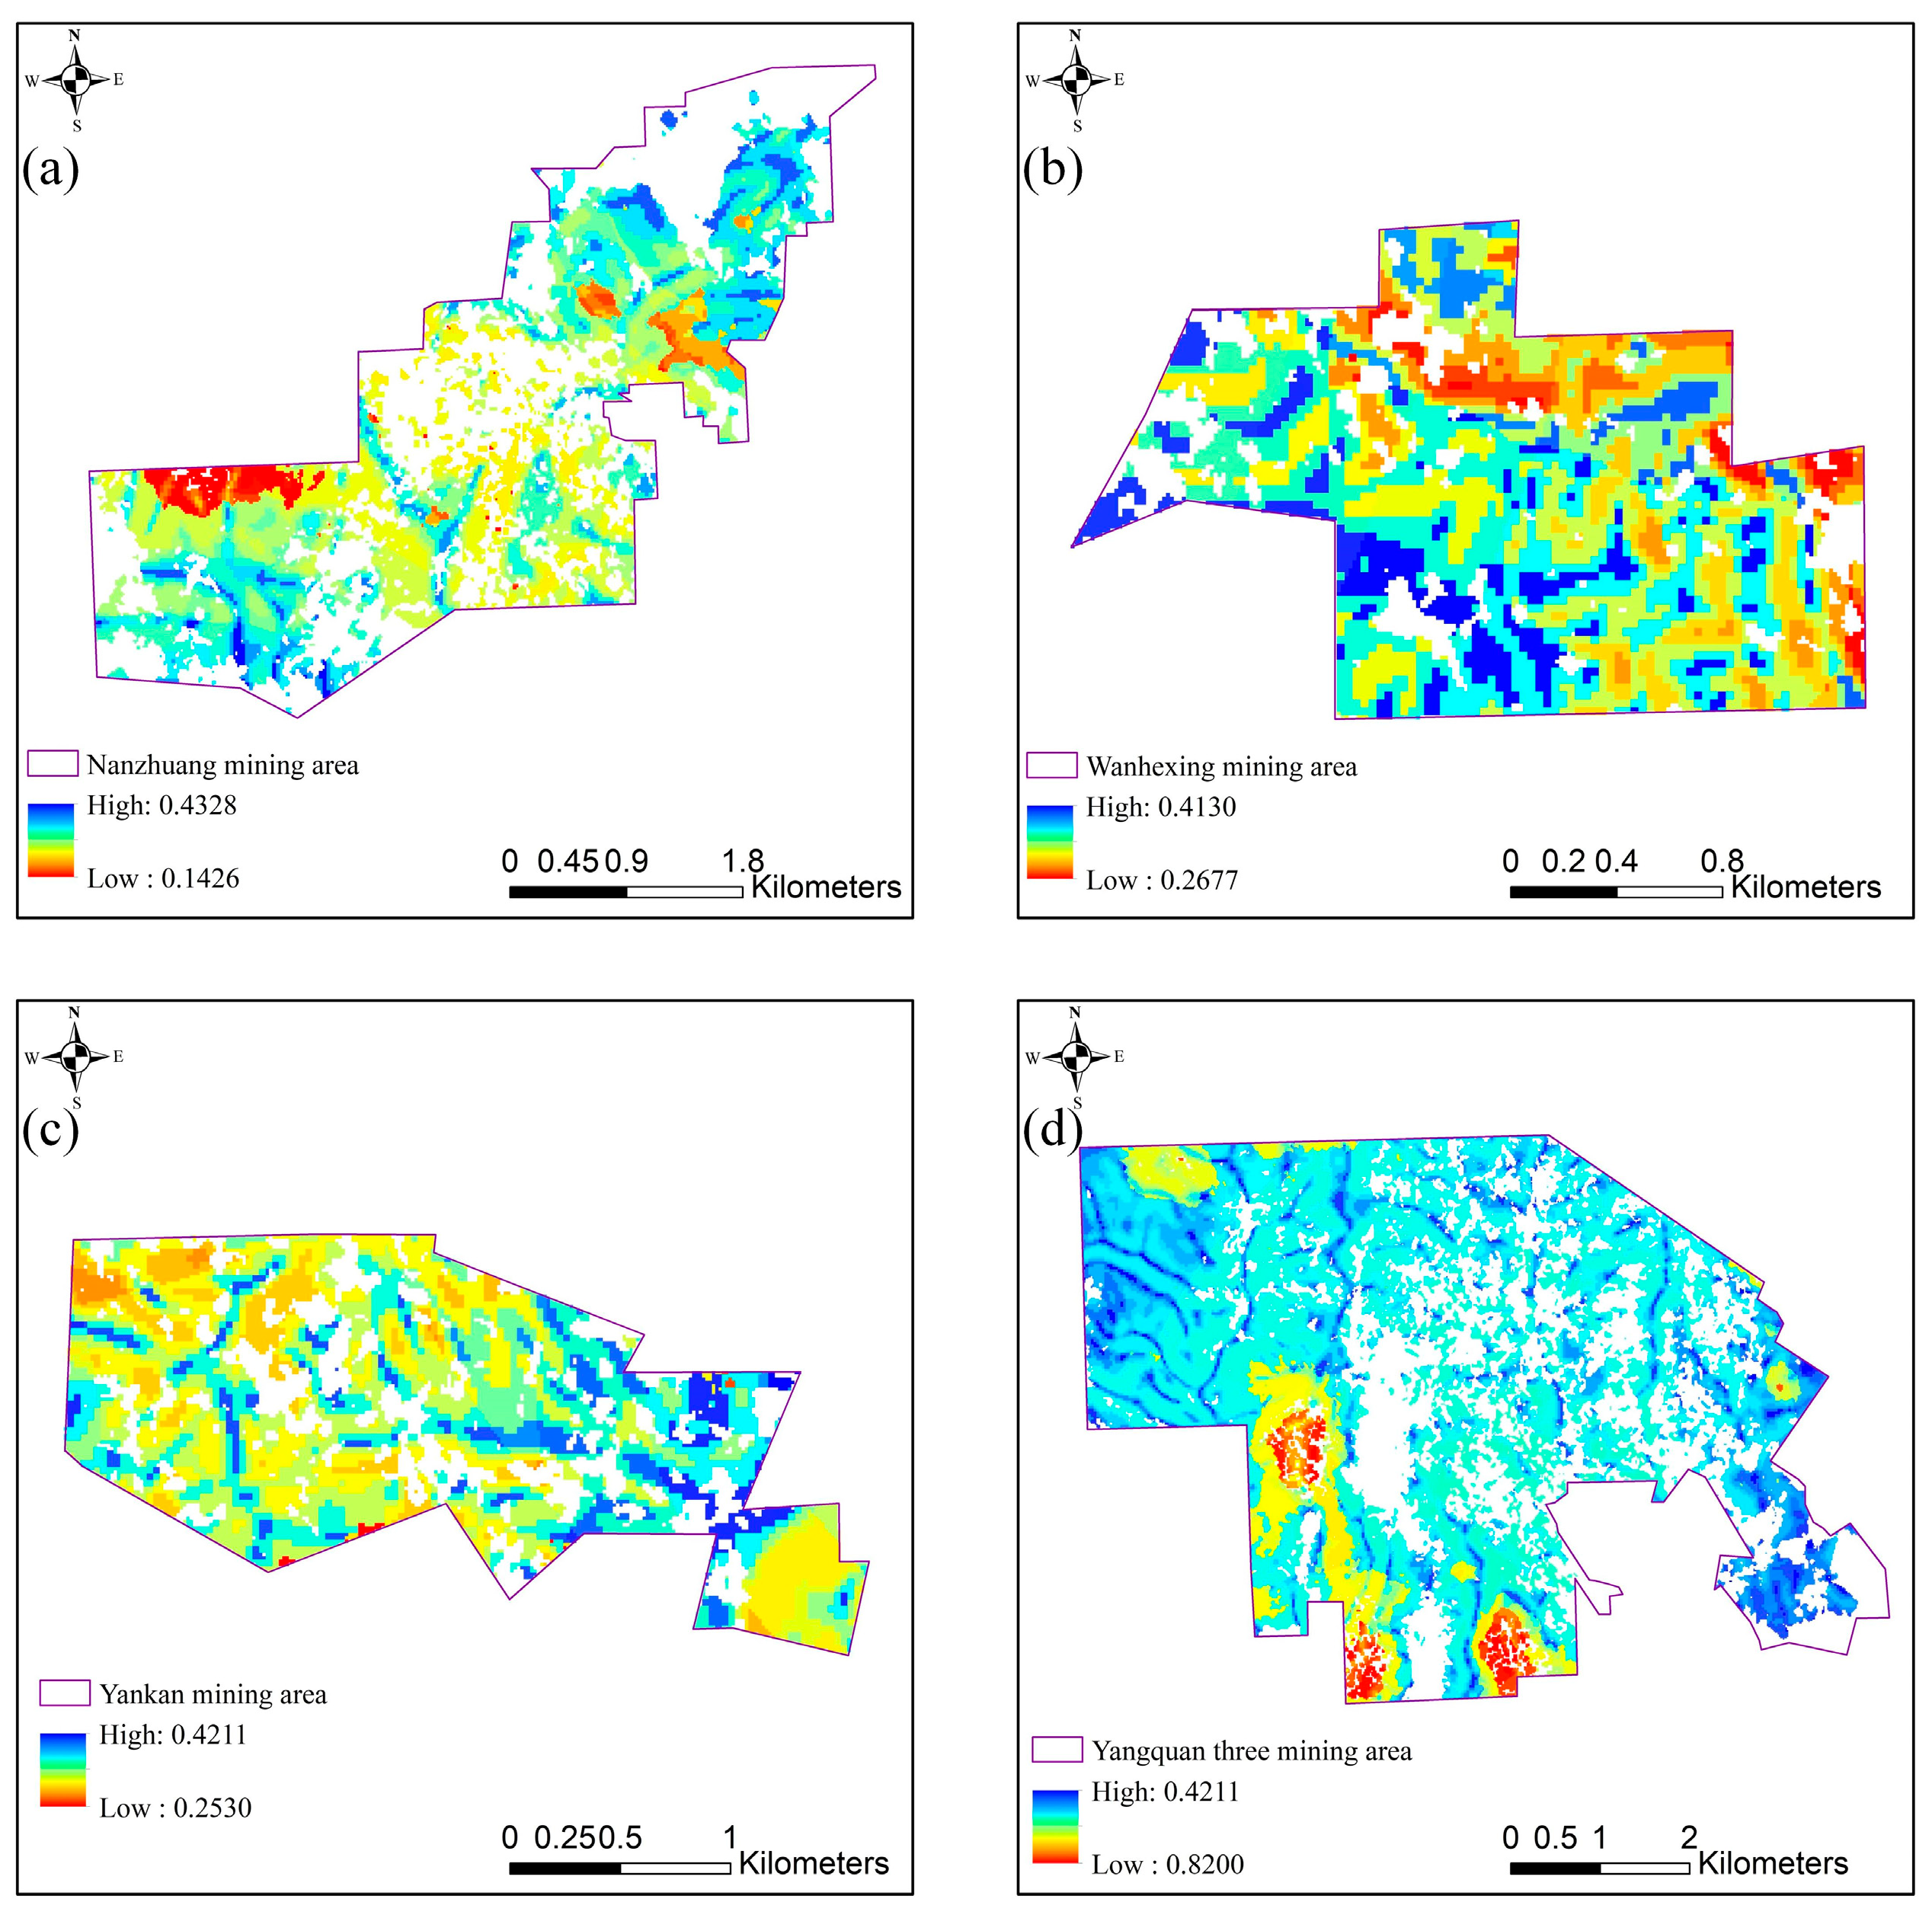
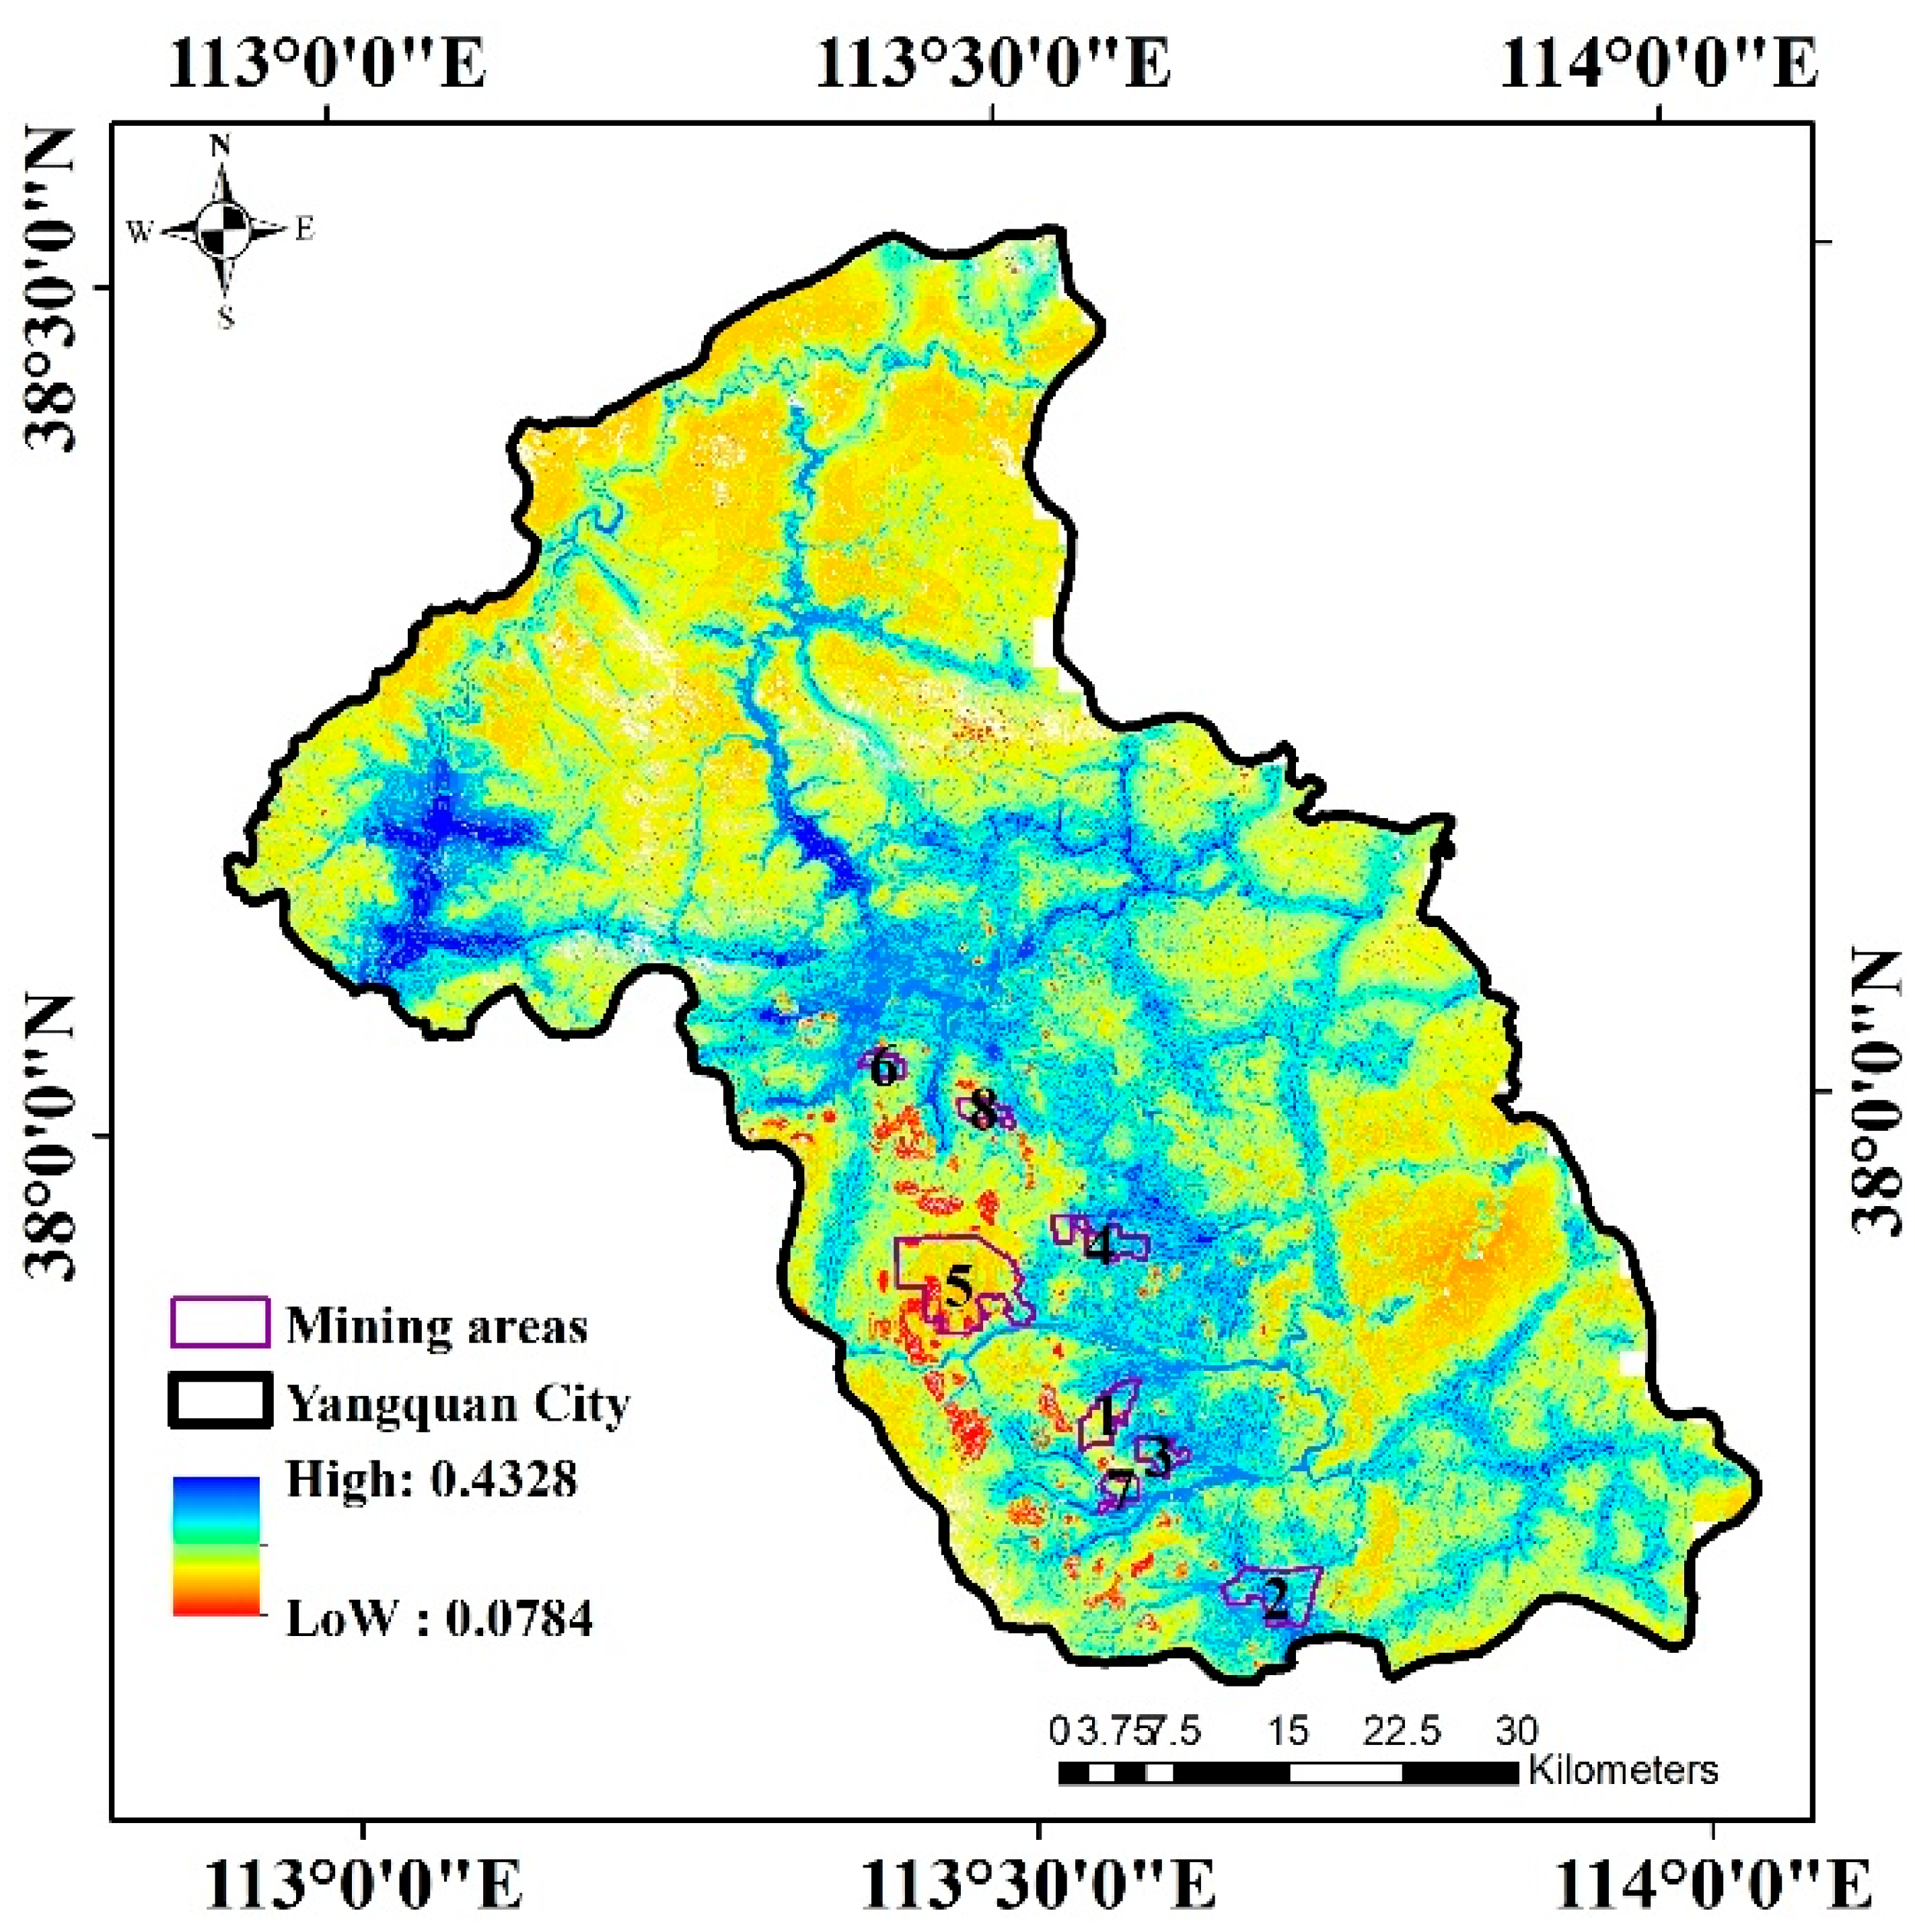
The GES development suitability evaluation results of some closed mining areas are shown in
Figure 8, and the statistical results are shown in
Table 10. The data reveal that among the eight closed mining areas, Yangquan No. 3 Mine is the least suitable for development, with the lowest mean suitability score of 0.2939; moreover,
Figure 7b indicates that this mining area is more sensitive to variations in indicator weights and, thus, is not recommended for GES construction. In contrast, the other seven mining areas receive scores of approximately 0.34–0.37, culminating in a total suitable area of 53.914 km
2.
While the Nanzhuang Mining Area’s mean suitability score of 0.3356 is not the highest, its selection for further analysis is justified by several factors. It possesses the third-largest area among the sites, and the difference between its mean score and that of the top-ranked Wanhexing Mining Area is marginal (0.0254). Furthermore, its relatively low standard deviation of 0.0396 indicates a consistently moderate-to-high suitability throughout the site, reducing locational risks. Therefore, considering the imperative to maximize the utilization of closed mining areas, the Nanzhuang Mining Area is identified as a highly viable candidate for GES construction.
The InSAR monitoring period in this study spans from January 2021 to December 2022. The time interval between this monitoring period and the closure of each mine varies: for the Taichang mining area, which closed earliest, the gap is 5 years; for the most recently closed Nanzhuang and Fuxin mining areas, the gap is 1 year (see
Table 1). Therefore, the suitability assessment results for goaf-based gravity energy storage obtained during this period can be used to evaluate whether closed mining areas in Yangquan are suitable for such development within 1–5 years after closure. However, mining history and closure conditions vary across different mining areas. For a more robust evaluation, longer-term InSAR monitoring is recommended—for example, by acquiring data continuously from the time of mine closure to the planning stage of a specific energy storage project.
4.3. GES Scale of Nanzhuang Mining Area Under Different Weight Densities
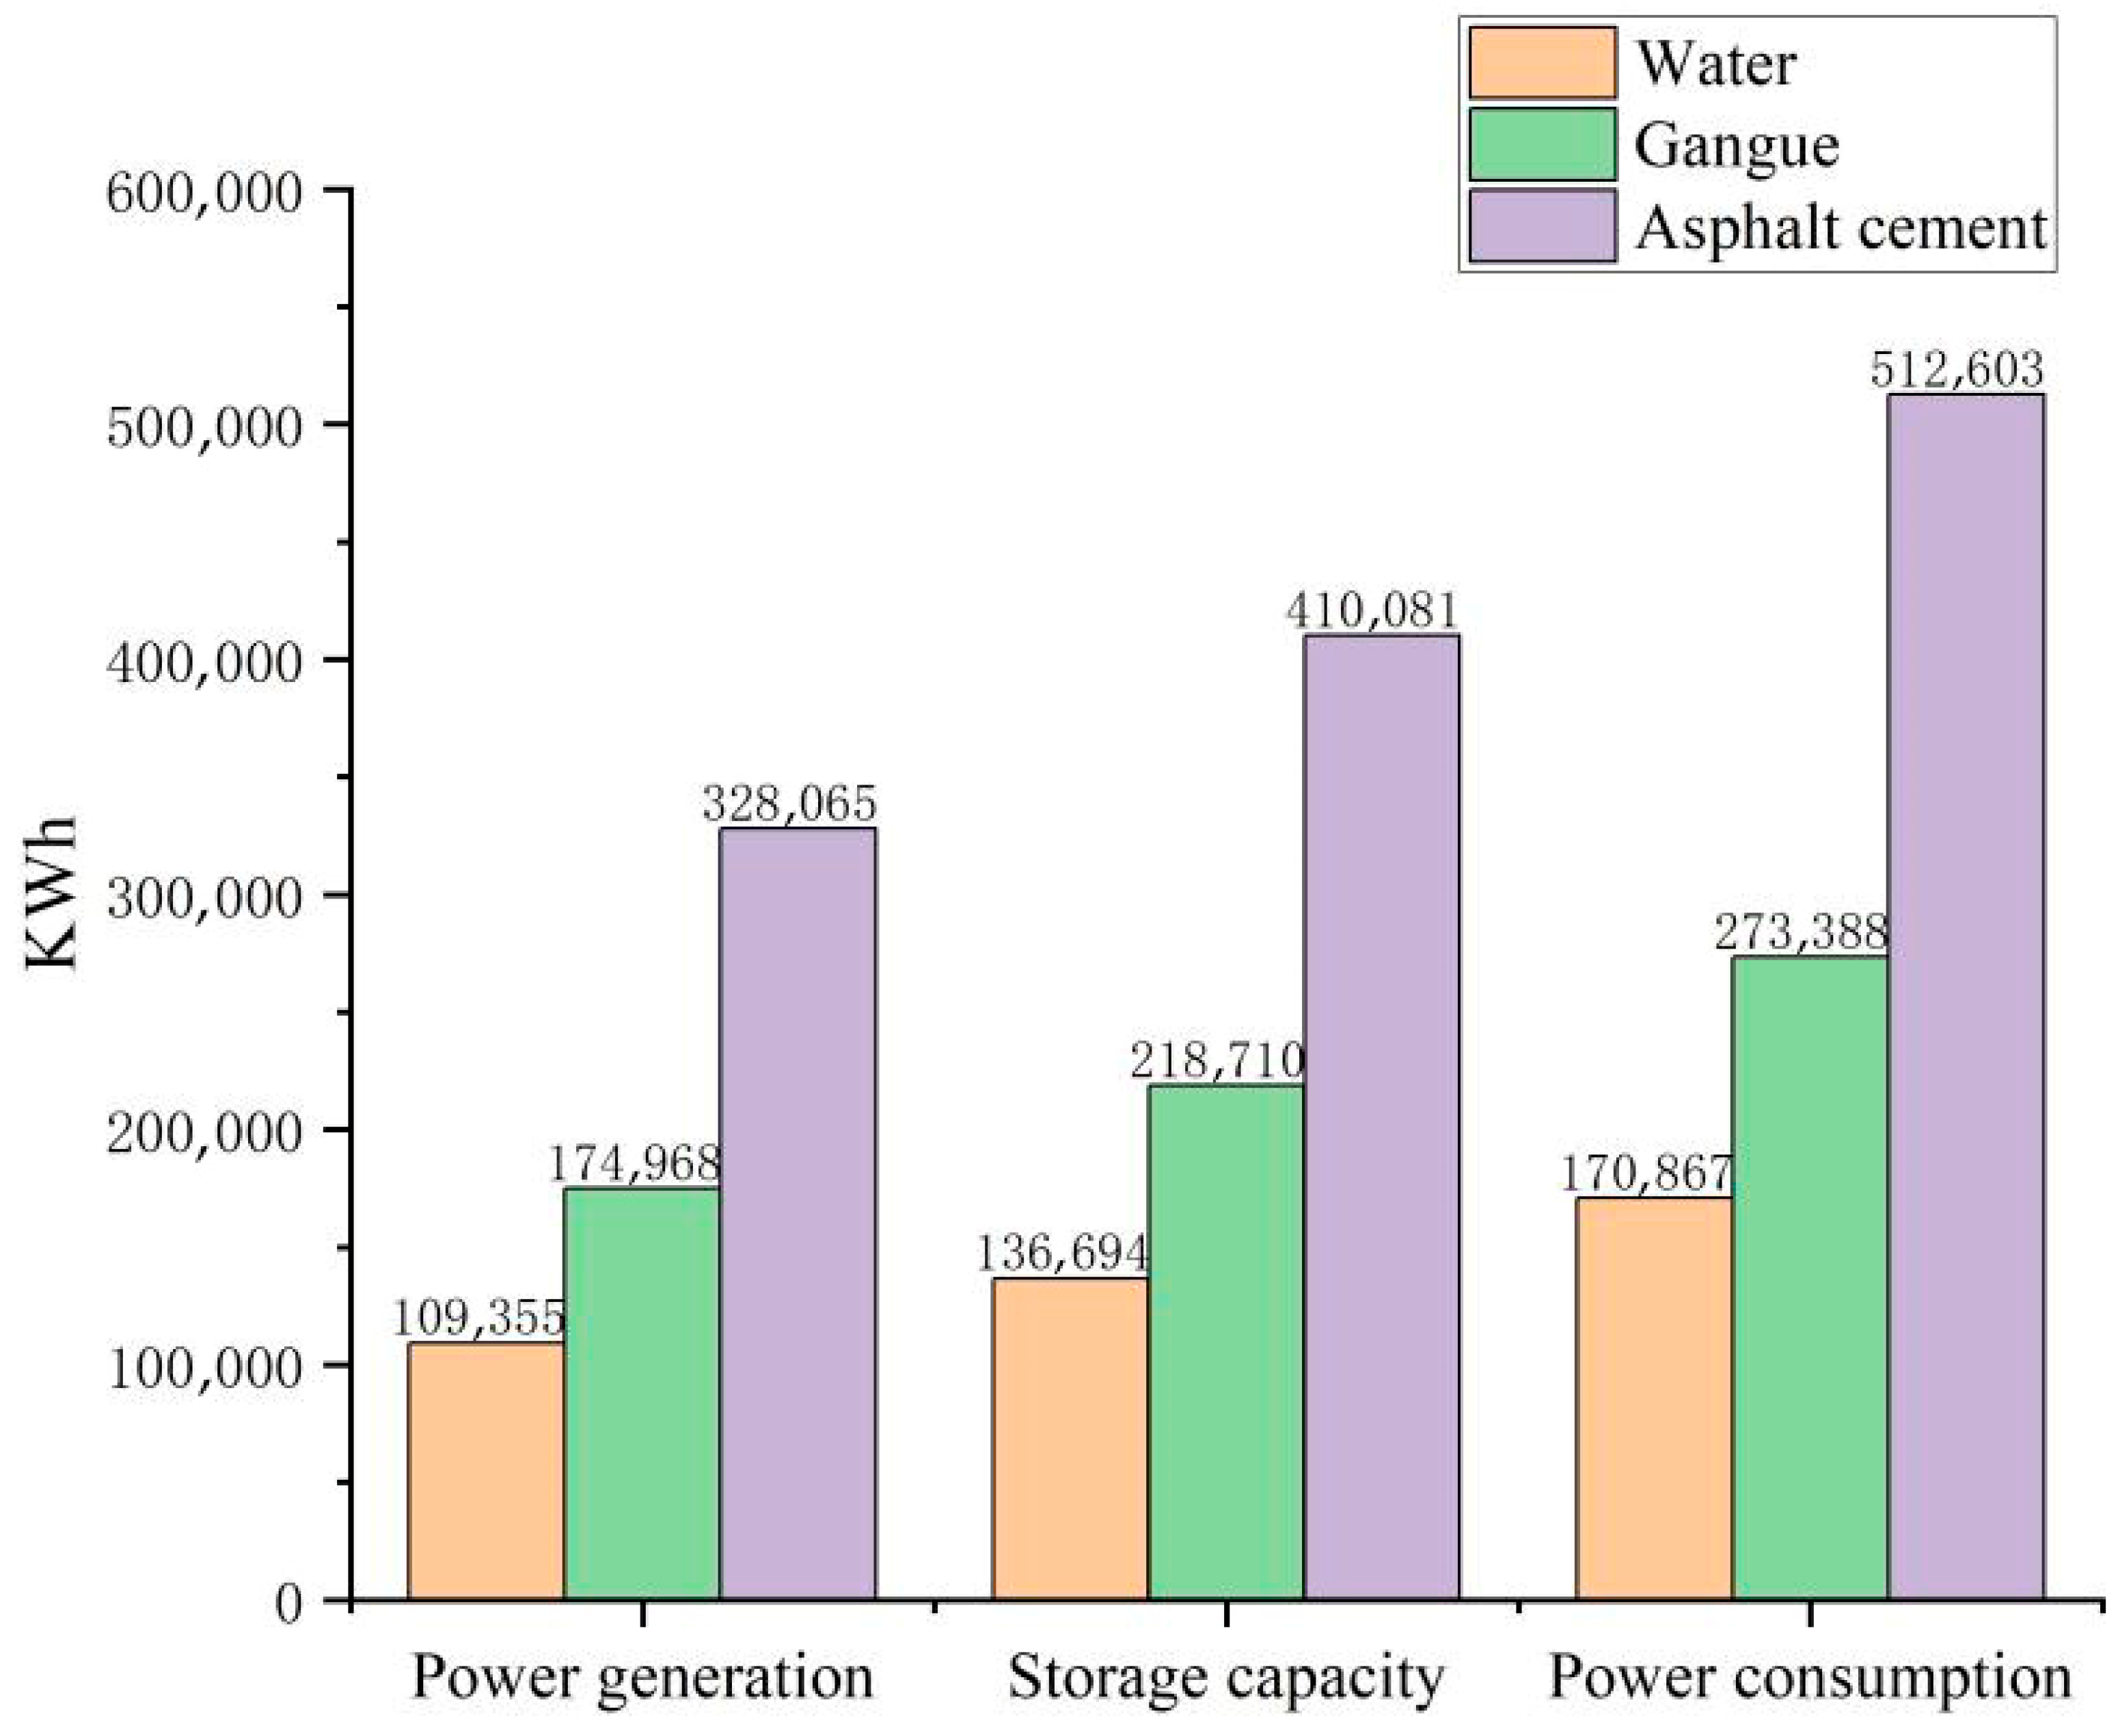
The energy storage scale of a GES facility is directly influenced by the density of the weight material, which also constitutes a significant portion of the project cost. To analyze this relationship, we evaluated three candidate materials with distinct densities and costs: water, coal gangue, and asphalt concrete (see
Table 11). For modeling purposes, the density of coal gangue is taken as 1500 kg/m
3. The resulting GES scales under different densities are shown in
Figure 9.
As illustrated in
Figure 9 the one-time power generation, energy storage scale, and power consumption scale of the GES facility in Nanzhuang Mining Area exhibit a positive correlation with material density. The use of high-density asphalt concrete yields a maximum energy storage scale reaching up to 410 MWh. However, material selection involves a critical trade-off, as higher-density materials typically command a higher price, directly impacting the capital expenditure of the facility. According to the “Implementation Rules for Shanxi Independent Energy Storage and User-Controlled Load Participation in Power Peak Shaving Market Transactions (Trial)” officially issued by the Shanxi Energy Regulatory Office of the National Energy Administration, the access threshold for independent energy storage is no less than 40 MWh. This analysis confirms that all three material options can meet the minimum access threshold of 40 MWh for independent energy storage participation, as stipulated by the Shanxi Energy Regulatory Office. Consequently, the final material selection can be optimized based on specific project requirements, balancing the desired storage capacity against budget constraints.
4.4. Comparative Analysis of LCOGS Under Different GES Scales
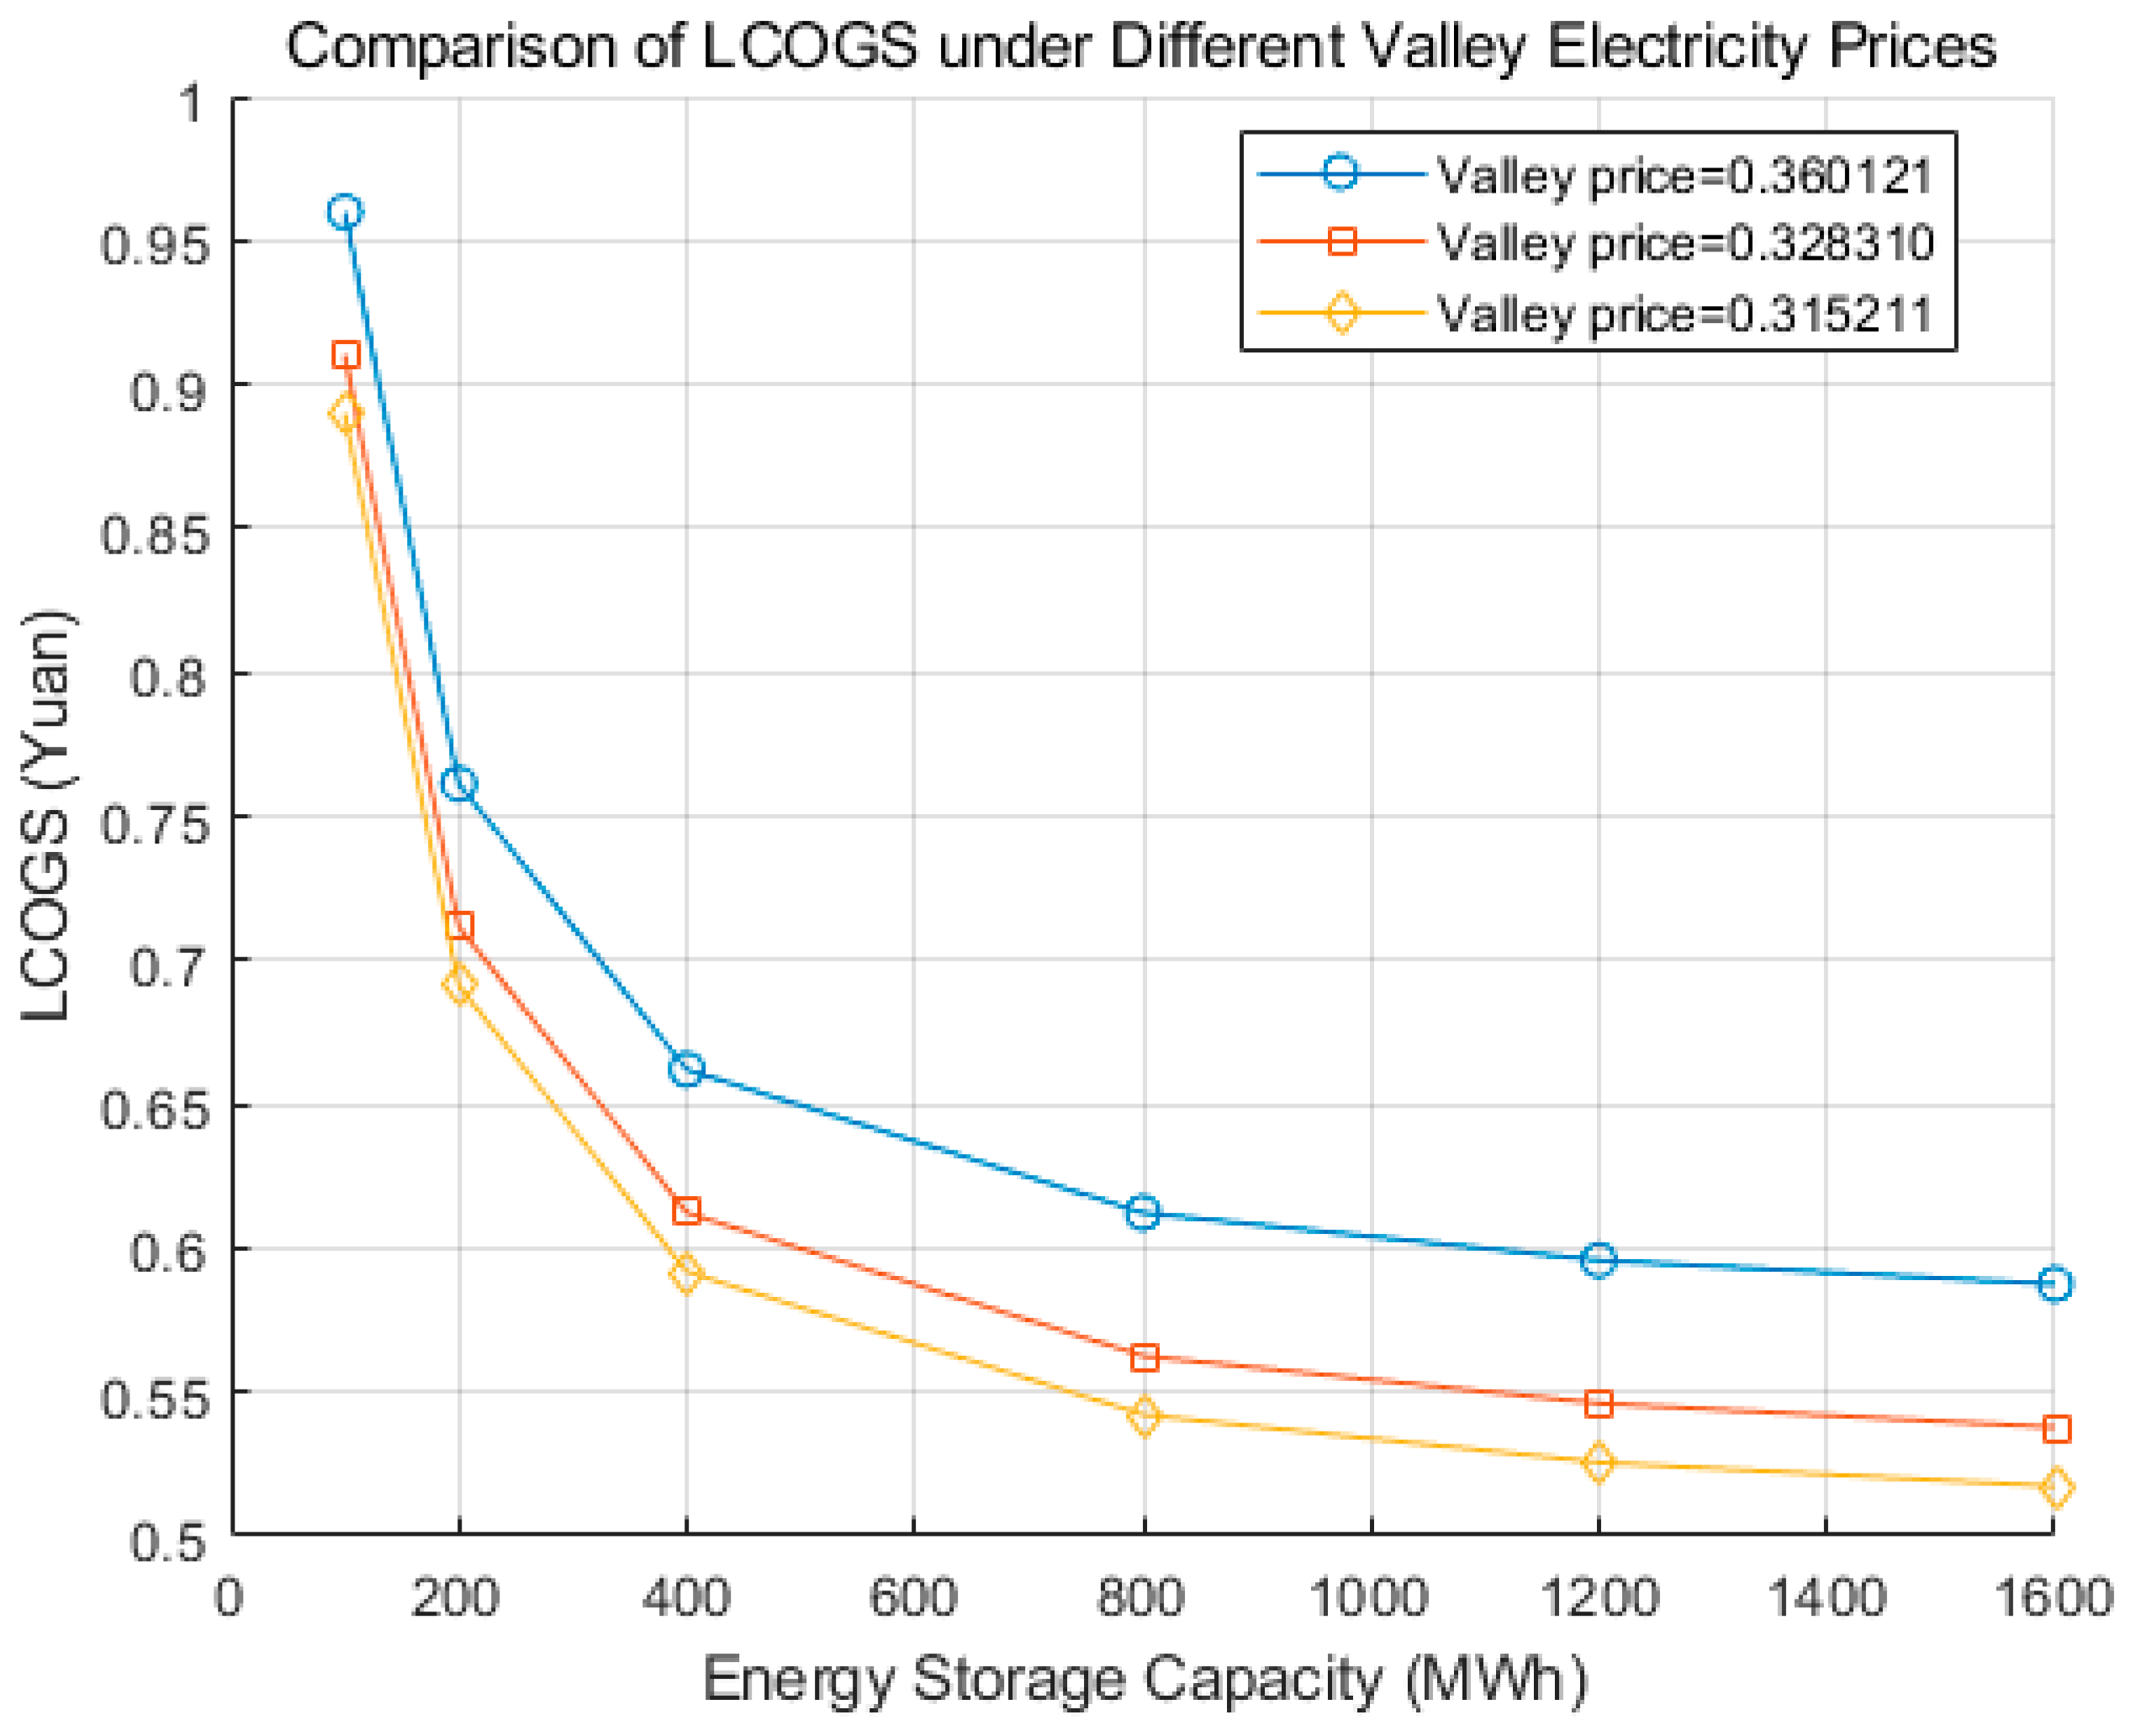
A comparative analysis of the LCOGS across different energy storage scales was conducted, with the results presented in
Figure 10.
The analysis reveals a clear economies-of-scale effect; as the GES capacity increases from 100 MWh to 1600 MWh, the LCOGS consistently decreases across all off-peak electricity price scenarios. However, this reduction is subject to diminishing returns, as the rate of cost decline slows with increasing scale.
For a given closed mining area, the physical dimensions of the roadways are fixed. Consequently, the primary determinant of the GES scale becomes the density of the weight material. While higher density directly translates to a larger storage capacity, it also introduces a critical trade-off by increasing construction costs and exerting greater pressure on the ground support structures. Therefore, the selection of a weight material is not a simple matter of maximizing density. It requires a multi-objective optimization that balances material density, cost, and geotechnical constraints to achieve the dual goals of large-scale and low-cost energy storage for goaf GES projects.
5. Conclusions
This paper proposed a novel, integrated model system for the large-scale assessment of GES development potential in mining goafs, evaluating key factors including subsidence risk, energy storage capacity, and economic viability. The application of this assessment system to Yangquan City and the Nanzhuang Mining Area yielded the following key findings:
(1) The proposed evaluation system provides a comprehensive and practical tool for assessing the GES development potential of goafs. By systematically integrating geological safety, energy storage scale, and economic benefits, this method aids government and enterprises in identifying goaf sites that are safe, meet capacity requirements, and are economically viable for GES development, thereby facilitating the promotion and implementation of GES technology in post-mining regions.
(2) The subsidence risk assessment results for 2021–2022 indicate that low-risk areas dominate the eight closed mining areas in Yangquan, covering 81.69 km2 and accounting for 89.82% of the total closed mining area. Relatively low-risk, relatively high-risk, and high-risk areas account for 8.79%, 1.29%, and 0.10%, respectively. Subsequent GES suitability assessment shows that seven of the eight closed mining areas are suitable for development, with a total suitable area of 53.91 km2, while only Yangquan No. 3 Mine is deemed unsuitable.
(3) Regarding energy storage scale and economic potential, the case study of the Nanzhuang Mining Area demonstrates significant promise. Assuming a GES unit material density of 3000 kg/m3, the potential energy storage scale reaches 410 MWh, substantially exceeding Shanxi Province’s minimum requirement for independent energy storage power stations (>40 MWh). Economically, based on the lowest off-peak electricity price, the calculated LCOGS is 0.5894 CNY/kWh. This cost is lower than the peak electricity price, confirming the potential for a profitable operational model.
Due to data deficiencies, this paper lacks verification of the InSAR detection results using GNSS data and leveling data, in addition to lacking more information about the closure of mining areas in Yangquan City. This leads to certain deviations in the results of this paper. With the addition of future data, the reliability of the detection results reported in this paper can be further improved. In summary, this method provides a reference for other researchers to study gravity storage facilities in abandoned mining areas. On the basis of the suitable areas preliminarily identified by the method proposed in this study, future researchers can further combine the actual closure information, roadway geometry, and engineering conditions of local goafs to evaluate the corresponding GES potential in specific mining areas. Moreover, the InSAR method can also conduct continuous structural health monitoring of GES facilities during operation, which is helpful for the long-term operation of abandoned-area gravity storage facilities.




 ,
,