1. Introduction
Accurate and efficient detection of individual trees is an important challenge with significant applications in different fields such as environmental sciences and agroforestry practices. Accurate tree detection provides essential input for forest resource inventory, detection of illegal logging activities, crop yield estimation, and overall assessment of forest health and carbon sequestration. Variability in tree species, canopies, and density of planted trees creates obstacles to achieving fully automated and highly accurate detection across diverse landscapes.
In recent years, the development of remote sensing technology at a fast rate has offered new opportunities for very high resolution analyses. In this regard, the Unmanned Aerial Vehicle (UAV) technology has been identified as a promising method for the implementation of tree detection. In other words, the UAVs allow more flexibility than the traditional aerial or satellite platforms, which can effectively provide very high resolution images with negligible influences from the atmosphere. As such, the derived data from UAV technology can sufficiently provide information at the individual tree level, even for the smaller or more complex plantations [
1].
In the field of tree detection using UAV data, there are two primary methodologies, image-based and 3D point cloud-based methods; while image-based detection is often based on spectral and textural information derived from orthomosaics and may involve vegetation indices and texture analysis, detection based on 3D point clouds, obtained through active (LiDAR) sensors or passive (photogrammetric) sensors, depends on height and morphological information to extract tree crowns [
1]. A common approach includes creating a Canopy Height Model (CHM) from the point cloud and then performing tree detection on the raster layer.
Many unsupervised techniques have been designed for both 2D image and 3D point clouds to automate the segmentation procedure independently of any training data. In the context of this study, the term “unsupervised” is used to define a method that does not require labeled training data or manual annotation and without any parameter learning based on ground truth examples. This distinguishes the proposed approach from supervised Deep Learning techniques that rely on extensive ground truth datasets for training. These traditional methods include watershed segmentation [
2], region growing [
3], template matching [
4], and object-oriented image analysis [
5]. Even though these methods are computationally efficient, the results are extremely sensitive to the parameters set by the user and need heavy manual adjustments to account for differences of canopy overlap, species, and the characteristics of data acquisition. Furthermore, the selection of the optimal spatial scale or kernel size often remains a heuristic process, significantly impacting the robustness and repeatability of the detection results. Although Deep Learning techniques are still the highest performers under optimum circumstances, they require an enormous amount of data and a lot of computational power and resources and may often be uneconomical and unsuitable for the specific scale of any environmental monitoring application.
This paper introduces a novel, robust framework for tree detection using UAV imagery and 3D point cloud data. Specifically, this study presents the DTCD (Distance Transform Circle Detection) method, an unsupervised approach that integrates Euclidean Distance Transform-based circle estimation with Akaike Information Criterion (AIC) optimization. The core innovation of this framework lies in the synergistic integration of the Euclidean Distance Transform which is utilized to directly extract geometric parameters (center and radius), while the AIC automatically and objectively determines the optimal number of trees with respect to canopy coverage efficiency.
This study makes two principal contributions:
The development of a fully unsupervised framework for tree detection, which demonstrates substantially faster processing and superior detection performance than existing state-of-the-art unsupervised and supervised methods.
The provision of the AgiosNikolaos-3 dataset, consisting of orthomosaics and photogrammetrically reconstructed 3D point clouds, enabling assessment across complex urban environments.
The remainder of this paper is organized as follows:
Section 2 describes the related work with emphasis on unsupervised methods utilizing CHMs, point clouds, and UAV/satellite imagery, and supervised and deep learning methods.
Section 3 describes in detail the main steps of the proposed method, which is divided into two main pipelines, the Image-Based Pipeline and the 3D Point Cloud-Based Pipeline.
Section 4 presents our experimental results on the Acacia-6 Dataset and the Urban Dataset. Finally,
Section 5 and
Section 6 present the discussion and the conclusion of the paper, respectively.
2. Related Work
Tree detection has been studied extensively using a wide range of remote sensing data, including RGB or multispectral UAV imagery, high resolution satellite data and LiDAR or photogrammetrically reconstructed point clouds.
Table 1 presents a brief overview of the methods commonly used in the literature, providing a comprehensive taxonomy of state-of-the-art tree detection methodologies, categorizing them based on the input data source, ranging from LiDAR and photogrammetric point clouds to satellite and UAV imagery and their algorithmic approach. As illustrated, the literature includes a broad spectrum of techniques, from traditional unsupervised methods utilizing Canopy Height Models (CHMs) and geometric point cloud analysis (e.g., Watershed, Local Maxima) to supervised Deep Learning frameworks that leverage high-resolution RGB data.
2.1. CHM-Based Unsupervised Methods
Local Maxima (LM) detection is one of the most widely used approaches for identifying treetops from Canopy Height Models (CHMs) [
6,
7]. The method assumes that the highest pixel within a sliding window corresponds to a tree top, making window size selection crucial. Very small windows tend to split large crowns into multiple detections [
8,
9,
10].
Watershed segmentation is frequently combined with LM to delineate individual crowns by simulating a topographic flooding process [
8,
11]. However, watershed algorithms often struggle in dense forests where adjacent crowns strongly overlap, leading to over-segmentation. Extensions such as improved watershed [
12] attempt to detect overlapping crown regions using geometric cues, but remain sensitive to height thresholds and smoothing parameters [
13].
Other works have explored single-level unsupervised crown delineation based on CHMs, such as Region-based Hierarchical Cross-Section Analysis (RHCSA) [
14,
15]. RHCSA treats the canopy as a 3D terrain surface and analyzes its horizontal cross-sections, but its performance strongly depends on user-defined height intervals and it may fail to detect smaller trees below the scanning threshold [
16].
2.2. Point Cloud—Based Unsupervised Methods
Point cloud-based methods directly operate on LiDAR or photogrammetrically reconstructed point clouds. The Point Cloud Segmentation (PCS) algorithm [
17] classifies points based on spacing thresholds and vertical profiles, but requires careful parameter tuning and tends to under-perform in highly heterogeneous forests [
18]. Layer Stacking (LS) [
19] constructs horizontal slices of the canopy and applies k-means clustering guided by LM detections. LS has shown improved performance in multi-layered forests and high-density fused datasets [
20].
Density-based approaches such as Adaptive Mean Shift 3D (AMS3D) [
21] model crowns as modes in a multi-density distribution. Although highly flexible, they are sensitive to kernel bandwidth selection, motivating several self-calibration enhancements [
22,
23,
24]. RANSAC has been used to fit parametric crown shapes to noisy point clouds [
25,
26], offering robustness for trees lacking clear apexes. Bottom–up methods that focus on trunk detection have also been explored [
27,
28,
29,
30], but they struggle in areas with interconnected crowns.
2.3. Unsupervised Detection from UAV and Satellite Imagery
Tree detection from RGB or multispectral images has also been pursued using purely image-based methods. Approaches include canopy boundary enhancement and segmentation from satellite imagery [
31], citrus tree extraction using multispectral UAV data and DSMs [
32], and circular or elliptical Hough Transform-based detection [
33,
34]. Recent work has introduced unsupervised geometric fitting methods such as the Decremental Circle Fitting Algorithm (DCFA) for UAV RGB imagery [
35], which uses skeleton-based initialization and an AIC-based optimization model.
2.4. Supervised and Deep Learning Approaches
Deep learning frameworks have recently shown strong performance in tree detection and counting [
43]. Semantic segmentation networks such as FCN, U-Net, SegNet, DeepLab, and PSPNet have been used to classify canopy regions [
36,
37]. Object detection networks, including Faster R-CNN, YOLO variants, and DeepForest [
38,
39], can detect individual trees, but often have difficulty in delineating the crown boundaries.
Instance segmentation methods such as Mask R-CNN and its variants [
40,
41] provide both localization and crown contours, offering improved accuracy in complex environments. Advanced transformer-based architectures (e.g., SwinTUnet [
42]) further improve feature representation by capturing global context. However, supervised methods require extensive manual annotation and may generalize poorly across different environments and sensor modalities.
2.5. Research Gaps
Despite significant progress, unsupervised methods that work effectively, particularly in complex urban environments, remain limited. CHM-based approaches require height information, while point cloud methods typically demand dense and accurate LiDAR or photogrammetric reconstructions, which are not always available or may vary in quality depending on acquisition conditions. Deep learning approaches are further dependent on time consuming need of annotated data. There is therefore a need to develop unsupervised techniques that use either RGB images or point clouds that are capable of robust tree detection even in very complex urban environments.
3. Methodology and Materials
An unsupervised and computationally efficient approach is presented for the automatic detection of tree crowns from high-resolution RGB images and orthomosaics, as well as from the corresponding photogrammetrically reconstructed 3D point clouds. The approach combines distance transform-based circle estimation, local maxima identification and an AIC-based optimization process, allowing robust crown detection without the need for training data; while the method works exclusively with RGB images, the incorporation of 3D point clouds further enhances accuracy and stability, particularly in complex urban environments.
Due to the heterogeneous nature of the datasets used in this study, the approach is divided into two separate pipelines:
The first pipeline, named Distance Transform Circle Detection (DTCD), addresses tree detection in 2D RGB imagery using the Acacia-6 dataset.
The second pipeline, named Distance Transform Circle Detection–Point Cloud (DTCD-PC), handles tree detection in urban environments using dense point clouds generated through photogrammetric reconstruction.
The main processes of both pipelines are described below.
3.1. Image-Based Pipeline
3.1.1. Dataset Description
To analyze the performance of the proposed approach, Acacia-6 dataset was chosen, which was introduced for the first time in [
37] and subsequently used by [
35]. The Acacia-6 dataset was created using a drone in a Southeast Asian region where Acacia trees are cultivated. Due to variations in dimensions and shapes during the growing season, the trees are shaded and overlapped. Thus, the Acacia dataset is produced considering different months like 6 and 12 months as mentioned in [
37].
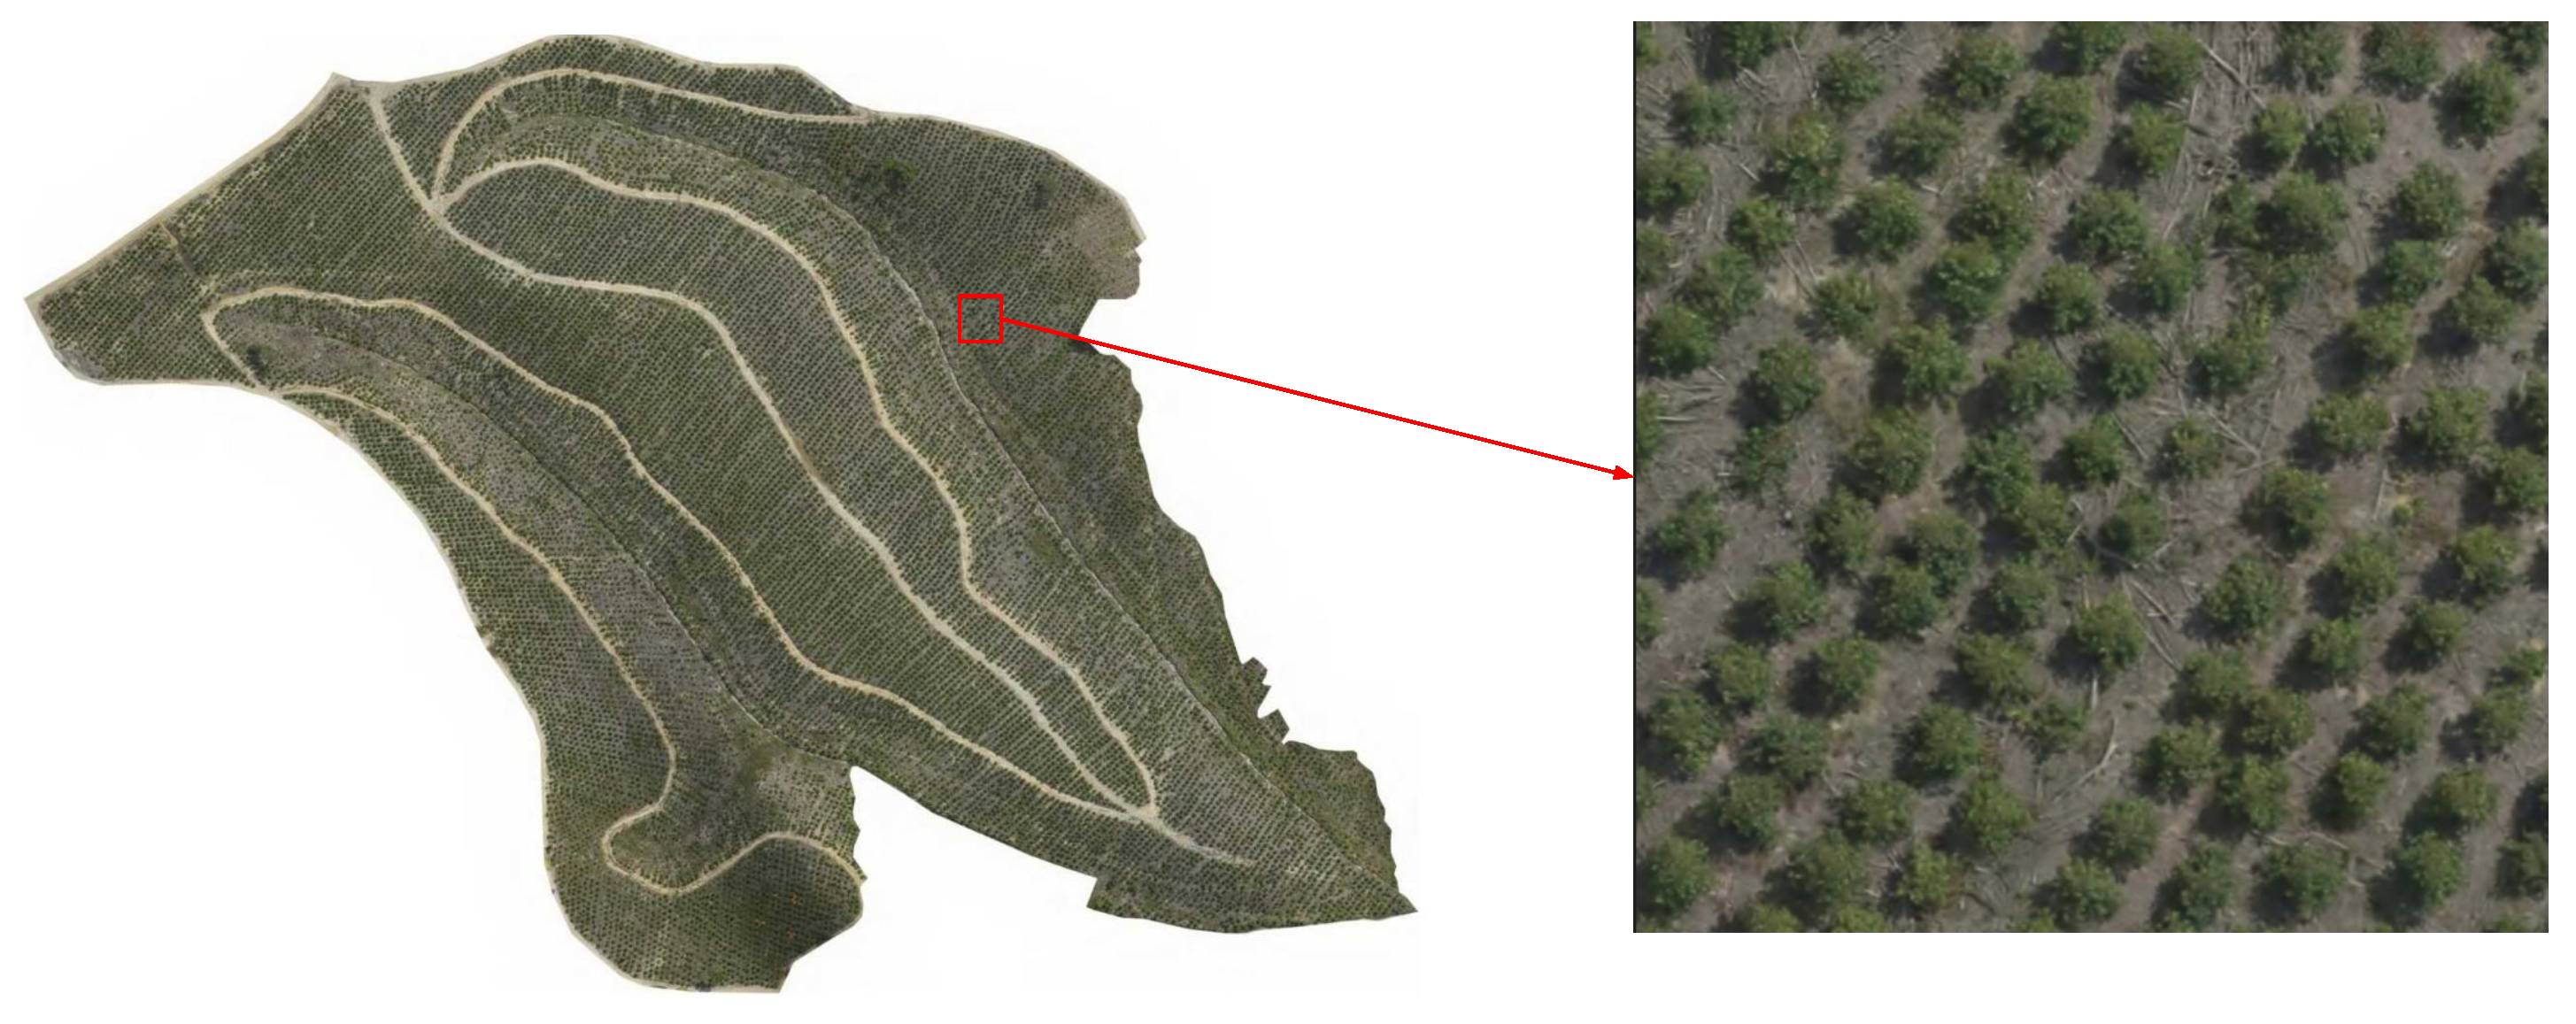
For the present research work, the Acacia-6 dataset consisting of images of six-month-old Acacia trees was used (see
Figure 1). There are complete tree shapes in Acacia-6 and the boundaries between objects are distinct. For the experiments, we divided the original Acacia-6 image into 247 sub-images of the same size.
3.1.2. Preprocessing and Vegetation Index Computation
A visible-band vegetation index was computed using the Red–Green–Blue Vegetation Index (RGBVI), as proposed by [
44]:
where
R,
G, and
B represent the red, green, and blue spectral bands, respectively. This index enhances vegetation by exploiting differences between green reflectance and the red—blue product.
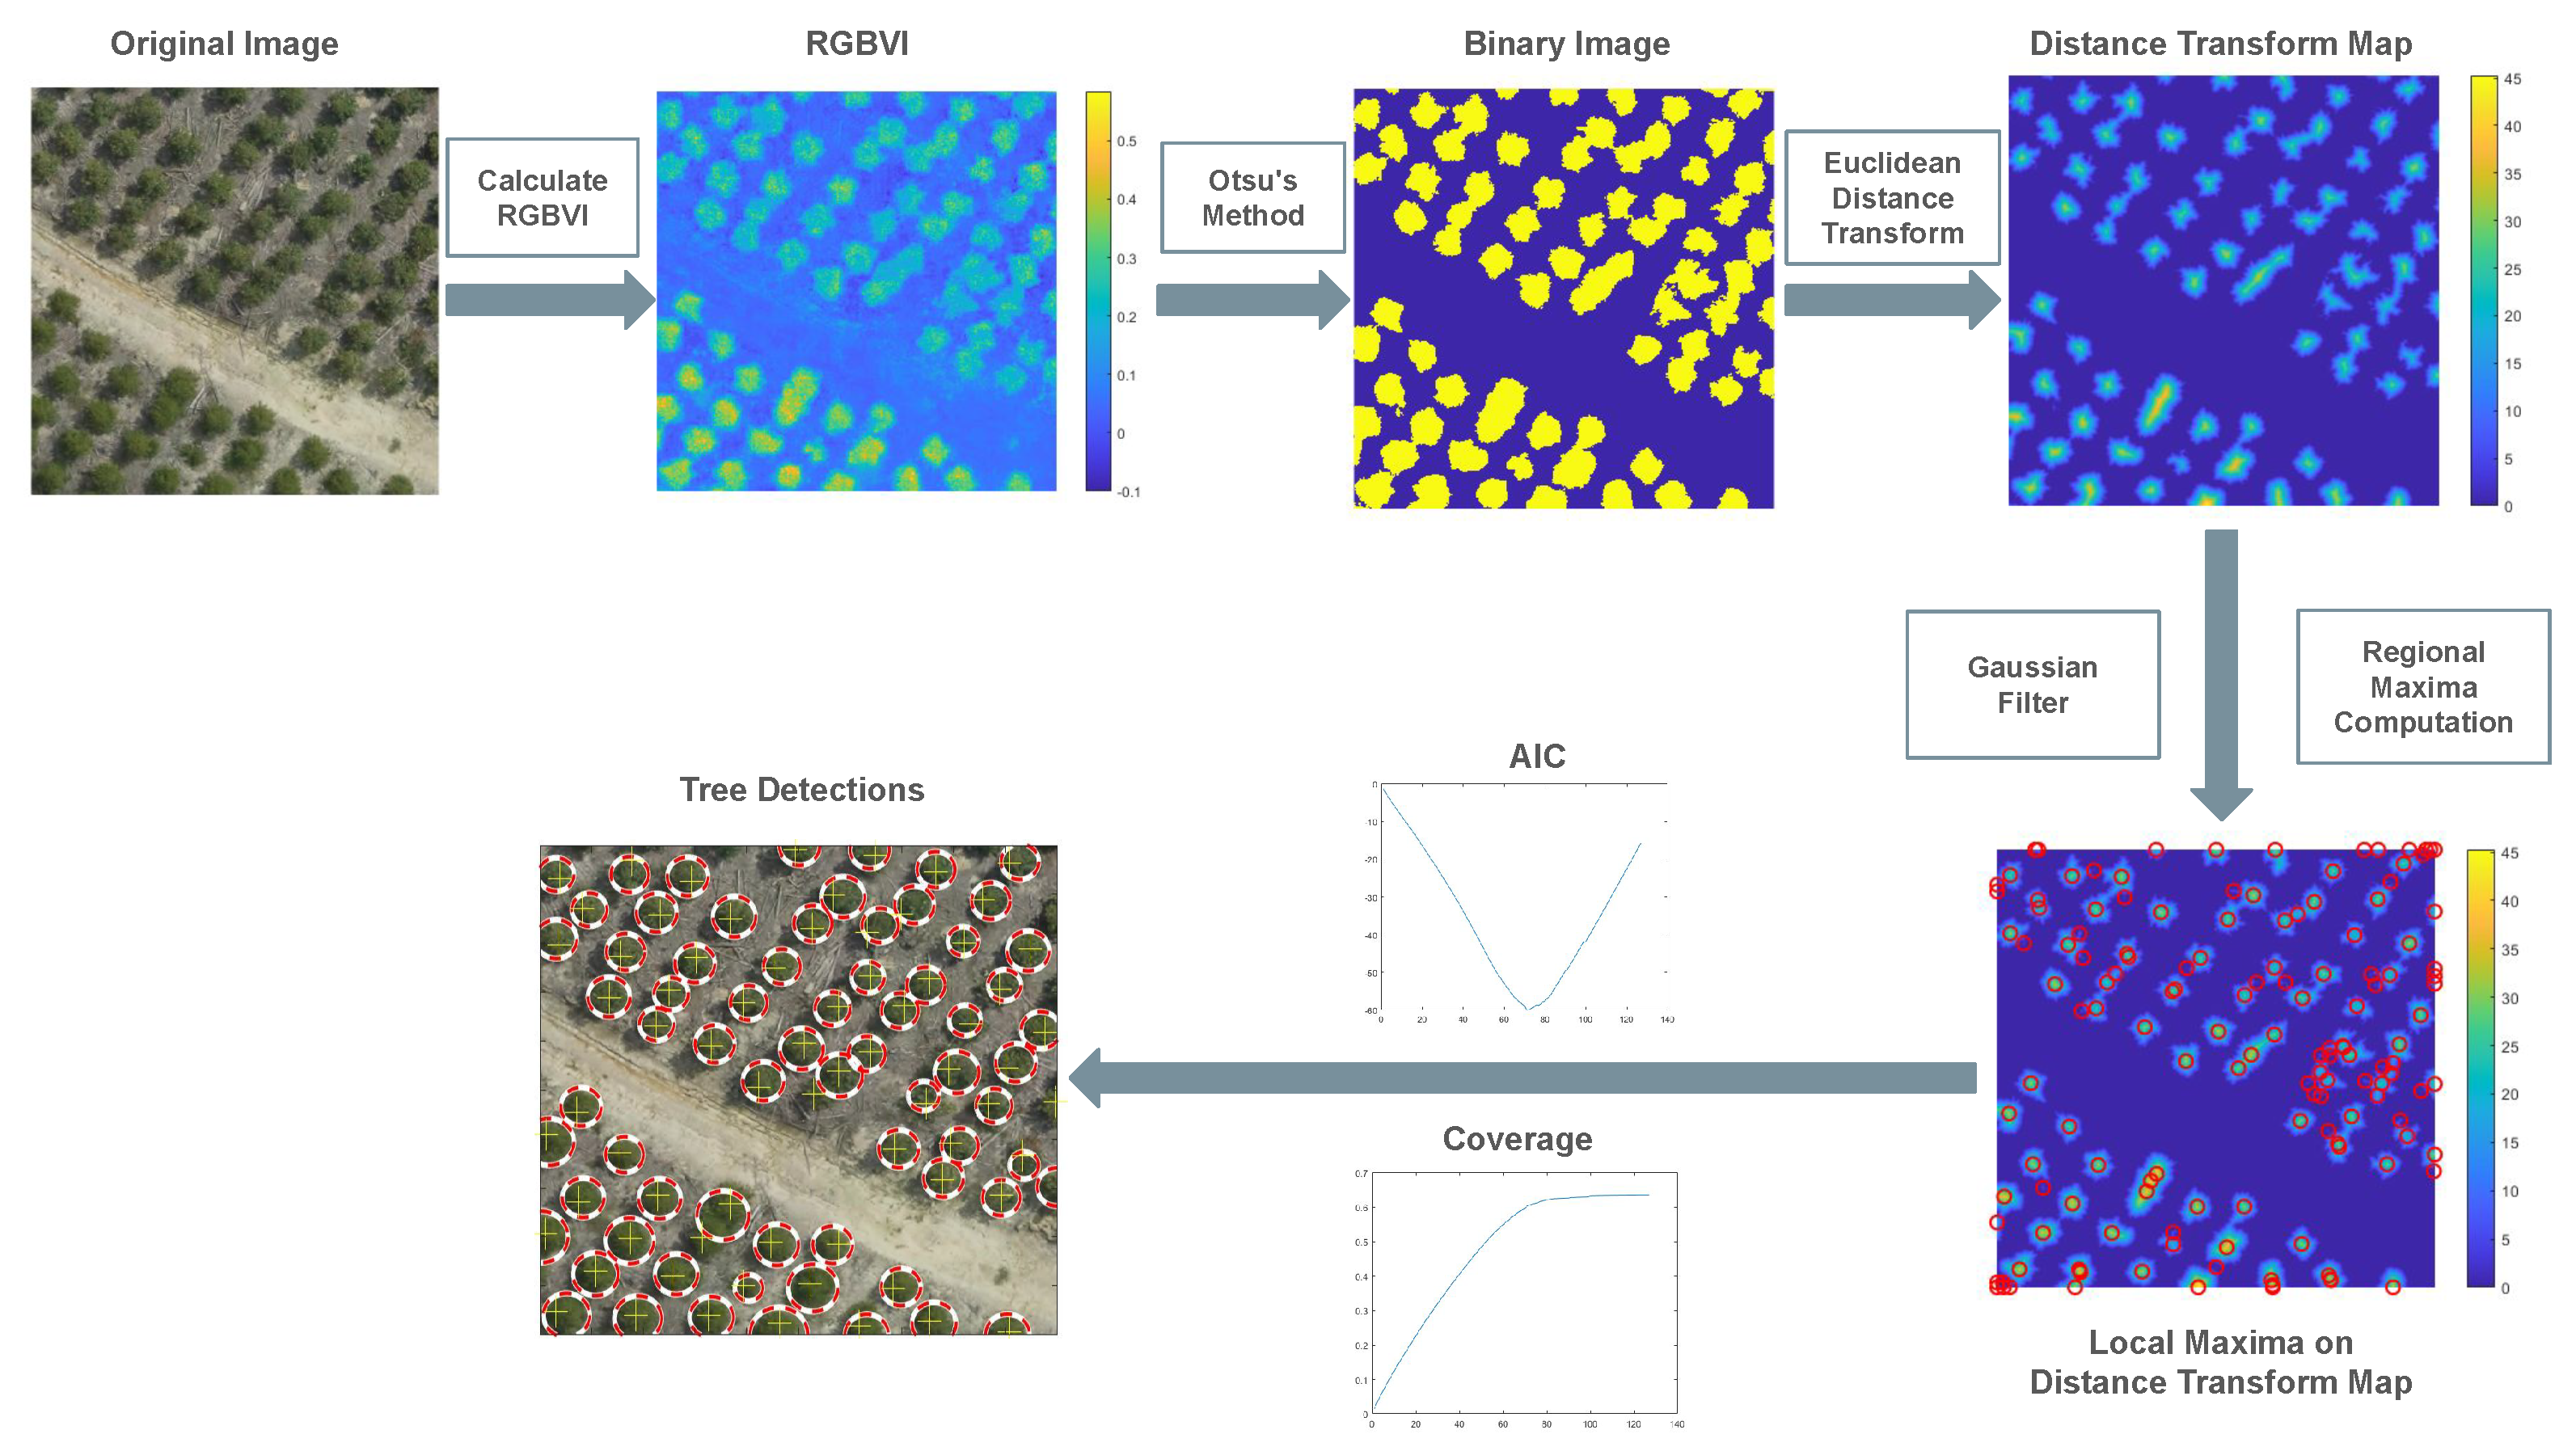
The RGBVI image (see
Figure 2) was then normalized and thresholded using Otsu’s adaptive method [
45] to create a binary vegetation mask (see
Figure 2). Finally, morphological functions were applied to eliminate noise and small gaps within canopy regions.
3.1.3. Distance Transform-Based Circle Estimation
The Euclidean Distance Transform (EDT) [
46] was calculated on the binary vegetation mask (see
Figure 2). The EDT assigns each vegetation pixel a value equal to its Euclidean Distance from the nearest background pixel. Typically, the Euclidean Distance
is defined as:
where
are the coordinates of the background pixels in the set
. The resulting distance map
provides a continuous representation of the distance of each canopy pixel from the canopy boundary, with larger values indicating those pixels near the top of the tree canopy.
A Gaussian filter with a standard deviation of
was applied to smooth the distance transform image and eliminate noise and false peaks. Local maxima from the smooth (EDT) were then extracted to serve as candidate tree tops (see
Figure 2).
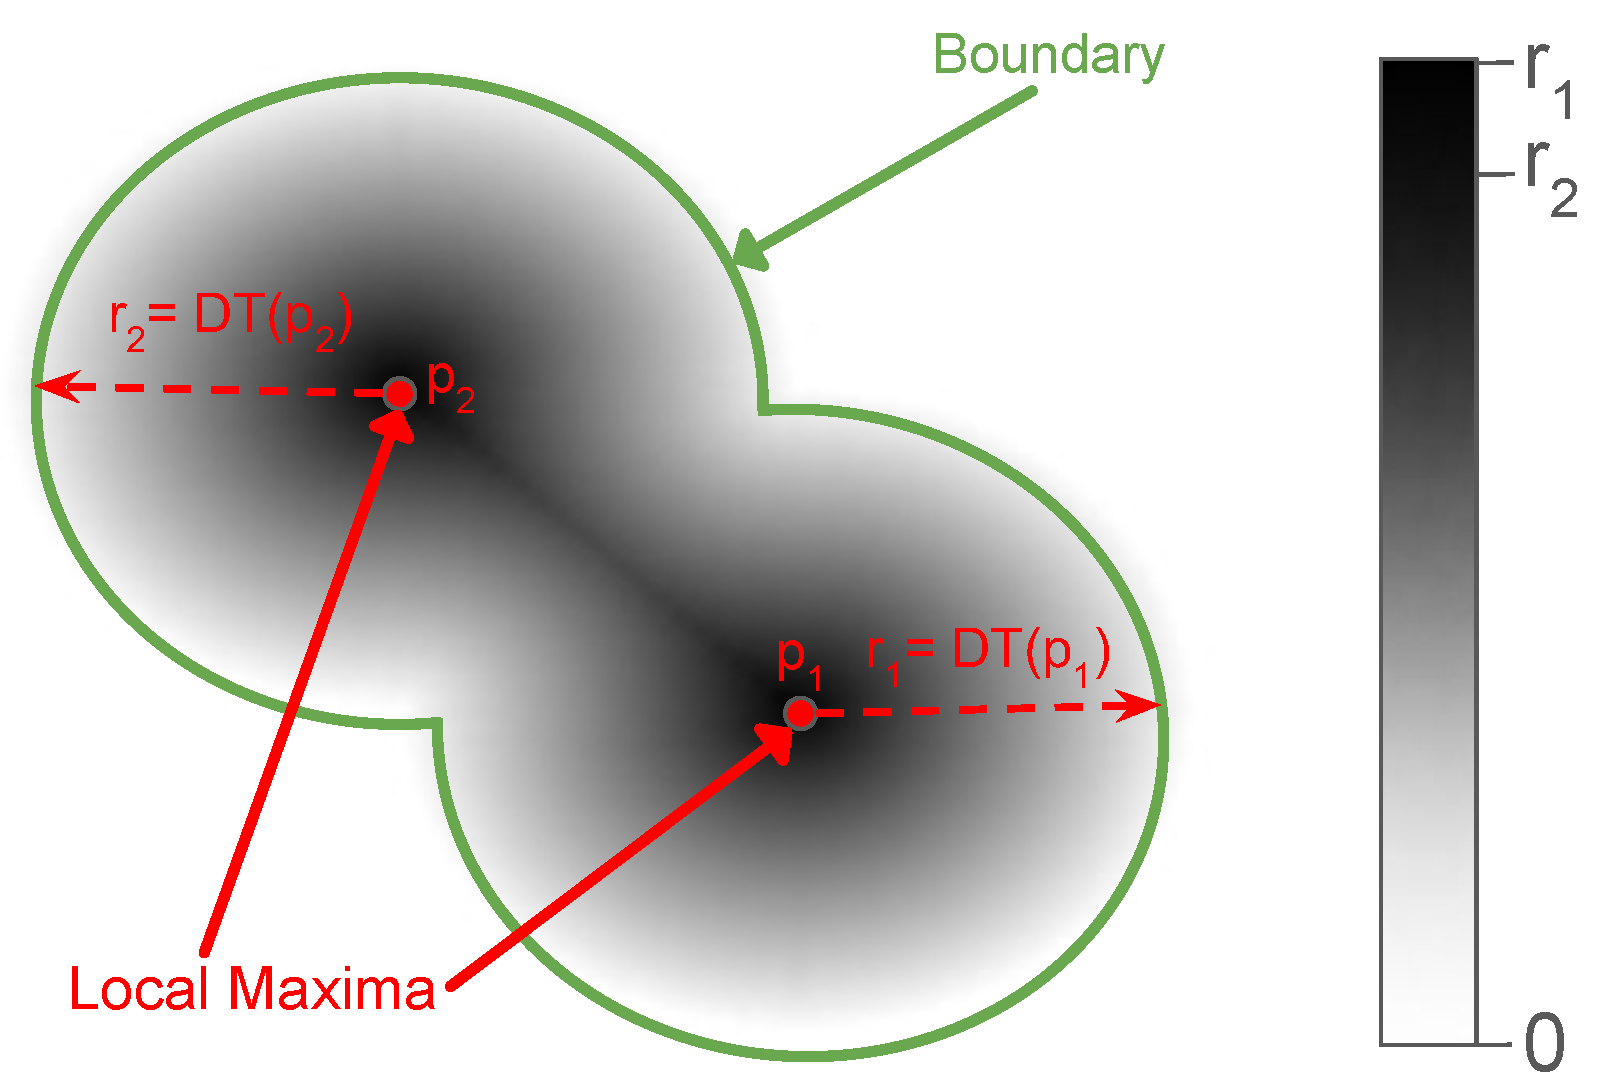
Each identified local maximum (e.g., points
and
in
Figure 3) is geometrically modeled as a circular crown defined by
, where
represents the coordinates of the center, and
r corresponds to the Euclidean Distance Transform value at that location (depicted as dashed arrows
and
). These defined circles serve as candidates for the subsequent optimization process, which aims to select the optimal set that maximizes coverage within the vegetation mask boundaries. Finally, the identified circles are sorted in descending order based on their radii to facilitate the subsequent optimization process described in
Section 3.1.4.
3.1.4. Model Optimization
The following step is to apply an iterative process in order to optimize the coverage of the canopy area, thereby preventing over-segmentation. The algorithm iterates over the sorted candidate circles, adding a new crown only if it contributes to the total canopy coverage. Specifically, in each iteration i, the next candidate from the sorted list is added to the current model. The algorithm then calculates the cumulative union of all i circles included so far and evaluates the total coverage.
To determine the optimal number of circles, a modified form of the Akaike Information Criterion (AIC) is employed. The standard AIC is defined as [
47]:
where
k is the number of estimated parameters and
L is the maximum likelihood of the model. AIC is also connected with the mean squared prediction error (MSE) of the model by
, where
N denotes the sample size (in lossless representation) and
is a constant independent of the model used, therefore it can be ignored [
48,
49]. Let
be the relative cumulative coverage defined as the ratio of the intersection area between the union of the
i circles and the vegetation mask, to the total area of the vegetation mask and
i represents the number of detected crowns. According to our problem formulation,
measures the fitting performance of the model and it is equal to
=
[
49]. The sample size (in a lossless representation) is defined as
, where
c denotes the total number of initial candidate peaks (local maxima) extracted from the Distance Transform and controls the magnitude of the penalty term. The factor of three reflects the three degrees of freedom of each candidate circle associated with a peak. Under this definition, the AIC framework is adapted to assess model fitness in terms of canopy coverage. The modified formulation is expressed as:
This formulation maintains a balance between detection completeness and model simplicity.
Crucially, the cumulative coverage is calculated based on the union of the selected circles, rather than the sum of their individual areas. Consequently, pixels located in overlapping regions between adjacent crowns are assigned to the union mask and are counted exactly once. Since candidates are processed in descending order of size, a new candidate contributes to the coverage metric only to the extent that it covers new pixels not already accounted for by previous, larger crowns. This ensures that the metric represents the true net coverage of the vegetation mask without inflation due to overlaps.
Since the EDT-derived radius represents the inscribed circle, it tends to underestimate the actual canopy coverage. To compensate for this, a global scaling factor is applied to enforce area consistency between the sum of estimated crown areas and the total vegetation mask, ensuring a more realistic geometric representation.
3.2. 3D Point Cloud-Based Pipeline
3.2.1. The AgiosNikolaos-3 Dataset
To examine the robustness and applicability of the proposed approach in more complex environments, additional experiments were performed on a custom-developed UAV dataset, named
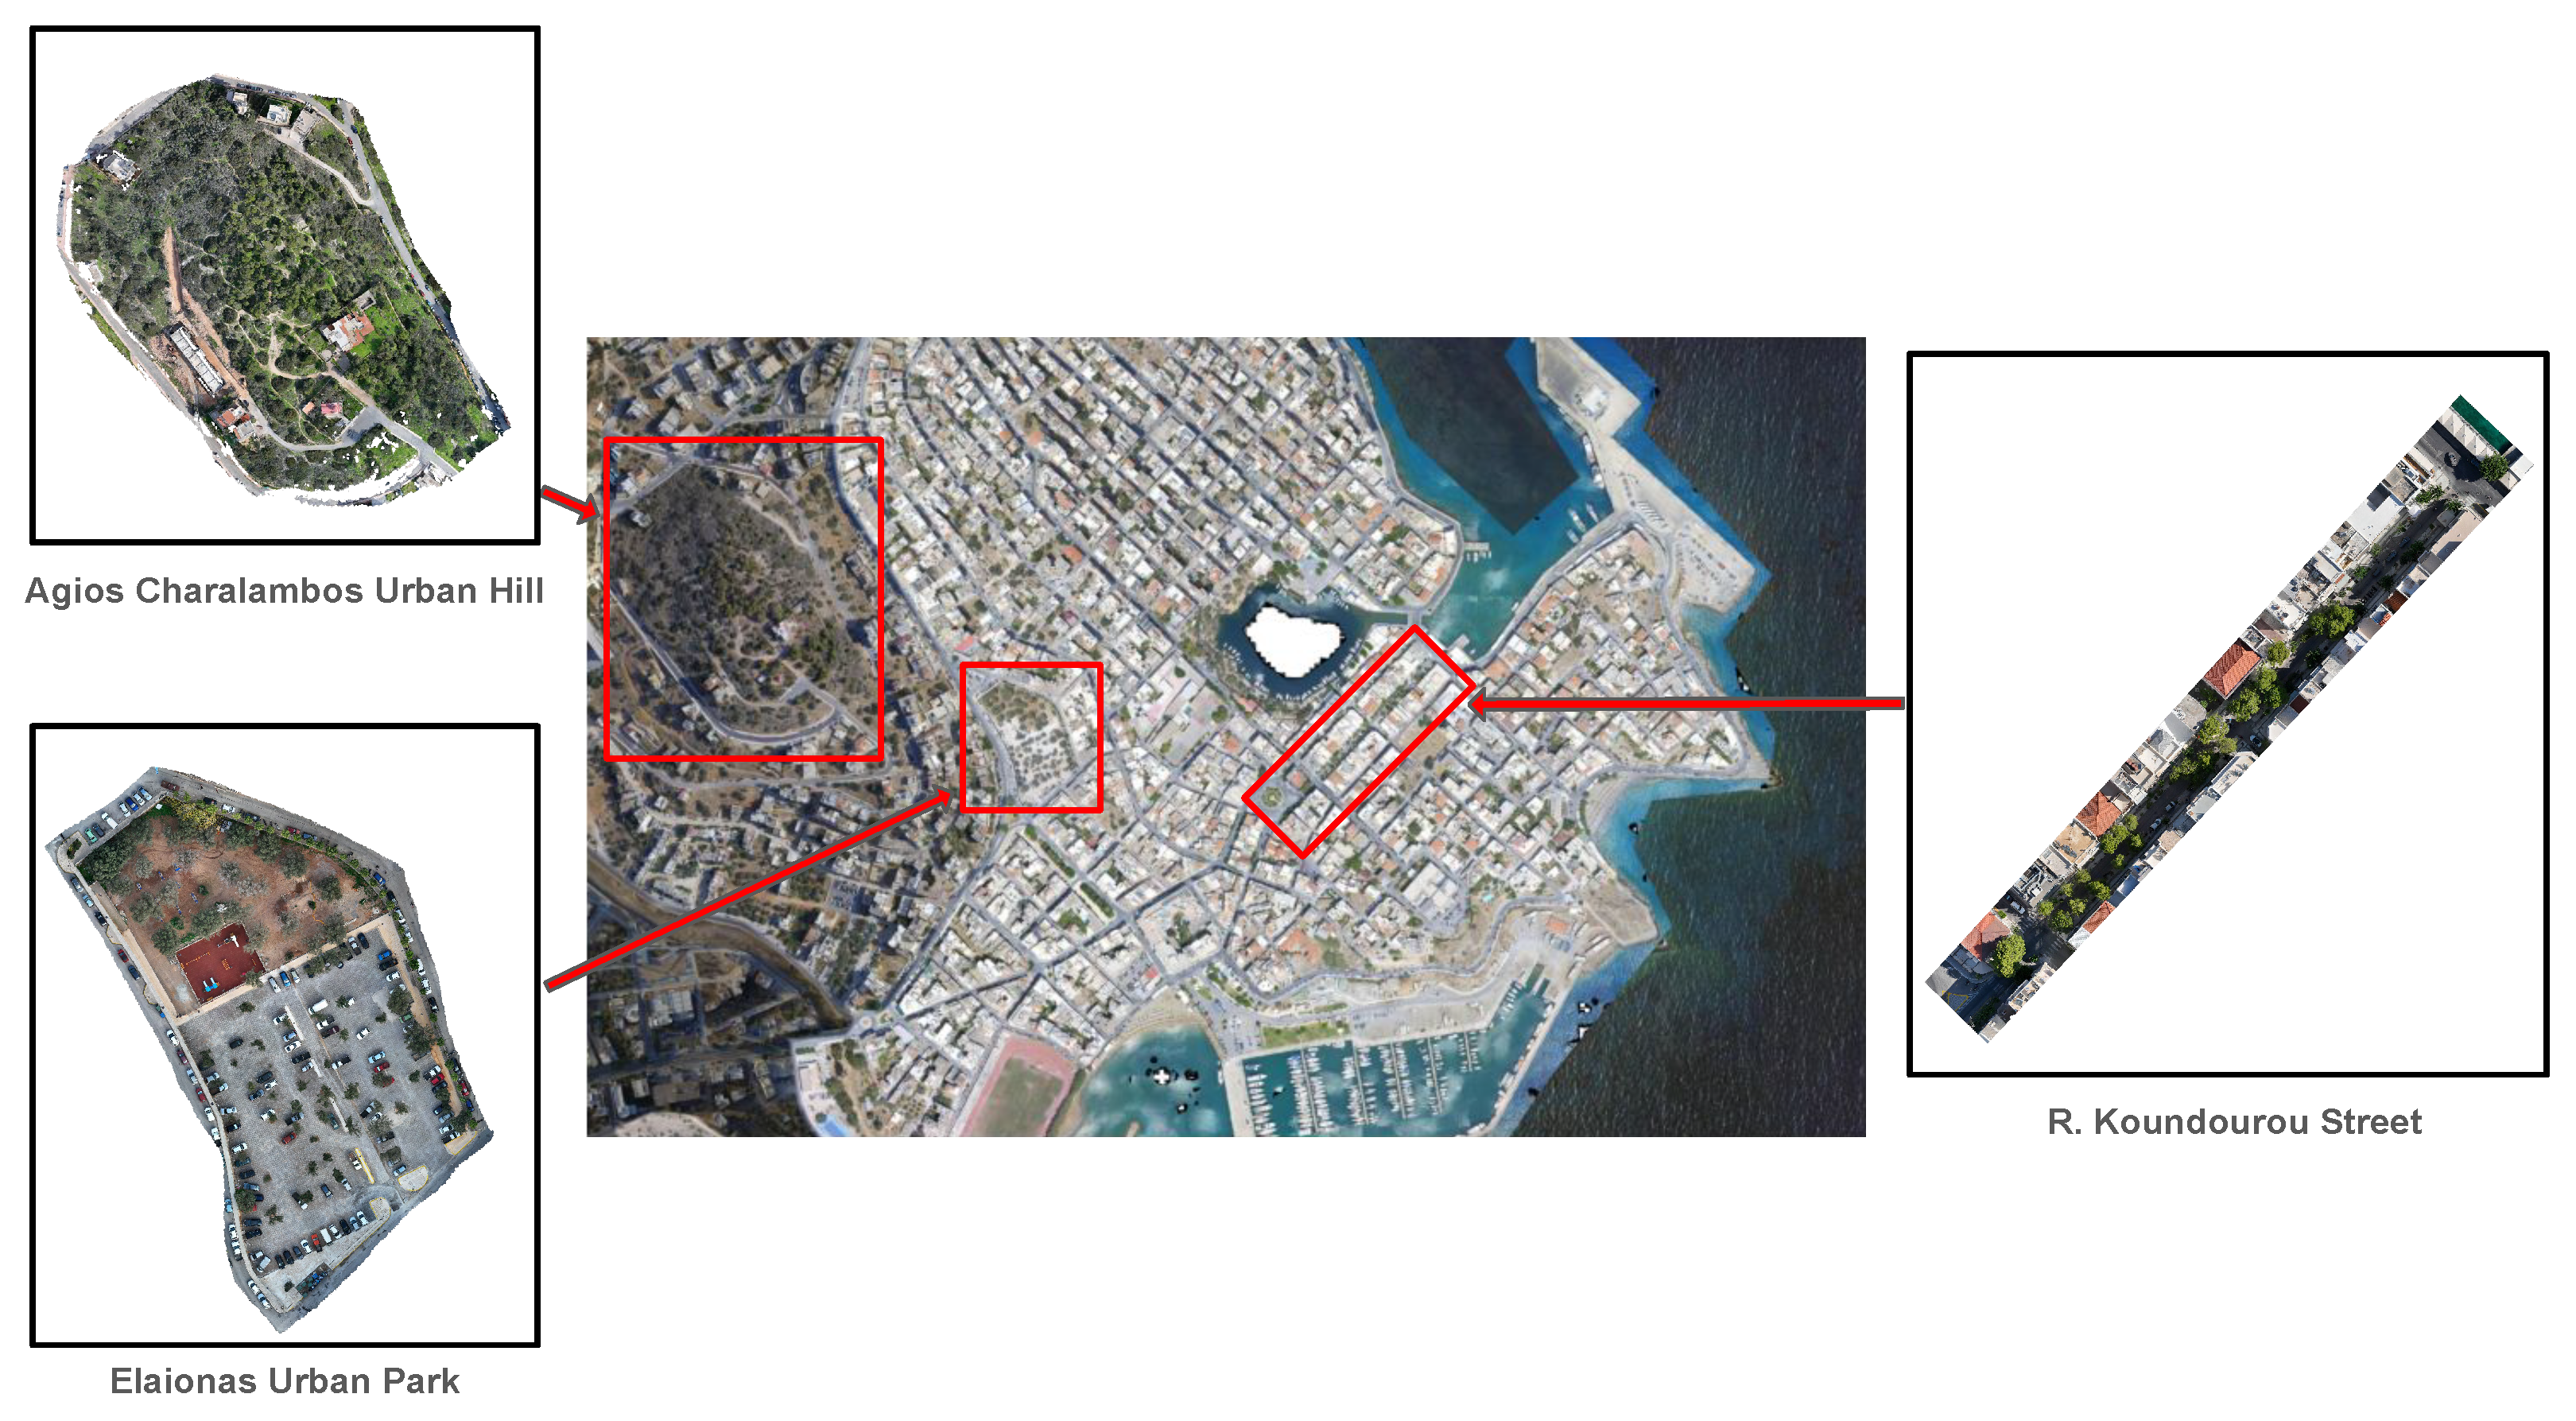
AgiosNikolaos-3, obtained in urban areas around the city of Agios Nikolaos, Crete, Greece. The developed dataset consists of three diverse sites: the city park
“Elaionas”, the city hill
“Agios Charalambos”, and the commercial street
“Roussou Koundourou” (
Figure 4).
The ‘AgiosNikolaos-3’ dataset was designed to capture the complexity of real urban environments. It includes three distinct locations, each chosen to test a specific challenge: distinguishing vegetation from human-made objects (Elaionas), handling obstacles from tall buildings (Roussou Koundourou), and resolving high tree density (Agios Charalambos).
More specifically, the first location, the urban park “Elaionas”, consists mainly of olive trees (Olea europaea) and fruit trees, which present irregular crown shapes and variable spacings. The second location, the inner-city hill “Agios Charalambos”, is characterized by very dense stands of pine trees (Pinus) mixed with low-growing shrubs, creating a complex, multi-layered canopy that poses significant challenges for the delineation of individual trees. Finally, the third location covers the main commercial street “Roussou Koundourou”, which is surrounded by tall pine trees. This site introduces unique challenges concerning the effect of city shading as well as the proximity of trees to artificial structures.
The AgiosNikolaos-3 Dataset was created using a DJI Mavic 3E UAV, equipped with a digital RGB camera featuring a 4/3 CMOS sensor with 20 MP effective pixels. The optical system offers an 84° Field of View (FOV), a 24 mm equivalent focal length, and a variable aperture ranging from f/2.8 to f/11, with a focus range from 1 m to ∞. Flight missions were designed to ensure complete coverage of each site with sufficient image overlap (80% frontal and 70% side overlap) to support photogrammetric reconstruction. The images were captured from multiple viewing angles following standard UAV photogrammetry principles. Accurate georeferencing was achieved using the onboard Global Navigation Satellite System (GNSS), providing Real Time Kinematic (RTK) solution with fixed accuracy under 2cm for orthomosaic generation and 3D reconstruction.
3.2.2. Orthomosaic Generation and 3D Point Cloud Reconstruction
For each location, an RGB orthomosaic and a dense point cloud were produced through standard photogrammetric workflows using Agisoft Metashape Professional software, Version 2.0.2 (64-bit). Initially, the Structure-from-Motion (SfM) algorithm was used to identify feature correspondences in images and estimate intrinsic and extrinsic camera parameters. Next, Multi-View Stereo (MVS) was applied to generate dense depth information, resulting in detailed 3D point clouds of the surveyed areas.
3.2.3. Point-Cloud Denoising and Filtering
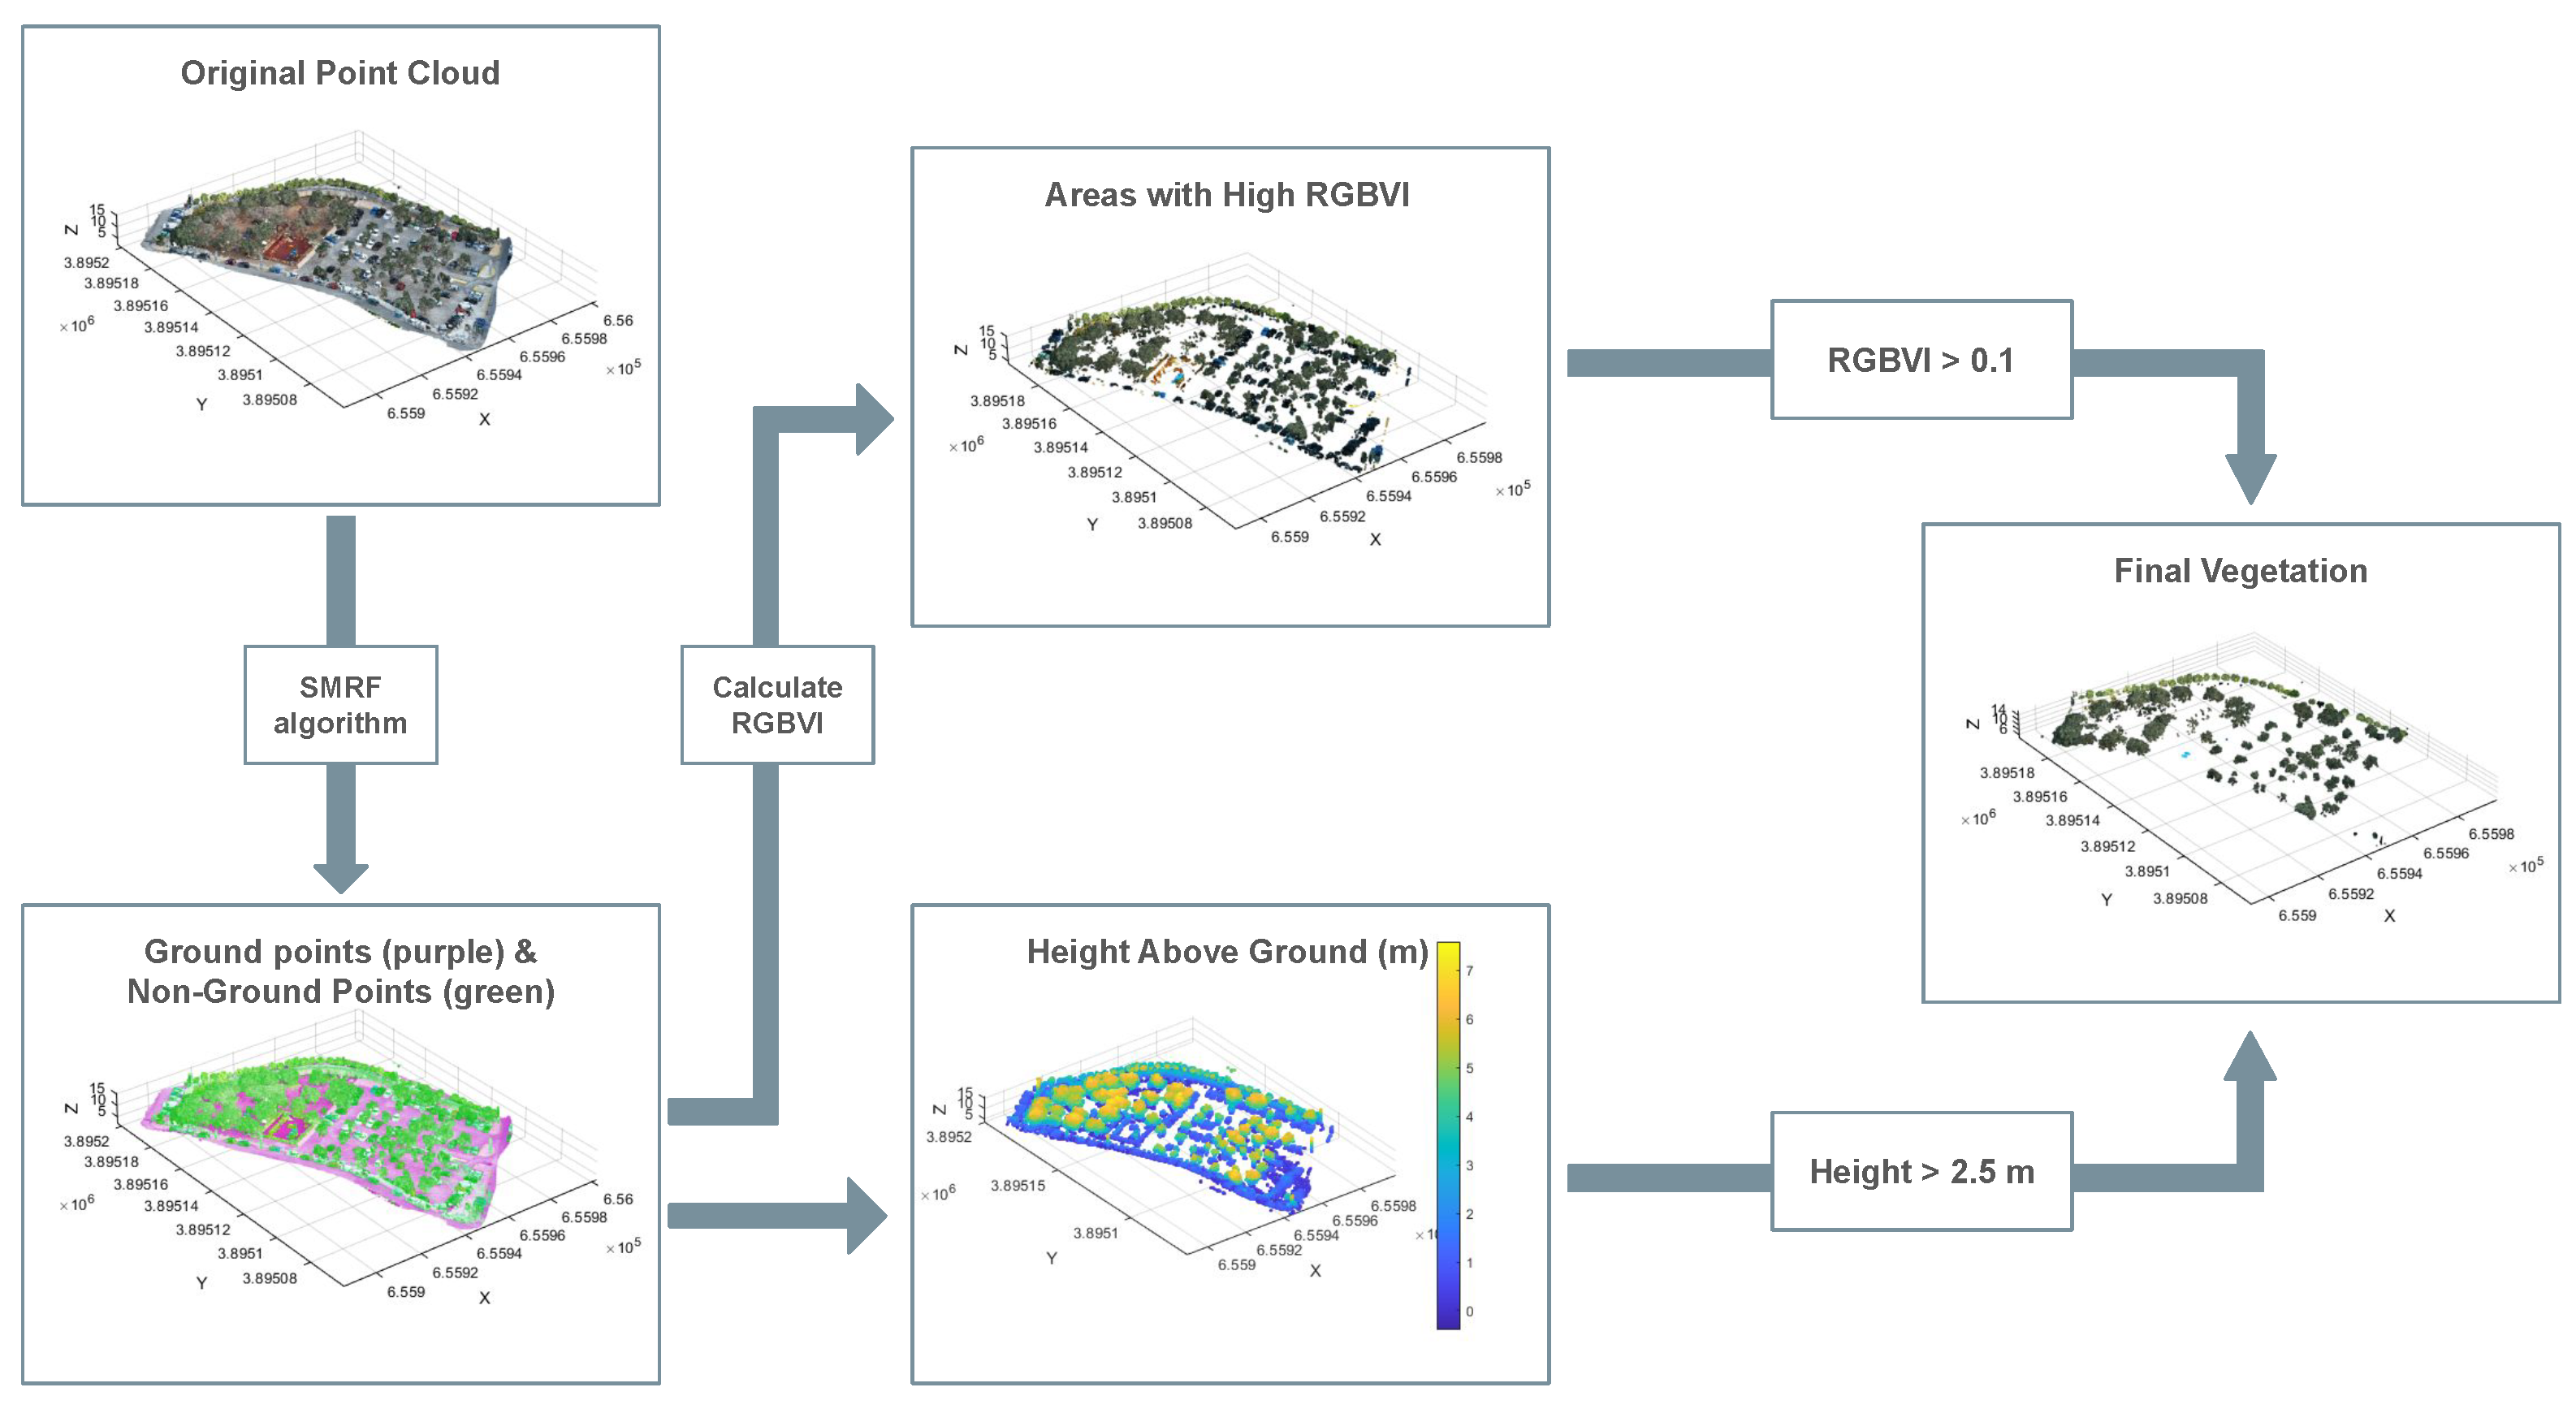
To isolate individual tree structures from the complex urban background, a multi-stage filtering workflow was applied directly to the raw point cloud (see
Figure 5).
Initially, the input point cloud is processed using the Simple Morphological Filter (SMRF) [
50] to classify ground points through adaptive morphological operations controlled by elevation, slope, and window-size parameters.
After ground classification, a Digital Terrain Model (DTM) is created using Natural Neighbor interpolation on the ground points. This allows the calculation of the normalized height (height above ground) for each non-ground point by subtracting the interpolated ground elevation from the point’s Z coordinate.
Then, to extract vegetation, a compound filter combining spectral and geometric criteria is applied. Initially, the RGB Vegetation Index (RGBVI) is calculated, as described in
Section 3.1.2. The resulting vegetation candidates are further refined by retaining only points classified as high vegetation, defined as those exhibiting a height above ground greater than 2.5 m. The utilization of this 3D height information was not merely a supplementary step but a necessary condition for accurate detection in the urban dataset. Spectral indices alone, such as RGBVI, proved insufficient in complex urban scenes, where artificial objects, such as parked vehicles or green infrastructure, often share similar spectral characteristics with tree canopies. Consequently, this strict vertical filtering effectively removed both low-lying natural vegetation (shrubs) and anthropogenic noise, ensuring that the generated binary mask exclusively represented tree canopy structures. Without it, the false positive rate in the urban environment would be prohibitively high.
To convert the filtered 3D points into a 2D representation suitable for the detection algorithm, a rasterization process is then implemented. A regular grid is defined on the extents of the point cloud with a spatial resolution of 0.2 m. The mapping from 3D points to 2D pixels is performed using a cell-averaging approach: for each grid cell, the RGB values of all points falling within its boundaries were summed and averaged. This method reduces noise and ensures that the resulting pixel color is spectrally representative of the canopy structure. Finally, the resulting orthomosaic is georeferenced to the Greek Geodetic Reference System (EGSA87; EPSG:2100).
3.2.4. Point Cloud-Based Tree Detection
The final detection step leverages the methodology established in the image-based pipeline.
Specifically, the orthomosaic generated in the previous step serves as the input for the detection algorithm. Consistency is maintained by implementing the exact processing chain described in the following image-based pipeline:
A binary mask representing areas with vegetation is created from the orthomosaic, while morphological operations are applied to improve the mask.
The Euclidean Distance Transform (EDT) is computed on the binary mask, representing for each vegetation pixel the distance to the nearest background pixel. The resulting distance map provides a continuous representation of the distance of each canopy pixel from the canopy boundary, with larger values corresponding to pixels located near the crown center.
Local maxima of the smoothed EDT were then extracted to identify potential tree apexes, representing candidate tree centers and their corresponding radii (see
Section 3.1.3).
Finally, an iterative selection procedure based on the Akaike Information Criterion (AIC) is applied to select the optimal set of circular crowns that maximizes canopy coverage while minimizing redundancy (see
Section 3.1.4).
3.3. Accuracy Assessment and Evaluation Metrics
For the quantitative evaluation of the performance of the proposed tree detection methodologies (DTCD and DTCD-PC), reference datasets (Ground Truth) were used for both the Acacia-6 and the Urban dataset.
For the Acacia-6 dataset, the ground truth was provided by the original authors [
37]. On the other hand, for the custom-made Urban Dataset, where no prior data existed, a manual digitization process was conducted. The ground truth data were created manually using 3D Survey software. Specifically, the center of each distinct tree crown was identified and marked as a point feature based on visual interpretation of the high-resolution RGB orthomosaics. In ambiguous cases, the dense 3D point cloud was visually inspected to confirm the presence of a tree structure.
Detection accuracy was evaluated by matching the detected tree centers with the ground truth points. A detection was considered True Positive () if the ground truth point fell within the estimated canopy boundary. Consequently, the distance threshold () was set equal to the individual estimated radius of each detected crown.
To evaluate the proposed method, we used the standard metrics of True Positive Rate (
, also known as Recall), Precision (
), and the
-score (
). These metrics are defined as follows:
where:
(True Positives) refers to the correctly identified trees.
(False Negatives) represents omitted trees (trees not recognized by the algorithm).
(False Positives) denotes commission errors (detected objects that do not correspond to actual trees).
High score indicates a low rate of commission errors, ensuring that most detected objects are indeed trees. On the other hand, high score indicates a low rate of omission errors, meaning that the majority of existing trees were successfully detected. The score serves as the harmonic mean of and , providing a single metric to assess the overall model performance.
3.4. Implementation
The proposed method has been implemented using MATLAB R2023b. To ensure a fair comparison, all experiments were conducted on a consistent hardware configuration: a high-performance PC equipped with dual Intel Xeon Gold 5218 CPUs, 2.30 GHz and 256 GB of RAM, running MATLAB R2023b. The code implementing the proposed method, together with the datasets and results, will be publicly available (after the acceptance of the article) at the following link (
https://sites.google.com/site/costaspanagiotakis/research/tree-detection-dtcd, accessed on 30 January 2026).
4. Experimental Evaluation
4.1. Experimental Results of the DTCD Method on the Acacia-6 Dataset
The proposed method is compared to the following unsupervised methods described in
Section 2 in more detail:
In order to show the robustness of the proposed method, it is also compared with the following state-of-the-art supervised and weakly supervised methods described in
Section 2 in more detail:
PWSSN: Point-Wise Supervised Segmentation Network proposed by [
37].
WSDDN: Weakly Supervised Deep Detection Network introduced by [
51], which simultaneously performs region selection and classification.
PCL: Proposal Cluster Learning introduced by [
52], which generates proposal clusters to learn refined instance classifiers via an iterative process.
C-MIL: Continuation Multiple Instance Learning method presented by [
53], which aims to alleviate the non-convexity problem of multiple instance learning using a series of smoothed loss functions.
Table 2 and
Table 3 summarize the results of the unsupervised and supervised methods, respectively, obtained with the Acacia-6 dataset for the original image. The results of the supervised methods (
PWSSN,
WSDDN,
PCL and
C-MIL) are presented according to the experimental evaluation of [
37]. In our experiments, we have also divided the original Acacia-6 image into 247 sub-images. By dividing the original image into sub-images we are able to calculate the average scores of the individual scores per image of the 247 sub-images. This is done to perform an experiment where all images have the same weight in the metric calculations (equal weight per area). Thus,
Table 4 shows the average values calculated for the 247 sub-images of the Acacia-6 dataset from the individual results per image.
As expected,
Table 2 and
Table 4 demonstrate a consistent ranking of the unsupervised methods, with minimal discrepancies observed between the results obtained from the original image (
Table 2) and the average performance across the 247 sub-images (
Table 4). Specifically, the proposed method clearly and consistently outperforms all comparative unsupervised approaches across every evaluation metric when assessed on the original image. For the set of 247 sub-images, the proposed method achieves the highest True Positive Rate (TPR) and F1-score, while ranking second in terms of the Precision metric.
Comparing the metrics obtained on the original image (
Table 2) with the average metrics per sub-image (
Table 4) reveals the method’s consistency. The results remain robust regardless of the processing scale. The minor discrepancies observed between the global and averaged values are primarily attributed to boundary effects, where trees located at the edges of the sub-image tiles may be fragmented or handled differently compared to the continuous processing of the full mosaic.
Table 3 presents the results of the proposed method and the supervised methods obtained on the Acacia-6 dataset for the original image. It is notable that the proposed unsupervised method achieved the second-highest performance overall when benchmarked against the state-of-the-art supervised techniques. This is a highly significant finding, as the proposed approach, by design, does not require labeled training data (unsupervised), yet its performance is comparable to that of advanced, data-intensive supervised methods.
4.2. Computational Efficiency
The computational performance of the proposed method was evaluated and compared against the unsupervised approaches. To ensure a fair comparison, all experiments were conducted on the hardware configuration described in
Section 3.4.
Table 5 summarizes the average computational time required per sub-image for the Acacia-6 dataset. The proposed DTCD method demonstrates exceptional efficiency, achieving an average processing time of 2.41 s per image. This performance is comparable to the classic Circle Hough Transform (CHT) and significantly faster than the improved CHT++ (3.05 s). In contrast, the DEFA and DCFA methods exhibit significantly higher computational costs, requiring 495.26 and 302.57 s per image, respectively. Consequently, the proposed approach is approximately 125 times faster than DCFA and over 200 times faster than DEFA. This significant discrepancy can be attributed to fundamental algorithmic differences. Methods such as DEFA and DCFA rely on complex fitting procedures that involve iterative optimization to match geometric shapes to the canopy. In contrast, the proposed DTCD method employs a direct Distance Transform-based circle estimation technique, avoiding costly convergence loops. This deterministic approach allows for rapid execution without compromising the robustness provided by the AIC selection step.
The crucial point is that this competitive accuracy is achieved with a significant gain in computational efficiency: the proposed method is significantly faster than all unsupervised and supervised techniques tested. This inherent speed makes the method particularly suitable for processing large-scale datasets and for potential integration into real-time remote sensing workflows.
As the performance results for the supervised methods were obtained from the literature [
37], a direct runtime comparison on identical hardware was not applicable. However, it is worth noting that while supervised Deep Learning models can achieve rapid inference times, they typically rely on specialized hardware (GPUs) for peak performance and require significant lead time for data annotation and training. In contrast, the proposed DTCD method operates efficiently on CPU-based hardware (avg. 2.41 s/image) without the need for training or large-scale dataset preparation, offering a distinct advantage in terms of total deployment time.
4.3. Experimental Results of the DTCD-PC Method on the AgiosNikolaos-3 Dataset
The effectiveness of the proposed method was also evaluated in complex urban environments through the use of the AgiosNikolaos-3 dataset, acquired across three distinct study sites within the city of Agios Nikolaos, Crete, Greece. This comprehensive dataset includes three heterogeneous areas: the urban park “Elaionas”, the inner-city hill “Agios Charalambos”, and the main commercial street “Roussou Koundourou”. For each study area, experiments were conducted using both the RGB orthomosaic and the 3D point cloud.
Table 6 presents the quantitative assessment of the DTCD Method’s performance on Orthomosaic vs. the DTCD-PC Method’s performance on Point Cloud data in the selected study areas. Given the complexity of the environment in all 3 areas, we consider the results in orthomosaics satisfactory, which certainly show an excellent improvement since the use of the point cloud enhances the accuracy and stability of the proposed method’s results.
In order to demonstrate the reliability of the DTCD-PC method, it is also compared with the following unsupervised methods:
WA: The Watershed Algorithm introduced by [
54] is a mathematical morphology segmentation technique based on topology theory that has been widely used in tree detection [
13].
WA++: An improved version of the WA method designed to address over-segmentation by applying smoothing and multi-criteria filtering (area and shape filters).
DTCD-PC/WA: A hybrid method combining the DTCD-PC and WA algorithms. Specifically, this combination relies on the DTCD algorithm, which is further enhanced through a topological pre-segmentation process based on the Watershed transformation.
RHCSA: The Region-Based Hierarchical Cross-Section Analysis [
14] is a recent approach that segments individual trees based on canopy height vertical variations.
RHCSA++: An improved version of the RHCSA method with the integration of the RGBVI index for vegetation filtering.
Table 7,
Table 8 and
Table 9 present the performance evaluation of the DTCD-PC method compared to the previously described unsupervised approaches on the Elaionas Urban Park, R. Koundourou Street and Agios Charalambos Urban Hill point clouds, respectively. As expected, the DTCD-PC method shows better results compared to the other unsupervised methods. More specifically, for the “Elaionas” and “Agios Charalambos” study areas DTCD-PC method achieves the highest Precision and F1-score, while ranking second in terms of True Positive Rate (TPR). For the “R. Koundourou Str.” study area DTCD-PC method clearly and consistently outperforms all comparative unsupervised approaches across every evaluation metric.
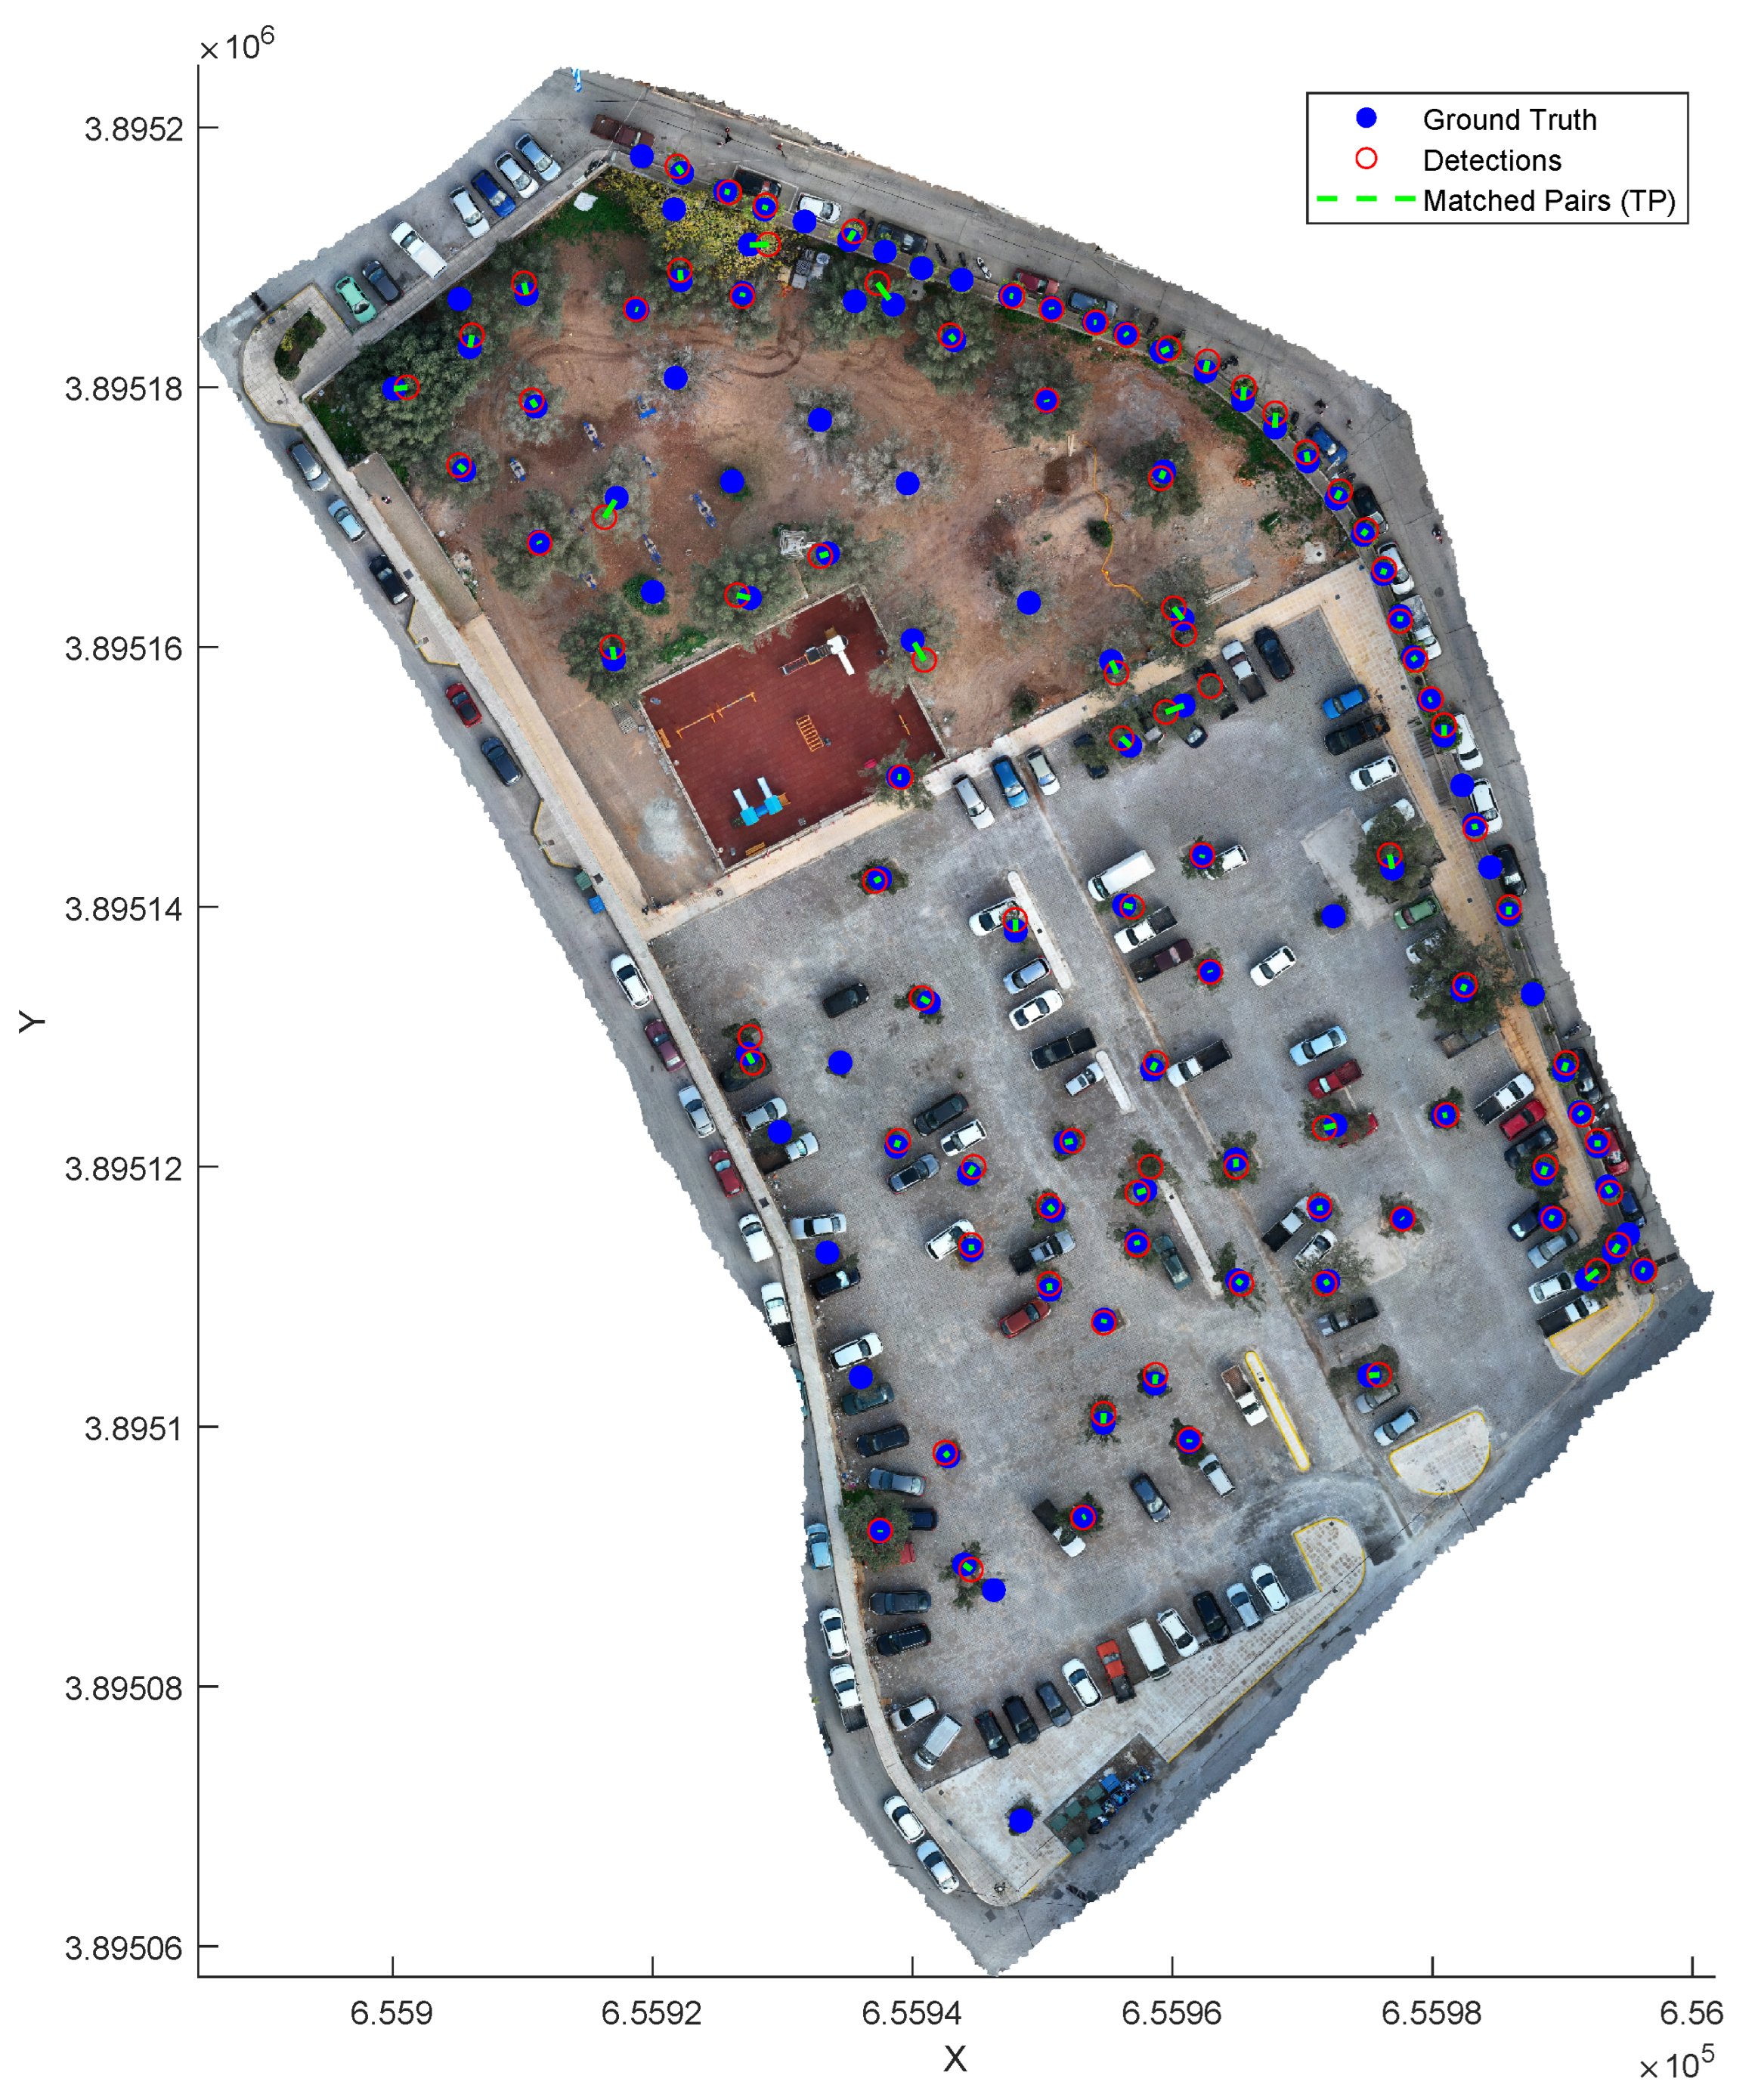
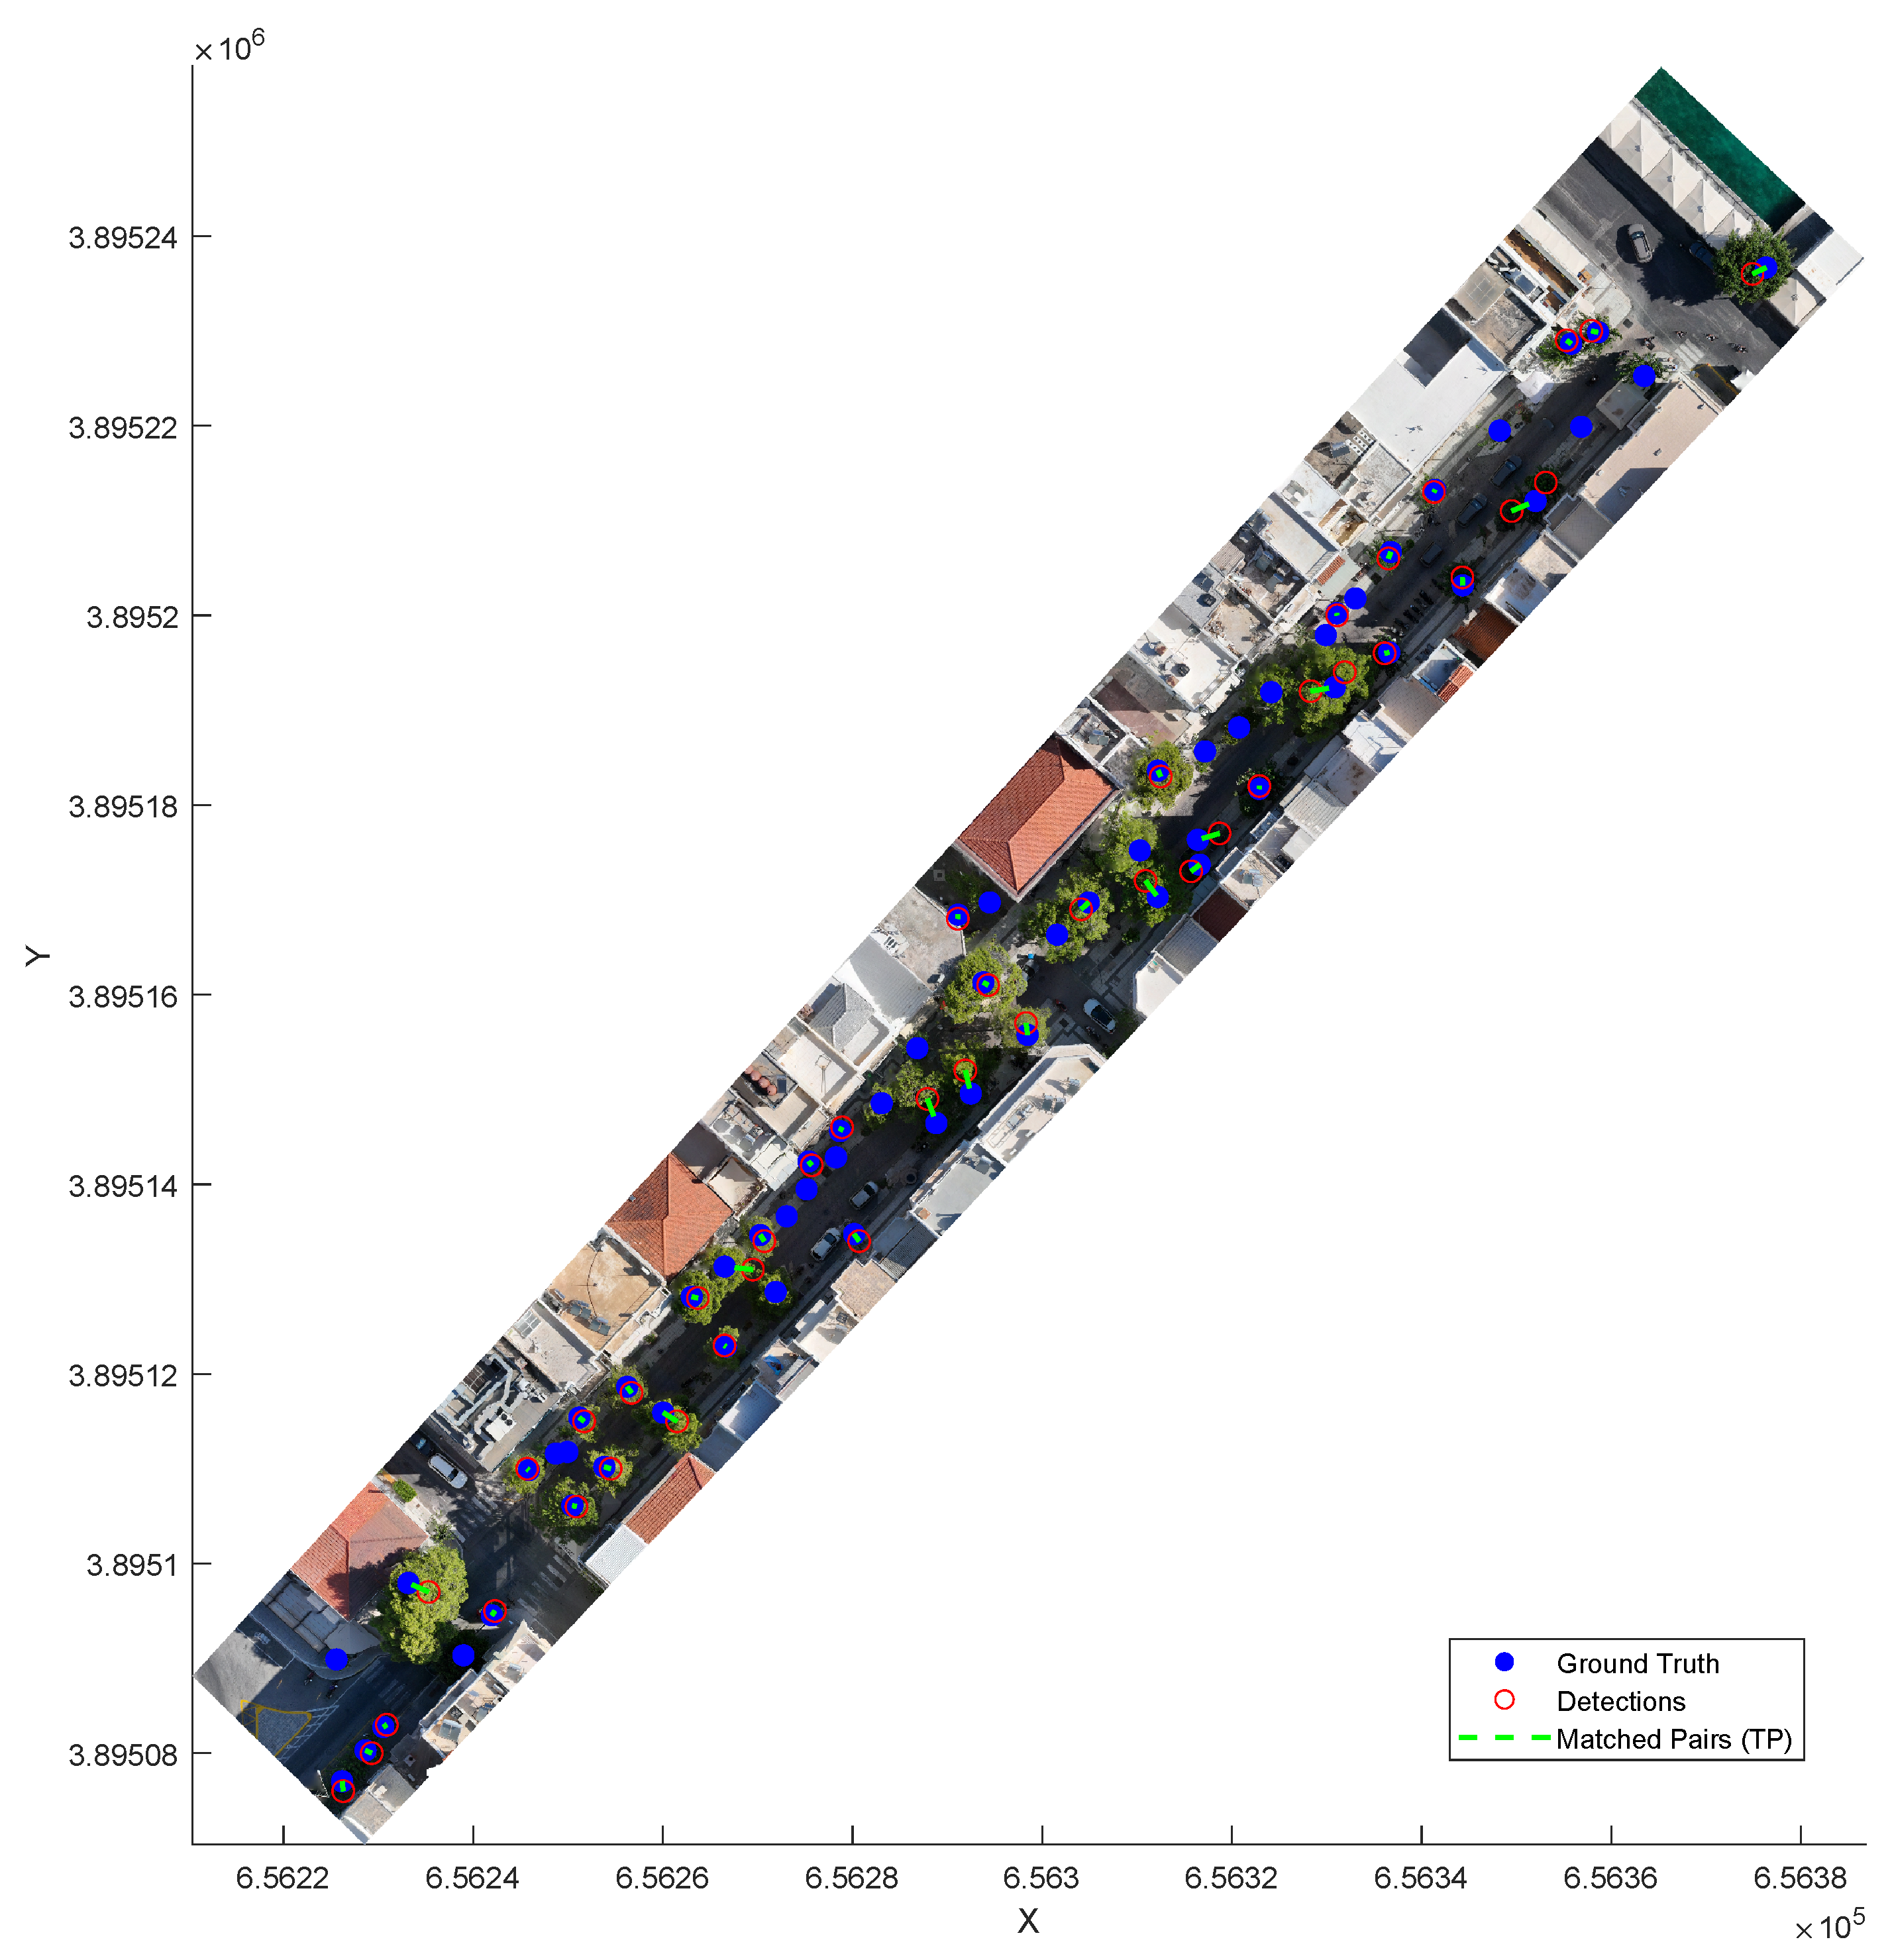
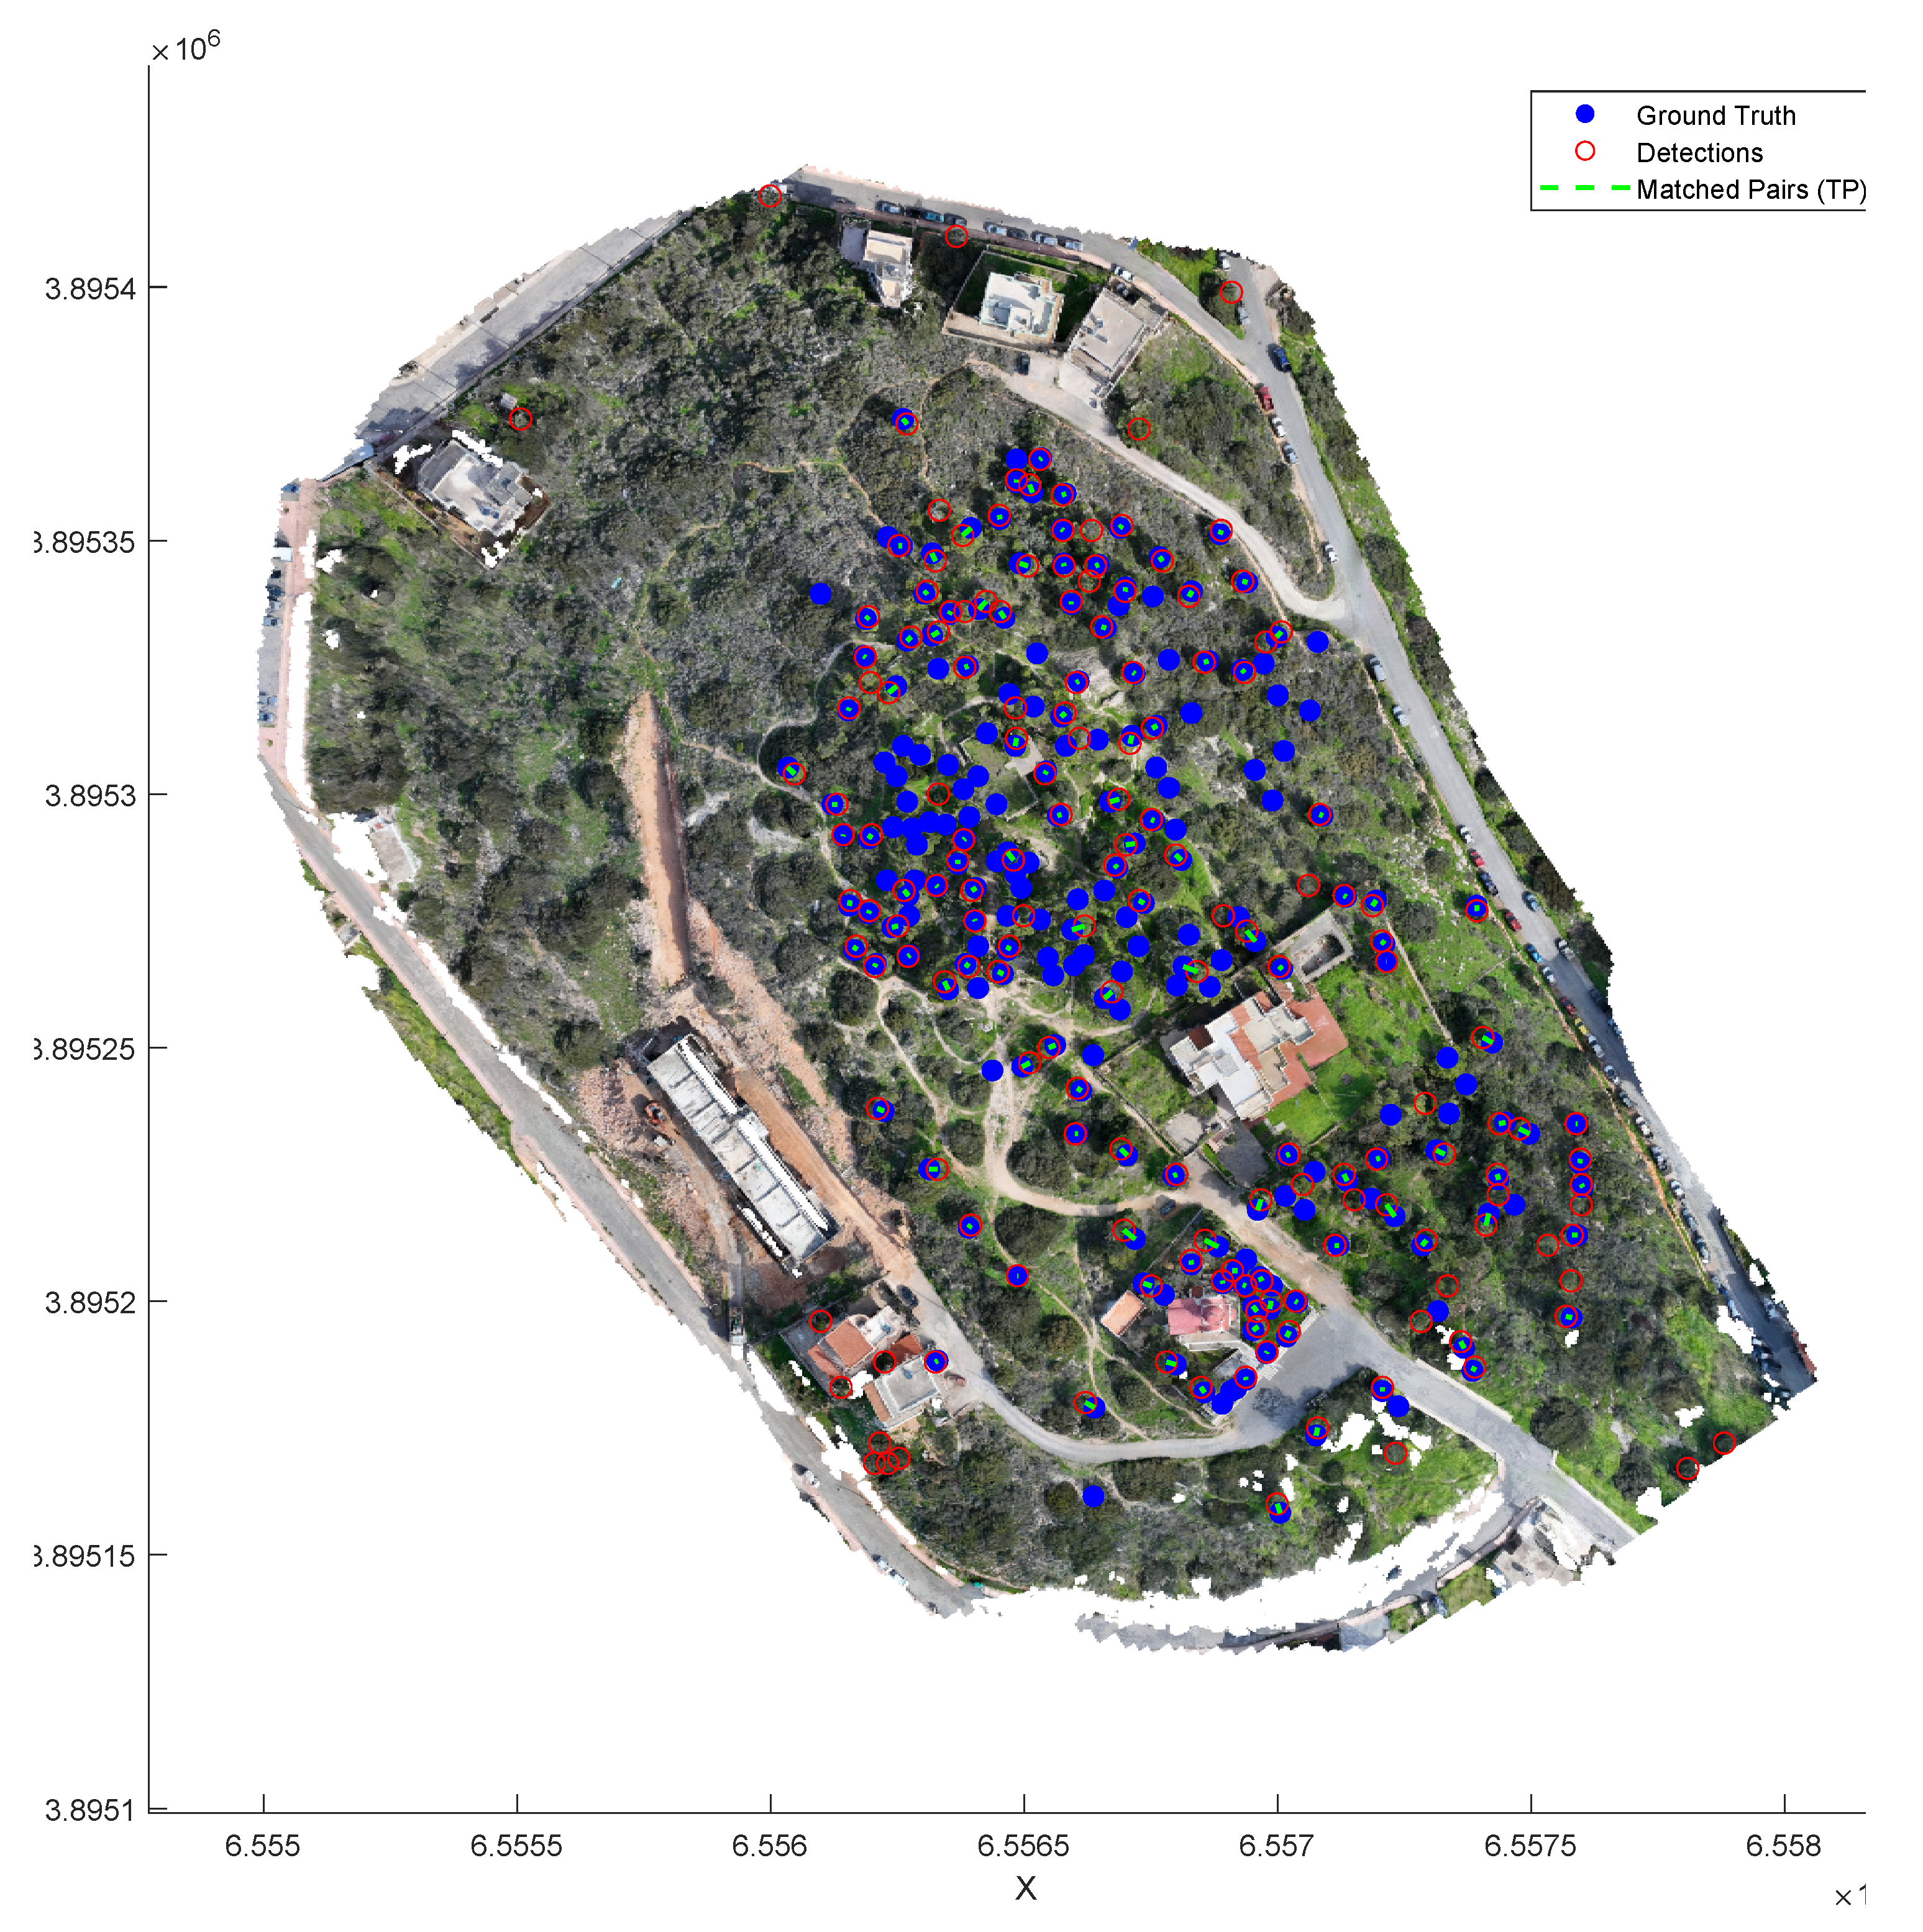
Figure 6,
Figure 7 and
Figure 8 present a visual validation showing the correspondence between DTCD-PC detected trees and ground truth across three distinct study sites the urban park “Elaionas”, the main commercial street “Roussou Koundourou” and the inner-city hill “Agios Charalambos” respectively. Detected trees are shown as red circles and ground truth locations as blue dots, while matching pairs (TP) are connected by green lines. The effectiveness of the DTCD-PC method is evident given the complexity of each specific urban environment.
4.4. Parameter Sensitivity Analysis
To evaluate the robustness of the proposed framework and justify the selection of the Gaussian smoothing parameter
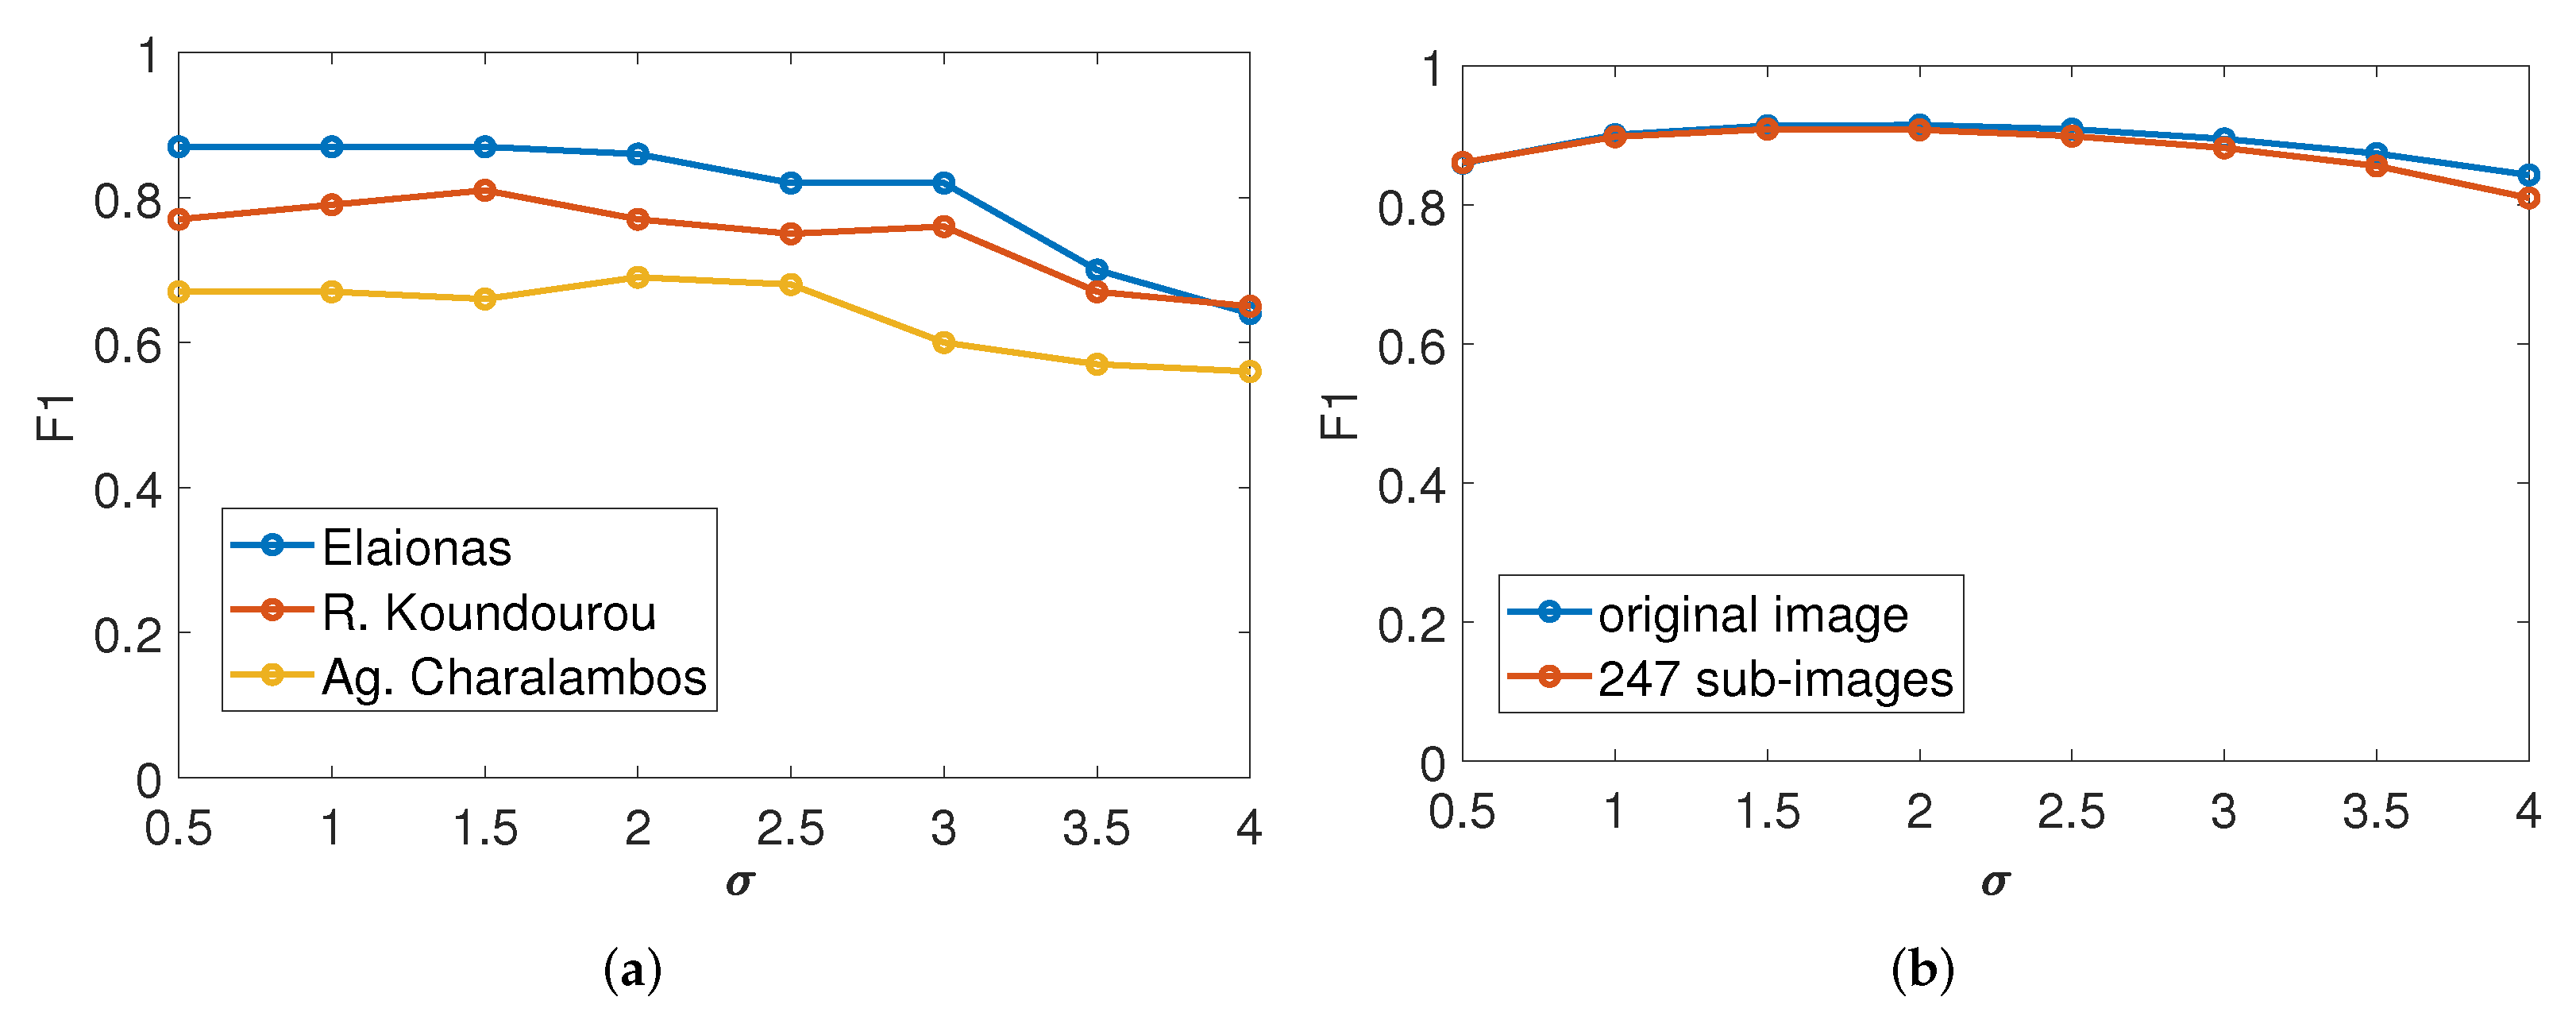
, we conducted a comprehensive sensitivity analysis on DTCD and DTCD-PC methods across the Acacia-6 and the AgiosNikolaos-3 datasets, respectively. We examined the variation of the F1-score for
values ranging from
to
with a step of
. The results are illustrated in
Figure 9.
As shown in
Figure 9a, the DTCD method exhibits remarkable stability for the Acacia-6 dataset. The F1-score remains consistently high (>0.90) across a wide range of values (
). Performance degradation is only observed at larger scales (
), where excessive smoothing begins to merge distinct tree crowns. The trend is identical for both the original image and the 247 sub-images, confirming scale invariance.
Figure 9b presents the sensitivity analysis for the DTCD-PC on the AgiosNikolaos-3 dataset. Despite the higher complexity of the urban scene, Elaionas Urban Park (blue line) demonstrates high robustness, maintaining an F1-score above 0.85 for
. Roussou Koundourou Str. (red line) and Agios Charalambos Hill (yellow line) show a stable performance plateau between
and
. On the other hand, the detected drop in F1-score for
in the urban sites is attributed to the merging of adjacent crowns in dense areas (under-segmentation).
Based on these experiments, the value of was selected as the optimal global parameter. It lies within the stable performance region for all tested environments, effectively balancing noise suppression with the preservation of structural canopy details.
5. Discussion
The experimental results demonstrate the effectiveness of the proposed DTCD and DTCD-PC methods on individual tree detection. The Euclidean Distance Transform technique incorporated with the Circle Fitting methodology and the Akaike Information Criterion optimization method create an effective technique for individual tree detection in any environment (Acacia-6 and AgiosNikolaos-3 datasets) without the requirement of the time consuming process of data training.
5.1. Performance of the DTCD Method on the Acacia-6 Dataset
The DTCD method on Acacia-6 dataset outperformed previous approaches for unsupervised tree detection methods (CHT, CHT++, DEFA, and DCFA) with a higher F1 score of 0.915 and 0.908 on the original image and on the 247 sub-images, respectively, (see
Table 2 and
Table 4). This is a result of the method’s ability to dynamically adjust the number of tree detections using AIC.
However, the most important result is the comparison made with supervised deep learning techniques. Although the best PWSSN model attained a higher F1 score (0.979), the proposed unsupervised approach performed better than more complex methods (WSDDN, PCL, and C-MIL) (see
Table 3). This is a highly valuable contribution to real-world forestry applications, where our technique entirely replaces the time-consuming task of annotation and training, providing an approach that is computationally efficient and can be easily applied.
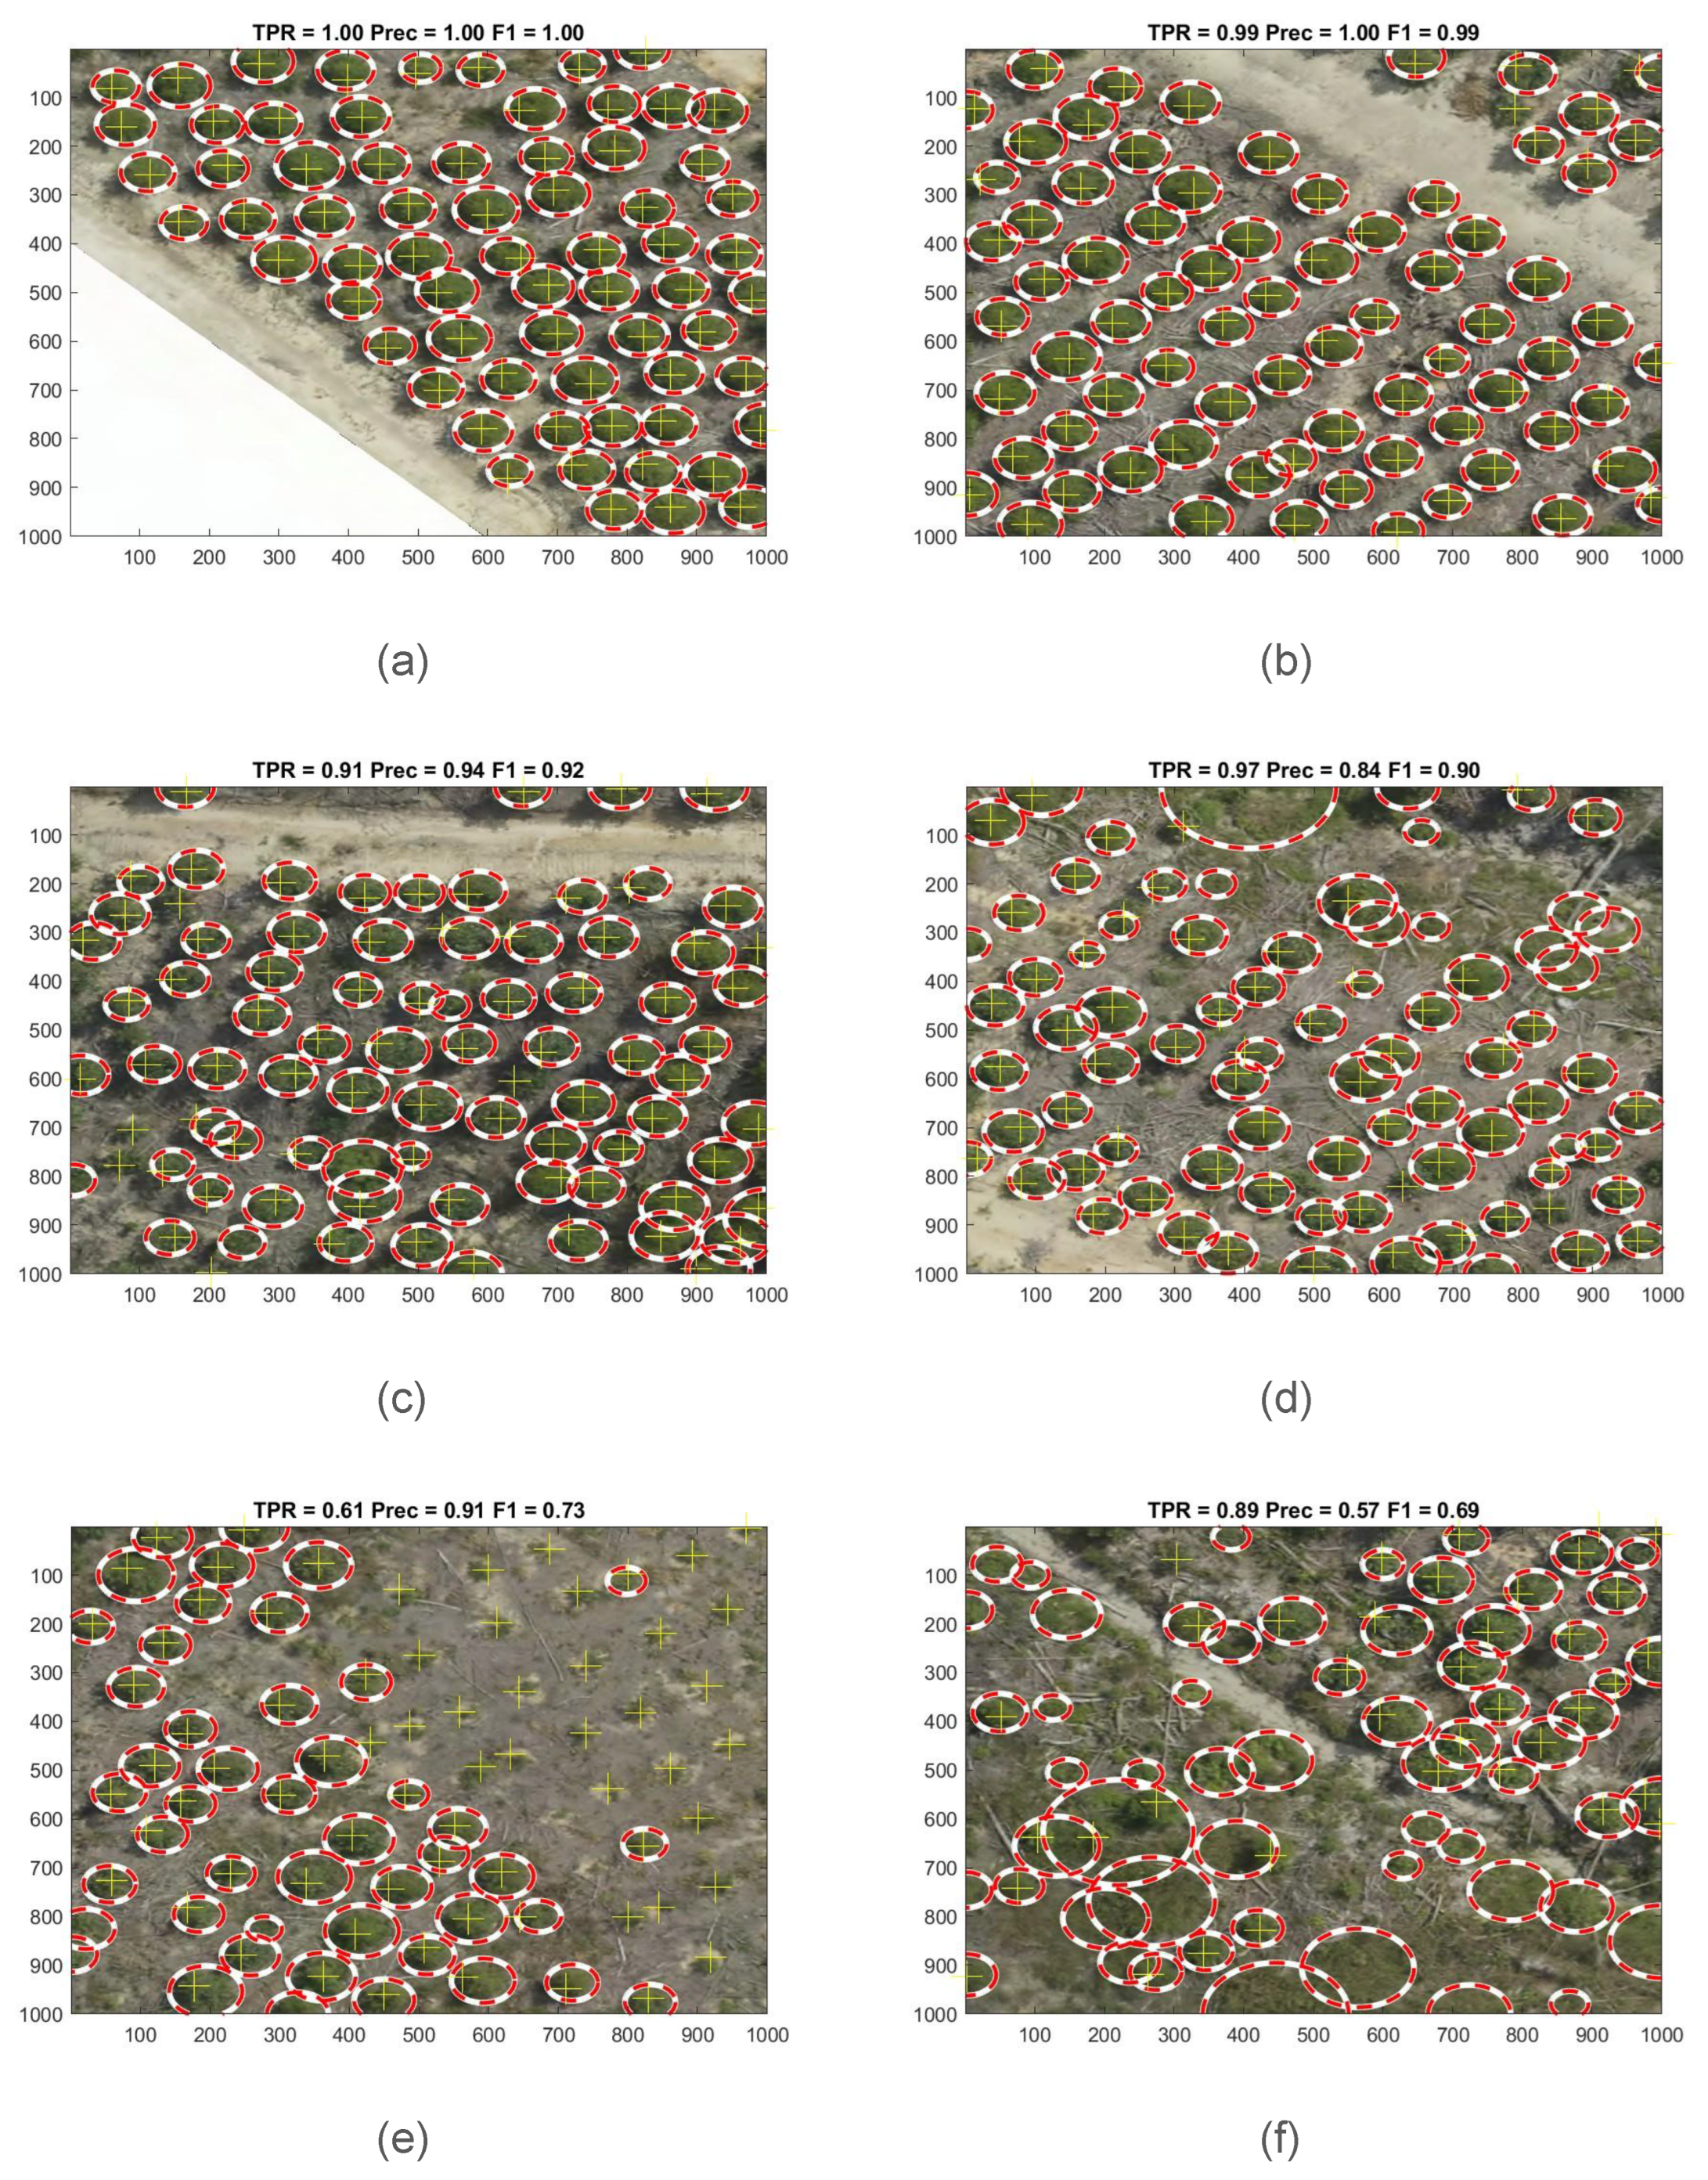
To provide a comprehensive qualitative analysis,
Figure 10 illustrates representative detection results ranging from ideal detections to characteristic failure modes.
As shown in
Figure 10a,b, the proposed DTCD framework demonstrates high robustness in standard scenarios, achieving near-perfect accuracy, with F1-scores approaching 1. In these examples, the algorithm successfully delineates all the canopies.
Figure 10c,d illustrate the method’s performance in typical, average-complexity scenes. In these cases, the framework demonstrates robust detection capabilities, maintaining high reliability with F1-scores averaging around 0.90. This confirms that for the majority of standard forest stands, the method performs consistently well.
However, specific environmental conditions can lead to performance degradation, as depicted in the bottom row. In
Figure 10e, the method exhibits a high omission rate (Low TPR), failing to segment small saplings on the right side of the image due to their low height and weak spectral contrast against the background. Conversely,
Figure 10f presents a scenario with high commission errors (Low Precision). Here, dense low-lying vegetation is misclassified as tree regions, resulting in false positives. It is worth noting that these false detections correspond to green vegetation that could be ambiguous even to the human eye. Despite these localized errors, the DTCD successfully delineates the dominant tree structures across all scenes.
5.2. Performance of the DTCD-PC Method on the AgiosNikolaos-3 Dataset
Experiments on the AgiosNikolaos-3 Dataset demonstrate well the limitations imposed by 2D image-based processing in complex urban environments. The necessity of integrating 3D vertical information in urban environments is explicitly demonstrated in
Table 6. Applying the DTCD method solely on orthomosaics yielded significantly lower precision in the urban dataset due to spectral confusion between vegetation and artificial objects like vehicles. This led to unacceptable results, especially in the location of “Agios Charalambos” urban hill (F1: 0.23), where dense canopy overlaps, low-lying vegetation and shadows made the spectral-based segmentation very difficult. In contrast, the hybrid DTCD-PC pipeline, significantly improved the results by reducing the false positives, with F1 as high as 0.69 for the same area. Thus, height-based filtering ensured that the DTCD-PC method effectively isolates tree structures from low-lying vegetation and urban background noise (like cars and pavement), which are spectrally very similar to trees but geometrically distinct. This comparison confirms that while rasterization provides computational efficiency, the preceding 3D geometric filtering is indispensable for reliable detection in complex urban environments.
As demonstrated by the comparative analysis on the AgiosNikolaos-3 dataset (
Table 7,
Table 8 and
Table 9), the proposed DTCD-PC method demonstrates superior robustness compared to other unsupervised approaches.The standard Watershed Algorithm (WA) exhibits a characteristic behavior of extreme over-segmentation; while it achieves high Sensitivity (TPR reaching 0.99 in Elaionas), its Precision is critically low (ranging from 0.10 to 0.13). This indicates that WA fragments single tree crowns into multiple smaller clusters, generating a vast number of false positives. Although the improved variant (WA++) increases Precision slightly by applying geometric constraints, it fails to achieve a satisfactory F1-score. In contrast, the proposed DTCD-PC effectively mitigates this issue through AIC optimization, achieving high Precision (up to 0.78) while maintaining high detection rates. Regarding the Region-Based Hierarchical Cross-Section Analysis (RHCSA), the results demonstrate that vertical slicing strategies face significant challenges in complex urban environments. RHCSA and its variant (RHCSA++) yielded the lowest performance metrics across all datasets. This under-performance is attributed to the method’s reliance on 2D cross-sections, which struggle to distinguish overlapping crowns with irregular vertical profiles. The proposed DTCD-PC, leveraging 3D volumetric properties, proved much more robust, significantly outperforming RHCSA.
A visual inspection of
Figure 6,
Figure 7 and
Figure 8 indicates that the main source of error in the the proposed framework is omission, caused by each specific site conditions. In Elaionas Park (
Figure 6), omissions are due to dry vegetation. More specifically, trees with low RGBVI values are filtered out during pre-processing. In Roussou Koundourou (
Figure 7), shadows from tall buildings obscure the spectral signature of trees, causing them to be classified as background. In Agios Charalambos (
Figure 8), some canopies appear as a continuous, unified green surface. In these cases, the algorithm merges multiple trees into a single estimated circle, effectively resulting in the omission of the individual neighboring trees.
Despite these challenges, the method proves effective in delineating the dominant canopy structure, minimizing the over-segmentation often observed with watershed-based approaches.
6. Conclusions
This study addressed the challenge of automated tree detection by introducing a fully unsupervised framework applicable to both 2D UAV imagery (DTCD pipeline) and 3D point clouds (DTCD-PC pipeline). By employing a novel framework that integrates direct EDT-based parameter extraction with Akaike Information Criterion (AIC) optimization, the proposed approach bypasses the need for labor-intensive training data while maintaining high detection accuracy.
The main conclusions that can be extracted from the present study are the following:
High Accuracy without Supervision: On the Acacia-6 dataset, the proposed method achieved an F1-score of 0.915, outperforming existing unsupervised methods and competing favorably with complex, state-of-the-art supervised deep learning models. This demonstrates that robust detection is achievable without the computational and extensive manual annotation required by supervised frameworks.
Robustness in Complex Urban Environments: The extension of the method to the 3D domain (DTCD-PC pipeline) proved critical for handling the heterogeneity of urban landscapes. The DTCD-PC technique demonstrated robust performance across three diverse urban sites of the new urban AgiosNikolaos-3 dataset, significantly outperforming the traditional Watershed segmentation technique and the contemporary region-based vertical analysis method (RHCSA).
Computational Efficiency: A major advantage of the DTCD framework is its computational efficiency. With processing times drastically lower than iterative fitting methods, the algorithm is ideally suited for large-scale forestry applications and potential real-time monitoring workflows.
Future work will focus on extending the proposed framework to incorporate multispectral or hyperspectral data fusion. This integration would not only enhance detection accuracy but also enable fine-grained tree species classification and the identification of diseased or stressed trees. Furthermore, we aim to utilize the derived tree inventory maps to assess urban green space distribution, pinpointing areas with vegetation deficits to support targeted reforestation and sustainable urban planning strategies.
Author Contributions
The authors contributed equally to this work. Conceptualization, S.M. and C.P.; methodology, S.M. and C.P.; software, S.M. and C.P.; validation, S.M. and C.P.; formal analysis, C.P.; investigation, S.M. and C.P.; resources, S.M.; data curation, S.M.; writing—original draft preparation, S.M.; writing—review and editing, S.M. and C.P.; visualization, S.M. and C.P.; supervision, C.P. All authors have read and agreed to the published version of the manuscript.
Funding
This research received no external funding.
Data Availability Statement
Conflicts of Interest
The authors declare no conflicts of interest.
Abbreviations
The following abbreviations are used in this manuscript:
| AIC | Akaike Information Criterion |
| AMS3D | Adaptive Mean Shift 3D |
| CHM | Canopy Height Model |
| CHT | Circular Hough Transform |
| CSP | Comparative Shortest Path |
| DBSCAN | Density-based Spatial Clustering |
| DCFA | Decremental Circle Fitting Algorithm |
| DEFA | Decremental Ellipse Fitting Algorithm |
| DTCD | Distance Transform Circle Detection |
| DTCD-PC | Distance Transform Circle Detection-Point Cloud |
| DTM | Digital Terrain Model |
| EDT | Euclidean Distance Transform |
| FOV | Field of View |
| FPN | Feature Pyramid Network |
| GNSS | Global Navigation Satellite System |
| ITCS | Individual Tree Crown Segmentation |
| LiDAR | Light Detection and Ranging |
| LS | Layer Stacking |
| MVS | Multi-View Stereo |
| PCS | Point Cloud Segmentation |
| RANSAC | Random Sample Consensus |
| RGBVI | Red Green Blue Vegetation Index |
| RHCSA | Region-based Hierarchical Cross-Section Analysis |
| RTK | Real Time Kinematic |
| SfM | Structure-from-Motion |
| SMRF | Simple Morphological Filter |
| UAV | Unmanned Aerial Vehicle |
| WA | Watershed Algorithm |
References
- Kuang, W.; Ho, H.W.; Zhou, Y.; Suandi, S.A.; Ismail, F. A Comprehensive review on tree detection methods using point cloud and aerial imagery from unmanned aerial vehicles. Comput. Electron. Agric. 2024, 227, 109476. [Google Scholar] [CrossRef]
- Chen, Q.; Baldocchi, D.; Gong, P.; Kelly, M. Isolating individual trees in a savanna woodland using small footprint lidar data. Photogramm. Eng. Remote Sens. 2006, 72, 923–932. [Google Scholar] [CrossRef]
- Erikson, M. Segmentation of individual tree crowns in colour aerial photographs using region growing supported by fuzzy rules. Can. J. For. Res. 2003, 33, 1557–1563. [Google Scholar] [CrossRef]
- Vibha, L.; Shenoy, P.D.; Venugopal, K.; Patnaik, L. Robust technique for segmentation and counting of trees from remotely sensed data. In Proceedings of the 2009 IEEE International Advance Computing Conference, Patiala, India, 6–7 March 2009; IEEE: New York, NY, USA, 2009; pp. 1437–1442. [Google Scholar]
- Qiu, L.; Jing, L.; Hu, B.; Li, H.; Tang, Y. A new individual tree crown delineation method for high resolution multispectral imagery. Remote Sens. 2020, 12, 585. [Google Scholar] [CrossRef]
- Ma, K.; Chen, Z.; Fu, L.; Tian, W.; Jiang, F.; Yi, J.; Du, Z.; Sun, H. Performance and sensitivity of individual tree segmentation methods for UAV-LiDAR in multiple forest types. Remote Sens. 2022, 14, 298. [Google Scholar] [CrossRef]
- Da Cunha Neto, E.M.; Rex, F.E.; Veras, H.F.P.; Moura, M.M.; Sanquetta, C.R.; Käfer, P.S.; Sanquetta, M.N.I.; Zambrano, A.M.A.; Broadbent, E.N.; Dalla Corte, A.P. Using high-density UAV-Lidar for deriving tree height of Araucaria Angustifolia in an Urban Atlantic Rain Forest. Urban For. Urban Green. 2021, 63, 127197. [Google Scholar] [CrossRef]
- Yin, D.; Wang, L. Individual mangrove tree measurement using UAV-based LiDAR data: Possibilities and challenges. Remote Sens. Environ. 2019, 223, 34–49. [Google Scholar] [CrossRef]
- Guerra-Hernández, J.; Cosenza, D.N.; Rodriguez, L.C.E.; Silva, M.; Tomé, M.; Díaz-Varela, R.A.; González-Ferreiro, E. Comparison of ALS-and UAV (SfM)-derived high-density point clouds for individual tree detection in Eucalyptus plantations. Int. J. Remote Sens. 2018, 39, 5211–5235. [Google Scholar] [CrossRef]
- Liu, Q.; Li, S.; Tian, X.; Fu, L. Dominant trees analysis using UAV LiDAR and photogrammetry. In Proceedings of the IGARSS 2020–2020 IEEE International Geoscience and Remote Sensing Symposium, Waikoloa, HI, USA, 26 September–2 October 2020; IEEE: New York, NY, USA, 2020; pp. 4649–4652. [Google Scholar]
- Wu, X.; Shen, X.; Cao, L.; Wang, G.; Cao, F. Assessment of individual tree detection and canopy cover estimation using unmanned aerial vehicle based light detection and ranging (UAV-LiDAR) data in planted forests. Remote Sens. 2019, 11, 908. [Google Scholar] [CrossRef]
- Ma, K.; Xiong, Y.; Jiang, F.; Chen, S.; Sun, H. A novel vegetation point cloud density tree-segmentation model for overlapping crowns using UAV LiDAR. Remote Sens. 2021, 13, 1442. [Google Scholar] [CrossRef]
- You, H.; Liu, Y.; Lei, P.; Qin, Z.; You, Q. Segmentation of individual mangrove trees using UAV-based LiDAR data. Ecol. Inform. 2023, 77, 102200. [Google Scholar] [CrossRef]
- Zhao, Y.; Hao, Y.; Zhen, Z.; Quan, Y. A region-based hierarchical cross-section analysis for individual tree crown delineation using ALS data. Remote Sens. 2017, 9, 1084. [Google Scholar] [CrossRef]
- Quan, Y.; Li, M.; Hao, Y.; Liu, J.; Wang, B. Tree species classification in a typical natural secondary forest using UAV-borne LiDAR and hyperspectral data. GIScience Remote Sens. 2023, 60, 2171706. [Google Scholar] [CrossRef]
- Liu, X.; Hao, Y.; Widagdo, F.R.A.; Xie, L.; Dong, L.; Li, F. Predicting height to crown base of Larix olgensis in Northeast China Using UAV-LiDAR data and nonlinear mixed effects models. Remote Sens. 2021, 13, 1834. [Google Scholar] [CrossRef]
- Li, W.; Guo, Q.; Jakubowski, M.K.; Kelly, M. A new method for segmenting individual trees from the lidar point cloud. Photogramm. Eng. Remote Sens. 2012, 78, 75–84. [Google Scholar] [CrossRef]
- Lu, J.; Wang, H.; Qin, S.; Cao, L.; Pu, R.; Li, G.; Sun, J. Estimation of aboveground biomass of Robinia pseudoacacia forest in the Yellow River Delta based on UAV and Backpack LiDAR point clouds. Int. J. Appl. Earth Obs. Geoinf. 2020, 86, 102014. [Google Scholar] [CrossRef]
- Ayrey, E.; Fraver, S.; Kershaw, J.A., Jr.; Kenefic, L.S.; Hayes, D.; Weiskittel, A.R.; Roth, B.E. Layer stacking: A novel algorithm for individual forest tree segmentation from LiDAR point clouds. Can. J. Remote Sens. 2017, 43, 16–27. [Google Scholar] [CrossRef]
- Chen, Q.; Gao, T.; Zhu, J.; Wu, F.; Li, X.; Lu, D.; Yu, F. Individual tree segmentation and tree height estimation using leaf-off and leaf-on UAV-LiDAR data in dense deciduous forests. Remote Sens. 2022, 14, 2787. [Google Scholar] [CrossRef]
- Ferraz, A.; Bretar, F.; Jacquemoud, S.; Gonçalves, G.; Pereira, L.; Tomé, M.; Soares, P. 3-D mapping of a multi-layered Mediterranean forest using ALS data. Remote Sens. Environ. 2012, 121, 210–223. [Google Scholar] [CrossRef]
- Ferraz, A.; Saatchi, S.; Mallet, C.; Meyer, V. Lidar detection of individual tree size in tropical forests. Remote Sens. Environ. 2016, 183, 318–333. [Google Scholar] [CrossRef]
- Rudge, M.L.; Levick, S.R.; Bartolo, R.E.; Erskine, P.D. Modelling the diameter distribution of savanna trees with drone-based LiDAR. Remote Sens. 2021, 13, 1266. [Google Scholar] [CrossRef]
- Lei, L.; Yin, T.; Chai, G.; Li, Y.; Wang, Y.; Jia, X.; Zhang, X. A novel algorithm of individual tree crowns segmentation considering three-dimensional canopy attributes using UAV oblique photos. Int. J. Appl. Earth Obs. Geoinf. 2022, 112, 102893. [Google Scholar] [CrossRef]
- Balsi, M.; Esposito, S.; Fallavollita, P.; Nardinocchi, C. Single-tree detection in high-density LiDAR data from UAV-based survey. Eur. J. Remote Sens. 2018, 51, 679–692. [Google Scholar] [CrossRef]
- Polat, N.; Uysal, M. An investigation of tree extraction from UAV-based photogrammetric dense point cloud. Arab. J. Geosci. 2020, 13, 846. [Google Scholar] [CrossRef]
- Lu, X.; Guo, Q.; Li, W.; Flanagan, J. A bottom-up approach to segment individual deciduous trees using leaf-off lidar point cloud data. ISPRS J. Photogramm. Remote Sens. 2014, 94, 1–12. [Google Scholar] [CrossRef]
- Lin, Y.C.; Liu, J.; Fei, S.; Habib, A. Leaf-off and leaf-on uav lidar surveys for single-tree inventory in forest plantations. Drones 2021, 5, 115. [Google Scholar] [CrossRef]
- Deng, S.; Xu, Q.; Yue, Y.; Jing, S.; Wang, Y. Individual tree detection and segmentation from unmanned aerial vehicle-LiDAR data based on a trunk point distribution indicator. Comput. Electron. Agric. 2024, 218, 108717. [Google Scholar] [CrossRef]
- Chen, Q.; Luo, H.; Cheng, Y.; Xie, M.; Nan, D. An individual tree detection and segmentation method from TLS and MLS point clouds based on improved seed points. Forests 2024, 15, 1083. [Google Scholar] [CrossRef]
- Wagner, F.H.; Ferreira, M.P.; Sanchez, A.; Hirye, M.C.; Zortea, M.; Gloor, E.; Phillips, O.L.; de Souza Filho, C.R.; Shimabukuro, Y.E.; Arag ao, L.E. Individual tree crown delineation in a highly diverse tropical forest using very high resolution satellite images. ISPRS J. Photogramm. Remote Sens. 2018, 145, 362–377. [Google Scholar] [CrossRef]
- Koc-San, D.; Selim, S.; Aslan, N.; San, B.T. Automatic citrus tree extraction from UAV images and digital surface models using circular Hough transform. Comput. Electron. Agric. 2018, 150, 289–301. [Google Scholar] [CrossRef]
- Khan, A.; Khan, U.; Waleed, M.; Khan, A.; Kamal, T.; Marwat, S.N.K.; Maqsood, M.; Aadil, F. Remote sensing: An automated methodology for olive tree detection and counting in satellite images. IEEE Access 2018, 6, 77816–77828. [Google Scholar] [CrossRef]
- Rizeei, H.M.; Shafri, H.Z.; Mohamoud, M.A.; Pradhan, B.; Kalantar, B. Oil palm counting and age estimation from WorldView-3 imagery and LiDAR data using an integrated OBIA height model and regression analysis. J. Sensors 2018, 2018, 2536327. [Google Scholar] [CrossRef]
- Markaki, S.; Panagiotakis, C. Unsupervised Tree Detection and Counting via Region-Based Circle Fitting. In Proceedings of the ICPRAM, Lisbon, Portugal, 22–24 February 2023; SciTePress: Setúbal, Portugal, 2023; pp. 95–106. [Google Scholar]
- Yao, L.; Liu, T.; Qin, J.; Lu, N.; Zhou, C. Tree counting with high spatial-resolution satellite imagery based on deep neural networks. Ecol. Indic. 2021, 125, 107591. [Google Scholar] [CrossRef]
- Tong, P.; Han, P.; Li, S.; Li, N.; Bu, S.; Li, Q.; Li, K. Counting trees with point-wise supervised segmentation network. Eng. Appl. Artif. Intell. 2021, 100, 104172. [Google Scholar] [CrossRef]
- Weinstein, B.G.; Marconi, S.; Aubry-Kientz, M.; Vincent, G.; Senyondo, H.; White, E.P. DeepForest: A Python package for RGB deep learning tree crown delineation. Methods Ecol. Evol. 2020, 11, 1743–1751. [Google Scholar] [CrossRef]
- Ammar, A.; Koubaa, A.; Benjdira, B. Deep-learning-based automated palm tree counting and geolocation in large farms from aerial geotagged images. Agronomy 2021, 11, 1458. [Google Scholar] [CrossRef]
- Ocer, N.E.; Kaplan, G.; Erdem, F.; Kucuk Matci, D.; Avdan, U. Tree extraction from multi-scale UAV images using Mask R-CNN with FPN. Remote Sens. Lett. 2020, 11, 847–856. [Google Scholar] [CrossRef]
- Sun, Y.; Li, Z.; He, H.; Guo, L.; Zhang, X.; Xin, Q. Counting trees in a subtropical mega city using the instance segmentation method. Int. J. Appl. Earth Obs. Geoinf. 2022, 106, 102662. [Google Scholar] [CrossRef]
- Abozeid, A.; Alanazi, R.; Elhadad, A.; Taloba, A.I.; El-Aziz, A.; Rasha, M. A Large-Scale Dataset and Deep Learning Model for Detecting and Counting Olive Trees in Satellite Imagery. Comput. Intell. Neurosci. 2022, 2022, 1549842. [Google Scholar] [CrossRef]
- Miao, S.; Zhang, K.F.; Zeng, H.; Liu, J. AI-based tree species classification using pseudo tree crown derived from UAV imagery. Preprints 2024. [Google Scholar] [CrossRef]
- Bendig, J.; Yu, K.; Aasen, H.; Bolten, A.; Bennertz, S.; Broscheit, J.; Gnyp, M.L.; Bareth, G. Combining UAV-based plant height from crop surface models, visible, and near infrared vegetation indices for biomass monitoring in barley. Int. J. Appl. Earth Obs. Geoinf. 2015, 39, 79–87. [Google Scholar] [CrossRef]
- Otsu, N. A threshold selection method from gray-level histograms. IEEE Trans. Syst. Man, Cybern. 1979, 9, 62–66. [Google Scholar] [CrossRef]
- Fabbri, R.; Costa, L.D.F.; Torelli, J.C.; Bruno, O.M. 2D Euclidean distance transform algorithms: A comparative survey. ACM Comput. Surv. (CSUR) 2008, 40, 1–44. [Google Scholar] [CrossRef]
- Akaike, H. A new look at the statistical model identification. IEEE Trans. Autom. Control 1974, 19, 716–723. [Google Scholar] [CrossRef]
- Burnham, K.P.; Anderson, D.R. Model Selection and Multimodel Inference: A Practical Information-Theoretic Approach; Springer: Berlin/Heidelberg, Germany, 2002. [Google Scholar]
- Panagiotakis, C.; Argyros, A. Parameter-free modelling of 2D shapes with ellipses. Pattern Recognit. 2016, 53, 259–275. [Google Scholar] [CrossRef]
- Pingel, T.J.; Clarke, K.C.; McBride, W.A. An improved simple morphological filter for the terrain classification of airborne LIDAR data. ISPRS J. Photogramm. Remote Sens. 2013, 77, 21–30. [Google Scholar] [CrossRef]
- Bilen, H.; Vedaldi, A. Weakly supervised deep detection networks. In Proceedings of the IEEE Conference on Computer Vision and Pattern Recognition, Las Vegas, NV, USA, 26 June–1 July 2016; IEEE: New York, NY, USA, 2016; pp. 2846–2854. [Google Scholar]
- Tang, P.; Wang, X.; Bai, S.; Shen, W.; Bai, X.; Liu, W.; Yuille, A. Pcl: Proposal cluster learning for weakly supervised object detection. IEEE Trans. Pattern Anal. Mach. Intell. 2018, 42, 176–191. [Google Scholar] [CrossRef]
- Wan, F.; Liu, C.; Ke, W.; Ji, X.; Jiao, J.; Ye, Q. C-mil: Continuation multiple instance learning for weakly supervised object detection. In Proceedings of the IEEE/CVF Conference on Computer Vision and Pattern Recognition, Long Beach, CA, USA, 16–20 June 2019; IEEE: New York, NY, USA, 2019; pp. 2199–2208. [Google Scholar]
- Vincent, L.; Soille, P. Watersheds in digital spaces: An efficient algorithm based on immersion simulations. IEEE Trans. Pattern Anal. Mach. Intell. 1991, 13, 583–598. [Google Scholar] [CrossRef]
Figure 1.
Acacia-6 Dataset [
37].
Figure 1.
Acacia-6 Dataset [
37].
Figure 2.
Schematic overview of the proposed approach.
Figure 2.
Schematic overview of the proposed approach.
Figure 3.
Schematic illustration of the circle estimation process. The red dots ( and ) indicate local maxima of the Distance Transform (DT), representing the centers of potential tree crowns. The dashed red arrows indicate the Distance Transform value at those centers ( and ), defining the radius ( and ) to the nearest mask boundary.
Figure 3.
Schematic illustration of the circle estimation process. The red dots ( and ) indicate local maxima of the Distance Transform (DT), representing the centers of potential tree crowns. The dashed red arrows indicate the Distance Transform value at those centers ( and ), defining the radius ( and ) to the nearest mask boundary.
Figure 4.
The AgiosNikolaos-3 Dataset.
Figure 4.
The AgiosNikolaos-3 Dataset.
Figure 5.
Schematic overview of the point cloud filtering procedure.
Figure 5.
Schematic overview of the point cloud filtering procedure.
Figure 6.
Visual validation showing the correspondence between DTCD-PC detected trees and ground truth in Elaionas Urban Park. Detected trees are shown as red circles and ground truth locations as blue dots, while matching pairs (TP) are connected by green lines.
Figure 6.
Visual validation showing the correspondence between DTCD-PC detected trees and ground truth in Elaionas Urban Park. Detected trees are shown as red circles and ground truth locations as blue dots, while matching pairs (TP) are connected by green lines.
Figure 7.
Visual validation showing the correspondence between DTCD-PC detected trees and ground truth in Roussou Koundourou Street. Detected trees are shown as red circles and ground truth locations as blue dots, while matching pairs (TP) are connected by green lines.
Figure 7.
Visual validation showing the correspondence between DTCD-PC detected trees and ground truth in Roussou Koundourou Street. Detected trees are shown as red circles and ground truth locations as blue dots, while matching pairs (TP) are connected by green lines.
Figure 8.
Visual validation showing the correspondence between DTCD-PC detected trees and ground truth in Agios Charalambos Urban Hill. Detected trees are shown as red circles and ground truth locations as blue dots, while matching pairs (TP) are connected by green lines.
Figure 8.
Visual validation showing the correspondence between DTCD-PC detected trees and ground truth in Agios Charalambos Urban Hill. Detected trees are shown as red circles and ground truth locations as blue dots, while matching pairs (TP) are connected by green lines.
Figure 9.
Parameter sensitivity analysis of the Gaussian smoothing kernel with respect to the F1-score. (a) In the DTCD method (Acacia-6 dataset). (b) In the DTCD-PC method (Agios Nikolaos-3 dataset).
Figure 9.
Parameter sensitivity analysis of the Gaussian smoothing kernel with respect to the F1-score. (a) In the DTCD method (Acacia-6 dataset). (b) In the DTCD-PC method (Agios Nikolaos-3 dataset).
Figure 10.
Qualitative assessment of the proposed DTCD framework on the Acacia-6 dataset, showcasing varying levels of detection performance. (a,b) High Performance with near-perfect accuracy (). (c,d) Typical Performance with high accuracy (). (e,f) Low Performance Cases where (e) illustrates omission errors (Low TPR) and (f) illustrates commission errors (Low Precision). (Red dashed circles indicate estimated tree crowns and yellow crosses denote ground truth centroids).
Figure 10.
Qualitative assessment of the proposed DTCD framework on the Acacia-6 dataset, showcasing varying levels of detection performance. (a,b) High Performance with near-perfect accuracy (). (c,d) Typical Performance with high accuracy (). (e,f) Low Performance Cases where (e) illustrates omission errors (Low TPR) and (f) illustrates commission errors (Low Precision). (Red dashed circles indicate estimated tree crowns and yellow crosses denote ground truth centroids).
Table 1.
A brief overview of the methods commonly used in the literature, categorized by data source and algorithmic approach.
Table 1.
A brief overview of the methods commonly used in the literature, categorized by data source and algorithmic approach.
| Authors | Year | Data | Approach | Methodology |
|---|
| Ma et al. [6] | 2022 | LiDAR | Unsupervised-CHM | WatershedAlgorithm
Local Maximum Method
Point Cloud-based Cluster Segmentation
Layer Stacking (LS) |
| Neto et al. [7] | 2021 | LiDAR | Unsupervised-CHM | Local Maxima Algorithm |
| Yin and Wang [8] | 2019 | LiDAR | Unsupervised-CHM | Watershed Segmentation |
| Guerra-Hernández et al. [9] | 2018 | LiDAR
Photogrammetry | Unsupervised-CHM | Local Maxima Algorithm |
| Liu et al. [10] | 2020 | LiDAR
Photogrammetry | Unsupervised-CHM | Local Maxima Algorithm |
| Wu et al. [11] | 2019 | LiDAR | Unsupervised-CHM | Watershed Algorithm
Polynomial Fitting
Individual Tree Crown Segmentation (ITCS)
Point Cloud Segmentation (PCS) Algorithm |
| Ma et al. [12] | 2021 | LiDAR | Unsupervised-CHM | Improved Watershed |
| You et al. [13] | 2023 | LiDAR | Unsupervised-CHM | Progressive Watershed |
| Zhao et al. [14] | 2017 | LiDAR | Unsupervised-CHM | Region-based Hierarchical Cross-Section Analysis (RHCSA) |
| Quan et al. [15] | 2023 | LiDAR
Hyperspectral Im. | Unsupervised Point Cloud | Region-based Hierarchical Cross-Section Analysis (RHCSA) |
| Liu et al. [16] | 2021 | LiDAR | Unsupervised Point Cloud | Region-based Hierarchical Cross-Section Analysis (RHCSA) |
| Li et al. [17] | 2021 | LiDAR | Unsupervised Point Cloud | Point Cloud Segmentation (PCS) Algorithm |
| Lu et al. [18] | 2020 | LiDAR | Unsupervised Point Cloud | Comparative Shortest Path (CSP) Algorithm |
| Ayrey et al. [19] | 2017 | LiDAR | Unsupervised Point Cloud | Layer Stacking (LS) |
| Chen et al. [20] | 2022 | LiDAR | Unsupervised Point Cloud | Watershed Segmentation
Point Cloud Segmentation (PCS) Algorithm
Layer Stacking (LS) |
| Ferraz et al. [21] | 2012 | LiDAR | Unsupervised Point Cloud | Adaptive Mean Shift 3D (AMS3D) Algorithm |
| Ferraz et al. [22] | 2016 | LiDAR | Unsupervised Point Cloud | Adaptive Mean Shift 3D (AMS3D) Algorithm |
| Rudge et al. [23] | 2021 | LiDAR | Unsupervised Point Cloud | Adaptive Mean Shift 3D (AMS3D) Algorithm |
| Lei et al. [24] | 2022 | LiDAR
Photogrammetry | Unsupervised Point Cloud | Adaptive Mean Shift 3D (AMS3D) Algorithm |
| Balsi et al. [25] | 2018 | LiDAR | Unsupervised Point Cloud | Random Sample Consensus (RANSAC) Algorithm |
| Polat et Uysal [26] | 2020 | Photogrammetry | Unsupervised Point Cloud | Random Sample Consensus (RANSAC) Algorithm |
| Lu et al. [27] | 2014 | LiDAR | Unsupervised Point Cloud | Tree Segmentation Method focusing on trunk detection |
| Lin et al. [28] | 2021 | LiDAR | Unsupervised Point Cloud | Tree Segmentation Method focusing on trunk detection |
| Deng et al. [29] | 2024 | LiDAR | Unsupervised-UAV/Sat. Im. | Tree Segmentation Method focusing on trunk detection |
| Chen et al. [30] | 2024 | LiDAR
Photogrammetry | Unsupervised-UAV/Sat. Im. | Density-based Spatial Clustering (DBSCAN) Algorithm |
| Wagner et al. [31] | 2018 | Satellite Im. | Unsupervised-UAV/Sat. Im. | Boundary Enhancement and Segmentation |
| Koc et al. [32] | 2018 | UAV Multispectral Im.
Photogrammetry | Unsupervised-UAV/Sat. Im. | Circular Hough Transform |
| Khan et al. [33] | 2018 | Satellite Im. | Unsupervised-UAV/Sat. Im. | Circular Hough Transform |
| Rizeei et al. [34] | 2018 | LiDAR and
Satellite Im. | Unsupervised-UAV/Sat. Im. | OBIA Height Model and Regression Analysis |
| Markaki & Panagiotakis [35] | 2023 | UAV RGB Im. | Unsupervised-UAV/Sat. Im. | Decremental Circle Fitting Algorithm (DCFA) |
| Yao et al. [36] | 2023 | Satellite Im. | Supervised-Deep Learning | Deep Neural Networks |
| Tong et al. [37] | 2020 | UAV RGB Im. | Supervised-Deep Learning | Point-Wise Supervised Segmentation Network |
| Weinstein et al. [38] | 2020 | RGB Im. | Supervised-Deep Learning | DeepForest |
| Ammar et al. [39] | 2021 | UAV RGB Im. | Supervised-Deep Learning | Deep Learning Methods |
| Ocer et al. [40] | 2020 | UAV RGB Im. | Supervised-Deep Learning | Mask R-CNN Model and Feature Pyramid Network (FPN) |
| Sun et al. [41] | 2022 | RGB Im. | Supervised-Deep Learning | Instance Segmentation Network (Cascade Mask R-CNN) |
| Abozeid et al. [42] | 2022 | Satellite Im. | Supervised-Deep Learning | SwinTUnet Architecture |
Table 2.
Performance evaluation of the DTCD method compared to unsupervised methods on the Acacia-6 dataset for the original image. Bold values indicate the best-performing method based on the corresponding metric.
Table 2.
Performance evaluation of the DTCD method compared to unsupervised methods on the Acacia-6 dataset for the original image. Bold values indicate the best-performing method based on the corresponding metric.
| Method | TPR | Prec | F1 |
|---|
| CHT | 0.875 | 0.556 | 0.680 |
| CHT++ | 0.861 | 0.853 | 0.857 |
| DEFA | 0.826 | 0.897 | 0.860 |
| DCFA | 0.876 | 0.908 | 0.892 |
| DTCD | 0.903 | 0.927 | 0.915 |
Table 3.
Performance evaluation of the DTCD method compared to supervised methods on the Acacia-6 dataset for the original image. Bold values indicate the best-performing method based on the corresponding metric.
Table 3.
Performance evaluation of the DTCD method compared to supervised methods on the Acacia-6 dataset for the original image. Bold values indicate the best-performing method based on the corresponding metric.
| Method | TPR | Prec | F1 |
|---|
| PWSSN | 0.975 | 0.983 | 0.979 |
| WSDDN | 0.702 | 0.776 | 0.715 |
| PCL | 0.751 | 0.785 | 0.773 |
| C-MIL | 0.826 | 0.879 | 0.868 |
| DTCD | 0.903 | 0.927 | 0.915 |
Table 4.
Average scores of the DTCD method compared to unsupervised methods computed over individual scores per image of the 247 sub-images obtained from the Acacia-6 dataset. Bold values indicate the best-performing method based on the corresponding metric.
Table 4.
Average scores of the DTCD method compared to unsupervised methods computed over individual scores per image of the 247 sub-images obtained from the Acacia-6 dataset. Bold values indicate the best-performing method based on the corresponding metric.
| Method | TPR | Prec | F1 |
|---|
| CHT | 0.870 | 0.602 | 0.694 |
| CHT++ | 0.861 | 0.859 | 0.852 |
| DEFA | 0.849 | 0.889 | 0.818 |
| DCFA | 0.870 | 0.904 | 0.883 |
| DTCD | 0.924 | 0.899 | 0.908 |
Table 5.
Average computational time (in s) of the unsupervised methods computed over the 247 sub-images of the Acacia-6 dataset. Bold value indicate the best-performing method.
Table 5.
Average computational time (in s) of the unsupervised methods computed over the 247 sub-images of the Acacia-6 dataset. Bold value indicate the best-performing method.
| Method | CHT | CHT++ | DEFA | DCFA | DTCD |
|---|
| Average Comp. Time (s) | 2.41 | 3.05 | 495.26 | 302.57 | 2.41 |
Table 6.
Quantitative assessment of the DTCD Method’s performance on Orthomosaic vs. the DTCD-PC Method’s performance on Point Cloud data in the selected study areas of AgiosNikolaos-3 dataset.
Table 6.
Quantitative assessment of the DTCD Method’s performance on Orthomosaic vs. the DTCD-PC Method’s performance on Point Cloud data in the selected study areas of AgiosNikolaos-3 dataset.
| Study Area | Orthomosaic | Point Cloud |
|---|
| TPR | Prec | F1 | TPR | Prec | F1 |
|---|
| Elaionas Urban Park | 0.51 | 0.71 | 0.59 | 0.96 | 0.78 | 0.86 |
| R. Koundourou Str. | 0.71 | 0.77 | 0.74 | 0.95 | 0.65 | 0.77 |
| Ag. Charalambos Hill | 0.31 | 0.18 | 0.23 | 0.79 | 0.61 | 0.69 |
Table 7.
Performance evaluation of the DTCD-PC method compared to unsupervised approaches on the Elaionas Urban Park point cloud of AgiosNikolaos-3 dataset.
Table 7.
Performance evaluation of the DTCD-PC method compared to unsupervised approaches on the Elaionas Urban Park point cloud of AgiosNikolaos-3 dataset.
| Method | TPR | Prec | F1 |
|---|
| WA | 0.99 | 0.13 | 0.23 |
| RHCSA | 0.37 | 0.30 | 0.33 |
| RHCSA++ | 0.45 | 0.41 | 0.43 |
| WA++ | 0.76 | 0.40 | 0.52 |
| DTCD-PC/WA | 0.99 | 0.62 | 0.76 |
| DTCD-PC | 0.96 | 0.78 | 0.86 |
Table 8.
Performance evaluation of the DTCD-PC method compared to unsupervised approaches on the R. Koundourou Str. point cloud of AgiosNikolaos-3 dataset.
Table 8.
Performance evaluation of the DTCD-PC method compared to unsupervised approaches on the R. Koundourou Str. point cloud of AgiosNikolaos-3 dataset.
| Method | TPR | Prec | F1 |
|---|
| WA | 0.83 | 0.10 | 0.18 |
| RHCSA | 0.15 | 0.10 | 0.12 |
| RHCSA++ | 0.27 | 0.18 | 0.22 |
| WA++ | 0.57 | 0.28 | 0.38 |
| DTCD-PC/WA | 0.91 | 0.65 | 0.76 |
| DTCD-PC | 0.95 | 0.65 | 0.77 |
Table 9.
Performance evaluation of the DTCD-PC method compared to unsupervised approaches on the Agios Charalambos Urban Hill point cloud of AgiosNikolaos-3 dataset.
Table 9.
Performance evaluation of the DTCD-PC method compared to unsupervised approaches on the Agios Charalambos Urban Hill point cloud of AgiosNikolaos-3 dataset.
| Method | TPR | Prec | F1 |
|---|
| WA | 0.92 | 0.10 | 0.15 |
| RHCSA | 0.31 | 0.16 | 0.21 |
| RHCSA++ | 0.48 | 0.23 | 0.31 |
| WA++ | 0.78 | 0.23 | 0.35 |
| DTCD-PC/WA | 0.84 | 0.45 | 0.59 |
| DTCD-PC | 0.79 | 0.61 | 0.69 |
| Disclaimer/Publisher’s Note: The statements, opinions and data contained in all publications are solely those of the individual author(s) and contributor(s) and not of MDPI and/or the editor(s). MDPI and/or the editor(s) disclaim responsibility for any injury to people or property resulting from any ideas, methods, instructions or products referred to in the content. |