Article

Combining Near-Infrared Vegetation Radiance to Improve the Accuracy of Grassland Aboveground Biomass Estimation
1
Nanjing Institute of Environmental Sciences, Ministry of Ecology and Environment of the People’s Republic of China, Nanjing 210042, China
2
Inner Mongolia Hulun Lake (Wetland) Comprehensive Monitoring Station for Ecological Quality, Hulunbuir 021000, China
3
Hulunbuir Inland Lake Research Institute of Northern Cold and Arid Areas, Hulunbuir 021000, China
4
Ecologie Société Evolution, Université Paris-Saclay, Centre National de la Recherche Scientifique, AgroParisTech, 91190 Gif-sur-Yvette, France
*
Author to whom correspondence should be addressed.
Remote Sens. 2026, 18(3), 467; https://doi.org/10.3390/rs18030467
Submission received: 19 December 2025 / Revised: 18 January 2026 / Accepted: 27 January 2026 / Published: 2 February 2026
(This article belongs to the Section Ecological Remote Sensing)

Highlights

What are the main findings?
  • The near-infrared radiance provided positive effect on improving AGB estimation accuracy, and NIRvR showed higher correlation with AGB than NDVI and NIRv.
  • Diverse grass species could introduce greater uncertainty, and grassland with lower or higher species richness showed larger deviations.
What are the implications of the main findings?
  • The study developed a novel drone hyperspectral-driven AGB estimation method, which is important for improving understanding of the carbon cycle in grassland ecosystems.
  • The species diversity index plays an important role in estimating grassland carbon sinks, and offers valuable guidance for grassland management.

Abstract
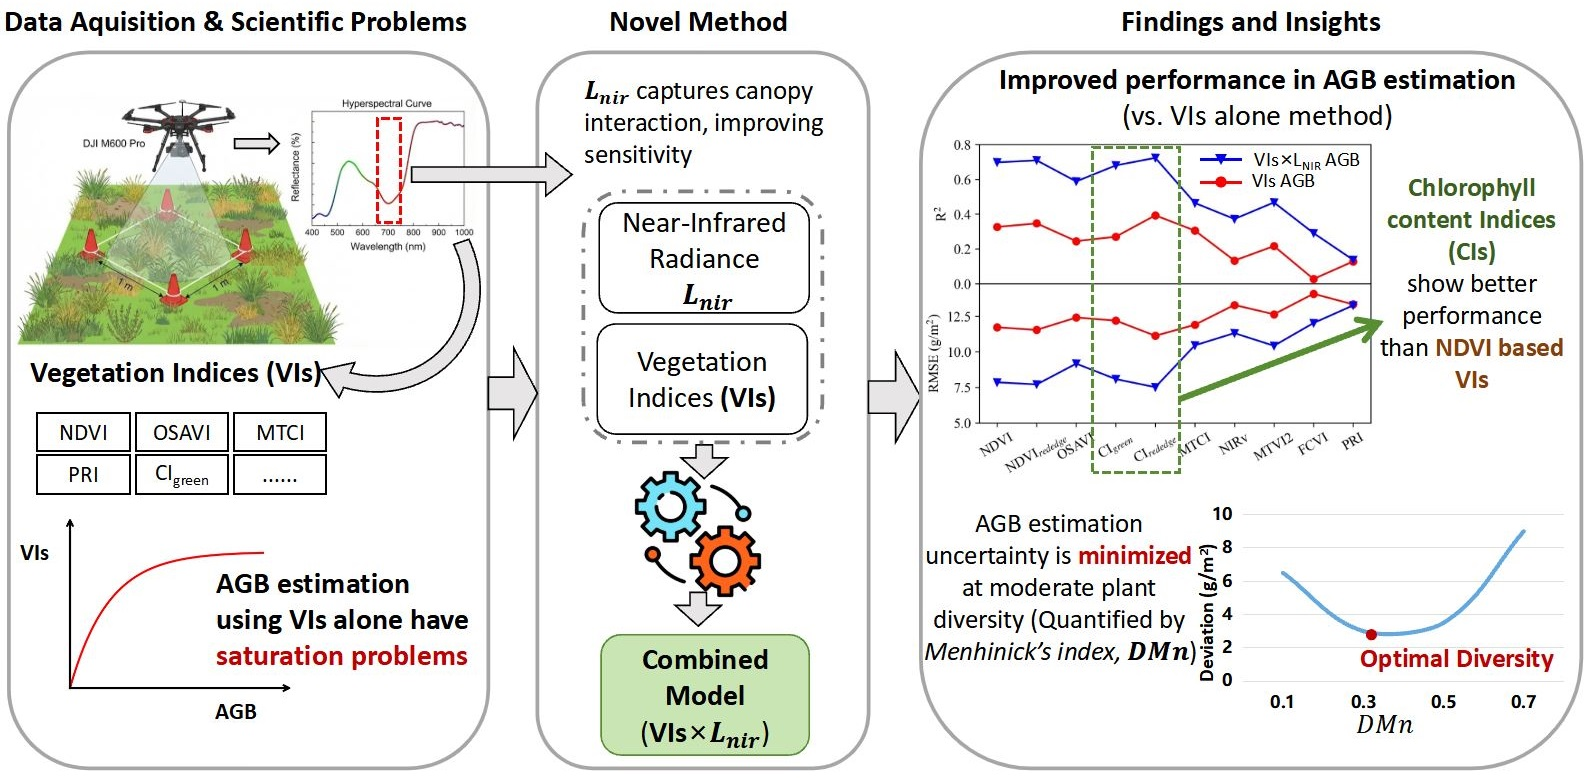
Grassland aboveground biomass (AGB) is a crucial component of the global carbon budget in climate change studies. Precise estimation of the AGB of grassland ecosystems is essential to better understand the carbon cycle and to improve grassland conservation as well as to achieve optimal growth. Traditional vegetation indices (VIs) derived from remote sensing often saturate at medium-high biomass levels, limiting estimation accuracy. In this study, we introduced a novel AGB estimation framework by explicitly integrating near-infrared radiance (Lnir) with UAV-based hyperspectral vegetation indices (VIs×Lnir), which effectively alleviated saturation effects commonly observed in conventional VI-based models. Field measurements and hyperspectral imagery were collected in a temperate meadow steppe, and model performance was evaluated using leave-one-out cross-validation (LOOCV). The proposed VIs×Lnir model achieved the highest accuracy (R2 = 0.72, RMSE = 7.52 g/m2), outperforming conventional VIs-based (R2 < 0.39, RMSE > 11.13 g/m2) estimations. The study further investigated the results of fAPARgreen-related VIs×Lnir model, which yielded higher AGB estimation accuracy than that using NDVI×Lnir. Furthermore, we examined the influence of plant diversity using Menhinick’s index (DMn) and found that AGB estimation uncertainty was lowest when DMn ranged from 0.2 to 0.4, likely due to reduced spectral mixing and optimal canopy structural homogeneity. Under both lower (DMn < 0.2) and higher diversity conditions (DMn > 0.4), AGB could still be estimated, but with increased uncertainty likely caused by insufficient spectral variability at low diversity and stronger spectral mixing at high diversity. This study demonstrates the potential of incorporating Lnir into UAV hyperspectral analysis to enhance grassland AGB estimation and provides insights into the role of biodiversity in remote sensing-based biomass monitoring.

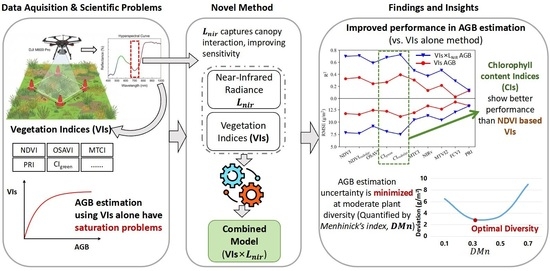
Graphical Abstract

1. Introduction

Grasslands are pivotal terrestrial ecosystems, occupying a significant portion of the Earth’s land surface and playing a crucial role in regulating global carbon, water, and nutrient cycles [1]. Aboveground biomass (AGB) is a fundamental parameter for assessing grassland productivity, grazing capacity, and ecosystem health. Traditionally, AGB is measured using destructive field sampling, which is accurate but time-consuming, labor-intensive, and geographically limited [2,3]. Therefore, accurate, non-destructive, and spatially extensive methods are urgently needed.
Remote sensing (RS) technique has emerged as the primary tool for large-scale and rapid AGB monitoring [4,5,6]. In general, there are two main types of AGB estimation methods based on remote sensing data: physically based models and data-driven empirical models. Physically based models (such as PROSAIL, SCOPE, etc.) estimate the biomass by simulating canopy biophysics, radiative transfer, and energy balance of vegetation [7,8,9]. Data-driven empirical models propose regression or machine learning methods and have been employed with the advantages of effectiveness and simplicity [9,10,11]. The approach primarily relies on vegetation indices (VIs), such as the normalized difference vegetation index (NDVI) and the enhanced vegetation index (EVI), which are derived from canopy reflectance [12]. While VIs have proven effective, they are inherently limited by two major issues in dense grassland canopies. First, VIs often experience the saturation effect at high AGB levels, leading to a weak sensitivity when biomass exceeds a certain threshold [13]. Second, VIs are susceptible to variations in soil background, atmospheric conditions, and the complex leaf area index (LAI) and leaf angle distribution of diverse grassland species [13]. These limitations contribute to the large uncertainties in AGB estimates, especially in heterogeneous natural grasslands [14]. In addition, estimation results from these models can be easily affected either by model assumptions and model structure or by input variables [15]. Variations in climate conditions and uncertainties in model parameterization may propagate through the model structure, resulting in considerable uncertainty in AGB estimation. Effective and simple AGB estimation methods with low dependence on climate conditions and model parametrization are still limited.
To address these shortcomings, recent studies have shifted focus from simple VIs towards indices that are more closely linked to vegetation’s physiological processes. Notably, the concept of near-infrared reflectance of vegetation (NIRv), which isolates the NIR component that scales linearly with the fraction of photosynthetically active radiation absorbed by the canopy (fAPAR) [16,17] has been introduced. NIRv is defined as the product of total scene NIR reflectance (NIRref) and NDVI. NIRv has demonstrated strong correlation with solar-induced chlorophyll fluorescence (SIF), a “proxy” of photosynthesis, and with gross primary productivity (GPP) [16]. Extending this concept, some studies further took the incoming radiation into account by replacing the NIRref with NIR radiance (NIRrad, hereafter, Lnir) and generated a new index, NIRvR. NIRvR has been assumed to have the potential to show stronger relationship with vegetation photosynthesis [17,18], which has been observed in some studies [19,20]. For example, Wu et al. [19] found that NIRvR can explain 84% and 78% variations in GPP at a half-hourly scale for corn and soybean, respectively. The strong relationships outperformed NIRv, SIF, and the commonly employed EVI. Similar results were also demonstrated at both half-hourly and daily timescales for corn fields [20]. Furthermore, NIRvP, defined as the product of NIRv and photosynthetically active radiation (PAR), has also been validated for capturing spatiotemporal patterns of canopy photosynthesis across scales [21]. The robustness, as a proxy for both SIF and GPP, has been validated in multiple spatial and temporal resolutions and diverse ecosystems [21]. Because NIRvR and NIRvP share similar mechanistic explanations regarding solar energy utilization for photosynthesis, these studies collectively validate the efficacy of incorporating the Lnir or radiant energy component in productivity modeling [17,18]. However, despite the established strong mechanistic link between these radiance-based indices and GPP, their application in AGB estimation remains largely unexplored. It must be emphasized that fundamental differences exist between GPP and AGB. GPP varies dynamically at short temporal scales (e.g., half-hourly) in response to changes in incoming radiation, whereas AGB represents a relatively stable and inherent property of vegetation that does not fluctuate with short-term environmental variability. From this perspective, whether radiance-based information that has proven effective for GPP estimation can be directly transferred to AGB estimation is not self-evident and remains theoretically uncertain. Nevertheless, radiance contains information related to instantaneous canopy–radiation interactions and photosynthetic activity [16], which may indirectly reflect functional differences among grass species. In species-rich natural grasslands, such functional heterogeneity can contribute to spectral confusion and increased uncertainty in reflectance-based AGB estimation. Incorporating radiance-based information may therefore provide complementary insights into canopy functioning that are not fully captured by reflectance alone. The core research gap lies in the underdeveloped application of this physically meaningful Lnir component in combination with traditional VIs to create more robust empirical models for AGB estimation in complex grassland environments. Specifically, the hypothesis is that combining reflectance-based VIs with near-infrared radiance (i.e., VIs×Lnir) does not aim to retrieve an inherent biomass signal from radiance itself, but rather provides complementary information on canopy–radiation interaction. When used jointly with reflectance, this approach may empirically alleviate index saturation and improve the AGB estimation performance of natural grasslands under relatively stable acquisition conditions.
Currently, traditional satellite-based remote sensing methods are primarily utilized, even though their application can be restricted by their relatively low spatial–temporal resolutions and spectral bands [5,22]. Recent advances in hyperspectral characteristics of vegetation monitoring capabilities using unmanned aerial vehicles (UAVs) may provide a new opportunity for AGB estimation at a regional scale. UAVs can fill the scale gap between satellite and in situ experiments by providing the fine spatial scales of grassland biophysical traits [22]. In order to analyze the biomass of grassland plants with low canopy height, a large amount of spectral and spatial information can be beneficial. Furthermore, UAVs can provide improved access to specific targets and can be deployed flexibly, which allows mitigation of the influence of changing atmospheric conditions on spectral data [22], especially in high latitude area where clouds move quickly. In addition, the detailed spatial scale of UAVs brings into sharper focus the role of plant species diversity and structural complexity in introducing spectral confusion and uncertainty into AGB modeling [23]. High species richness can lead to “spectral confusion,” where different species with distinct biochemical and structural traits contribute overlapping or confounding spectral signatures within a single pixel or region of interest, ultimately decoupling the spectral index from the actual biomass. Conversely, very low diversity may not adequately represent the ecosystem’s full complexity, limiting the model’s ability to generalize. Therefore, understanding the relationship between plant diversity and AGB estimation uncertainty is crucial for establishing robust monitoring protocols in heterogeneous ecosystems.
The Hulun Lake Basin was selected as the study area due to its ecological significance as a representative region of the Inner Mongolia Steppe, one of the most vital grassland ecosystems globally [24,25]. Critically, the area exhibits significant spatial and structural heterogeneity, characterized by a wide ecological gradient ranging from typical temperate steppe to meadow–steppe transition zones, often coupled with varying grazing pressures. This high degree of heterogeneity is well suited for testing our proposed methodology, as it is precisely under structurally complex conditions. Under these conditions, VIs typically suffer from saturation and uncertainty; thus, the robustness of the radiance-based VIs×Lnir model can be most rigorously validated. Consequently, demonstrating the model’s effectiveness here provides broad implications for improving AGB estimation in other highly heterogeneous, species-rich, and complex grassland ecosystems worldwide.
Given the theoretical concerns associated with radiance-based variables, this study deliberately adopts a cautious and hypothesis-driven framework, explicitly treating radiance as a complementary rather than intrinsic predictor of AGB. The overall goal of this study is to improve the accuracy of grassland AGB estimation by integrating Lnir with various VIs using UAV-borne hyperspectral data. The specific objectives are (1) to explore the effectiveness of the proposed VIs×Lnir modeling approach in estimating AGB; (2) to compare the performance of the VIs×Lnir model with traditional VIs and the NIRv model; and (3) to quantify the influence of plant species diversity on the uncertainty of the AGB estimation model. The findings of this study provide new insights for remote sensing-based monitoring of AGB in heterogeneous grassland ecosystems.

2. Methods and Materials

2.1. Study Area and Field Data Collection

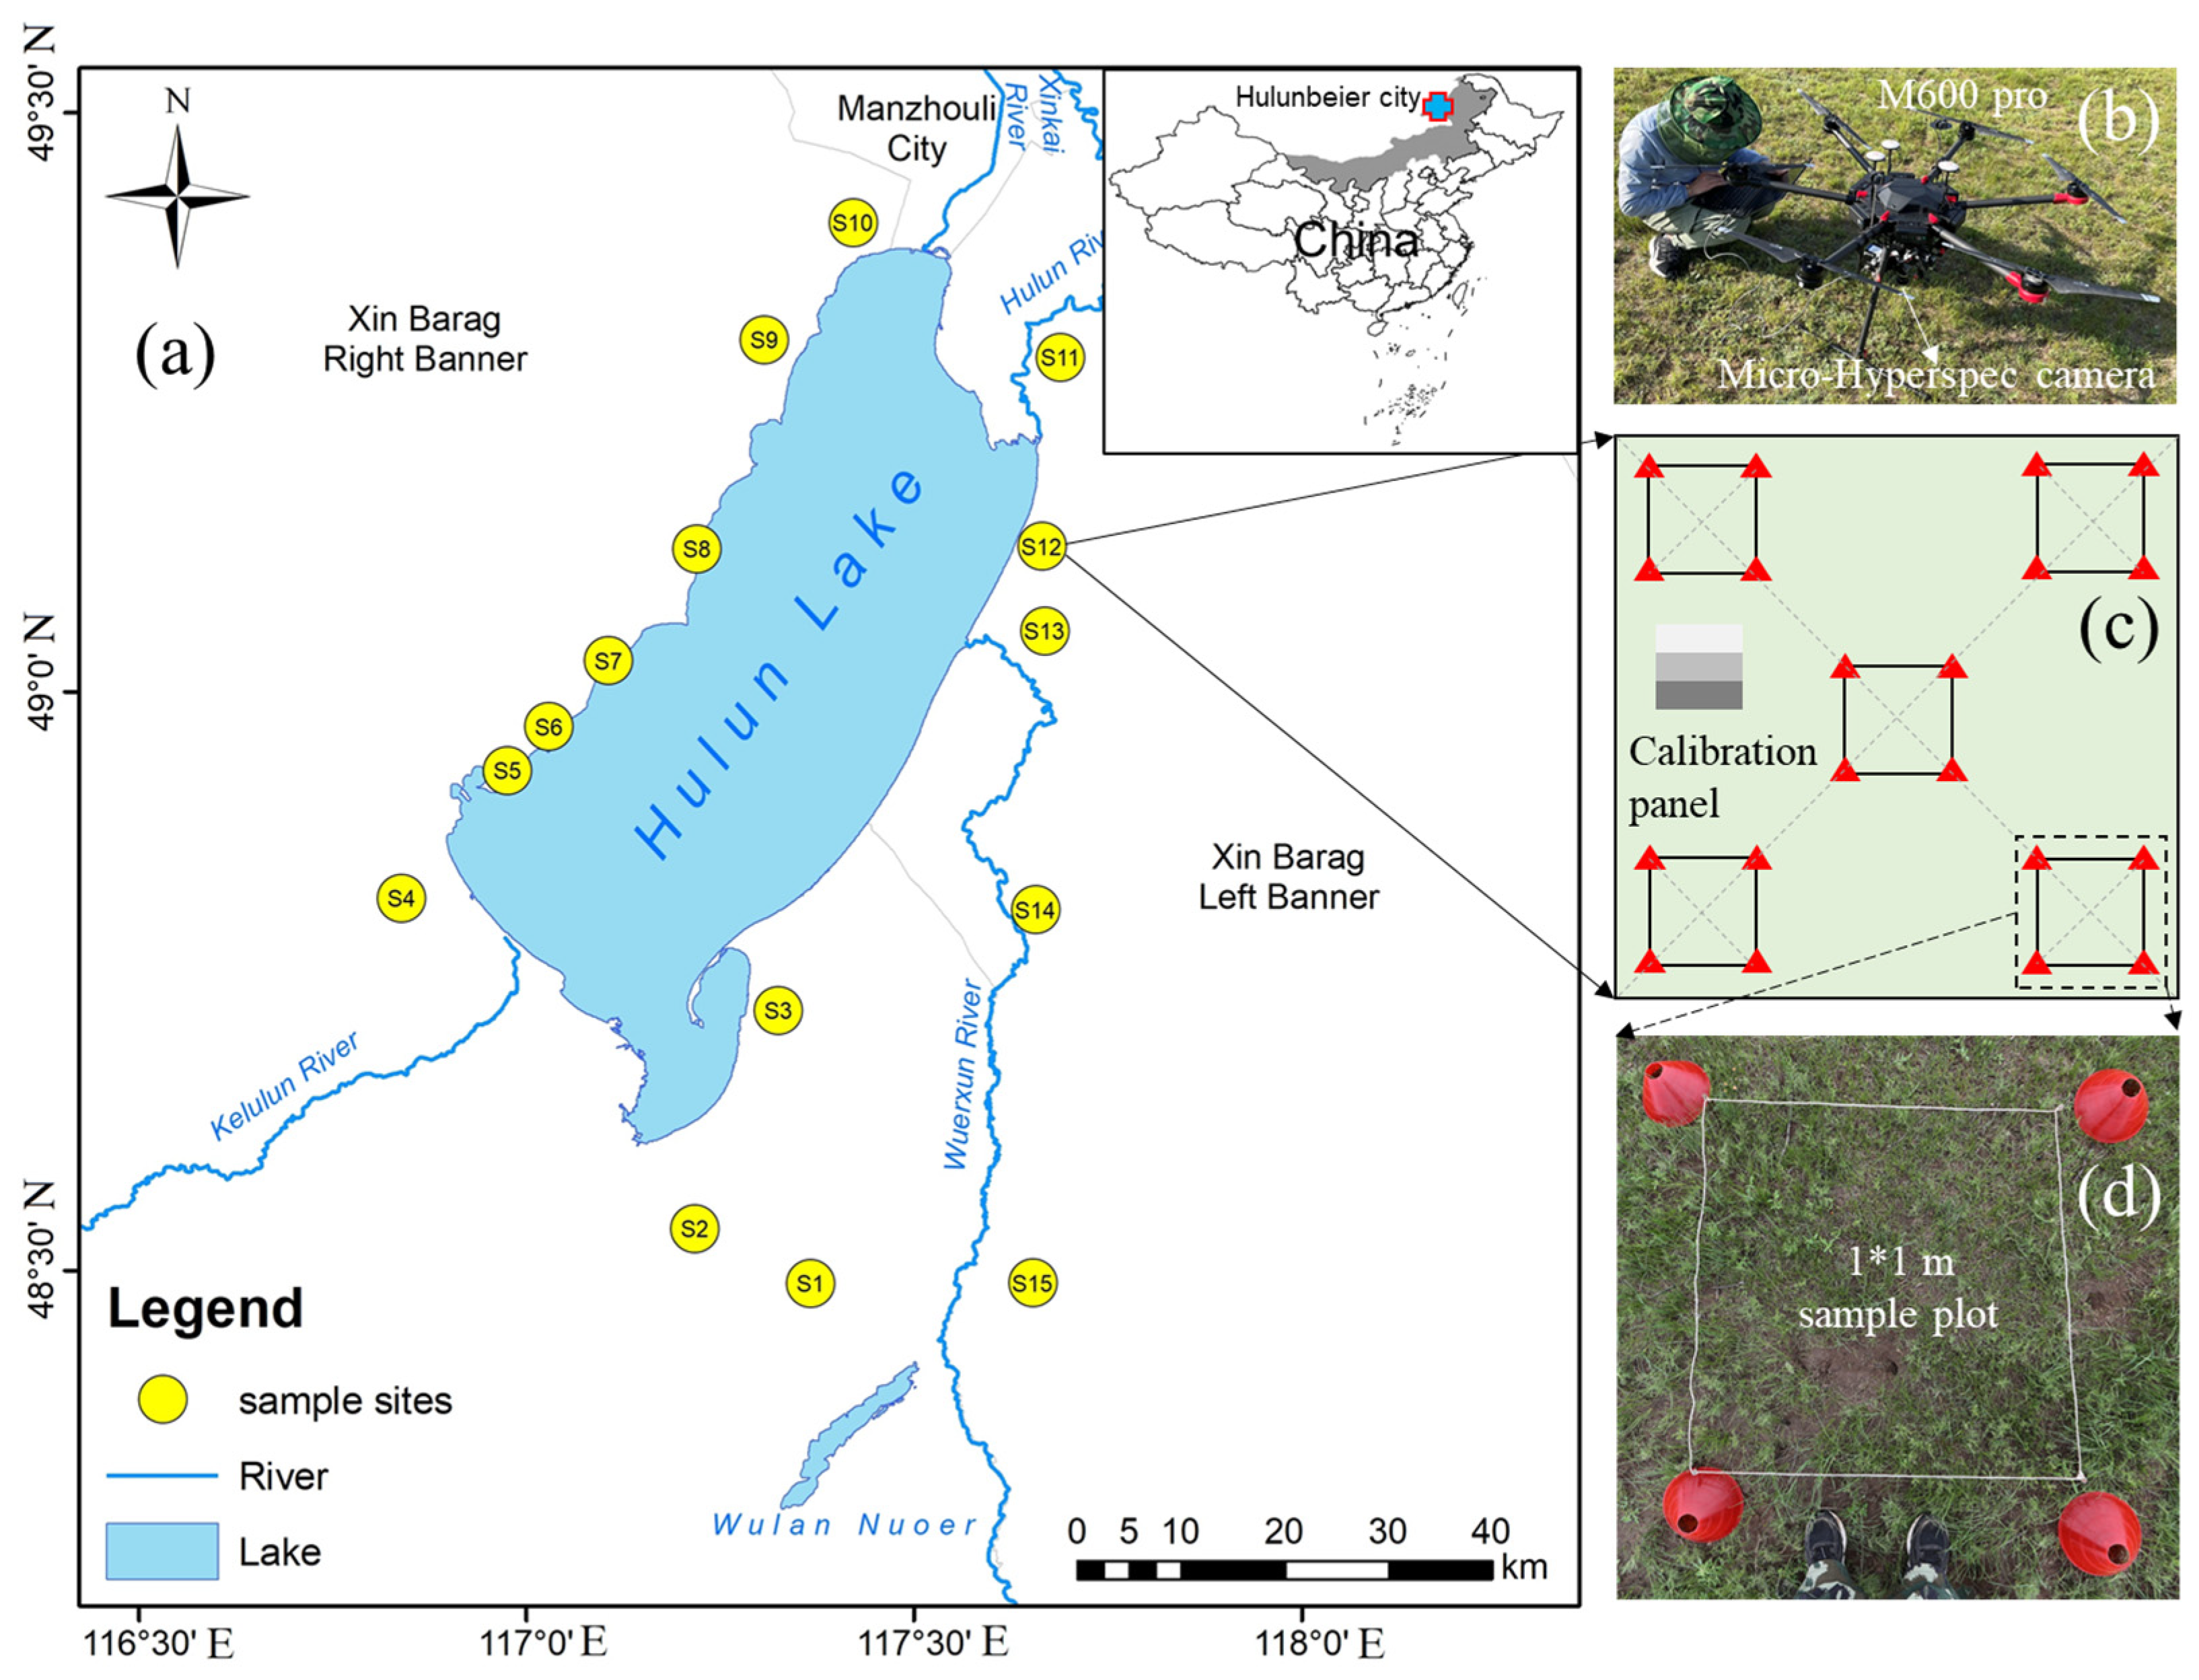
The study area is located in the Hulun Lake basin of Hulunbeier city, Inner Mongolia Autonomous Region, China (Figure 1a). This area belongs to the mid-temperate semiarid grassland monsoon climate, in which the annual average temperature is 0.83 °C (1983–2017). The annual precipitation is concentrated during the period of June–September, and the average annual precipitation is around 200–300 mm. The field data collection was carried out from 27 August to 7 September 2021 in a typical steppe, in which grasses were in maturity and grew without human intervention.
The experiment consisted of 15 large sample sites with different locations across the Hulun Lake basin (Figure 1a). Each site had an area of 10,000 m2 with a length of 100 m and a width of 100 m. Five small 1 × 1 m size sample plots, each marked with four white nylon ropes and four red cones (Figure 1d), were evenly distributed in each large sample site (Figure 1c). The dominant species included Cleistogenes suqarrosa, Carex duriuscula, and Suaeda salsa in the sample plots.
The AGB data collection of each small sample plot followed three steps: (1) collect all aboveground parts of the grass (including stems, leaves, ears, etc.) within the sample plot; (2) put them in the laboratory at 105 °C for 1 h, and then dry them at 80 °C for 24 h to a constant weight; and (3) weight the samples and calculate the aboveground dry biomass per square meter (g/m2) based on the area of the sample plot. A total of 75 AGB data points were expected to be acquired in this field data collection experiment. In addition, the number of species and the total number of grass individuals in each plot were also collected to assess the grass diversity of each plot.

2.2. Hyperspectral Data Collection

The study area was surveyed using Matrice 600 pro platform (DJI Inc., Shenzhen, China) mounted with a Micro-Hyperspec hyperspectral camera (Headwall Inc., Bolton, MA, USA). The system was powered by 6 brushless electric rotors which allow autonomous vertical take-off and landing (Figure 1b). The hyperspectral sensor provides 270 spectral channels with wavelengths ranging from 400 to 1000 nm. The spectral sample interval (SSI) and the full width at half maximum (FWHM) are about 1.85 nm and 6 nm, respectively. The size and weight of the hyperspectral sensor are 76 × 76 × 87 mm and 0.52 kg, respectively, which makes it easy to integrate it and mount it onto a drone.
Flight missions were planned using DJI Go App (v3.1.81, DJI Inc., Shenzhen, China). The flight campaign was mostly conducted under clear sky conditions before field data collection from each sample site. It is noted that images affected by clouds would be excluded after quality control (Section 2.3). Each flight campaign was implemented with a horizontal speed of 2.2 m/s at the height of 50 m over the vegetation canopy. In this configuration, each flight took generally 10–15 min, which ensured relatively clear and stable light conditions during the experiment, especially considering the variable cloud conditions in the Hulun Lake basin.

2.3. Data Processing and Quality Control

Absolute radiometric calibration, reflectance calculation, and geometric correction were subsequently implemented using SpectralView software (v2.5, Headwall Inc., Bolton, MA, USA): (1) The digital numbers of the hyperspectral image were converted into radiance using the embedded calibration factors that were pre-calibrated in the laboratory. (2) Reflectance was calculated using a 3 × 3 m calibration panel placed at the sample site. The calibration panel constituted three different materials with a gradient reflectance (black 0.11, gray 0.32, and white 0.56). Firstly, the integration time of the camera was optimized automatically according to the illumination conditions by pointing the camera lens straight down at the white panel before each flight. Then, the calibration panel was moved and placed within the area of the sample site. The reference panel radiance obtained during the flight would be used for reflectance calculation. (3) The georectification and ortho-mosaicing of the images were completed using SpectralView software. Through these steps, digital orthophoto images of reflectance were generated. Similarly, we could acquire the digital orthophoto images of radiance by using SpectralView for radiance obtained in step (1).
Reflectance and radiance of the sample plots were extracted by selecting the data cube within a region of interest (ROI). In this study, the ROI was defined as the area within the white nylon rope (Figure 1d). Pixels in the buffer zone consisting of three pixels from the edge were excluded in order to mitigate the influence of the white rope. Moreover, several data control methods were applied to the selected spectra data cube to reduce the influence of unstable illumination conditions and to exclude inevitable data outliers. Criteria selected in this study included reflectance, signal-to-noise ratio, solar zenith angle (SZA), and illumination conditions (Table 1). SZA < 60 effectively prevented the effects of diffuse radiance reflected from both the vegetation canopy and the sky on the sensor, which is a commonly used criterion for spectral measurement.
The selected spectra for each plot were filtered and then averaged for deriving VIs to minimize the noise in the reflectance spectra. This experiment collected 38 spectral-AGB data sequences with the 410–810 nm band after quality control.

2.4. Vegetation Indices, Reflectance Derivatives, and Near-Infrared Radiance (Lnir)

To facilitate a systematic comparison, the vegetation indices used in this study were classified into five groups according to their functional characteristics and spectral sensitivity, including greenness-related indices, structure-related indices, chlorophyll-related indices, light-use efficiency-based indices, and combined indices. This classification helps clarify the role of different spectral and biophysical properties in AGB estimation. These five groups (Table 2) are as follows: (1) NDVI series, including NDVI, red-edge NDVI (NDVIrededge), and optimized soil adjusted vegetation index (OSAVI); (2) vegetation reflectance, represented by near-infrared reflectance of vegetation (NIRv); (3) chlorophyll content, including green chlorophyll index (CIgreen), red-edge chlorophyll index (CIrededge), and MERIS terrestrial chlorophyll index (MTCI); (4) canopy structure, including modified triangular vegetation index 2 (MTVI2) and fluorescence correction vegetation index (FCVI); and (5) light-use efficiency, represented by the photochemical reflectance index (PRI). The equations and wavelengths used for these vegetation indices are listed in Table 2.
The first (ρ′) and second (ρ″) derivatives of reflectance were calculated to enhance spectral features related to vegetation biochemical and structural properties. The first derivative emphasizes changes in spectral slope associated with absorption features, while the second derivative highlights curvature and reduces background and illumination effects. Reflectance derivatives have been widely applied in hyperspectral vegetation studies to improve sensitivity to canopy properties related to biomass.
In this study, all vegetation indices were calculated exclusively from surface reflectance. Near-infrared radiance (Lnir) refers specifically to the radiometrically calibrated at-sensor radiance in the near-infrared band (770–790 nm), which was used as an independent explanatory variable and combined with reflectance-based vegetation indices to improve AGB estimation.

2.5. Vegetation Species and Diversity

Menhinick’s index (DMn) emerged after a comparative study on diversity indices [29], and became a commonly used index describing the species diversity at the analysis scale. It is defined as the ratio of the number of species (S) and the square root of the total number of plant individuals (N).
D M n = S / N
In this study, DMn was utilized to measure the grass diversity of the small plot. The higher the DMn value, the higher the diversity in the plot.

2.6. Data Analysis

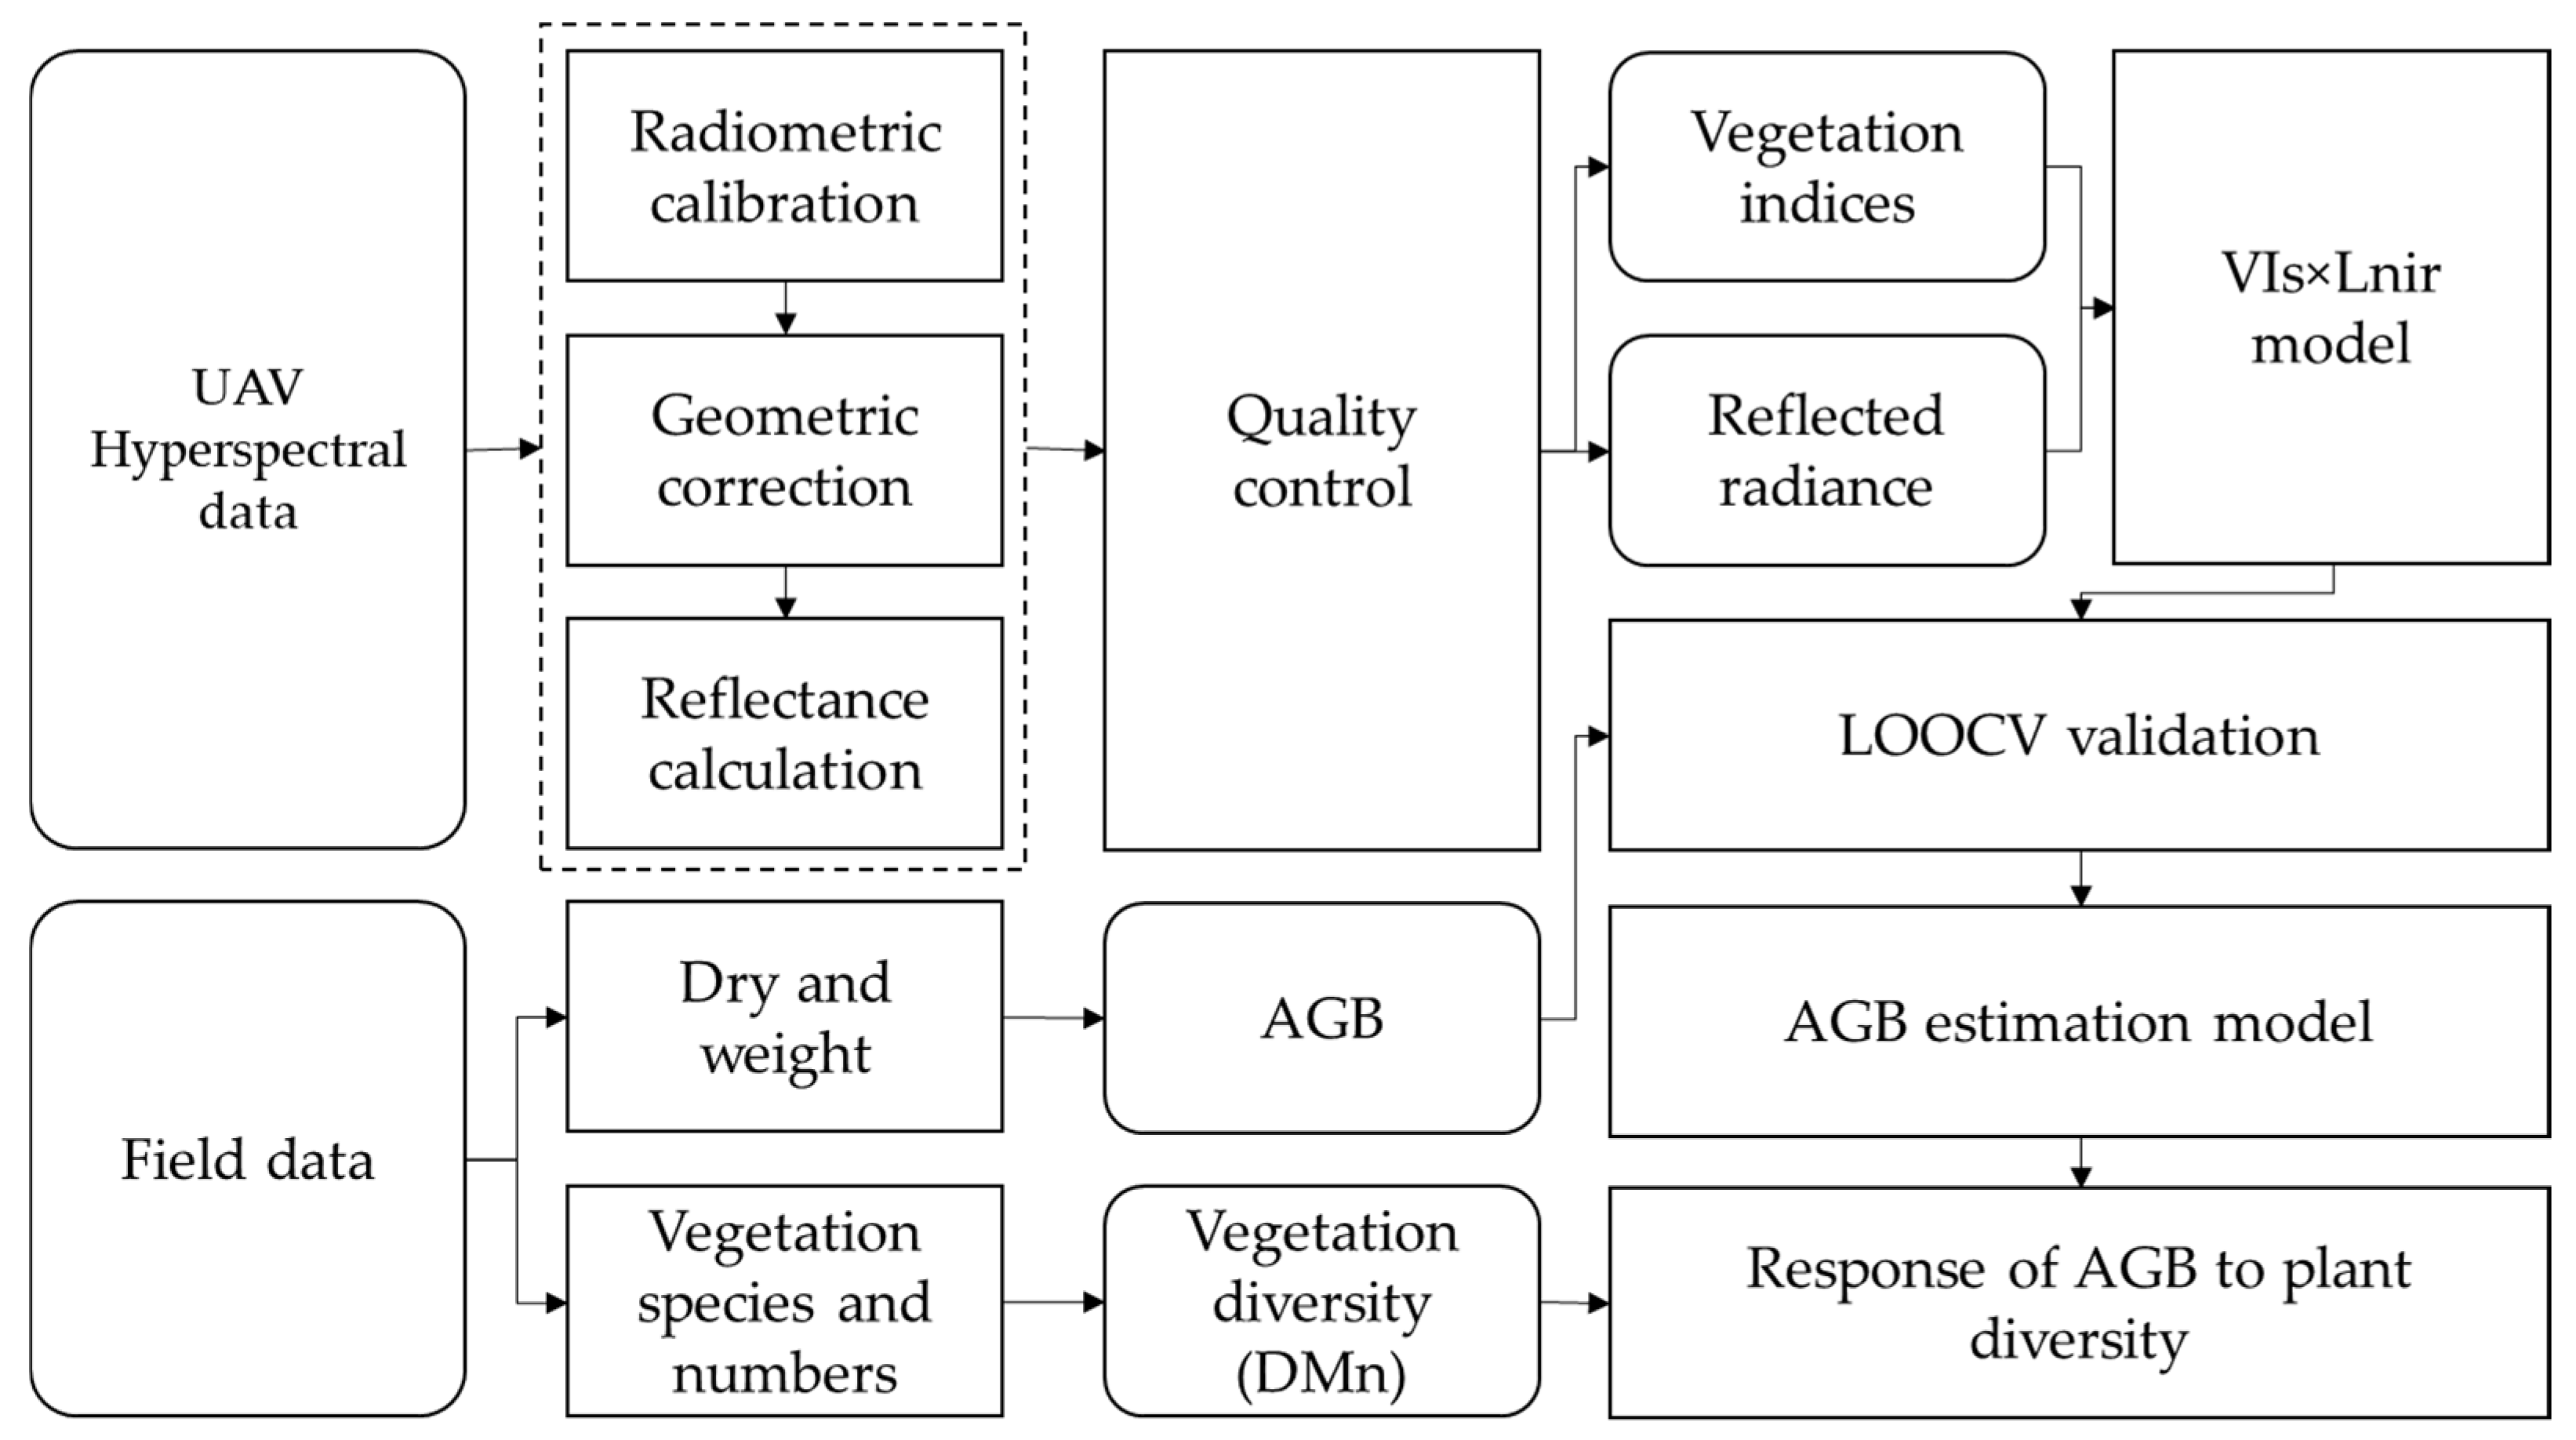
To ensure the robustness of the AGB estimation, we followed a stringent procedure encompassing data acquisition, spectral processing, model construction, and validation. The entire research methodology and data processing procedure is detailed in Figure 2. Linear regression was utilized to derive the relationship between AGB and other variables. The coefficient of determination (R2) and root mean square error (RMSE) of the regression were used to evaluate the performance of the AGB estimation. R2 indicated the stability of the model, and RMSE was used to measure the accuracy of the model. The higher the R2 and the lower the RMSE, the better the prediction ability of the estimation model. Leave-one-out cross-validation (LOOCV) was used for AGB model validation. To analyze the influence of plant diversity, the AGB estimation uncertainty (absolute deviation) was specifically calculated using the results from the NDVI×Lnir model, which served as the most widely recognized baseline model among the standard VIs tested. All analysis and visualization works were completed using Python (v3.7.9).

3. Results

3.1. AGB, Hyperspectral Data, and Vegetation Indices

The field data collection yielded a total of 38 valid samples for AGB after quality control. The statistical summary of the measured AGB (in g/m2) showed a high degree of heterogeneity across the sampling plots: the AGB values ranged from a minimum of 9.55 g/m2 to a maximum of 61.71 g/m2. The mean AGB was 29.26 g/m2, with a standard deviation of 14.48 g/m2.
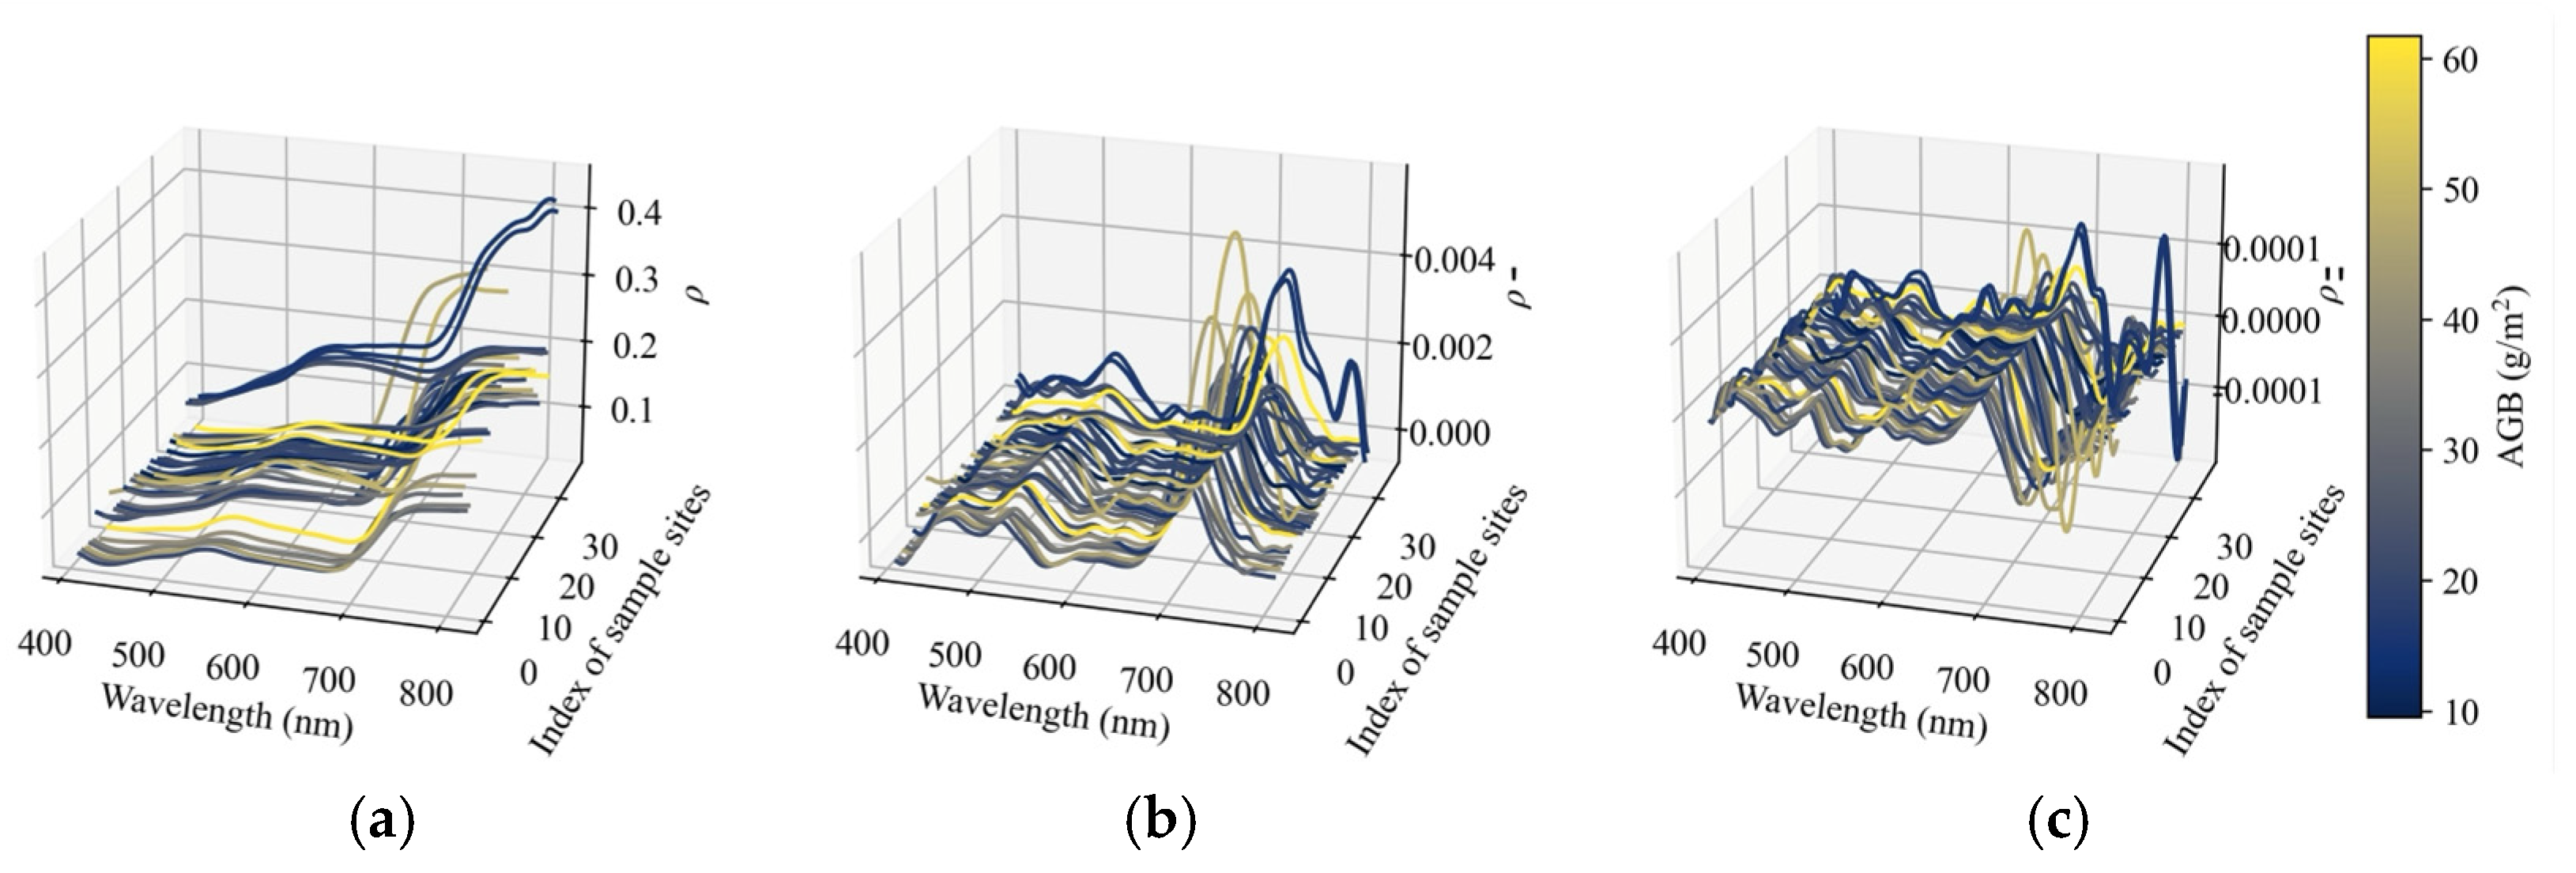
Overall, the spectral variation in the 410–810 domains of the sample plots is relatively small, which was observed in figures of single-band reflectance (ρ), the first derivative of ρ (ρ′), and the second derivative of ρ (ρ″) (Figure 3). Only a small difference was noticeable in the NIR domains (>700 nm) for ρ′. The color bar indicated the AGB value of the corresponding sample plot. Few links between AGB and the hyperspectral data were observed, especially for the ρ″ of the reflectance. However, it is noteworthy that the variations in AGB values among the sample plots are more clearly revealed by differences in ρ′ in the NIR region than by the relatively consistent variations of ρ and ρ′ in the visible part of the spectra.
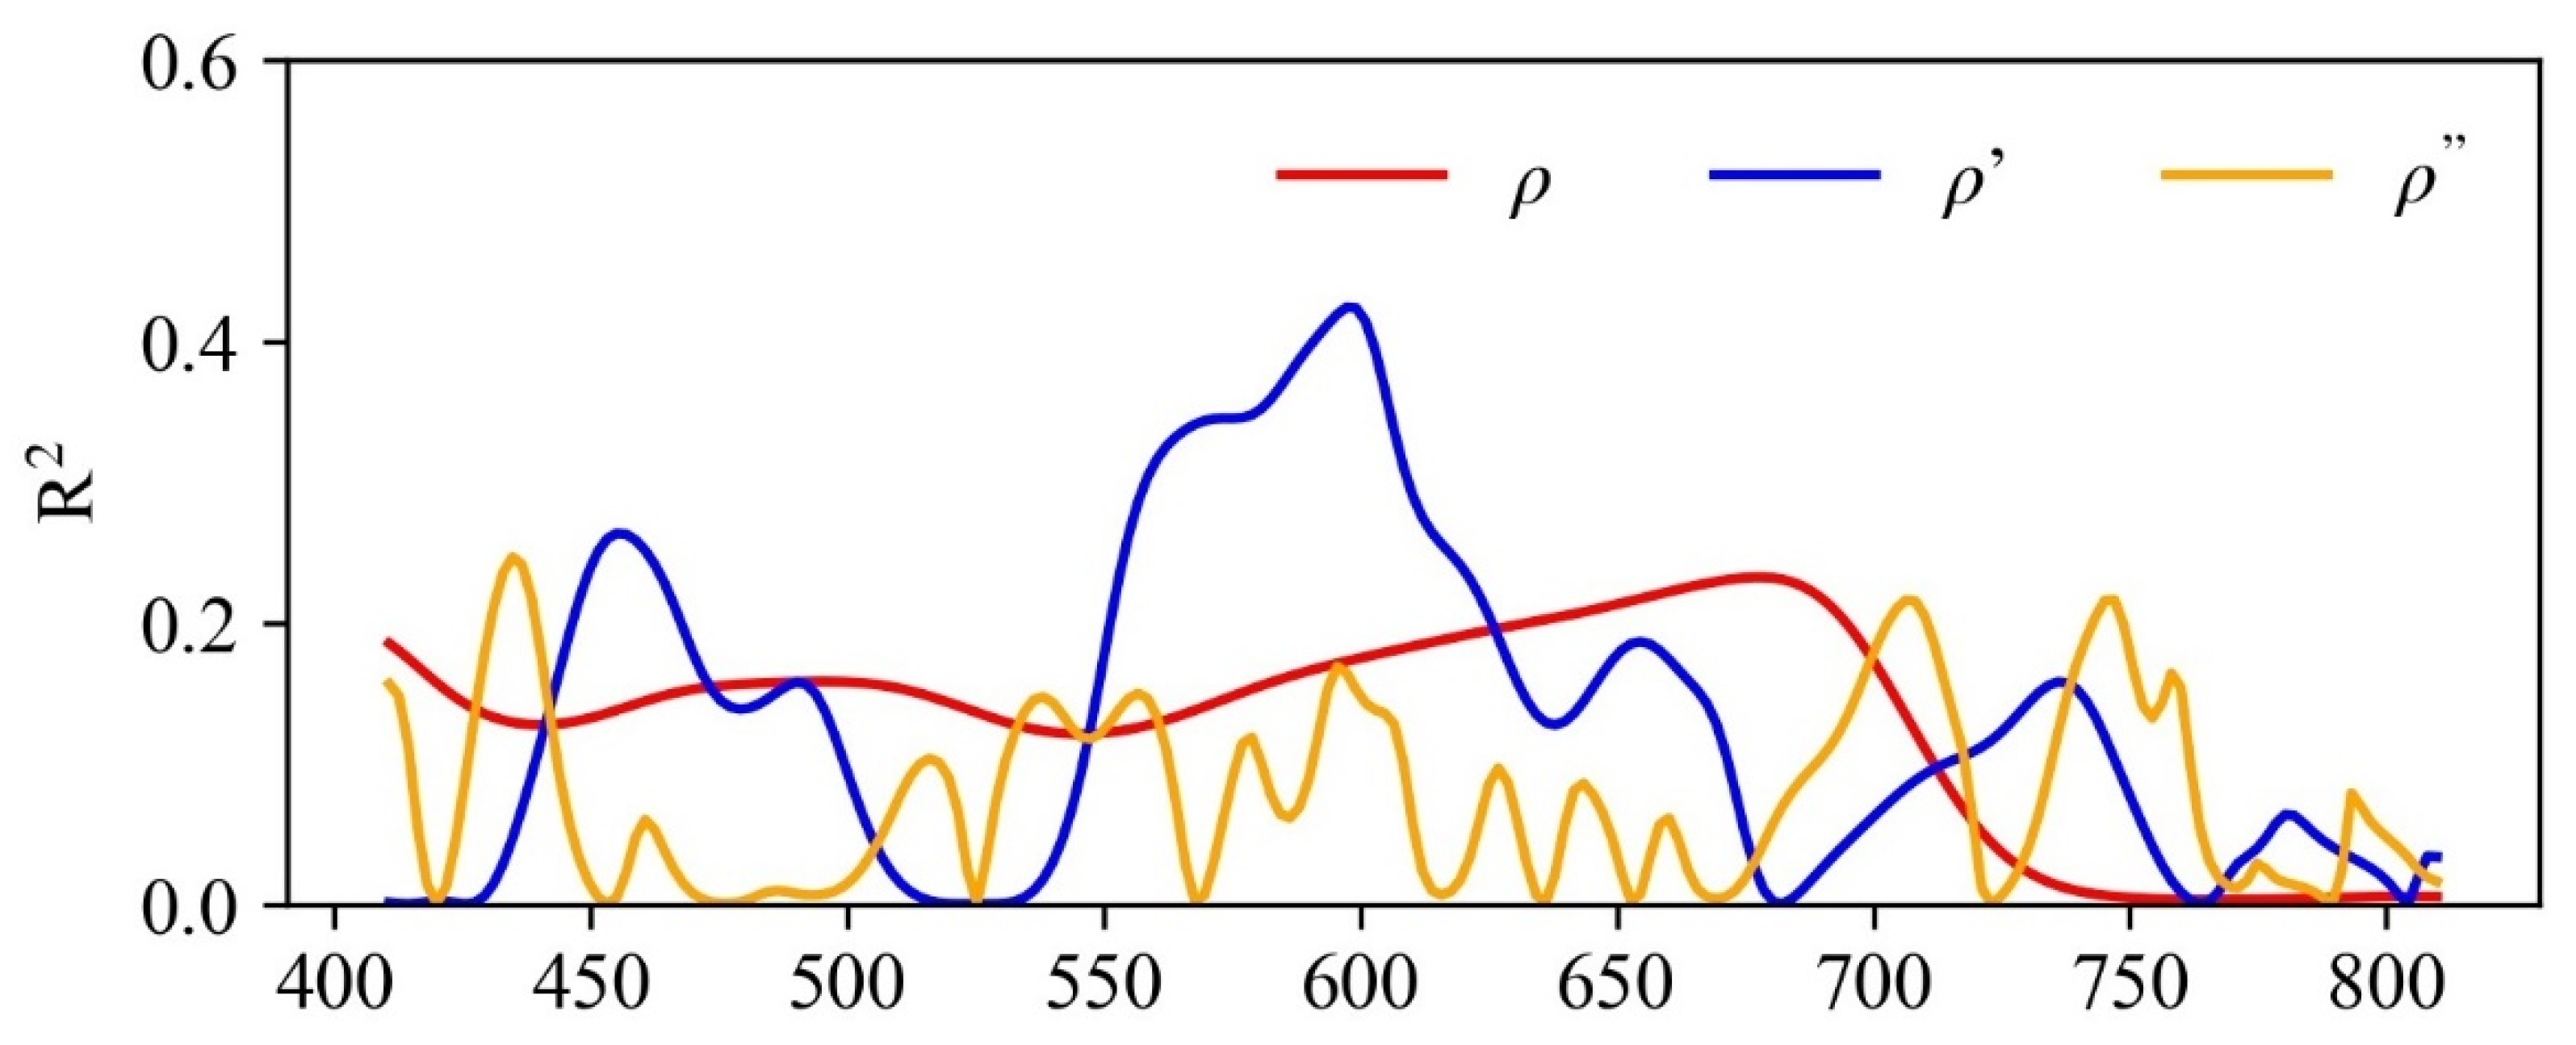
The correlations between AGB and ρ, ρ′, and ρ″ were then investigated to demonstrate the basic relationships of AGB-reflectance and its derivatives (Figure 4). The results showed that ρ, ρ′, and ρ″ show weak correlation with AGB across the 410–810 nm range. The R2 values of ρ and AGB were lower than 0.23, varying slightly between 0.12 and 0.23 in the 400–700 nm band and nearing 0 in the 750–810 nm band. Generally, the variation of the ρ-AGB R2 was relatively stable, except for a rapid descent in the 700–750 nm band. The correlation of ρ′ and AGB is fluctuant in the 410–810 nm band and reached its maximum of 0.42 at roughly 600 nm. In contrast, the relationship between ρ″ and AGB in the 410–810 nm range showed a much more undulated pattern than that of ρ-AGB and ρ′-AGB. The maximum R2 of ρ″-AGB was only 0.24, which is close to the maximum R2 of ρ-AGB.
Among ρ, ρ′, and ρ″, ρ′ exhibited the strongest relationship with AGB at certain bands, especially in the 570–600 nm band, with approximately 40% of the AGB variation explained. The results indicated that the correlation between the reflectance and AGB could be improved using the band compositions whose formula pattern was close to the first derivative (namely, (ρa − ρa)/(a − b)) of the reflectance.
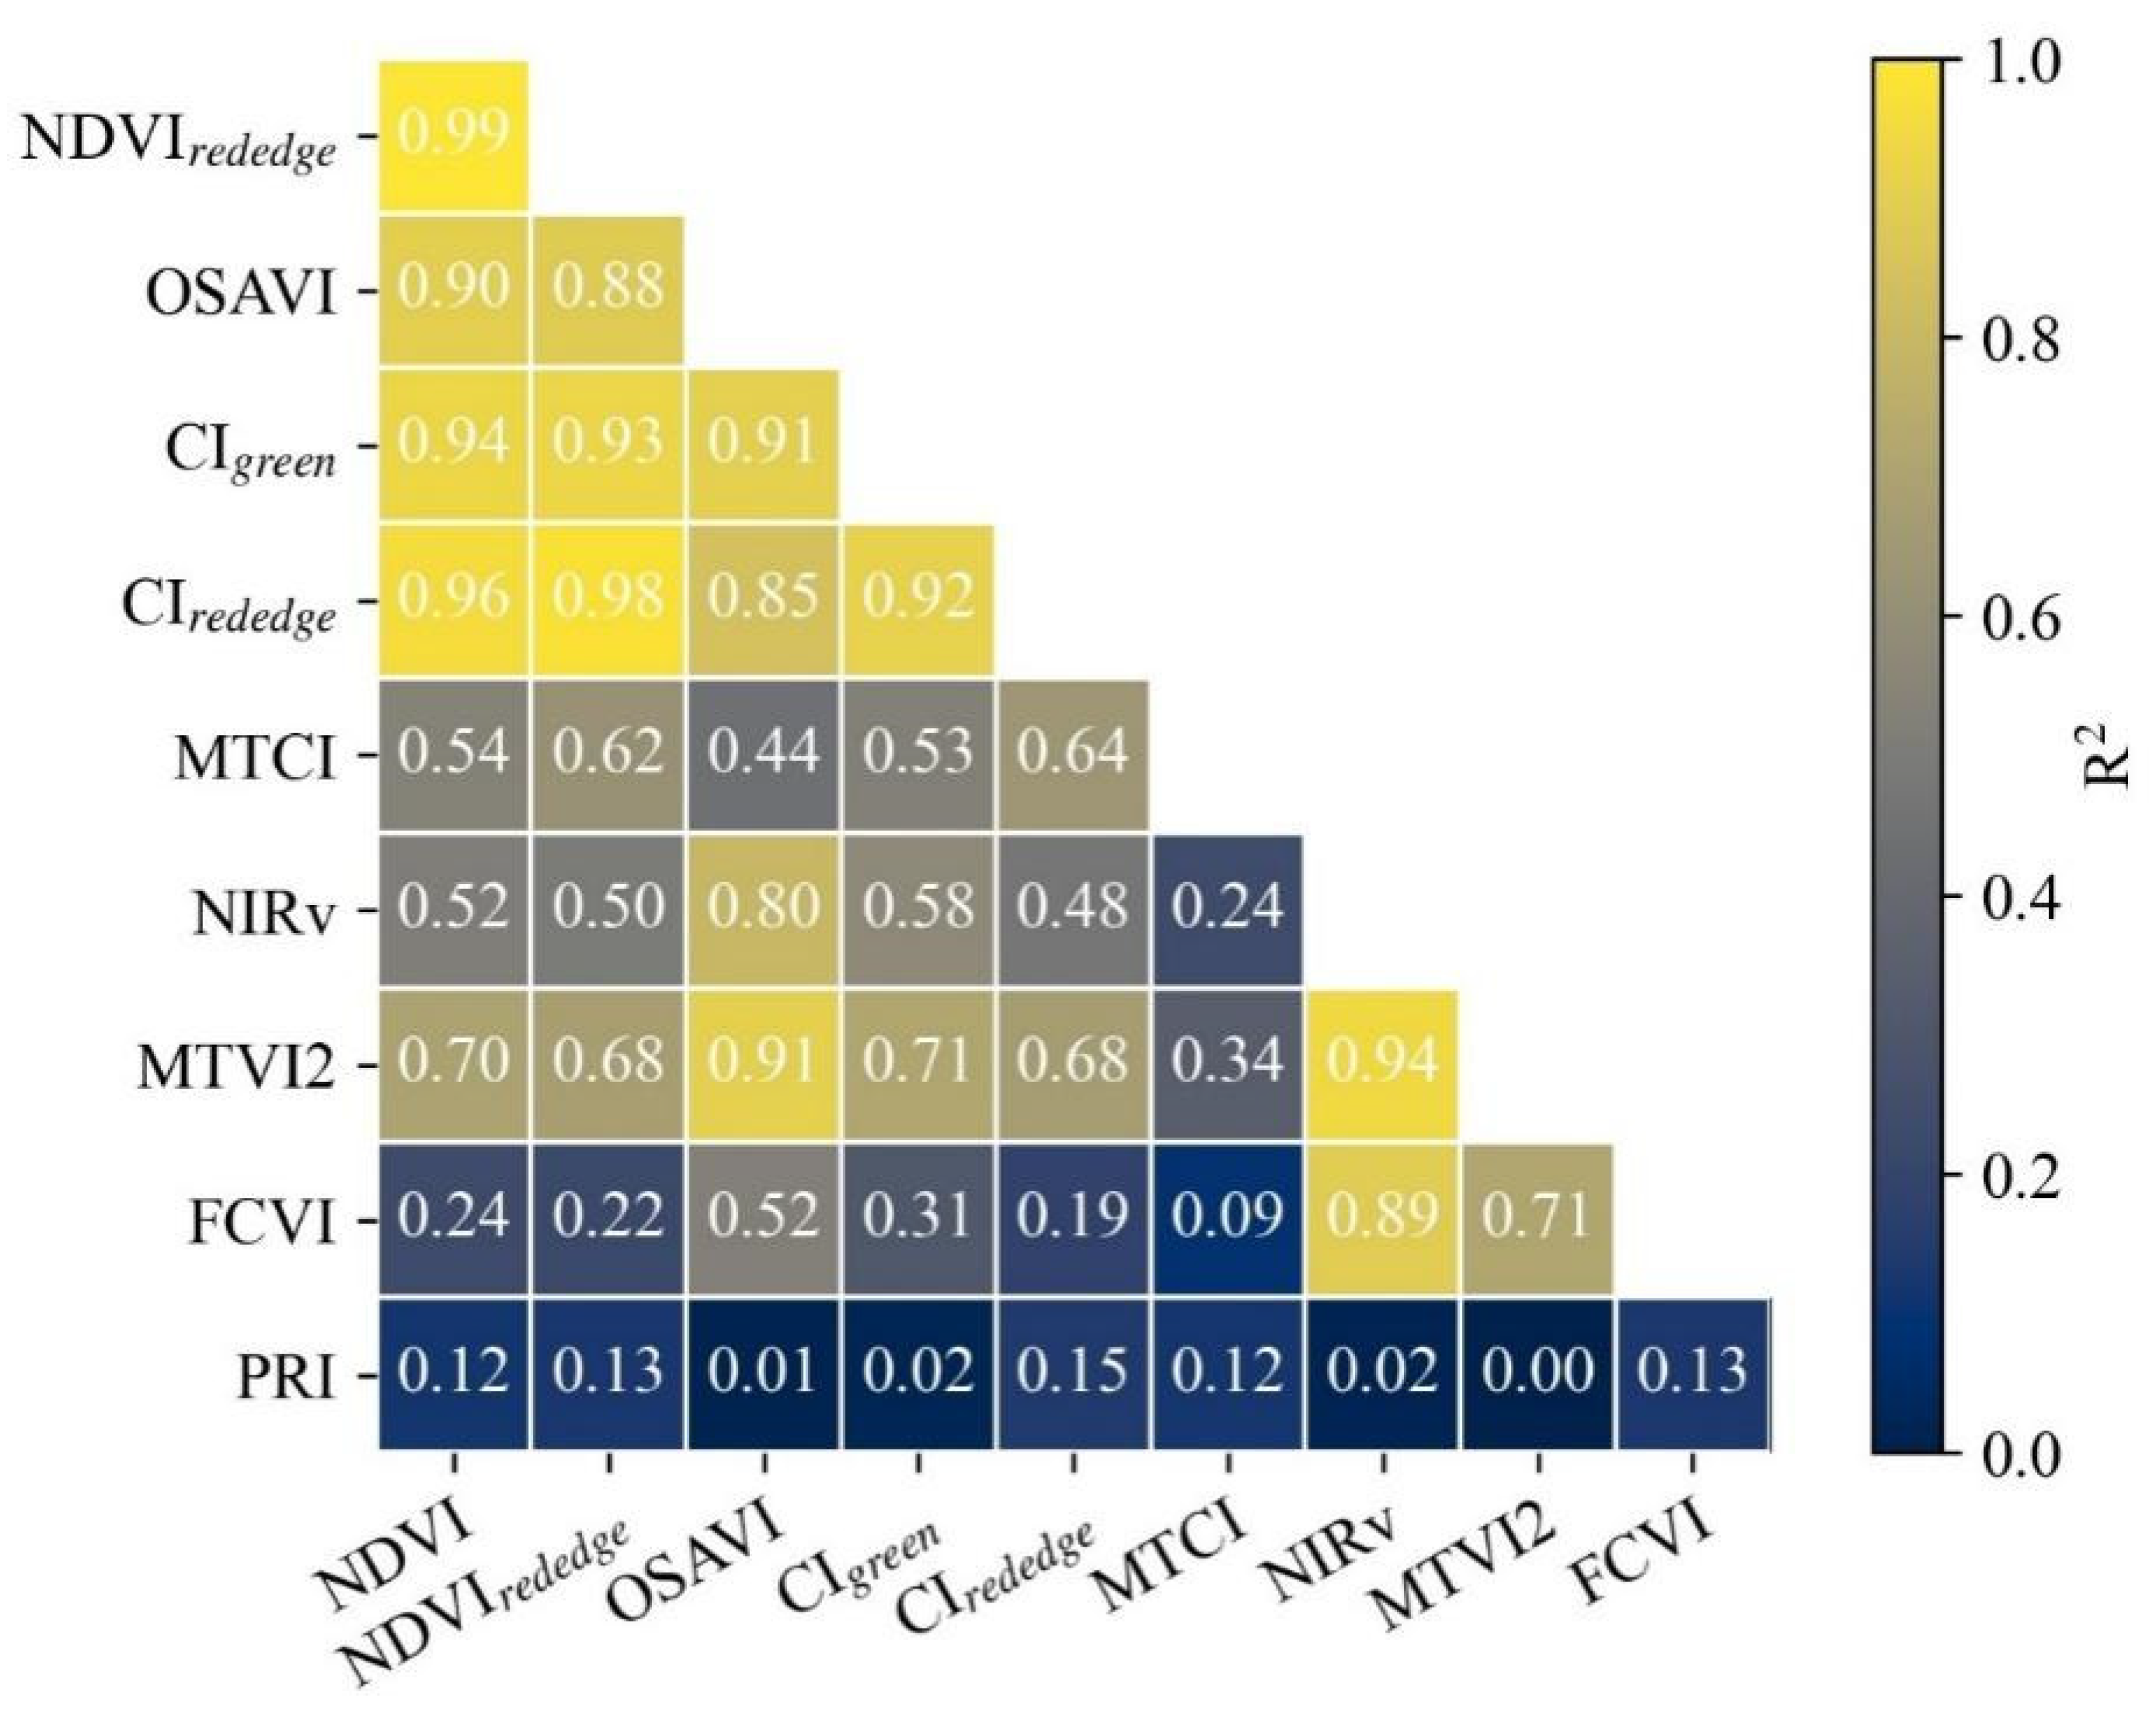
The correlation between the vegetation indices under study was investigated for the 38 sample plots (Figure 5). The results show that NDVI series (NDVI, NDVIrededge and OSAVI) and chlorophyll content indices (CIgreen and CIrededge) are strongly correlated to each other because the R2 values are higher than 0.85. Similar high-correlation relationships are observed between NIRv and structural indices (MTVI2 and FCVI), with R2 values higher than 0.89. In contrast, the biochemical indices related to light-use efficiency (PRI) show a substantially lower correlation with other vegetation indices. MTCI shows a high correlation with NDVI series and chlorophyll content indices (0.44–0.64) and a relatively lower correlation with vegetation indices representing canopy structure and light-use efficiency (0.09–0.34).

3.2. Combining Near-Infrared Radiance and VIs Improved AGB Estimation

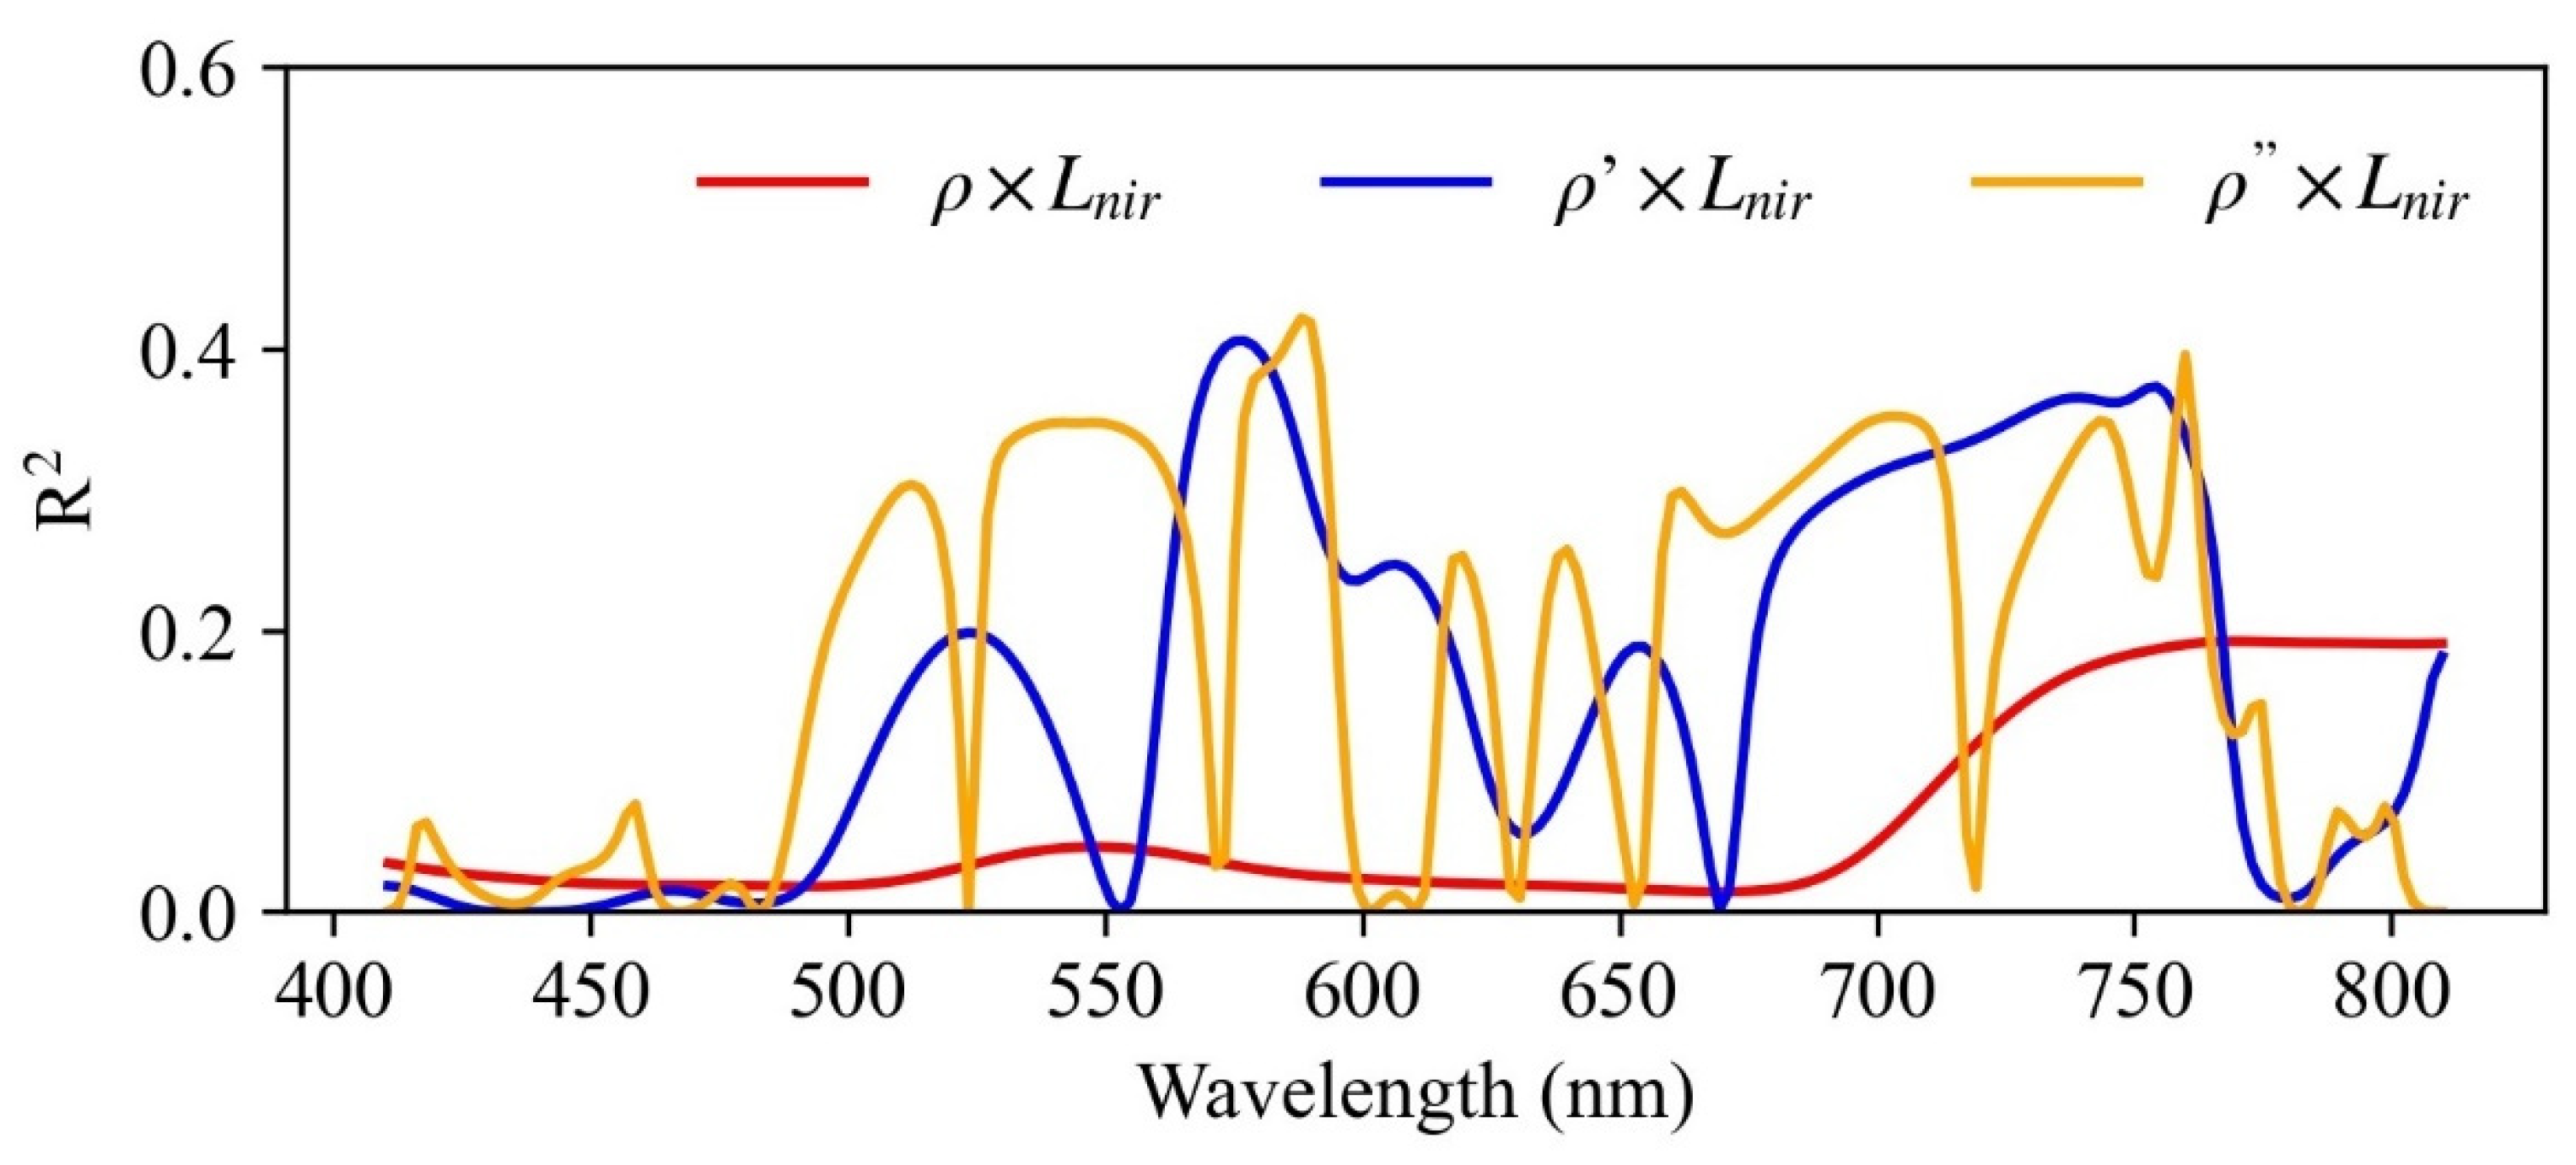
In order to investigate the influence of near-infrared radiance (Lnir) on AGB estimation based on single-band ρ, ρ′, and ρ″, the R2 values of ρ (ρ′, ρ″) × Lnir-AGB were derived across the 410–810 nm range, as shown in Figure 6. A significant improvement in the R2 values was observed compared to that without coupling Lnir, shown in Figure 4, except for the ρ-AGB relationship. The correlation of ρ × Lnir-AGB demonstrated an almost reversed pattern compared to that of ρ-AGB, with a value close to 0 in the 400–700 nm range, increasing rapidly to around 0.2 in the 700–750 nm range, and maintaining consistency at 0.2 in the 750–810 nm range. The maximum of R2 for ρ′ × Lnir-AGB regression was 0.41, which is slightly lower than that for ρ′-AGB regression. The band of the R2 maximum shifted left from 600 nm to 575 nm. The fluctuant characteristic of ρ″ × Lnir-AGB was the same as that of ρ″-AGB, while an obvious improvement in maximum R2 (0.42) was observed.
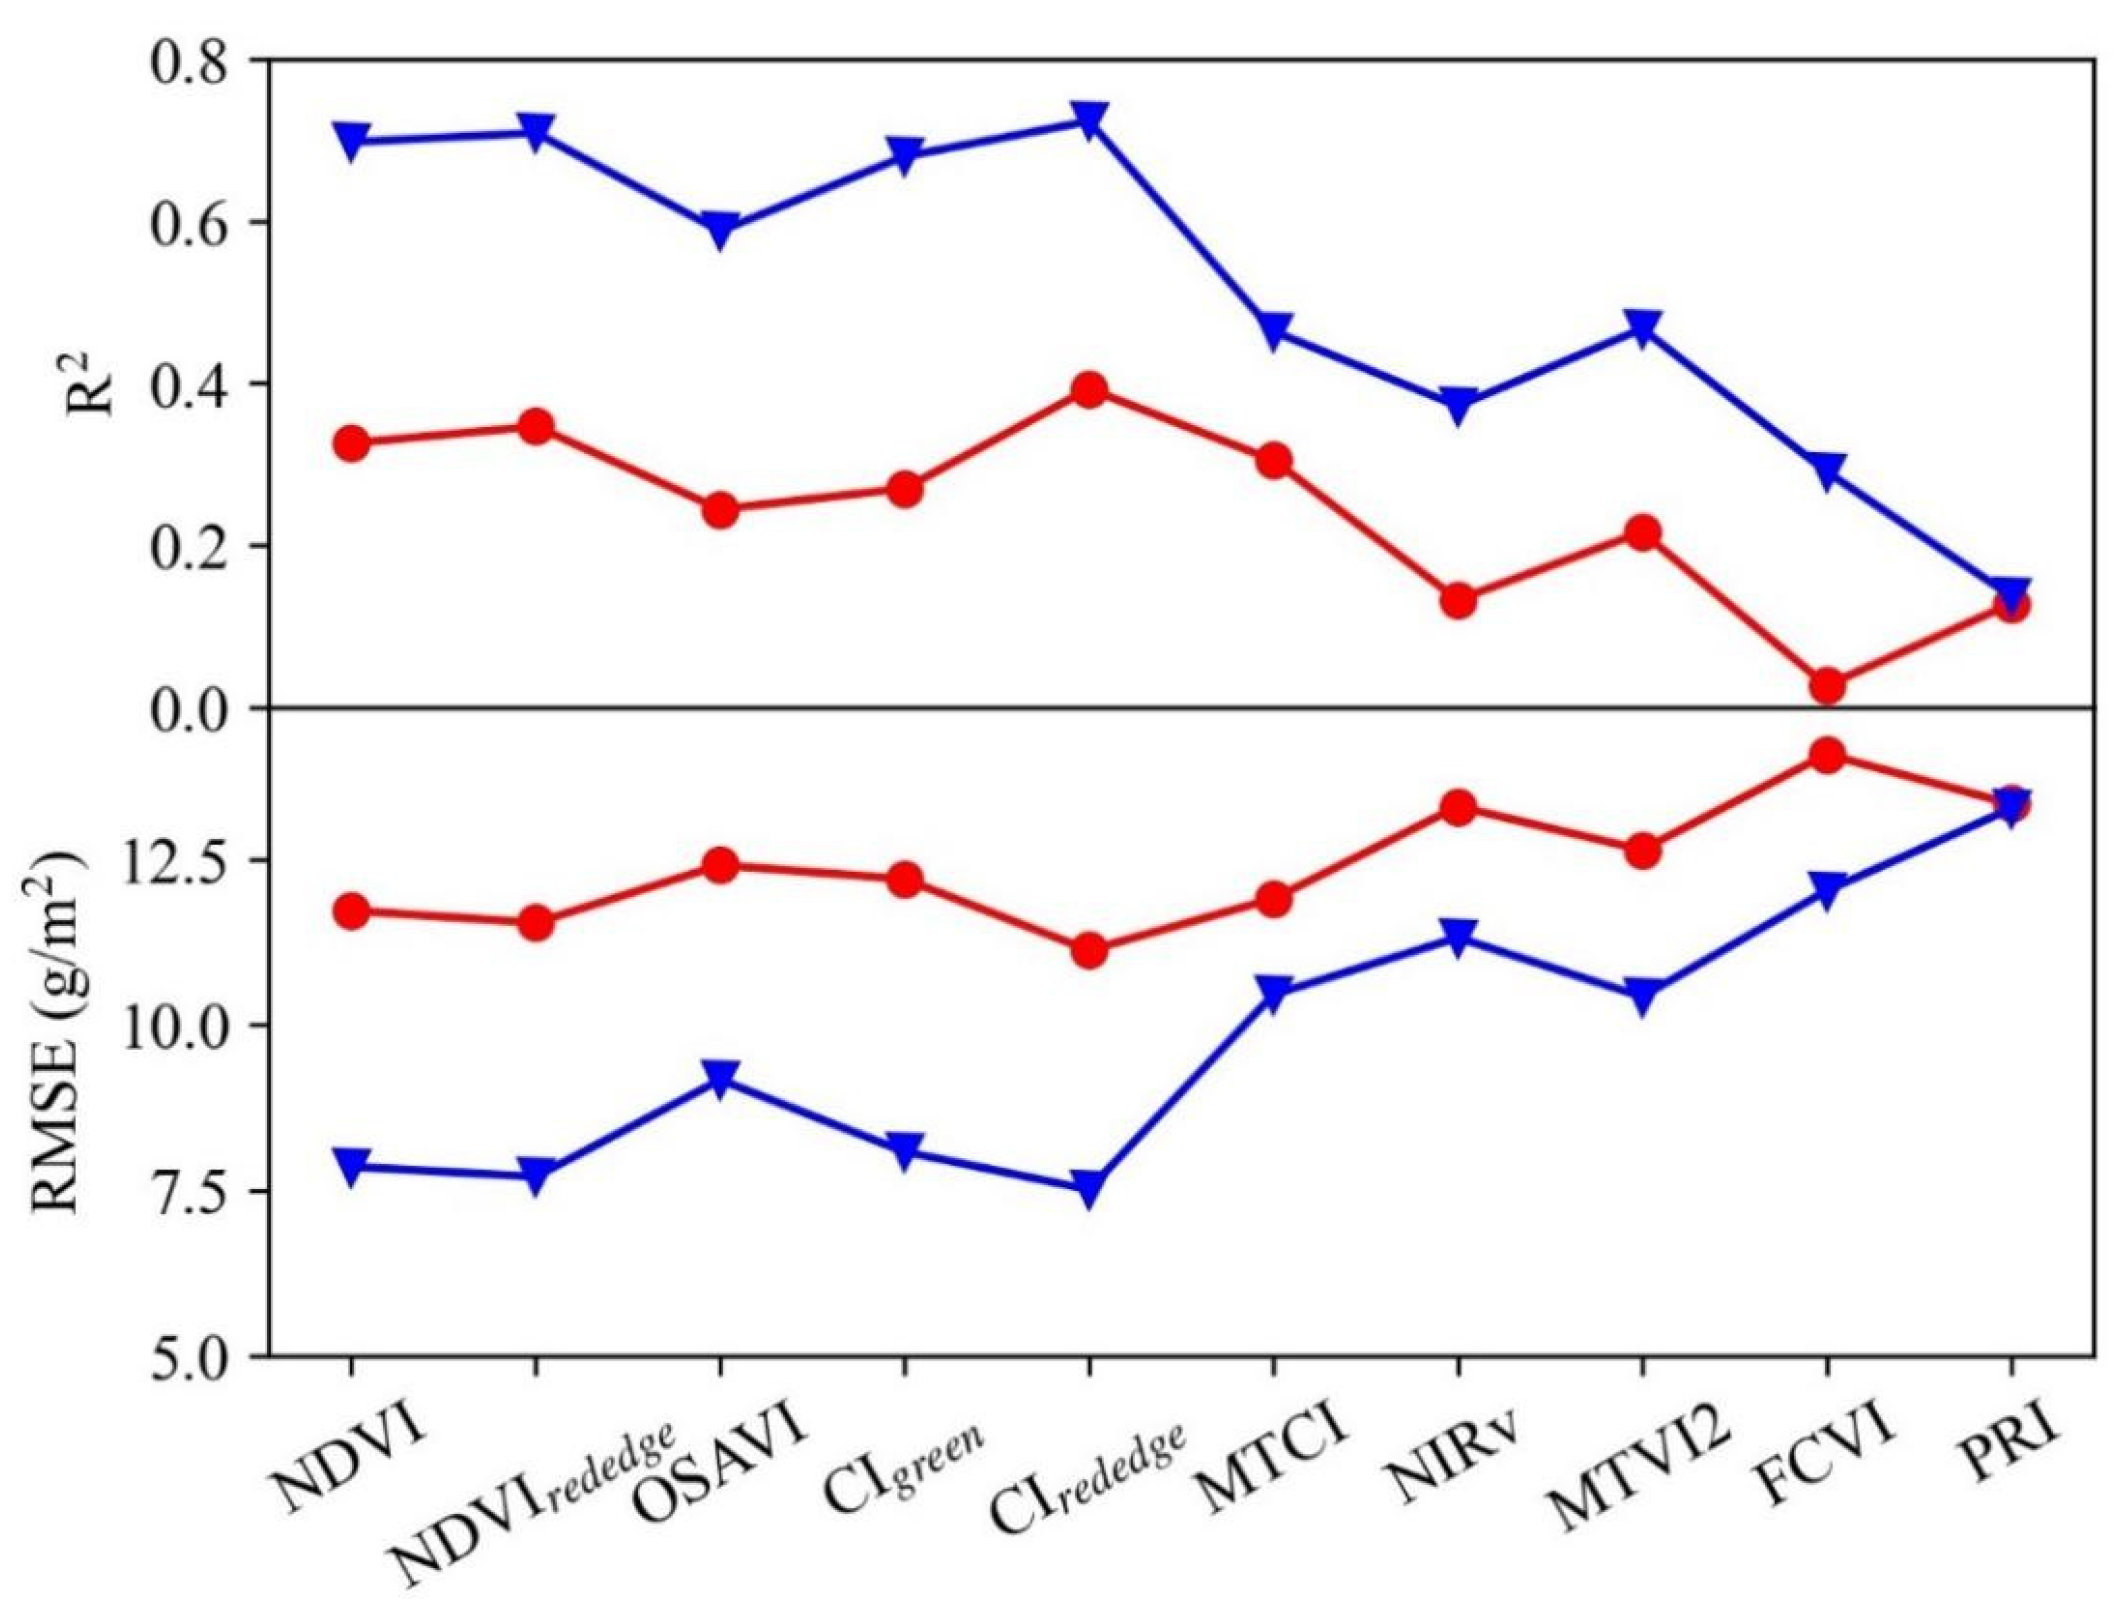
The influence of Lnir on AGB estimation based on vegetation indices was exhibited as Figure 7. VIs including NDVI series (NDVI, NDVIrededge, and OSAVI) and indices revealing chlorophyll content (CIgreen, CIrededge, and MTCI) showed a general promotion of AGB estimation compared to using a single band of ρ, with R2 varying in 0.24–0.39 and RMSE varying in 11.13–12.41 g/m2. In contrast, VIs representing vegetation reflectance (NIRv), canopy structure (MTVI2 and FCVI) and light-use efficiency (PRI) turned out to show relatively lower correlation with AGB, with R2 varying in 0.02–0.22 and RMSE larger than 12.65 g/m2. Coupling Lnir and VIs in AGB estimation demonstrated a conspicuous improvement of both R2 and RMSE compared to that based on VIs only, especially for VIs of NDVI series and chlorophyll content indices. The R2 increased to higher than 0.68, with a maximum of 0.72, for NDVI, NDVIrededge, CIgreen and CIrededge. Meanwhile, the RMSE of these four indices decreased to lower than 8.08 g/m2, with a minimum of 7.52 g/m2. It was noted that the improvement effect of Lnir on VIs-AGB correlation was also observed for VIs, such as MTCI, NIRv, MTVI2, and FCVI, with R2 higher than 0.29 and RMSE lower than 12.03 g/m2. However, there seemed to be little improvement of R2 and RMSE for PRI, with R2 changing from 0.13 to 0.14 and RMSE changing from 13.24 g/m2 to 13.27 g/m2.
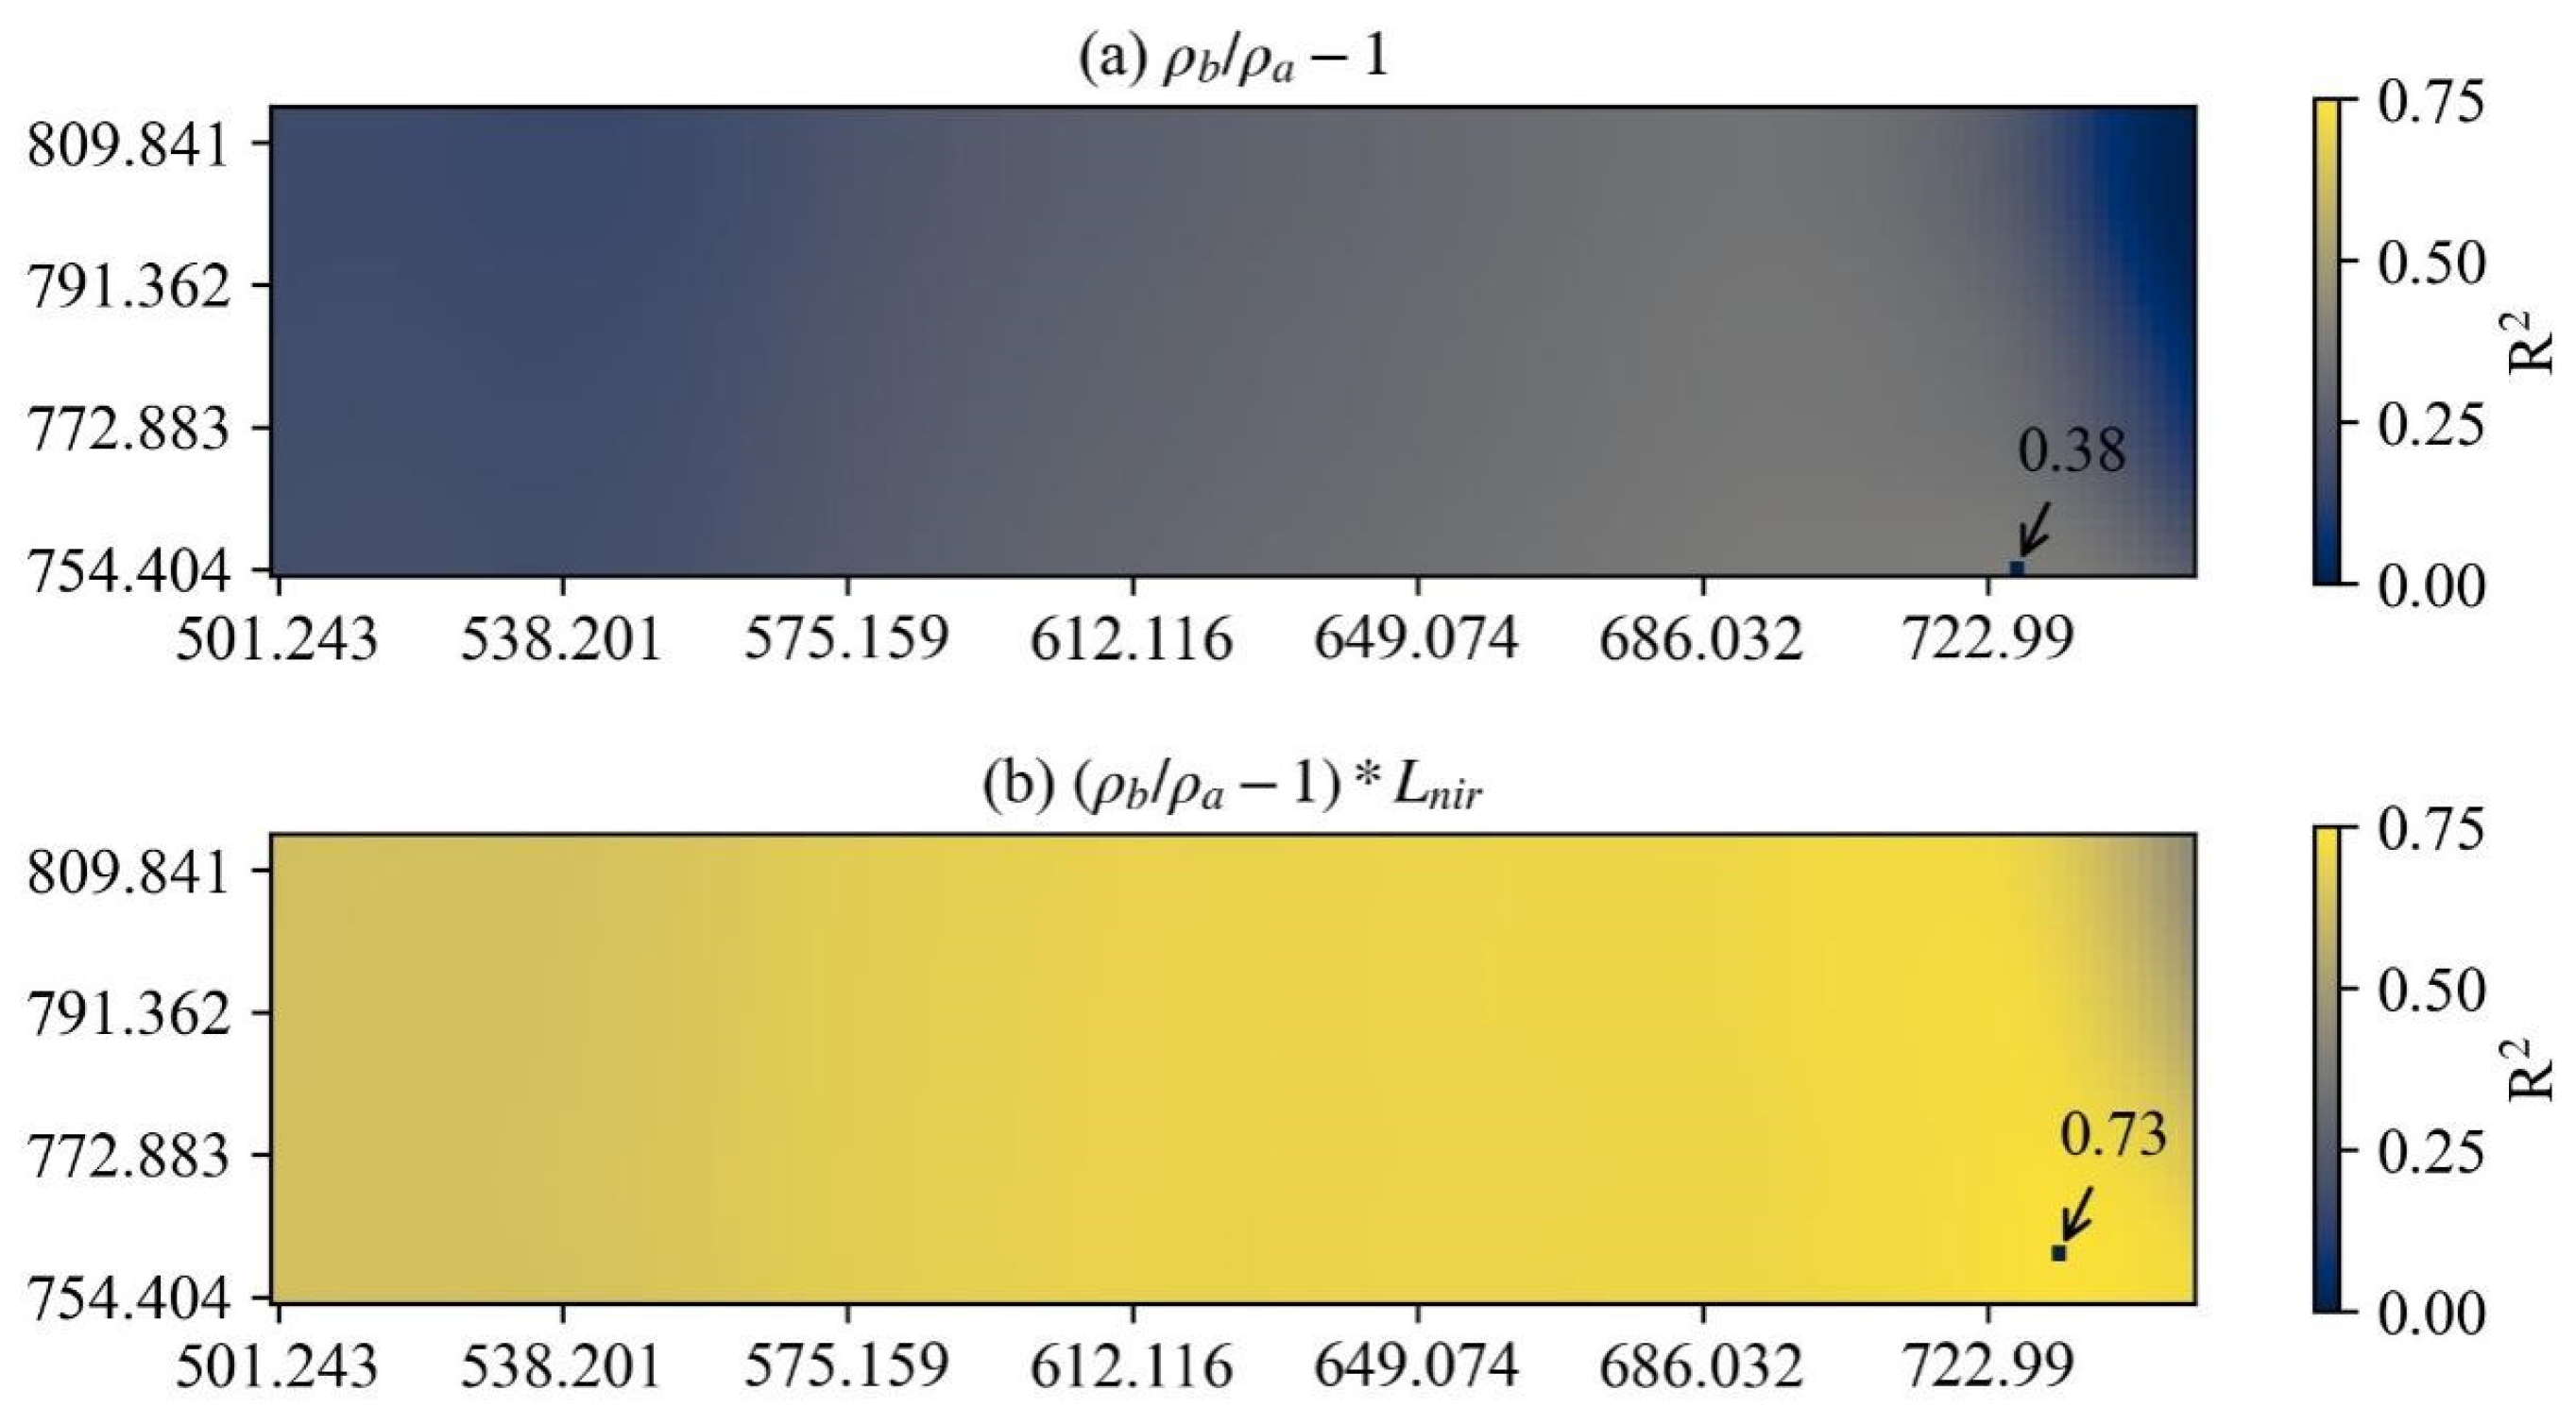
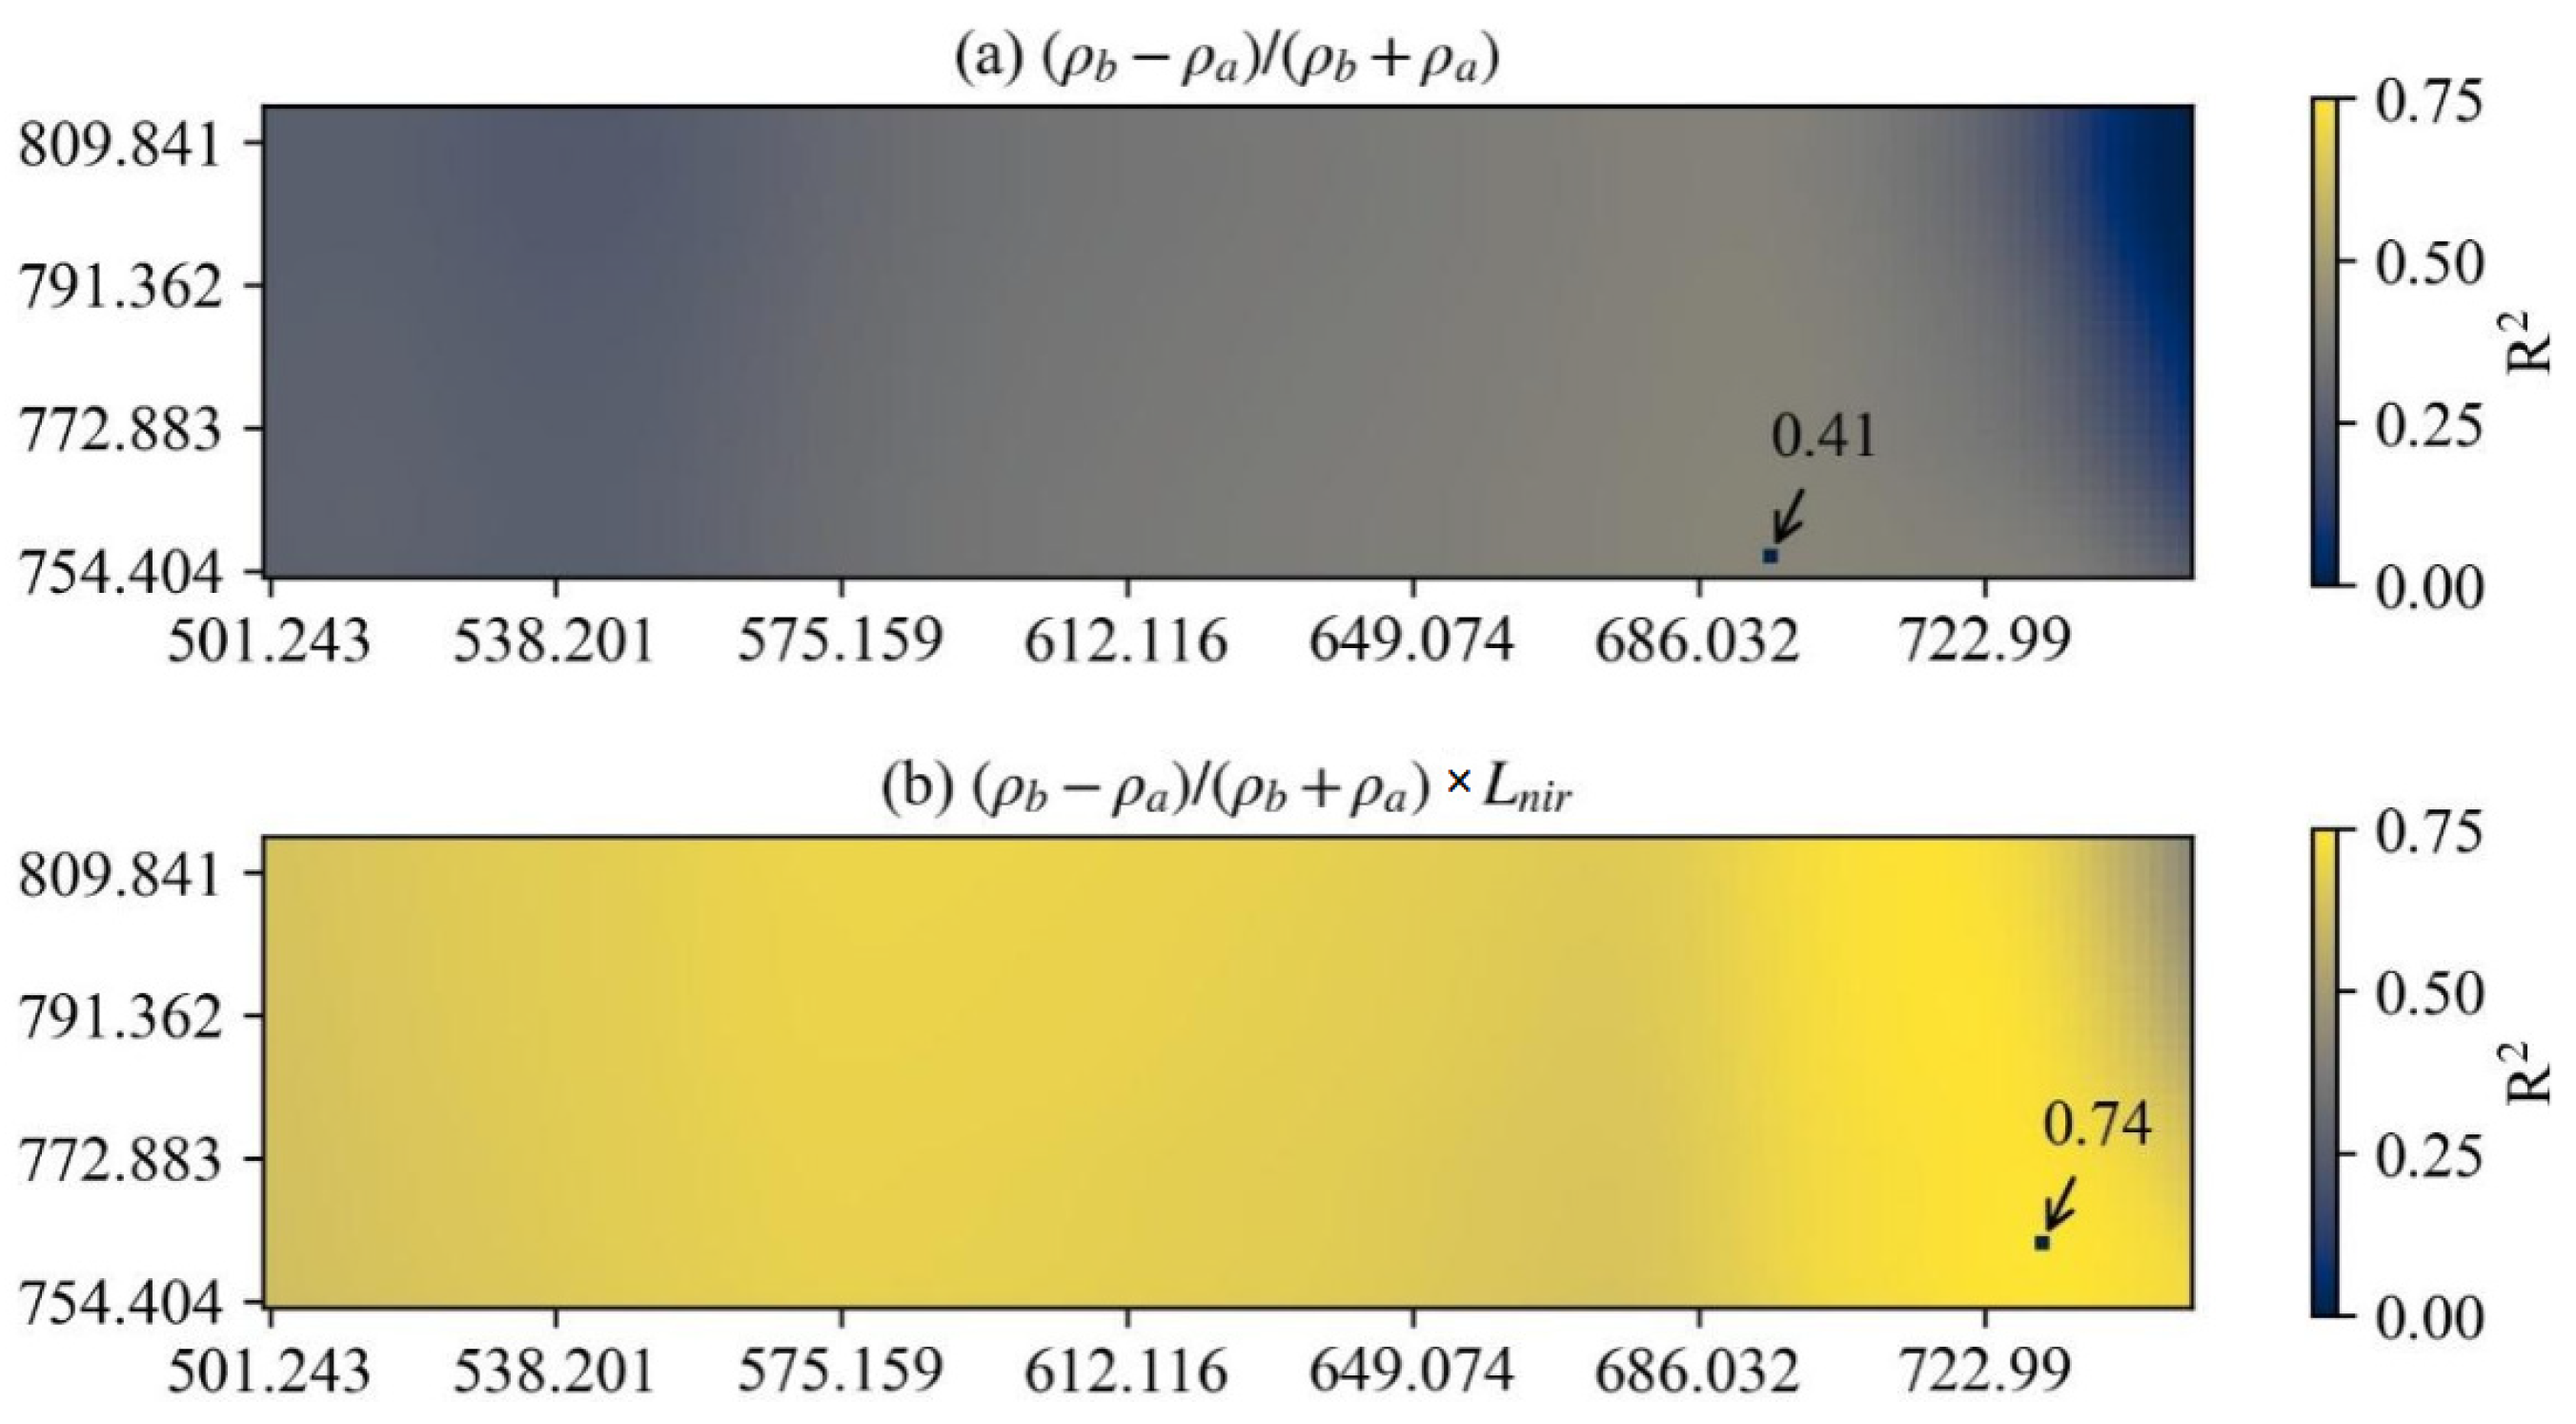
Considering the relatively better performance of chlorophyll content indices (CIgreen and CIrededge) and NDVI series (NDVI and NDVIrededge), a further band sensitivity analysis was derived using the basic CI-like formula (ρa − ρb − 1) and NDVI-like formula (ρa − ρb)/(ρa + ρb). The matrix of R2 between AGB and spectral index combinations across different wavelength pairs is visualized in Figure 8 and Figure 9. From the perspective of CI-like indices, the high R2 values are relatively concentrated in the 720–730 nm domain, with maxima of 0.38 (Figure 8a) and 0.73 (Figure 8b) for VIs and VIs×Lnir, respectively. The R2 of VIs×Lnir-AGB regression reached its maximum when ρa and ρb were located at 730.38 nm and 759.95 nm bands. Similar results were also observed for NDVI-like indices. The high value of R2 showed a concentration in roughly the same domains, namely 720–730 nm. The maximum of R2 was 0.74 (Figure 9b) for CI-like VIs×Lnir when ρa and ρb were located at 732.23 nm and 758.10 nm, which is very close to the maximum for NDVI-like VIs×Lnir. In addition, combining Lnir with VIs using different bands can improve the correlation to varying degrees with AGB for both CI-like indices and NDVI-like indices (Figure 8 and Figure 9).

3.3. Response of Grassland AGB to Plant Diversity

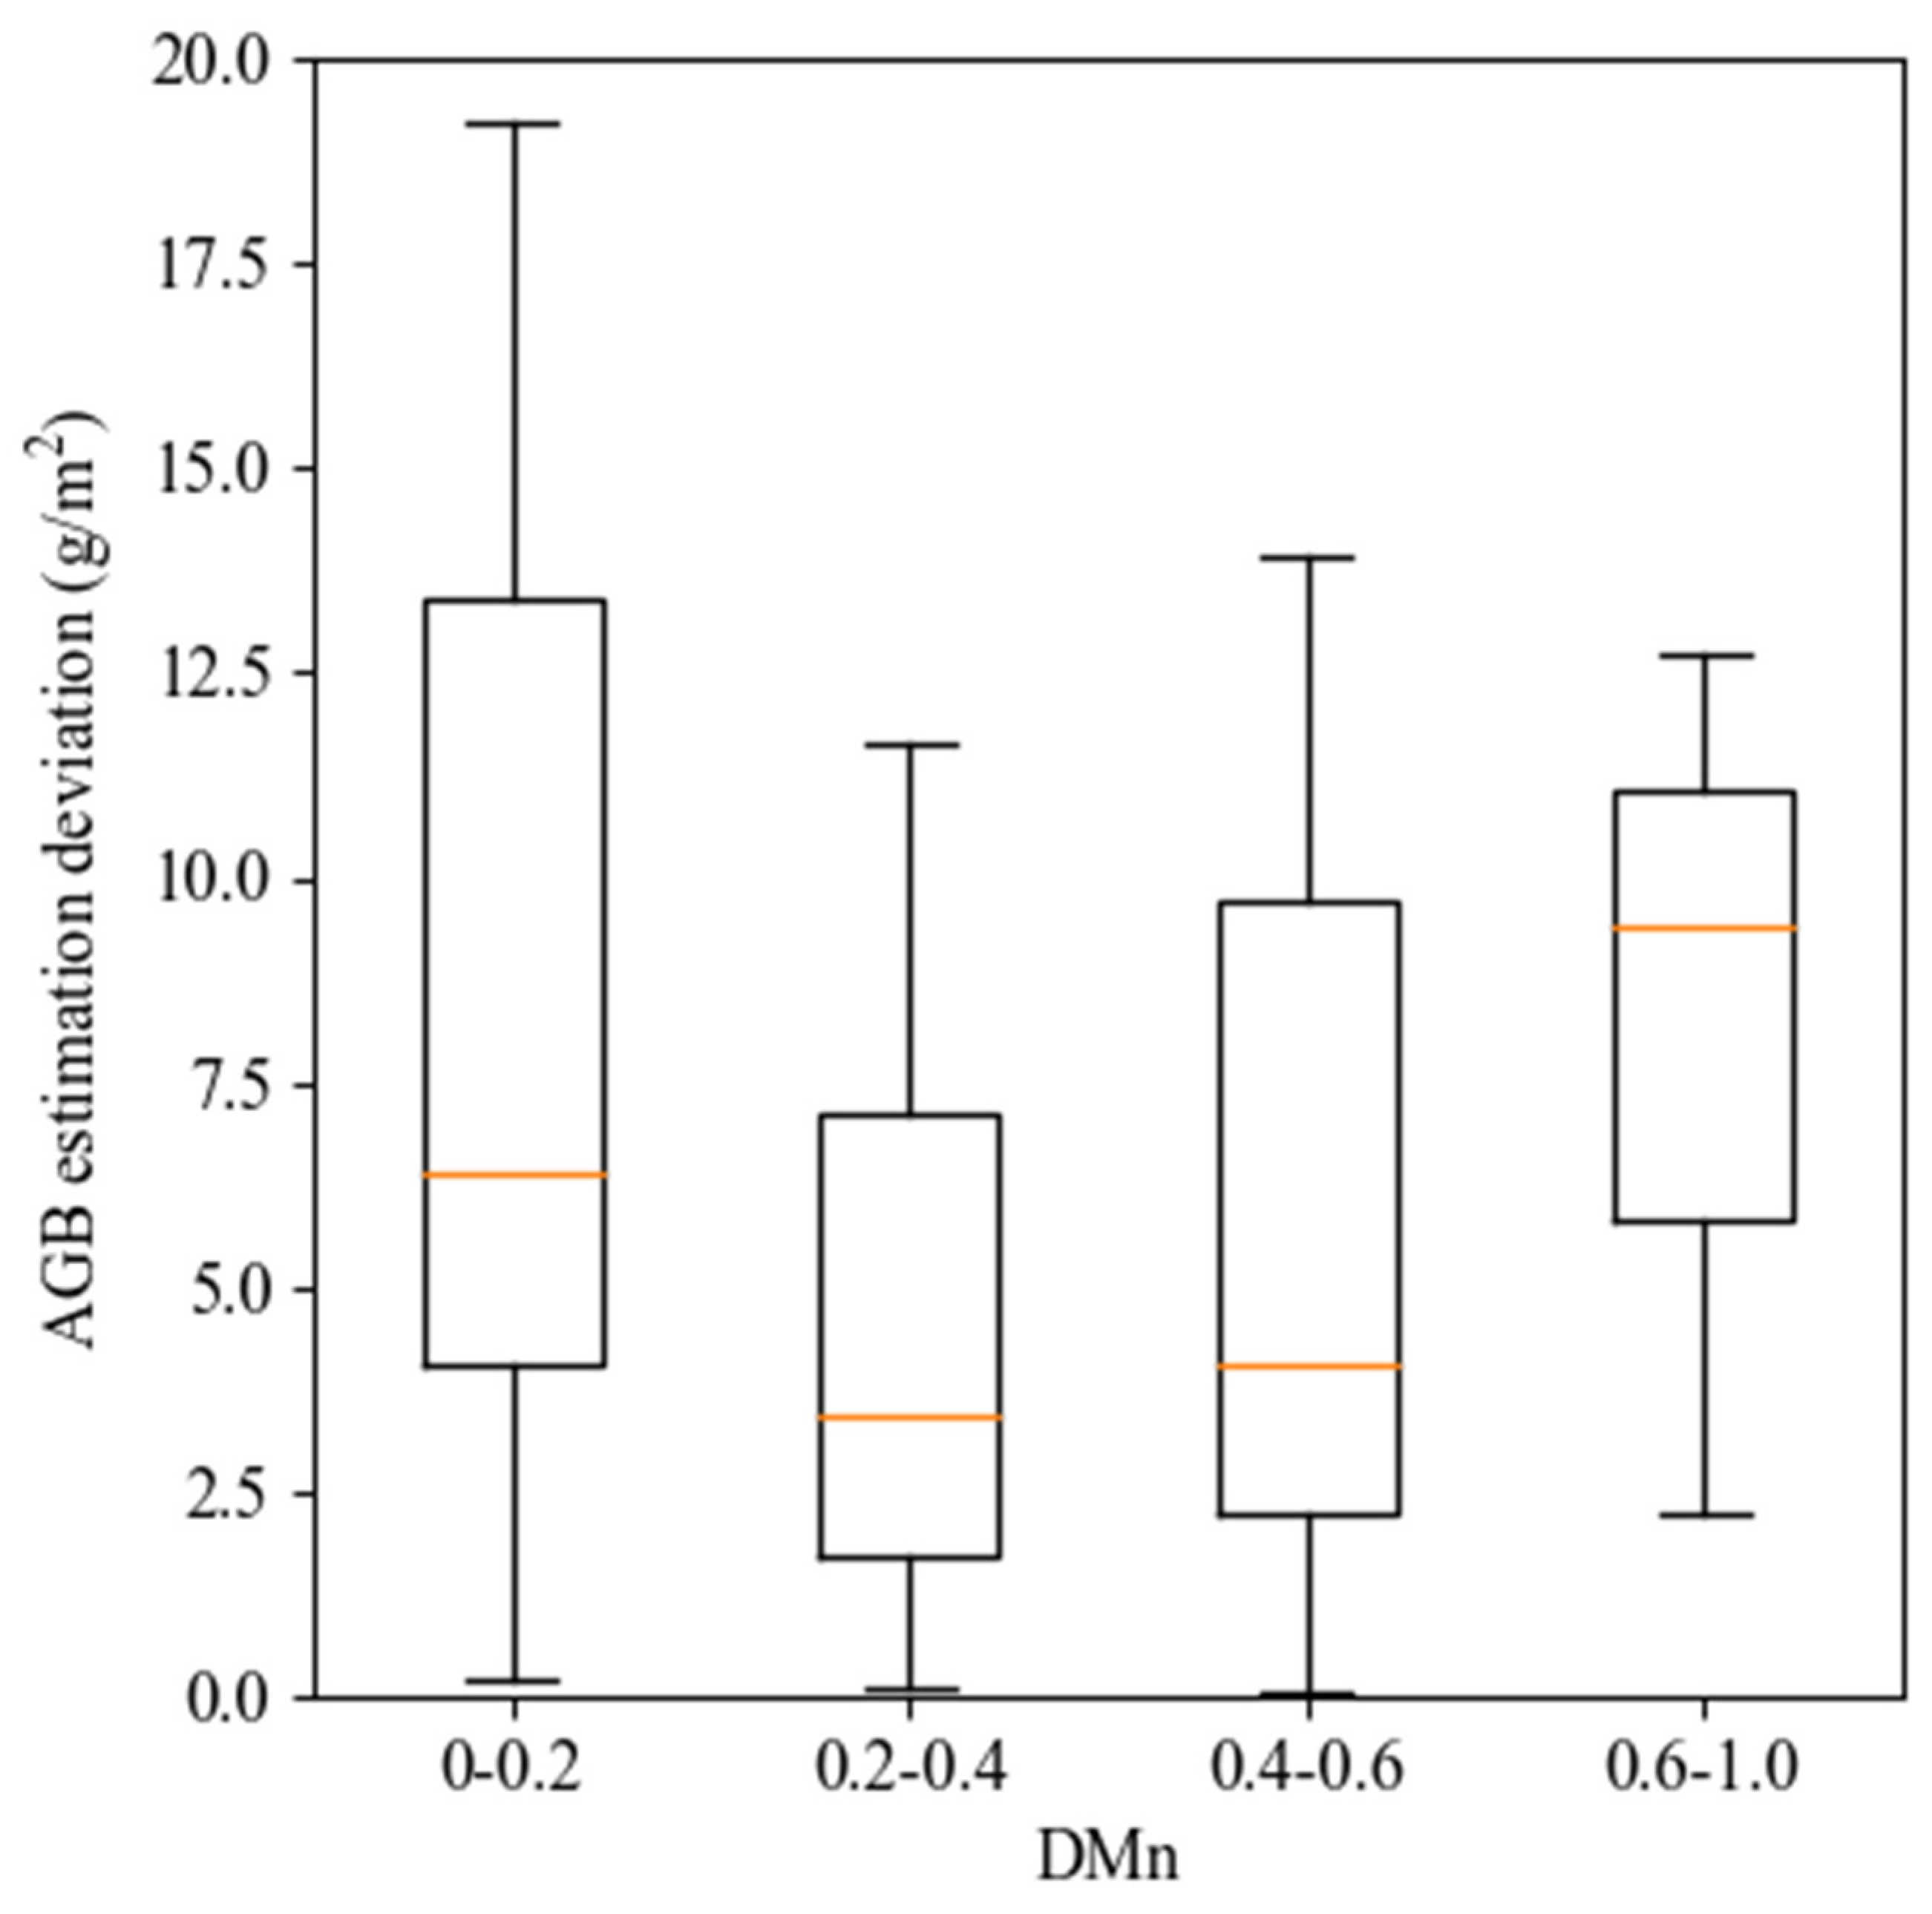
Diverse grass species were found in the sample plots, which introduced potential uncertainty in AGB estimation using hyperspectral data. AGB estimation uncertainty in plots with different species diversity is shown in Figure 10. In this study, AGB estimation uncertainty was calculated as the absolute value of the deviation between measured AGB and estimated AGB. DMn values for each plot were divided into five groups: 0–0.2, 0.2–0.4, 0.4–0.6, 0.6–0.8, and 0.8–1.0. The last two groups were joined into one, 0.6–1.0, because the number of DMn values between 0.6 and 0.8 was only one, which was low enough to be shown in the boxplot. The lowest AGB estimation uncertainty was observed when DMn was in the 0.2–0.4 group, and the highest uncertainty was observed when DMn was in the 0.6–1.0 group (Figure 10). Moreover, AGB estimation uncertainty decreased when DMn increased from 0–0.2 to 0.2–0.4, then gradually increased when DMn increased from 0.2–0.4 to 0.6–1.0.

4. Discussion

4.1. Comparison Between the Estimated AGB and Other AGB Estimation Studies

We compared our grassland AGB estimation results with previous relevant studies focusing on AGB estimation based on remote sensing data (Table 3). In this study, the linear regression method was utilized for AGB estimation by combing VIs and near-infrared radiance data acquired by a drone. The R2 reached a maximum of 0.72 and RMSE reached a minimum of 7.52 g/m2. A higher AGB estimation accuracy was acquired based on the PLSR method (R2 = 0.83 and RMSE = 2.95 g/m2) compared to merely using linear regression with Vis (R2 = 0.57 and RMSE = 4.29 g/m2) [22]. The sample sites in this study were all located in natural grassland with relatively high plant diversity. Low diversity in the artificially managed grassland farm [22] could be one of the reasons why higher AGB estimation accuracy was observed there compared with this study.
The final analysis of AGB estimation was based on 38 valid samples, reduced from the planned 75 due to stringent quality control against unstable illumination conditions (Table 1). While this sample size is moderate, it is important to note that most similar studies in this field, particularly those utilizing UAV hyperspectral data for grassland analysis, use 20–60 plots, and our sample size falls within this typical range. For instance, Capolupo et al. [22] employed 60 plots in their analysis of grassland traits using UAV hyperspectral images. Moreover, the high reliability of our ground measurements compensates for the moderate sample number. We emphasize that each sample corresponds to a fully harvested 1 × 1 m ground-truth plot, where all aboveground grass parts were collected and weighed to determine the dry biomass. This enhanced robustness of the ground-truth data ensures the stability of the established spectral–biomass relationships despite the limited number of plots. Furthermore, model robustness was ensured by utilizing the LOOCV technique, which is an appropriate and rigorous validation method for datasets of this scale. The wide range of AGB observed (9.55 g/m2 to 61.71 g/m2) confirms that the 38 plots effectively captured the high heterogeneity of the natural grassland ecosystem, lending confidence to the derived relationships.
Comparing AGB estimation accuracy with studies in larger spatial scale, a notably higher RMSE value was observed, although with similar R2 [5,6,11,30]. For instance, Pang et al. [5] estimated the grassland AGB of the Inner Mongolia Plateau based on Sentinel-2 data using the PLSR algorithm, achieving an R2 of 0.72 and an RMSE of 26.34 g/m2. Probably, the much higher RMSE value is related to different study regions, sensors, and sample sizes, which explains the variability and occasionally high RMSE values reported for machine learning-based methods such as PLSR, GBRT, and RF.

4.2. The Explanation of the Accurate Estimation of AGB Using NIRvR

Our results revealed the significant and positive effect of near-infrared radiance on improving AGB estimation accuracy. NIRvR (namely, NDVI×Lnir) showed considerably higher correlation with AGB than NDVI and NIRv (Figure 7).
Although many studies have reported the strong and robust correlation between VIs and plants photosynthesis, depicting the ability of VIs to capture the variability of photosynthesis [31,32,33], most studies were based on a long-term temporal scale, either covering the whole growth stage or across multiple years. As a result, the structural and biochemical traits of plants co-changed with vegetation growth and environmental variables, and the reflectance itself was inevitably able to exhibit the long-term variability of plant photosynthesis. In contrast, instantaneous and day-to-day variations are easily affected by high-frequency variations of PAR owing to varying solar angle and sky conditions [34]. Canopy structure and light-use efficiency do not change much within a day, so they could not show up in bi-directional reflectance [35].
The strong correlation between NIRvR and AGB is mainly attributed to the intrinsic characteristics, which is that NIRvR contains the information on both PAR and biophysics and biochemical characteristics contained in reflectance-based VIs. GPP is the amount of carbon fixed during plant photosynthesis in an ecosystem during a given period of time, and is regarded as a fundamental variable in terrestrial-vegetation carbon cycling [36]. AGB is the organic matter derived by plants’ photosynthetic activity; thus, it is an alternative method for quantifying the amount of energy absorbed by the plants from sunlight and converted into chemical energy through the photosynthesis system. Previous studies confirmed the close relationship between AGB and GPP [37,38]. Considering the high correlation and similar meaning between AGB and GPP, AGB can also be explained using a light-use efficiency model [39], indicating that AGB contains information on PAR, fAPAR, and LUE. NIRvR is defined as the product of NDVI, NIRref, and NIRirra. Studies had revealed a strong relationship between NIRirra and PAR [20], NDVI and fAPAR [40,41], and NIRref and LUE [20,27]. Therefore, NIRvR is expected to give an accurate estimation of AGB at near-ground scale. Additionally, our results showed that higher estimation accuracy can be achieved by integrating Lnir with vegetation indices describing biochemical traits (e.g., CIgreen, CIrededge) than with indices representing canopy structure and light-use efficiency. This may be because these biochemical indices show closer relationship with fAPARgreen, which refers to the fraction of PAR absorbed by photosynthetically active vegetation [26], compared to other vegetation indices [31,42]. Hence, it is revelaed that fAPARgreen-related VIs are more effective in the VIs×Lnir model estimating AGB at near-ground scale.
It should be emphasized that near-infrared radiance is not an intrinsic vegetation property and is influenced by solar illumination and atmospheric conditions. Therefore, radiance alone is not suitable for direct biomass estimation. In this study, Lnir was not used as a standalone predictor, but rather as a complementary variable integrated with reflectance-based vegetation indices to empirically enhance AGB estimation performance. By jointly considering reflectance and radiance, the proposed approach may partially account for short-term canopy functional differences that indirectly relate to accumulated biomass, particularly in structurally and compositionally heterogeneous grasslands. Nevertheless, the applicability of radiance-based variables for AGB estimation remains constrained by their sensitivity to illumination and environmental conditions. Caution is therefore required when extending this approach to other platforms, temporal scales, or acquisition settings. Future studies should further investigate the generalizability of radiance-assisted models across varying sun–sensor–target geometries and atmospheric conditions, and explore physically grounded normalization strategies to better isolate vegetation-related signals.

4.3. Uncertainty of Grassland Aboveground Biomass

There are certain difficulties and uncertainties in the inversion of grassland AGB using UAV remote sensing due to the intrinsic characteristics. Compared to other ecosystems, the heterogeneous sward structure with high spatiotemporal variability in grasslands has the potential to alter the spatial distribution of biomass [43]. Previous study found that plant species diversity and AGB were negatively correlated in areas with low and high values; by contrast, they were positively correlated in areas with medium values [44]. Our results, as shown in Figure 10, indicate a non-linear relationship between species diversity (DMn) and AGB estimation uncertainty, with the lowest uncertainty occurring at moderate diversity levels (DMn: 0.2–0.4). This pattern suggests that at the two extremes, different factors amplify the estimation error. At low diversity levels (DMn: 0–0.2), the limited variety of spectral signatures may not adequately represent the full complexity of the grassland ecosystem, resulting in a model that is poorly generalized or susceptible to dominant single-species influence. Conversely, when sample diversity increases to high levels (DMn: 0.6–1.0), two primary effects introduce greater uncertainty: spectral confusion and vertical structure complexity. High species richness results in overlapping or confounding spectral signals from different species, making it difficult for the model to disentangle the true relationships between spectra and biomass. Moreover, high diversity is often coupled with a complex vertical structure (e.g., varying canopy heights and layering). Taller or denser canopies may cause self-shading, reducing the spectral contribution of lower layers (where significant biomass may reside) and leading to underprediction [45]. This demonstrates that the optimal range of DMn balances the need for sufficient sample representativeness with the challenges posed by severe spectral mixing.
In addition, research has shown that the relationship between species diversity and spectral diversity is mediated by the vertical complexity of the grassland community [28,46]. Biochemical traits like leaf water content or lignin concentration can modulate reflectance in specific bands (e.g., near-infrared for water, shortwave infrared for lignin), and their variability—independent of diversity—can decouple spectral signatures from actual biomass [47]. Moreover, different grass species may respond differently to environmental factors such as topography and the climatic environment. These factors can further modulate the spectral reflectivity of grasses. The resulting spectral mixture from these species in different environmental niches adds to the uncertainty in the model’s ability to accurately predict biomass based on spectral data.

5. Conclusions

Accurate AGB estimation is important to better understand the carbon cycle in grassland ecosystem. The study developed a novel drone hyperspectral-driven AGB estimation method that can improve the estimation accuracy of grassland AGB, namely coupling Lnir in VIs-AGB estimation model to form a VIs×Lnir model. Furthermore, the results of the fAPARgreen-related VIs×Lnir model were further investigated, yielding higher AGB estimation accuracy than NDVI×Lnir. The grassland exhibited a heterogeneous spatial distribution in different sample plots, which resulted in different species diversities. The study also revealed that the AGB estimation deviation using hyperspectral data was closely related to plant diversity, following a non-linear trend. Lowest AGB estimation uncertainty was observed when DMn was in the 0.2–0.4 range, indicating that moderate diversity optimizes the balance between ecosystem representativeness and spectral signal complexity. This finding provides valuable guidance for stratifying remote sensing surveys in heterogeneous grasslands, suggesting that areas with extremely low or high species diversity should be treated with greater caution or require specific modeling strategies. In addition, The VIs×Lnir model is based on a concise formula of VIs and Lnir without extra input variables. This method provides a new perspective on long-term monitoring of global AGB based on historical satellite data (e.g., MODIS data).

Author Contributions

Conceptualization, N.S. and S.B.; methodology, Z.L. and L.L.; software, S.B.; validation, Y.T. and N.S.; formal analysis, S.B., Y.T. and N.L.; investigation, Y.T., L.L. and N.L.; resources, Z.L.; data curation, Z.L. and Y.T.; writing—original draft preparation, N.S. and S.B.; writing—review and editing, N.S. and W.W.; visualization, N.S. and W.W.; supervision, N.S.; project administration, N.S.; funding acquisition, N.S. and W.W. All authors have read and agreed to the published version of the manuscript.

Funding

This research was supported by the Project of Strengthening the Scientific and Technological Research Capacity of Hulun Lake Natrue Reserve (HSZCS-C-F-210094) and Eco-logical Security Investigation and Assessment Project of Hulun Lake (HSZCS-G-F-210059), National Natural Sciences Foundation of China (No. 42071050).

Data Availability Statement

The original contributions presented in this study are included in the article. Further inquiries can be directed to the corresponding author.

Conflicts of Interest

The authors declare that they have no known competing financial interests or personal relationships that could have appeared to influence the work reported in this paper.

References

  1. Scurlock, J.M.O.; Hall, D.O. The Global Carbon Sink: A Grassland Perspective. Glob. Chang. Biol. 1998, 4, 229–233. [Google Scholar] [CrossRef]
  2. Adjorlolo, C.; Mutanga, O.; Cho, M.A. Predicting C3 and C4 Grass Nutrient Variability Using in Situ Canopy Reflectance and Partial Least Squares Regression. Int. J. Remote Sens. 2015, 36, 1743–1761. [Google Scholar] [CrossRef]
  3. Clevers, J.G.P.W.; van der Heijden, G.W.A.M.; Verzakov, S.; Schaepman, M.E. Estimating Grassland Biomass Using SVM Band Shaving of Hyperspectral Data. Photogramm. Eng. Remote Sens. 2007, 73, 1141–1148. [Google Scholar] [CrossRef]
  4. Li, H.; Kato, T.; Hayashi, M.; Wu, L. Estimation of Forest Aboveground Biomass of Two Major Conifers in Ibaraki Prefecture, Japan, from PALSAR-2 and Sentinel-2 Data. Remote Sens. 2022, 14, 468. [Google Scholar] [CrossRef]
  5. Pang, H.; Zhang, A.; Kang, X.; He, N.; Dong, G. Estimation of the Grassland Aboveground Biomass of the Inner Mongolia Plateau Using the Simulated Spectra of Sentinel-2 Images. Remote Sens. 2020, 12, 4155. [Google Scholar] [CrossRef]
  6. Yu, R.; Yao, Y.; Wang, Q.; Wan, H.; Xie, Z.; Tang, W.; Zhang, Z.; Yang, J.; Shang, K.; Guo, X.; et al. Satellite-Derived Estimation of Grassland Aboveground Biomass in the Three-River Headwaters Region of China during 1982–2018. Remote Sens. 2021, 13, 2993. [Google Scholar] [CrossRef]
  7. Yi, S.; Wang, X.; Qin, Y.; Xiang, B.; Ding, Y. Responses of Alpine Grassland on Qinghai–Tibetan Plateau to Climate Warming and Permafrost Degradation: A Modeling Perspective. Environ. Res. Lett. 2014, 9, 074014. [Google Scholar] [CrossRef]
  8. Jacquemoud, S.; Verhoef, W.; Baret, F.; Bacour, C.; Zarco-Tejada, P.J.; Asner, G.P.; François, C.; Ustin, S.L. PROSPECT + SAIL Models: A Review of Use for Vegetation Characterization. Remote Sens. Environ. 2009, 113, S56–S66. [Google Scholar] [CrossRef]
  9. Wang, Y.; Wu, G.; Deng, L.; Tang, Z.; Wang, K.; Sun, W.; Shangguan, Z. Prediction of Aboveground Grassland Biomass on the Loess Plateau, China, Using a Random Forest Algorithm. Sci. Rep. 2017, 7, 6940. [Google Scholar] [CrossRef]
  10. Piao, S.; Fang, J.; Zhou, L.; Tan, K.; Tao, S. Changes in Biomass Carbon Stocks in China’s Grasslands between 1982 and 1999. Glob. Biogeochem. Cycles 2007, 21, 2005GB002634. [Google Scholar] [CrossRef]
  11. Zeng, N.; Ren, X.; He, H.; Zhang, L.; Li, P.; Niu, Z. Estimating the Grassland Aboveground Biomass in the Three-River Headwater Region of China Using Machine Learning and Bayesian Model Averaging. Environ. Res. Lett. 2021, 16, 114020. [Google Scholar] [CrossRef]
  12. Gitelson, A.A.; Kaufman, Y.J.; Merzlyak, M.N. Use of a Green Channel in Remote Sensing of Global Vegetation from EOS-MODIS. Remote Sens. Environ. 1996, 58, 289–298. [Google Scholar] [CrossRef]
  13. Yan, K.; Gao, S.; Yan, G.; Ma, X.; Chen, X.; Zhu, P.; Li, J.; Gao, S.; Gastellu-Etchegorry, J.-P.; Myneni, R.B.; et al. A Global Systematic Review of the Remote Sensing Vegetation Indices. Int. J. Appl. Earth Obs. Geoinf. 2025, 139, 104560. [Google Scholar] [CrossRef]
  14. Wu, H.; An, S.; Meng, B.; Chen, X.; Li, F.; Ren, S. Retrieval of Grassland Aboveground Biomass across Three Ecoregions in China during the Past Two Decades Using Satellite Remote Sensing Technology and Machine Learning Algorithms. Int. J. Appl. Earth Obs. Geoinf. 2024, 130, 103925. [Google Scholar] [CrossRef]
  15. Liang, W.; Lü, Y.; Zhang, W.; Li, S.; Jin, Z.; Ciais, P.; Fu, B.; Wang, S.; Yan, J.; Li, J.; et al. Grassland Gross Carbon Dioxide Uptake Based on an Improved Model Tree Ensemble Approach Considering Human Interventions: Global Estimation and Covariation with Climate. Glob. Chang. Biol. 2017, 23, 2720–2742. [Google Scholar] [CrossRef]
  16. Badgley, G.; Field, C.B.; Berry, J.A. Canopy Near-Infrared Reflectance and Terrestrial Photosynthesis. Sci. Adv. 2017, 3, e1602244. [Google Scholar] [CrossRef]
  17. Zeng, Y.; Badgley, G.; Dechant, B.; Ryu, Y.; Chen, M.; Berry, J.A. A Practical Approach for Estimating the Escape Ratio of Near-Infrared Solar-Induced Chlorophyll Fluorescence. Remote Sens. Environ. 2019, 232, 111209. [Google Scholar] [CrossRef]
  18. Dechant, B.; Ryu, Y.; Badgley, G.; Zeng, Y.; Berry, J.A.; Zhang, Y.; Goulas, Y.; Li, Z.; Zhang, Q.; Kang, M.; et al. Canopy Structure Explains the Relationship between Photosynthesis and Sun-Induced Chlorophyll Fluorescence in Crops. Remote Sens. Environ. 2020, 241, 111733. [Google Scholar] [CrossRef]
  19. Wu, G.; Guan, K.; Jiang, C.; Peng, B.; Kimm, H.; Chen, M.; Yang, X.; Wang, S.; Suyker, A.E.; Bernacchi, C.J.; et al. Radiance-Based NIRv as a Proxy for GPP of Corn and Soybean. Environ. Res. Lett. 2020, 15, 034009. [Google Scholar] [CrossRef]
  20. Liu, L.; Liu, X.; Chen, J.; Du, S.; Ma, Y.; Qian, X.; Chen, S.; Peng, D. Estimating Maize GPP Using Near-Infrared Radiance of Vegetation. Sci. Remote Sens. 2020, 2, 100009. [Google Scholar] [CrossRef]
  21. Dechant, B.; Ryu, Y.; Badgley, G.; Köhler, P.; Rascher, U.; Migliavacca, M.; Zhang, Y.; Tagliabue, G.; Guan, K.; Rossini, M.; et al. NIRVP: A Robust Structural Proxy for Sun-Induced Chlorophyll Fluorescence and Photosynthesis across Scales. Remote Sens. Environ. 2022, 268, 112763. [Google Scholar] [CrossRef]
  22. Capolupo, A.; Kooistra, L.; Berendonk, C.; Boccia, L.; Suomalainen, J. Estimating Plant Traits of Grasslands from UAV-Acquired Hyperspectral Images: A Comparison of Statistical Approaches. ISPRS Int. J. Geo-Inf. 2015, 4, 2792–2820. [Google Scholar] [CrossRef]
  23. Darvishzadeh, R.; Skidmore, A.; Schlerf, M.; Atzberger, C. Inversion of a Radiative Transfer Model for Estimating Vegetation LAI and Chlorophyll in a Heterogeneous Grassland. Remote Sens. Environ. 2008, 112, 2592–2604. [Google Scholar] [CrossRef]
  24. Chen, Z.; Liu, J.; Li, L.; Wu, Y.; Feng, G.; Qian, Z.; Sun, G.-Q. Effects of Climate Change on Vegetation Patterns in Hulun Buir Grassland. Phys. A Stat. Mech. Its Appl. 2022, 597, 127275. [Google Scholar] [CrossRef]
  25. Zhang, G.; Xu, X.; Zhou, C.; Zhang, H.; Ouyang, H. Responses of Grassland Vegetation to Climatic Variations on Different Temporal Scales in Hulun Buir Grassland in the Past 30 Years. J. Geogr. Sci. 2011, 21, 634–650. [Google Scholar] [CrossRef]
  26. Hall, F.G.; Huemmrich, K.F.; Goetz, S.J.; Sellers, P.J.; Nickeson, J.E. Satellite Remote Sensing of Surface Energy Balance: Success, Failures, and Unresolved Issues in FIFE. J. Geophys. Res. Atmos. 1992, 97, 19061–19089. [Google Scholar] [CrossRef]
  27. Dechant, B.; Ryu, Y.; Kang, M. Making Full Use of Hyperspectral Data for Gross Primary Productivity Estimation with Multivariate Regression: Mechanistic Insights from Observations and Process-Based Simulations. Remote Sens. Environ. 2019, 234, 111435. [Google Scholar] [CrossRef]
  28. Lopatin, J.; Fassnacht, F.E.; Kattenborn, T.; Schmidtlein, S. Mapping Plant Species in Mixed Grassland Communities Using Close Range Imaging Spectroscopy. Remote Sens. Environ. 2017, 201, 12–23. [Google Scholar] [CrossRef]
  29. Menhinick, E.F. A Comparison of Some Species-Individuals Diversity Indices Applied to Samples of Field Insects. Ecology 1964, 45, 859–861. [Google Scholar] [CrossRef]
  30. Zhao, L.; Zhou, W.; Peng, Y.; Hu, Y.; Ma, T.; Xie, Y.; Wang, L.; Liu, J.; Liu, Z. A New AG-AGB Estimation Model Based on MODIS and SRTM Data in Qinghai Province, China. Ecol. Indic. 2021, 133, 108378. [Google Scholar] [CrossRef]
  31. Peng, Y.; Gitelson, A.A.; Keydan, G.; Rundquist, D.C.; Moses, W. Remote Estimation of Gross Primary Production in Maize and Support for a New Paradigm Based on Total Crop Chlorophyll Content. Remote Sens. Environ. 2011, 115, 978–989. [Google Scholar] [CrossRef]
  32. Gitelson, A.A.; Vina, A.; Masek, J.G.; Verma, S.B.; Suyker, A.E. Synoptic Monitoring of Gross Primary Productivity of Maize Using Landsat Data. IEEE Geosci. Remote Sens. Lett. 2008, 5, 133–137. [Google Scholar] [CrossRef]
  33. Gitelson, A.A.; Viña, A.; Verma, S.B.; Rundquist, D.C.; Arkebauer, T.J.; Keydan, G.; Leavitt, B.; Ciganda, V.; Burba, G.G.; Suyker, A.E. Relationship between Gross Primary Production and Chlorophyll Content in Crops: Implications for the Synoptic Monitoring of Vegetation Productivity. J. Geophys. Res. Atmos. 2006, 111, D08S11. [Google Scholar] [CrossRef]
  34. Peng, Y.; Gitelson, A.A. Application of Chlorophyll-Related Vegetation Indices for Remote Estimation of Maize Productivity. Agric. For. Meteorol. 2011, 151, 1267–1276. [Google Scholar] [CrossRef]
  35. Kim, J.; Ryu, Y.; Jiang, C.; Hwang, Y. Continuous Observation of Vegetation Canopy Dynamics Using an Integrated Low-Cost, near-Surface Remote Sensing System. Agric. For. Meteorol. 2019, 264, 164–177. [Google Scholar] [CrossRef]
  36. Ballantyne, A.P.; Alden, C.B.; Miller, J.B.; Tans, P.P.; White, J.W.C. Increase in Observed Net Carbon Dioxide Uptake by Land and Oceans during the Past 50 Years. Nature 2012, 488, 70–72. [Google Scholar] [CrossRef]
  37. Nakano, T.; Nemoto, M.; Shinoda, M. Environmental Controls on Photosynthetic Production and Ecosystem Respiration in Semi-Arid Grasslands of Mongolia. Agric. For. Meteorol. 2008, 148, 1456–1466. [Google Scholar] [CrossRef]
  38. Nakano, T.; Shinoda, M. Modeling Gross Primary Production and Ecosystem Respiration in a Semiarid Grassland of Mongolia. Soil Sci. Plant Nutr. 2015, 61, 106–115. [Google Scholar] [CrossRef]
  39. Monteith, J.L. Solar Radiation and Productivity in Tropical Ecosystems. J. Appl. Ecol. 1972, 9, 747–766. [Google Scholar] [CrossRef]
  40. Myneni, R.B.; Williams, D.L. On the Relationship between FAPAR and NDVI. Remote Sens. Environ. 1994, 49, 200–211. [Google Scholar] [CrossRef]
  41. Rahman, M.M.; Lamb, D.W.; Stanley, J.N. The Impact of Solar Illumination Angle When Using Active Optical Sensing of NDVI to Infer fAPAR in a Pasture Canopy. Agric. For. Meteorol. 2015, 202, 39–43. [Google Scholar] [CrossRef]
  42. Peng, Y.; Gitelson, A.A. Remote Estimation of Gross Primary Productivity in Soybean and Maize Based on Total Crop Chlorophyll Content. Remote Sens. Environ. 2012, 117, 440–448. [Google Scholar] [CrossRef]
  43. Bazzo, C.O.G.; Kamali, B.; Hütt, C.; Bareth, G.; Gaiser, T. A Review of Estimation Methods for Aboveground Biomass in Grasslands Using UAV. Remote Sens. 2023, 15, 639. [Google Scholar] [CrossRef]
  44. Yang, M.; Chen, A.; Zhang, M.; Gu, Q.; Wang, Y.; Guo, J.; Yang, D.; Zhao, Y.; Huang, Q.; Ma, L.; et al. Relationship between Plant Species Diversity and Aboveground Biomass in Alpine Grasslands on the Qinghai–Tibet Plateau: Spatial Patterns and the Factors Driving Them. Front. Ecol. Evol. 2023, 11, 1138884. [Google Scholar] [CrossRef]
  45. Mutanga, O.; Skidmore, A.K. Narrow Band Vegetation Indices Overcome the Saturation Problem in Biomass Estimation. Int. J. Remote Sens. 2004, 25, 3999–4014. [Google Scholar] [CrossRef]
  46. Gholizadeh, H.; Gamon, J.A.; Townsend, P.A.; Zygielbaum, A.I.; Helzer, C.J.; Hmimina, G.Y.; Yu, R.; Moore, R.M.; Schweiger, A.K.; Cavender-Bares, J. Detecting Prairie Biodiversity with Airborne Remote Sensing. Remote Sens. Environ. 2019, 221, 38–49. [Google Scholar] [CrossRef]
  47. Asner, G.P. Biophysical and Biochemical Sources of Variability in Canopy Reflectance. Remote Sens. Environ. 1998, 64, 234–253. [Google Scholar] [CrossRef]
Figure 1. Location of the study area (a), the DJI M600 pro hexacopter UAV platform equipped with Micro-Hyperspec camera (b), the distribution of five 1 × 1 m sample plots in each 100 × 100 m sample site, a calibration panel with varied reflectance was set synchronously during UAV flight experiment (c), and RGB image of a 1 × 1 m sample plot highlighted with four white nylon ropes (d).
Remotesensing 18 00467 g001
Figure 2. Flowchart illustrating the overall procedure for AGB estimation and analysis. The process includes two major data streams: UAV hyperspectral data collection and processing (radiometric calibration, geometric correction, reflectance calculation, and quality control) and field data collection and processing (drying and weighting the collected aboveground grass parts for AGB determination, and recognizing and statistically summarizing vegetation species and individual counts for quantifying vegetation diversity). The processed data are integrated into the VIs×Lnir model. Model performance is evaluated using the leave-one-out cross-validation (LOOCV) technique, culminating in the AGB estimation model and the analysis of AGB response to plant diversity.
Remotesensing 18 00467 g002
Figure 3. Reflectance ρ (a), first derivative ρ′ (b), and second derivative ρ″ (c) of 38 plots in 410–810 nm band. The color of the reflectance curve represents AGB value of each plot.
Remotesensing 18 00467 g003
Figure 4. Relationships between AGB and ρ, ρ′, and ρ″. R2 is the coefficient of determination of linear regression; same below.
Remotesensing 18 00467 g004
Figure 5. Correlation matrix of vegetation indices used in this study.
Remotesensing 18 00467 g005
Figure 6. Relationships between AGB and ρ, ρ′, ρ″ × Lnir. R2 denotes the coefficient of determination used to evaluate the goodness of fit between estimated and measured AGB. Lnir represents near-infrared radiance.
Remotesensing 18 00467 g006
Figure 7. Comparison of R2 and RMSE of different vegetation indices. RMSE is the root-mean-square error of measured AGB and predicted AGB. Red dots and blue triangles represent VIs-AGB and VIs×Lnir-AGB, respectively.
Remotesensing 18 00467 g007
Figure 8. R2 matrix derived from VIs (a) and VIs×Lnir (b) based on formula of CI series. The x- and y-axes represent ρa and ρb, respectively. ρa ranges from 500 to 750 nm and ρb ranges from 750 to 810 nm.
Remotesensing 18 00467 g008
Figure 9. R2 matrix derived from VIs (a) and VIs×Lnir (b) based on formula of NDVI series. The x- and y-axes represent ρa and ρb, respectively. ρa ranges from 500 to 750 nm and ρb ranges from 750 to 810 nm.
Remotesensing 18 00467 g009
Figure 10. Absolute AGB estimation deviation in different species richness samples. DMn is Menhinick index. AGB estimation deviation is derived from the predicted AGB of the NDVI×Lnir model and the field-measured AGB, the orange line in boxplot represents median number of samples within certain category.
Remotesensing 18 00467 g010
Table 1. The quality control criteria and corresponding thresholds for hyperspectral data.
CriteriaFormulaThreshold
ReflectanceL(λ) × pi/E(λ)>0 and <1
Signal-to-noiseDN(λ)/DC(λ)>30
Solar zenith angle (SZA)-<60°
Illumination conditions-Clear sky and cloudless
Table 2. Vegetation indices used in this study. ρgreen, ρred, ρred-edge, and ρnir refer to reflectance derived from spectral data collected by UAV hyperspectral data in 540–570 nm, 650–680 nm, 700–710 nm, 770–790 nm bands. The ρλ is the reflectance at the given wavelength λ. ϱ v i s ¯ is the broad visible directional reflectance over the 400–700 nm range of photosynthetically active radiation (PAR).
Vegetation IndexFormulaReference
NDVI series
Normalized Difference Vegetation Index (NDVI) ( ϱ n i r ϱ r e d )   /   ( ϱ n i r + ϱ r e d ) [26]
Red-edge NDVI (NDVIrededge) ( ϱ n i r ϱ r e d e d g e )   /   ( ϱ n i r + ϱ r e d e d g e ) [14]
Optimized Soil Adjusted Vegetation Index (OSAVI) ( ϱ n i r ϱ r e d )   /   ( ϱ n i r + ϱ r e d + 0.16 ) [27]
Vegetation reflectance
Near-infrared Reflectance of Vegetation (NIRv) ϱ n i r × N D V I [3]
Chlorophyll content
Green Chlorophyll Index (CIgreen) ϱ n i r / ϱ g r e e n 1 [15]
Red-edge Chlorophyll Index (CIrededge) ϱ n i r / ϱ r e d e d g e 1 [16]
MERIS Terrestrial Chlorophyll Index (MTCI) ( ϱ 754 ϱ 709 )   /   ( ϱ 709 + ϱ 681 ) [8]
Canopy structure
Modified Triangular Vegetation Index 2 (MTVI2) 1.5 × [ 1.2 × ( ϱ 800 ϱ 550 ) 2.5 × ( ϱ 670 ϱ 550 ) ] ( 2 × ϱ 800 + 1 ) 2 ( 6 × ϱ 800 5 × ϱ 670 ) 0.5 [19]
Fluorescence Correction Vegetation Index (FCVI) ϱ 531 ϱ v i s ¯ [28]
Light-use efficiency
Photochemical Reflectance Index (PRI) ( ϱ 531 ϱ 570 )   /   ( ϱ 531 + ϱ 570 ) [12]
Table 3. Performance metrics for grassland AGB estimation methods reported in representative published studies. PLSR is partial least squares regression method, MSR is multiple stepwise regression method, MLR is multiple linear regression method, GBRT is gradient boosting regression tree model, and RF is random forest machine learning model.
DataMethodsPlatformScaleR2RMSE (g/m2)Reference
VIs, near-infrared radianceLinear regressionUAVnear ground0.727.52This study
VIsLinear regressionUAVnear ground0.574.29[22]
Raw reflectancePLSRUAVnear ground0.832.95[22]
Raw reflectance-VIsMSRSentinel-2satellite0.6928.25[5]
Simulated reflectance-VIsMSRSentinel-2satellite0.6729.15[5]
Raw reflectance-VIsPLSRSentinel-2satellite0.7226.34[5]
Simulated reflectance-VIsPLSRSentinel-2satellite0.7227.21[5]
EVI, radiation, altitude, B5/B7, latitude, and precipitationMLRMODIS and SRTMsatellite0.800-[30]
VIs, meteorological and ancillary dataGBRTAVHRR and MODISsatellite0.7688.8[6]
VIs, meteorological and topographical dataRF + ensemble analysisMODISsatellite0.7176.99[11]
Disclaimer/Publisher’s Note: The statements, opinions and data contained in all publications are solely those of the individual author(s) and contributor(s) and not of MDPI and/or the editor(s). MDPI and/or the editor(s) disclaim responsibility for any injury to people or property resulting from any ideas, methods, instructions or products referred to in the content.