Article

Localized Browning in Thermokarst-Dominated Landscapes Reverses Regional Greening Trends Under a Warming Climate in Northeastern Siberia

by
Ruixin Wang
1,2,
Ping Wang
1,2,*,
Li Xu
1,2,
Shiqi Liu
1,2 and
Qiwei Huang
1,2
1
Key Laboratory of Water Cycle and Related Land Surface Processes, Institute of Geographic Sciences and Natural Resources Research, Chinese Academy of Sciences, Beijing 100101, China
2
University of Chinese Academy of Sciences, Beijing 100049, China
*
Author to whom correspondence should be addressed.
Remote Sens. 2026, 18(2), 308; https://doi.org/10.3390/rs18020308
Submission received: 2 December 2025 / Revised: 4 January 2026 / Accepted: 14 January 2026 / Published: 16 January 2026
(This article belongs to the Section Environmental Remote Sensing)

Highlights

What are the main findings?
  • Vegetation greening dominates northeastern Siberia, yet browning is relatively more frequent in areas with high thermokarst lake coverage.
  • Air temperature was the primary driver of vegetation dynamics, whereas soil temperature and soil moisture played secondary but important roles.
What are the implications of the main findings?
  • Thermokarst lake coverage critically modulates vegetation responses to warming, locally overriding regional greening trends.
  • Accounting for thermokarst processes and landscape heterogeneity is essential for predicting changes in Arctic vegetation and guiding conservation efforts.

Abstract

The response of Arctic vegetation to climate warming exhibits pronounced spatial heterogeneity, driven partly by widespread permafrost degradation. However, the role of thermokarst lake development in mediating vegetation-climate interactions remains poorly understood, particularly across heterogeneous landscapes of northeastern Siberia. This study integrated multi-source remote sensing data (2001–2021) with trend analysis, partial correlation, and a Shapley Additive Explanation (SHAP)-interpreted random forest model to examine the drivers of normalized difference vegetation index (NDVI) variability across five levels of thermokarst lake coverage (none, low, moderate, high, very high) and two vegetation types (forest, tundra). The results show that although greening dominates the region, browning is disproportionately observed in areas with high thermokarst lake coverage (>30%), highlighting the localized reversal of regional greening trends under intensified thermokarst activity. Air temperature was identified as the dominant driver of NDVI change, whereas soil temperature and soil moisture exerted secondary but critical influences, especially in tundra ecosystems with extensive thermokarst lake development. The relative importance of these factors shifted across thermokarst lake coverage gradients, underscoring the modulatory effect of thermokarst processes on vegetation-climate feedbacks. These findings emphasize the necessity of incorporating thermokarst dynamics and landscape heterogeneity into predictive models of Arctic vegetation change, with important implications for understanding cryospheric hydrology and ecosystem responses to ongoing climate warming.

1. Introduction

Under accelerated global warming, temperatures in the Arctic have increased nearly four times faster than the global average, a phenomenon known as Arctic amplification [1,2]. This climatic change has profoundly impacted high-latitude permafrost regions, including thermokarst lake development, active layer thickening, ground subsidence, and altered hydrological pathways, which have reshaped high-latitude landscapes and influenced the structure and functioning of ecosystems [3]. Therefore, assessing the persistence and resilience of terrestrial ecosystems under climate change has become a major global research focus, particularly in high-latitude regions [4,5].
Siberia, characterized by its typical cold-region ecosystems, spans both the Arctic and sub-Arctic zones [6]. As the dominant vegetation biomes in Siberia, coniferous (taiga) forests and tundra represent some of the most valuable environmental regions on Earth, jointly maintaining the structural integrity and resilience of the Arctic and sub-Arctic ecosystems [7,8]. Cold-region vegetation constitutes an essential component of terrestrial ecosystems, and northern vegetation and tundra play a vital role in regulating the energy, water, and carbon exchanges between the land surface and the atmosphere [9,10,11]. In recent decades, vegetation in permafrost regions has shown high sensitivity to climate change [12], with positive trends in satellite-derived vegetation indices (greening) indicating enhanced vegetation activity and negative trends (browning) reflecting vegetation decline [13]. These trends are therefore widely used as indicators of ecosystem responses to climate change [14].
Previous studies have demonstrated that vegetation activity is strongly regulated by key climatic factors [15]. On one hand, temperature increases can enhance vegetation productivity by promoting photosynthesis and respiration efficiency and by extending the growing season in high-latitude regions [14,16]. On the other hand, as the primary water source for ecosystems, the amount and variability of precipitation significantly constrain vegetation growth, and its high variability helps explain regional differences in vegetation dynamics, such as NDVI reductions following drought or extreme snowfall [17]. Overall, the Arctic is projected to become warmer and wetter due to rising temperatures and increased precipitation. This change may alleviate drought stress induced by warming, thereby generally promoting vegetation growth and tundra expansion [5,18,19].
In addition, under the influence of climate warming, potential factors affecting vegetation greenness include permafrost, land cover, topography, and wildfires [20]. Much of Siberia is underlain by continuous permafrost, with the northern regions containing thick, carbon- and ice-rich Yedoma deposits [21]. Thawing of permafrost in these areas drives thermokarst development and associated lake dynamics, including thermokarst lake initiation, lateral expansion through thermal erosion, and eventual drainage [22,23,24], which in turn strongly regulates local vegetation responses. Localized greening occurs where thermokarst lake drainage exposes newly thawed sediments, providing favorable conditions for seedling establishment, nutrient availability, and soil aeration [25,26]. Conversely, browning is observed in ice-rich, poorly drained coniferous forests, where thaw-induced waterlogging stresses vegetation, reduces growth, and increases mortality [27]. Furthermore, wildfires are a major driver of forest loss and degradation in Siberia [28]. Northeastern Siberia, in particular, experiences intense wildfire activity, with burned areas surging dramatically during extreme years such as 2019 and 2020 [29]. Wildfire occurrence is strongly regulated by climatic conditions, showing positive correlations with summer temperature and drought [30,31], which explains the negative relationship between climate warming and vegetation greenness trends in fire-affected regions [32,33].
Previous studies have revealed the direct impacts of climate change on plant growth, phenology, and species distribution [16,34,35]. In parallel, a growing number of studies have focused on permafrost degradation and thermokarst lake dynamics, documenting the spatial and temporal patterns of lake expansion, drainage, and associated landscape changes across Siberia and the circumpolar Arctic [36,37,38,39,40]. In addition, the effects of permafrost degradation [41], drained lakes [42,43], and wildfires [44] on vegetation have also been discussed. However, the differential impacts of these driving factors across vegetation types and thermokarst coverage gradients remain insufficiently quantified. Therefore, this study uses multi-source remote sensing data from 2001–2021 and integrates trend analysis, partial correlation analysis, and a SHAP-interpreted random forest model to quantify how climate, environmental conditions, and wildfire disturbance shape NDVI variability across vegetation types and gradients of thermokarst lake coverage at the regional scale. The specific objectives are to (1) characterize the spatiotemporal patterns of vegetation activity in cold-region catchments across northeastern Siberia, (2) quantify the relative contributions of climatic and environmental factors to vegetation dynamics, and (3) identify the dominant driving factors to vegetation dynamics and their spatial patterns across vegetation types and thermokarst lake coverage gradients. This study aims to enhance the understanding of the coupled climate–permafrost–vegetation mechanisms in cold regions, improve the predictive capability of ecosystem models in permafrost areas, and provide scientific guidance for the conservation of vulnerable cold-region ecosystems under future warming scenarios.

2. Materials and Methods

2.1. Study Area

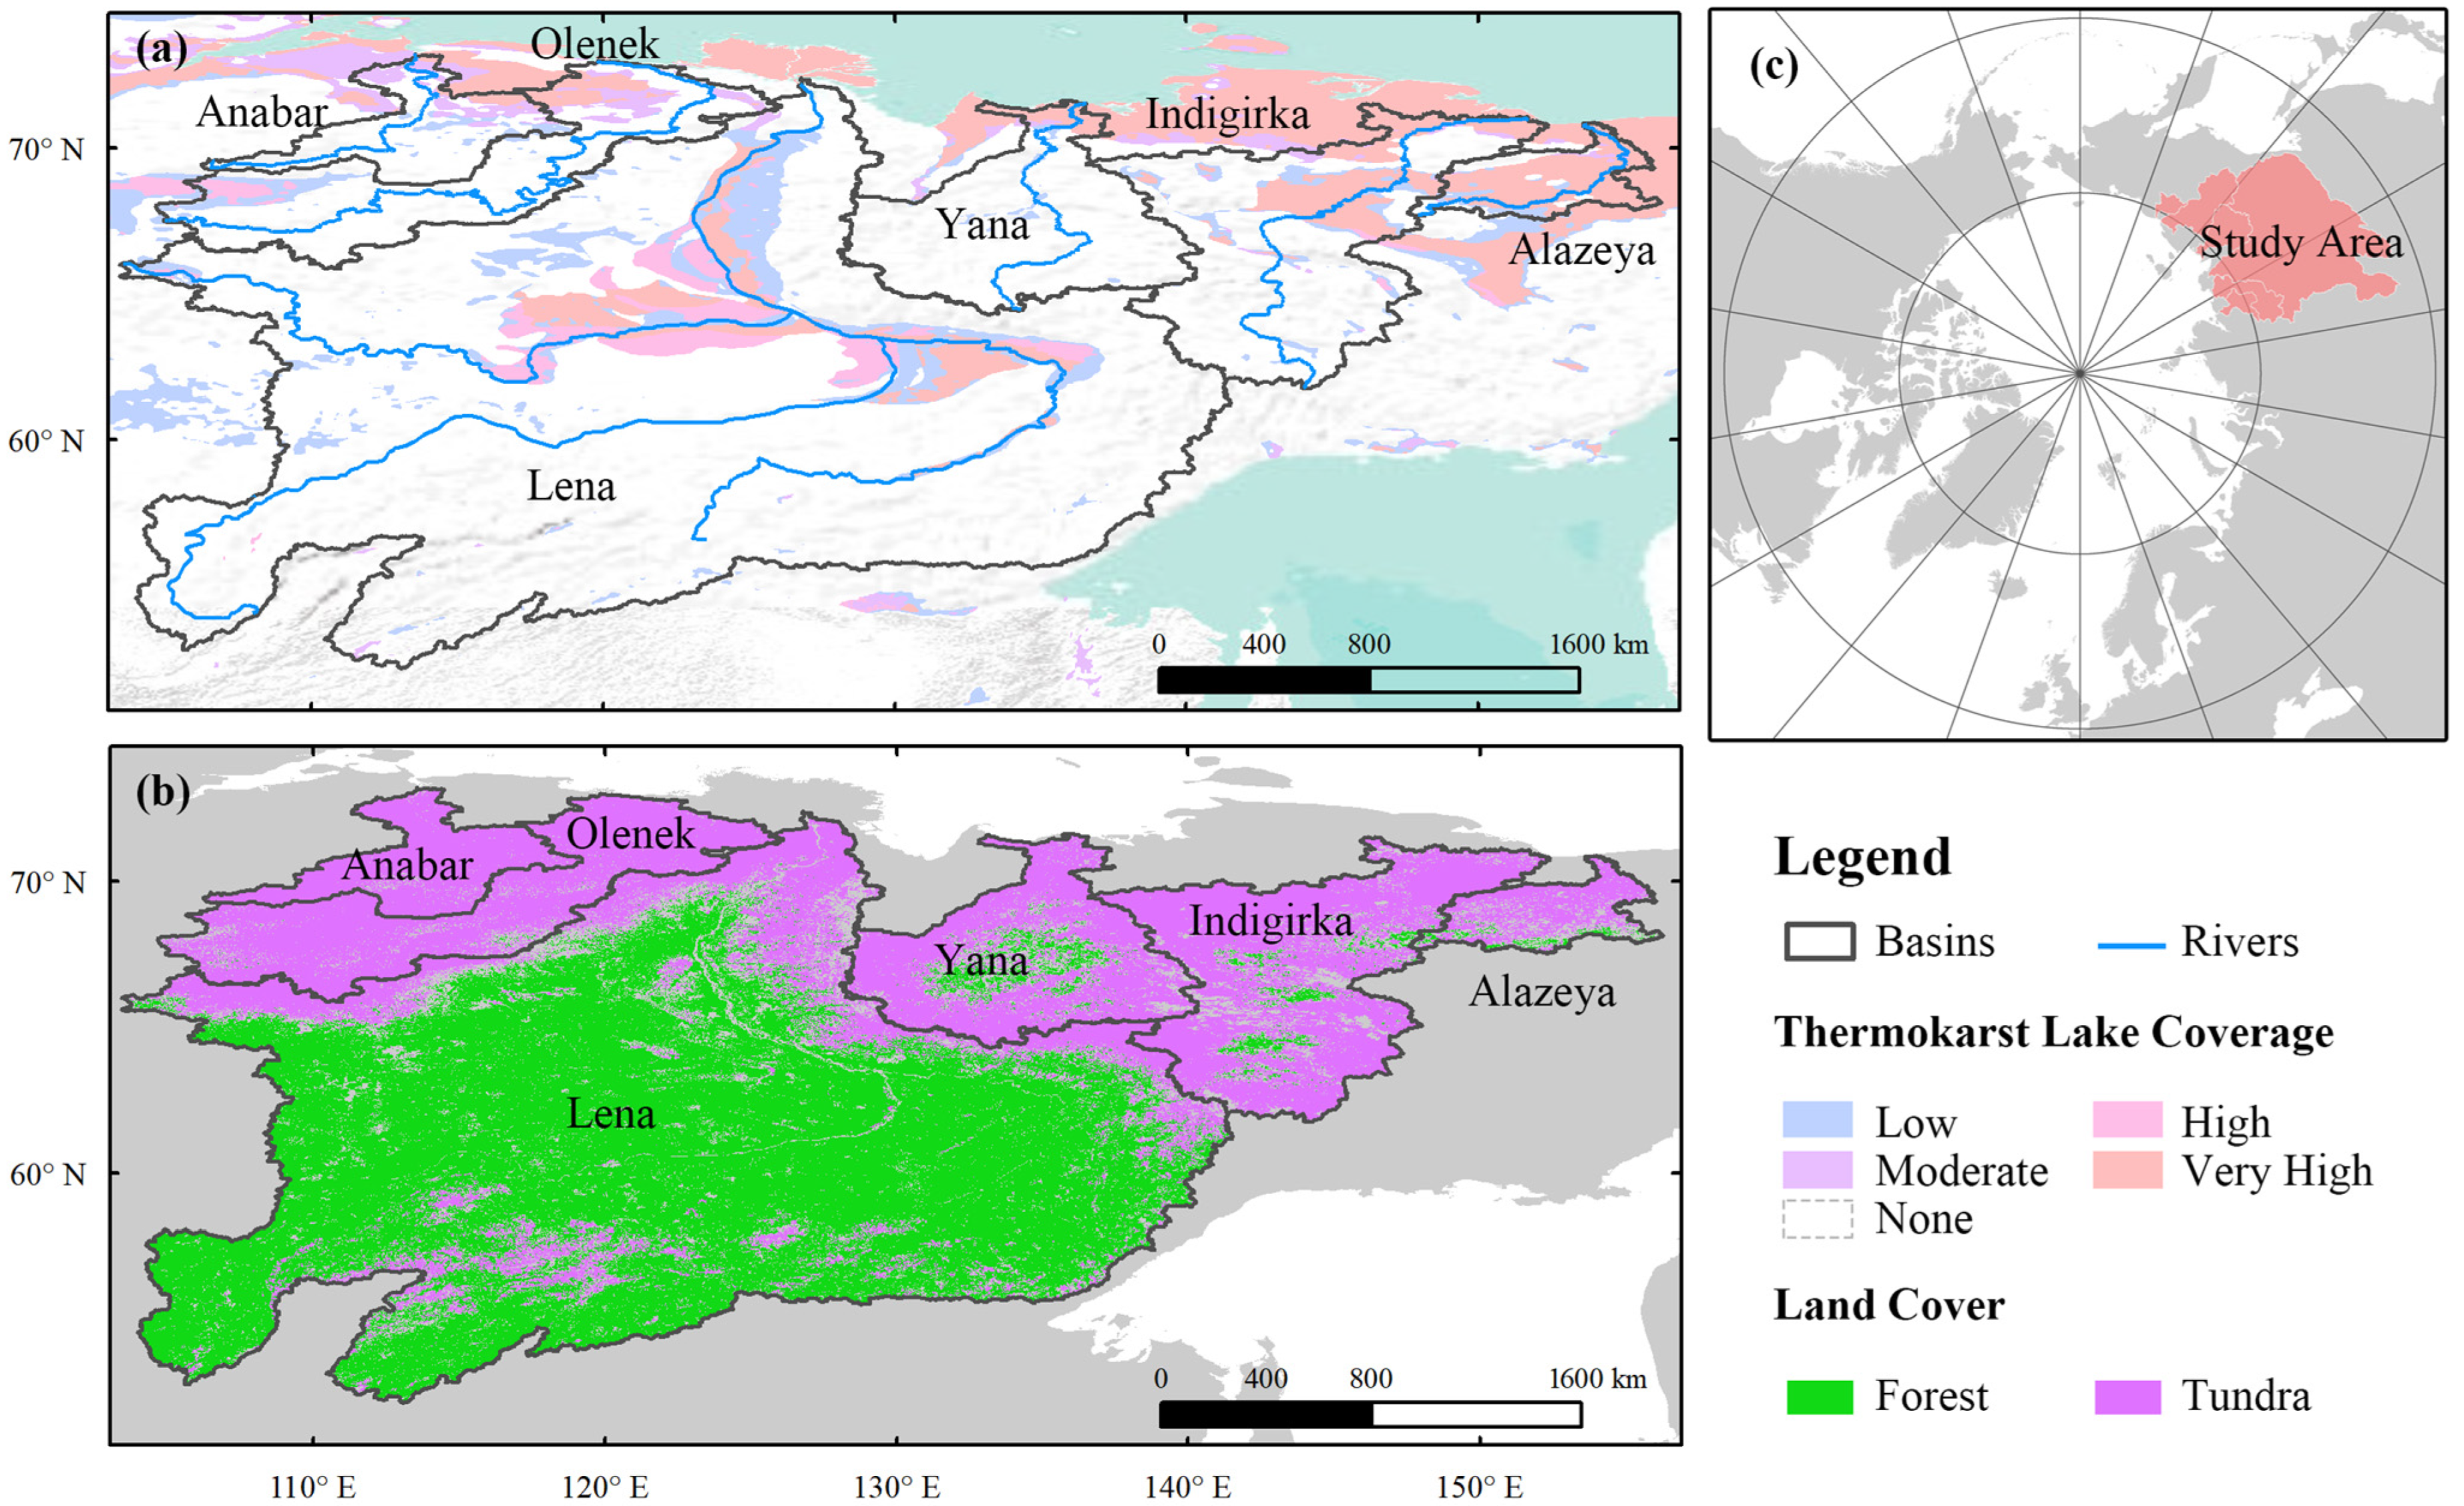
The study area encompasses the Lena River Basin and five adjacent northern catchments: Anabar, Olenek, Yana, Indigirka, and Alazeya. Together, they cover approximately 3.4 × 10⁶ km2 (103.3°~156.3°E, 52.0°~73.3°N) in northeastern Siberia (Figure 1c). The elevation in the study area ranged from 0 to approximately 2665 m above sea level, with an average of 529 m. The long-term mean annual temperature is −9.6 °C, and the mean annual precipitation is 349.1 mm (Table 1; Figure S1). The main plant biomes in the study area include taiga and tundra (Figure 1b), generally following a south–north gradient, with forest patches extending into lowland areas of the upper Yana River basin. Forest areas are primarily composed of boreal coniferous species such as Pinus sibirica, Picea obovata, Abies sibirica, Larix sibirica, and Pinus sylvestris, together with birch; tundra vegetation is dominated by mosses, lichens, perennial grasses, and shrubs [45,46].
This region is predominantly underlain by continuous permafrost, covering 78.36% of the study area (70.05% in the Lena Basin and nearly 100% in the other catchments) [47]. Under ongoing permafrost degradation, thermokarst lakes and associated drainage events are widespread. According to the spatial distribution of thermokarst lake coverage (Figure 1a), most areas within the study region remain without significant thermokarst lake development. However, extensive clusters of thermokarst lakes occur along the middle Lena River floodplain, while only sparse occurrences are found in parts of the lower Anabar and Olenek lowlands. In contrast, the middle–lower Indigirka Basin and the entire Alazeya catchment contain large areas classified as very high thermokarst lake coverage (60–100%). However, because only 11 forest pixels are located in the low thermokarst lake coverage category (1–10%; Table 1), this category is excluded from subsequent analyses to avoid potential bias.

2.2. Dataset

In this study, we utilized MODIS/Terra Vegetation Indices 16-Day L3 Global 250 m (MOD13Q1, Version 6.1) data and selected data products from 2001 to 2021 to synthesize the NDVI for analyzing the spatiotemporal changes in vegetation cover in the study area. The MOD13Q1 product, provided by NASA (https://doi.org/10.5067/MODIS/MOD13Q1.061, accessed on 28 January 2025), has a spatial resolution of 250 m and a temporal resolution of 16 days. 16-day NDVI composites were aggregated to monthly values by averaging all observations within each month.
The influential factor data used in this study include air temperature (Tem), precipitation (Pre), soil temperature (ST), soil moisture (SM), and wildfire burned area (WBA). In addition, thermokarst lake coverage and vegetation type were incorporated as static gradient classes to partition the landscape into distinct geomorphic and land-cover groups for comparing NDVI trends and the relative importance of different drivers.
Monthly air temperature data at a spatial resolution of 0.5° for 2001–2022 were obtained from the Climate Research Unit Time-Series (CRU) version 4.05 dataset (https://crudata.uea.ac.uk/cru/data/hrg/, accessed on 27 June 2024). Precipitation data were derived by averaging the monthly Global Precipitation Climatology Project (GPCP) dataset (https://www.ncei.noaa.gov/access/metadata/landing-page/bin/iso?id=gov.noaa.ncdc:C00979, accessed on 5 January 2025) and Multi-Source Weighted-Ensemble Precipitation (MSWEP) dataset (https://www.gloh2o.org/mswep/, accessed on 2 February 2025), both providing precipitation estimates for the period 2001–2022. The original spatial resolutions of GPCP and MSWEP are 1° and 0.05°, respectively. To harmonize the datasets at a common 0.1° grid, the coarser GPCP data were resampled using nearest-neighbor interpolation, whereas the finer MSWEP data were resampled using bilinear interpolation. The resampled datasets were then averaged with equal weighting (1:1) to produce the final precipitation product. The merged dataset was validated against Russian meteorological station observations from the Carbon Dioxide Information Analysis Center (https://cdiac.ess-dive.lbl.gov/ndps/russia_daily518.html, accessed on 18 August 2025) and the Russian Meteorological Station database (http://aisori-m.meteo.ru, accessed on 18 August 2025), showing high agreement (R2 > 0.9; Figure S2), indicating that the resampling and merging procedure reliably captures regional precipitation patterns relevant for NDVI analyses.
We used the 2002–2021 soil moisture (SM) data (0–5 cm) developed by Yao et al. [48] (https://cstr.cn/18406.11.Soil.tpdc.270960, accessed on 5 March 2025) derived from the Remote Sensing-based Global Surface Soil Moisture Decadal Dataset (RSSSM) covering 2003–2022, with a 0.1° spatial resolution. The soil moisture dataset was used to calculate interannual trends, and values for 2001–2002 were estimated based on the ratio of the trend slopes to their long-term monthly means to ensure temporal consistency across the study period.
Soil temperature (ST; 0–7 cm) was obtained from the fifth-generation ECMWF atmospheric reanalysis for land (ERA5-Land) monthly averaged reanalysis dataset at 0.1° spatial resolution for 2001–2021 (https://cds.climate.copernicus.eu/, accessed on 1 February 2025). Wildfire burned area data were obtained from the SeasFire Cube v0.4 dataset (https://zenodo.org/records/13834057, accessed on 24 March 2025), which contains global burned area data derived from the Fire Climate Change Initiative (FireCCI). The dataset covers 2001–2021 with a spatial resolution of 0.25° × 0.25° and an 8-day temporal resolution.
River networks and basin boundaries were obtained from the Hydrological data and maps based on SHuttle Elevation Derivatives at multiple Scales (HydroSHEDS, https://www.hydrosheds.org/, accessed on 24 August 2024) dataset. These data were only used for visualization of the study area (Figure 1) and were not included as predictors in the analysis.
We used the MODIS MCD12Q1 land cover dataset with a 500 m resolution (https://doi.org/10.5067/MODIS/MCD12Q1.061, accessed on 11 February 2025). To represent the average land cover conditions during the study period, the 2010 MODIS classification was used as the reference. Following the FAO-Land Cover Classification System (LCCS3) principles, we excluded three non-vegetated categories—barren land (Class 1), permanent snow and ice (Class 2), and water bodies (Class 3). The remaining land cover categories were grouped into two major categories: (1) forest, including both open and dense forests (tree cover > 10%), and (2) tundra, encompassing all other vegetated surfaces.
Thermokarst lake distribution data were obtained from the Arctic Circumpolar Distribution and Soil Carbon of Thermokarst Landscapes, 2015 dataset (https://www.earthdata.nasa.gov/data/catalog/ornl-cloud-thermokarst-circumpolar-map-1332-1, accessed on 24 March 2025). This dataset has been used as a baseline spatial stratification in previous regional analyses of thermokarst landscapes [26,38]. The regional coverage was derived using an expert evaluation and subtractive scoring system that integrates six landscape characteristics: permafrost zonation, ground ice content, sediment thickness, terrestrial ecoregion, topographic ruggedness, and histel coverage. Each polygon was scored for the likelihood of thermokarst occurrence, and fractional coverages were adjusted to account for overlapping wetland, lake, and hillslope landscapes. Regional thermokarst lake coverage is classified into five levels (L0–L4): Very High (60–100%), High (30–60%), Moderate (10–30%), Low (1–10%), and None (0–1%). Because this thermokarst map represents the persistent geomorphic context and potential landscape template rather than instantaneous water extent [40], it is appropriate to use as a static stratification variable for analyzing 2001–2021 NDVI trends.
For consistency across datasets, all variables were resampled to a common spatial resolution of 0.1° prior to analysis. Thermokarst lake coverage, originally provided as polygon-based fractional classes, was converted to a 0.1° raster grid and used as a static stratification variable representing the dominant thermokarst landscape category within each grid cell.

2.3. Methodology

2.3.1. Mann–Kendall Trend Test and Theil–Sen Slope Estimator

Theil–Sen slope estimator [49] estimates the median of all pairwise slopes within a time series, providing a robust measure of trend magnitude that effectively mitigates the influence of random noise and outliers. However, it does not by itself assess the statistical significance of the detected trend. The Mann–Kendall test [50,51] is a non-parametric statistical method commonly used to assess the significance of monotonic trends in time series data. Its advantages lie in not requiring the data to be normally distributed or independent, and it is relatively insensitive to outliers and missing values [52,53]. The combined Sen’s slope and Mann–Kendall trend analysis has been widely applied in hydrology, climatology, and ecology to detect long-term trends in environmental variables [54,55,56,57].
Assuming the time series of the growing-season mean NDVI or other influential factors is represented as x 1 , x 2 , , x n , the Sen’s slope and Mann–Kendall trend analysis is expressed as follows:
β = M e d i a n ( x j x i j i )
S = i = 1 n 1 j = i + 1 n s i g n ( x j x i )
Z = S 1 n ( n 1 ) ( ( 2 n ) + 5 ) 18 , S > 0                 0 ,                     S = 0 S + 1 n ( n 1 ) ( ( 2 n ) + 5 ) 18 , S < 0
In Equations (1)–(3), β represents the Sen’s slope, indicating the magnitude of the trend, and S is the test statistic used to detect trends in hydrological or climatic time series. x i and x j denote the observations in years i and j , respectively. The sign function takes values of 1, 0, and −1 when x j > x i , x j = x i , and x j < x i , respectively. The standardized test statistic Z follows a standard normal distribution, where its positive and negative values indicate increasing and decreasing trends, respectively. For a given significance level α , a trend is considered statistically significant if   Z   >   Z 1 α / 2 . In this study, the significance level was set at α = 0.05 , corresponding to a critical threshold of Z = 1.96 .

2.3.2. Partial Correlation Analysis

To investigate the relationships between growing-season NDVI and key climatic variables, partial correlation analysis was applied at the pixel level. Unlike simple correlation, which only measures the overall association between two variables, partial correlation quantifies the relationship between a dependent variable and a specific independent variable after accounting for other covariates. This method has been widely used in recent vegetation–climate studies to isolate the effects of individual climatic variables on NDVI [58,59].
In this study, the dependent variable was the annual mean NDVI over the growing season (April–September). The independent variables included the following: climatic factors—mean temperature and precipitation during the growing season (April–September) and the preceding winter (October– next March); soil factors—mean soil temperature and soil moisture during the growing season; and a disturbance factor—burned area during the growing season. Partial correlation coefficients were calculated for each independent variable at the pixel level, enabling a spatially explicit assessment of its unique effect on growing-season NDVI while simultaneously controlling for all remaining independent variables.
The calculation of partial correlation coefficients was based on the Pearson correlation matrix R constructed from all variables, including the dependent variable y (NDVI) and n independent variables x 1 , x 2 , , x n . The resulting correlation matrix R has a dimension of n + 1 ) × ( n + 1 . Let C = R 1 denote the inverse of the correlation matrix. Then, the partial correlation coefficient between the independent variable x i and the dependent variable y is given by
R x i y = C x i y C x i x i C y y
where C x i y is the element of the inverse correlation matrix corresponding to x i and y , and C x i x i and C y y are the corresponding diagonal elements.

2.3.3. Random Forest Regression

To quantify the relative contributions of influential factors to vegetation dynamics, we applied a Random Forest (RF) regression model to monthly NDVI data for each pixel. Random Forest is a supervised ensemble learning algorithm based on decision trees, which constructs multiple regression trees using bootstrapped samples of the training data and randomly selects a subset of predictors at each split [60]. The final prediction is obtained by averaging the outputs of all individual trees, which reduces variance, mitigates overfitting, and enables handling of nonlinear and high-dimensional relationships [61,62]. Compared with other regression approaches, such as support vector regression (SVR) or boosting-based models, RF typically requires fewer hyperparameter adjustments and yields more consistent importance rankings [63,64], which is particularly suitable when the primary objective is driver attribution.
In this study, the model included five predictor variables: monthly mean temperature, precipitation, soil temperature, soil moisture, and burned area, with NDVI as the response variable. We adopted a time-based split, with data from 2001–2015 used for model training and data from 2016–2021 reserved for independent validation.
To ensure reproducibility and obtain stable estimates of variable importance, hyperparameter tuning was performed using a representative subset of 1000 randomly selected pixels. A three-fold cross-validation strategy was applied during model calibration to optimize key hyperparameters, including the number of trees (100, 150, 200), the minimum number of samples required to split an internal node (3, 5, 7), and the minimum number of samples required at a leaf node (2, 3, 5), based on cross-validated coefficients of determination (R2). The optimized parameter set (number of trees = 200, node split = 5, leaf node = 3) was then fixed, and the RF model was trained using the full training dataset. Predictive performance was finally assessed using the coefficient of determination (R2) calculated for the independent validation period (2016–2021).
In addition to the pixel-level monthly analysis, RF regression was applied at the annual scale, with all pixels’ annual observations used to train a single model for the entire study region and each of the nine subregions. The dependent variable was the mean NDVI over the growing season, with independent variables including mean temperature and total precipitation during the growing season and winter, mean soil temperature, soil moisture, and total wildfire burned area during the growing season. The same hyperparameters and training–validation split as in the monthly models were applied. This annual analysis captures the key environmental factors of vegetation, while minimizing seasonal and phenological effects and complementing the pixel-level monthly results.

2.3.4. SHAP-Based Variable Importance

To explain the contributions of individual predictors to NDVI within the “black-box” Random Forest model, we employed SHAP (Shapley Additive Explanation) values, a machine learning interpretability method based on cooperative game theory (CGP) [65]. The method is based on the Shapley value, which attributes the overall outcome of a cooperative game to each participant, treating each machine learning prediction as a game in which the marginal contribution of each feature is evaluated across all possible feature combinations [66,67]. Formally, the SHAP value of feature is calculated as
ϕ i ( f , x ) = S N i   S   !   ( N S 1 ) !   N   ! [ f x S x i f x S ]
where f is the predictive function of the random forest model, N is the set of all features, S is any subset of features excluding x i , x S denotes the input restricted to the features in subset S , and N and S represent the number of features in N and S , respectively.
In this study, we used TreeSHAP, an efficient implementation of SHAP for tree-based models [68], implemented in the Python SHAP library (version 0.46.0). TreeSHAP values were used to decompose the prediction of the RF model for each observation into additive contributions of each feature, allowing the effect of a predictor to be expressed in the same units as NDVI. Positive SHAP values indicate that a feature increases the predicted NDVI for that observation, whereas negative values indicate a decreasing effect. At the monthly scale, mean absolute SHAP values were used to quantify the relative importance of each factor. At the annual regional scale, SHAP dependence plots were further examined for selected representative regions to visualize the nonlinear response patterns of NDVI to key variables.
Together, these SHAP-based analyses provide complementary insights into both the relative importance and the functional responses of environmental drivers across temporal and spatial scales. This approach allows detailed insights into complex, nonlinear relationships between NDVI and environmental drivers, and has been widely applied in ecology, hydrology, climate studies, and remote sensing research [67,69,70,71].

3. Results

3.1. Spatial and Temporal Patterns of NDVI

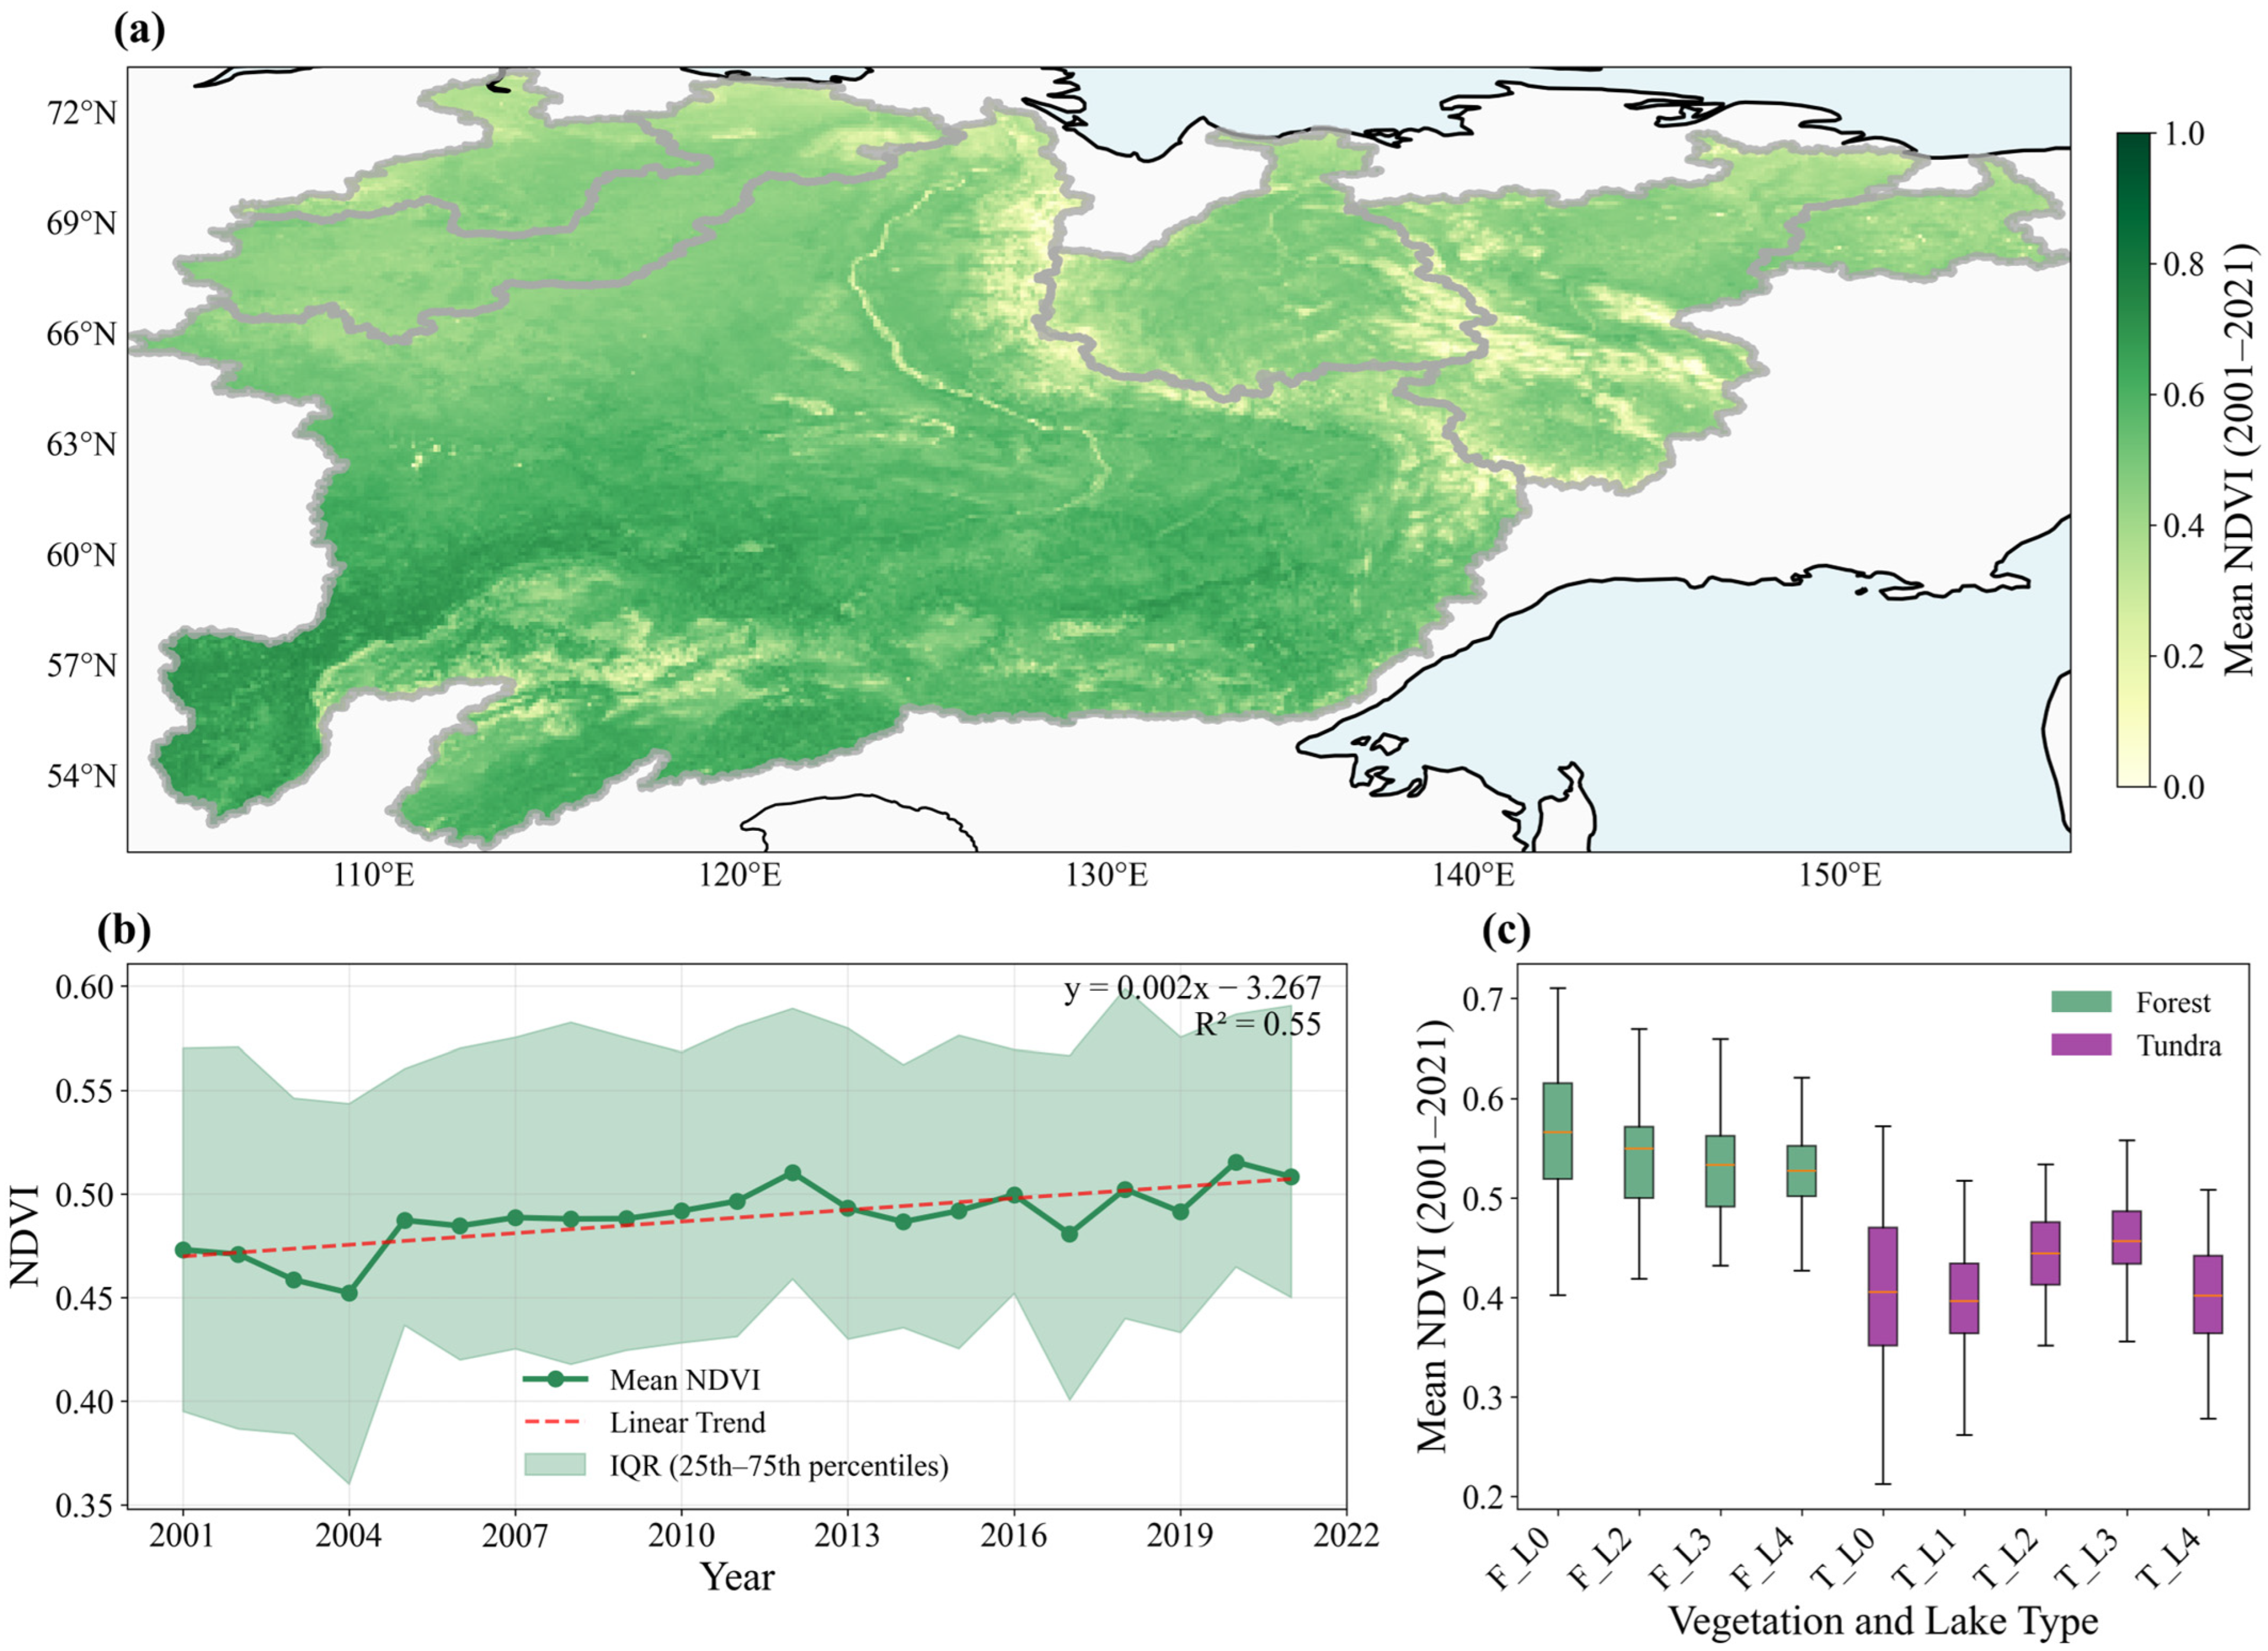
As shown in Figure 2, the average NDVI during the growing season (April–September) over the 2001–2021 period was 0.49, which generally exhibits a south–north decreasing pattern across the study area, except for the eastern and southern parts of the Lena River Basin and the southern high-latitude regions of the Yana and Indigirka River basins. This spatial pattern corresponds well with the vegetation zonation, characterized by forests in the south and tundra in the north. Within the same thermokarst lake coverage category, forest areas consistently show higher average NDVI values (0.56) than tundra areas (0.40). For a given vegetation type, forest areas without thermokarst lake distribution exhibit higher NDVI (0.57) than those with thermokarst lakes (0.53), which also exhibit the highest soil temperatures (2.15 °C; Table 1). Meanwhile, tundra areas without thermokarst lakes and those with the highest thermokarst lake coverage show comparable mean NDVI, whereas tundra areas with moderate and high thermokarst lake coverage (0.45 and 0.46) have relatively higher average NDVI than other lake coverage classes (none, low, and very high: 0.40, 0.39, 0.40). These variations correspond to soil moisture and soil temperature values reported in Table 1. L2–L3 areas exhibit intermediate soil moisture (0.17–0.18 m3/m3) and relatively higher soil temperatures (−0.94 to −0.77 °C), whereas L0 and L4 areas are drier or more saturated (0.14 and 0.29 m3/m3) and colder (−1.47 and −1.60 °C). From 2001 to 2021, the mean NDVI during the growing season increased notably from 0.47 to 0.51, corresponding to a rate of 0.02 per decade (Figure 2b).
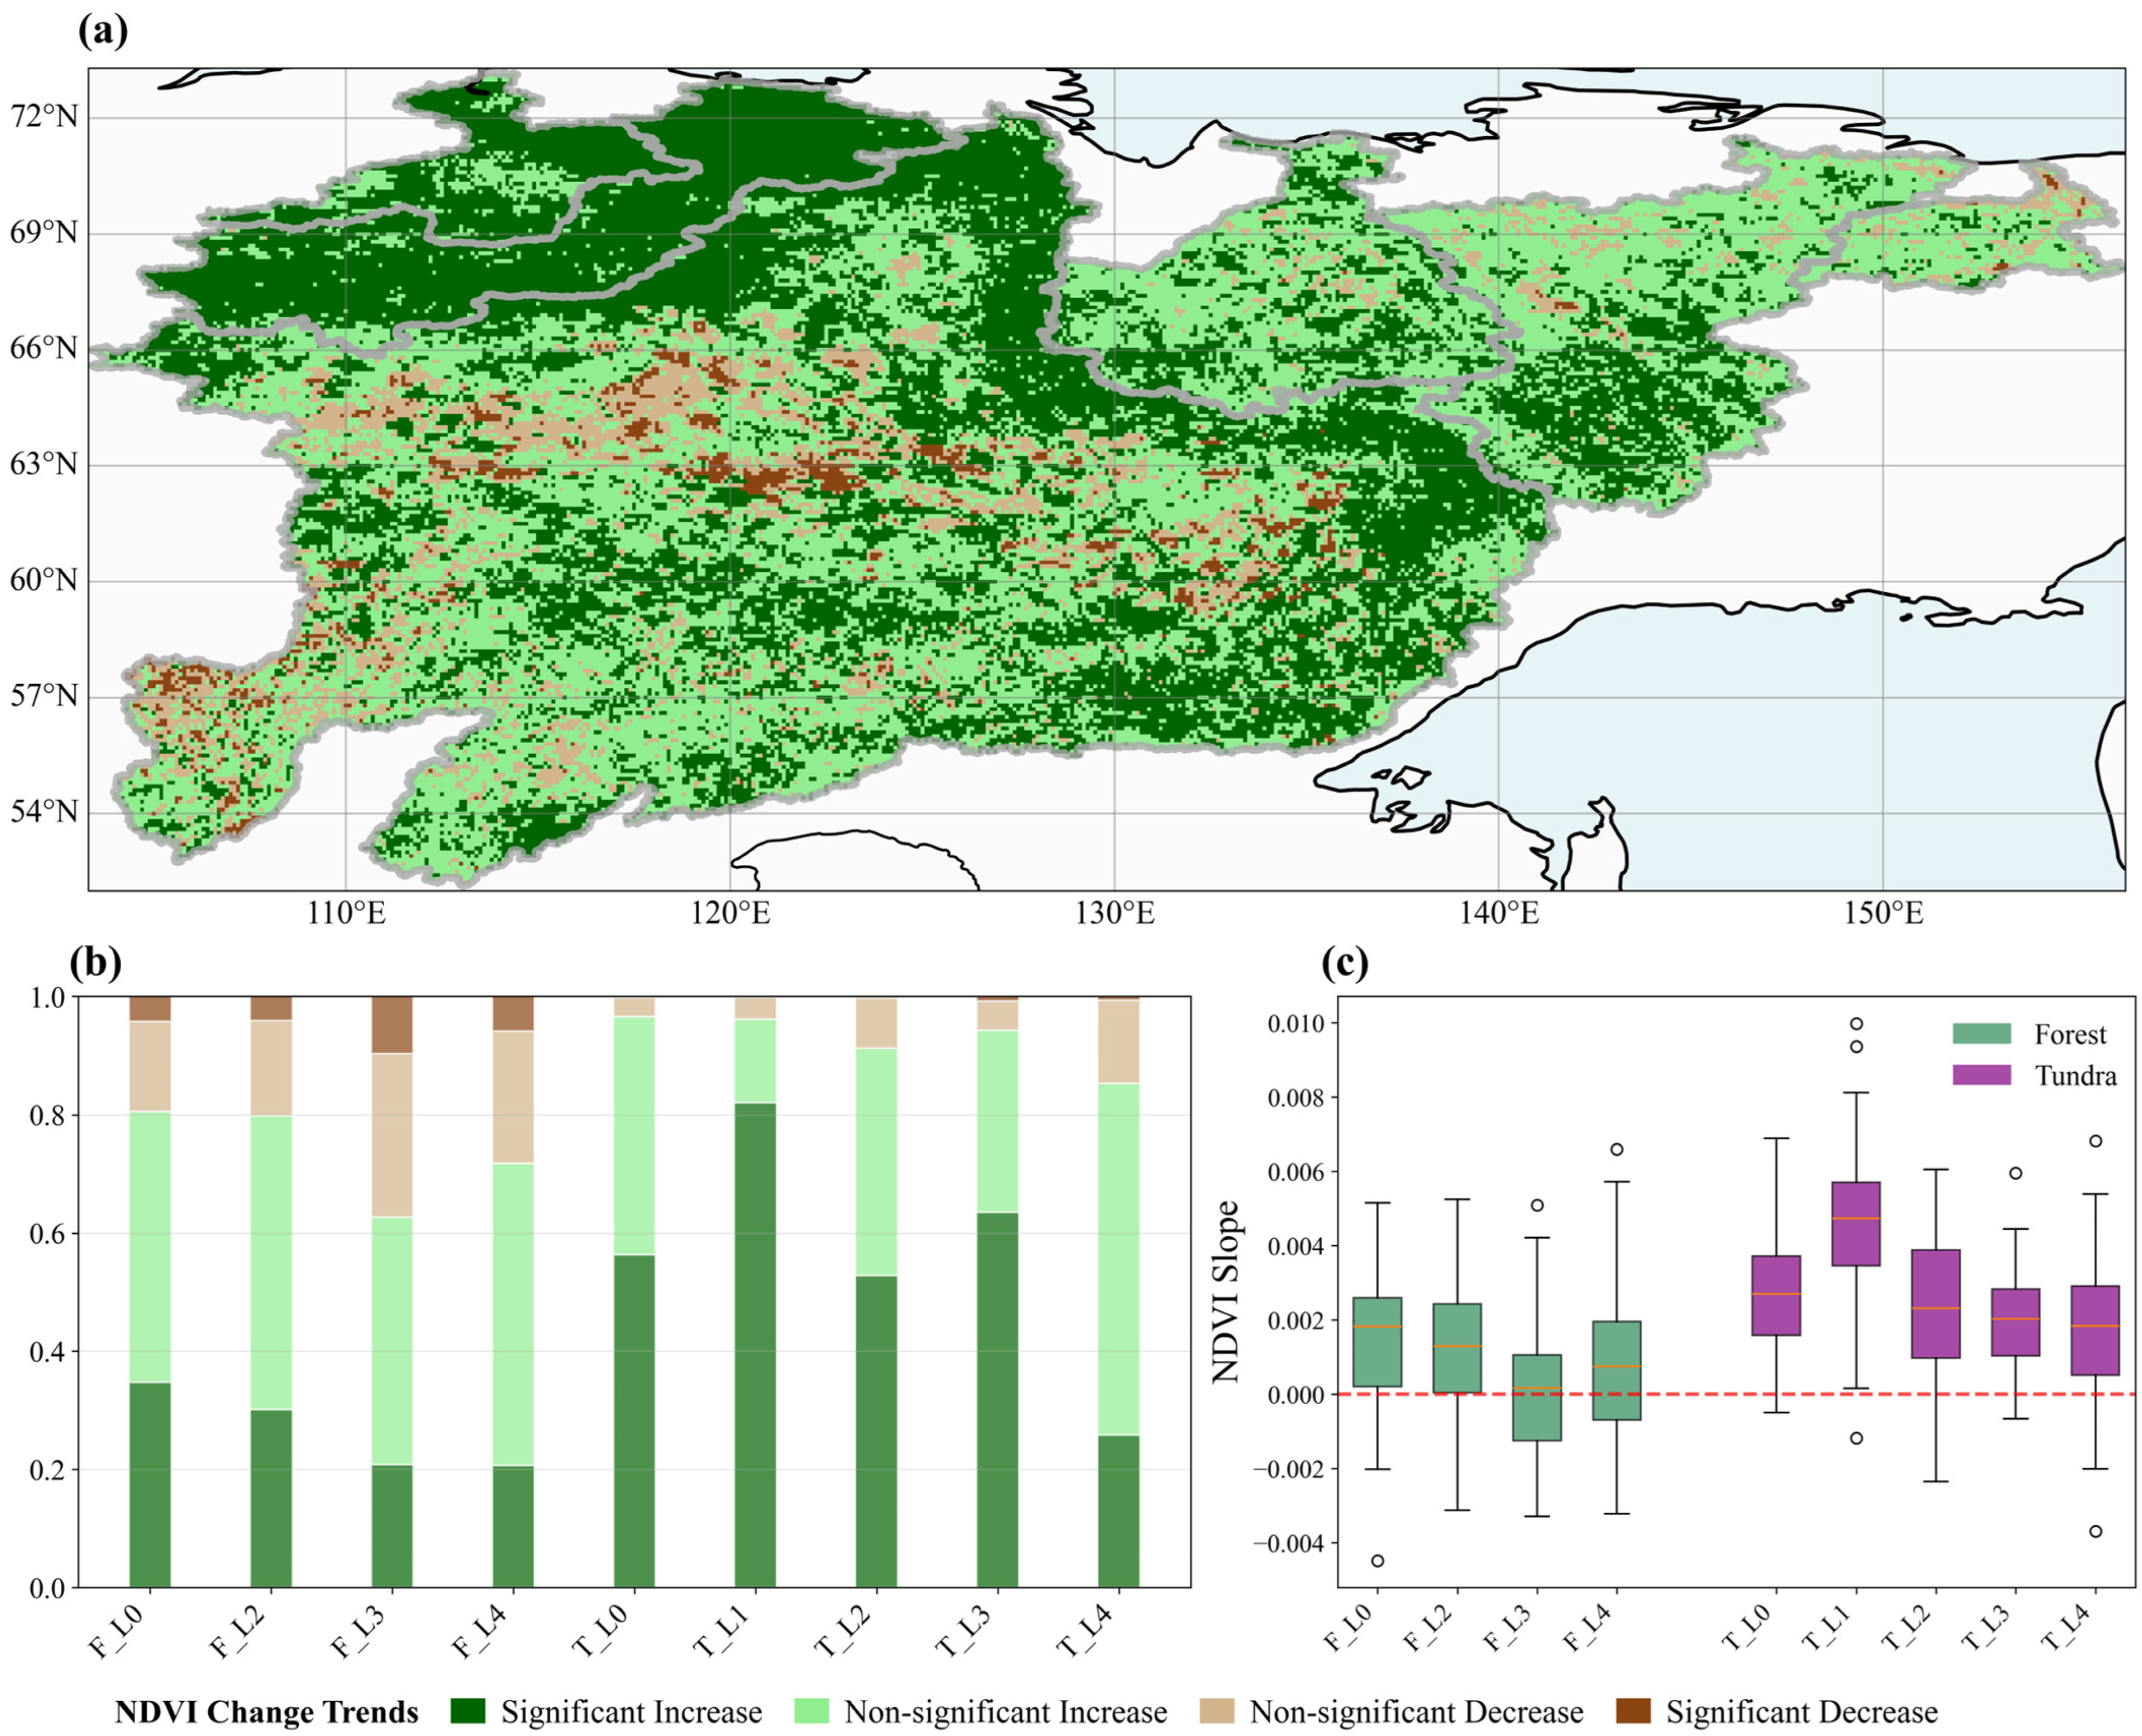
The spatial distribution of the average NDVI trend is shown in Figure 3a. The trend analysis indicates that most parts of the study area experienced a greening trend. Significant greening signals are particularly evident in high-elevation regions and in tundra areas within the Anabar and Olenek River basins. In contrast, browning areas are relatively scattered and mainly located in the mid- and southwestern low-elevation forested regions of the Lena River basin.
Comparing different thermokarst lake coverage categories, tundra generally exhibits faster greening than forests (Figure 3b,c). Within tundra areas, sites with low thermokarst lake coverage (L1) show the highest NDVI increase rate (0.0043 yr−1) and the largest proportion of significantly greening pixels (8.2%). Conversely, forest areas with high lake coverage (L3) display the slowest NDVI increase (0.0003 yr−1) and the highest proportion of significantly browning pixels (9.6%), with very high thermokarst lake coverage (L4) showing the second highest proportion (5.8%). Notably, the proportion of browning pixels generally increase with thermokarst lake level in both tundra and forest.
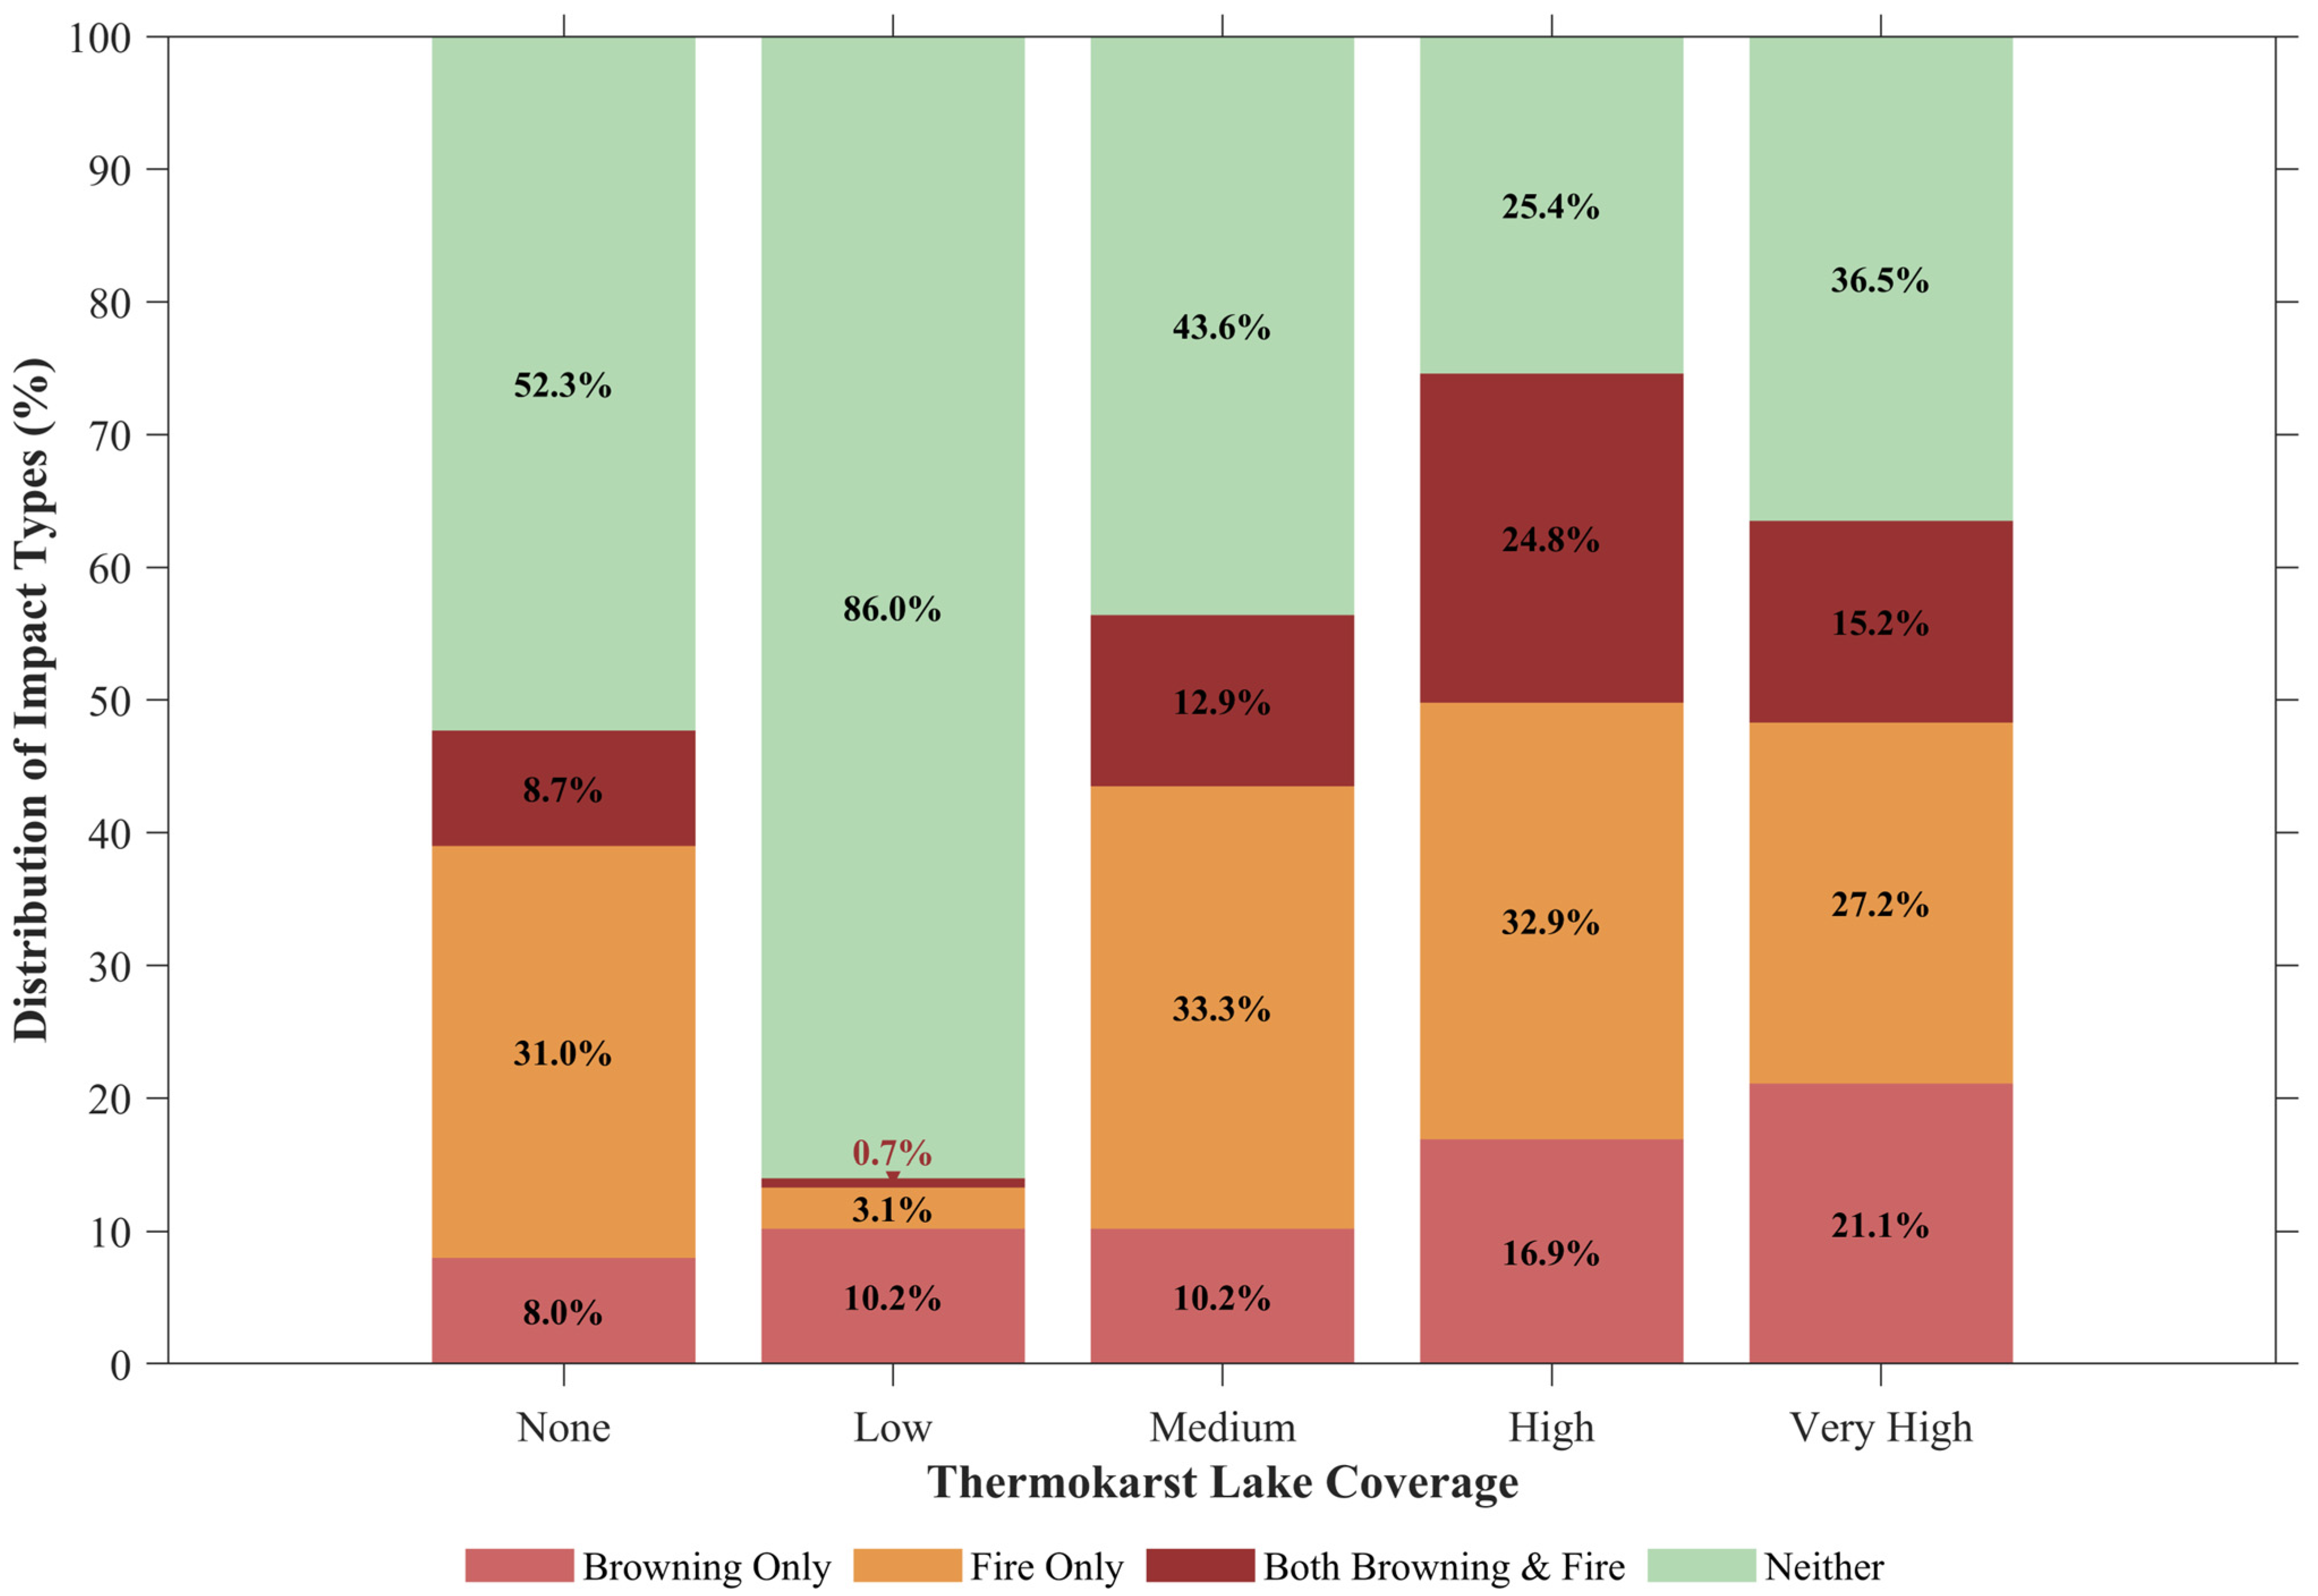
As shown in Figure 4, the proportions of browning pixels and burned pixels differ across thermokarst lake coverage categories. Except for the low-coverage class (L1), where the sample size is limited, the fraction of pixels that experienced wildfire range consistently between approximately 30% and 50% across all thermokarst lake categories. Among these, pixels affected only by fire account for roughly 30% and exhibit little variation with increasing thermokarst lake coverage.
In contrast, the proportion of pixels that only show browning increases markedly with higher thermokarst lake coverage. Specifically, the share of browning-only pixels rises from 8% in areas without thermokarst lakes to 21.1% in areas with very high thermokarst lake coverage. This observed increase in the proportion of browning-only pixels with thermokarst lake coverage occurs largely independently of wildfire-affected areas (Figure 4), suggesting that additional factors beyond wildfire may be associated with browning in high lake-coverage regions.

3.2. Partial Correlations Between NDVI and Influential Factors

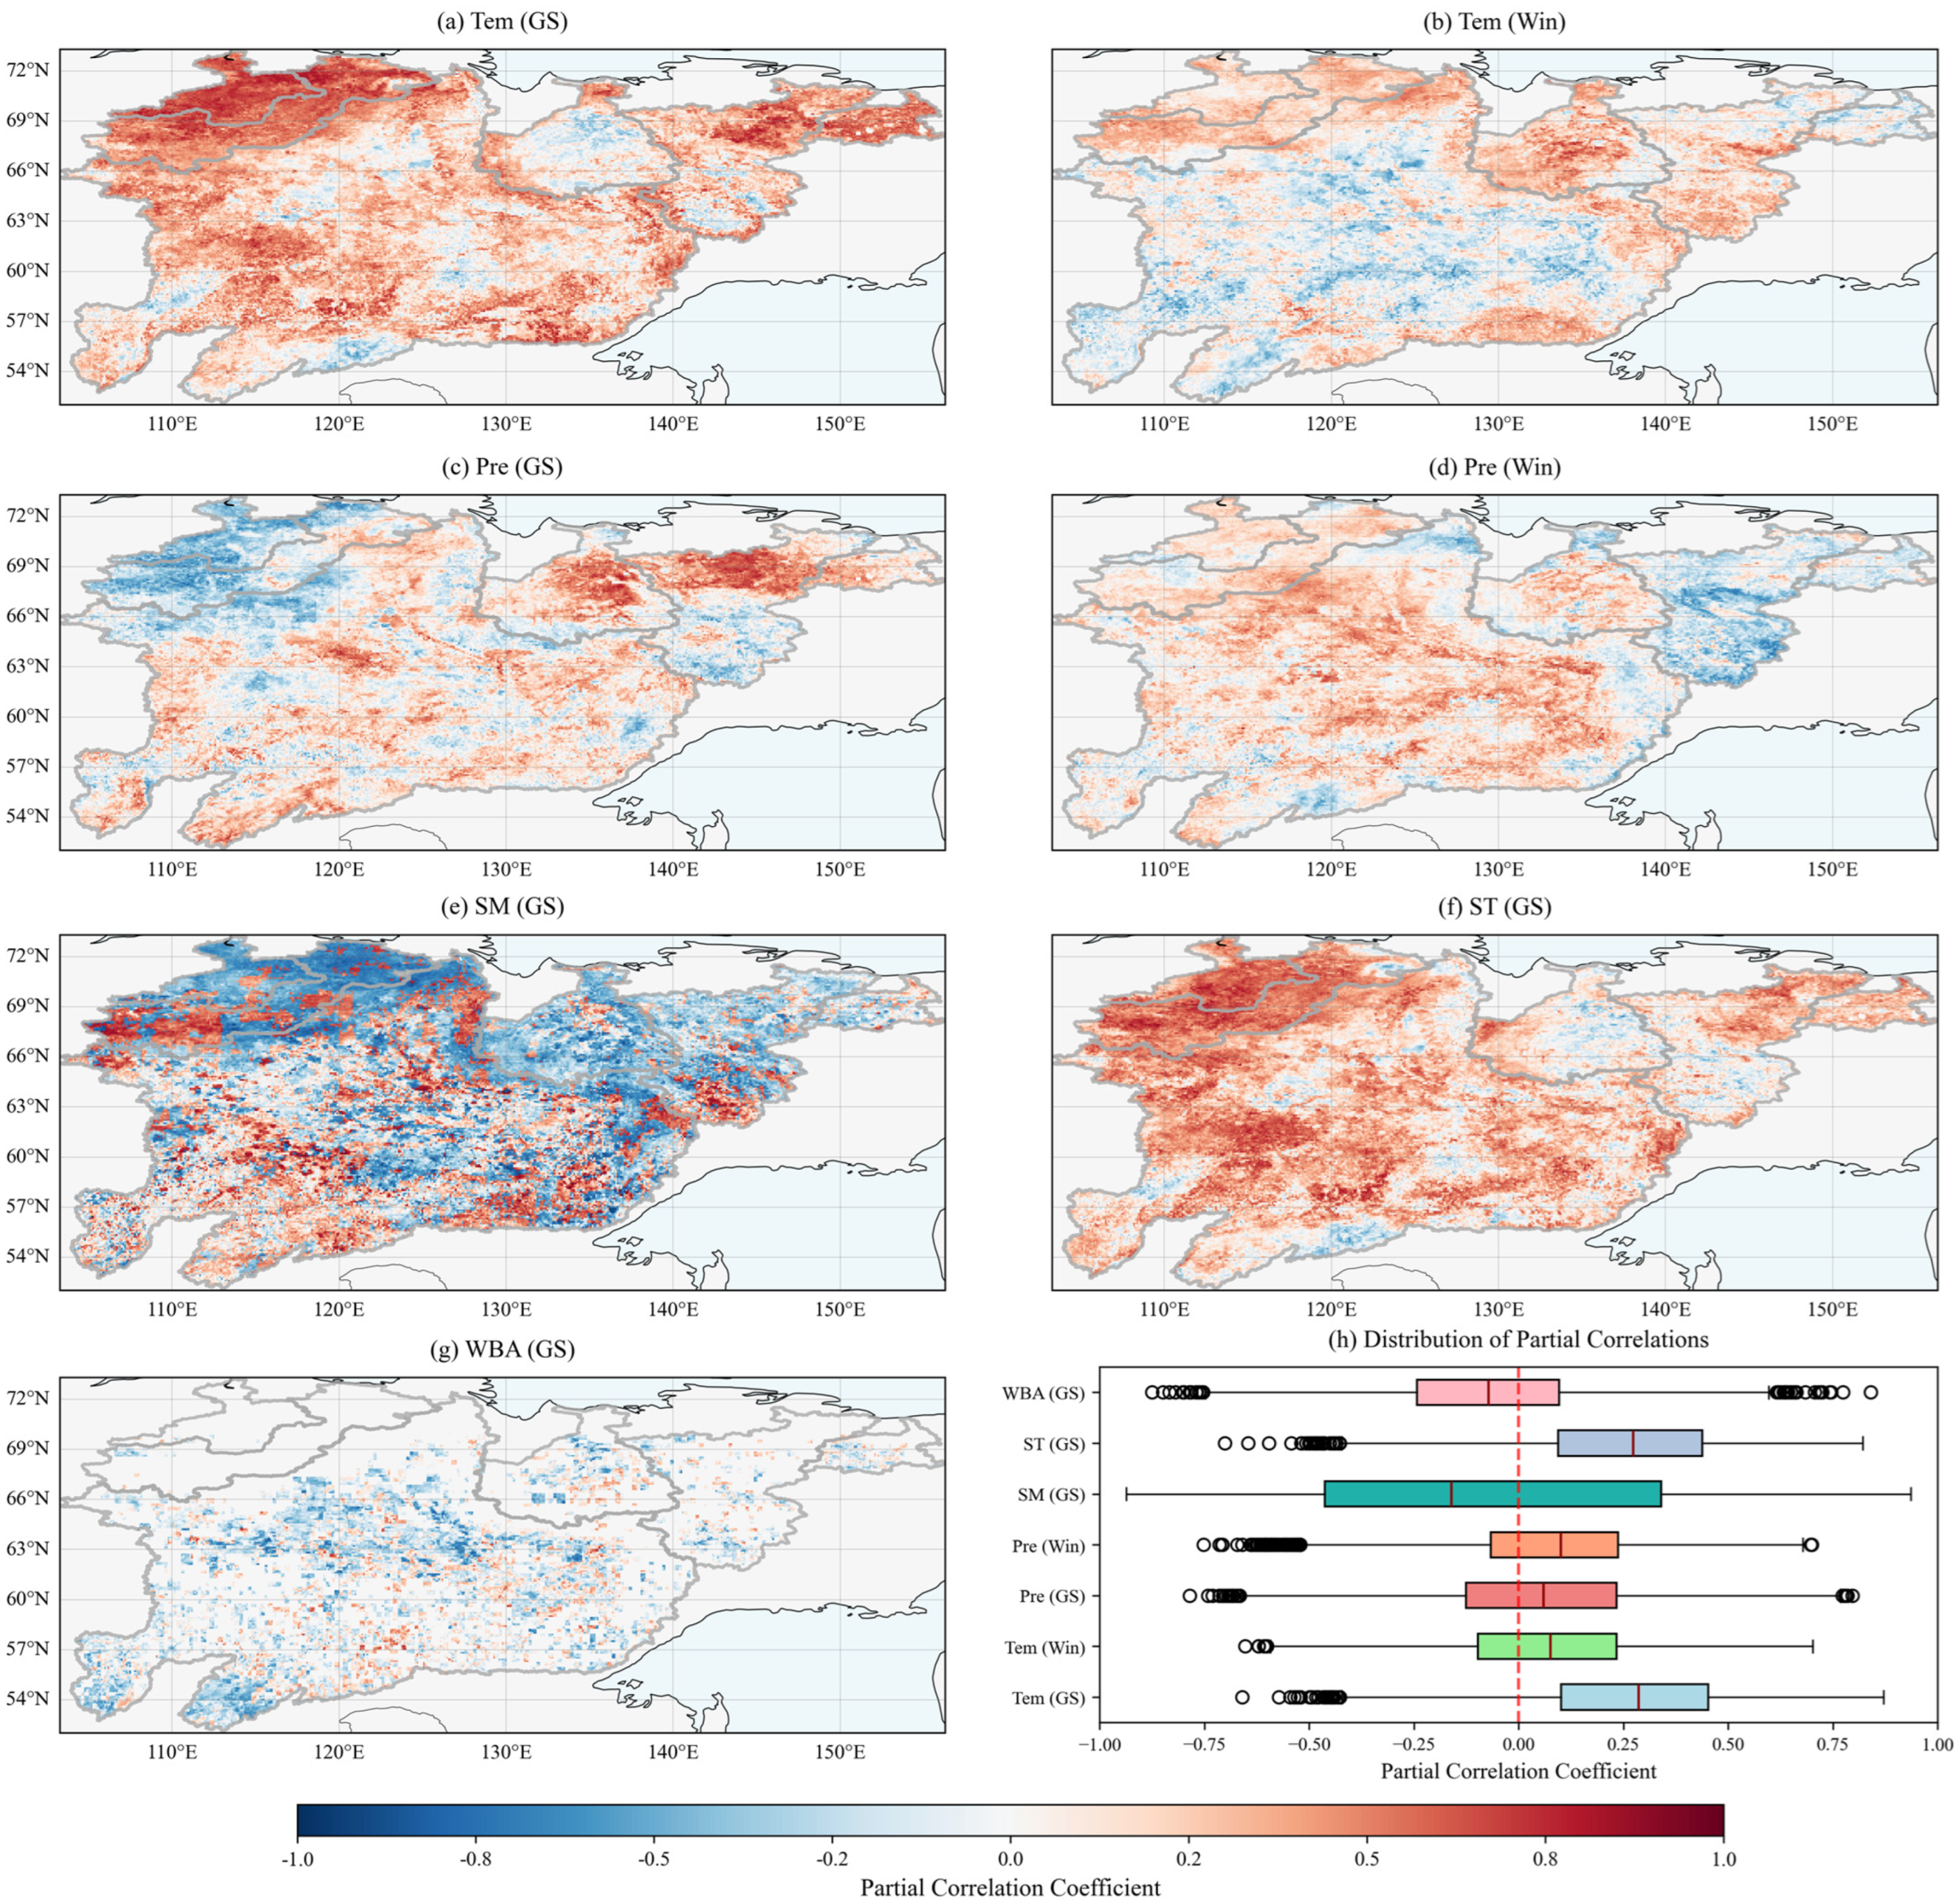
We performed a partial correlation analysis focusing on Tem and Pre during the growing season (April–September) and winter (October–March), as well as ST, SM, and wildfire burned area during the growing season. The results (Figure 5) show that, at the annual scale, when other variables were held constant, the average partial correlation coefficients between NDVI and growing-season Tem (0.27) and ST (0.26) were the highest across the study area. Their spatial patterns were largely consistent, showing negative correlations in the middle reaches of the Lena River and the upper and middle reaches of the Yana River, while positive correlations were observed in the downstream regions of other basins at higher latitudes. Compared with the growing-season variables, the partial correlation between NDVI and winter Tem was weaker (0.06), and its spatial pattern in the northeastern part of the study area was opposite to that of the growing-season Tem.
Growing-season Pre showed a weak overall positive partial correlation with NDVI (0.05), although negative correlations were concentrated in the northern part of the study area, particularly in the Anabar and Olenek basins and the Yana, Indigirka, and Alazeya River basins. Winter Pre exhibited a stronger overall positive partial correlation with NDVI (0.08), with positive correlations dominating the high-latitude regions.
In contrast, the partial correlations between NDVI and growing-season SM and WBA were generally negative, exhibiting pronounced spatial heterogeneity. The spatial pattern of SM correlations was almost opposite to that of Tem, showing positive correlations in the upper reaches and negative correlations in the high-latitude downstream regions. WBA showed negative correlations with NDVI in only 5.9% of the grid cells, primarily concentrated in the browning regions of the middle and southwestern Lena basin.
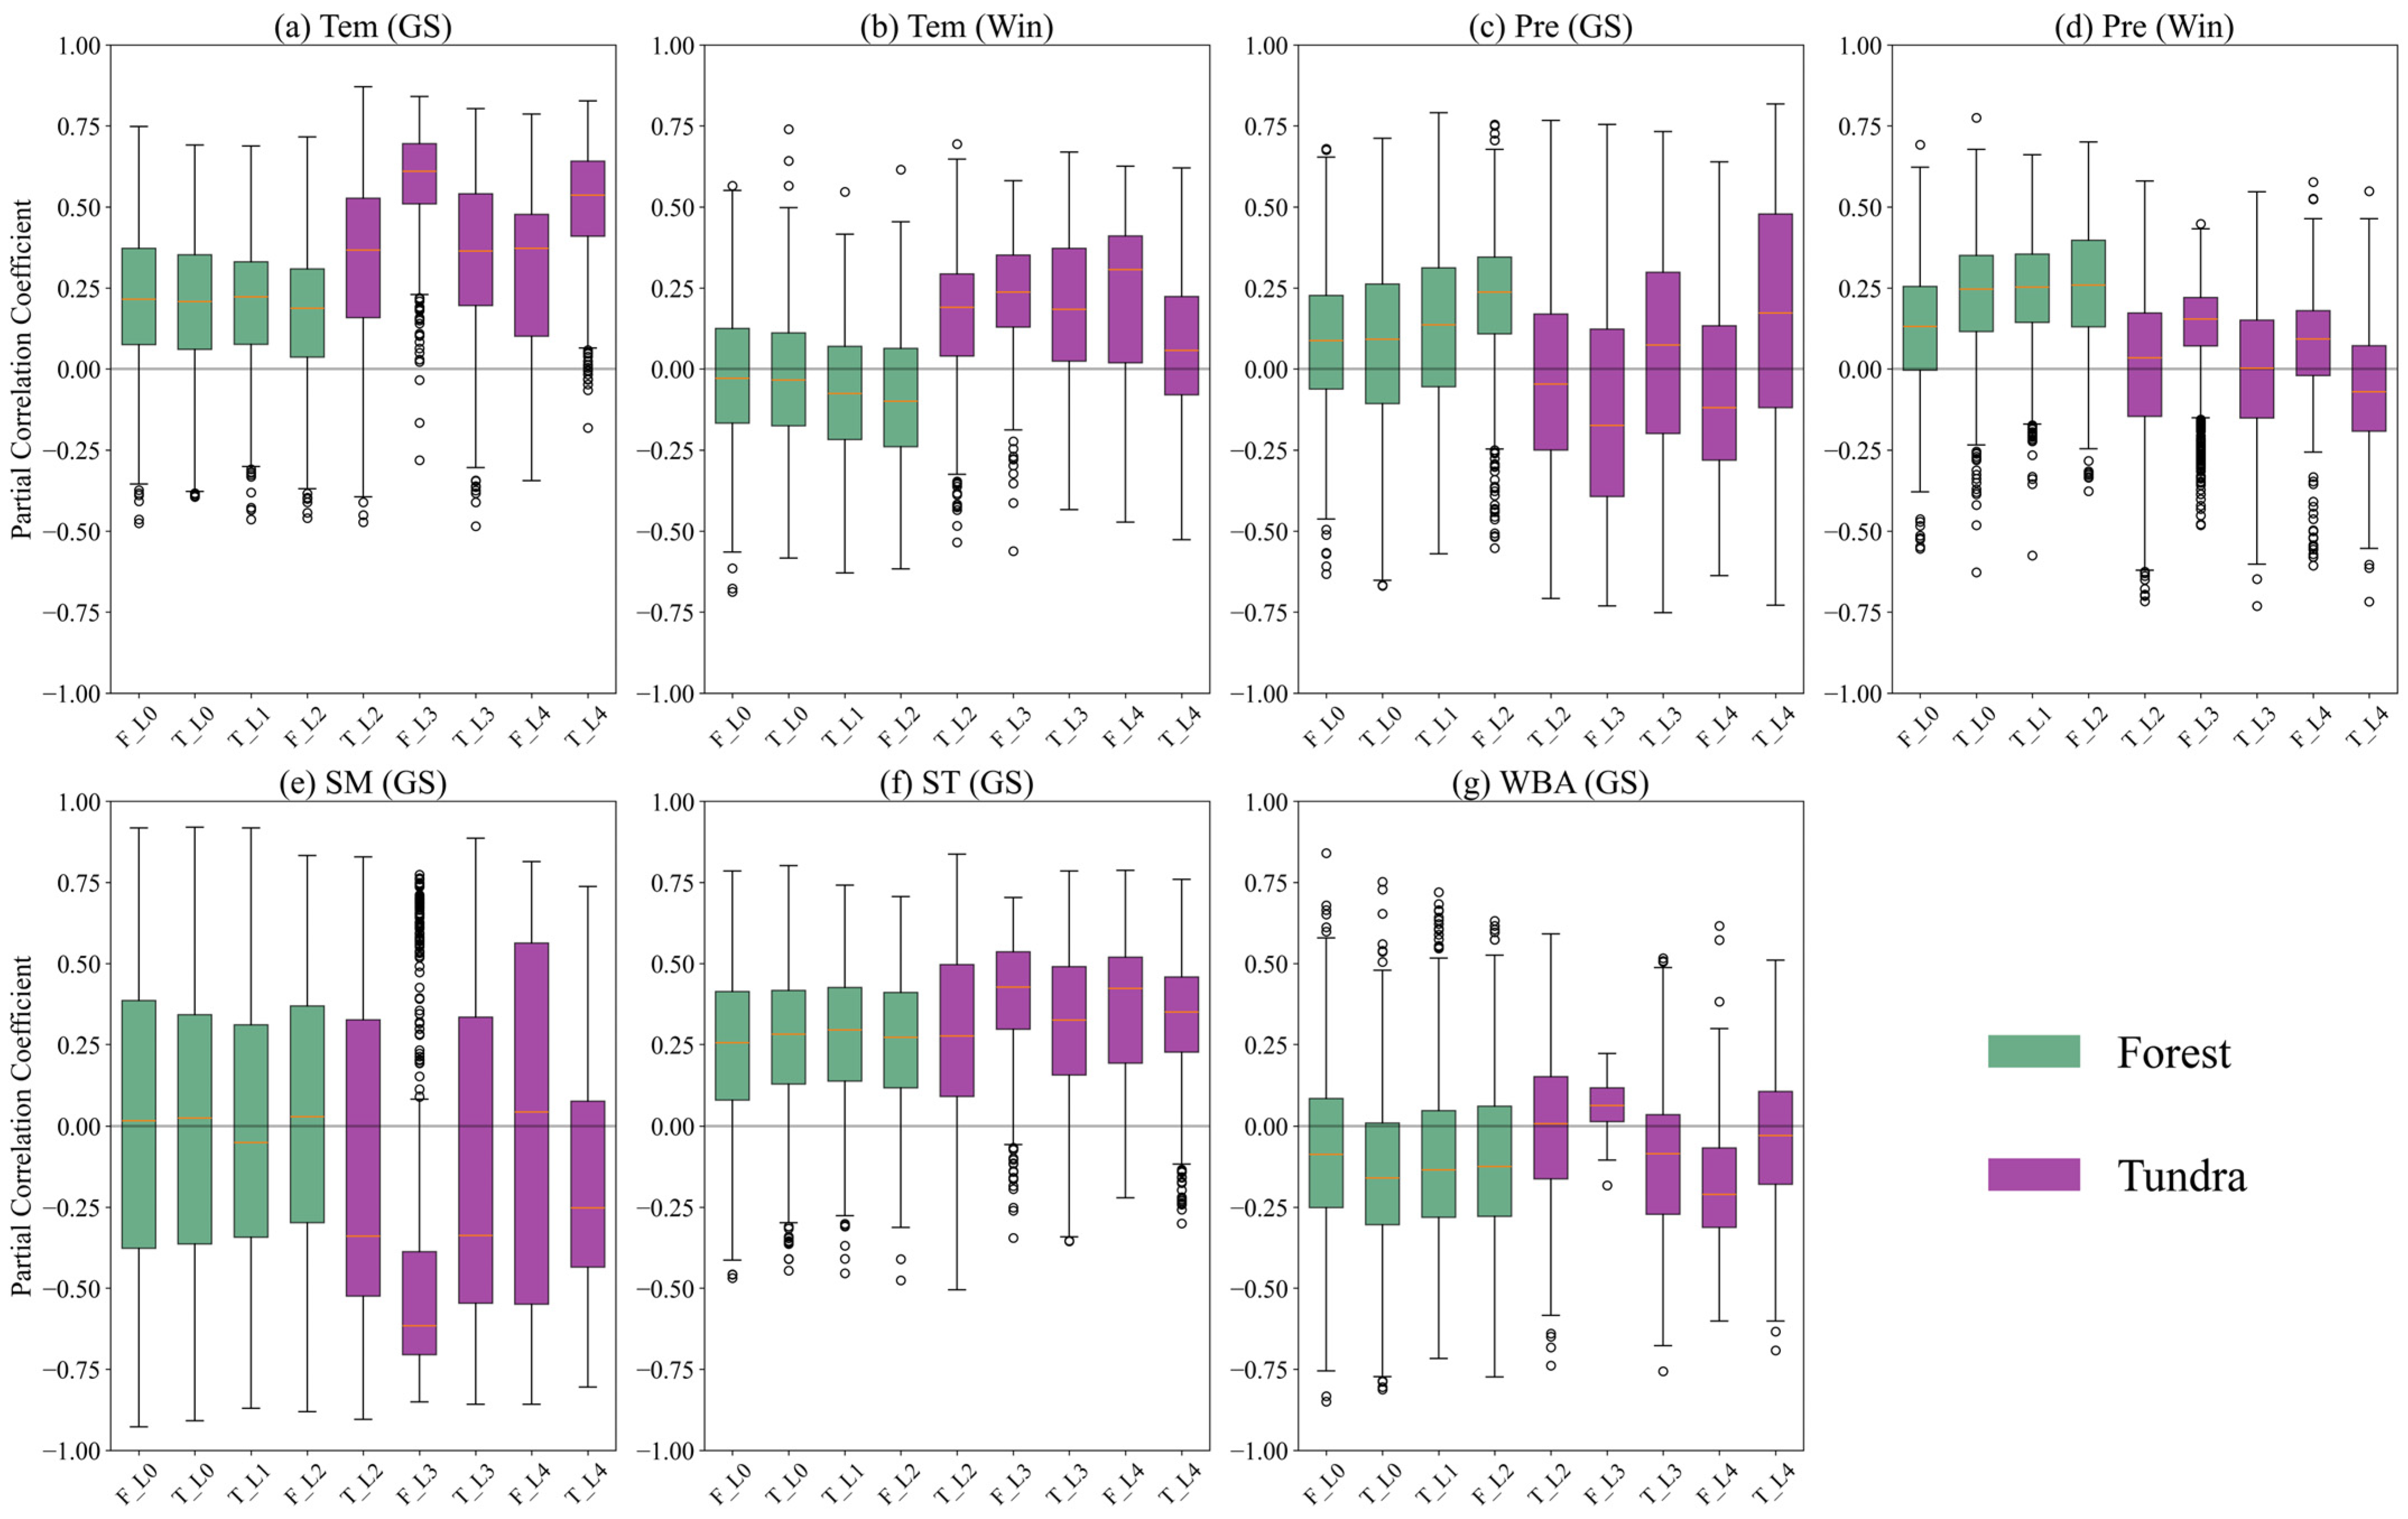
Based on vegetation and thermokarst lake coverage categories (Figure 6), the partial correlations show clear differences between tundra and forest ecosystems at the annual scale. Growing-season Tem and ST and winter Tem exhibit markedly stronger positive partial correlations with tundra NDVI than with forest NDVI. Notably, forest NDVI shows a negative partial correlation with winter Tem, and this negative relationship becomes stronger with increasing thermokarst lake coverage. Growing-season and winter Pre are positively correlated with forest NDVI; however, in areas with intensified thermokarst lake development, Pre exhibits negative correlations with tundra NDVI. Growing-season SM shows comparable proportions of positive and negative correlations with forest NDVI, whereas tundra NDVI is dominated by negative correlations. WBA exhibits a predominantly negative relationship with NDVI across vegetation types, with the negative association being more pronounced for forests than for tundra.
Across the entire study area (Table S1), growing-season Tem and ST are the strongest predictors of NDVI, with mean partial correlation coefficients of 0.27 and 0.26, respectively. Winter air temperature and precipitation also show relatively large proportions of positive correlations with NDVI (61.8% and 66.5%). In contrast, growing-season precipitation and soil moisture exhibit nearly balanced positive and negative correlation proportions (40–60%), with soil moisture showing the highest proportion of strong correlations (36.2%) and a mean partial correlation coefficient of −0.08. WBA shows the lowest proportion of positive correlations with NDVI (4.7%), consistent with its predominantly suppressive effect on vegetation activity.

3.3. Importance Distribution of Influential Factors

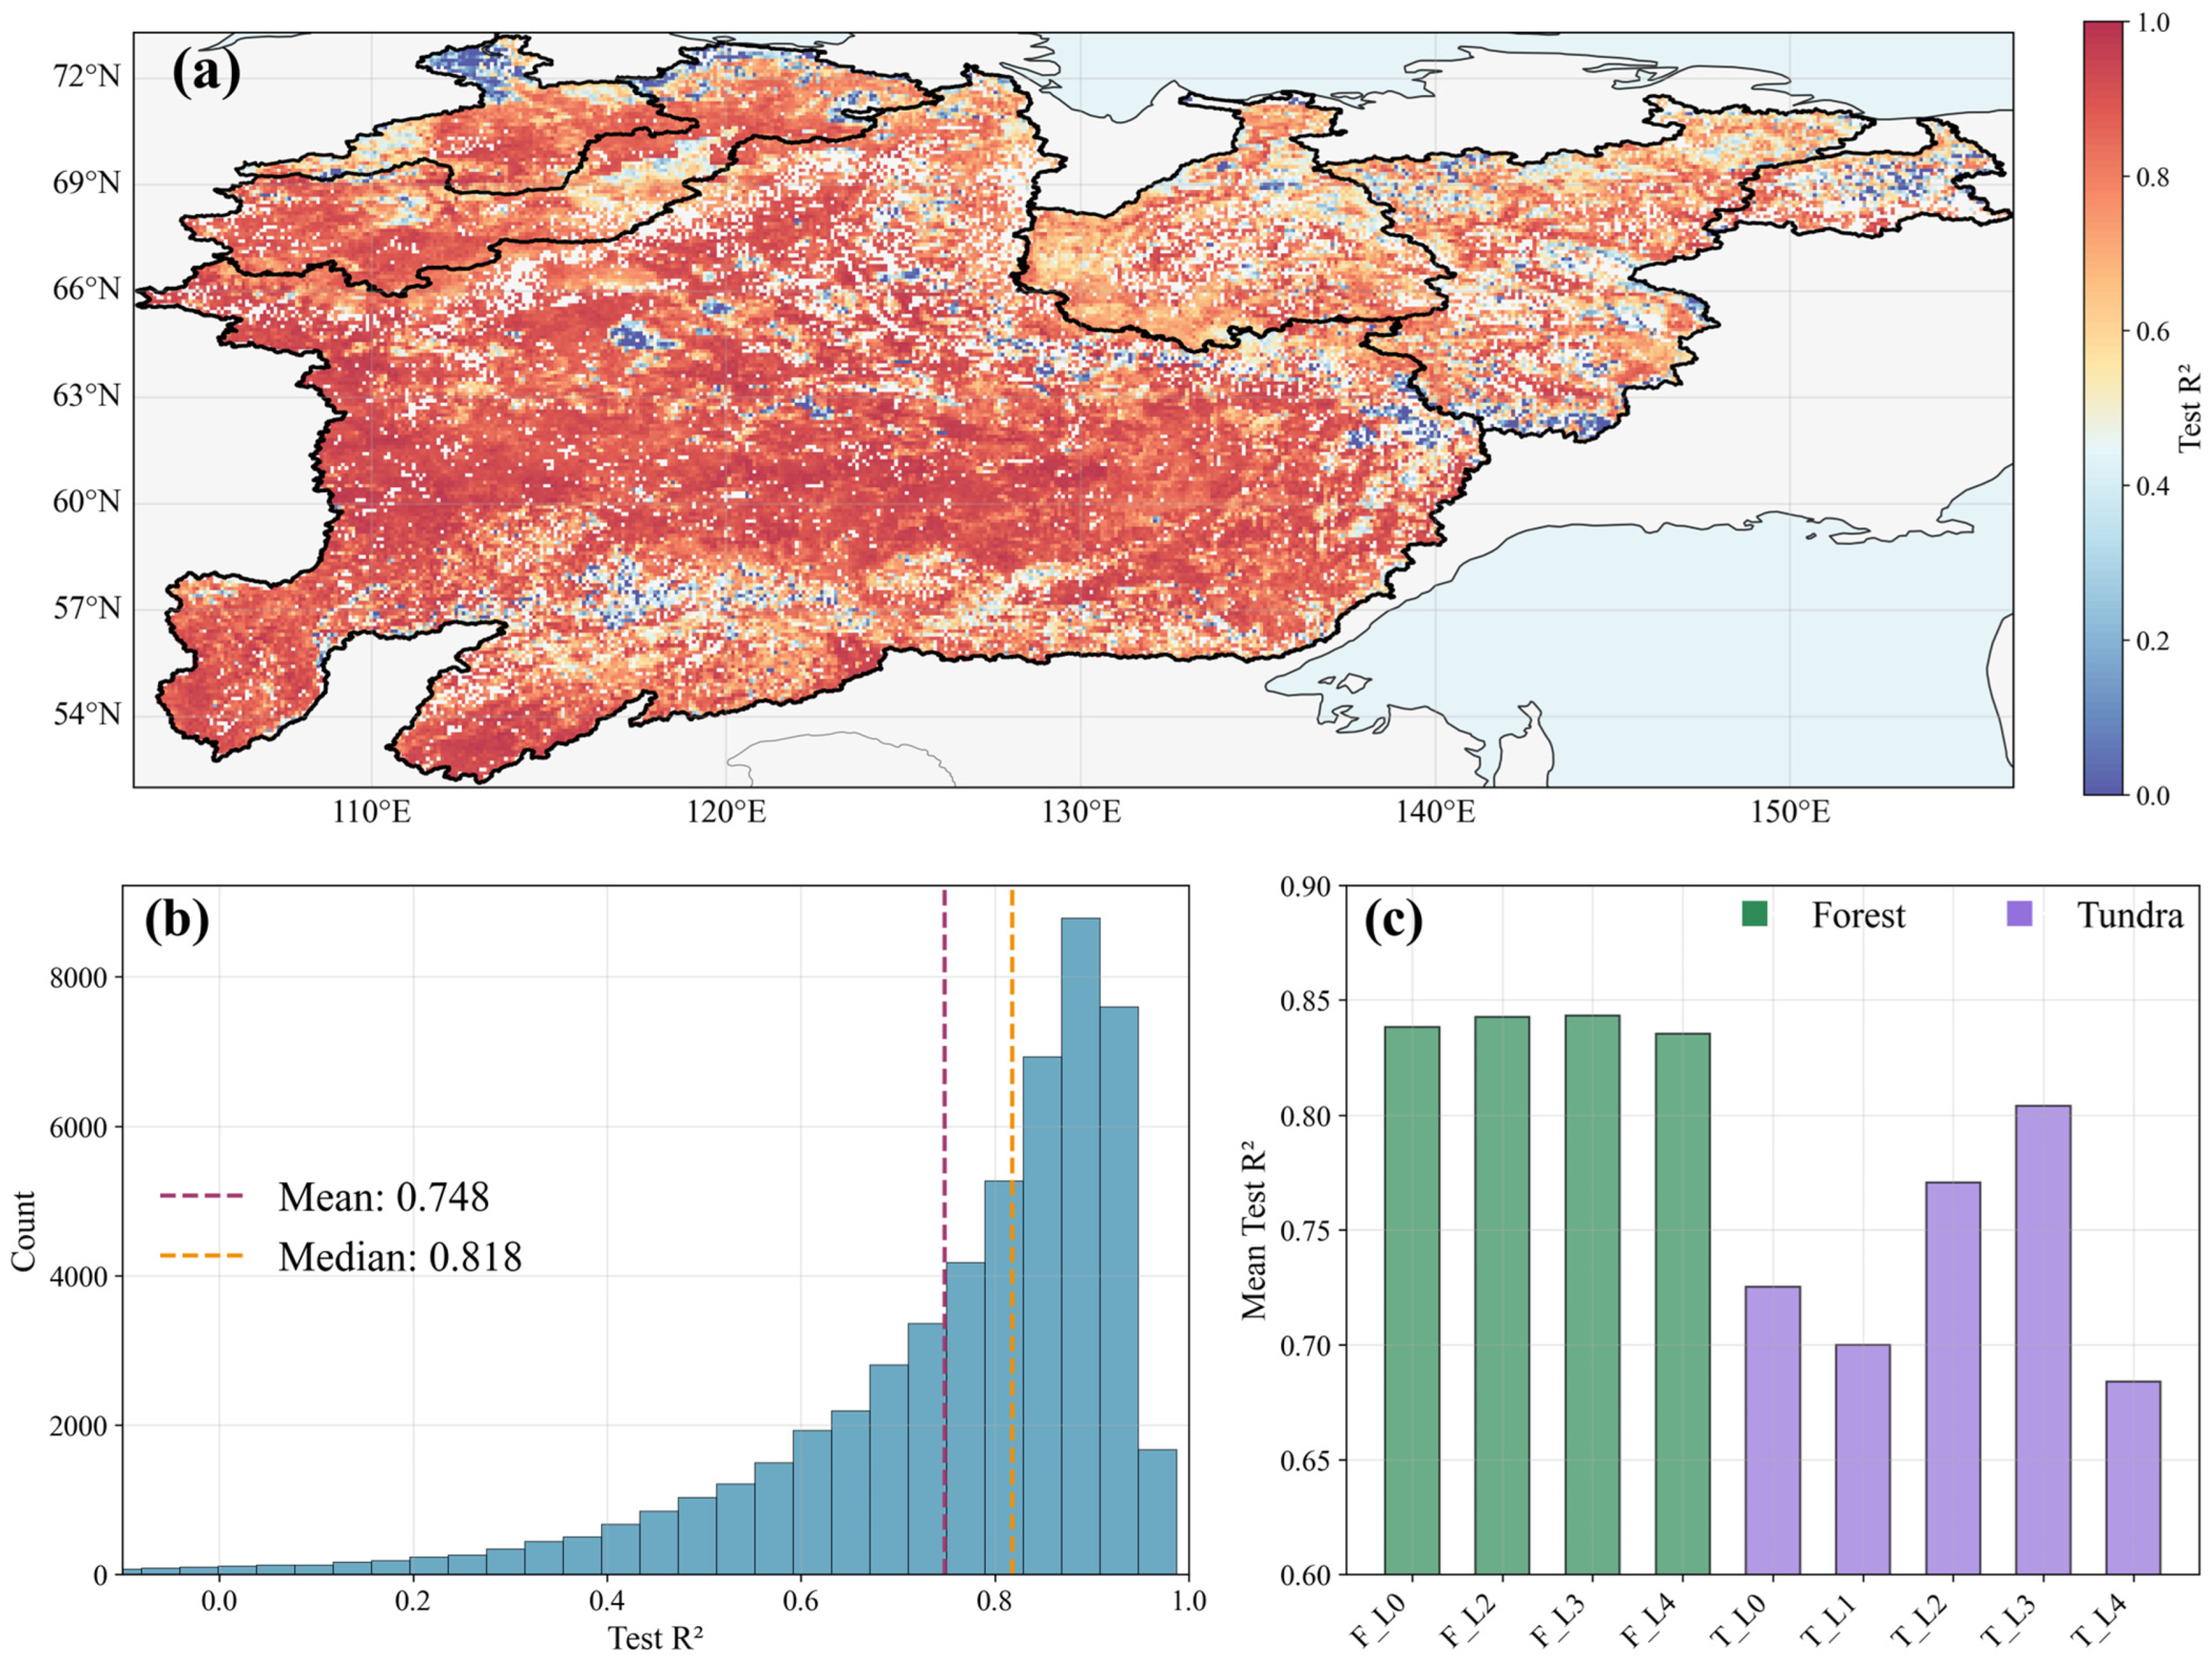
On a monthly time scale, we used a random forest regression model to characterize the relationships between NDVI and the influential factors. The mean explanatory power of the influencing factors for growing-season NDVI variability (R2) was 0.75, with a median of 0.82 (Figure 7). In forested areas, R2 values consistently exceeded 0.8, substantially higher than those in tundra regions, indicating that monthly climatic and environmental factors exert a stronger overall influence on NDVI in forest ecosystems. Within tundra areas, the lowest R2 (0.68) occurred in thermokarst-lake distribution level 4, suggesting that climatic and environmental factors have the weakest explanatory power for NDVI variability in tundra regions with extremely high thermokarst-lake coverage.
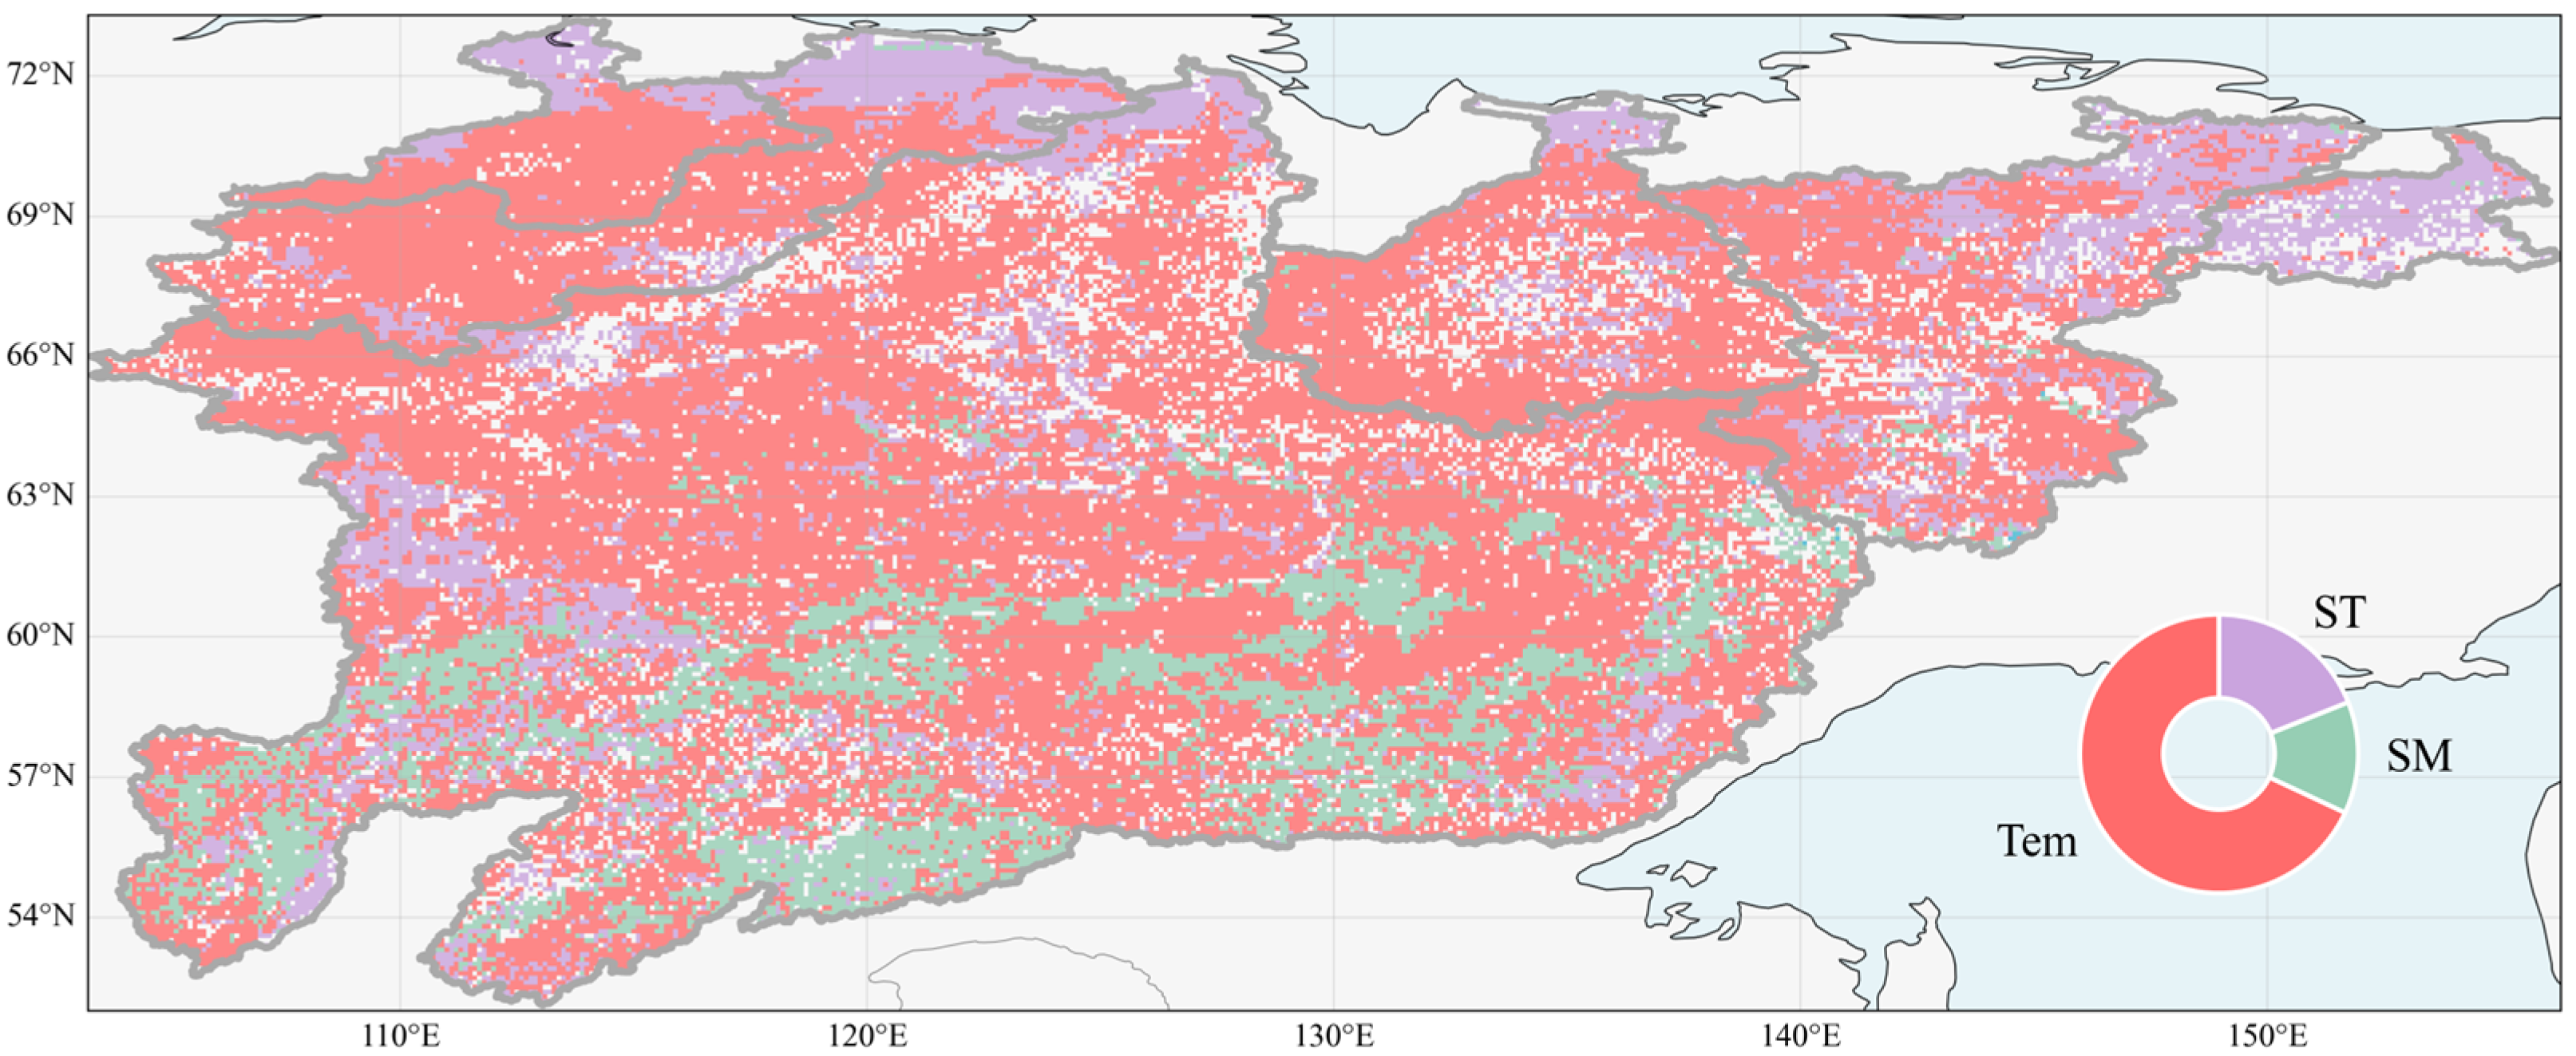
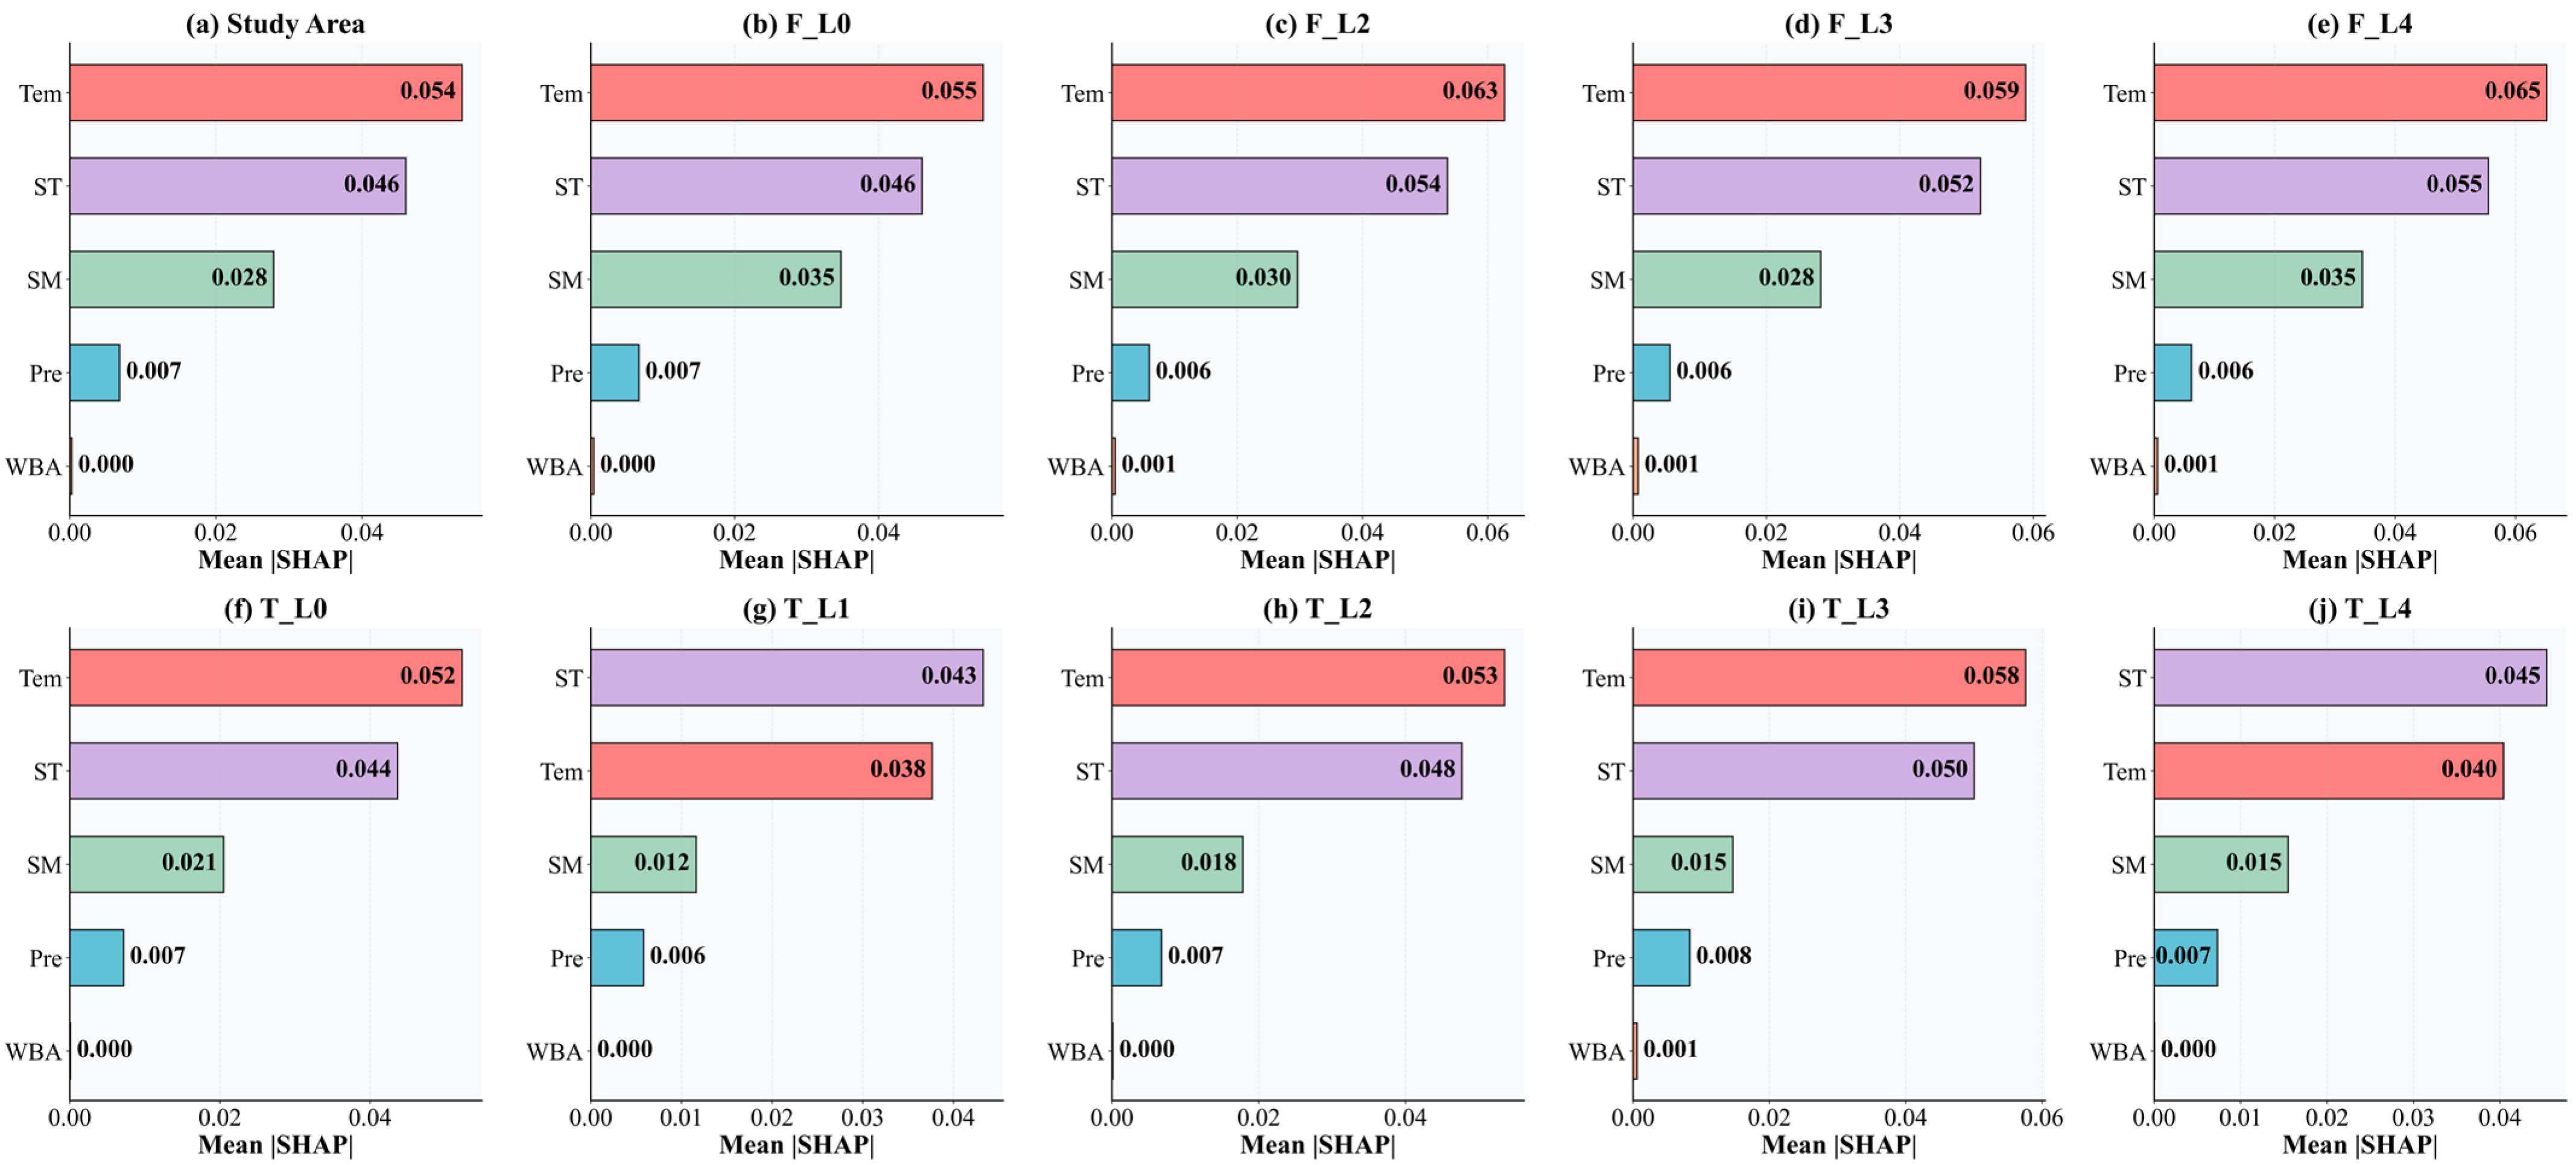
The spatial distribution of dominant factors derived from the SHAP value-based random forest importance ranking is shown in Figure 8. Most of the study area is primarily controlled by air temperature, which dominates 68% of the region. In contrast, a small portion of the southern forested area and parts of the northern tundra are predominantly influenced by soil moisture (13%) and soil temperature (19%), respectively. The SHAP analysis (Figure 9) further indicates that during 2001–2021, growing-season NDVI dynamics were mainly governed by air temperature (importance = 0.054). Soil temperature (importance = 0.046) was the second most influential factor, ranking first in high-latitude tundra regions where thermokarst lake coverage is Low (1–10%) or Very High (60–100%). Soil moisture (importance = 0.028) ranked third, dominating 13% of the area, particularly in forested regions with low thermokarst lake coverage. In contrast, Pre and WBA exhibited substantially lower importance values, indicating only minor contributions to NDVI variability at the monthly scale.
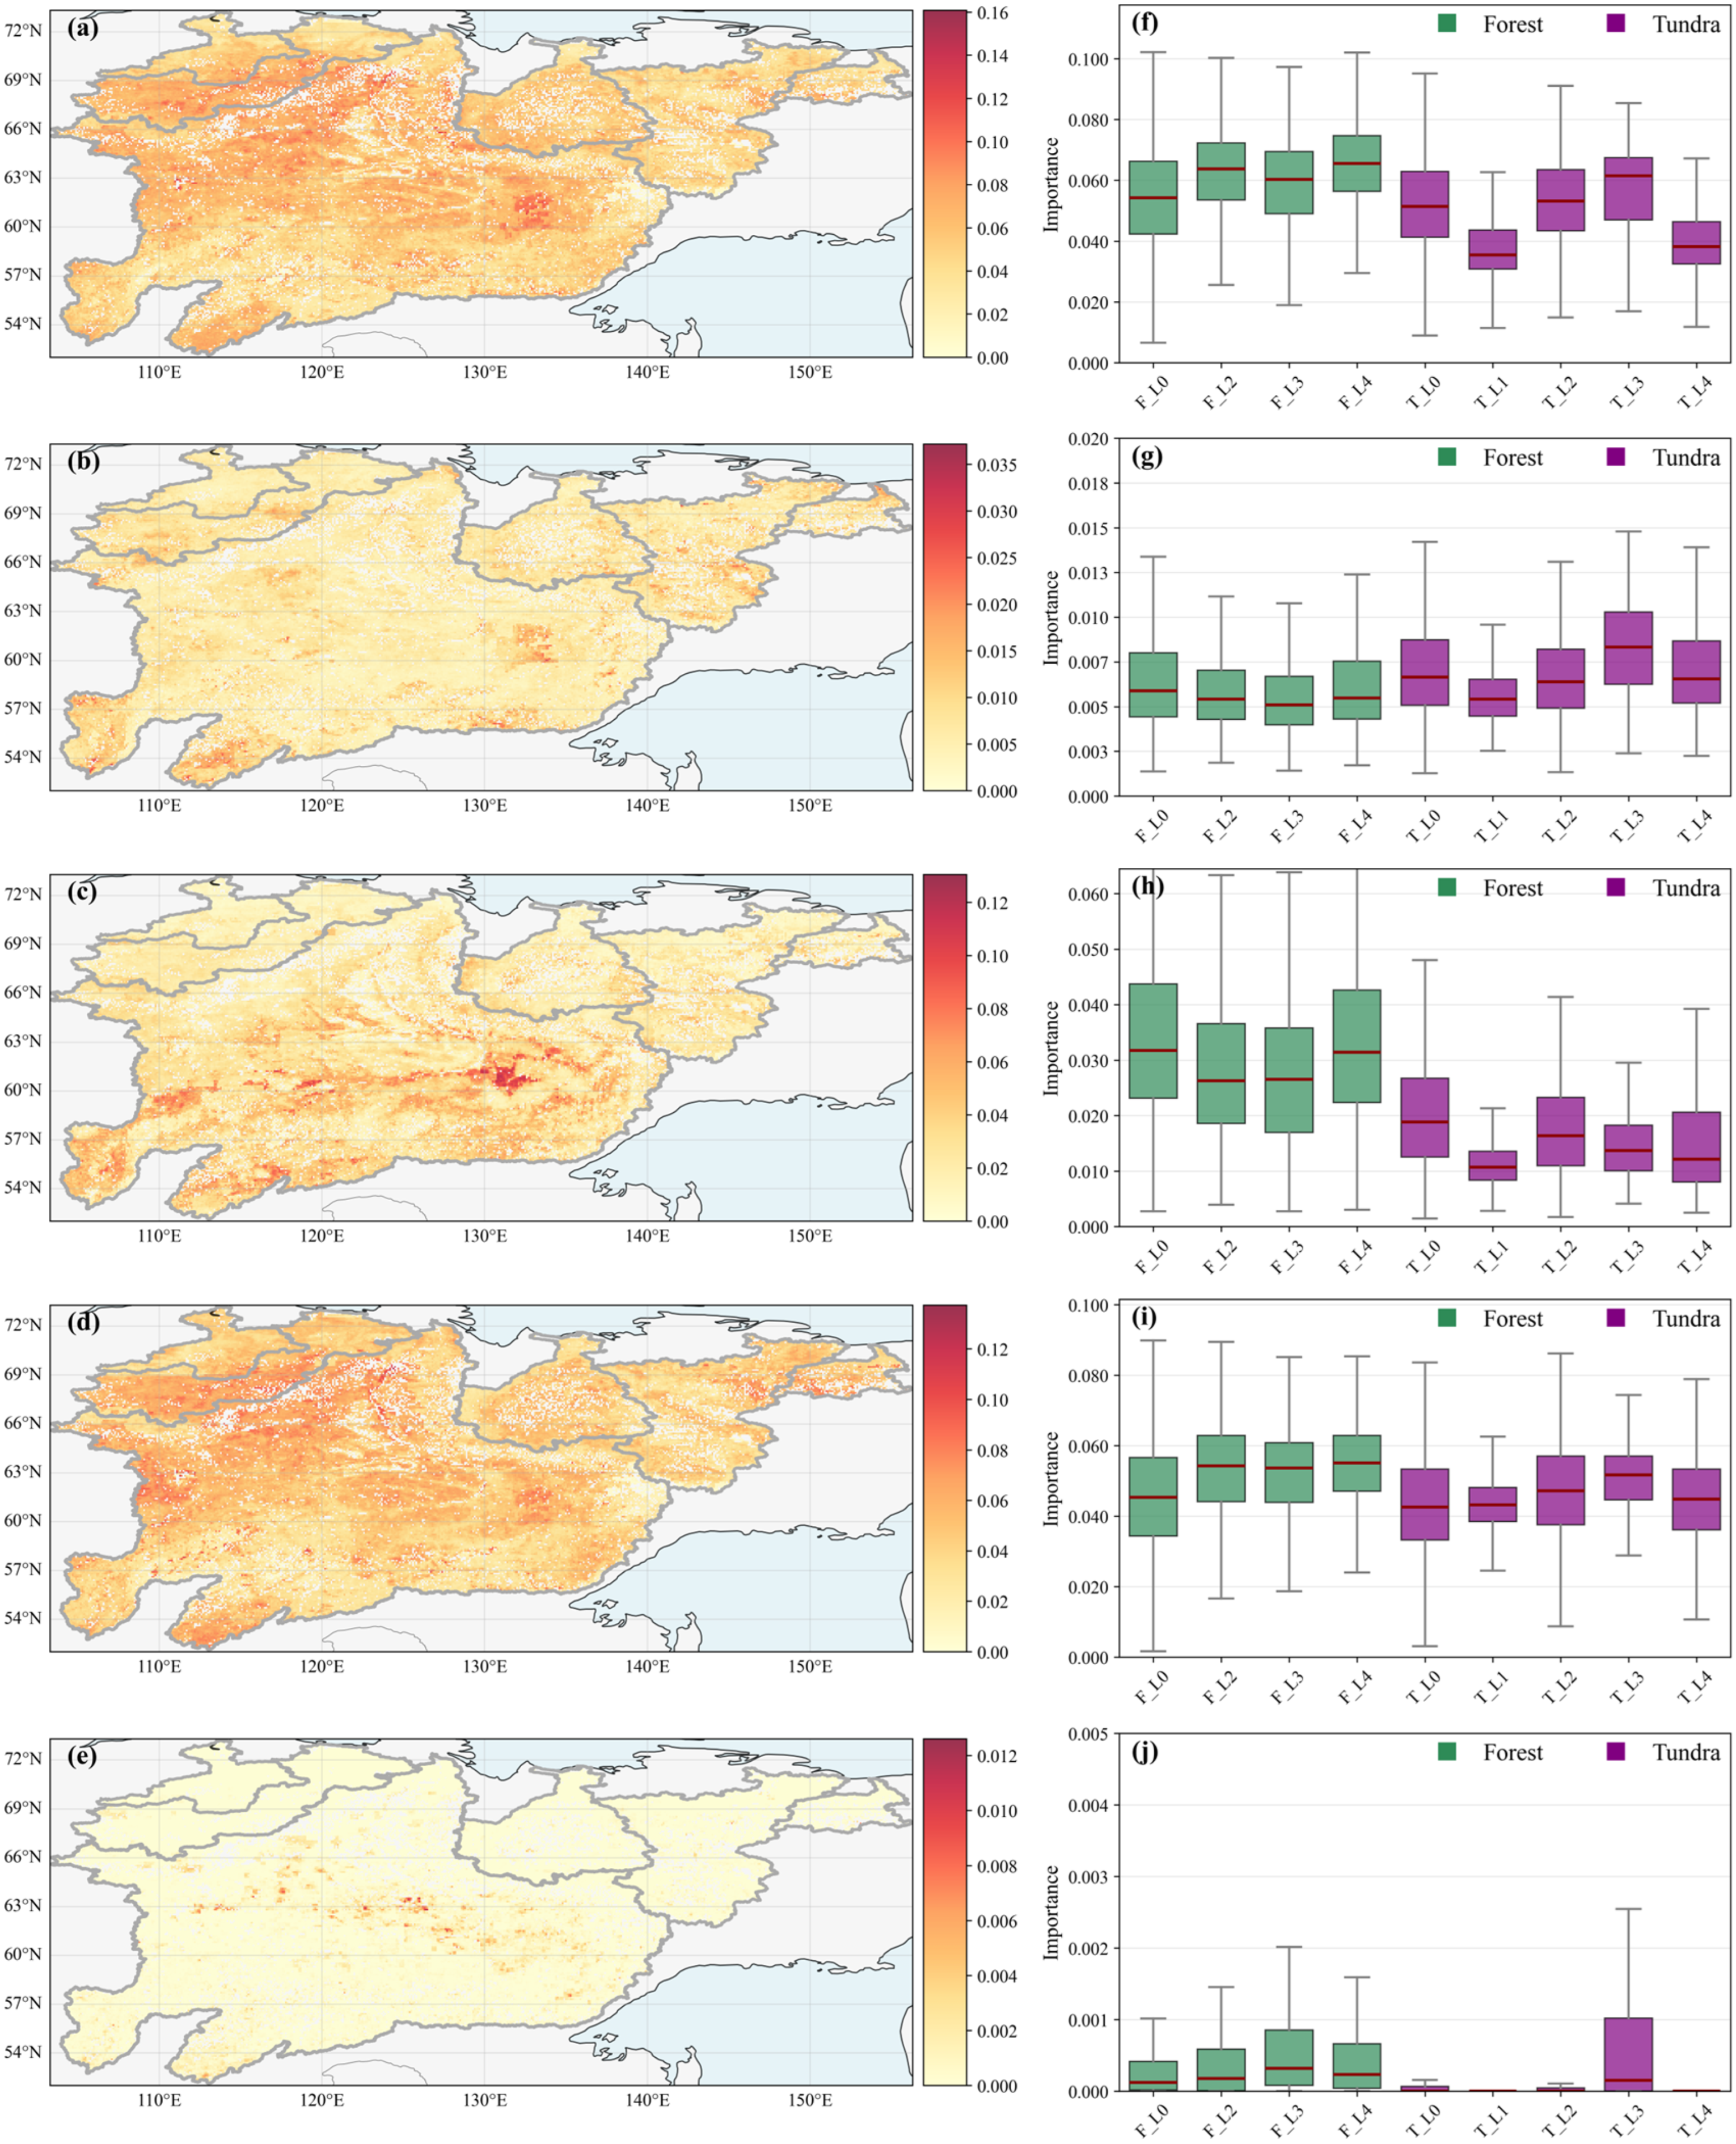
The spatial distribution of factor importance and the corresponding statistics for each vegetation–thermokarst lake complex are shown in Figure 10. Tem and ST exhibit broadly similar spatial patterns, with the highest importance values concentrated in the middle Lena River basin. Across vegetation types (Figure 10f,i), both Tem and ST show higher importance in forested regions than in tundra, and their importance increases with thermokarst lake coverage. Within tundra, ST shows less variation across thermokarst lake levels than Tem, and in the highest thermokarst lake class, ST exceeds Tem in relative importance.
High SM importance is concentrated in the southern Lena basin (Figure 10c), where its contribution is substantially higher in forested regions than in tundra. Within tundra, SM importance is notably lower in thermokarst lake–dominated areas than in non-thermokarst regions. Pre shows a more northern distribution of high importance values and increases progressively with thermokarst lake level in tundra. WBA importance is concentrated in browning areas along the middle Lena River and is generally higher in forests, with localized high values also observed in tundra areas classified as thermokarst lake level 3.
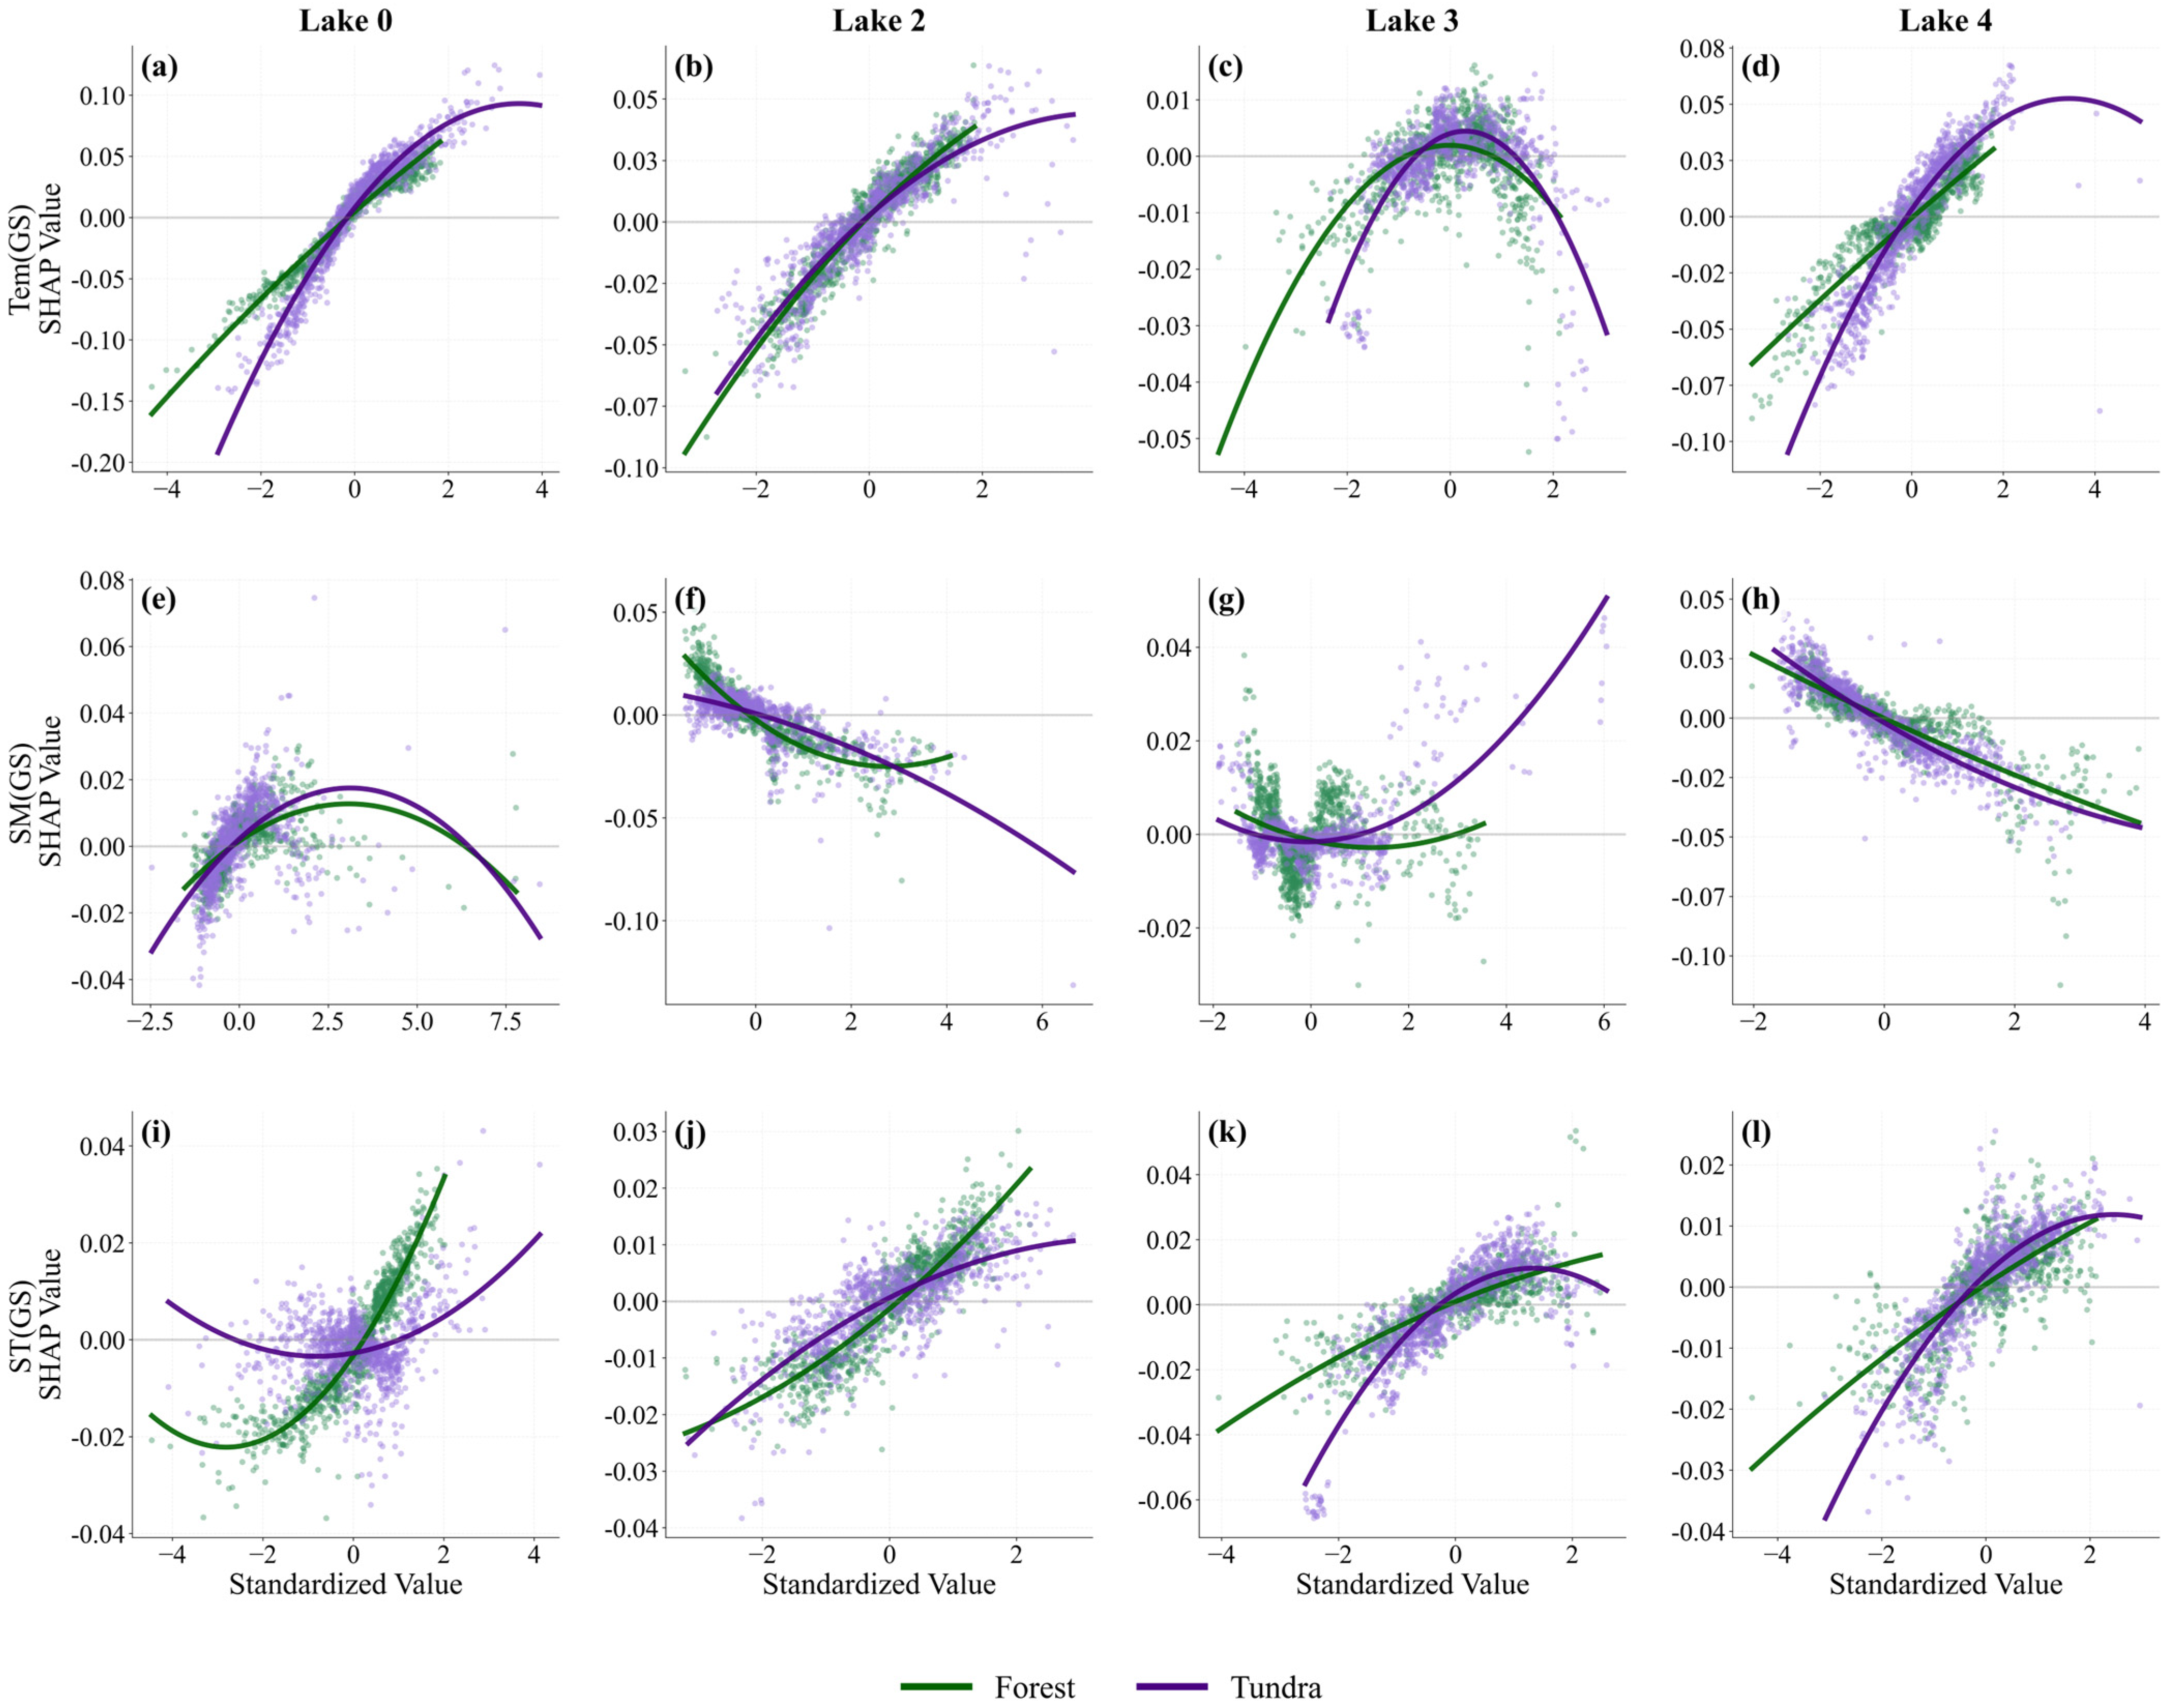
In addition, we conducted a supplementary analysis using the annual Random Forest model. Across the entire study area, growing-season air temperature (Tem), soil moisture (SM), and soil temperature (ST) ranked among the top three most important variables based on SHAP values (Figure S4), with R2 exceeding 0.6 in all subregions (Figure S5). Based on this, we focused on the growing-season Tem, ST, and SM for each subregion and plotted the SHAP dependence curves (Figure 11).
We found that the standardized values of Tem and ST were generally positively associated with SHAP values, indicating that higher air or soil temperatures contribute positively to NDVI. For Tem and ST in forests and tundra, some thermokarst lake-covered regions exhibited nonlinear threshold effects: at low standardized values (<0), SHAP values remained negative, reflecting a negative contribution of low temperature or soil temperature to NDVI; at high standardized values (>2), the positive contributions weakened or even declined, particularly in areas with high thermokarst lake coverage (lake3), suggesting that NDVI gains tend to saturate or may be suppressed under extreme temperature or soil temperature conditions.
The contribution of SM differed across thermokarst lake coverage levels but showed a common pattern in lake regions: in all thermokarst lake-covered areas, low SM values (<0) corresponded to positive SHAP values, in contrast to areas without lakes. In medium and very high coverage regions (lake2 and lake4), SM generally exhibited negative associations with NDVI. In high-coverage tundra areas (lake3), deviations from the mean, whether increases or decreases, led to positive marginal contributions, indicating that both higher and lower SM levels could enhance NDVI predictions relative to the baseline.
Overall, Tem shows the largest contribution to growing-season NDVI variability across most of the study area, while ST exhibits higher relative importance in southern tundra regions with thermokarst lakes, and SM contributes more prominently in forested areas. Tem and ST promote NDVI at low to moderate levels but saturate or decline at high levels, while SM contributions are modulated by thermokarst lake coverage, producing either positive or negative effects.

4. Discussion

4.1. Localized Browning in Thermokarst-Dominated Landscapes

In our study, we identified a significant greening trend across the northeastern Siberian permafrost basins, as evidenced by a rise in the mean growing-season NDVI from 0.47 to 0.51 between 2001 and 2021 (Figure 2b). This overall trend is consistent with the widely documented pan-Arctic greening observed in multi-decadal satellite records [35,72,73].
However, our examination indicates that this greening is not spatially uniform but is profoundly modulated by landscape heterogeneity, with thermokarst lake coverage emerging as a critical regulator. Across both vegetation types, thermokarst lake coverage acted as a consistent constraint on vegetation recovery. In tundra, stronger greening occurred mainly in areas with low thermokarst lake coverage, whereas sites with dense lakes (>30%) showed markedly lower greening rates (Figure 3c). In forests, this suppressing effect was even more evident, aligning with earlier observations of slower greening and more frequent browning in Siberian forested landscapes [16]. Importantly, wildfire activity did not increase with lake coverage (Figure 4), suggesting that intensified browning in lake-rich areas is likely associated with thermokarst-related disturbance rather than fire.
These observed patterns can be coherently interpreted within the conceptual framework of the thermokarst lake cycle [74], in which the stages of lake formation, expansion, and drainage generate distinct local thermal–hydrological environments that shape ecological outcomes. The suppressed greening and pronounced browning observed in high lake-coverage tundra and forest areas likely correspond to the more destructive phases of lake expansion and stabilization. During these phases, ground subsidence and waterlogging [75] promote soil saturation, root anoxia, and physical damage [27], potentially contributing to observed browning and local vegetation decline.
In contrast, the vigorous greening found in low lake-coverage tundra likely reflects the post-drainage successional stage. Following drainage, surface drying and enhanced nutrient availability create favorable conditions for vegetation establishment and growth [39,42], producing the strong local greening signals detected in our analysis. Similar post-drainage greening has been reported in parts of Alaska and the Canadian Arctic, where thermokarst lake drainage and subsequent basin development are often associated with vegetation recovery or greening, commonly driven by shrub expansion or the colonization of highly productive wetland species [26,43]. Together, these circumpolar observations suggest that while post-drainage greening represents a broadly shared Arctic response, its magnitude and ecological expression remain strongly modulated by regional climate, vegetation composition, and permafrost conditions.
Overall, thermokarst processes appear to play a concurrent and non-negligible role in local browning patterns in northeastern Siberia, independent of wildfire. Beyond the recognized greening following lake drainage, the browning-dominated phases of lake formation and expansion must be considered a critical factor in assessing NDVI dynamics across the rapidly changing Arctic.

4.2. Air Temperature and Soil Thermal–Moisture Controls on Regional NDVI Dynamics

Our annual partial-correlation analysis and monthly-scale Random Forest (RF) modeling consistently highlight the dominant role of air temperature (Tem) and soil regime (soil temperature, ST; soil moisture, SM) in shaping NDVI variability across the study area, in line with broader assessments of permafrost regions.
In the northeastern Siberian permafrost river basins, annual-scale partial correlations indicate that Tem is the primary control on NDVI, corroborating recent pan-Arctic evaluations that warming remains the main driver of greening in permafrost ecosystems [76]. Growing-season temperature exhibits the strongest positive partial correlation with NDVI, and SHAP values from RF models further support this pattern, suggesting that enhanced Arctic greening over the past decade appears largely associated with temperature increases. Mechanistically, temperature influences vegetation both directly and indirectly. Direct effects include stimulation of photosynthesis and increases in leaf area and chlorophyll content [77]. Indirect effects involve deepening of the active layer, enhanced soil thermal availability, and greater root-zone access to nutrients, thereby promoting plant growth [78]. Similar positive relationships between ALT and NDVI have been reported across Siberia and northern North America [41], indicating a broadly shared soil–thermal control on vegetation productivity. In regions with high thermokarst lake coverage (30–60%), the SHAP dependence plots further show negative contributions at high temperature levels. This suggests that warming in these areas may be accompanied by increased risks of thermokarst disturbance, lake expansion, and wildfire occurrence [37,79], which can offset or even suppress temperature-driven NDVI gains.
Notably, tundra vegetation responds strongly to winter temperatures, likely due to altered snow-soil insulation and delayed spring freeze-thaw cycles [80,81]. In contrast, in forested regions with high thermokarst lake coverage, NDVI is negatively correlated with winter temperature. This negative relationship may result from weakened insulation under warmer winters, leading to lower soil temperatures or enhanced freezing [82], which can suppress oxygen availability or root aeration and ultimately reduce summer productivity.
Following air temperature, soil temperature (ST) and soil moisture (SM) emerge as the second-most influential drivers of NDVI at both monthly and annual scales. ST exhibits a positive correlation with NDVI and ranks second in importance in RF analyses. Particularly in the northern high-latitude portion of the study region, the slope of ST trends surpasses that of air temperature (Figure S3), suggesting that enhanced soil warming underlies the pronounced greening observed in these areas. High-resolution thermal imagery shows that thermokarst lakes act as hotspots of surface thermal anomalies, taliks and altering soil thermal regimes [83], providing a mechanistic basis for spatial heterogeneity in vegetation responses across lake-rich areas.
In forest ecosystems with sparse thermokarst lakes, it becomes a key limiting factor at the monthly scale. While growing-season SM generally declined across the study region, reflecting broad-scale drying, some localized areas, particularly in the middle Lena basin, exhibited increasing trends (Figure S3). These observations are consistent with previous studies showing that permafrost degradation alters soil hydrological processes [84]. As the active layer deepens, some water percolates to deeper layers [85], and plant water-use efficiency increases under intensified moisture stress [86]. In tundra, SM generally exhibits negative correlations with NDVI at the annual scale, consistent with browning patterns associated with high snow depths and flooding [33]. At the monthly scale, the relative importance of SM is reduced, likely because moisture limitation is minor in lake-rich regions; thermal constraints such as ST dominate; and water-related effects often exhibit a lagged response [87]. Annual SHAP dependence analysis showed that compared with areas without thermokarst lakes, all lake-influenced regions exhibit positive NDVI responses under relatively low soil moisture. This pattern suggests that, in landscapes with generally high background moisture, lower soil moisture may improve soil aeration and root-zone conditions, potentially linked to thermokarst lake drainage [88,89]. In regions with moderate and very high thermokarst lake coverage, higher soil moisture negatively affects NDVI, potentially due to lake expansion and soil water saturation suppressing vegetation productivity [17,90].
Beyond these major drivers, precipitation and wildfire play smaller roles, but can cause local deviations from temperature-driven greening patterns, particularly during months or subregions affected by extreme hydrological events or disturbances. Growing-season precipitation exhibits weak overall correlations with NDVI, but shows negative relationships in high-latitude tundra, suggesting that wetter conditions (e.g., late-season snow or soil saturation) may suppress early growth and even induce browning [17]. Winter precipitation generally correlates positively with NDVI in forested areas by enhancing snow insulation and improving soil thermal conditions, thus benefiting vegetation [82]. The influence of precipitation may also be lagged [16], as snowmelt, soil heating, and water availability require time to affect the growing season, which can explain its reduced monthly importance. Wildfire generally has low importance across the study area, though it shows negative correlations in some central Lena River lowland regions, consistent with recent findings on fire-driven browning in Siberian taiga and tundra [29,33]. In tundra, NDVI correlations with wildfire are mostly positive, likely reflecting the resilience of Arctic tundra vegetation, where temperature-driven growth and recovery following disturbance remain effective [91,92].
Comparing results of multi-scale analyses, we find a clear hierarchy of influential factors: air temperature, soil temperature, and soil moisture jointly serve as the primary controls on NDVI across the study region, while precipitation and wildfire exert secondary, seasonally and spatially modulated effects. Thermokarst processes appear to modulate these relationships, influencing both the sensitivity and relative importance of dominant environmental drivers, contributing to the pronounced spatial heterogeneity observed in vegetation responses.

4.3. Limitation and Prospect

This study provides a comprehensive multi-scale analysis of NDVI dynamics, but several limitations should be acknowledged. First, the spatial resolution of the meteorological and soil moisture datasets is relatively coarse, which may reduce the accuracy of local-scale assessments of NDVI responses, particularly in areas with complex terrain or heterogeneous microclimates [93]. Second, the RF–SHAP analysis provides insights into the relative importance of predictors and their associations with NDVI, but it does not imply direct causal effects. Moreover, monthly NDVI contains inherent phenological signals, and collinearity among predictors, as well as potential lagged or cumulative effects of key environmental drivers [16], may influence RF importance rankings and the modeled variability. Third, thermokarst lake coverage was represented using a static landscape classification reflecting long-term geomorphic context rather than interannual lake dynamics, which may introduce uncertainty when linking thermokarst processes to short-term NDVI variability. Moreover, the number of pixels varies markedly among thermokarst lake coverage classes due to their uneven spatial distribution, and pixel-level spatial autocorrelation may further influence the observed patterns. Consequently, aggregated statistics, partial correlation patterns, random forest results, and descriptive summaries for classes with limited spatial extent may be associated with uncertainty. Finally, while our analysis incorporated major climatic and soil drivers, other potentially influential factors, such as permafrost dynamics, fine-scale topography, and land-cover changes, were not explicitly included, limiting the completeness of the mechanistic understanding.
Despite these limitations, the gradient-based analysis of thermokarst lake coverage provides a robust framework for interpreting vegetation dynamics across heterogeneous permafrost landscapes. Future research could address these limitations by incorporating higher-resolution remote sensing datasets, extending temporal and spatial coverage, and applying advanced modeling approaches capable of capturing lagged and cumulative responses. Future studies could also explore alternative machine learning models to further investigate vegetation–climate relationships. Moreover, integrating dynamic thermokarst lake extent and land-cover changes would improve predictions of vegetation sensitivity under ongoing climate change. Additionally, consideration of vegetation resilience and carbon dynamics is crucial. Existing evidence suggests that vegetation recovery is more vulnerable in regions characterized by high summer temperatures, deeper active layers, higher elevations, low winter precipitation, high summer EVI, lower soil nitrogen availability, and higher summer water deficits [94]. Vegetation development contributes to carbon sequestration; however, thermokarst drainage and permafrost degradation can release greenhouse gases such as CO2 and CH4, potentially destabilizing long-term vegetation dynamics. Incorporating carbon-cycle-related processes into future studies would allow for a more comprehensive understanding of permafrost–vegetation feedback under climate warming.
Overall, continued high-resolution monitoring and integrative modeling are essential to capture the complex interactions among temperature, soil regime, hydrology, disturbance, and carbon dynamics, and to predict future vegetation responses across permafrost landscapes in a warming Arctic.

5. Conclusions

This study quantified spatiotemporal patterns of NDVI variations across thermokarst lake coverage gradients in northeastern Siberia and identified their key environmental drivers using partial correlation and a Random Forest model. Overall, vegetation greening dominates the region, yet browning occurs more frequently in areas with high thermokarst lake coverage compared with non-lake areas, indicating that localized thermokarst processes can locally reverse regional greening trends. Air temperature emerged as the primary driver of NDVI variability, while soil temperature and soil moisture exerted secondary but critical influences. Soil temperature was particularly important in high-latitude tundra, likely reflecting the local warming and insulation effects of thermokarst lakes and taliks on the soil thermal regime. In contrast, soil moisture primarily limited NDVI in forests with low-coverage thermokarst lakes.
Our findings highlight that thermokarst lake coverage gradients and associated hydrological and thermal heterogeneity critically modulate vegetation responses to climate warming. Ignoring this landscape-scale variability may oversimplify the interpretation of NDVI trends and vegetation–climate interactions in the region. These results demonstrate the value of integrating remote sensing and environmental modeling to assess cryosphere–vegetation linkages, offering insights into improving predictions of ecosystem responses and supporting management strategies for vulnerable permafrost regions under ongoing climate change.

Supplementary Materials

The following supporting information can be downloaded at https://www.mdpi.com/article/10.3390/rs18020308/s1: Figure S1: Spatial distribution of multi-year mean influential variables in the study area (2001–2021); Figure S2: Density scatter comparisons between station observations and gridded datasets for temperature and precipitation; Figure S3: Spatial distribution of the trend slopes in influential variables in the study area (2001–2021); Figure S4: Annual SHAP-based importance ranking of influential factors across northeastern Siberian; Figure S5: Random Forest model performance quantified by test R2 values across different vegetation types and lake classes in the study area; Table S1: Statistical summary of partial correlation results between NDVI and environmental variables.

Author Contributions

Conceptualization, P.W. and R.W.; methodology, R.W.; formal analysis, R.W.; investigation, R.W.; writing—original draft preparation, R.W.; writing—review and editing, P.W., L.X., S.L. and Q.H.; supervision, P.W. All authors have read and agreed to the published version of the manuscript.

Funding

This research was funded by the National Natural Science Foundation of China (Nos. W2412055, 42471036).

Data Availability Statement

All datasets used in this study are publicly available from the sources listed in the References. The processed data generated during the study are available from the corresponding author upon reasonable request.

Acknowledgments

The authors thank Tianye Wang for his valuable discussions and helpful suggestions during this study.

Conflicts of Interest

The authors declare no conflicts of interest.

Abbreviations

The following abbreviations are used in this manuscript:
NDVINormalized Difference Vegetation Index
RFRandom Forest
SHAPShapley Additive Explanation
GSGrowing Season
WinWinter
TemAir Temperature
PrePrecipitation
SMSoil Moisture
STSoil Temperature
WBAWildfire Burned Area
MOD13Q1MODIS/Terra Vegetation Indices 16-Day L3 Global 250 m
CRUClimate Research Unit Time-Series
GPCPGlobal Precipitation Climatology Project
MSWEPMulti-Source Weighted-Ensemble Precipitation
ERA5-LandThe fifth-generation ECMWF atmospheric reanalysis for land
FireCCIFire Climate Change Initiative
RSSSMGlobal Surface Soil Moisture Decadal Dataset
HydroSHEDSHydrological data and maps based on SHuttle Elevation Derivatives at multiple Scales

References

  1. IPCC. Climate Change 2021—The Physical Science Basis: Working Group I Contribution to the Sixth Assessment Report of the Intergovernmental Panel on Climate Change; Cambridge University Press: Cambridge, UK, 2023. [Google Scholar]
  2. Rantanen, M.; Karpechko, A.Y.; Lipponen, A.; Nordling, K.; Hyvarinen, O.; Ruosteenoja, K.; Vihma, T.; Laaksonen, A. The Arctic has warmed nearly four times faster than the globe since 1979. Commun. Earth Environ. 2022, 3, 168. [Google Scholar] [CrossRef]
  3. Wang, G.X.; Hu, H.C.; Li, T.B. The influence of freeze-thaw cycles of active soil layer on surface runoff in a permafrost watershed. J. Hydrol. 2009, 375, 438–449. [Google Scholar] [CrossRef]
  4. Garcia, R.A.; Cabeza, M.; Rahbek, C.; Araujo, M.B. Multiple Dimensions of Climate Change and Their Implications for Biodiversity. Science 2014, 344, 1247579. [Google Scholar] [CrossRef]
  5. Garcia Criado, M.; Myers-Smith, I.H.; Bjorkman, A.D.; Elmendorf, S.C.; Normand, S.; Aastrup, P.; Aerts, R.; Alatalo, J.M.; Baeten, L.; Bjork, R.G.; et al. Plant diversity dynamics over space and time in a warming Arctic. Nature 2025, 642, 653–661. [Google Scholar] [CrossRef]
  6. Montesano, P.M.; Neigh, C.S.R.; Sexton, J.; Feng, M.; Channan, S.; Ranson, K.J.; Townshend, J.R. Calibration and Validation of Landsat Tree Cover in the Taiga-Tundra Ecotone. Remote Sens. 2016, 8, 551. [Google Scholar] [CrossRef]
  7. Callaghan, T.V.; Crawford, R.M.M.; Eronen, M.; Hofgaard, A.; Payette, S.; Rees, W.G.; Skre, O.; Sveinbjornsson, J.; Vlassova, T.K.; Werkman, B.R. The dynamics of the tundra-taiga boundary: An overview and suggested coordinated and integrated approach to research. Ambio 2002, 12, 3–5. [Google Scholar]
  8. Walther, C.; Huettich, C.; Urban, M.; Schmullius, C. Modelling the Arctic taiga-tundra ecotone using ALOS PALSAR and optical earth observation data. Int. J. Appl. Earth Obs. Geoinf. 2019, 81, 195–206. [Google Scholar] [CrossRef]
  9. Oh, Y.; Zhuang, Q.; Liu, L.; Welp, L.R.; Lau, M.C.Y.; Onstott, T.C.; Medvigy, D.; Bruhwiler, L.; Dlugokencky, E.J.; Hugelius, G.; et al. Reduced net methane emissions due to microbial methane oxidation in a warmer Arctic. Nat. Clim. Change 2020, 10, 317–321. [Google Scholar] [CrossRef]
  10. Voigt, C.; Virkkala, A.-M.; Hould Gosselin, G.; Bennett, K.A.; Black, T.A.; Detto, M.; Chevrier-Dion, C.; Guggenberger, G.; Hashmi, W.; Kohl, L.; et al. Arctic soil methane sink increases with drier conditions and higher ecosystem respiration. Nat. Clim. Change 2023, 13, 1095–1104. [Google Scholar] [CrossRef] [PubMed]
  11. Law, B.E.; Falge, E.; Gu, L.; Baldocchi, D.D.; Bakwin, P.; Berbigier, P.; Davis, K.; Dolman, A.J.; Falk, M.; Fuentes, J.D.; et al. Environmental controls over carbon dioxide and water vapor exchange of terrestrial vegetation. Agric. For. Meteorol. 2002, 113, 97–120. [Google Scholar] [CrossRef]
  12. Arndt, K.A.; Santos, M.J.; Ustin, S.; Davidson, S.J.; Stow, D.; Oechel, W.C.; Tran, T.T.P.; Graybill, B.; Zona, D. Arctic greening associated with lengthening growing seasons in Northern Alaska. Environ. Res. Lett. 2019, 14, 125018. [Google Scholar] [CrossRef]
  13. Melvin, A. Understanding Northern Latitude Vegetation Greening and Browning: Proceedings of a Workshop; National Academies Press: Washington, DC, USA, 2019. [Google Scholar]
  14. Myers-Smith, I.H.; Kerby, J.T.; Phoenix, G.K.; Bjerke, J.W.; Epstein, H.E.; Assmann, J.J.; John, C.; Andreu-Hayles, L.; Angers-Blondin, S.; Beck, P.S.A.; et al. Complexity revealed in the greening of the Arctic. Nat. Clim. Change 2020, 10, 106–117. [Google Scholar] [CrossRef]
  15. Seddon, A.W.R.; Macias-Fauria, M.; Long, P.R.; Benz, D.; Willis, K.J. Sensitivity of global terrestrial ecosystems to climate variability. Nature 2016, 531, 229–232. [Google Scholar] [CrossRef]
  16. Shi, S.Y.; Wang, P.; Zhang, Y.C.; Yu, J.J. Cumulative and time-lag effects of the main climate factors on natural vegetation across Siberia. Ecol. Indic. 2021, 133, 108446. [Google Scholar] [CrossRef]
  17. Magnusson, R.I.; Groten, F.; Bartholomeus, H.; van Huissteden, K.; Heijmans, M.M.P.D. Tundra Browning in the Indigirka Lowlands (North-Eastern Siberia) Explained by Drought, Floods and Small-Scale Vegetation Shifts. J. Geophys. Res. Biogeosci. 2023, 128, e2022JG007330. [Google Scholar] [CrossRef]
  18. Bring, A.; Fedorova, I.; Dibike, Y.; Hinzman, L.; Mard, J.; Mernild, S.H.; Prowse, T.; Semenova, O.; Stuefer, S.L.; Woo, M.K. Arctic terrestrial hydrology: A synthesis of processes, regional effects, and research challenges. J. Geophys. Res. Biogeosci. 2016, 121, 621–649. [Google Scholar] [CrossRef]
  19. Lara, M.J.; Nitze, I.; Grosse, G.; Martin, P.; McGuire, A.D. Reduced arctic tundra productivity linked with landform and climate change interactions. Sci. Rep. 2018, 8, 2345. [Google Scholar] [CrossRef] [PubMed]
  20. Berner, L.T.; Massey, R.; Jantz, P.; Forbes, B.C.; Macias-Fauria, M.; Myers-Smith, I.; Kumpula, T.; Gauthier, G.; Andreu-Hayles, L.; Gaglioti, B.V.; et al. Summer warming explains widespread but not uniform greening in the Arctic tundra biome. Nat. Commun. 2020, 11, 4621. [Google Scholar] [CrossRef] [PubMed]
  21. Strauss, J.; Schirrmeister, L.; Grosse, G.; Fortier, D.; Hugelius, G.; Knoblauch, C.; Romanovsky, V.; Schädel, C.; von Deimling, T.S.; Schuur, E.A.G.; et al. Deep Yedoma permafrost: A synthesis of depositional characteristics and carbon vulnerability. Earth-Sci. Rev. 2017, 172, 75–86. [Google Scholar] [CrossRef]
  22. Nitze, I.; Grosse, G. Detection of landscape dynamics in the Arctic Lena Delta with temporally dense Landsat time-series stacks. Remote Sens. Environ. 2016, 181, 27–41. [Google Scholar] [CrossRef]
  23. Jones, B.M.; Grosse, G.; Farquharson, L.M.; Roy-Léveillée, P.; Veremeeva, A.; Kanevskiy, M.Z.; Gaglioti, B.V.; Breen, A.L.; Parsekian, A.D.; Ulrich, M.; et al. Lake and drained lake basin systems in lowland permafrost regions. Nat. Rev. Earth Environ. 2022, 3, 85–98. [Google Scholar] [CrossRef]
  24. Lara, M.J.; Chen, Y.; Jones, B.M. Recent warming reverses forty-year decline in catastrophic lake drainage and hastens gradual lake drainage across northern Alaska. Environ. Res. Lett. 2021, 16, 124019. [Google Scholar] [CrossRef]
  25. Jones, B.M.; Arp, C.D.; Grosse, G.; Nitze, I.; Lara, M.J.; Whitman, M.S.; Farquharson, L.M.; Kanevskiy, M.; Parsekian, A.D.; Breen, A.L.; et al. Identifying historical and future potential lake drainage events on the western Arctic coastal plain of Alaska. Permafr. Periglac. Process. 2020, 31, 110–127. [Google Scholar] [CrossRef]
  26. Chen, Y.; Liu, A.; Cheng, X. Vegetation grows more luxuriantly in Arctic permafrost drained lake basins. Glob. Change Biol. 2021, 27, 5865–5876. [Google Scholar] [CrossRef]
  27. Heijmans, M.M.P.D.; Magnusson, R.I.; Lara, M.J.; Frost, G.V.; Myers-Smith, I.H.; van Huissteden, J.; Jorgenson, M.T.; Fedorov, A.N.; Epstein, H.E.; Lawrence, D.M.; et al. Tundra vegetation change and impacts on permafrost. Nat. Rev. Earth Environ. 2022, 3, 68–84. [Google Scholar] [CrossRef]
  28. Curtis, P.G.; Slay, C.M.; Harris, N.L.; Tyukavina, A.; Hansen, M.C. Classifying drivers of global forest loss. Science 2018, 361, 1108–1111. [Google Scholar] [CrossRef] [PubMed]
  29. Talucci, A.C.; Loranty, M.M.; Alexander, H.D. Siberian taiga and tundra fire regimes from 2001–2020. Environ. Res. Lett. 2022, 17, 025001. [Google Scholar] [CrossRef]
  30. Zhu, X.; Xu, X.; Jia, G. Recent massive expansion of wildfire and its impact on active layer over pan-Arctic permafrost. Environ. Res. Lett. 2023, 18, 084010. [Google Scholar] [CrossRef]
  31. Hu, F.S.; Higuera, P.E.; Duffy, P.; Chipman, M.L.; Rocha, A.V.; Young, A.M.; Kelly, R.; Dietze, M.C. Arctic tundra fires: Natural variability and responses to climate change. Front. Ecol. Environ. 2015, 13, 369–377. [Google Scholar] [CrossRef]
  32. Buermann, W.; Parida, B.; Jung, M.; MacDonald, G.M.; Tucker, C.J.; Reichstein, M. Recent shift in Eurasian boreal forest greening response may be associated with warmer and drier summers. Geophys. Res. Lett. 2014, 41, 1995–2002. [Google Scholar] [CrossRef]
  33. Phoenix, G.; Bjerke, J.; Björk, R.; Blok, D.; Bryn, A.; Callaghan, T.; Christiansen, C.; Cunliffe, A.; Davidson, S.; Epstein, H.; et al. Browning events in Arctic ecosystems: Diverse causes with common consequences. PLoS Clim. 2025, 4, e0000570. [Google Scholar] [CrossRef]
  34. Rina, W.; Bao, G.; Hai, Q.; Chen, J.; Guo, E.; Li, F.; Bao, Y.; Miao, L.; Huang, X. Parallel acceleration of vegetation growth rate and senescence rate across the Northern Hemisphere from 1982 to 2015. Glob. Ecol. Conserv. 2023, 46, e02622. [Google Scholar] [CrossRef]
  35. Frost, G.V.; Bhatt, U.S.; Macander, M.J.; Berner, L.T.; Walker, D.A.; Raynolds, M.K.; Magnusson, R.I.; Bartsch, A.; Bjerke, J.W.; Epstein, H.E.; et al. The changing face of the Arctic: Four decades of greening and implications for tundra ecosystems. Front. Environ. Sci. 2025, 13, 1525574. [Google Scholar] [CrossRef]
  36. Brisebois, H.; Olsthoorn, J.; Devoie, E. Investigating effects of thermokarst lakes on permafrost under equilibrium conditions. Sci. Total Environ. 2025, 958, 177921. [Google Scholar] [CrossRef]
  37. Liu, Y.; Qiu, H.; Wang, N.; Yang, D.; Zhao, K.; Yang, G.; Huangfu, W.; Luo, W. Thermokarst disturbance responses to climate change across the circumpolar permafrost regions from 1990 to 2023. Geosci. Front. 2025, 16, 102147. [Google Scholar] [CrossRef]
  38. Jenrich, M.; Prodinger, M.; Nitze, I.; Grosse, G.; Strauss, J. Thermokarst Lagoons: Distribution, Classification and Dynamics in Permafrost-to-Marine Transitions. Permafr. Periglac. Process. 2025, 36, 625–640. [Google Scholar] [CrossRef]
  39. Nitze, I.; Cooley, S.W.; Duguay, C.R.; Jones, B.M.; Grosse, G. The catastrophic thermokarst lake drainage events of 2018 in northwestern Alaska: Fast-forward into the future. Cryosphere 2020, 14, 4279–4297. [Google Scholar] [CrossRef]
  40. Olefeldt, D.; Goswami, S.; Grosse, G.; Hayes, D.; Hugelius, G.; Kuhry, P.; McGuire, A.D.; Romanovsky, V.E.; Sannel, A.B.K.; Schuur, E.A.G.; et al. Circumpolar distribution and carbon storage of thermokarst landscapes. Nat. Commun. 2016, 7, 13043. [Google Scholar] [CrossRef] [PubMed]
  41. Liu, Y.; Wu, X.; Wu, T.; Hu, G.; Zou, D.; Qiao, Y.; Wei, X.; Fan, X.; Yan, X. Climate Warming Controls Vegetation Growth with Increasing Importance of Permafrost Degradation in the Northern Hemisphere During 1982–2022. Remote Sens. 2025, 17, 104. [Google Scholar] [CrossRef]
  42. Chen, Y.; Cheng, X.; Liu, A.; Chen, Q.; Wang, C. Tracking lake drainage events and drained lake basin vegetation dynamics across the Arctic. Nat. Commun. 2023, 14, 7359. [Google Scholar] [CrossRef]
  43. Wolter, J.; Jones, B.M.; Fuchs, M.; Breen, A.; Bussmann, I.; Koch, B.; Lenz, J.; Myers-Smith, I.H.; Sachs, T.; Strauss, J.; et al. Post-drainage vegetation, microtopography and organic matter in Arctic drained lake basins. Environ. Res. Lett. 2024, 19, 045001. [Google Scholar] [CrossRef]
  44. Tape, K.D.; Clark, J.A.; Jones, B.M.; Kantner, S.; Gaglioti, B.V.; Grosse, G.; Nitze, I. Expanding beaver pond distribution in Arctic Alaska, 1949 to 2019. Sci. Rep. 2022, 12, 7123. [Google Scholar] [CrossRef]
  45. Myers-Smith, I.H.; Elmendorf, S.C.; Beck, P.S.A.; Wilmking, M.; Hallinger, M.; Blok, D.; Tape, K.D.; Rayback, S.A.; Macias-Fauria, M.; Forbes, B.C.; et al. Climate sensitivity of shrub growth across the tundra biome. Nat. Clim. Change 2015, 5, 887–891. [Google Scholar] [CrossRef]
  46. Tchebakova, N.M.; Parfenova, E.; Soja, A.J. The effects of climate, permafrost and fire on vegetation change in Siberia in a changing climate. Environ. Res. Lett. 2009, 4, 045013. [Google Scholar] [CrossRef]
  47. Obu, J.; Westermann, S.; Bartsch, A.; Berdnikov, N.; Christiansen, H.H.; Dashtseren, A.; Delaloye, R.; Elberling, B.; Etzelmueller, B.; Kholodov, A.; et al. Northern Hemisphere permafrost map based on TTOP modelling for 2000–2016 at 1 km2 scale. Earth-Sci. Rev. 2019, 193, 299–316. [Google Scholar] [CrossRef]
  48. Yao, P.; Lu, H. A long-term global daily soil moisture dataset derived from AMSR-E and AMSR2 (2002–present). Natl. Tibetan Plateau Third Pole Environ. Data Cent. 2020. [Google Scholar] [CrossRef]
  49. Sen, P.K. Estimates of the Regression Coefficient Based on Kendall’s Tau. J. Am. Stat. Assoc. 1968, 63, 1379–1389. [Google Scholar] [CrossRef]
  50. Mann, H.B. Non-parametric tests against trend. Econometrica 1945, 13, 245–259. [Google Scholar] [CrossRef]
  51. Kendall, M.G. Rank Correlation Methods; Griffin: London, UK, 1948. [Google Scholar]
  52. Yue, S.; Wang, C.Y. The Mann-Kendall test modified by effective sample size to detect trend in serially correlated hydrological series. Water Resour. Manag. 2004, 18, 201–218. [Google Scholar] [CrossRef]
  53. Jin, S.; Ma, Y.; Huang, Z.; Huang, J.; Gong, W.; Liu, B.; Wang, W.; Fan, R.; Li, H. A comprehensive reappraisal of long-term aerosol characteristics, trends, and variability in Asia. Atmos. Chem. Phys. 2023, 23, 8187–8210. [Google Scholar] [CrossRef]
  54. Burn, D.H.; Elnur, M.A.H. Detection of hydrologic trends and variability. J. Hydrol. 2002, 255, 107–122. [Google Scholar] [CrossRef]
  55. Sicard, P.; Mangin, A.; Hebel, P.; Mallea, P. Detection and estimation trends linked to air quality and mortality on French Riviera over the 1990–2005 period. Sci. Total Environ. 2010, 408, 1943–1950. [Google Scholar] [CrossRef]
  56. Song, Y.; Jin, L.; Wang, H.B. Vegetation Changes along the Qinghai-Tibet Plateau Engineering Corridor Since 2000 Induced by Climate Change and Human Activities. Remote Sens. 2018, 10, 95. [Google Scholar] [CrossRef]
  57. Ali, S.; Wang, Q.M.; Liu, D.; Fu, Q.; Rahaman, M.M.; Faiz, M.A.; Cheema, M.J.M. Estimation of spatio-temporal groundwater storage variations in the Lower Transboundary Indus Basin using GRACE satellite. J. Hydrol. 2022, 605, 127315. [Google Scholar] [CrossRef]
  58. Wang, J.; Liu, D.S. Vegetation green-up date is more sensitive to permafrost degradation than climate change in spring across the northern permafrost region. Glob. Change Biol. 2022, 28, 1569–1582. [Google Scholar] [CrossRef]
  59. Mehmood, K.; Anees, S.A.; Muhammad, S.; Hussain, K.; Shahzad, F.; Liu, Q.J.; Ansari, M.J.; Alharbi, S.A.; Khan, W.R. Analyzing vegetation health dynamics across seasons and regions through NDVI and climatic variables. Sci. Rep. 2024, 14, 11775. [Google Scholar] [CrossRef]
  60. Breiman, L. Random forests. Mach. Learn. 2001, 45, 5–32. [Google Scholar] [CrossRef]
  61. Prasad, A.M.; Iverson, L.R.; Liaw, A. Newer Classification and Regression Tree Techniques: Bagging and Random Forests for Ecological Prediction. Ecosystems 2006, 9, 181–199. [Google Scholar] [CrossRef]
  62. Pham, L.T.; Luo, L.; Finley, A. Evaluation of random forests for short-term daily streamflow forecasting in rainfall- and snowmelt-driven watersheds. Hydrol. Earth Syst. Sci. 2021, 25, 2997–3015. [Google Scholar] [CrossRef]
  63. Eva, E.A.; Quiring, S.M. Comparison of different machine learning techniques for downscaling SMAP and NLDAS soil moisture over CONUS. J. Environ. Manag. 2025, 394, 127442. [Google Scholar] [CrossRef]
  64. Settu, P.; Ramaiah, M. A data driven comparison of hybrid machine learning techniques for soil moisture modeling using remote sensing imagery. Sci. Rep. 2025, 15, 43170. [Google Scholar] [CrossRef]
  65. Strumbelj, E.; Kononenko, I. Explaining prediction models and individual predictions with feature contributions. Knowl. Inf. Syst. 2014, 41, 647–665. [Google Scholar] [CrossRef]
  66. Aas, K.; Jullum, M.; Loland, A. Explaining individual predictions when features are dependent: More accurate approximations to Shapley values. Artif. Intell. 2021, 298, 103502. [Google Scholar] [CrossRef]
  67. Berdugo, M.; Gaitán, J.J.; Delgado-Baquerizo, M.; Crowther, T.W.; Dakos, V. Prevalence and drivers of abrupt vegetation shifts in global drylands. Proc. Natl. Acad. Sci. USA 2022, 119, e2123393119. [Google Scholar] [CrossRef]
  68. Lundberg, S.M.; Erion, G.; Chen, H.; DeGrave, A.; Prutkin, J.M.; Nair, B.; Katz, R.; Himmelfarb, J.; Bansal, N.; Lee, S.I. From local explanations to global understanding with explainable AI for trees. Nat. Mach. Intell. 2020, 2, 56–67. [Google Scholar] [CrossRef]
  69. Xu, Y.H.; Lin, K.R.; Hu, C.H.; Chen, X.H.; Zhang, J.W.; Xiao, M.Z.; Xu, C.Y. Uncovering the Dynamic Drivers of Floods Through Interpretable Deep Learning. Earths Future 2024, 12, e2024EF004751. [Google Scholar] [CrossRef]
  70. Liu, R.; Yu, Y.; Malik, I.; Wistuba, M.; Guo, Z.; Lu, Y.; Ding, X.; He, J.; Sun, L.; Li, C.; et al. Time-Series MODIS-Based Remote Sensing and Explainable Machine Learning for Assessing Grassland Resilience in Arid Regions. Remote Sens. 2025, 17, 2749. [Google Scholar] [CrossRef]
  71. Husic, A.; Hammond, J.; Price, A.N.; Roundy, J.K. Interrogating process deficiencies in large-scale hydrologic models with interpretable machine learning. Hydrol. Earth Syst. Sci. 2025, 29, 4457–4472. [Google Scholar] [CrossRef]
  72. Shijin, W.; Xiaoqing, P. Permafrost degradation services for Arctic greening. Catena 2023, 229, 107209. [Google Scholar] [CrossRef]
  73. Wenzl, M.; Baumhoer, C.A.; Dietz, A.J.; Kuenzer, C. Vegetation Changes in the Arctic: A Review of Earth Observation Applications. Remote Sens. 2024, 16, 4509. [Google Scholar] [CrossRef]
  74. Morgenstern, A.; Grosse, G.; Günther, F.; Fedorova, I.; Schirrmeister, L. Spatial analyses of thermokarst lakes and basins in Yedoma landscapes of the Lena Delta. Cryosphere 2011, 5, 849–867. [Google Scholar] [CrossRef]
  75. Jin, X.-Y.; Jin, H.-J.; Iwahana, G.; Marchenko, S.S.; Luo, D.-L.; Li, X.-Y.; Liang, S.-H. Impacts of climate-induced permafrost degradation on vegetation: A review. Adv. Clim. Change Res. 2021, 12, 29–47. [Google Scholar] [CrossRef]
  76. Pearson, R.G.; Phillips, S.J.; Loranty, M.M.; Beck, P.S.A.; Damoulas, T.; Knight, S.J.; Goetz, S.J. Shifts in Arctic vegetation and associated feedbacks under climate change. Nat. Clim. Change 2013, 3, 673–677. [Google Scholar] [CrossRef]
  77. Chen, L.; Hanninen, H.; Rossi, S.; Smith, N.G.; Pau, S.; Liu, Z.; Feng, G.; Gao, J.; Liu, J. Leaf senescence exhibits stronger climatic responses during warm than during cold autumns. Nat. Clim. Change 2020, 10, 777–780. [Google Scholar] [CrossRef]
  78. Yang, Y.P.; Wang, X.F.; Wang, T.H. Permafrost Degradation Induces the Abrupt Changes of Vegetation NDVI in the Northern Hemisphere. Earths Future 2024, 12, e2023EF004309. [Google Scholar] [CrossRef]
  79. Treat, C.C.; Virkkala, A.-M.; Burke, E.; Bruhwiler, L.; Chatterjee, A.; Fisher, J.B.; Hashemi, J.; Parmentier, F.-J.W.; Rogers, B.M.; Westermann, S.; et al. Permafrost Carbon: Progress on Understanding Stocks and Fluxes Across Northern Terrestrial Ecosystems. J. Geophys. Res. Biogeosci. 2024, 129, e2023JG007638. [Google Scholar] [CrossRef]
  80. Domine, F.; Fourteau, K.; Picard, G.; Lackner, G.; Sarrazin, D.; Poirier, M. Permafrost cooled in winter by thermal bridging through snow-covered shrub branches. Nat. Geosci. 2022, 15, 554–560. [Google Scholar] [CrossRef]
  81. Gruenberg, I.; Wilcox, E.J.; Zwieback, S.; Marsh, P.; Boike, J. Linking tundra vegetation, snow, soil temperature, and permafrost. Biogeosciences 2020, 17, 4261–4279. [Google Scholar] [CrossRef]
  82. Bouchard, B.; Nadeau, D.F.; Domine, F.; Anctil, F.; Jonas, T.; Tremblay, É. How does a warm and low-snow winter impact the snow cover dynamics in a humid and discontinuous boreal forest? Insights from observations and modeling in eastern Canada. Hydrol. Earth Syst. Sci. 2024, 28, 2745–2765. [Google Scholar] [CrossRef]
  83. Ke, X.; Wang, W.; Niu, F.; Gao, Z.; Huang, W.; Cao, H. Thermokarst lakes disturb the permafrost structure and stimulate through-talik formation in the Qinghai–Tibet Plateau, China: A hydrogeophysical investigation. Cryosphere 2025, 19, 4989–5002. [Google Scholar] [CrossRef]
  84. Li, W.; Yan, D.; Weng, B.; Zhu, L. Research progress on hydrological effects of permafrost degradation in the Northern Hemisphere. Geoderma 2023, 438, 116629. [Google Scholar] [CrossRef]
  85. Andresen, C.G.; Lawrence, D.M.; Wilson, C.J.; McGuire, A.D.; Koven, C.; Schaefer, K.; Jafarov, E.; Peng, S.; Chen, X.; Gouttevin, I.; et al. Soil moisture and hydrology projections of the permafrost region—A model intercomparison. Cryosphere 2020, 14, 445–459. [Google Scholar] [CrossRef]
  86. Yang, Z.-p.; Gao, J.-x.; Zhao, L.; Xu, X.-l.; Ouyang, H. Linking thaw depth with soil moisture and plant community composition: Effects of permafrost degradation on alpine ecosystems on the Qinghai-Tibet Plateau. Plant Soil 2013, 367, 687–700. [Google Scholar] [CrossRef]
  87. Gao, X.; Zhuo, W.; Gonsamo, A. Humid, Warm and Treed Ecosystems Show Longer Time-Lag of Vegetation Response to Climate. Geophys. Res. Lett. 2024, 51, e2024GL111737. [Google Scholar] [CrossRef]
  88. Liu, A.; Chen, Y.; Cheng, X. Effects of Thermokarst Lake Drainage on Localized Vegetation Greening in the Yamal–Gydan Tundra Ecoregion. Remote Sens. 2023, 15, 4561. [Google Scholar] [CrossRef]
  89. Pan, J.; Sharif, R.; Xu, X.; Chen, X. Mechanisms of Waterlogging Tolerance in Plants: Research Progress and Prospects. Front. Plant Sci. 2021, 11, 627331. [Google Scholar] [CrossRef]
  90. Deng, Y.; Li, X.; Shi, F.; Chai, L.; Zhao, S.; Ding, M.; Liao, Q. Nonlinear effects of thermokarst lakes on peripheral vegetation greenness across the Qinghai-Tibet Plateau using stable isotopes and satellite detection. Remote Sens. Environ. 2022, 280, 113215. [Google Scholar] [CrossRef]
  91. Mekonnen, Z.A.; Riley, W.J.; Berner, L.T.; Bouskill, N.J.; Torn, M.S.; Iwahana, G.; Breen, A.L.; Myers-Smith, I.H.; Criado, M.G.; Liu, Y.; et al. Arctic tundra shrubification: A review of mechanisms and impacts on ecosystem carbon balance. Environ. Res. Lett. 2021, 16, 053001. [Google Scholar] [CrossRef]
  92. Keenan, T.F.; Riley, W.J. Greening of the land surface in the world’s cold regions consistent with recent warming. Nat. Clim. Change 2018, 8, 825–828. [Google Scholar] [CrossRef]
  93. Mikola, J.; Virtanen, T.; Linkosalmi, M.; Vähä, E.; Nyman, J.; Postanogova, O.; Räsänen, A.; Kotze, D.J.; Laurila, T.; Juutinen, S.; et al. Spatial variation and linkages of soil and vegetation in the Siberian Arctic tundra—Coupling field observations with remote sensing data. Biogeosciences 2018, 15, 2781–2801. [Google Scholar] [CrossRef]
  94. Zhang, Y.; Wang, J.A.; Berner, L.T.; Goetz, S.J.; Zhao, K.; Liu, Y. Warming and disturbances affect Arctic-boreal vegetation resilience across northwestern North America. Nat. Ecol. Evol. 2024, 8, 2265–2276. [Google Scholar] [CrossRef] [PubMed]
Figure 1. Study area in northeastern Siberia: (a) spatial distribution of thermokarst lake coverage classified into five levels (None: 0–1%; Low: 1–10%; Moderate: 10–30%; High: 30–60%; Very High: 60–100%) overlaid with river basins, to illustrate the persistent geomorphic potential of thermokarst lakes; (b) major vegetation types (forest and tundra) and river basins; (c) relative geographic location of the study area. In panel (a), sky blue represents ocean, while in panels (b,c), grey represents land. Data sources and processing details are described in Section 2.2.
Remotesensing 18 00308 g001
Figure 2. Spatial patterns and interannual dynamics of growing-season NDVI over the 2001–2021 period. (a) Spatial distribution of average NDVI from 2001 to 2021. (b) Interannual NDVI variations from 2001 to 2021. Green dots indicate growing-season mean NDVI, the red dashed line shows the fitted long-term trend, and the shaded area represents the interquartile range (IQR; 25th–75th percentiles). (c) Boxplots of the multi-year average growing-season NDVI for different vegetation types and thermokarst lake categories. Forest (F) and tundra (T) categories are colored in green and purple, respectively. Thermokarst lake coverage levels are coded as L0–L4, representing None (0–1%), Low (1–10%), Moderate (10–30%), High (30–60%), and Very High (60–100%) coverage. All boxplots and group-level statistics are based on pixel-level samples; the number of pixels in each vegetation–thermokarst lake category is reported in Table 1. Grey lines indicate watershed boundaries, white areas represent land, and light blue areas denote the ocean.
Remotesensing 18 00308 g002
Figure 3. Spatial patterns and trend characteristics of growing-season NDVI in relation to vegetation and thermokarst lakes over the 2001–2021 period. (a) Spatial distribution of NDVI trend types across the study watershed, with significant increase (dark green), non-significant increase (light green), non-significant decrease (light brown), and significant decrease (dark brown) based on the Mann–Kendall trend test (α = 0.05). (b) Proportion of NDVI trend types for different vegetation and thermokarst lake combinations. (c) Distribution of NDVI trend slopes for different vegetation and thermokarst lake combinations. Forest (F) and tundra (T) vegetation types are combined with five thermokarst lake coverage levels (L0–L4). Grey lines indicate watershed boundaries, white areas represent land, and light blue areas denote the ocean.
Remotesensing 18 00308 g003
Figure 4. Distribution of browning and wildfire burned areas by thermokarst lake coverage categories.
Remotesensing 18 00308 g004
Figure 5. Partial correlation analysis between NDVI and influential factors across northeastern Siberia from 2001 to 2021. (ag) Spatial distribution of partial correlation coefficients between NDVI and environmental variables, including growing-season (GS) and winter (Win) temperature (Tem) and precipitation (Pre), growing-season soil moisture (SM), soil temperature (ST), and wildfire burned area (WBA). (h) Boxplots showing the distribution of partial correlation coefficients across all influential factors. All boxplots and group-level statistics are based on pixel-level samples; the number of pixels in each vegetation–thermokarst lake category is reported in Table 1. Grey lines indicate watershed boundaries, light grey areas represent land, and light blue areas denote the ocean.
Remotesensing 18 00308 g005
Figure 6. Distribution of partial correlations between NDVI and influential factors across vegetation types and thermokarst lake categories (2001–2021). (ag) Boxplots of partial correlation coefficients between NDVI and environmental variables. Environmental variables include growing-season (GS) and winter (Win) temperature (Tem) and precipitation (Pre), and growing-season soil moisture (SM), soil temperature (ST), and wildfire burned area (WBA) across different vegetation-thermokarst lake combinations. Forest and tundra data are colored in green and purple, respectively. Thermokarst lake coverage levels are classified as L0–L4.
Remotesensing 18 00308 g006
Figure 7. Spatial patterns and statistical characteristics of Random Forest model performance (R2) in predicting growing-season NDVI from 2001 to 2021. (a) Spatial distribution of test R2. (b) Histogram of test R2 values. (c) Mean test R2 by vegetation type and thermokarst lake category. Forest (F) and tundra (T) categories are colored in green and purple, respectively. Black lines indicate watershed boundaries, light grey areas represent land, and light blue areas denote the ocean.
Remotesensing 18 00308 g007
Figure 8. Spatial distribution of dominant drivers of NDVI variability across the study area during 2001–2021. The dominant driver at each pixel is defined as the variable with the highest SHAP value in the pixel-level random forest model, indicating the strongest contribution to local NDVI variability. Light grey areas represent land, and light blue areas denote the ocean.
Remotesensing 18 00308 g008
Figure 9. Importance ranking of influential factors across northeastern Siberian vegetation types: (a) Study Area overview. (be) Forest (F) and (fj) Tundra (T) ecosystems stratified by thermokarst lake coverage (L0–L4).
Remotesensing 18 00308 g009
Figure 10. Spatial heterogeneity and regional patterns of influential controls on NDVI variability across northeastern Siberia from 2001 to 2021. Left column (ae): Spatial distributions of variable importance (temperature, precipitation, soil moisture, soil temperature, wildfire burned area) based on absolute SHAP values. Right column (fj): Importance distributions across vegetation-thermokarst lake complexes for corresponding influential factors. Forest (F) and tundra (T) categories are colored in green and purple, respectively. Data from forest (F) and tundra (T) regions were analyzed separately, with thermokarst lake coverage categorized into levels L0–L4. Grey lines indicate watershed boundaries, light grey areas represent land, and light blue areas denote the ocean.
Remotesensing 18 00308 g010
Figure 11. Annual SHAP dependence of NDVI on key environmental factors across forest and tundra ecosystems and thermokarst lake coverage levels (L0–L4, 2001–2021). (ad) Growing-season air temperature (Tem(GS)). (eh) Growing-season soil moisture (SM(GS)). (il) Growing-season soil temperature (ST(GS)). For all panels, colors indicate forest (green) and tundra (purple) responses, and subpanels correspond to thermokarst lake coverage levels L0, L2, L3, and L4. Note: The X axes represent standardized values, calculated by subtracting the mean and dividing by the standard deviation.
Remotesensing 18 00308 g011
Table 1. Climatic and environmental characteristics of forest and tundra pixels across thermokarst lake coverage levels.
Vegetation
Type
Thermokarst
Lake
Coverage 1
Pixel CountTemperaturePrecipitationSoil TemperatureSoil Moisture
-°Cmm°Cm3/m3
ForestNone25,844−7.064042.150.15
ForestLow11−4.473650.520.23
ForestModerate1902−8.853301.490.21
ForestHigh1477−8.253071.800.23
ForestVery High1706−8.943101.440.24
TundraNone18,540−12.26309−1.470.14
TundraLow785−12.15241−2.070.19
TundraModerate1434−11.71298−0.940.17
TundraHigh251−10.59302−0.770.18
TundraVery High2455−11.78231−1.600.29
Total54,405−9.403500.540.16
1 Thermokarst lake coverage levels correspond to a model-derived fractional coverage of thermokarst lake landscapes within each spatial unit, classified as None (0–1%), Low (1–10%), Moderate (10–30%), High (30–60%), and Very High (60–100%). These classes represent the persistent geomorphic potential of thermokarst lakes rather than instantaneous water extent and are derived from the Arctic Circumpolar Thermokarst Landscapes dataset (see Section 2.2 for details).
Disclaimer/Publisher’s Note: The statements, opinions and data contained in all publications are solely those of the individual author(s) and contributor(s) and not of MDPI and/or the editor(s). MDPI and/or the editor(s) disclaim responsibility for any injury to people or property resulting from any ideas, methods, instructions or products referred to in the content.