Article

Emissivity-Driven Directional Biases in Geostationary Satellite Land Surface Temperature: Integrated Comparison and Parametric Analysis Across Complex Terrain in Hunan, China

1
Hunan Key Laboratory of Meteorological Disaster Prevention and Reduction, Changsha 410118, China
2
China Meteorological Administration Training Centre Hunan Branch, Changsha 410125, China
3
Hunan Meteorological Research Institute, Changsha 410118, China
4
Hunan Meteorological Information Center, Changsha 410118, China
*
Author to whom correspondence should be addressed.
Remote Sens. 2026, 18(2), 284; https://doi.org/10.3390/rs18020284
Submission received: 17 November 2025 / Revised: 26 December 2025 / Accepted: 13 January 2026 / Published: 15 January 2026

Highlights

What are the main findings?
  • The accuracy of LST retrieved from geostationary satellite thermal infrared observations is systematically affected by both viewing and illumination geometries.
  • Surface elevation and vegetation density regulate LST directional anisotropy in a systematic manner, with emissivity-driven effects exerting a greater influence than solar-induced shadowing and sunlit conditions.
What are the implications of the main findings?
  • The findings advance the understanding of LST directional anisotropy in thermally heterogeneous regions, facilitating more effective bias correction and product harmonization.
  • The comparative analysis of major geostationary LST products, analysis of geometric influence mechanisms, and parameterization of directional anisotropy over Hunan establishes a scientific basis for optimizing LST retrieval algorithms.

Abstract

Land surface temperature (LST) is fundamental for monitoring surface energy balance and environmental dynamics, with remote sensing providing the primary means of acquisition. However, directional anisotropy (DA) introduces systematic bias in satellite-derived LST products, particularly over complex landscapes. This study examines the impact of angular effects on LST retrievals from three leading East Asian geostationary satellites (FengYun 4A, FengYun 4B, and Himawari 9) across Hunan Province, China, using integrated comparison with in situ measurements and reanalysis data. Results show that all products exhibit a systematic cold bias, with FY4B achieving the highest accuracy. Diurnal retrieval precision increases with higher solar zenith angles (SZA), while no consistent relationship is observed between viewing zenith angle (VZA) and retrieval accuracy. Notably, the retrieval bias of the FY4 series increases significantly when the sun and sensor are aligned in azimuth, particularly when the relative azimuth angle (RAA) is less than or equal to 30°. Parametric modeling reveals that emissivity kernel-induced anisotropy is the principal driver of significant LST deviations in central Hunan, while solar kernel effects result in LST overestimation in mountainous regions and underestimation in plains. Increases in elevation or vegetation density reduce emissivity-induced errors but amplify errors caused by shadowing and sunlit effects. Emissivity anisotropy is thus identified as the primary source of LST DA. These findings deepen the understanding of LST DA in remote sensing and provide essential guidance for refining retrieval algorithms and improving the applicability of LST products in complex terrains.

1. Introduction

Land surface temperature (LST) is a fundamental parameter that characterizes the land surface energy balance, water–heat exchange, and climate change [1,2]. It plays an indispensable role in a wide range of fields, including weather forecasting, urban heat island monitoring, agricultural production optimization, and ecological environment assessment [3]. Remote sensing technology, with its broad spatial coverage and rapid data acquisition capabilities, has become the primary method for obtaining LST [4,5]. Over the past several decades, retrieval techniques utilizing data from satellite instruments such as the Moderate Resolution Imaging Spectroradiometer (MODIS) onboard Terra and Aqua, the Visible Infrared Imaging Radiometer Suite (VIIRS) of the National Polar-orbiting Partnership, the Advanced Baseline Imager (ABI) of the Geostationary Operational Environmental Satellite, and the Advanced Geostationary Radiation Imager (AGRI) on Feng Yun satellites have matured considerably. As a result, the accuracy of LST products has significantly improved, paving the way for their widespread application in operational monitoring and scientific research across multiple sectors, including meteorology and agriculture [3,5]. Most official satellite-derived LST products are retrieved using split-window algorithms or temperature–emissivity separation approaches, both of which assume that the land surface emits thermal radiation isotropically and remains in thermodynamic equilibrium [2].
However, both land surface thermal emission and LST observations display pronounced directional anisotropy (DA) [2]. Although the true land surface temperature is direction-independent, non-isothermal mixed pixels and variations in surface emissivity with observation angle cause the retrieved LST to represent a directional radiometric temperature [6,7]. Consequently, remote sensing measurements of LST are strongly influenced by viewing and illumination geometries [8]. This surface temperature DA causes the same surface to exhibit different radiometric characteristics under varying observation conditions, introducing systematic biases and serving as a major source of artificial variability/biases in LST data records [9]. Notably, directional temperature variations can even exceed the impacts of surface emissivity and atmospheric conditions on LST retrieval [10]. For instance, radiometric temperature differences between nadir and off-nadir directions can reach 2 K in crops [11] and 7 K in forests [12]; DA-induced brightness temperature differences can reach 8 K in vegetated areas [13] and 14 K in urban areas [14]. Furthermore, DA-induced LST differences can reach 6 K over flat regions of California [15], 8.8 K in dense built-up areas [16], and 15 K in vineyards [17]. Cao et al. [2] reviewed studies of brightness temperature DA based on in situ measurements over soils and vegetation, reporting differences of 3–16.2 K for heterogeneous surfaces and 0.6–3 K for homogeneous surfaces. Such directional variability constrains the consistency of LST products obtained from different sensors or viewing geometries [3,15]. Studies have shown that accounting for spectral and angular variations in surface emissivity enhances LST retrieval accuracy when using dual-angle or optimized algorithms [3,18,19]. Nevertheless, current operational algorithms still neglect DA [4], introducing global-scale errors of 1.7–5.1 K [20] and hindering the intercomparison and harmonization of multi-angle and multi-sensor LST products [2,21].
Various models have been developed to evaluate DA in satellite remote sensing, particularly in the thermal-infrared (TIR) bands or for LST products [2]. Physics-based model investigations include analyses of TIR/LST DA over sparse vegetation using the Discrete Anisotropy Radiative Transfer (DART) model [22], the Scattering by Arbitrarily Inclined Leaves (4SAIL) model [23], and the Soil Canopy Observation of Photochemistry and Energy fluxes (SCOPE) model [24]. While physics-based models can provide highly accurate simulations, their low computational efficiency and the detailed surface information they require—which is often unavailable at continental or global scales—greatly limit their operational applications [2]. In contrast, parametric models are attractive due to their simplicity, robustness, and scalability across spatial domains [25], though they remain relatively scarce in LST DA analysis [26]. For example, some studies have adapted reflectance hotspot models for the thermal infrared directional signature by replacing reflectance with surface temperature [27]. Others have developed parametric models using a linear combination of emissivity and solar kernels, following the structure of Bidirectional Reflectance Distribution Function (BRDF) models [28]. Notably, this latter approach is currently the only parametric model applied for angular correction of satellite-derived LSTs [8]. Unlike previous analyses, which have primarily focused on homogeneous and flat surfaces [2], this study investigates LST DA over complex terrain and heterogeneous surface conditions, where the Vinnikov model is particularly well suited.
Field experiments play a crucial role in revealing the directional characteristics of thermal radiation and provide valuable data for model validation. Several studies have analyzed TIR/LST DA using in situ measurements [17]; however, most have concentrated on the specific grid points where observation stations are located [26]. Comprehensive anisotropy datasets covering diverse conditions are scarce, necessitating large accumulated datasets for thorough evaluation of parametric models [25]. Geostationary satellites, due to the high temporal resolution of their products, have become the preferred choice for developing multi-angle satellite remote sensing datasets at the pixel scale [8]. To address the lack of comprehensive directional datasets, this study integrates multi-source geostationary satellite LST products, in situ and reanalysis data, and environmental parameters to construct a high-quality dataset for anisotropy analysis.
A clear understanding of DA is essential for bias correction and product harmonization [19,29]. This study examines DA in geostationary LST products over Hunan Province, China, with three main objectives: (1) comparative analysis of FengYun-4 series and Himawari-9 LST products; (2) analysis of the influence of angular factors on retrieval accuracy; and (3) regional anisotropy assessment using a parametric model. In contrast to previous studies that relied on limited in situ observations or simulations, this work utilizes multiple geostationary satellites equipped with comparable sensors and high-quality ground reference data. By extending a parametric model to thermally heterogeneous regions, this study provides, for the first time, a comprehensive DA analysis over an area characterized by complex thermal environments and heterogeneous land surfaces. The findings offer new insights into anisotropy mechanisms and provide practical guidance for improving operational LST products.

2. Materials and Methods

2.1. Study Area

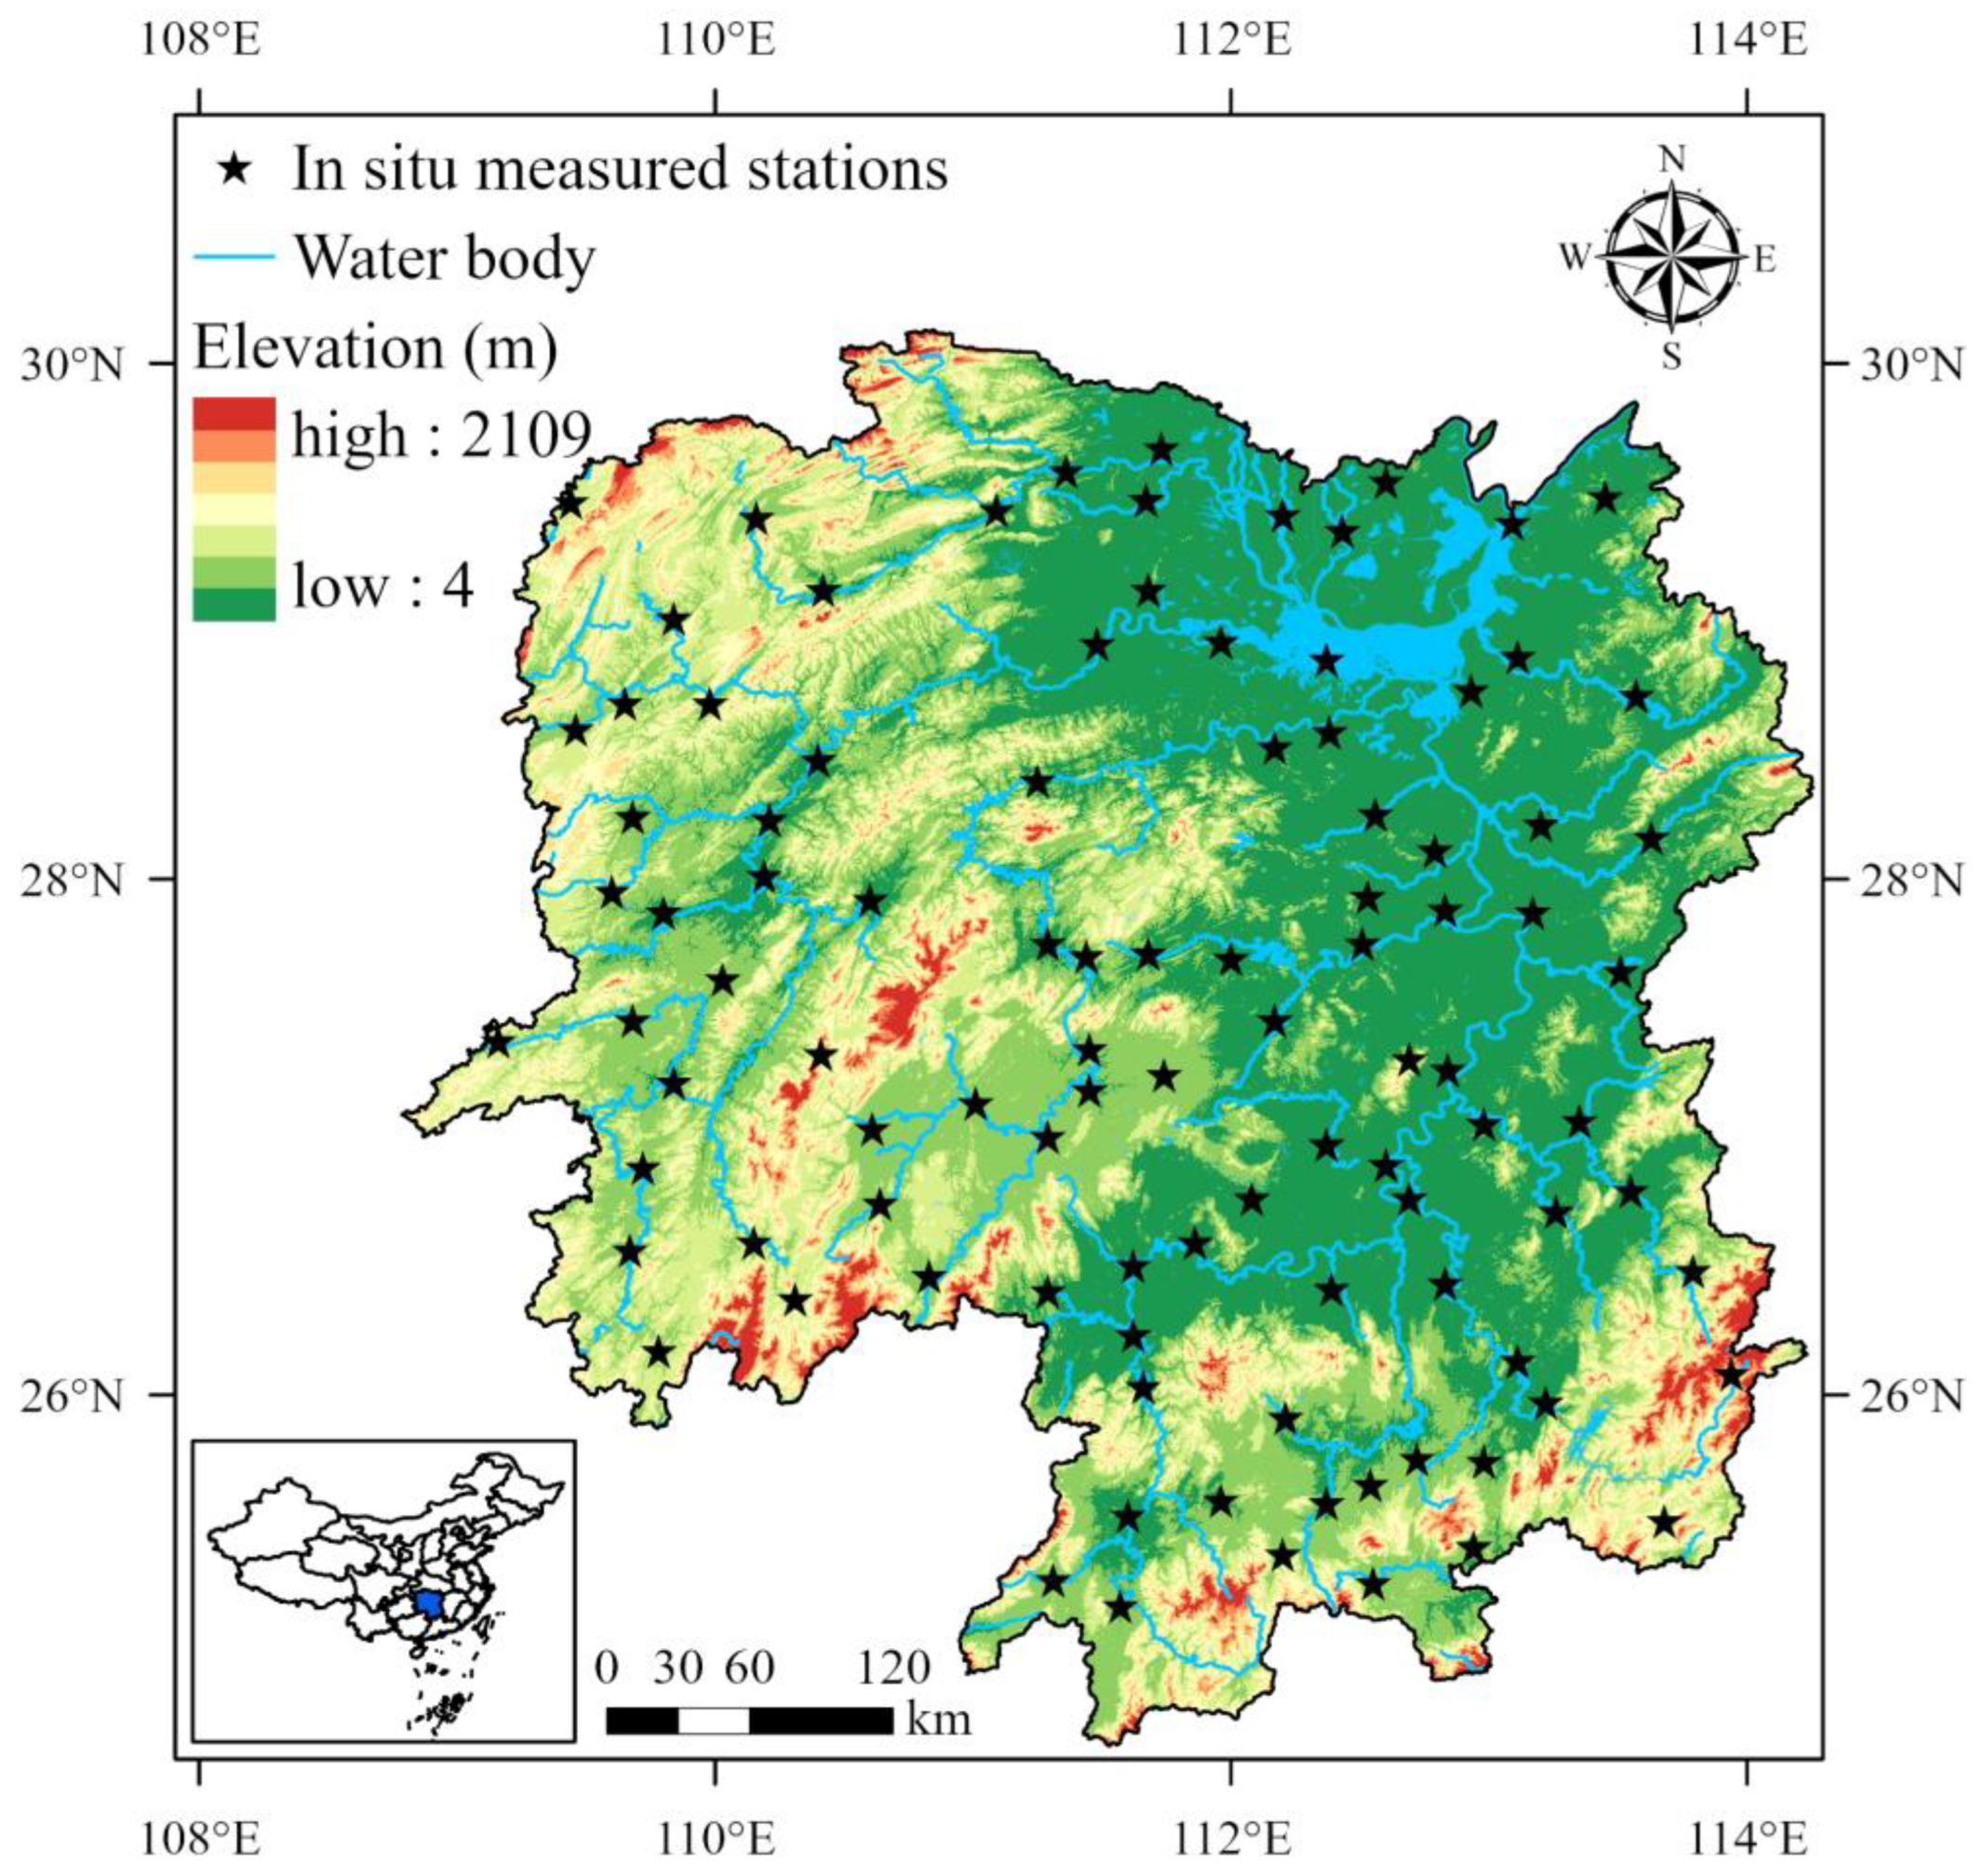
Hunan Province, located in south-central China (24°38′–30°08′N, 108°47′–114°15′E), covers approximately 211,800 km2. The region features higher elevations in the south and lower elevations in the north, and is surrounded by mountains on three sides (Figure 1). Its topography is diverse, comprising mountains (51.2%), hills (15.4%), plains (13.1%), and plateaus (20.3%). Hunan experiences a subtropical monsoon climate, with a mean annual temperature of 16–18 °C and annual precipitation of 1200–1700 mm. The combination of abundant hydrothermal resources and varied elevation leads to pronounced spatial heterogeneity in surface thermal characteristics. The complex terrain and highly fragmented land cover make Hunan an exemplary setting for investigating DA in LST.

2.2. Data

2.2.1. Remote Sensing Products

  • FY4A/B LST
Fengyun-4A (FY4A) and Fengyun-4B (FY4B) are part of China’s second-generation geostationary meteorological satellite system, positioned at 104.7°E and 133°E, respectively, during the study period. The Advanced Geostationary Radiation Imager (AGRI) provides multispectral observations for atmospheric and land monitoring [30]. Level-2 LST is retrieved using a split-window algorithm [31] applied to thermal infrared channels (10.3–12.5 µm), with calibration accuracy better than 1 K for FY4A and 0.7 K for FY4B. The data have a spatial resolution of 4 km and a temporal resolution up to 15 min, and are stored in netCDF format using the normalized projection (NOM). Associated angular parameters—including Sun Zenith Angle (SZA), Viewing Zenith Angle (VZA), Sun Azimuth Angle (SAA), and Viewing Azimuth Angle (VAA)—were obtained from FY-4 Level-1 GEO products, which share the same projection and resolution but are provided in HDF format. FY4A/B LST and GEO datasets were acquired from http://satellite.nsmc.org.cn/.
2.
H9 LST
Himawari-9, stationed at 140.7°E and equipped with the Advanced Himawari Imager (AHI), provides multispectral imagery comparable to AGRI. The Copernicus Global Land Service (CGLS) Himawari-9 LST product for East Asia is generated using the Generalized Split-Window (GSW) algorithm [32] applied to the 10.8–13.1 μm bands, with a spatial resolution of 0.045° and an hourly temporal resolution (WGS 1984 projection). Viewing and illumination geometries (SZA, VZA, SAA, and VAA) were derived from Level-1 data (5 km, 10 min, equidistant rectangular projection). Both datasets are provided in netCDF format and are available at http://land.copernicus.eu/.

2.2.2. Reference Datasets

  • In situ measured data
In situ data were collected from 98 China Meteorological Administration (CMA) stations distributed across Hunan Province (Figure 1). These stations are located on flat, homogeneous surfaces, minimizing sub-pixel variability and ensuring local representativeness. Measurements were obtained using platinum resistance thermometers in direct contact with the soil surface to obtain the thermodynamic temperature, with an accuracy of ±0.1 °C. Instruments were regularly maintained by trained personnel, and data underwent quality control to retain values within −80 to 80 °C. Minute-resolution data were provided by the Hunan Meteorological Big Data Center.
2.
CLDAS GST
The CMA Land Data Assimilation System (CLDAS v2.0) [33] is an equal-angle gridded reanalysis dataset covering 0–65°N and 60–160°E. It integrates numerical model simulations, in situ observations, and satellite inputs and demonstrates superior performance compared to international counterparts across China. The ground surface temperature (GST) product used in this study has a spatial resolution of 0.0625° and an hourly temporal resolution. National assessments indicate strong agreement with in situ measurements (Pearson’s correlation coefficient, R = 0.98; root mean square error, RMSE = 1.8 K; mean bias, Bias = 1.4 K). The dataset, distributed in netCDF format, was obtained from http://satellite.nsmc.org.cn/.

2.2.3. Auxiliary Data

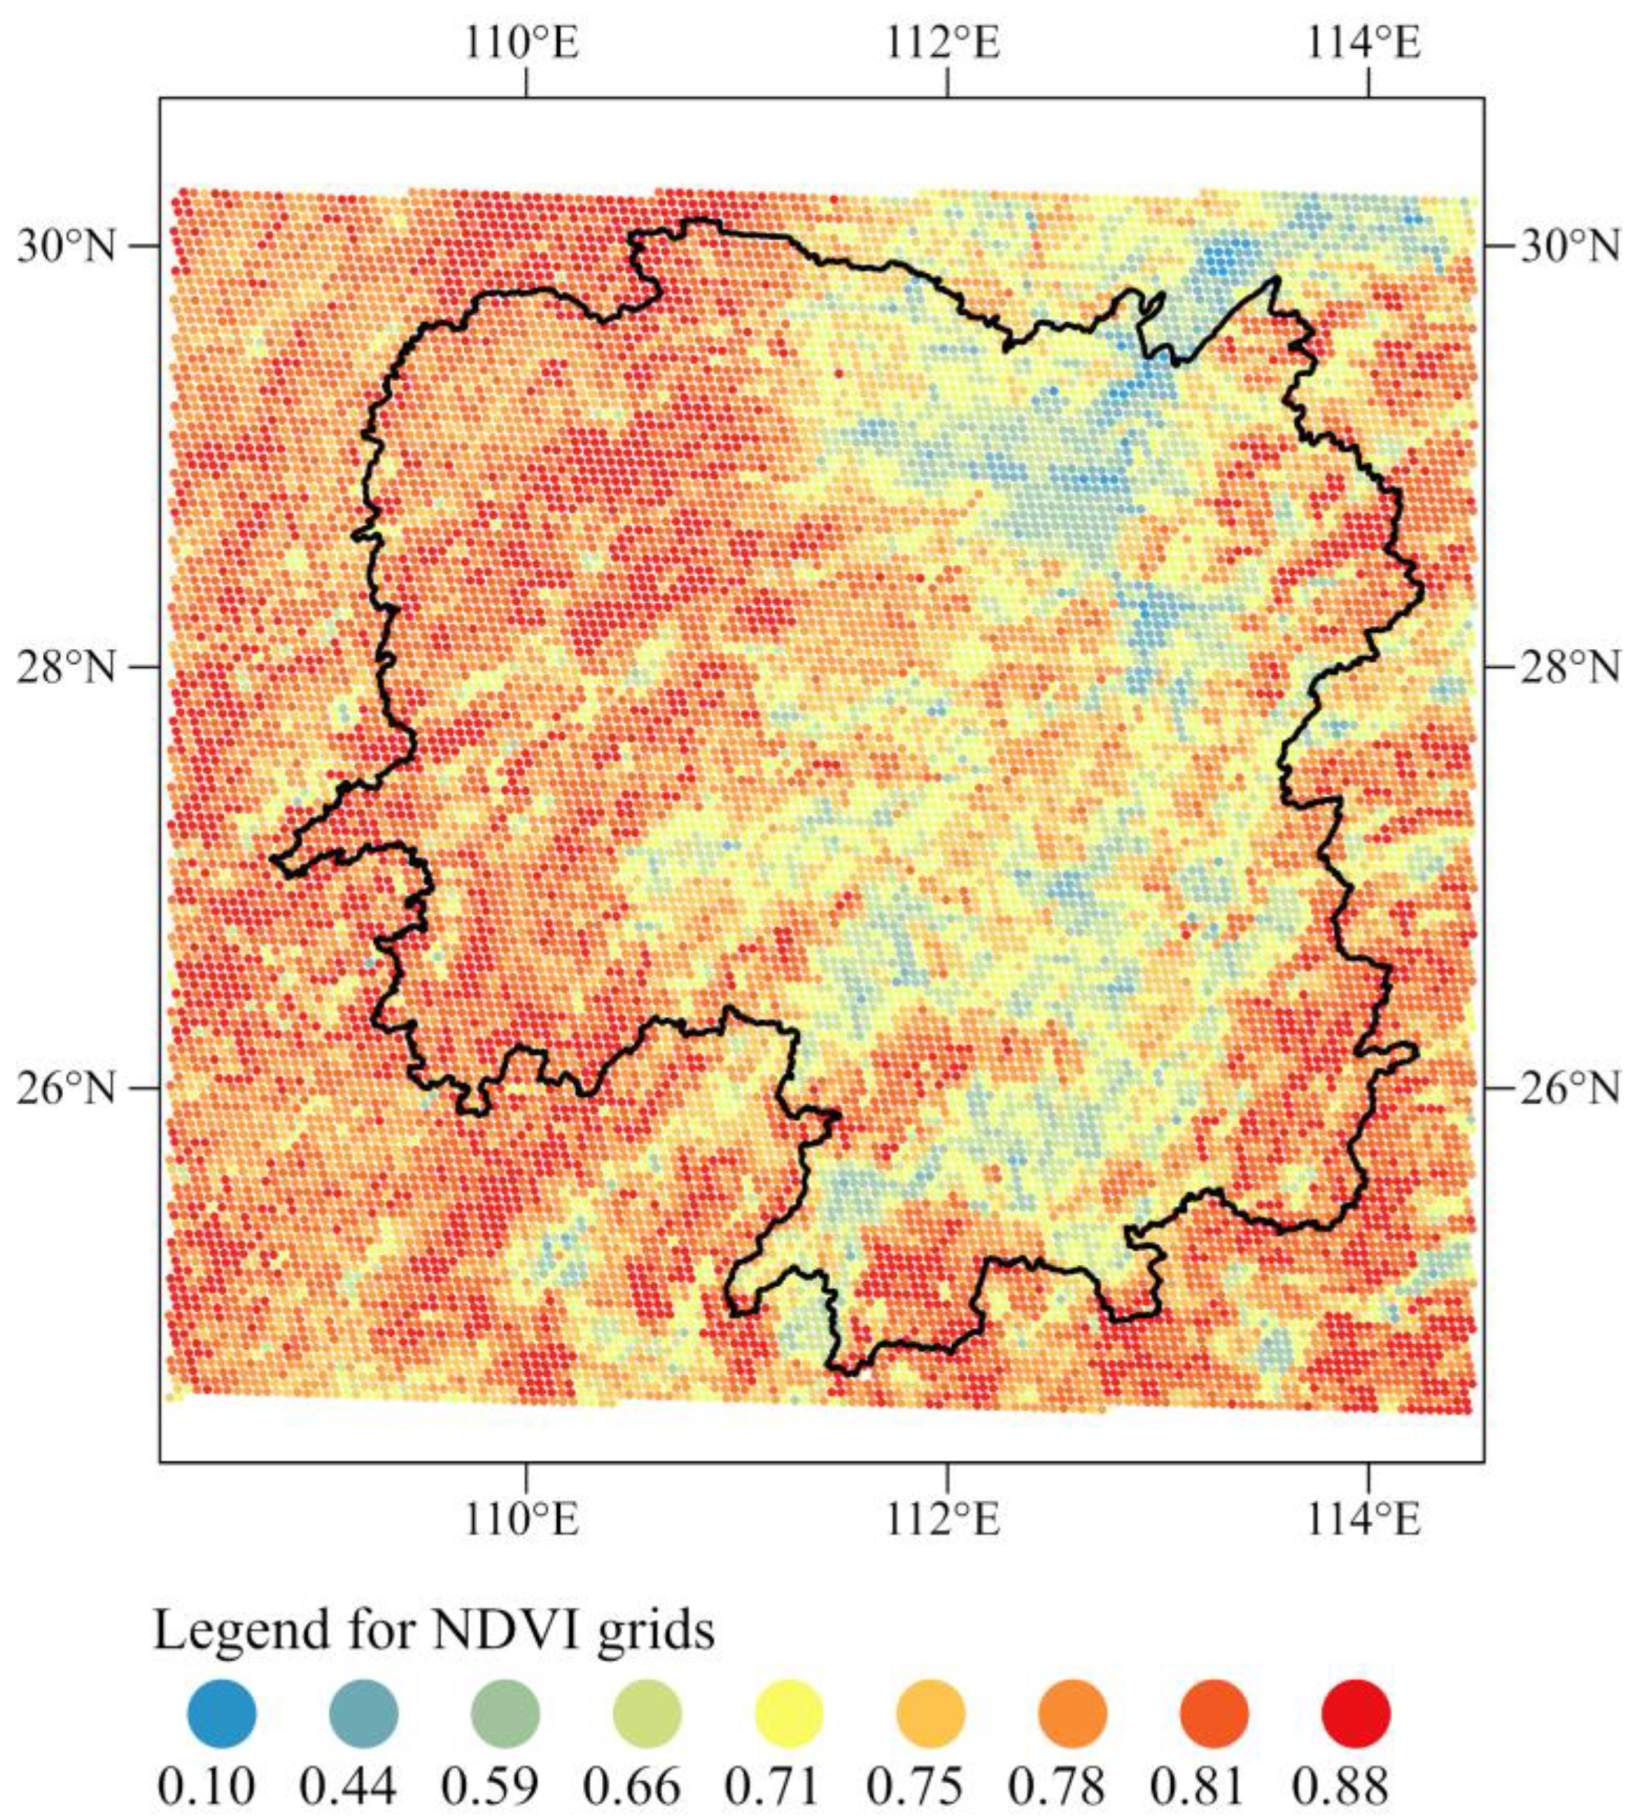
Normalized Difference Vegetation Index (NDVI) data were obtained from the MODIS Aqua Vegetation Indices Monthly product (MYD13C2 Version 6.1, July 2023), with a pixel size of 5600 m in the Climate Modeling Grid (CMG). The data are provided in HDF format (https://lpdaac.usgs.gov). Digital elevation model (DEM) parameters for FY4 grids were calculated using NASA’s ASTER Global Digital Elevation Model Version 3 (ASTER GDEM V3) at 30 m resolution (https://doi.org/10.5067/ASTER/AST14DEM.003, accessed on 22 September 2023).

2.3. Methods

All datasets were standardized to a unified temporal window from 00:00 UTC 17 July to 23:45 UTC 16 August 2023. LST values were converted to degrees Celsius (°C), and timestamps were synchronized to Coordinated Universal Time (UTC).

2.3.1. Data Preprocessing

FY4A/B angular parameters were merged with their corresponding LST data on the native NOM grids. H9 LST products and their angular parameters were co-registered using nearest-neighbor matching based on H9’s WGS 1984 grids. Two independent reference datasets were generated: (i) An in situ reference dataset, constructed through spatiotemporal nearest-neighbor matching between satellite observations and in situ measurements at 98 stations, with minute-level temporal alignment and a mean spatial offset of approximately 1.6 km between stations and satellite footprint centers, achieving up to 15 min temporal resolution. (ii) A reanalysis reference dataset, established by resampling satellite products to CLDAS 0.0625° grids, with a mean offset of approximately 1.7 km between satellite footprints and CLDAS grid centers, covering all study area pixels with hourly temporal resolution. No temporal or spatial interpolation was performed on the matched datasets.

2.3.2. Comparative Analysis Methodology

Comprehensive and categorical analyses were conducted on both matched datasets using the following error metrics:
R = cov ( R S T , I S T ) σ R S T σ I S T
Bias = 1 m i = 1 m ( R S T i I S T i )
Bias r = 1 m i = 1 m ( R S T i I S T i I S T i )
RMSE = 1 m i = 1 m ( R S T i I S T i ) 2
ubRMSE = RMSE 2 Bias 2
where RST denotes the LST of each remote sensing–based product, IST denotes the in situ measured LST or CLDAS GST, cov() is the covariance, and σ is the standard deviation. In these metrics, a higher R and lower Bias, Biasr (relative bias), RMSE, and ubRMSE (unbiased RMSE) indicate better product performance.

2.3.3. Additional Angular Parameter

The analysis incorporated the Sun–view relative azimuth angle (RAA), defined as the minimal angle between SAA and VAA, to quantify directional disparities between solar illumination and satellite observation geometries. RAA is calculated as follows:
RAA = 180 ° SAA VAA 180 °
Geometrically, RAA = 0° indicates co-alignment of solar and viewing directions on the same side of the target, where the sun and satellite reside within the same vertical plane relative to the observed surface point. RAA = 180° represents a diametrically opposed configuration, with the target positioned on the vertical plane between the sun and satellite, thus maximizing shadowing effects.

2.3.4. Parametric Model for Directional Anisotropy Assessment

The influence of angular factors was analyzed using the Vinnikov parametric model, a kernel-driven framework for LST angular dependence analysis initially developed by Vinnikov et al. [28] and computationally enhanced by Ermida et al. [8]. This model quantifies the statistical dependence of LST on viewing and illumination geometries, as follows:
T ( θ v , θ i , Δ ϕ ) T 0 = 1 + A Φ ( θ v ) + D Ψ ( θ v , θ i , Δ ϕ )
Φ ( θ v ) = 1 cos ( θ v )
Ψ ( θ v , θ i , Δ ϕ ) = sin ( θ v ) cos ( θ i ) sin ( θ i ) cos ( θ i θ v ) cos ( Δ ϕ )
where Φ ( θ v ) represents the emissivity kernel; Ψ ( θ v , θ i , Δ ϕ ) denotes the solar kernel; ( θ v , θ i , Δ ϕ ) corresponding to VZA, SZA, and RAA, respectively; and T 0 = T ( θ v = 0 , θ i ) signifies the nadir-direction LST. Coefficients A and D, which capture land cover structural properties, are derived from observations and calculated following the optimized methodology of Ermida et al. [8]:
A = T b T a Φ b T a Φ a T b
D = T b T a A ( Φ b T a Φ a T b ) Ψ b T a Ψ a T b
where subscripts a , b denote observations from FY4A and FY4B, with A and D computed independently for each grid cell. The coefficient A is solved using nighttime acquisitions, while D is subsequently calculated from daytime observations based on the previously derived A value. To reduce uncertainty, calculations were limited to observations with VZA ≤ 50°, and generalized least squares were applied to all valid dual-satellite observation combinations for parameter estimation. The calculated values of coefficients A and D are screened for outliers using the Median Absolute Deviation (MAD) method.

3. Results and Discussion

3.1. Comprehensive Comparative Analysis of Satellite LST Products over the Hunan Region

A comprehensive comparative analysis of LST products from the three satellites was conducted using both in situ measurements and CLDAS reanalysis data. These datasets are complementary: in situ measurements offer site-specific, high-accuracy references, though their limited spatial distribution and inherent scale mismatch may influence the analysis results; in contrast, CLDAS provides spatial completeness and relatively high-accuracy reference data at an approximate spatial scale within China, but it may smooth local extremes and is not entirely independent of satellite inputs.
During the study period (17 July–16 August 2023), all satellite-derived LST products exhibited a systematic cold bias, although the accuracy varied among the products. Comparative analysis against in situ observations indicated that FY4B demonstrated the highest accuracy, while H9 exhibited the lowest performance. In contrast, CLDAS-based analysis indicated that H9 marginally outperformed FY4A, although FY4B remained the most accurate overall (Table 1). These results are based on statistically robust, matched datasets. FY4B’s error metrics display significant advantages, even with its substantially larger observational volume, thereby confirming the exceptional stability of its LST retrieval system.
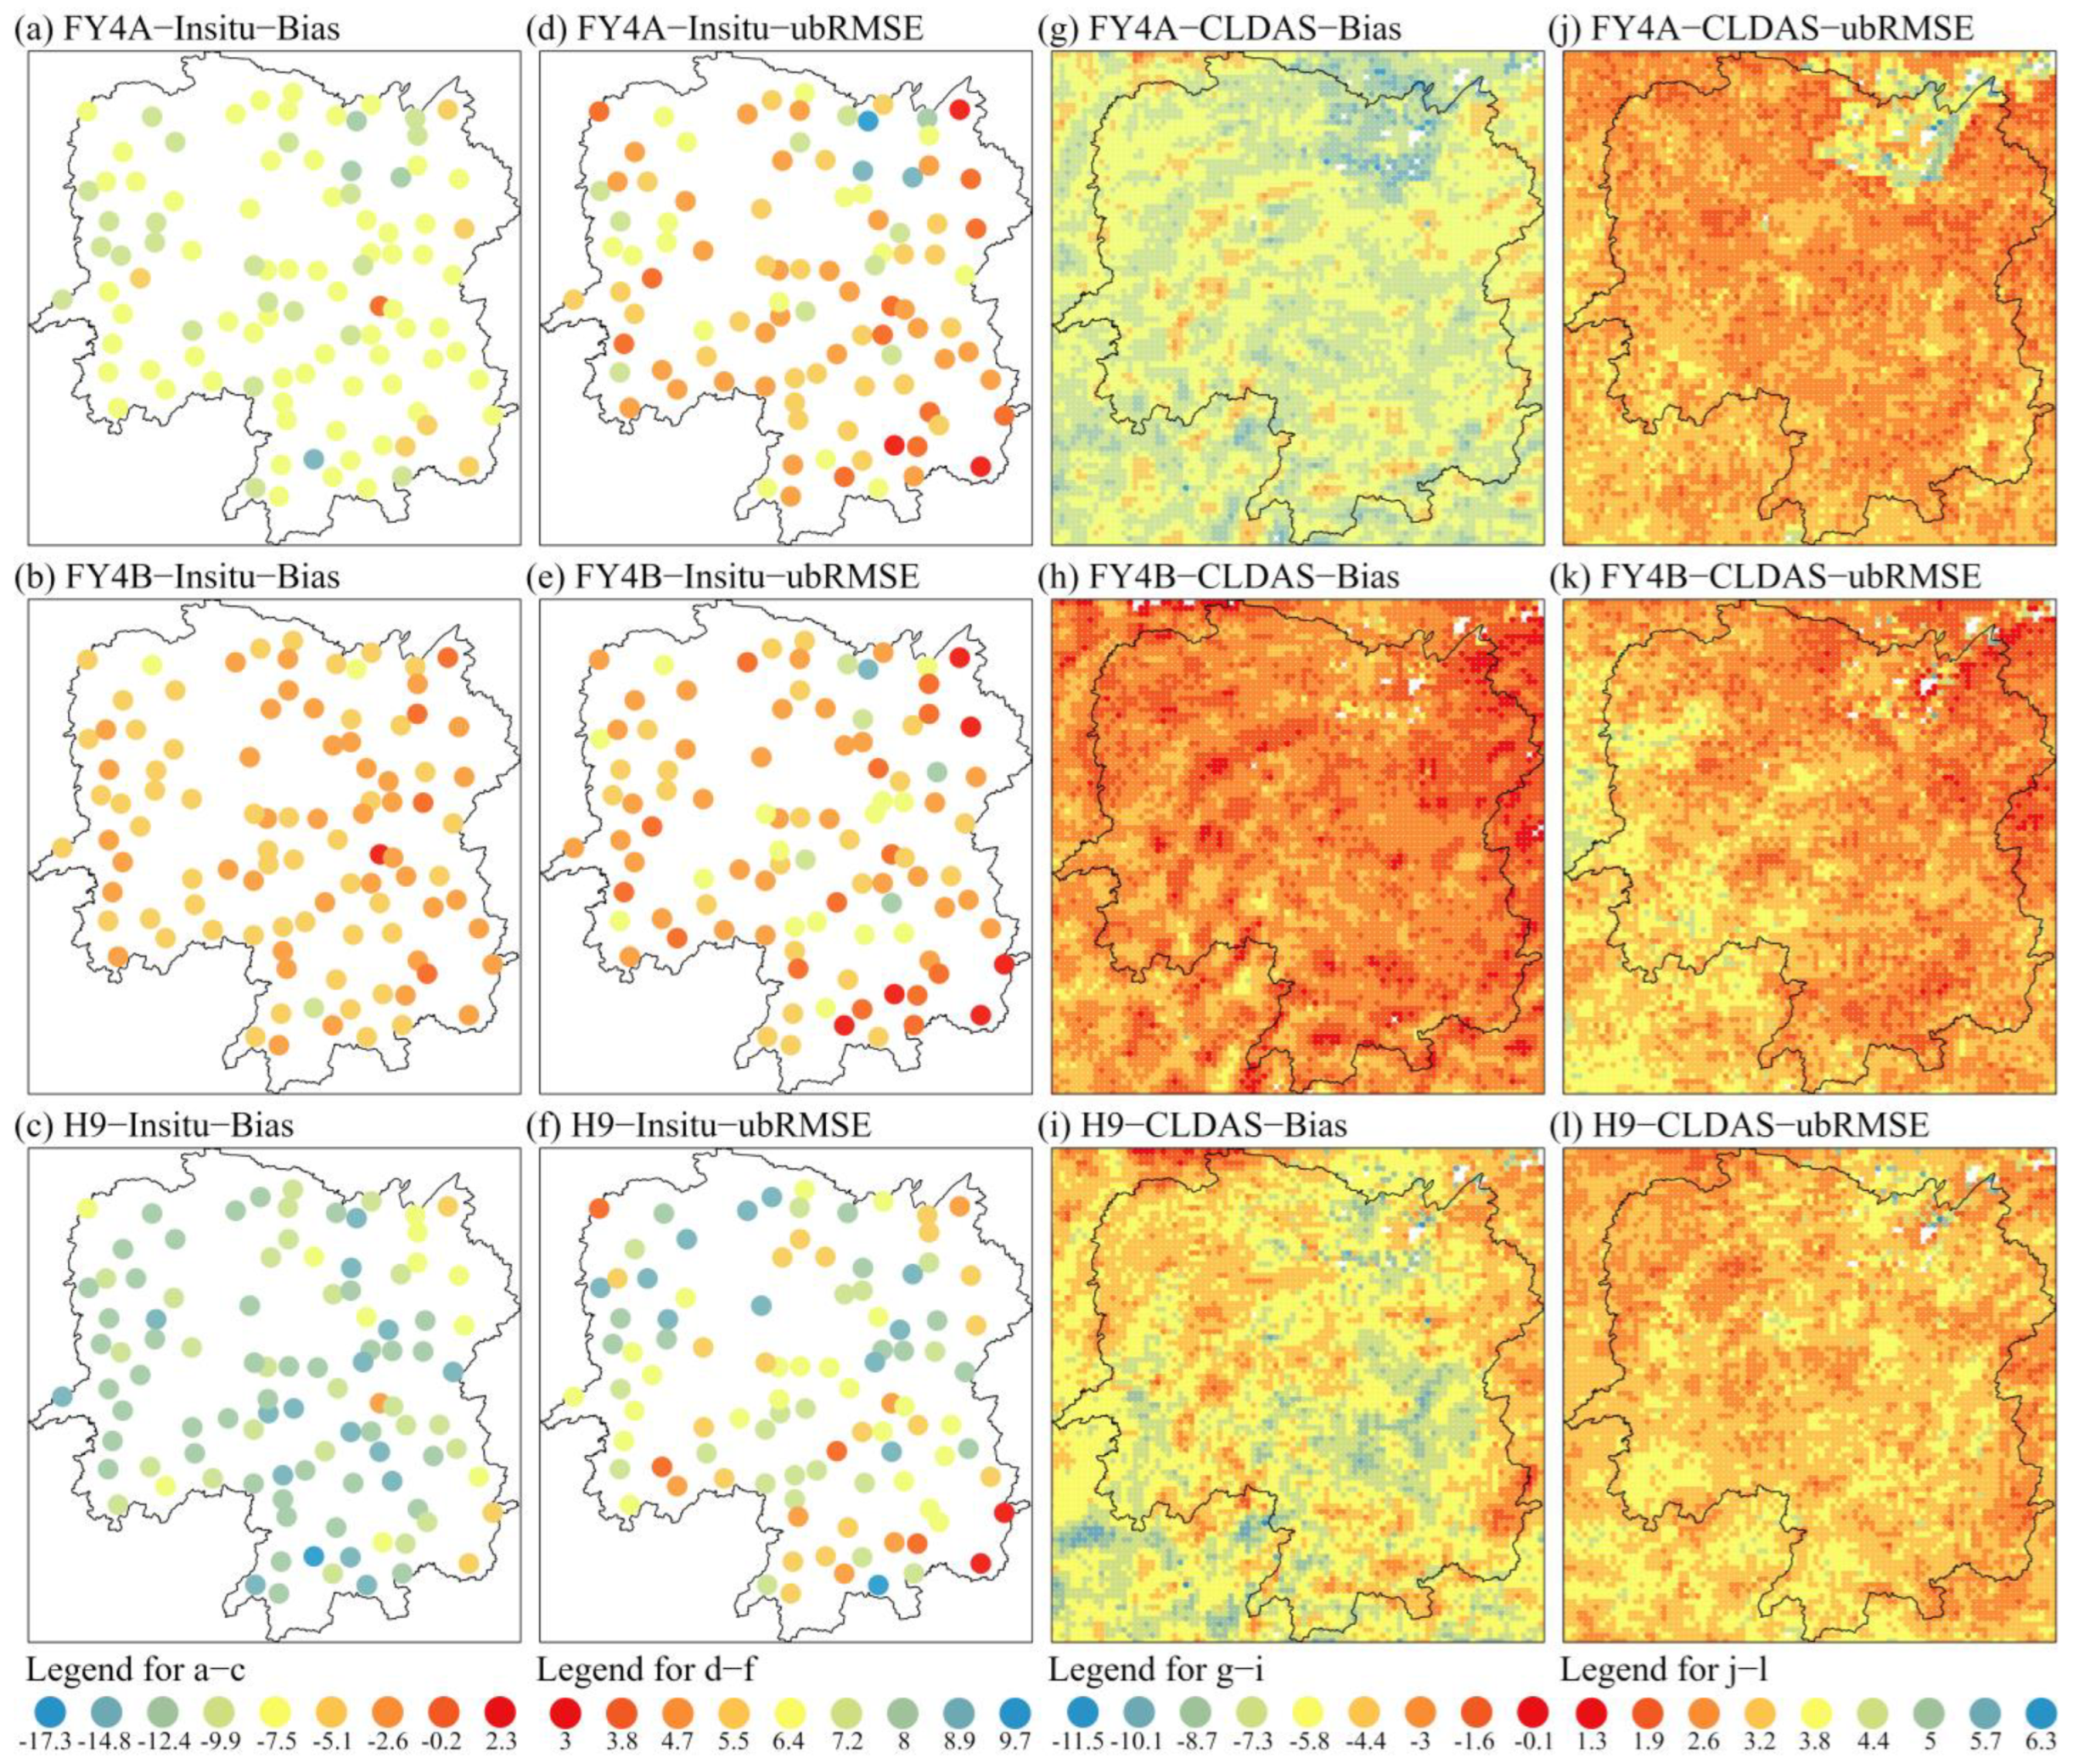
The spatial distribution of accuracy for the satellite-derived LST products across Hunan Province revealed three common error pattern characteristics. First, in situ-based analysis indicated that retrieval accuracy was higher in eastern compared to western Hunan, and higher in southern than in northern regions. Eastern areas exhibited lower systematic bias (improved Bias metrics), while the smallest random error variability (optimal ubRMSE) was predominantly observed along provincial boundaries. The Dongting Lake region in the northeast exhibited notably poor accuracy, in contrast to the higher precision observed in the southeastern mountainous zones (Figure 2a–f).
CLDAS-based analysis, benefiting from its higher spatial resolution, provided further spatial insights. Compared to the east, systematic errors were lower in western Hunan, but this was accompanied by greater random variability, particularly in high-elevation western terrain, where low systematic bias coexisted with substantial error fluctuation. The northeastern plains showed poorer overall accuracy than the western and southern mountains, a pattern primarily driven by suboptimal performance in the Dongting Lake area. Nonetheless, the northeastern plains (excluding Dongting Lake) and the northwestern mountains demonstrated superior regional performance.
The spatial patterns of CLDAS-derived error distributions (Figure 2g–l) with Hunan’s topography (Figure 1) and concurrent NDVI patterns (Figure 3) confirm that both terrain and vegetation are critical factors influencing LST retrieval precision. In the densely vegetated, high-altitude regions of western and southern Hunan, systematic bias was low but random error variability was high, whereas lower-elevation mountains exhibited low systematic bias and low random error variability. Sparsely vegetated lowlands—excluding Dongting Lake—were characterized by high systematic bias and low random variability.
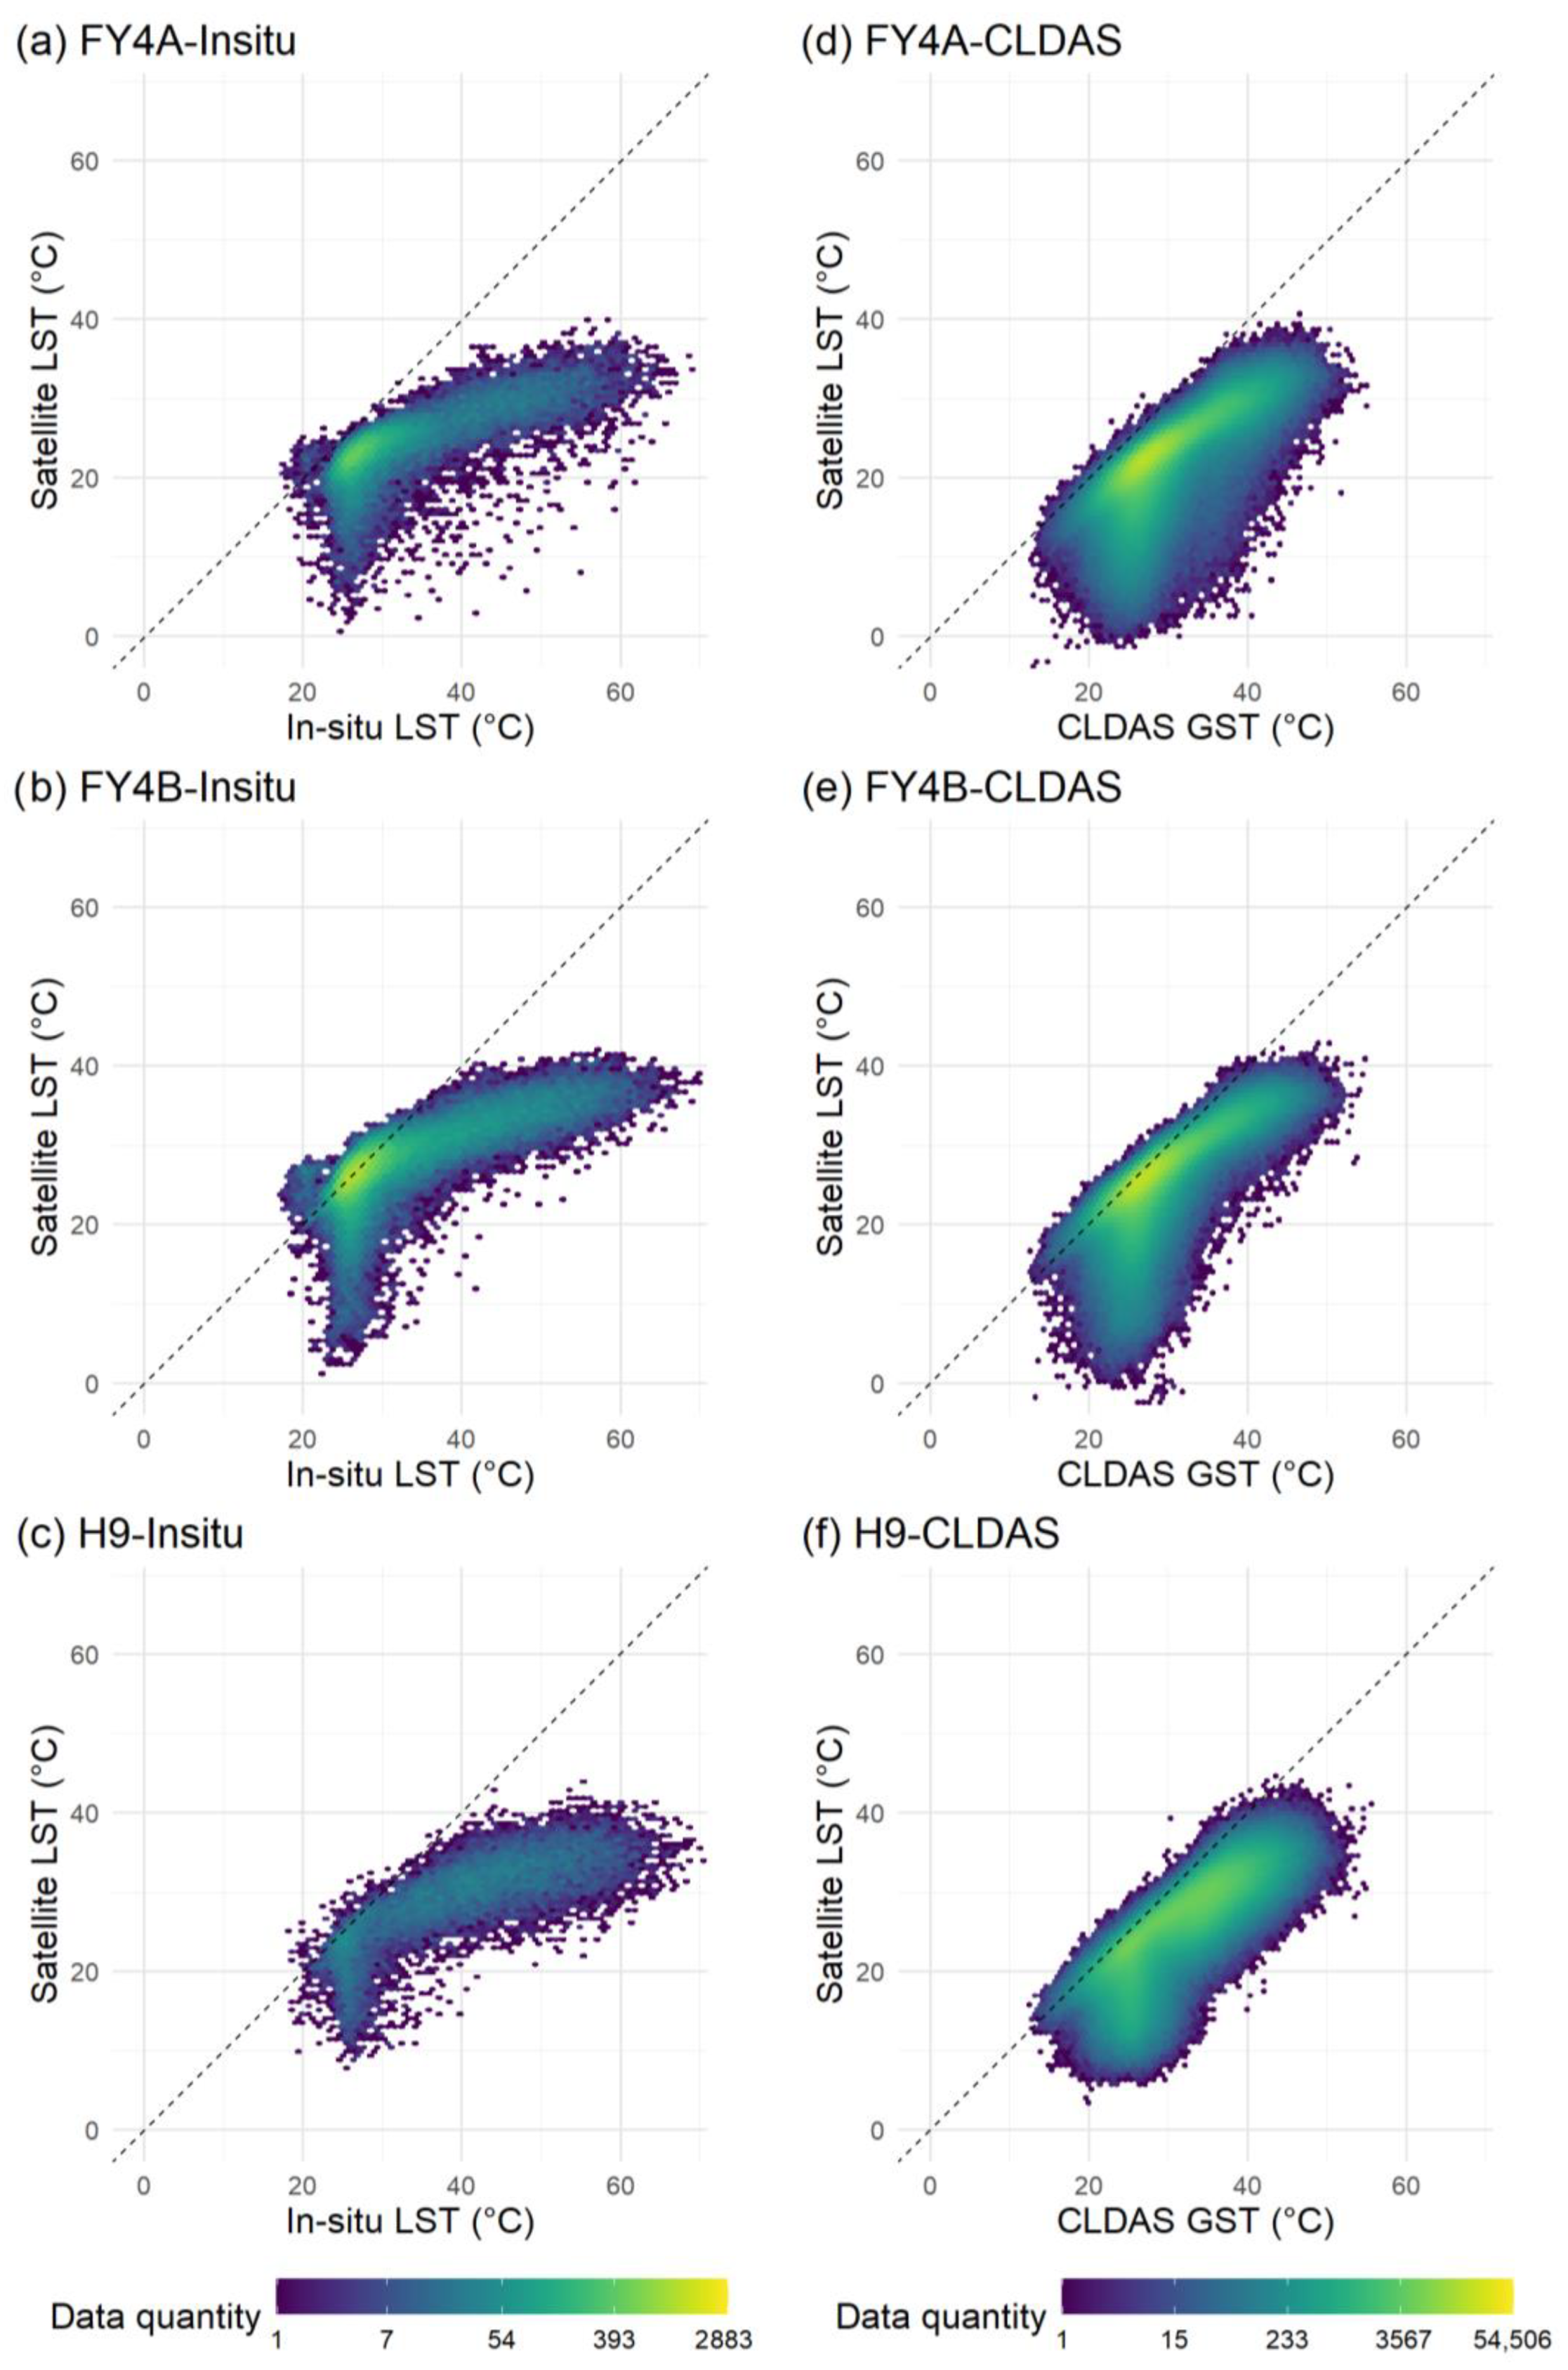
Scatter density plots (Figure 4) indicate that all three satellite-derived LST products captured the overall reference LST trends, with the highest-density points distributed around the 1:1 line (dashed line). However, the main data trend lies below this line, indicating a systematic cold bias. This bias intensifies with increasing temperature, as high-density regions shift toward the X-axis, suggesting a more pronounced underestimation at higher temperatures. The nonlinear distribution reveals marked underestimation in the low-temperature range (<30 °C), likely corresponding to nighttime or high-elevation conditions—consistent with the greater random variability observed in mountainous regions (Figure 2j–l). Due to uneven sample sizes in in situ datasets (Table 1), inter-satellite comparison was conducted using CLDAS data (Figure 4d–f), which confirmed that FY4B achieved the highest accuracy. FY4A exhibited stronger underestimation across all temperature ranges, while FY4B only slightly underestimated relative to Himawari-9 at low temperatures but demonstrated a more concentrated distribution of scatter points near the reference line at higher temperatures (>30 °C), indicating superior retrieval performance.
This comprehensive comparative analysis clarifies the quantitative error metrics, inter-product discrepancies, and spatial distribution characteristics of the satellite LST products. It is important to note that this comparative analysis does not constitute a strict validation of the three satellite products, as both reference datasets have inherent limitations when used as validation data. Therefore, the conclusions drawn here are based on the common findings from both reference data sources and provide essential error parameters for subsequent analyses.
The results of both that the Himawari LST product is more accurate than FY4A when evaluated against CLDAS data and the poorest satellite-derived LST performance occurs over the Dongting Lake area, are consistent with previous findings [34]. The larger retrieval errors in the Dongting Lake region may be attributable to mixed land–water pixels, which challenge retrieval algorithms optimized for homogeneous surfaces. Additionally, the observed increase in random error over areas with complex topography underscores the need for improved land cover parameterization in retrieval models. Therefore, subsequent analyses will disregard inherent and regional LST accuracy differences among the three satellites. Instead, the focus will be on the DA characteristics across the study area.

3.2. Influence of Angular Parameters on the Accuracy of LST Retrievals

This section investigates the influence of three angular parameters—SZA, VZA, and RAA—on the accuracy of geostationary LST products via large-sample correlation analysis, aiming to explore the generalizable impacts of angular factors on LST accuracy and to support the overall assessment of LST DA within the study region. SZA is defined as the angle between the solar rays and the local zenith, daytime ranging from 0° (sun directly overhead) to 90° (sun at the horizon), with nocturnal values extending from 90° to 180°. VZA quantifies the angle between the sensor’s line of sight and the zenith, where 0° corresponds to nadir viewing and larger values indicate more oblique observations. RAA is defined as described in Section 2.3.3. Collectively, these angular parameters are essential metadata, fundamentally determining radiative transfer modeling, atmospheric correction, and land surface parameter retrieval algorithms.
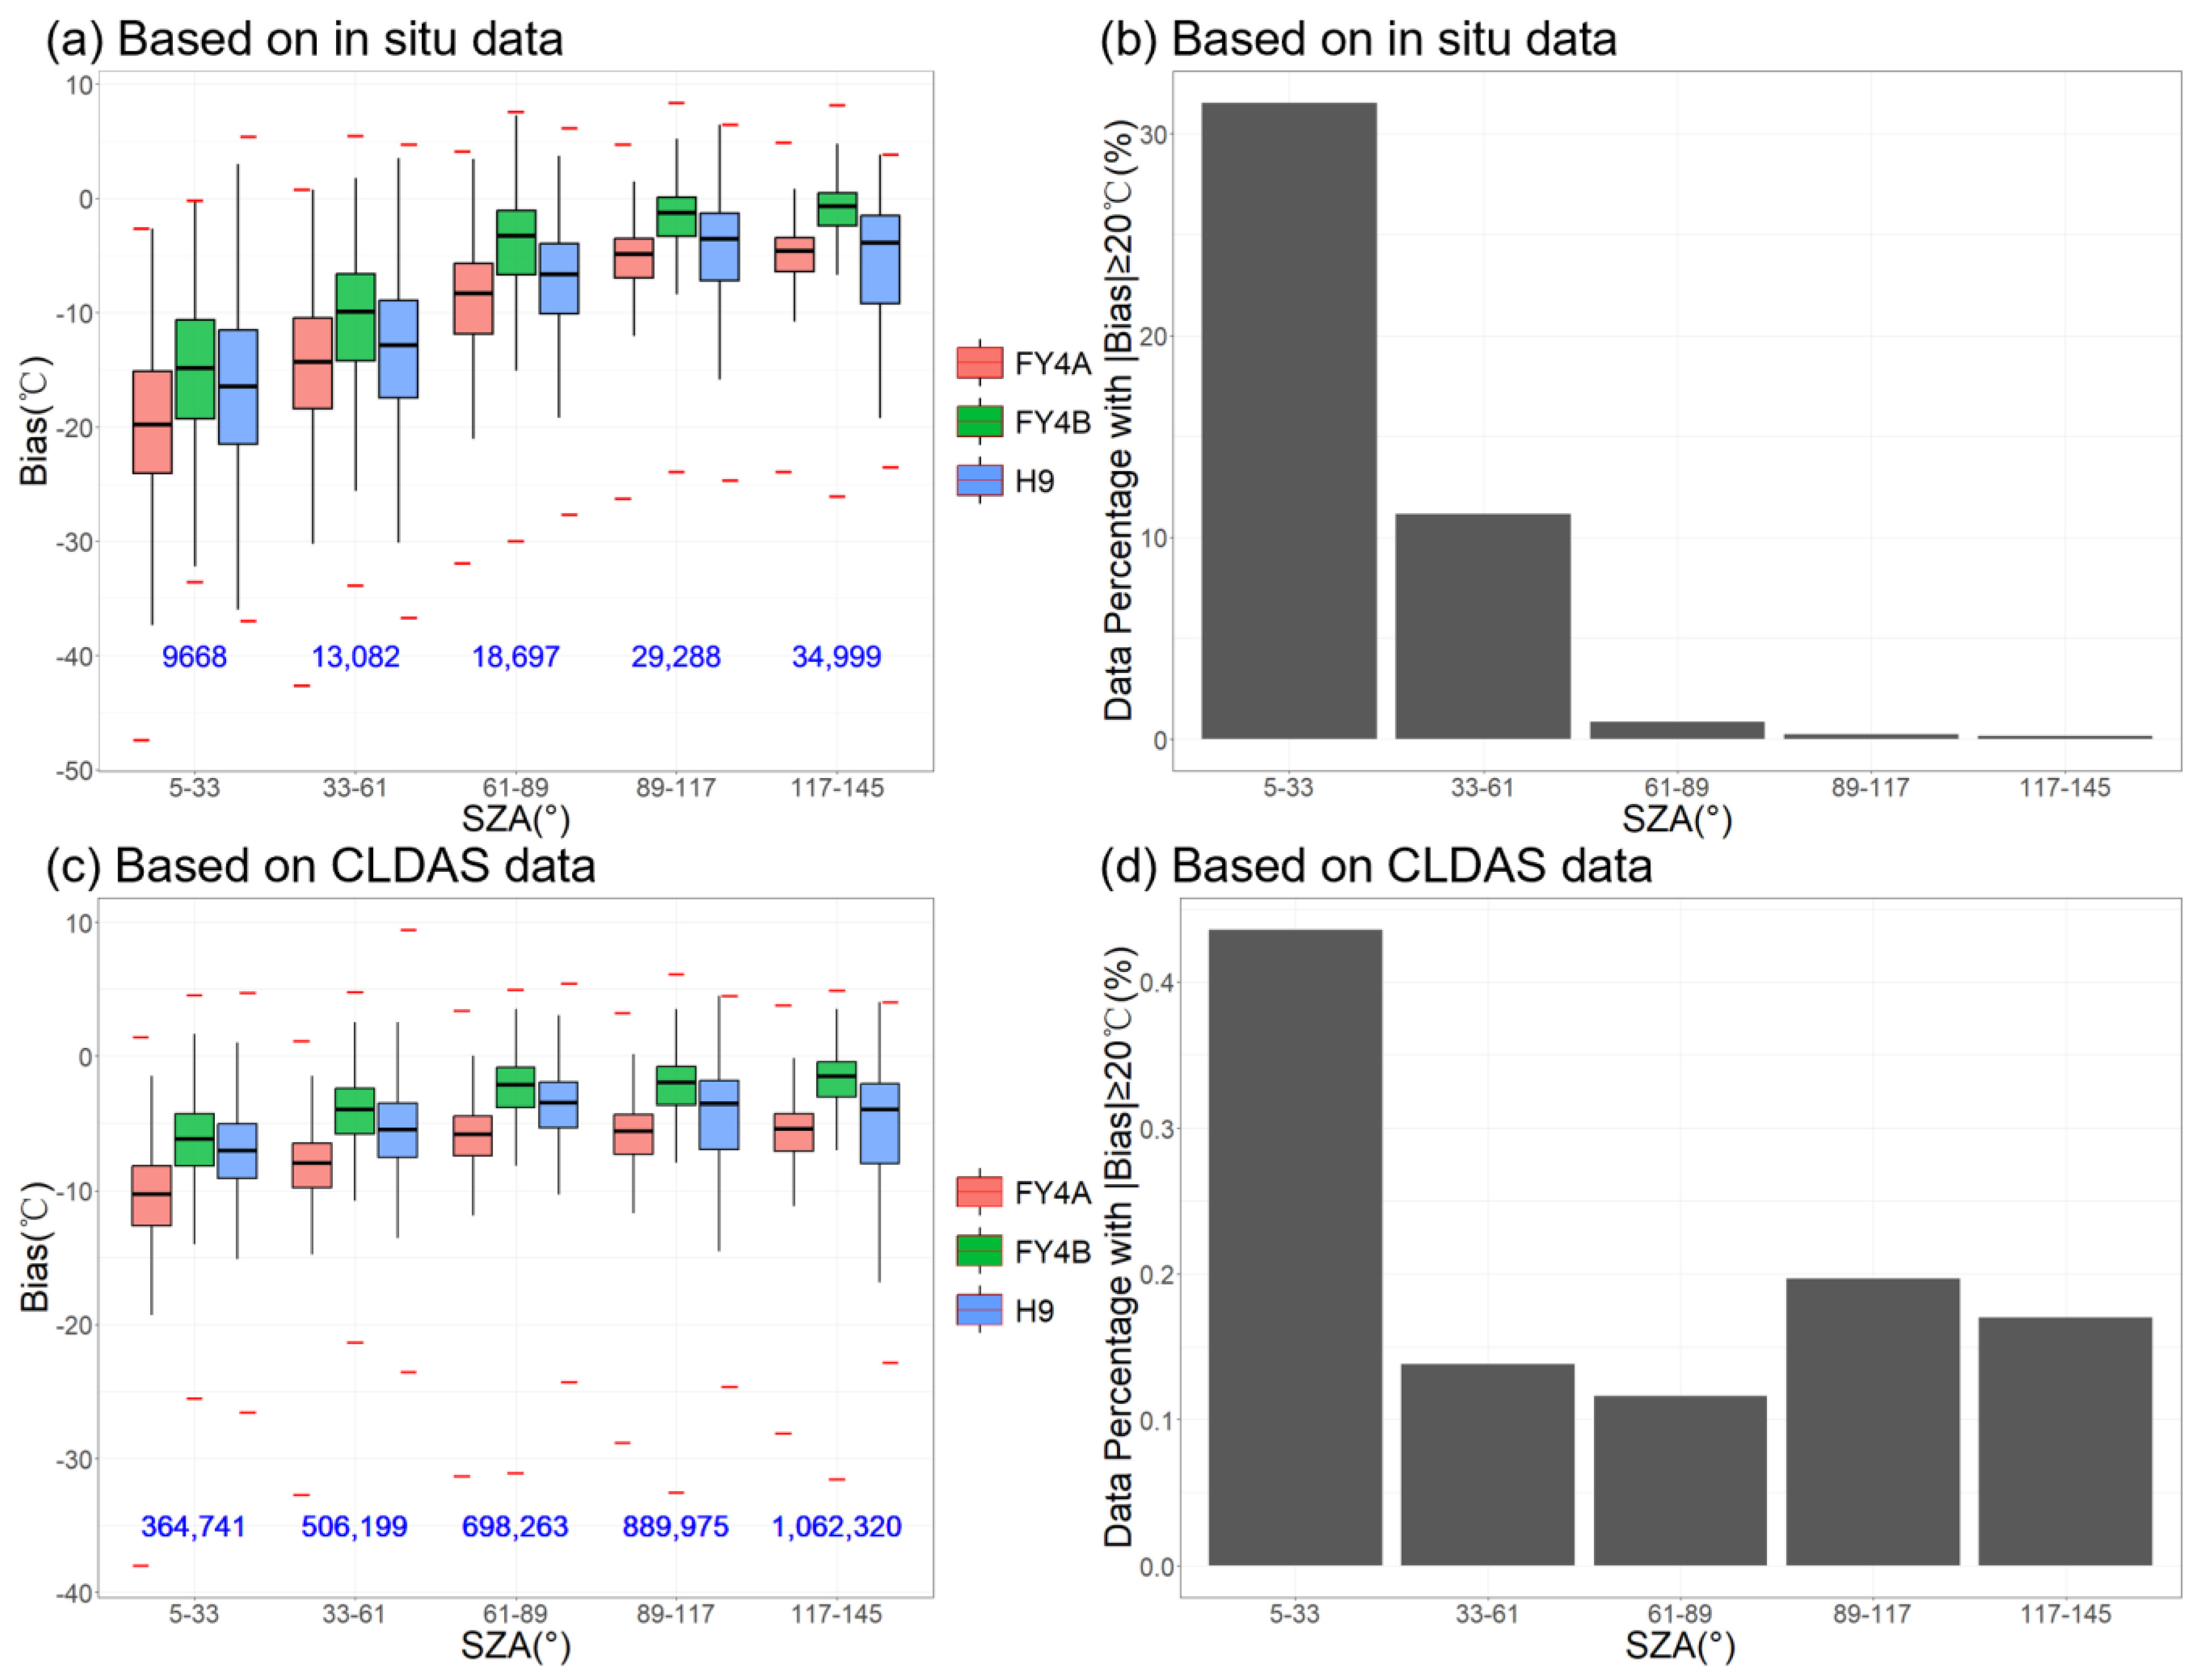
SZA influences shadows cast by surface cover, thereby affecting LST retrieval. Although not an explicit input in most TIR-based LST retrieval algorithms, SZA remains a crucial parameter for analysis. Analysis reveals consistent SZA impact mechanisms across both in situ- and reanalysis-based error parameters: daytime LST observation bias decreases systematically with increasing SZA, stabilizing during nocturnal periods (SZA > 89°), and the quantity of observational data positively correlates with SZA (Figure 5a,c). The higher data quantity of the reanalysis-based assessment allows for smoother transition patterns, with boxplot analysis (Figure 5c) confirming that bias levels for all three satellites stabilize beyond SZA > 61°, indicating minimal sensitivity to further SZA increases from late afternoon through nighttime.
Histogram analysis (Figure 5b,d) indicates that significant bias outliers are concentrated at low SZAs (SZA ≤ 33°). In situ-based analysis shows a systematic decline in the prevalence of high-bias outliers with increasing SZA, dropping to negligible levels (<1%) beyond 60°. While the CLDAS-based analysis reveals an overall low proportion of significant outliers, a slightly higher count is observed only within the SZA ≤ 33° interval, with similar outlier levels across other SZA ranges.
Figure 5a illustrates a progressive reduction in the interquartile range (IQR) of Bias for FY4 series satellites as SZA increases, indicating reduced variability in retrieval errors. This trend is consistent with the decreasing ubRMSE observed in in situ-based error parameters (Table 2). In contrast, for the H9 satellite, the IQR initially decreases and then increases with SZA, with the lowest ubRMSE observed within the 89–117° nocturnal range. Figure 5c corroborates the consistent IQR trend with Figure 5a across all satellites. However, ubRMSEs from CLDAS (Table 2) indicate that the minimum values occur for FY4B at SZAs of 33–61°, and for FY4A and H9 at SZAs of 61–89°, suggesting these intervals represent the lowest error variability for each satellite.
Synthesizing these results, a common trend emerges: during daytime conditions (SZA ≤ 89°), satellite LST retrieval performance improves with increasing SZA. For nighttime periods, the relationship between LST product accuracy and SZA varies by satellite and reference dataset, possibly due to the more complex factors influencing land surface emissivity at night. This complexity makes it challenging to establish a universal relationship between SZA and LST retrieval accuracy for nighttime conditions.
Previous studies have confirmed that the DA of brightness temperature due to nighttime angular variations is minimal, typically with differences less than 2 K [14], which is consistent with this study’s finding of reduced errors for SZA > 89°. The substantial increase in LST retrieval error during daytime (SZA ≤ 89°) aligns with earlier research [35], which attributes this to the variable shadowing effects of solar illumination over heterogeneous surfaces. At night or over homogeneous surfaces, this effect diminishes markedly [35]. Furthermore, nighttime LST retrievals, based solely on land surface-emitted radiation in the TIR bands, are independent of solar radiation, resulting in no SZA dependence when SZA > 89°.
From a physical perspective, larger SZA during the daytime increases the atmospheric path length, amplifying both scattering and absorption, and increasing the sensitivity to errors in precipitable water vapor parameterization. Additionally, larger SZAs produce longer shadows, further affecting surface reflectance characteristics. Theoretically, these factors should complicate LST retrieval and correction at larger daytime SZAs. However, both Yu Y et al. [3] and the present results indicate that the greatest differences in retrieved LST occur at minimal SZA (around solar noon), likely due to the critical influence of shadowing. Therefore, consideration of SZA in LST retrieval algorithms is particularly applicable during the daytime for larger SZAs and at night. In contrast, retrieval algorithms continue to struggle with adequately correcting for SZA effects under conditions of small SZA (near-nadir).
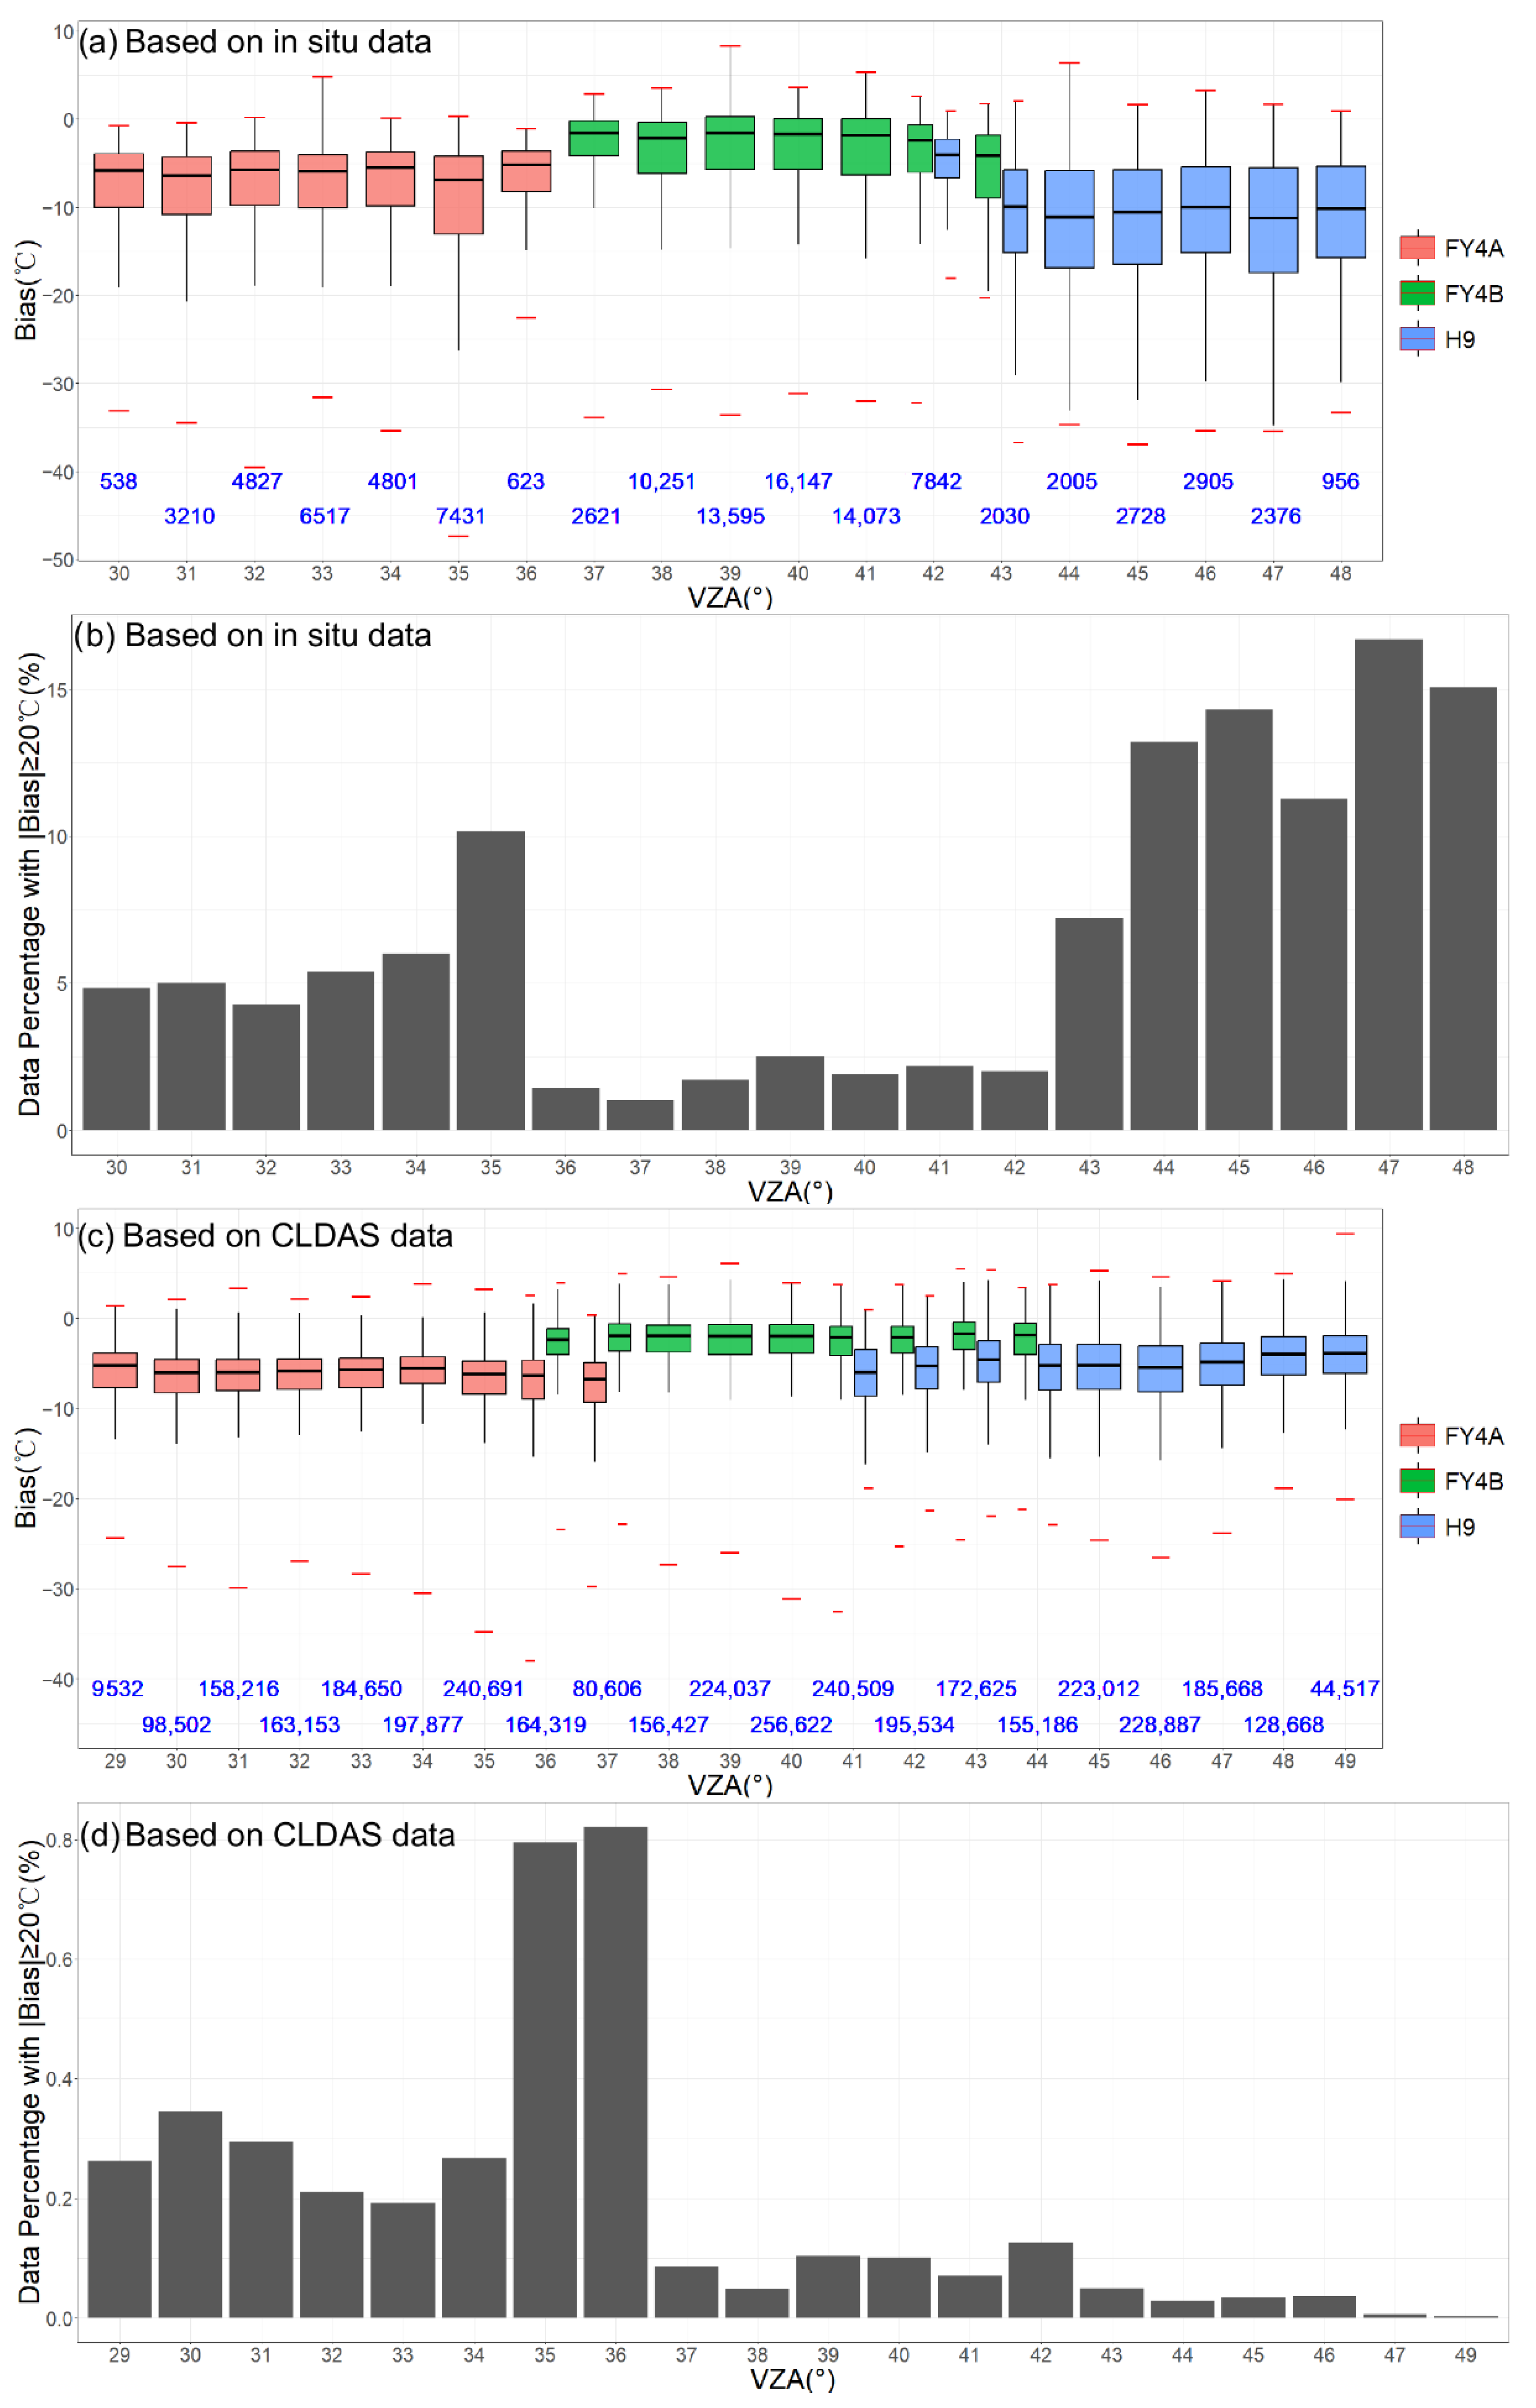
VZA affects the angle at which the satellite receives electromagnetic waves from the surface. Although the VZAs for geostationary LST are fixed, the three satellites in this study have comparable sensor characteristics but distinct geolocations, providing an opportunity to comprehensively assess the impact of VZA on LST retrieval accuracy. The three satellites, owing to their spatial positions, have distinct VZA ranges: FY4A covers the lowest range, H9 the highest, and FY4B an intermediate range, with FY4B achieving the smallest overall LST observation bias (Figure 6a,c). In situ-based analysis reveals irregular fluctuations in LST accuracy with varying VZA for each satellite. Conversely, CLDAS-based analysis indicates that LST accuracy remains nearly constant regardless of VZA.
Further examination of Figure 6b,d shows increased proportions of outliers at certain VZA values. For example, FY4A exhibits a notable rise in outliers at VZA 35°. Both in situ and CLDAS-based analyses find that FY4A’s LST outliers increase at higher VZAs, probably attributable to the inherently high errors in the FY4A product over the northeastern lake region of the study area (Figure 2). Across all satellites, in situ analysis demonstrates increased outlier occurrence and reduced precision stability at higher VZAs (Figure 6b, Table 3), with H9 generally exhibiting the highest outlier levels. However, CLDAS-based analysis finds lower outlier levels for H9 compared to other satellites. Table 3 further confirms that FY4 series satellites tend to have smaller ubRMSE at lower VZAs and larger ubRMSE at higher VZAs, indicating reduced precision stability at larger VZAs. This pattern observed for the FY4 series can rule out the influence of terrain on the error metrics and be attributed to VZA effects, as the differing geolocations of FY4A and FY4B result in their respective maximum VZAs corresponding to plain and mountainous terrains.
Previous studies have confirmed that the bias of satellite-derived LST is strongly correlated with VZA, increasing as the absolute value of VZA rises [19,21,26]. However, this discrepancy varies among cities and is generally influenced by underlying surface characteristics and latitude [36]. As this study only involves geostationary satellite data—where VZA at each grid point is fixed—it is not possible to generalize the impact of varying VZA for a single land cover type. Surface environmental conditions exert a strong influence on remote sensing accuracy, and, given the constraints of this study region and dataset, no universal rule can be established for VZA’s effect on geostationary satellite LST accuracy. Thus, only FY4A demonstrates decreased product accuracy at higher VZAs, while the accuracy of other geostationary satellites shows no direct correlation with VZA.
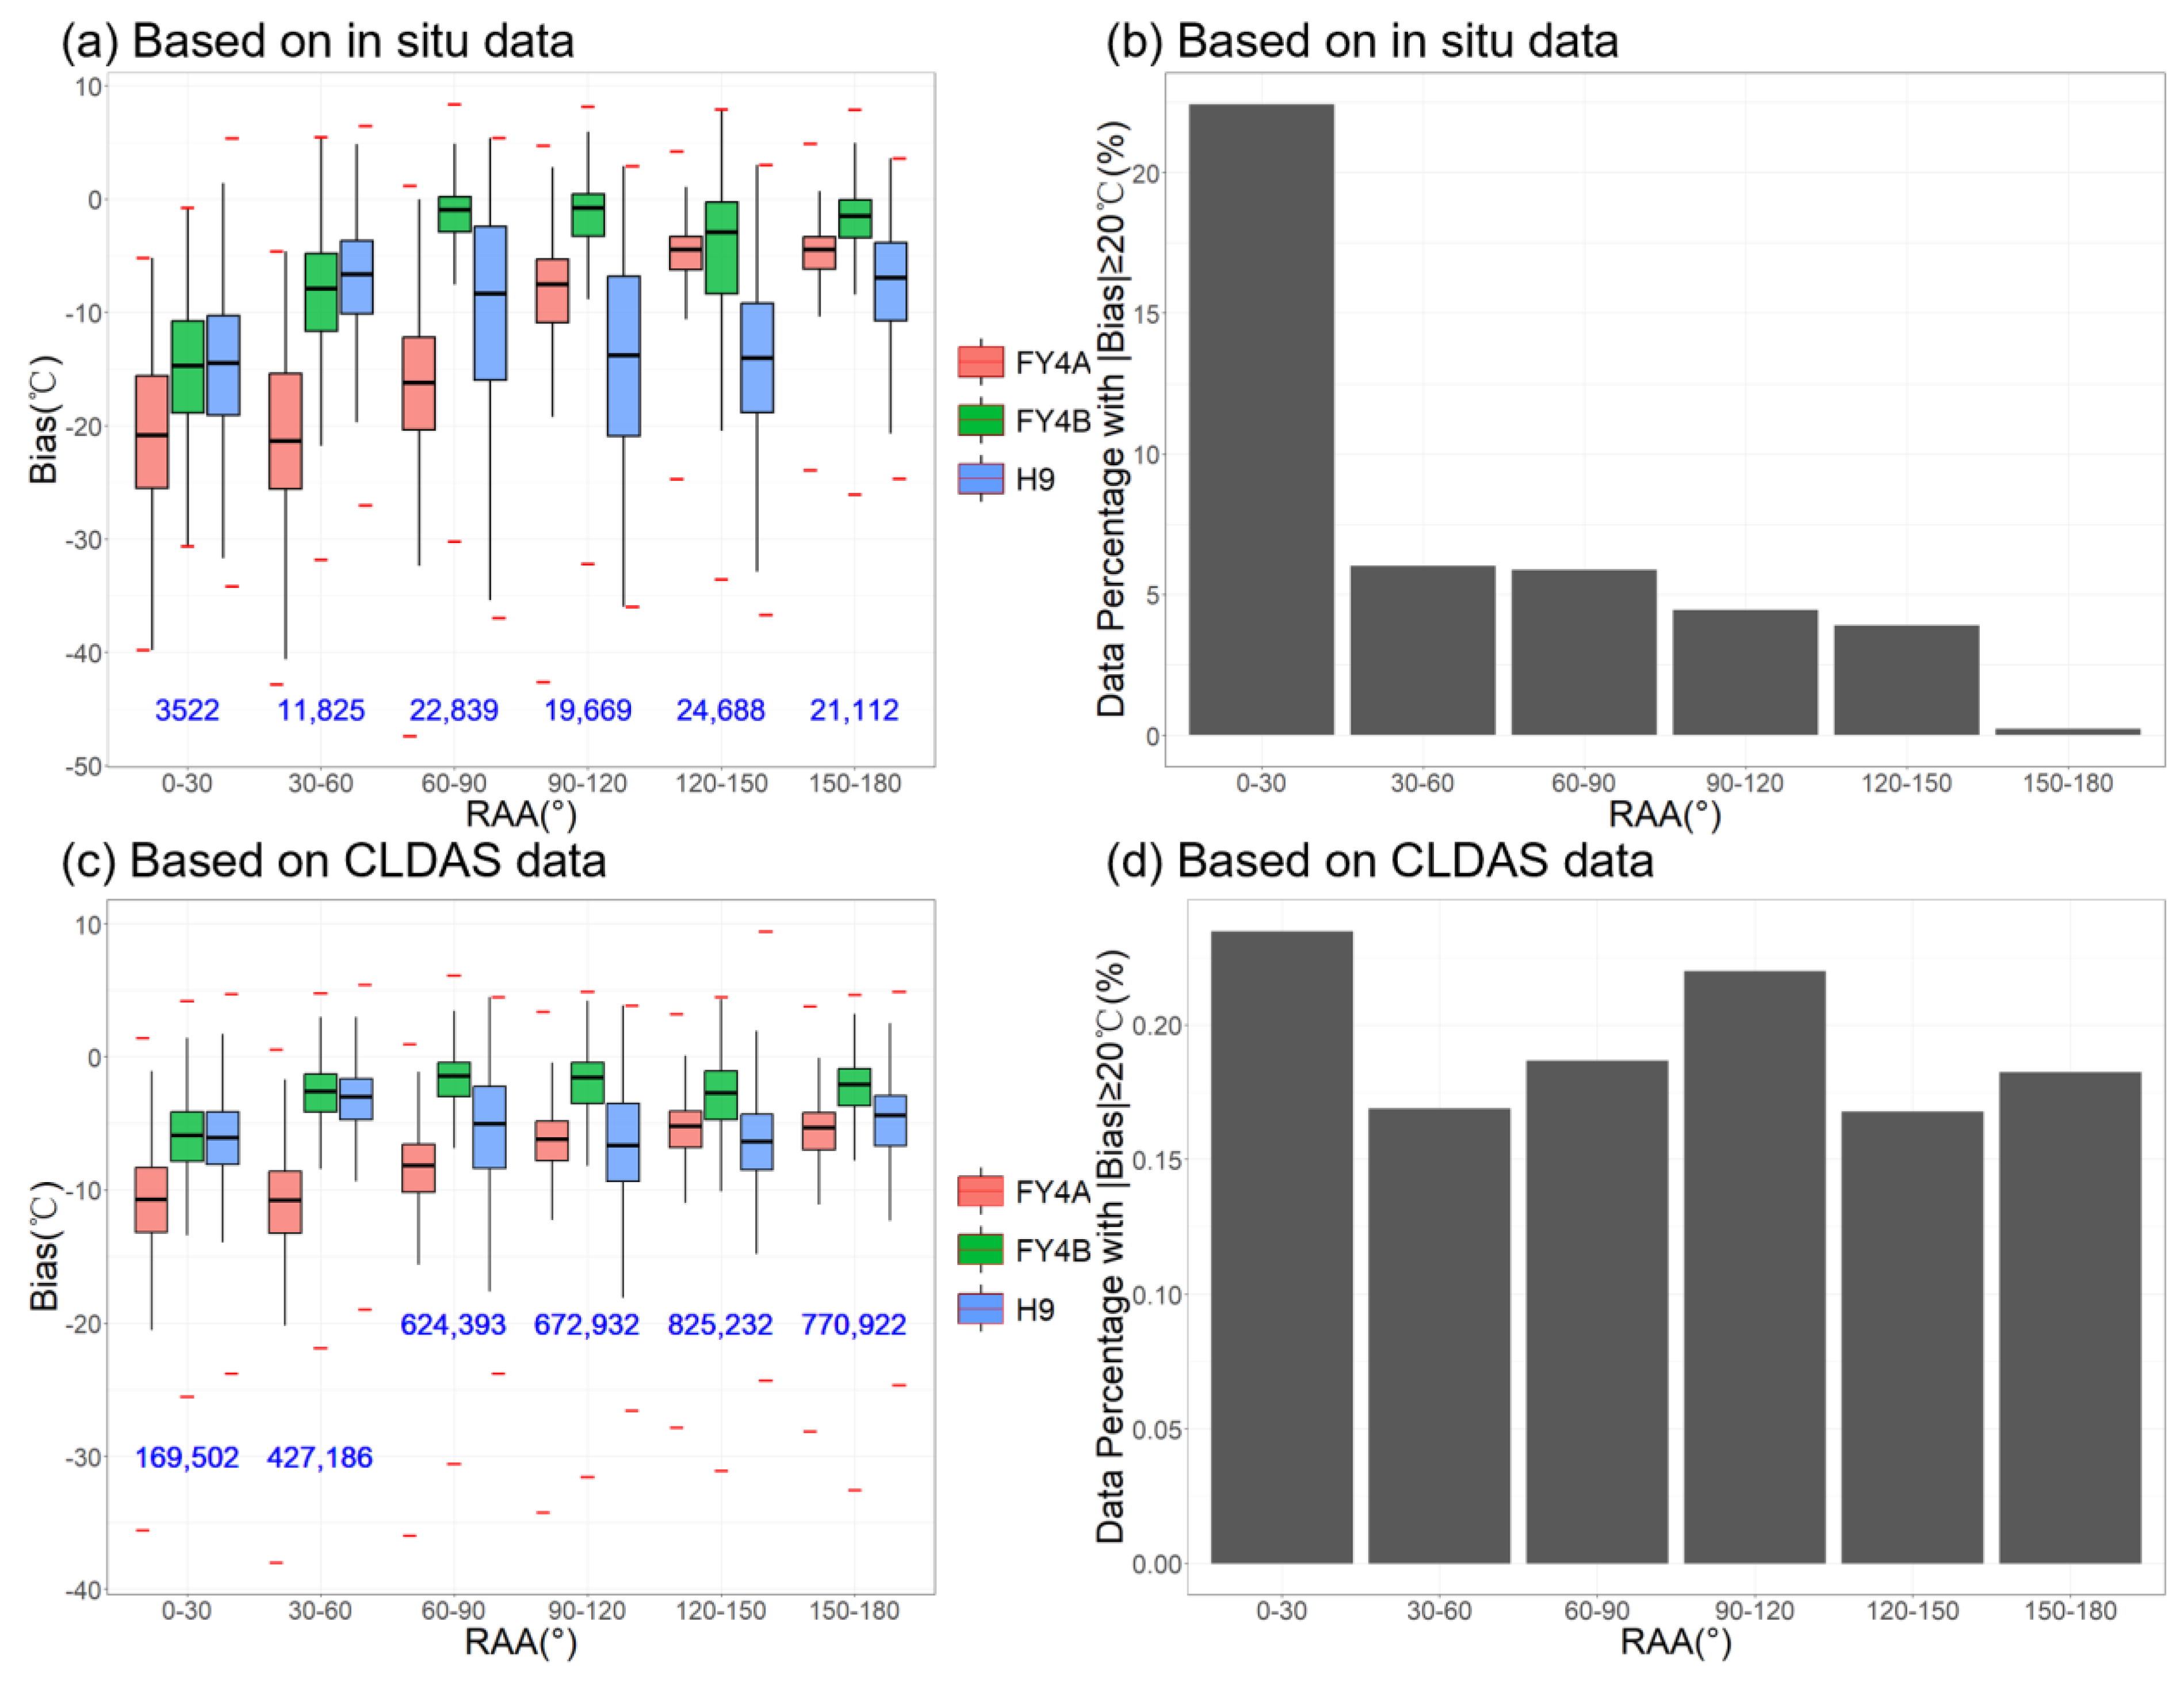
All satellites provide SAA and VAA parameters, but analysis of their individual impact on LST accuracy is not sufficiently intuitive. The effect of a single angle is minimal within a swath of satellite data like MODIS [26]. Therefore, RAA, which describes the relative orientation of the sun and satellite with respect to the surface target, is more meaningful for analysis. Results in Figure 7a,c show that, for the FY4 series satellites, LST observation bias generally decreases as RAA increases, with FY4B exhibiting the most pronounced effect. For FY4B, when RAA > 60°, the mean LST bias approaches zero. Thus, when the sun and satellite are on the same side of the observation point, LST detection bias is elevated, particularly for RAA ≤ 30°, where outlier occurrence is also highest (Figure 7b,d). Conversely, lower detection bias is observed when the sun and satellite are positioned nearly perpendicular or on opposite sides relative to the target. For H9, the observed bias displays a sinusoidal trend with RAA, with the minimum mean bias occurring in the 30–60° interval. In situ-based ubRMSE results confirm that error stability is optimal for all three satellites when RAA is 150–180° (Table 4). However, CLDAS-based results indicate that optimal error stability occurs for FY4A at 90–120°, and for FY4B and H9 at 30–60°.

3.3. Parametric Modeling of Angular Dependence in Satellite LST Products

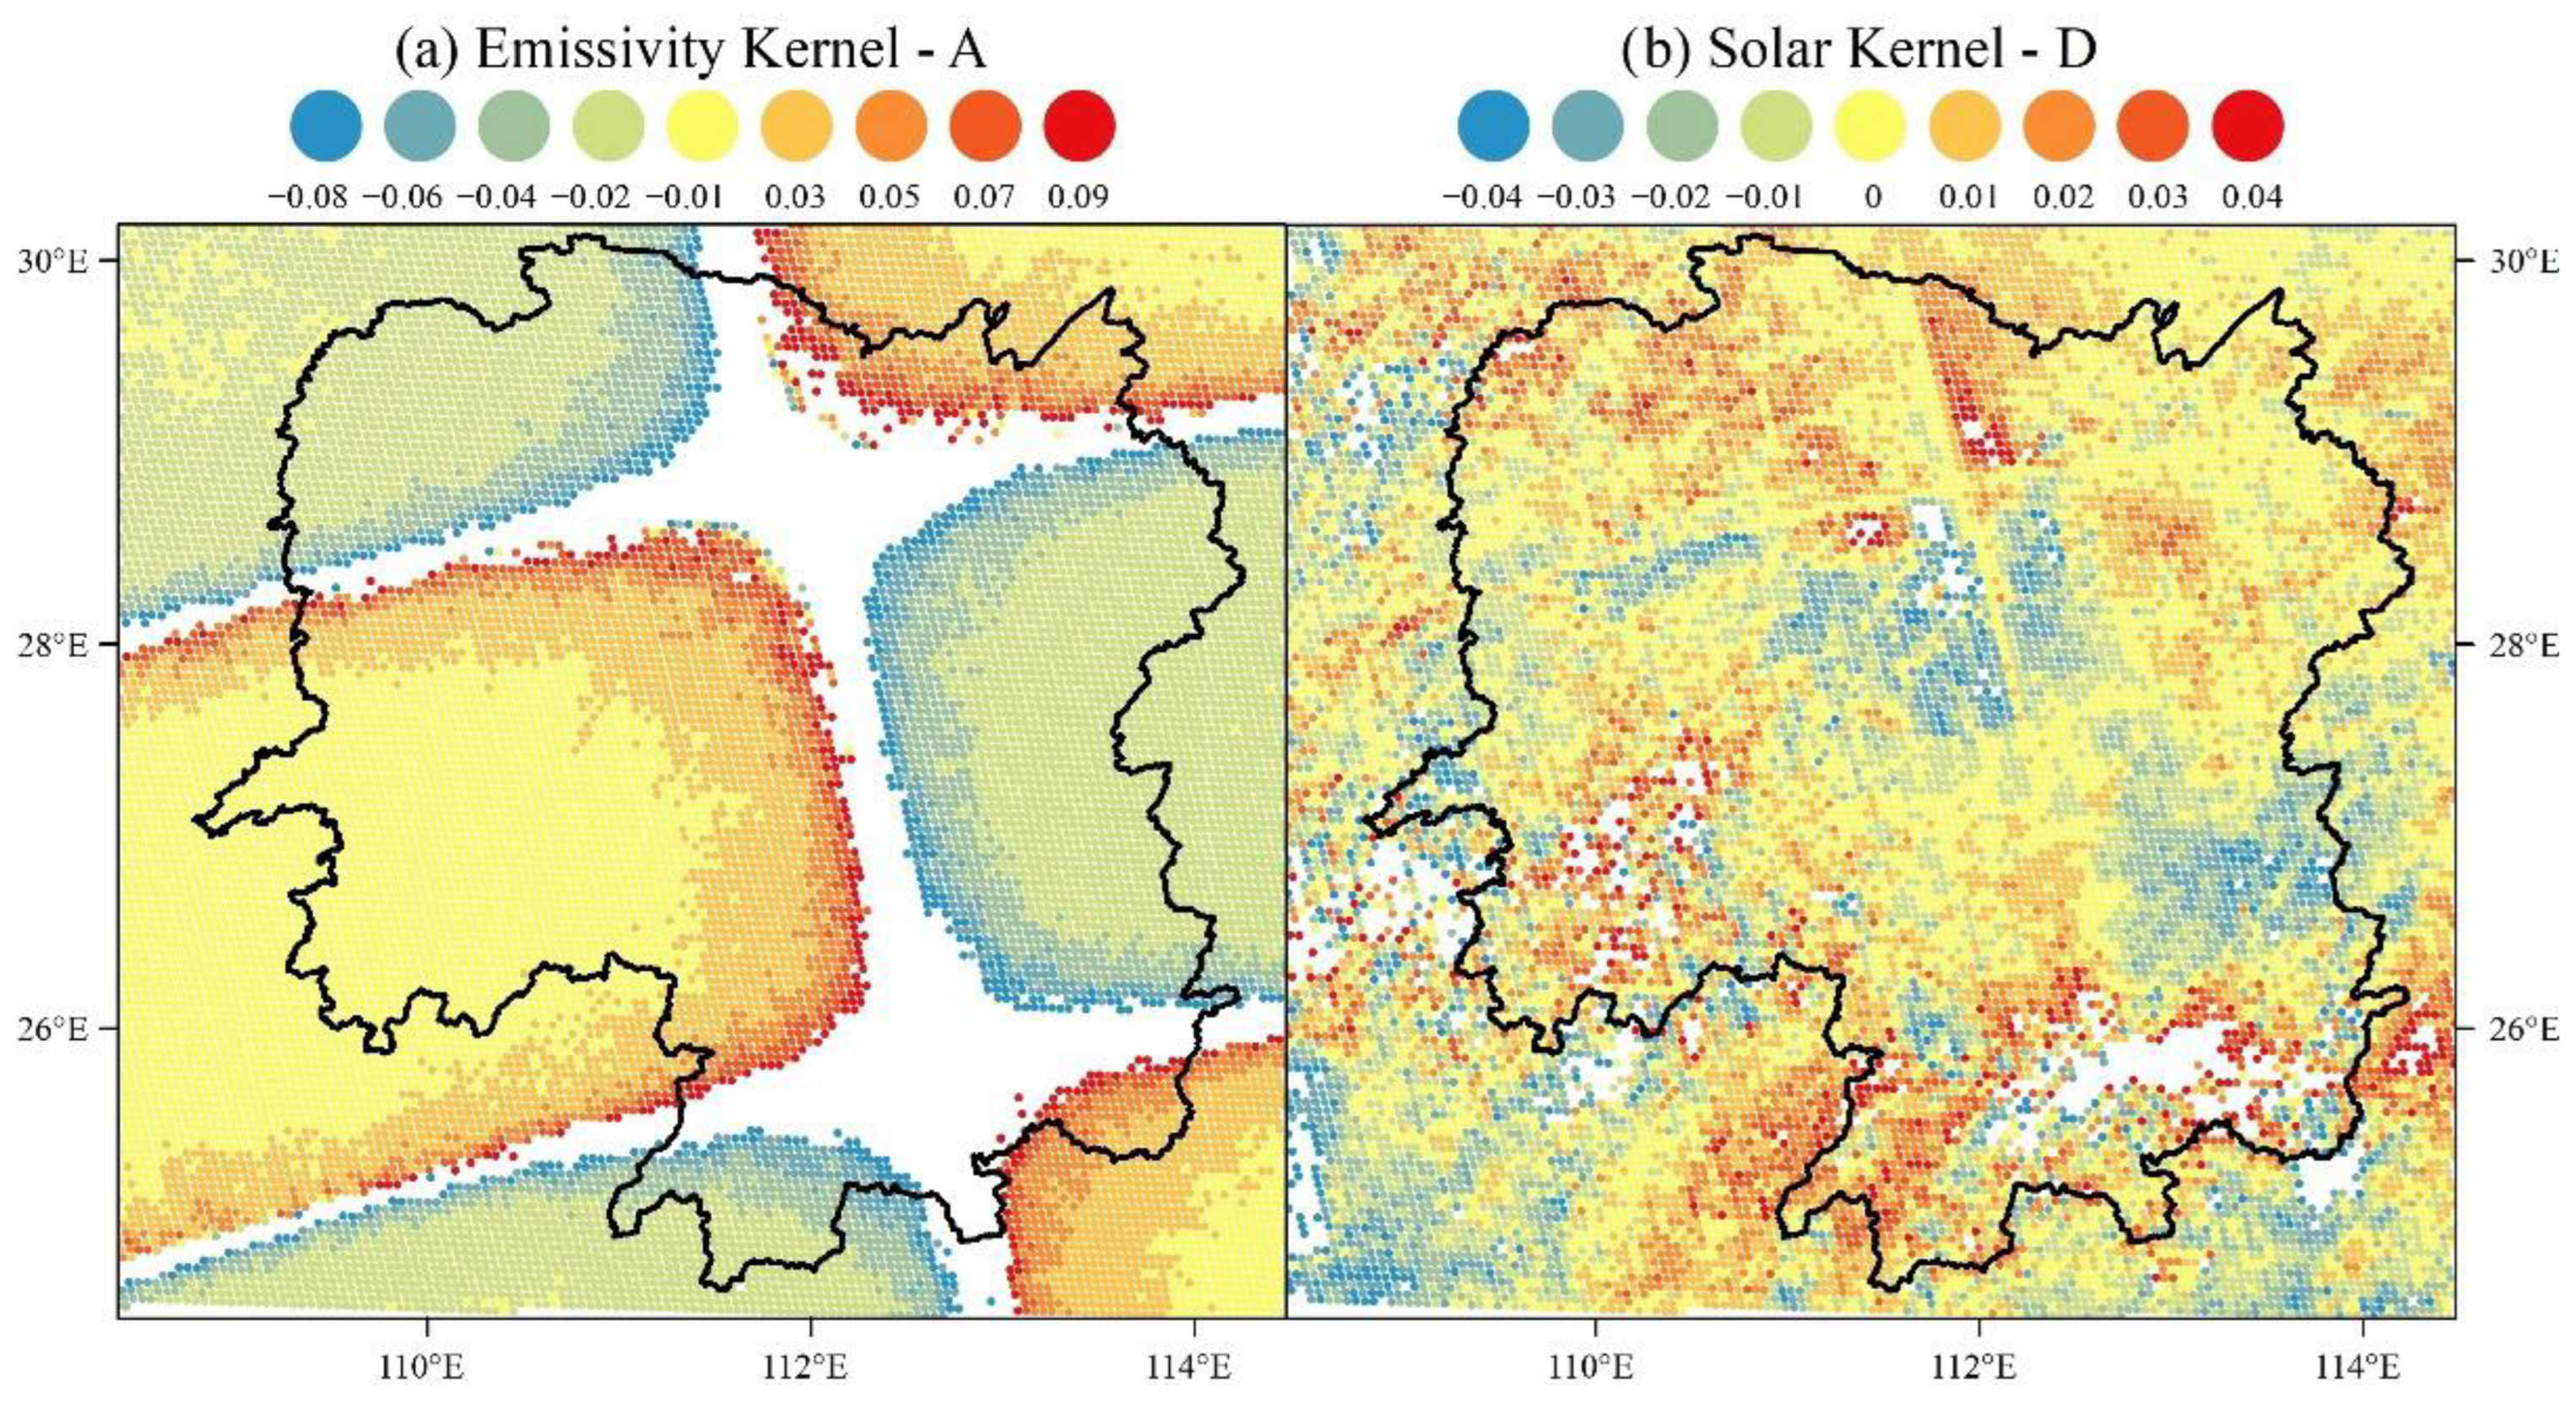
This section investigates LST DA within the study region based on the classical Vinnikov parametric model (Equation (7)), in which coefficients A and D are angular anisotropy parameters derived from dual-satellite retrievals, which characterize dependencies on land topography and land cover structure at the grid-cell level. Using only FY-4 constellation products eliminates inter-satellite algorithmic and instrumental discrepancies, allowing for a focused assessment. Physically, positive values of A and D indicate increased LST relative to nadir observations as the angle varies, whereas negative values indicate decreased LST. Values near zero denote minimal angular sensitivity. The emissivity kernel, which depends only on VZA, results in frequent outliers in coefficient A (seen as data voids filtered by MAD in Figure 8a). The other parameters exhibit systematic, band-like spatial patterns, likely associated with the scanning geometry of the geostationary AGRI sensor.
Spatially, A values indicate that emissivity-driven LST overestimation occurs in the southwestern highlands and parts of the northeast and southeast. In contrast, underestimation is observed in the central-eastern, northwestern, and parts of the southwestern regions, with the largest deviations concentrated in central Hunan. Near-neutral emissivity angular dependence (A ≈ 0) is observed in parts of the southwestern mountains, suggesting a balance between viewing geometry and surface properties influenced by local vegetation and topography. The solar kernel, which measures differential heating caused by shadowing and variations in sunlit areas, yields predominantly positive D values in mountainous regions (indicating systematic LST overestimation), negative values in plains (indicating underestimation), and more complex patterns over lakes (Figure 8b). Thus, solar-effects–driven LST overestimation mainly occurs in mountainous and lake areas, while underestimation is more common over plains. However, in some urbanized plain regions within the study area, shadowing or sunlit effects may also lead to local LST overestimation.
Joint analysis of coefficients A and D with DEM and NDVI data (Table 5 and Table 6) reveals systematic trends related to elevation and vegetation. The value of |A| decreases with increasing altitude or vegetation density, while |D| correspondingly increases. This pattern indicates that retrieval errors caused by emissivity anisotropy decrease in high-elevation or densely vegetated areas, while errors due to shadowing or sunlit effects become more pronounced. At lower elevations with bare soil, water, or sparse vegetation, emissivity-induced errors are the main source of error, with minimal influence from solar irradiance. By contrast, in high-altitude or densely vegetated terrains, the disparity between those two aspects narrows significantly. However, mountainous regions exhibit more complex processes, where LST retrievals are influenced not only by the sensor-sun relative positions but also by the relative orientation of slopes [8]. In this study, only a DEM-based categorical analysis was conducted to reveal the overall topographic influence on LST retrievals. Notably, in all cases, solar-induced retrieval errors are smaller than those caused by emissivity anisotropy, confirming that emissivity anisotropy is the main source of angular bias in satellite LST products.
Sign-specific analysis of coefficients A and D (Table 5 and Table 6) shows that negative values dominate across environmental gradients. For DEM intervals, the absolute values of negative A exceed those of positive A in half of the elevation strata, and negative A predominates in six out of seven NDVI bins. Negative D values consistently outnumber positive ones in all intervals. Aforementioned parameters indicate that DA primarily reduces retrieved LST relative to nadir observations. This trend is consistent with the systematic cold bias observed in all three satellite products (Table 1), which is mainly attributable to emissivity kernel effects (Figure 8, Table 5 and Table 6). When the solar kernel is inactive during nighttime retrievals, the magnitude of LST underestimation is reduced, as shown by the smaller bias amplitudes observed for nocturnal periods (SZA > 89°) in Figure 5.
The kernel model effectively captures vegetation and, most notably, orography patterns, which are known to exert the most significant effects on LST directionality [37]. Ermida S L et al. [38] found that when vegetation cover is extremely low or extremely high, the shadow effect is negligible, causing the solar kernel parameter D to approach zero. The maximum D value occurs at about 50% vegetation coverage, where the contrast between shadow and sunlit areas produces the strongest LST directional effects. Moreover, very dense forested areas may reduce angular dependence as tree crowns obscure shadows [8]. This matches the |D| trend observed in this study, where it initially increases with NDVI but decreases as NDVI reaches its peak range (Table 6). Yu Y et al. [3] also reported that pronounced soil moisture heterogeneity amplifies emissivity variability, as reflected in greater spatial variation in A and D coefficients, especially in the emissivity kernel. This is evident in Figure 8, which shows large parameter fluctuations in Dongting Lake’s hydrologically complex terrain.
Our spatial maps of coefficients A and D offer a spatially explicit quantification of LST DA, which may inform the development of correction factors for operational LST products in Hunan and similar environments. Several studies have demonstrated that calibrating LST products using Vinnikov model coefficients significantly improves LST accuracy (e.g., Ermida S L et al. [38] reported an RMSE reduction of 0.2–0.5 °C, Liu X et al. [26] confirmed an RMSE reduction of 0.89 K) and outperforms corrections based on the hotspot model [38]. Based on these findings, we recommend that future retrieval algorithms incorporate empirically derived angular adjustments. This approach is especially important in heterogeneous landscapes.

4. Conclusions

The growing availability of long-term remotely sensed datasets has significantly advanced Earth surface monitoring. However, effective harmonization of multi-source satellite products and improved retrieval algorithms require a better understanding of how angular factors affect product performance. While previous research on DA has primarily relied on simulated datasets or airborne observations, this study adopts an innovative approach by integrating in situ measurements, reanalysis data, and parametric modeling to analyze LST anisotropy over Hunan Province, China. This integrated methodology yields three principal findings:
(1)
Geostationary LST products exhibit a systematic cold bias, with FY4B showing the highest accuracy among the platforms (FY4A, FY4B, and H9) across all reference datasets. Retrieval precision is generally higher in southern Hunan than in the north, with the poorest performance in the Dongting Lake area. Terrain and vegetation substantially influence retrieval accuracy. Densely vegetated, high-altitude mountains display low systematic bias but high random error variability, whereas lower-elevation mountains have reduced levels of both error components. By contrast, sparsely vegetated lowlands typically exhibit high systematic bias and low error variability. Additionally, the degree of systematic underestimation in satellite LST products intensifies with increasing surface temperature. To enhance future LST retrievals in areas with high thermal heterogeneity, improvements in surface parameterization schemes are recommended.
(2)
Diurnal analysis shows that geostationary LST product performance improves with increasing SZA during the day, while nocturnal bias is largely unaffected by SZA. Inadequate angular compensation under near-zenith illumination (SZA ≤ 33°) increases the frequency of outliers. Increasing VZA reduces the stability of FY4A LST retrievals, although no consistent VZA-accuracy relationship is observed for other platforms. Retrieval bias of the FY4 series is elevated when both the sun and sensor are located within the same azimuthal plane relative to the target, with the highest probability of outlier observations occurring when RAA ≤ 30°. Conversely, errors in FY4 series products are minimized when the sun and satellite are positioned from nearly perpendicular to opposite sides relative to the target (RAA ≈ 90–180°). For the H9 satellite, overall bias exhibits a sinusoidal-like fluctuation with increasing RAA.
(3)
Analysis using the Vinnikov model demonstrates that anisotropy induced by the emissivity kernel correlates with sensor scanning geometry. This results in LST overestimation in the southwestern highlands and partial northeastern and southeastern areas, and underestimation in central-eastern, northwestern, and partial southwestern regions, with peak deviations concentrated in central Hunan. Near-neutral emissivity dependence (A ≈ 0) is observed in some southwestern mountains, indicating local equilibrium. Solar kernel coefficients (D) are positive in mountainous and urbanized plain regions, reflecting systematic LST overestimation, negative in most plains, indicating LST underestimation, and show complex patterns over lakes. Increases in elevation or vegetation density reduce emissivity-driven errors but amplify shadowing and sunlit effects. Notably, DA predominantly reduces LST relative to nadir observations, an effect primarily attributable to emissivity anisotropy. This finding confirms the predominant role of the emissivity kernel at the regional scale. These results validate the effectiveness of model coefficients in quantifying anisotropy and underscore the importance of incorporating parametric angular adjustment terms into future LST retrieval algorithms for heterogeneous landscapes.
This comprehensive investigation leverages geostationary LST products from three leading East Asian meteorological satellites, together with benchmark datasets, to clarify the mechanisms and environmental modulation of remote sensing LST DA. These findings provide a theoretical foundation for optimizing LST retrieval algorithms and enhancing operational applications. Although the present analysis is focused on Hunan Province, China, the identified patterns—namely, the variation in geostationary satellite LST product accuracy with surface environmental conditions and viewing and illumination geometries, as well as the influence of surface environment on LST DA—are expected to be generalizable to other thermally complex regions in global mid- to low-latitude areas.
Despite these advances, the effects of vegetation canopy architecture—particularly shadowing and sunlit influences on DA—and land cover-specific anisotropy signatures remain insufficiently explored in this study. Moreover, the analysis of angular parameter impacts does not entirely exclude systematic bias introduced by differences in retrieval algorithms. These aspects warrant further investigation.

Author Contributions

J.F.: Writing—review & editing, Writing—original draft, Visualization, Validation, Software, Resources, Methodology, Investigation, Formal analysis, Data curation, Conceptualization. Q.H.: Writing—review & editing, Supervision, Project administration, Methodology, Investigation, Funding acquisition, Data curation, Conceptualization. B.S.: Writing—review & editing, Project administration, Methodology, Funding acquisition. L.C.: Methodology, Visualization, Conceptualization. L.Y.: Writing—review & editing, Methodology. G.L.: Writing—review & editing, Resources. B.Z.: Writing—review & editing, Resources. E.L.: Writing—review & editing, Data curation. All authors have read and agreed to the published version of the manuscript.

Funding

This work was supported by the Natural Science Foundation of Hunan Province under grant number 2025JJ80279, the National Natural Science Foundation of China under grant number U2242201, and the Natural Science Foundation of Hunan Province under grant number 2021JC0009.

Data Availability Statement

The raw data supporting the conclusions of this article will be made available by the authors on request.

Acknowledgments

We thank the Hunan Meteorological Big Data Center for providing in situ observation data.

Conflicts of Interest

The authors declare that they have no known competing financial interest or personal relationships that could have appeared to influence the work reported in this paper.

References

  1. Anderson, M.C.; Norman, J.M.; Kustas, W.P.; Houborg, R.; Starks, P.J.; Agam, N. A thermal-based remote sensing technique for routine mapping of land-surface carbon, water and energy fluxes from field to regional scales. Remote Sens. Environ. 2008, 112, 4227–4241. [Google Scholar] [CrossRef] [Scilit]
  2. Cao, B.; Liu, Q.; Du, Y.; Roujean, J.-L.; Gastellu-Etchegorry, J.-P.; Trigo, I.F.; Zhan, W.; Yu, Y.; Cheng, J.; Jacob, F.; et al. A review of earth surface thermal radiation directionality observing and modeling: Historical development, current status and perspectives. Remote Sens. Environ. 2019, 232, 111304. [Google Scholar] [CrossRef] [Scilit]
  3. Yu, Y.; Renzullo, L.J.; McVicar, T.R.; Van Niel, T.G.; Cai, D.; Tian, S.; Ma, Y. Solar zenith angle-based calibration of Himawari-8 land surface temperature for correcting diurnal retrieval error characteristics. Remote Sens. Environ. 2024, 308, 114176. [Google Scholar] [CrossRef] [Scilit]
  4. Yu, Y.; Tarpley, D.; Privette, J.L.; Goldberg, M.D.; Raja, M.K.R.V.; Vinnikov, K.Y.; Xu, H. Developing Algorithm for Operational GOES-R Land Surface Temperature Product. IEEE Trans. Geosci. Remote Sens. 2009, 47, 936–951. [Google Scholar] [CrossRef] [Scilit]
  5. Li, Z.-L.; Tang, B.-H.; Wu, H.; Ren, H.; Yan, G.; Wan, Z.; Trigo, I.F.; Sobrino, J.A. Satellite-derived land surface temperature: Current status and perspectives. Remote Sens. Environ. 2013, 131, 14–37. [Google Scholar] [CrossRef] [Scilit]
  6. Norman, J.M.; Becker, F. Terminology in thermal infrared remote sensing of natural surfaces. Agric. For. Meteorol. 1995, 77, 153–166. [Google Scholar] [CrossRef] [Scilit]
  7. Peng, S.; Tang, B.; Li, Z.; Wu, H.; Tang, R. Study of the Relationship Between Thermal Infrared Directional and Hemispherical Radiative Temperatures. J. Geo-Inf. Sci. 2016, 18, 106–116. [Google Scholar]
  8. Ermida, S.L.; DaCamara, C.C.; Trigo, I.F.; Pires, A.C.; Ghent, D.; Remedios, J. Modelling directional effects on remotely sensed land surface temperature. Remote Sens. Environ. 2017, 190, 56–69. [Google Scholar] [CrossRef] [Scilit]
  9. Duffour, C.; Lagouarde, J.P.; Olioso, A.; Demarty, J.; Roujean, J.L. Driving factors of the directional variability of thermal infrared signal in temperate regions. Remote Sens. Environ. 2016, 177, 248–264. [Google Scholar] [CrossRef] [Scilit]
  10. Lagouarde, J.P.; Moreau, P.; Irvine, M.; Bonnefond, J.M.; Voogt, J.A.; Solliec, F. Airborne experimental measurements of the angular variations in surface temperature over urban areas: Case study of Marseille (France). Remote Sens. Environ. 2004, 93, 443–462. [Google Scholar] [CrossRef] [Scilit]
  11. Kimes, D.S.; Kirchner, J.A. Directional radiometric measurements of row-crop temperatures. Int. J. Remote Sens. 1983, 4, 299–311. [Google Scholar] [CrossRef] [Scilit]
  12. Balick, L.K.; Hutchinson, B.A. Directional Thermal Infrared Exitance Distributions from a Leafless Deciduous Forest. IEEE Trans. Geosci. Remote Sens. 1986, GE-24, 693–698. [Google Scholar] [CrossRef]
  13. Coll, C.; Galve, J.M.; Niclòs, R.; Valor, E.; Barberà, M.J. Angular variations of brightness surface temperatures derived from dual-view measurements of the Advanced Along-Track Scanning Radiometer using a new single band atmospheric correction method. Remote Sens. Environ. 2019, 223, 274–290. [Google Scholar] [CrossRef] [Scilit]
  14. Lagouarde, J.P.; Irvine, M. Directional anisotropy in thermal infrared measurements over Toulouse city centre during the CAPITOUL measurement campaigns: First results. Meteorol. Atmos. Phys. 2008, 102, 173–185. [Google Scholar] [CrossRef] [Scilit]
  15. Michel, J.; Hagolle, O.; Hook, S.J.; Roujean, J.-L.; Gamet, P. Quantifying Thermal Infra-Red directional anisotropy using Master and Landsat-8 simultaneous acquisitions. Remote Sens. Environ. 2023, 297, 113765. [Google Scholar] [CrossRef] [Scilit]
  16. Hu, L.; Monaghan, A.; Voogt, J.A.; Barlage, M. A first satellite-based observational assessment of urban thermal anisotropy. Remote Sens. Environ. 2016, 181, 111–121. [Google Scholar] [CrossRef] [Scilit]
  17. Lagouarde, J.P.; Dayau, S.; Moreau, P.; Guyon, D. Directional Anisotropy of Brightness Surface Temperature Over Vineyards: Case Study Over the Medoc Region (SW France). IEEE Geosci. Remote Sens. Lett. 2014, 11, 574–578. [Google Scholar] [CrossRef] [Scilit]
  18. Li, Z.; Duan, S.; Tang, B.; Wu, H.; Ren, H.; Yan, G.; Tang, R.; Leng, P. Review of methods for land surface temperature derived from thermal infrared remotely sensed data. J. Remote Sens. 2016, 20, 899–920. [Google Scholar] [CrossRef] [Scilit]
  19. Ermida, S.L.; Hulley, G.; Trigo, I.F. Introducing emissivity directionality to the temperature-emissivity separation algorithm. Remote Sens. Environ. 2024, 311, 114280. [Google Scholar] [CrossRef] [Scilit]
  20. Du, H.; Zhan, W.; Liu, Z.; Scott Krayenhoff, E.; Chakraborty, T.C.; Zhao, L.; Jiang, L.; Dong, P.; Li, L.; Huang, F.; et al. Global mapping of urban thermal anisotropy reveals substantial potential biases for remotely sensed urban climates. Sci. Bull. 2023, 68, 1809–1818. [Google Scholar] [CrossRef] [Scilit]
  21. Wang, D.; Chen, Y.; Hu, L.; Voogt, J.A. Urban Thermal Anisotropy: A Comparison Among Observational and Modeling Approaches at Different Time Scales. IEEE Trans. Geosci. Remote Sens. 2022, 60, 5002215. [Google Scholar] [CrossRef] [Scilit]
  22. Guillevic, P.C.; Bork-Unkelbach, A.; Göttsche, F.M.; Hulley, G.; Gastellu-Etchegorry, J.P.; Olesen, F.S.; Privette, J.L. Directional Viewing Effects on Satellite Land Surface Temperature Products Over Sparse Vegetation Canopies—A Multisensor Analysis. IEEE Geosci. Remote Sens. Lett. 2013, 10, 1464–1468. [Google Scholar] [CrossRef] [Scilit]
  23. Verhoef, W.; Jia, L.; Xiao, Q.; Su, Z. Unified Optical-Thermal Four-Stream Radiative Transfer Theory for Homogeneous Vegetation Canopies. IEEE Trans. Geosci. Remote Sens. 2007, 45, 1808–1822. [Google Scholar] [CrossRef] [Scilit]
  24. van der Tol, C.; Verhoef, W.; Timmermans, J.; Verhoef, A.; Su, Z. An integrated model of soil-canopy spectral radiances, photosynthesis, fluorescence, temperature and energy balance. Biogeosciences 2009, 6, 3109–3129. [Google Scholar] [CrossRef] [Scilit]
  25. Duffour, C.; Lagouarde, J.P.; Roujean, J.L. A two parameter model to simulate thermal infrared directional effects for remote sensing applications. Remote Sens. Environ. 2016, 186, 250–261. [Google Scholar] [CrossRef] [Scilit]
  26. Liu, X.; Tang, B.; Li, Z. Evaluation of Three Parametric Models for Estimating Directional Thermal Radiation from Simulation, Airborne, and Satellite Data. Remote Sens. 2018, 10, 420. [Google Scholar] [CrossRef] [Scilit]
  27. Peng, J.; Liu, Q.; Liu, Q.; Li, J.; Ma, H.; Fang, L. Kernel-driven model fitting of multi-angle thermal infrared brightness temperature and its application. J. Infrared Millim. Waves 2011, 30, 361–365. [Google Scholar] [CrossRef] [Scilit]
  28. Vinnikov, K.Y.; Yu, Y.; Goldberg, M.D.; Tarpley, D.; Romanov, P.; Laszlo, I.; Chen, M. Angular anisotropy of satellite observations of land surface temperature. Geophys. Res. Lett. 2012, 39, L23802. [Google Scholar] [CrossRef] [Scilit]
  29. Jia, A.; Liang, S.; Wang, D.; Ma, L.; Wang, Z.; Xu, S. Global hourly, 5 km, all-sky land surface temperature data from 2011 to 2021 based on integrating geostationary and polar-orbiting satellite data. Earth Syst. Sci. Data 2023, 15, 869–895. [Google Scholar] [CrossRef] [Scilit]
  30. Yang, J.; Zhang, Z.; Wei, C.; Lu, F.; Guo, Q. Introducing the New Generation of Chinese Geostationary Weather Satellites, Fengyun-4. Bull. Am. Meteorol. Soc. 2017, 98, 1637–1658. [Google Scholar] [CrossRef] [Scilit]
  31. Dong, L.; Tang, S.; Wang, F.; Cosh, M.; Li, X.; Min, M. Inversion and Validation of FY-4A Official Land Surface Temperature Product. Remote Sens. 2023, 15, 2437. [Google Scholar] [CrossRef] [Scilit]
  32. Zhengming, W.; Dozier, J. A generalized split-window algorithm for retrieving land-surface temperature from space. IEEE Trans. Geosci. Remote Sens. 1996, 34, 892–905. [Google Scholar] [CrossRef] [Scilit]
  33. Shi, C.; Xie, Z.; Qian, H.; Liang, M.; Yang, X. China land soil moisture EnKF data assimilation based on satellite remote sensing data. Sci. China Earth Sci. 2011, 54, 1430–1440. [Google Scholar] [CrossRef] [Scilit]
  34. Fan, J.; Han, Q.; Wang, S.; Liu, H.; Chen, L.; Tan, S.; Song, H.; Li, W. Evaluation of Fengyun-4A Detection Accuracy: A Case Study of the Land Surface Temperature Product for Hunan Province, Central China. Atmosphere 2022, 13, 1953. [Google Scholar] [CrossRef] [Scilit]
  35. Trigo, I.F.; Ermida, S.L.; Martins, J.P.A.; Gouveia, C.M.; Göttsche, F.M.; Freitas, S.C. Validation and consistency assessment of land surface temperature from geostationary and polar orbit platforms: SEVIRI/MSG and AVHRR/Metop. ISPRS J. Photogramm. Remote Sens. 2021, 175, 282–297. [Google Scholar] [CrossRef] [Scilit]
  36. Wang, D.; Chen, Y.; Hu, L.; Voogt, J.A.; He, X. Satellite-based daytime urban thermal anisotropy: A comparison of 25 global cities. Remote Sens. Environ. 2022, 283, 113312. [Google Scholar] [CrossRef] [Scilit]
  37. Trigo, I.F.; Monteiro, I.T.; Olesen, F.; Kabsch, E. An assessment of remotely sensed land surface temperature. J. Geophys. Res. Atmos. 2008, 113. [Google Scholar] [CrossRef] [Scilit]
  38. Ermida, S.L.; Trigo, I.F.; DaCamara, C.C.; Roujean, J.L. Assessing the potential of parametric models to correct directional effects on local to global remotely sensed LST. Remote Sens. Environ. 2018, 209, 410–422. [Google Scholar] [CrossRef] [Scilit]
Figure 1. Distribution of topography, water bodies, and in situ measured LST observation stations in Hunan Province, China.
Remotesensing 18 00284 g001
Figure 2. Grid maps of error parameters (bias and unbiased RMSE) for three satellite-derived LST products based on in situ measurements (af) and CLDAS data (gl).
Remotesensing 18 00284 g002
Figure 3. Grid map of NDVI across Hunan Province in July 2023, classified using the Jenks natural breaks method.
Remotesensing 18 00284 g003
Figure 4. Scatter density plots of three satellite-derived LST products based on in situ measurements (ac) and CLDAS data (df), the dashed line indicates the 1:1 line.
Remotesensing 18 00284 g004
Figure 5. LST bias of three products under different SZA intervals, based on in situ measurements (a,b) and CLDAS data (c,d). Boxplots indicate bias distributions, with the central line indicating the median; the upper and lower boundaries of the box representing the 25th and 75th percentiles; red lines marking the overall minimum and maximum; and blue numbers denote sample size for each interval.
Remotesensing 18 00284 g005
Figure 6. LST bias of three products under different VZAs, based on in situ measurements (a,b) and CLDAS data (c,d). Boxplot elements and color coding are consistent with those described in Figure 5.
Remotesensing 18 00284 g006
Figure 7. LST bias of three products under different RAA intervals, based on in situ measurements (a,b) and CLDAS data (c,d). Boxplot elements and color coding are consistent with those described in Figure 5.
Remotesensing 18 00284 g007
Figure 8. Gridded spatial distributions of coefficients A and D derived from the Vinnikov model over the study area.
Remotesensing 18 00284 g008
Table 1. Comparative analysis metrics for three satellite LST products based on in situ and CLDAS datasets.
In Situ DataCLDAS Data
FY4AFY4BH9FY4AFY4BH9
Data Quantity27,93867,70612,6171,193,1231,259,3651,121,560
Bias−8.210−3.821−11.093−6.681−2.779−5.387
Biasr−0.237−0.101−0.254−0.229−0.095−0.168
R0.7200.7270.7830.7550.7600.821
RMSE10.2326.74813.3077.4214.1586.408
ubRMSE6.1055.5637.3493.2313.0933.470
Table 2. ubRMSE of satellite-derived LST of three products based on in situ measurements and CLDAS datasets under different SZA ranges.
In Situ DataCLDAS Data
FY4AFY4BH9FY4AFY4BH9
SZA 5–33°6.385.956.873.793.033.07
SZA 33–61°5.445.416.172.922.613.00
SZA 61–89°4.504.394.672.772.742.71
SZA 89–117°3.283.454.403.043.143.94
SZA 117–145°3.083.255.022.972.984.17
Table 3. ubRMSE of satellite-derived LST of three products based on in situ measurements and CLDAS datasets under different VZAs.
In Situ DataCLDAS DATA
FY4AFY4BH9FY4AFY4BH9
VZA-30°5.67VZA-37°4.30VZA-42°3.15VZA-29°3.37VZA-36°2.99VZA-41°3.47
VZA-31°5.55VZA-38°5.30VZA-43°7.20VZA-30°3.31VZA-37°3.06VZA-42°3.29
VZA-32°5.49VZA-39°5.91VZA-44°7.36VZA-31°3.18VZA-38°2.92VZA-43°3.41
VZA-33°5.69VZA-40°5.51VZA-45°7.35VZA-32°3.01VZA-39°3.18VZA-44°3.62
VZA-34°5.93VZA-41°5.84VZA-46°7.10VZA-33°2.92VZA-40°3.12VZA-45°3.52
VZA-35°7.07VZA-42°5.34VZA-47°7.66VZA-34°2.85VZA-41°3.06VZA-46°3.59
VZA-36°4.44VZA-43°4.56VZA-48°7.36VZA-35°3.45VZA-42°3.08VZA-47°3.30
VZA-36°3.75VZA-43°3.26VZA-48°3.10
VZA-37°4.14VZA-44°3.16VZA-49°3.06
Table 4. ubRMSE of satellite-derived LST of three products based on in situ measurements and CLDAS datasets under different RAA ranges.
In Situ DataCLDAS Data
FY4AFY4BH9FY4AFY4BH9
RAA 0–30°7.085.556.254.012.852.95
RAA 30–60°6.775.014.713.852.552.60
RAA 60–90°6.014.128.643.093.173.97
RAA 90–120°4.725.918.862.843.293.87
RAA 120–150°3.176.156.933.062.993.14
RAA 150–180°3.083.254.583.022.943.36
Table 5. Statistical characteristics of coefficients A and D stratified by DEM intervals.
DEM ClassesData Quantity|A|_Mean|A|_Median|D|_Mean|D|_MedianA_NegA_PosD_NegD_Pos
[19, 150)24750.03440.02640.00820.0061−0.03400.0348−0.00940.0070
[150, 300)18700.02950.02140.01100.0083−0.02900.0300−0.01210.0094
[300, 450)19290.02330.01610.01210.0098−0.02750.0210−0.01270.0114
[450, 600)19740.02220.01480.01300.0107−0.02240.0220−0.01310.0129
[600, 750)16550.01990.01330.01300.0105−0.02090.0193−0.01370.0121
[750, 1685)22380.02270.01520.01300.0108−0.02250.0230−0.01360.0125
Notes: For A (and similarly for D): |A|_Mean and |A|_Median are the mean and median of |A|; A_Neg and A_Pos are the mean of negative and positive values of A.
Table 6. Statistical characteristics of coefficients A and D stratified by NDVI intervals.
NDVI ClassesData Quantity|A|_Mean|A|_Median|D|_Mean|D|_MedianA_NegA_PosD_NegD_Pos
[−0.13, 0.65)8570.03050.02200.00910.0065−0.03310.0285−0.01010.0079
[0.65, 0.7)11660.02850.02060.01020.0075−0.02870.0284−0.01110.0092
[0.7, 0.75)22290.02830.01960.01040.0079−0.02810.0284−0.01130.0092
[0.75, 0.78)23260.02550.01750.01170.0092−0.02600.0250−0.01270.0104
[0.78, 0.81)33000.02290.01520.01320.0109−0.02390.0220−0.01430.0118
[0.81, 0.84)28800.02280.01540.01320.0106−0.02350.0222−0.01440.0119
[0.84, 0.94]10660.02110.01540.01240.0097−0.02270.0197−0.01350.0115
Notes: For A (and similarly for D): |A|_Mean and |A|_Median are the mean and median of |A|; A_Neg and A_Pos are the mean of negative and positive values of A.
Disclaimer/Publisher’s Note: The statements, opinions and data contained in all publications are solely those of the individual author(s) and contributor(s) and not of MDPI and/or the editor(s). MDPI and/or the editor(s) disclaim responsibility for any injury to people or property resulting from any ideas, methods, instructions or products referred to in the content.