Article

A Multi-Wavelength Deep Neural Network Framework for Synergistic Retrieval of AOD, FMF, and AAOD from TROPOMI
1
Aerospace Information Research Institute, Chinese Academy of Sciences, Beijing 100101, China
2
School of Electronics and Information, Northwestern Polytechnical University, Xi’an 710072, China
3
School of Geographical Sciences, Fujian Normal University, Fuzhou 350007, China
*
Author to whom correspondence should be addressed.
Remote Sens. 2026, 18(8), 1139; https://doi.org/10.3390/rs18081139
Submission received: 10 March 2026 / Revised: 2 April 2026 / Accepted: 10 April 2026 / Published: 12 April 2026

Highlights

What are the main findings?
  • This study developed a deep neural network framework for the synergistic retrieval of AOD, FMF, and AAOD at seven wavelengths (380–772 nm) from TROPOMI.
  • The proposed framework achieved high retrieval accuracy and excellent spatial consistency, demonstrating robust performance under high aerosol loading conditions.
What are the implications of the main findings?
  • The multi-wavelength retrieval of AOD, AAOD, and FMF facilitates enhanced aerosol type discrimination, significantly constraining uncertainties in global aerosol radiative forcing assessments.
  • The DNN-based approach offers superior spatial continuity in capturing extreme aerosol events (e.g., wildfires), bypassing the limitations of traditional physical algorithms while remaining consistent with established satellite products.

Abstract

Aerosol optical depth (AOD), fine-mode fraction (FMF), and absorption aerosol optical depth (AAOD) are essential for quantifying aerosol extinction and related climate and air-quality effects. Yet, most satellite retrievals target a single wavelength or parameter. In this study, a deep neural network (DNN) framework was developed to synergistically retrieve AOD, FMF, and AAOD from Sentinel-5P/TROPOMI at seven wavelengths across 380–772 nm. Parameter-specific feature engineering was designed by incorporating physical linkages among aerosol optical properties. Bayesian optimization was employed to tune hyperparameters, and SHAP (Shapley additive explanations) was used to interpret feature contributions. The proposed model demonstrated high accuracy and robustness on an independent test set. The retrieved AOD showed excellent agreement with AERONET (R = 0.960, MAE = 0.034, RMSE = 0.070), and similarly strong performance was achieved for FMF (R = 0.955, MAE = 0.027, RMSE = 0.039). For AAOD, an overall correlation of 0.86 was obtained (MAE = 0.005, RMSE = 0.008). Comparisons with existing satellite products indicated globally consistent spatial patterns and improved spatial continuity under high aerosol loading. Overall, the proposed data-driven approach enhances the efficiency and coverage of multi-parameter aerosol retrieval while maintaining high accuracy, supporting absorbing aerosol monitoring, aerosol-type discrimination, and climate-effect assessment.

1. Introduction

Atmospheric aerosols significantly modulate Earth’s radiation budget by scattering and absorbing solar radiation and altering cloud optical properties, remaining a key factor in global climate change [1,2,3]. According to the IPCC Sixth Assessment Report, aerosols contribute substantially to global radiative forcing [4]. Furthermore, excessive aerosol concentrations pose severe threats to human health and environmental quality [5,6].
Aerosol optical and microphysical properties are essential for quantifying aerosol climatic and environmental impacts. Aerosol optical depth (AOD), a measure of column-integrated aerosol extinction, describes atmospheric turbidity and constrains aerosol radiative effects, and is widely used as a key input to climate and air-quality forecasting models [7,8]. Fine-mode fraction (FMF), defined as the ratio of fine-mode AOD (AODF) to total AOD, characterizes the aerosol size distribution [9]. It is vital for aerosol type identification and source apportionment, as aerosols of different sizes exert markedly different impacts on climate and environmental quality [10]. Absorption Aerosol Optical Depth (AAOD) represents aerosol absorption properties. It is a key parameter for discriminating between aerosol types, such as black carbon, brown carbon, and mineral dust [11,12,13]. Most existing aerosol products provide only AOD or retrieve separate parameters, making it difficult to obtain multi-parameter information simultaneously and thereby limiting their utility for climate and environmental monitoring. Moreover, because aerosol scattering and absorption exhibit strong wavelength dependencies that vary by aerosol type, information from a single spectral band is inherently limited [14]. Consequently, synergistic multi-wavelength, multi-parameter monitoring over a broad spectral range (e.g., from the ultraviolet to the near-infrared) is required to capture the full spectral evolution of aerosol optical responses and to enable more accurate aerosol-type discrimination and climate-impact assessment.
Over the past decades, various physical retrieval algorithms, including Deep Blue (DB), Dark Target (DT), and Multi-Angle Implementation of Atmospheric Correction (MAIAC), have been developed for sensors on polar-orbiting and geostationary satellites (e.g., MODIS, VIIRS, and AHI) [15,16,17,18]. These algorithms have produced global AOD, widely used in climate and environmental research. However, constrained by the band configurations of conventional sensors, most methods struggle to meet the physical requirements for synergistic multi-wavelength and multi-parameter retrieval. TROPOMI provides broad-spectrum observation capabilities ranging from the ultraviolet (UV) to the shortwave infrared (SWIR) [19]. Specifically, its coverage in the UV bands significantly enhances sensitivity to absorbing aerosols (e.g., biomass burning smoke and mineral dust). It provides critical a priori information on absorption properties, such as the UV Aerosol Index (UVAI) [20]. The Generalized Retrieval of Atmosphere and Surface Properties (GRASP) algorithm [21] was adapted for TROPOMI data, leading to the successful generation of the TROPOMI/GRASP aerosol retrieval dataset [22]. However, the practical application of such physics-based methods still faces significant challenges. First, forward simulations and iterative solutions based on complex radiative transfer models (RTMs) are computationally expensive, leading to low retrieval efficiency [17,23,24]. Second, to ensure retrieval accuracy, physics-based methods often rely on stringent quality control, resulting in numerous missing values and poor spatial continuity [25,26]. Furthermore, existing high-quality TROPOMI/GRASP multi-wavelength products have limited temporal coverage, significantly hindering their application in long-term studies of aerosol-climate effects and environmental evolution.
To overcome the limitations of physics-based algorithms, data-driven approaches, represented by machine learning, have emerged and been widely applied in aerosol retrieval [27]. Early studies focused on classical machine learning, leveraging algorithms such as Random Forest (RF) [28,29,30], Support Vector Machine (SVM) [31,32], and XGBoost [33,34]. By establishing mapping relationships between satellite observations and ground-based measurements (e.g., AERONET), these researchers achieved high-efficiency retrieval of aerosol optical parameters. Recently, deep neural networks (DNNs) have gained prominence. Fully Connected Networks (FCNs) initially demonstrated the potential of deep models for multi-source data fusion [35], while Convolutional Neural Networks (CNNs) significantly improved aerosol retrieval under complex backgrounds [36,37,38]. Moreover, Capsule Networks have shown enhanced robustness in addressing observational angular effects [39]. Furthermore, Transformer models—leveraging attention mechanisms to capture long-range spatiotemporal dependencies—have emerged as frontier tools for continuous aerosol retrieval [40,41,42]. These deep-learning models have dramatically accelerated the real-time processing of massive remote sensing datasets [43]. To address the lack of physical interpretability and poor generalization of deep-learning models in small-sample regions, researchers have explored pre-training models using large-scale simulation datasets generated by RTMs. Such strategies facilitate the construction of physics-informed deep-learning architectures [23,44,45]. These frameworks combine the flexibility of data-driven methods with physical constraints. Retrieval parameters are undergoing a profound evolution, transitioning from single-parameter to multi-physical property characterization and from single-wavelength to full-spectrum synergistic inversion. Recent studies have moved toward multi-task output strategies, supporting the retrieval of multiple key parameters such as AOD, FMF, and AAOD [46,47,48,49]. Concurrently, researchers have fully exploited the multi-wavelength collaborative observations from satellite sensors to establish robust inversion schemes for diverse aerosol parameters [50].
However, despite significant advances in aerosol parameter retrieval using machine learning, notable shortcomings remain in multi-parameter, multi-wavelength synergistic retrieval. First, existing machine-learning studies largely focus on single-wavelength parameter retrieval, with very few performing simultaneous prediction of multi-wavelength AOD, FMF, and AAOD [49], thereby overlooking the intrinsic physical coupling of different optical parameters in the radiative transfer process. Second, in terms of feature engineering, most current models treat reflectance from each wavelength as independent input features, lacking in-depth exploitation of the wavelength-dependent behavior of aerosol optical properties, such as spectral gradients, ratios, and wavelength-dependent features [48]. These limitations constrain the reliability of machine-learning approaches for multidimensional aerosol feature retrieval in complex atmospheric environments.
In this study, we developed a deep neural network–based method for multi-wavelength, multi-parameter aerosol retrieval, applied to TROPOMI satellite data for seven wavelengths between 380 and 772 nm, retrieving AOD, FMF, and AAOD. Dedicated input feature systems were constructed for the neural networks to account for the physical characteristics of different aerosol optical parameters, considering the influence of AOD on FMF and AAOD. A systematic approach to model selection and interpretability was adopted, employing Bayesian optimization to enhance hyperparameter search efficiency and combining SHAP to quantify feature contributions for interpretability. Cross-validation using multi-source data and comprehensive comparative validation was conducted with multiple satellite observations. The structure of this paper is as follows: Section 2 introduces the datasets used in this study. Section 3 details the DNN methodology, including training set construction, feature engineering, Bayesian hyperparameter optimization, and model evaluation methods. Section 4 presents model performance, result validation, comparisons, and a discussion of different aerosol products. Finally, Section 5 provides the conclusions of this study.

2. Materials

2.1. Satellite Observations

2.1.1. TROPOMI

TROPOMI, onboard the Sentinel-5 Precursor (S5P) satellite, was launched on 13 October 2017. The instrument measures top-of-atmosphere (TOA) radiance with high spectral resolution (0.25–1 nm) across the ultraviolet (UV), visible (VIS), near-infrared (NIR), and shortwave infrared (SWIR) bands. It features a wide swath of approximately 2600 km, an ascending node crossing time of 13:30 local mean time at the equator [51], and a spatial resolution of 5.5 × 3.5 km2. Owing to the spectral smoothness of aerosol scattering and absorption, the aerosol retrieval in this study is configured for seven 1 nm wide spectral bands within the 380–772 nm range. These bands are specifically selected from the continuum portions of the spectrum, positioned away from strong gaseous absorption lines (Table 1). A triangular weighting function was applied to average all observations within a 1 nm bandwidth; it assigns a value of 1 at the selected band center and 0 at the band edges [52]. After inter-band co-registration using the triangular weighting function, radiance data from all TROPOMI channels were resampled to a uniform spatial resolution of 0.09° within an equidistant cylindrical projection and the WGS84 coordinate system.
In addition, the retrieval model incorporates several TROPOMI Level 2 products as input features. Total Ozone Column Concentration (TOC) and surface elevation data are obtained from the S5P L2 NO2 product [53]. The UVAI is sourced from the S5P L2 Aerosol Index product [52]. Surface reflectance data were obtained from the TROPOMI surface LER (Lambertian Equivalent Reflectance) database. The surface reflectance values corresponding to the seven target wavelengths are extracted at a spatial resolution of 0.125° × 0.125°. For cloud screening in the aerosol retrieval process, the S5P NPP-VIIRS cloud product, which features a spatial resolution of approximately 500 m, was employed. A pixel is considered cloud-free if the cloud fraction is less than or equal to 10% for the 380, 494, and 670 nm spectral bands. Additionally, to prevent potential misclassification of high-aerosol pixels by the cloud threshold, pixels with a UVAI greater than 1.5 are identified as cloud-free.

2.1.2. TROPOMI/GRASP

To assess the spatial distribution consistency and parameter plausibility of the inversion results in this study, the TROPOMI/GRASP dataset was employed for cross-validation. This dataset is derived from multispectral observations of Sentinel-5P/TROPOMI and generated using the GRASP (Generalized Retrieval of Atmosphere and Surface Properties) retrieval framework, providing global aerosol optical and microphysical parameters [22,54]. The available data cover the period from March 2019 to November 2020. For product comparison, overlapping data corresponding to the study period (as defined in the experimental settings) were selected for statistical analysis and case studies. The TROPOMI/GRASP dataset provides aerosol parameters at a spatial resolution of approximately 10 km, encompassing 10 wavelengths (340, 367, 380, 416, 440, 494, 670, 747, 772, and 2313 nm), including AOD, AAOD, and AODF. To ensure comparability, seven wavelengths consistent with those in this study were selected for validation and result comparison.

2.1.3. MODIS AOD and Land Cover Type

To evaluate the spatial distribution and large-scale consistency of the AOD retrieved in this study, the MODIS Multi-Angle Implementation of Atmospheric Correction (MAIAC) aerosol product was introduced for cross-validation. The MCD19A2 product is a Level 3 AOD dataset derived from the MAIAC algorithm, providing daily global observations at a 1 km spatial resolution [55]. In this study, the AOD data at 550 nm from the MCD19A2 product were selected for validation. The spatial resolution was resampled to 0.09° to maintain consistency across the datasets. The MODIS annual land cover type product (MCD12C1) is employed to provide surface type information [56]. This dataset is utilized both for the selection of land pixels and as a key input feature for the model.

2.1.4. VIIRS Aerosol Products

The VIIRS Level 3 aerosol product (AERDB_D3), generated from VIIRS sensor observations, provides continuity with MODIS observations, ensuring consistency with long-term climate data records [57]. This dataset offers global daily atmospheric aerosol properties at a spatial resolution of 1°. Key parameters include AOD at various wavelengths, the Ångström Exponent (AE) between 490 and 670 nm, aerosol types, and their associated uncertainties [58]. In this study, AOD and AE data from this product are selected for result validation.

2.2. Ground-Based Measurements

AERONET is a global ground-based remote sensing aerosol observation network [59]. Its radiance measurements cover key spectral channels including 340, 380, 440, 500, 675, 870, and 1020 nm. The AERONET inversion data product is utilized as the target labels for neural network model training. This dataset provides key parameters, including AOD, AODF, and AAOD, at 440, 675, 870, and 1020 nm. To ensure a sufficient training sample size, Level 1.5 data are selected. These data have undergone preliminary cloud screening and quality control, making them suitable for research scenarios that balance data quality and availability. Spatiotemporal matching was performed between ground-based station observations and satellite data. Spatially, the mean value within a 3 × 3-pixel window centered at each station was calculated for matching, requiring more than 50% of the pixels to be valid. Temporally, station observations averaged within ±30 min of the satellite overpass were matched with satellite measurements, and the same procedure was applied to other spatial datasets. Stations with observation periods longer than three months during 2019–2021 were selected. After spatiotemporal matching and quality screening, 13,745 samples were obtained.
Because seven target retrieval wavelengths were defined, AAOD values available at four wavelengths were interpolated and extrapolated to the target spectrum. To account for the spectral dependence of AOD in AAOD retrieval, AOD values were also interpolated and extrapolated to ensure consistency across the target wavelengths. Although the AE method is commonly used for spectral interpolation, this study adopted a second-order polynomial empirical formula, which better represents spectral relationships and improves interpolation and extrapolation across the target wavelengths:
l n τ λ = a 0 + a 1 l n ( λ ) + a 2 l n 2 ( λ )
where τ λ denotes the aerosol parameter at wavelength λ (AOD, AODF, or AAOD), and a 0 , a 1 , and a 2 are the coefficients to be fitted. Compared with the conventional AE method, the second-order polynomial approach provided better spectral consistency across the target wavelengths, and the comparison results are summarized in Supplementary Materials (Text S1). Additional uncertainties introduced by spectral interpolation/extrapolation will be considered in the subsequent discussion. The target FMF was derived from AODF and AOD, and its values were constrained to the 0–1 range.

2.3. ERA5 Reanalysis Data

ERA5 is the fifth-generation global climate and weather reanalysis dataset released by the European Centre for Medium-Range Weather Forecasts (ECMWF), providing a high-quality data source for global climate research and weather analysis [60]. The ERA5 reanalysis data were used to provide auxiliary atmospheric-state features for the retrieval model in this study. The selected variables included mean sea level pressure, 10 m u/v-wind components, 2 m air temperature, total column water vapor (TCWV), and boundary layer height (BLH). The original ERA5 dataset has a spatial resolution of 0.25° × 0.25° and a temporal resolution of 3 hours.
Table 2 lists all the data used in this research.

3. Methods

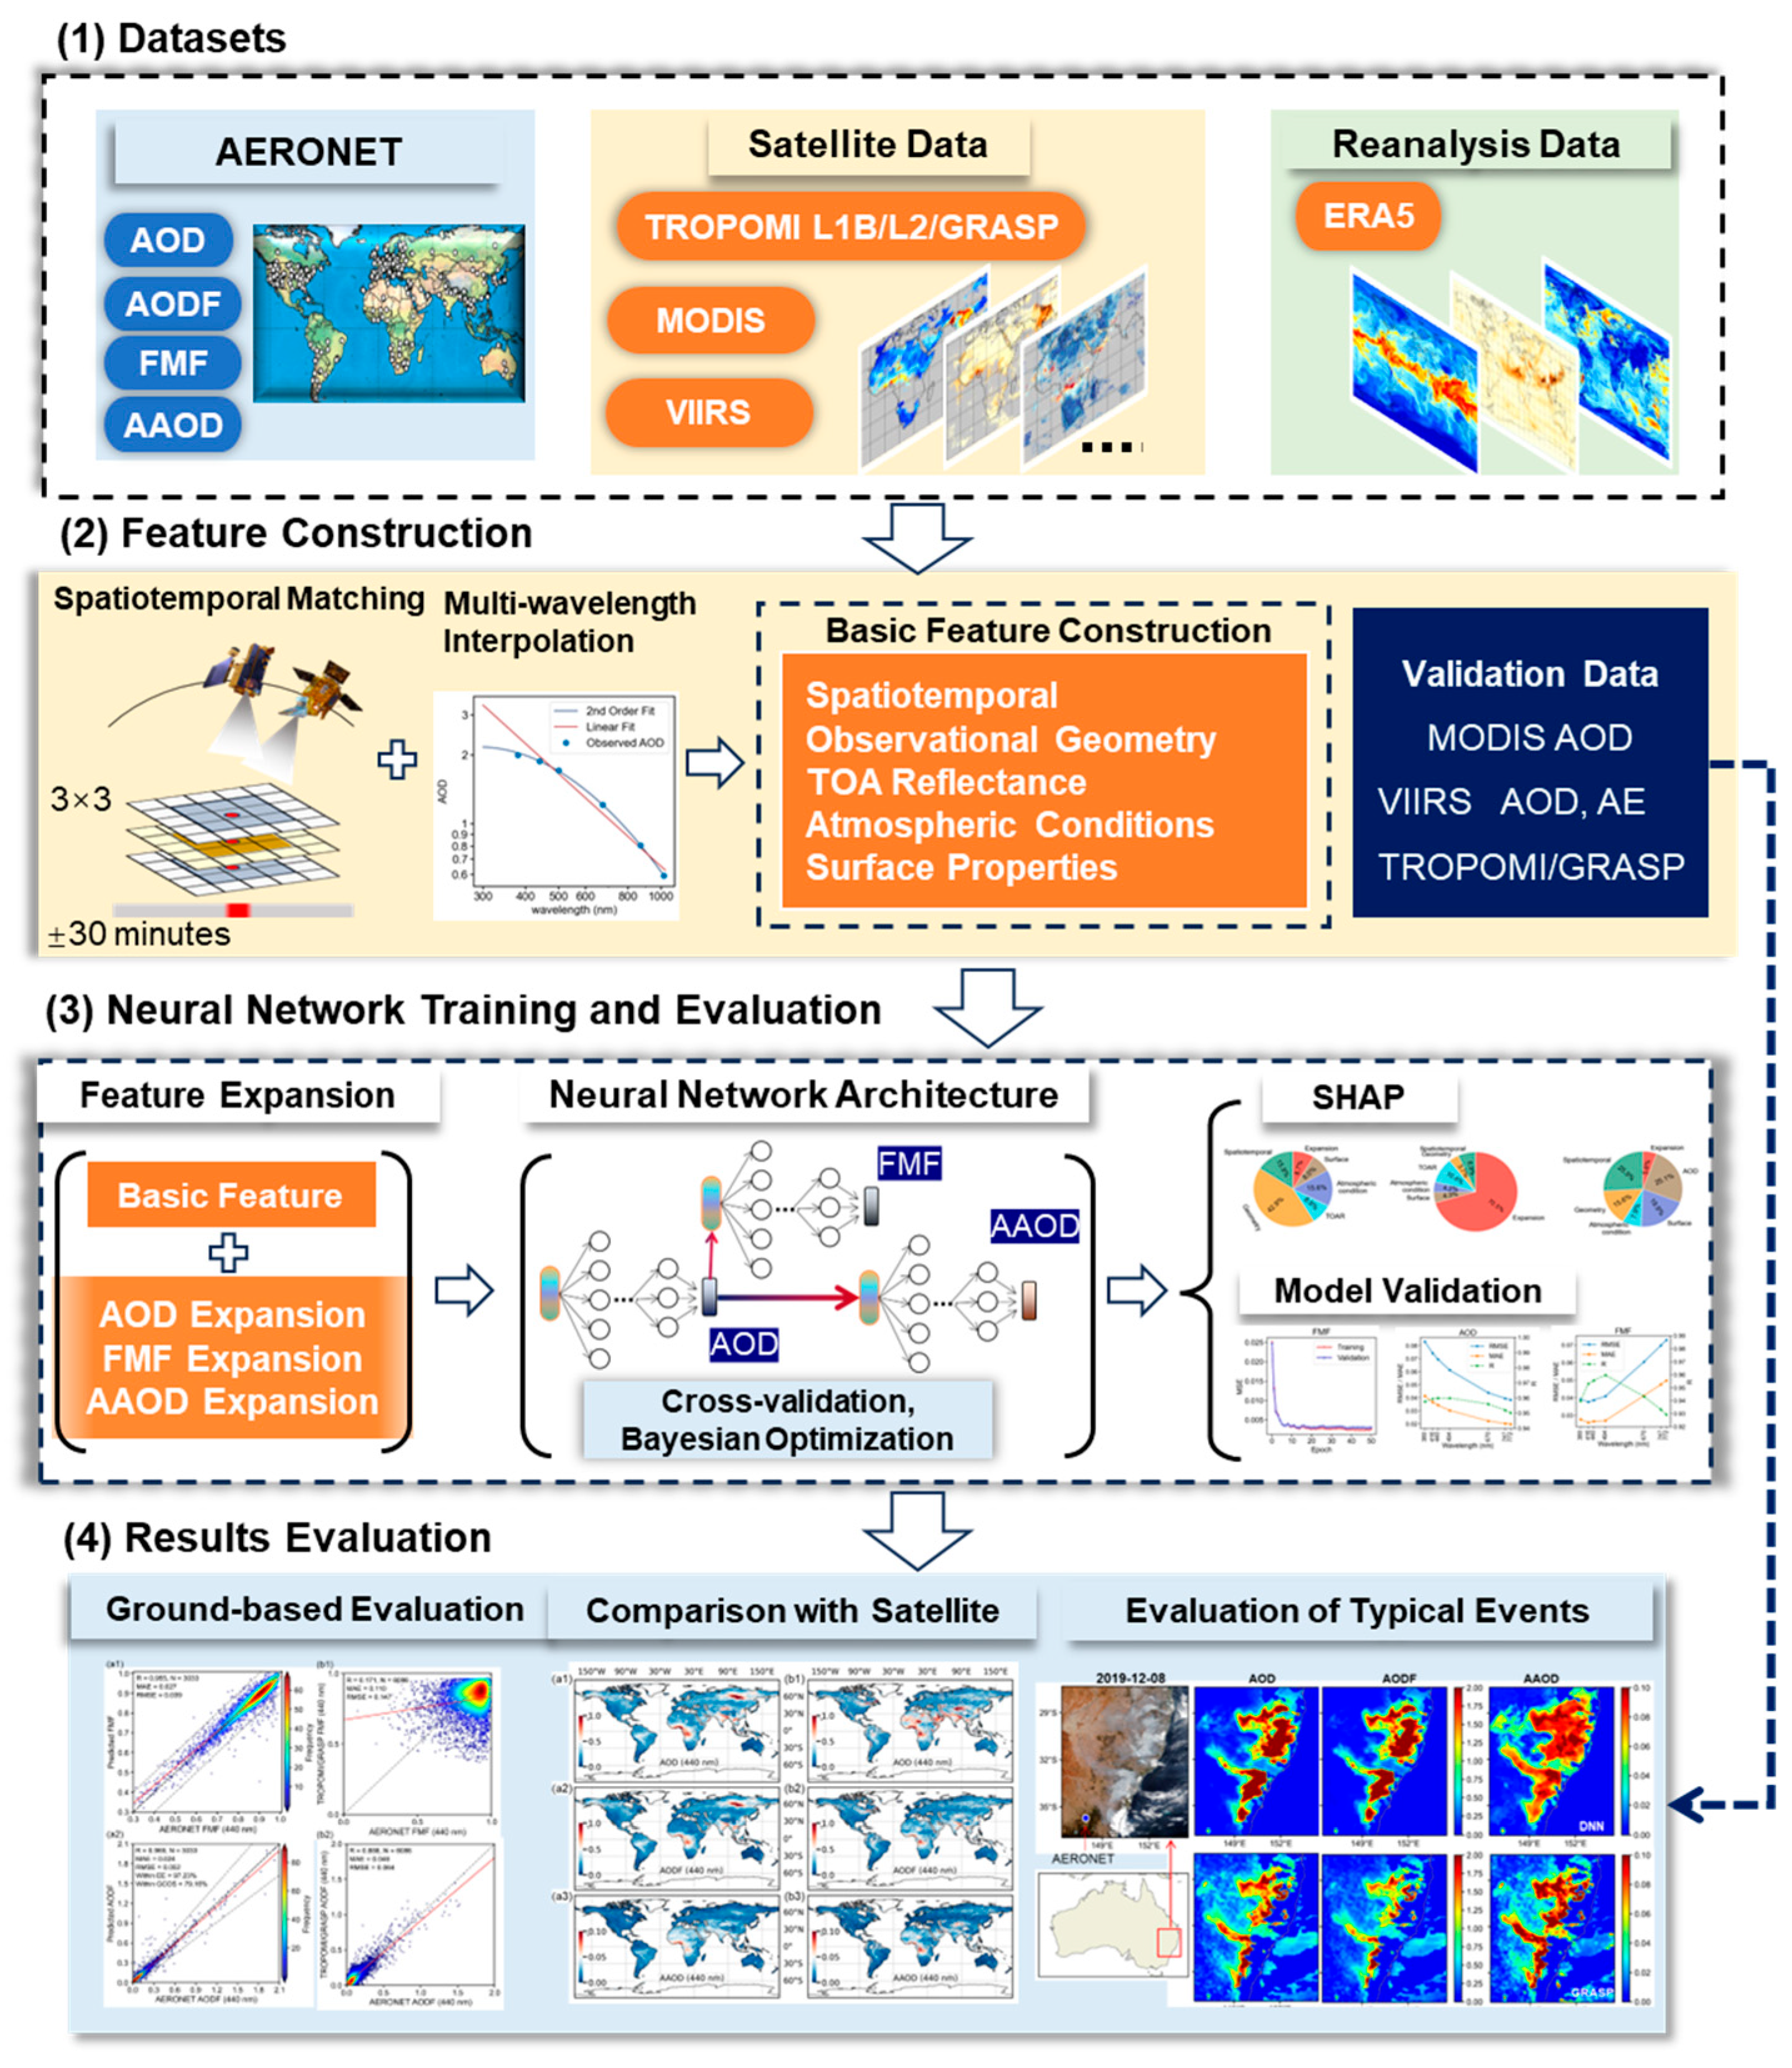
In this study, a deep neural network–based aerosol retrieval framework was developed using TROPOMI observations to simultaneously retrieve three aerosol optical parameters, namely AOD, FMF, and AAOD, at seven target wavelengths (380, 416, 440, 494, 670, 747, and 772 nm). The technical workflow of this study is shown in Figure 1. The workflow consists of the following: (1) building the training and validation datasets by applying quality control, spatial resampling, and spatiotemporal matching to multi-source inputs, with AERONET observations used to generate supervised labels at the target wavelengths; (2) training and interpreting a multi-output neural network, including parameter-specific feature engineering and normalization, with Bayesian hyperparameter optimization and cross-validation used to select the optimal configuration, and SHAP employed to quantify feature contributions; and (3) validating the retrievals against AERONET on an independent test set, and benchmarking spatial patterns and consistency against TROPOMI/GRASP, MODIS, and VIIRS products to assess reliability and the scope of applicability.

3.1. Training Dataset Construction and Feature Engineering

3.1.1. Basic Feature Construction

Based on the physical mechanisms underlying aerosol remote sensing retrievals, a multidimensional input feature system was constructed for different aerosol parameters. The system incorporates five categories of basic feature variables: spatiotemporal information, observation geometry, TOA reflectance, atmospheric conditions, and surface properties (Table 3), providing sufficient physical constraints for the retrieval model. Spatiotemporal features included longitude, latitude, and day of year (DOY) as basic location parameters to characterize the spatial distribution of aerosols across different geographic environments and their temporal variability. Observation geometry features consist of four critical angular parameters: Solar Zenith Angle (SZA), Solar Azimuth Angle (SAA), Viewing Zenith Angle (VZA), and Viewing Azimuth Angle (VAA). These parameters provide essential geometric constraints for the retrieval process [61]. TOA reflectance comprised Top-of-Atmosphere Reflectance (TOAR) at seven TROPOMI target wavelengths. These bands spanned the UV to NIR spectrum, enabling effective discrimination of aerosol types with varying size distributions and chemical compositions. Atmospheric conditions comprised 10 m u/v wind components, sea-level pressure, 2 m temperature, total column ozone, total column water vapor, and planetary boundary layer height. Surface properties were represented using MODIS MCD12C1, SRTM DEM, and TROPOMI LER.

3.1.2. Feature Expansion Strategy

Based on the basic features, a differentiated progressive feature-expansion strategy was designed to gradually increase feature complexity and physical constraints. For AOD, spectral features of AOT reflectance were further explored across wavelengths. Using the seven wavelengths, three types of spectral combination features were constructed: (1) Wavelength-difference features (DR_i_j = TOARi − TOARj), which emphasize absolute inter-wavelength differences and characterize spectral gradients and wavelength-dependent atmospheric scattering [62]. (2) Wavelength-ratio features (R_i_j = TOARi/TOARj), which partially reduce the influence of overall surface brightness variations and highlight spectral characteristics of surface targets, making them suitable for concentration or turbidity estimation [63]. (3) Normalized difference ratios features (NDR_i_j = (TOARi − TOARj)/(TOARi + TOARj)), which suppress the influence of absolute radiance and enhance sensitivity to relative aerosol signal variations [64]. For FMF, the AE was introduced as an indicator of aerosol particle size. Using AOD values at the seven target wavelengths, AE was calculated for all two-wavelength combinations. AE reflects the spectral dependence of aerosol optical depth and is closely related to aerosol particle size distribution. Higher AE values generally indicate fine-mode dominance, while lower values are associated with coarse-mode aerosols [65]. For AAOD, three feature categories were introduced. The first category consisted of optical parameters, where AOD at the seven wavelengths was directly used to provide prior information for AAOD retrieval. The second category incorporated the AE derived from the wavelength dependence of AOD. The third category was UVAI. The aerosol index directly reflects the UV absorption capability of aerosols, and different types of absorbing aerosols exhibit distinct absorption spectral characteristics in the ultraviolet wavelengths. Prior to neural network training, all features were standardized.

3.2. Neural Network Architecture

3.2.1. Architecture Configuration

Previous studies have shown that, compared with traditional machine-learning models, neural networks are better able to capture the complex relationships between satellite observations and aerosol parameters, leading to higher retrieval accuracy [50]. A fully connected DNN was adopted to construct the regression model. Independent models were developed for different retrieval targets (AOD, FMF, and AAOD), with differentiated input features and network configurations. The supervised labels for the DNN models were derived from the AERONET inversion product, including AOD, FMF, and AAOD at seven target wavelengths. The DNN models were trained from scratch, without any fine-tuning or transfer learning. The network architecture is illustrated in Figure S4. The number of hidden layers is treated as a hyperparameter and determined through hyperparameter search, as described in the following section. The output layer was designed with seven nodes, corresponding to the aerosol optical parameters at the target spectral bands. ReLU was selected as the activation function throughout the network. For model optimization, the Adam (Adaptive Moment Estimation) solver was employed due to its adaptive learning rate, which ensures greater training stability. A supervised learning framework was adopted for model training, using AERONET observations as the ground truth. The Mean Squared Error (MSE) was selected as the loss function. For the model with seven output nodes, the loss function was calculated as follows:
L M S E = 1 n × k i = 1 n j = 1 k ( y ^ i j y i j ) 2
where n is the number of samples and k is the number of output nodes. y ^ i j and y i j represent the predicted and reference values, respectively, for the i-th sample at the j-th wavelength. The loss function assigns equal weights to the errors across all wavelengths to calculate the overall average. To ensure model generalization, the input features incorporated station location and observation time. The dataset was divided into training and testing subsets following a strict separation strategy to ensure independence between model training and evaluation. The testing dataset was not involved in any stage of model training or hyperparameter optimization, thereby providing an unbiased assessment of model generalization. The dataset was divided into training and testing sets at a ratio of 80% and 20%, respectively, resulting in a total of 13,745 AERONET samples used for model training.

3.2.2. Bayesian Hyperparameter Optimization

Hyperparameter configurations significantly influence the training efficiency and generalization performance of neural networks. In this study, Bayesian optimization based on Gaussian Processes (GP) was employed to perform hyperparameter searching [66]. A multidimensional search space covering six key hyperparameters was constructed in this study (search ranges are listed in Table S3). A 10-fold cross-validation strategy was integrated into the hyperparameter search, using negative MSE as the evaluation metric to ensure consistent predictive stability and generalization across different data subsets. The optimization process consisted of 40 Bayesian sampling iterations. For model training, a progressive convergence strategy was adopted with a maximum of 800 epochs and a convergence threshold of 5 × 10⁻⁴. The final network architectures and parameter configurations are summarized in Table 4. Specifically, β1 and β2 denote the exponential decay rates for the first- and second-moment estimates in the Adam optimizer, ε is a small constant for numerical stability, and the batch size defines the number of samples used per training iteration. Training was performed on a workstation equipped with a CPU and 64 GB of RAM. The average training time for a single optimized model was approximately 78 s, 47 s, and 51 s for AOD, FMF, and AAOD, respectively. The Bayesian hyperparameter optimization required approximately 11.5 h, 8.0 h, and 10.0 h for AOD, FMF, and AAOD, respectively.

3.3. Model Evaluation and Feature Contribution Analysis

To evaluate the accuracy of the neural network model, five statistical metrics were used to assess the retrieval results: root mean square error (RMSE), mean absolute error (MAE), correlation coefficient (R), the expected error (EE) for AOD, and the accuracy threshold defined by the Global Climate Observing System (GCOS). Taking AOD as an example, the specific calculation formulas for these metrics are given as follows:
R M S E = i N ( y i x i ) 2 N
M A E = i N y i x i N
R = i N ( x i x ¯ ) ( y i y ¯ ) i N ( x i x ¯ ) 2 i N ( y i y ¯ ) 2
E E A O D = ± ( 0.2 × A O D + 0.05 )
G C O S = m a x ( 0.03 ,   0.1 × A O D )
The error range indicators for FMF and AAOD were adjusted as follows:
E E F M F = ± 0.1
E E S S A = ± 0.01
To quantitatively assess the contributions of different input features to aerosol retrieval results and to reveal the physical relationships learned by the model, the SHAP method was used to perform interpretability analysis of the trained neural network.

4. Results

4.1. Model Interpretability

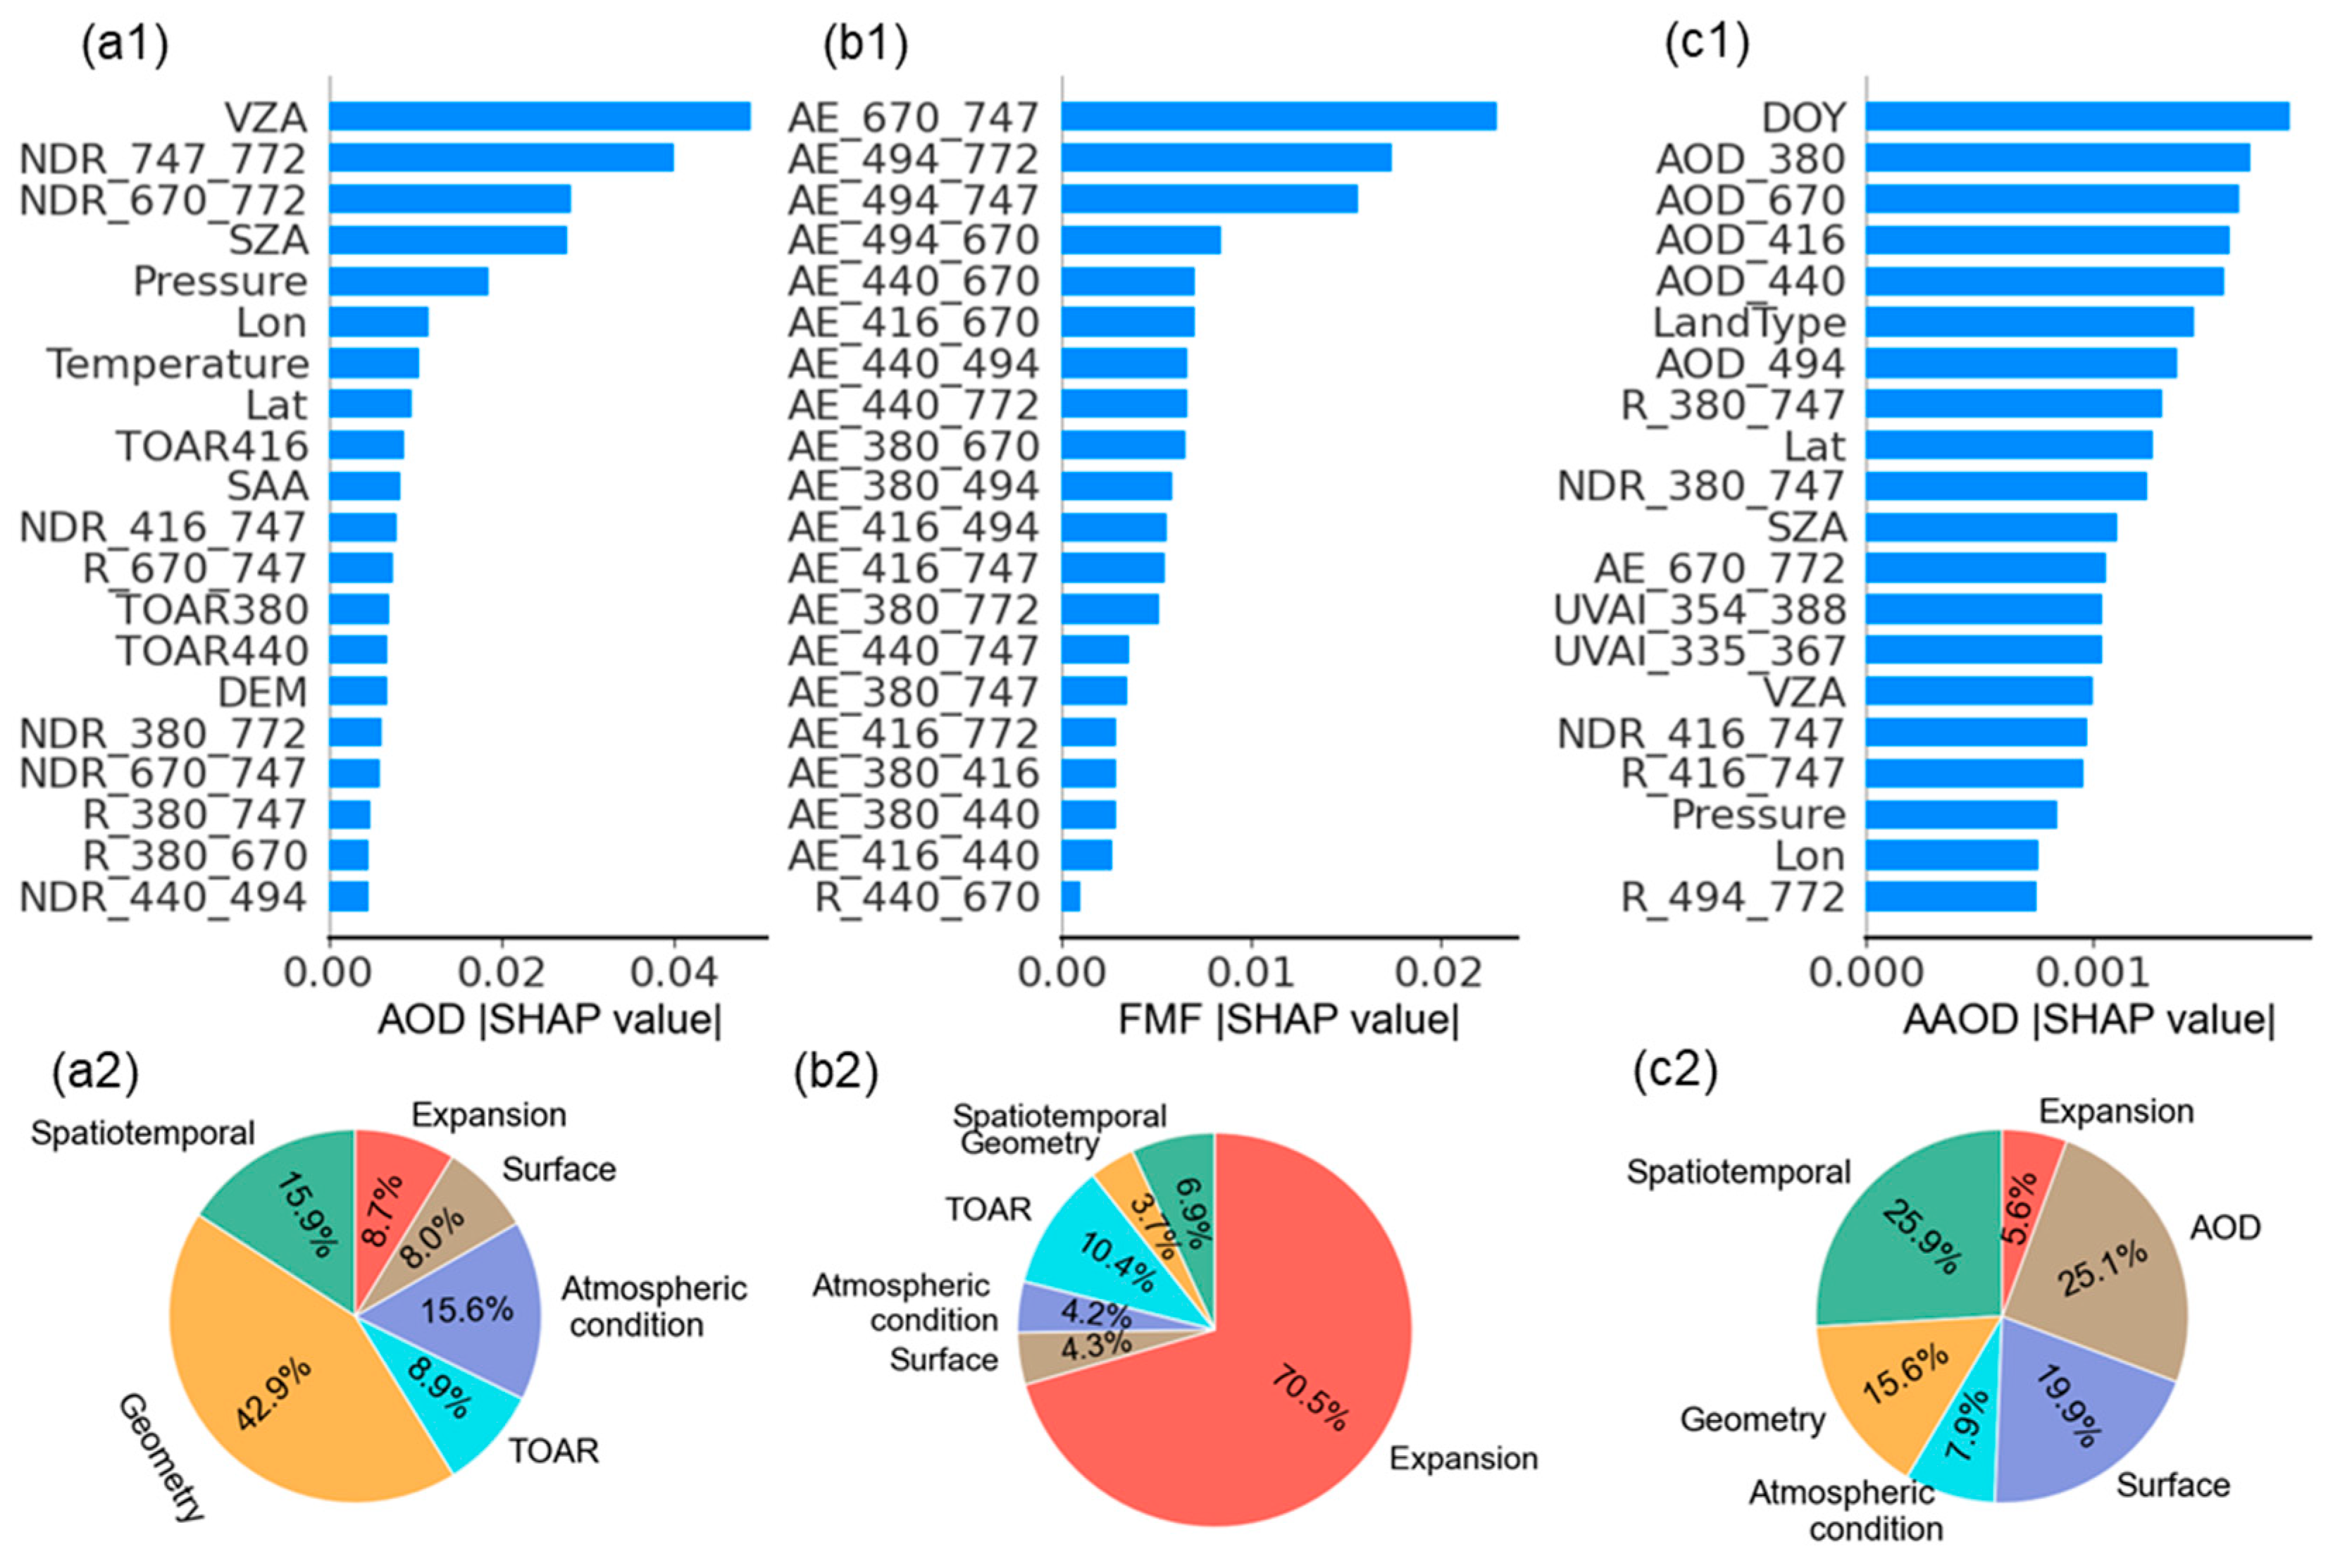
To systematically reveal the physical drivers of different aerosol parameter retrieval models, the SHAP method is used to quantitatively evaluate the importance of each input feature (Figure 2). From the SHAP contribution patterns of the three aerosol parameters (AOD, FMF, and AAOD), clear differences are observed in their responses to different feature categories. These differences have well-defined physical bases and are highly consistent with recent remote sensing retrieval theories. For AOD retrieval, observation geometry parameters, particularly VZA and SZA, dominate the SHAP contributions (Figure 2(a1,a2)), with geometric features accounting for the largest share (42.9%). The extended features contribute 8.7% to the results. Specifically, high-contribution normalized difference reflectance features (e.g., NDR_747_772 and NDR_670_772) effectively enhance aerosol spectral signals while suppressing surface background effects. In contrast, for FMF retrieval, multi-wavelength expanded features contribute the most (70.5%), with AE-based features (e.g., AE_670_747 and AE_494_772) showing particularly high SHAP importance. For AAOD retrieval, the results show that DOY and AOD features make the largest contributions to the model, accounting for 25.9% and 25.1% of the total contribution, respectively.

4.2. Model Validation

4.2.1. Overall Accuracy

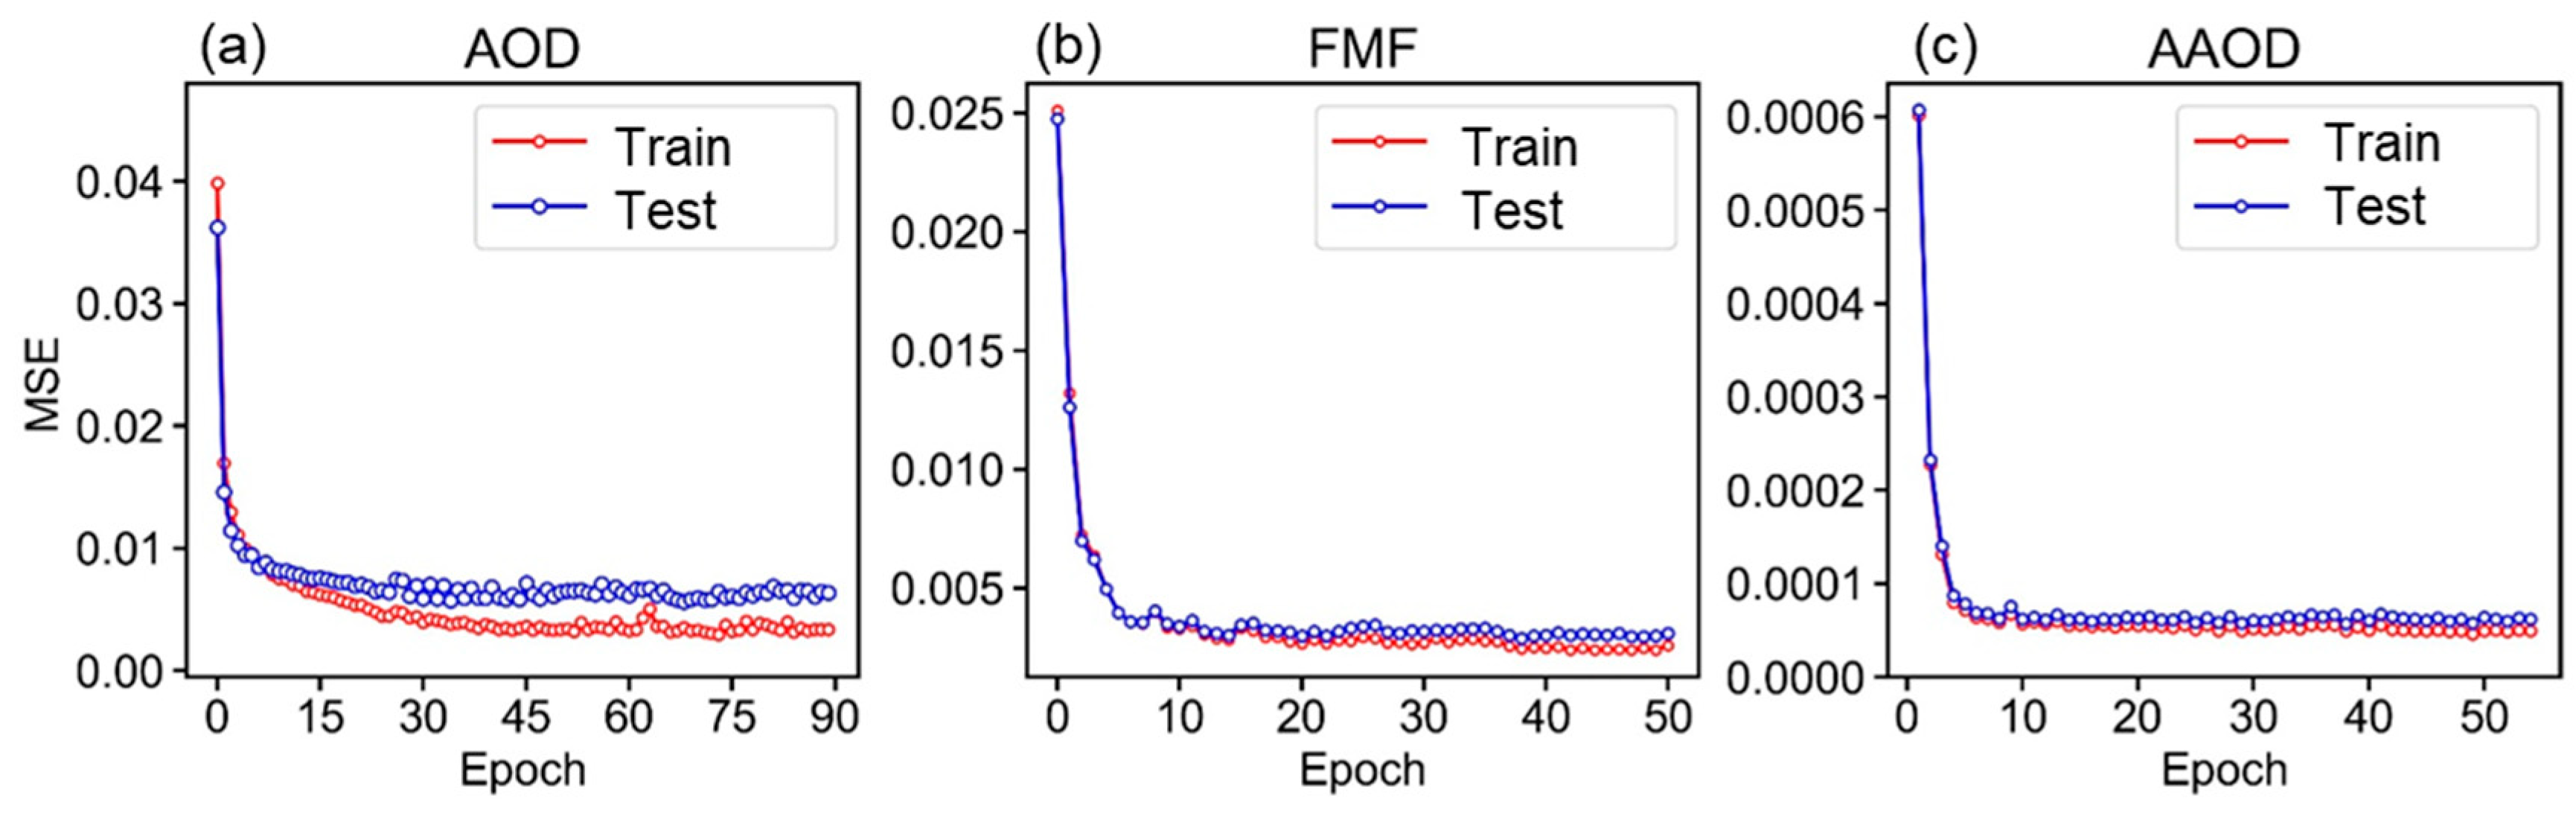
During neural network training, model performance is typically evaluated by examining the loss curves of the training and testing datasets. Figure 3 shows the variations in MSE with training epochs for the three models (AOD, FMF, and AAOD) on both datasets, providing a direct assessment of model performance and generalization ability. For the AOD model, the loss curves show that both training and testing losses decrease rapidly at the early stage of training and gradually stabilize. The small gap between the two losses and their convergence to low values indicates that the model achieves good fitting on the training data while maintaining strong generalization capability without evident overfitting. The FMF model exhibits a similar pattern: training and testing losses decline rapidly in the first few epochs and stabilize thereafter, reaching a final loss of approximately 0.003. The AAOD model shows an even faster decrease in loss and ultimately stabilizes at a very low level of approximately (5 × 10⁻⁵), indicating that the model effectively captures the characteristics of the training data. Meanwhile, the small difference between the training and test losses further demonstrates the model’s strong generalization capability and its potential for practical applications. Overall, the training and testing loss curves of the AOD, FMF, and AAOD models all exhibit stable decreasing trends, with only small differences between the two datasets. These results indicate that the models effectively fit the training data while maintaining good generalization performance without overfitting, demonstrating strong stability and applicability in practical aerosol retrieval tasks.
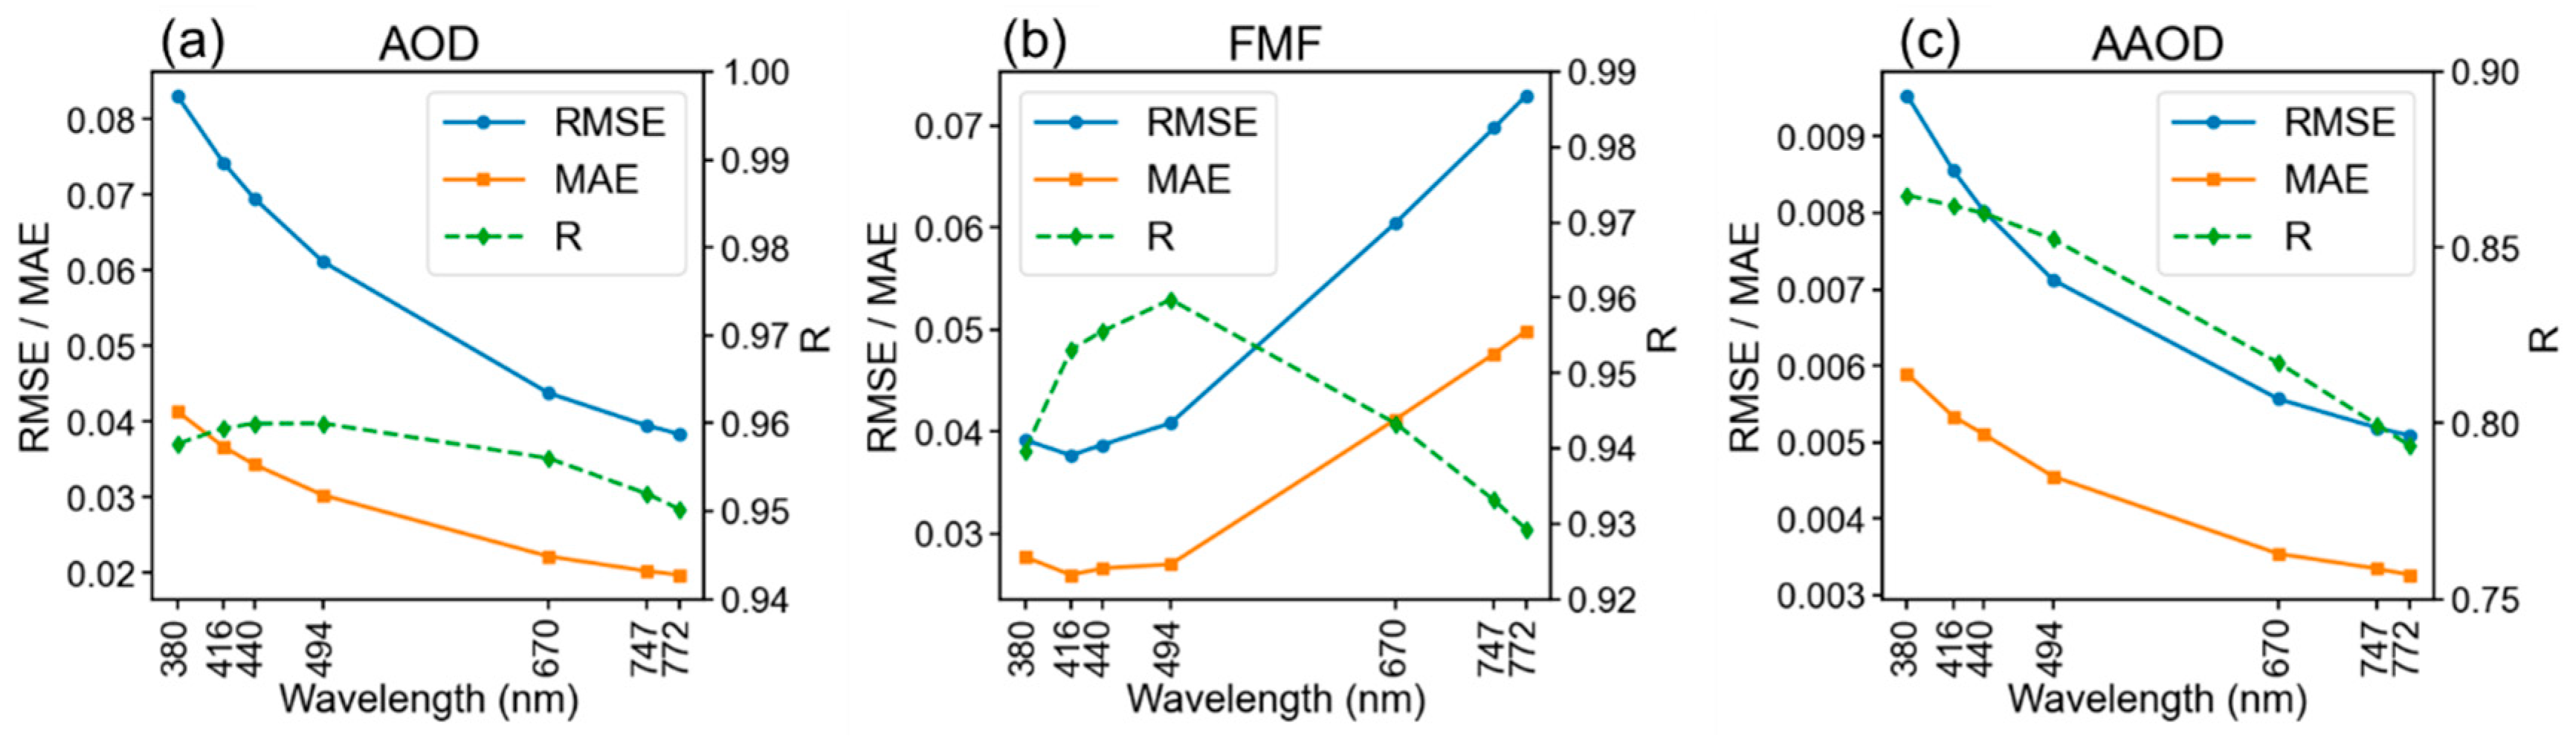
Figure 4 shows the performance of the three neural network models on the test dataset, evaluated using RMSE, MAE, and the R across different wavelengths. Overall, the models exhibit clear wavelength dependence. In the blue–green range (400–550 nm), the AOD and FMF models maintain high correlations (R > 0.95). Meanwhile, correlations decrease for all models in the red range (>600 nm), suggesting reduced prediction accuracy at longer wavelengths. For the AOD model, RMSE and MAE generally decrease with increasing wavelength, indicating lower errors at longer wavelengths (RMSE: 0.083 at 380 nm to 0.038 at 772 nm; MAE: 0.041 to 0.020). The correlation coefficient peaks at 494 nm (R ≈ 0.96). In contrast, FMF shows increasing RMSE and MAE with wavelength, indicating larger errors at longer wavelengths, although R also peaks at 494 nm (≈0.96). The AAOD model exhibits a different pattern, with RMSE, MAE, and R reaching maximum values at 380 nm (RMSE = 0.01, MAE = 0.006, R = 0.865), indicating better performance at shorter wavelengths. MAE values remain consistently lower than RMSE for all models, suggesting relatively uniform error distributions with only occasional large deviations. Overall, the models show clear wavelength dependence but maintain high accuracy and stable performance in the shorter-wavelength range.
To evaluate the contribution of the expanded feature, we performed an ablation study using only the basic features for model training. Comparison with the full features shows that including parameter-specific spectral features noticeably improves retrieval performance, especially for FMF and AAOD, as shown in Tables S4 and S5. For instance, R values for FMF increase from 0.658–0.676 (basic features) to 0.929–0.960 (full features) across the seven wavelengths, and corresponding RMSE and MAE decrease significantly. Similarly, AAOD retrieval benefits from the full features, with R increasing from 0.652–0.745 to 0.794–0.865. These results demonstrate that feature expansion is essential for accurately capturing aerosol optical properties across multiple wavelengths and parameters.

4.2.2. Accuracy Validation and Comparison

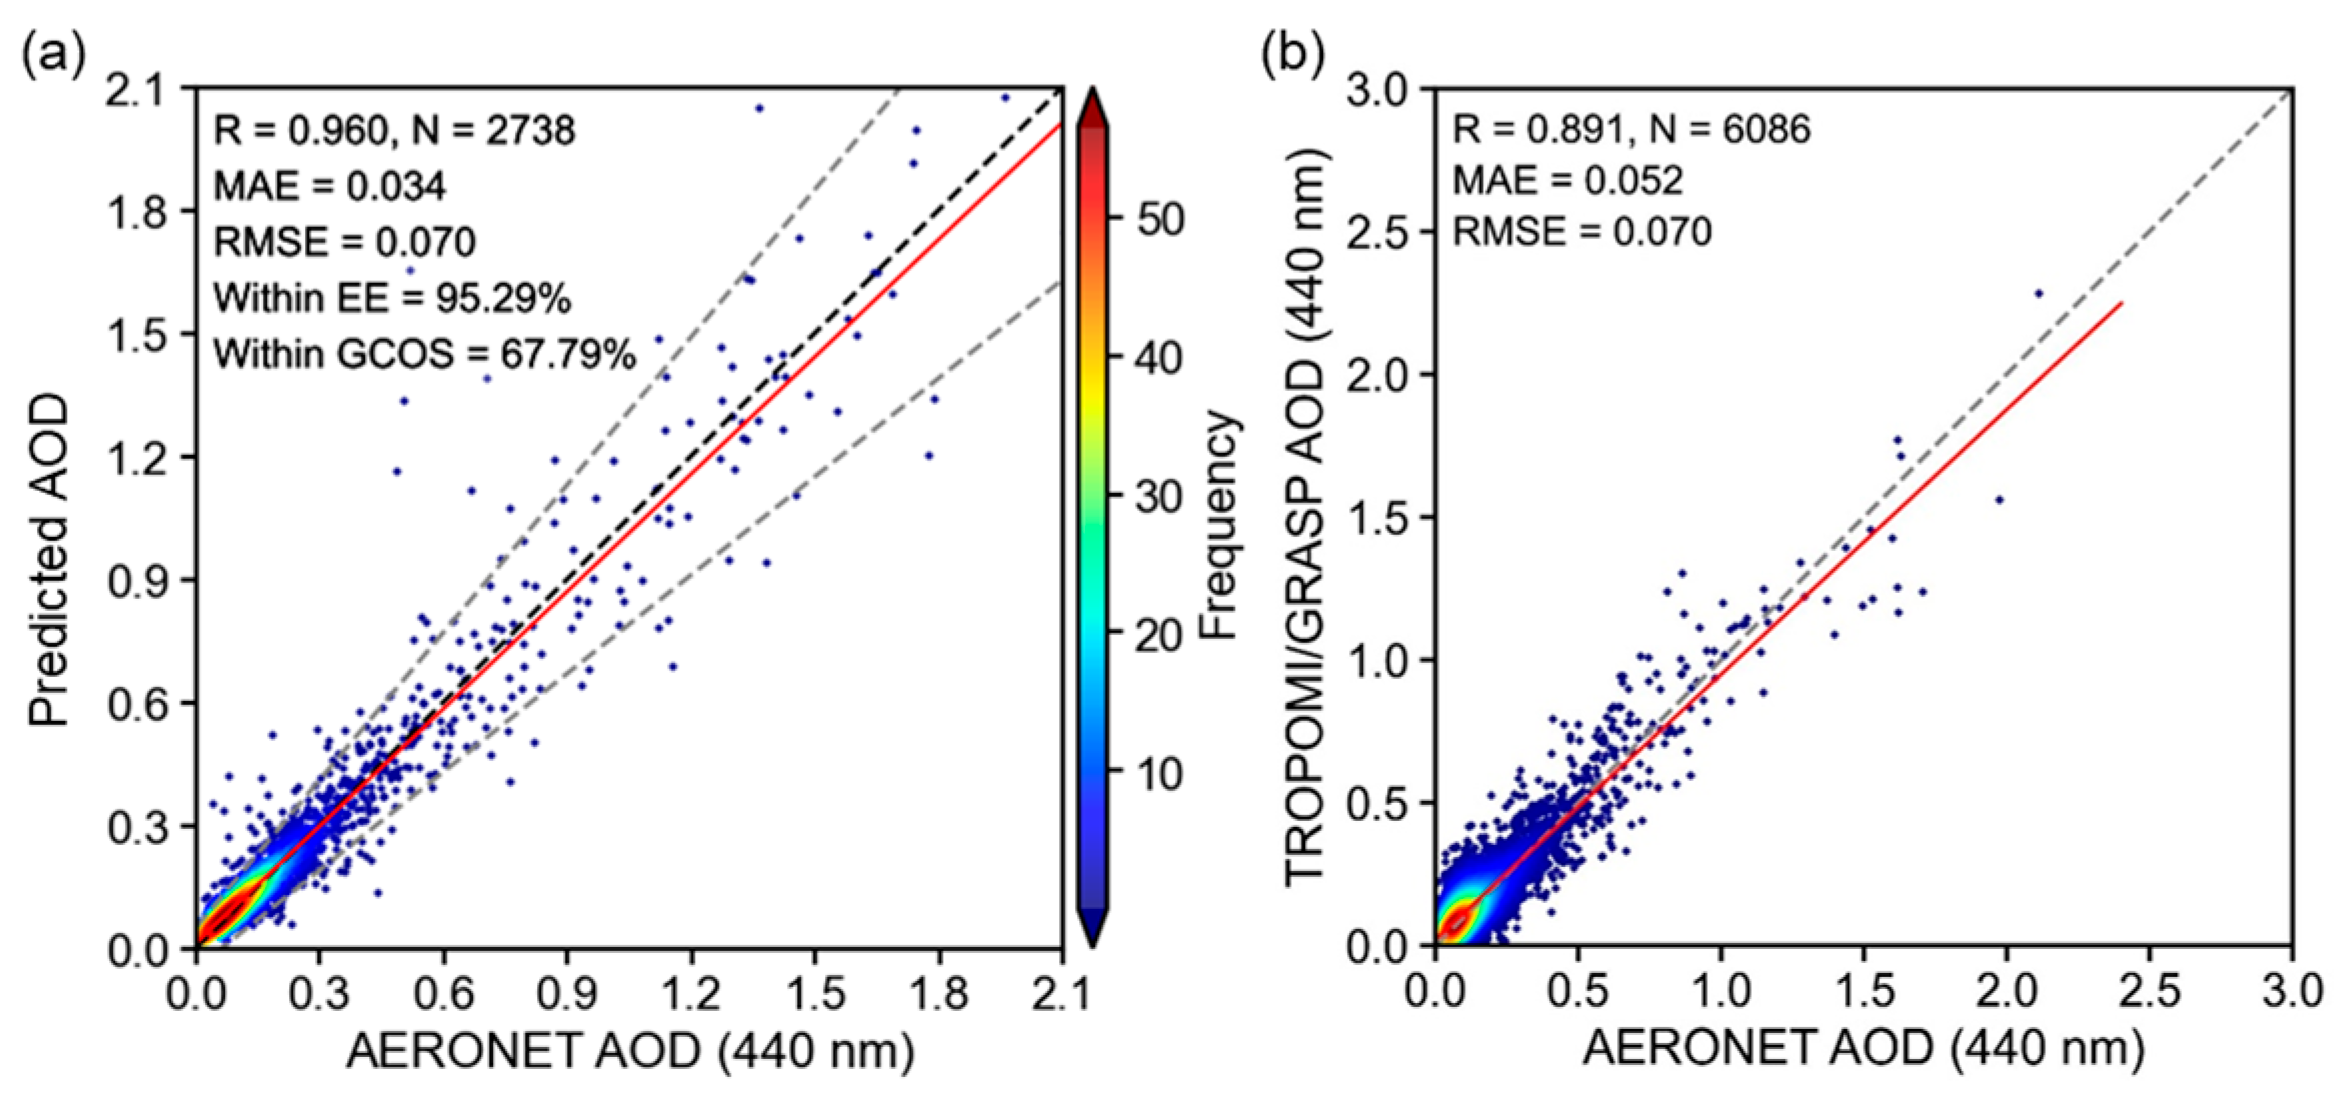
To further evaluate the accuracy and reliability of the DNN retrieval algorithm, model performance was validated against AERONET observations and systematically compared with results from the TROPOMI/GRASP algorithm. Figure 5a shows the comparison between the TROPOMI/DNN-retrieved AOD and the AERONET test dataset at 440 nm. The R of 0.960 indicates that the DNN model effectively captures AOD variations. The model yields an MAE of 0.034 and an RMSE of 0.070, reflecting an overall low error level. In addition, 95.29% of the samples fall within the expected error envelope, and 67.79% satisfy the GCOS accuracy requirement for aerosol retrieval, further demonstrating the high retrieval accuracy and robustness of the model under different aerosol conditions. Figure 5b presents the comparison between the AOD retrieved by the TROPOMI/GRASP and AERONET. The R is 0.891, with an RMSE of 0.070 and an MAE of 0.052. Validation against AERONET observations shows that the DNN-retrieved AOD overall outperforms TROPOMI/GRASP in both correlation and error control.
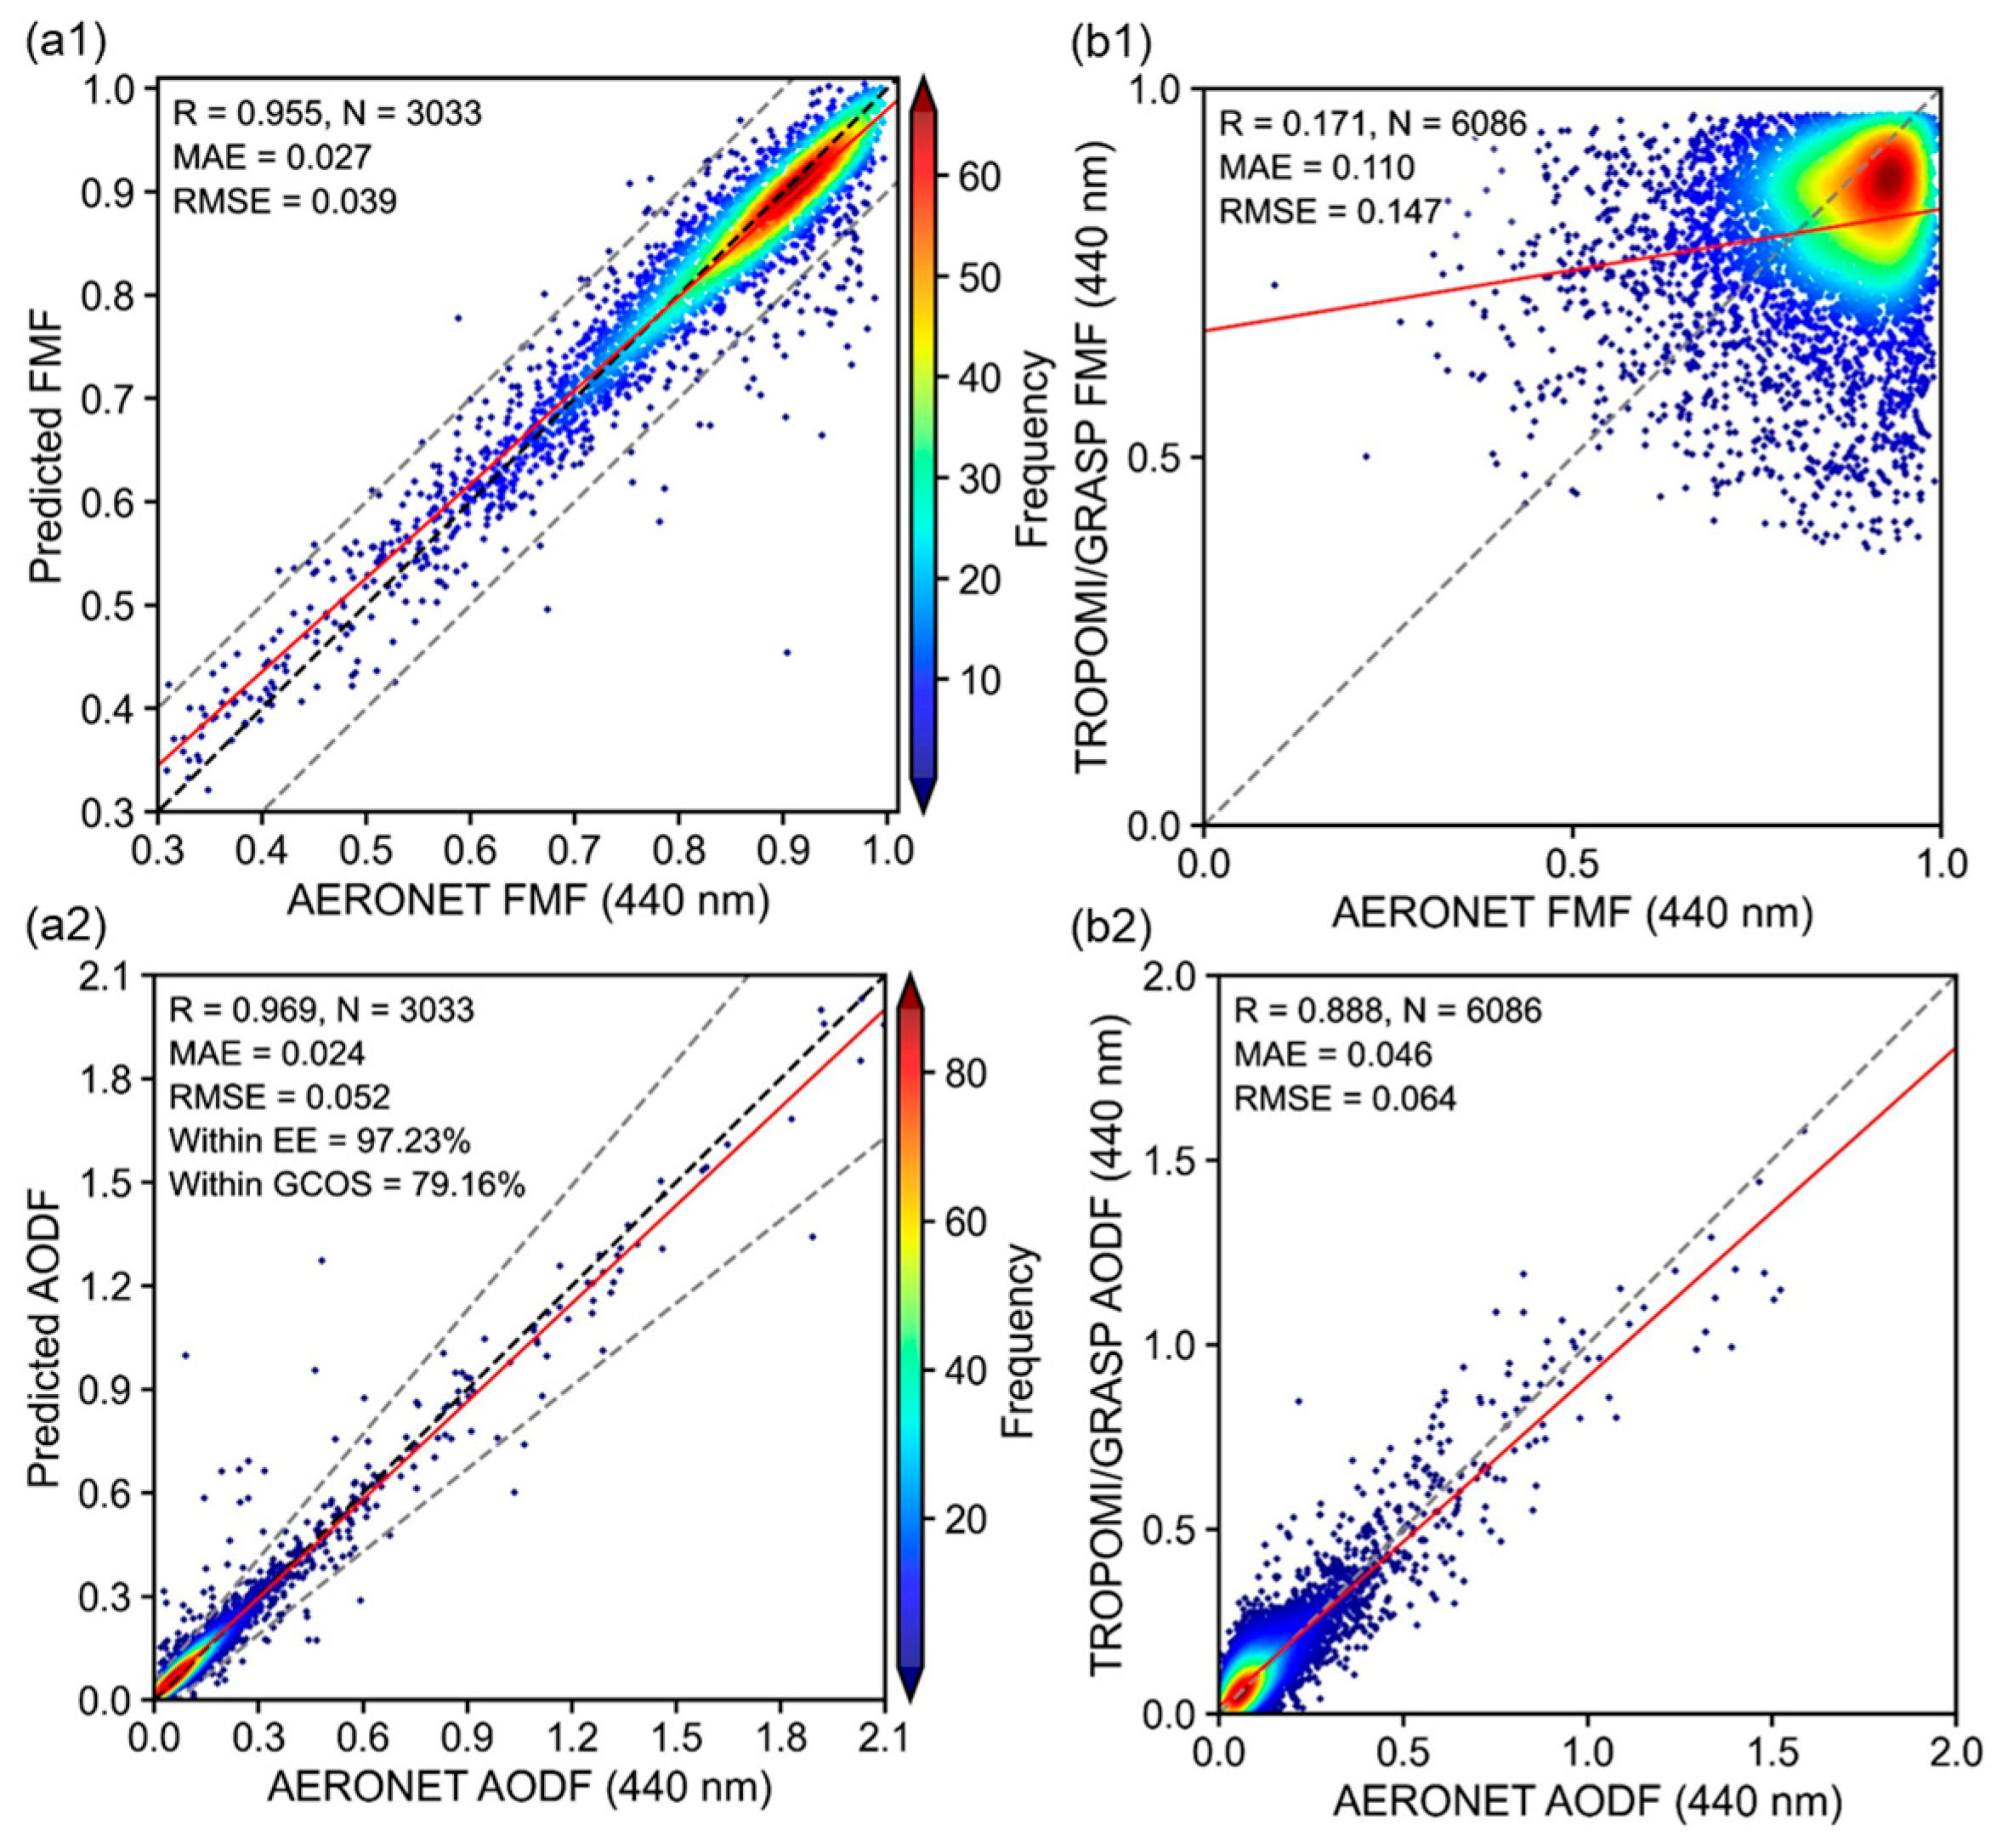
Figure 6 evaluates the retrieval accuracy of the FMF and AODF. For FMF, the TROPOMI/DNN model exhibits high correlation (R = 0.955), with an MAE of 0.027 and an RMSE of 0.039, demonstrating its effectiveness in characterizing fine-mode aerosol proportions. For AODF, the TROPOMI/DNN model yields an R of 0.969, an MAE of 0.024, and an RMSE of 0.052, indicating superior predictive consistency; notably, 97.23% of the samples fall within the EE envelope, and 79.16% satisfy the GCOS requirements. In contrast, TROPOMI/GRASP shows significantly lower performance in FMF retrieval (R = 0.171, MAE = 0.110, RMSE = 0.147). While the AODF results are more robust (R = 0.888, MAE = 0.046, RMSE = 0.064), they still fall short of the precision achieved by the TROPOMI/DNN model. The comprehensive analysis indicates that TROPOMI/DNN outperforms TROPOMI/GRASP for both FMF and AODF, with a particularly pronounced advantage in FMF retrieval.
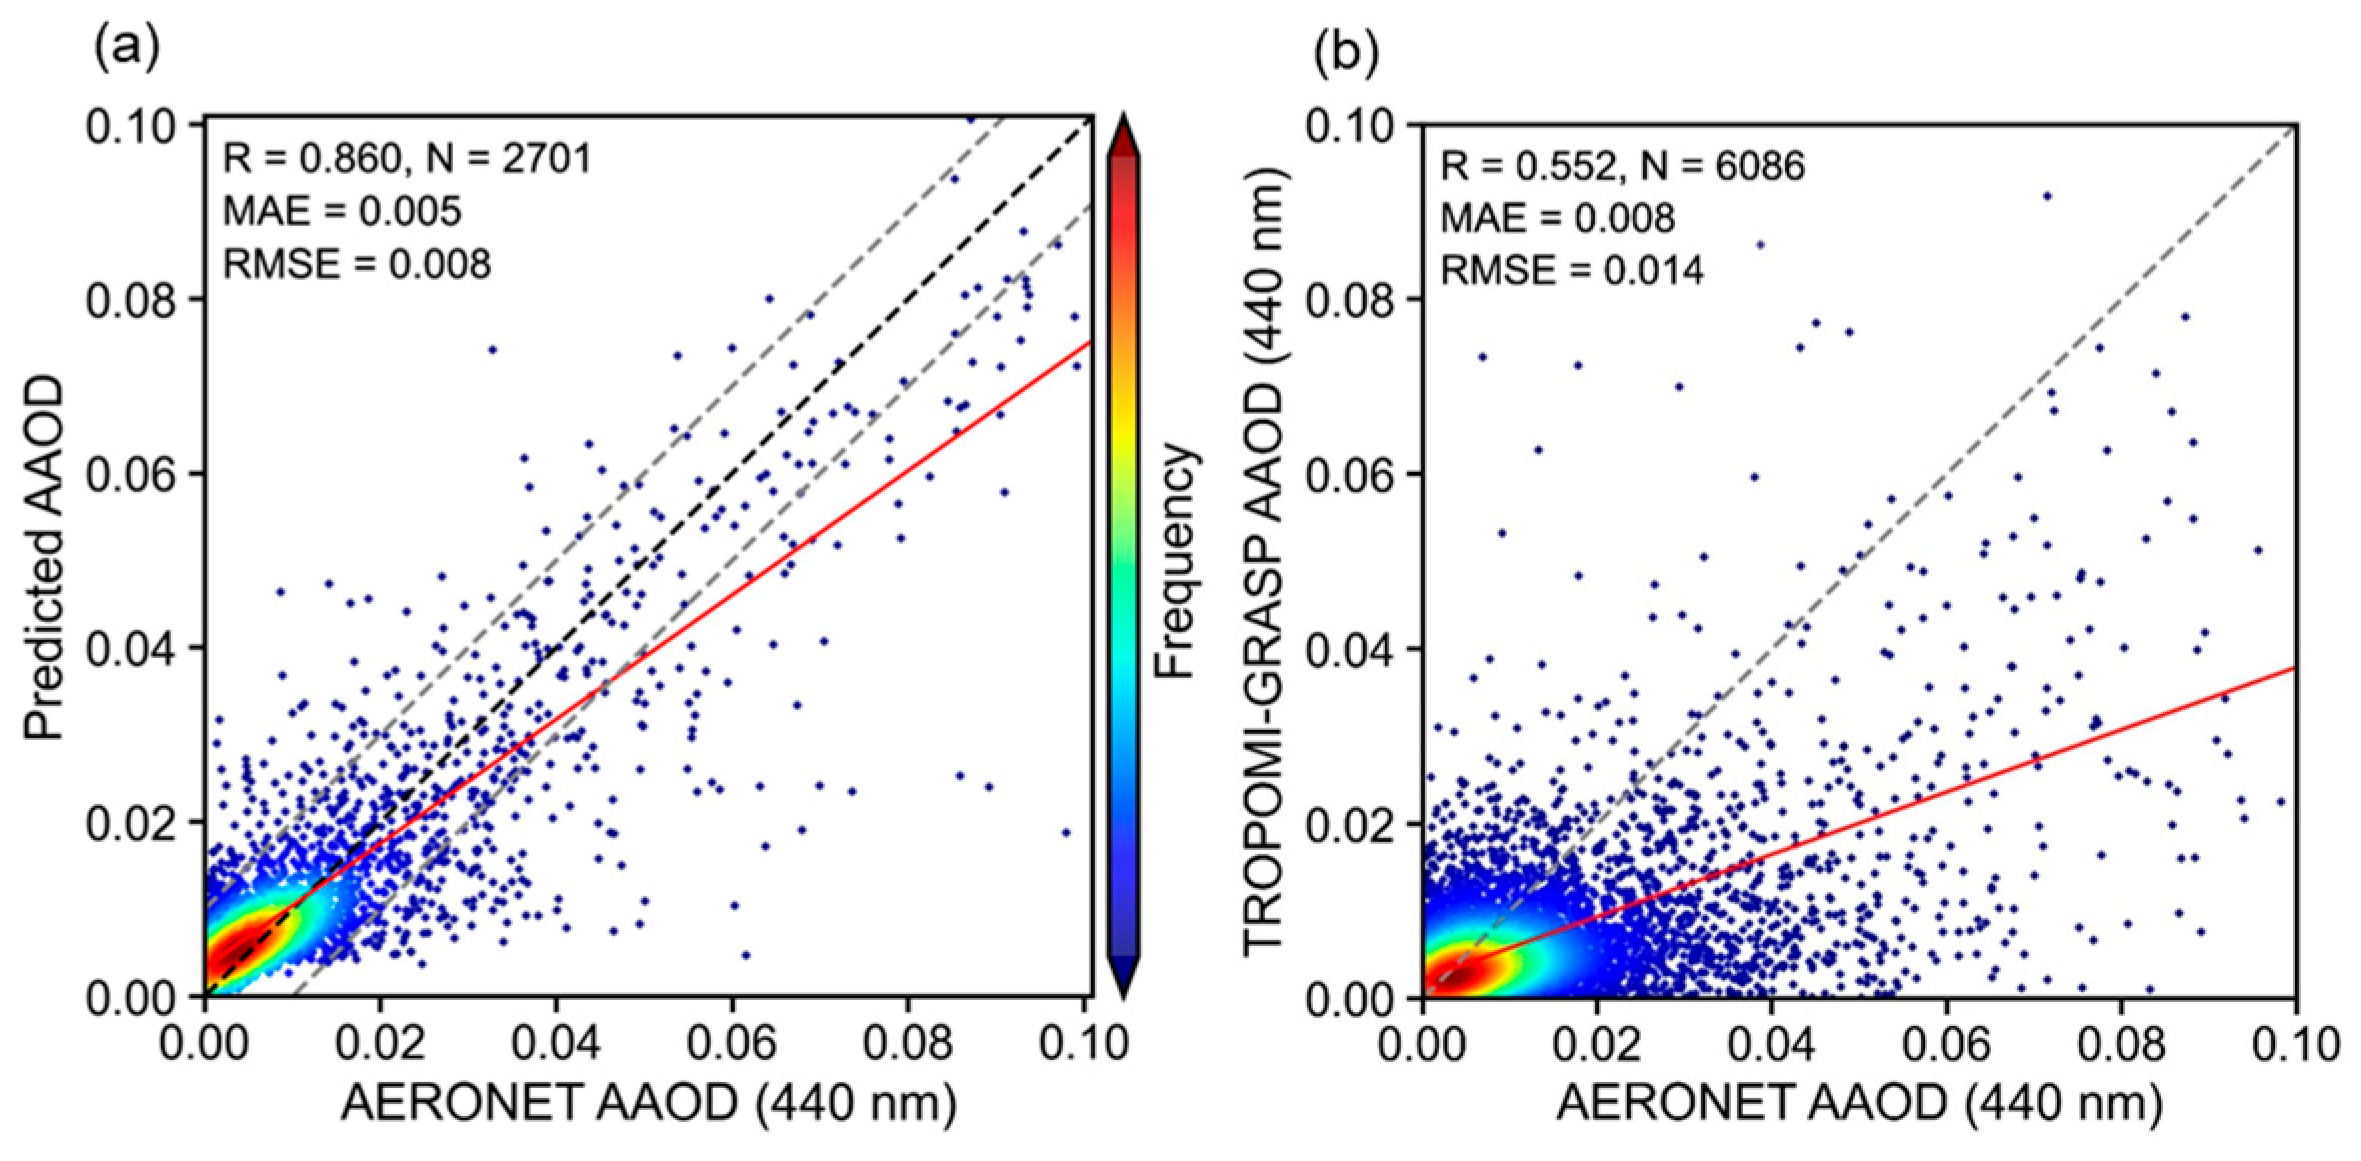
For AAOD, Figure 7a compares the retrieval results of this study with AERONET observations. The correlation coefficient reaches 0.86, with an MAE of 0.005 and an RMSE of 0.008. Figure 7b shows the corresponding comparison for the TROPOMI/GRASP physical retrieval. In this case, the correlation is lower (R = 0.552), while the MAE and RMSE increase to 0.008 and 0.014, respectively. The comparison clearly shows that, when validated against AERONET, the DNN used in this study performs markedly better than TROPOMI/GRASP in AAOD retrieval, achieving both higher correlation and lower errors. These results indicate superior retrieval accuracy and stronger stability. The difference in the number of validation samples between TROPOMI/DNN and TROPOMI/GRASP is mainly due to differences in data availability and matching conditions, including quality control criteria and spatiotemporal collocation constraints.

4.3. Spatial Comparison with Satellite Products

4.3.1. Spatial Comparison with TROPOMI/GRASP Results

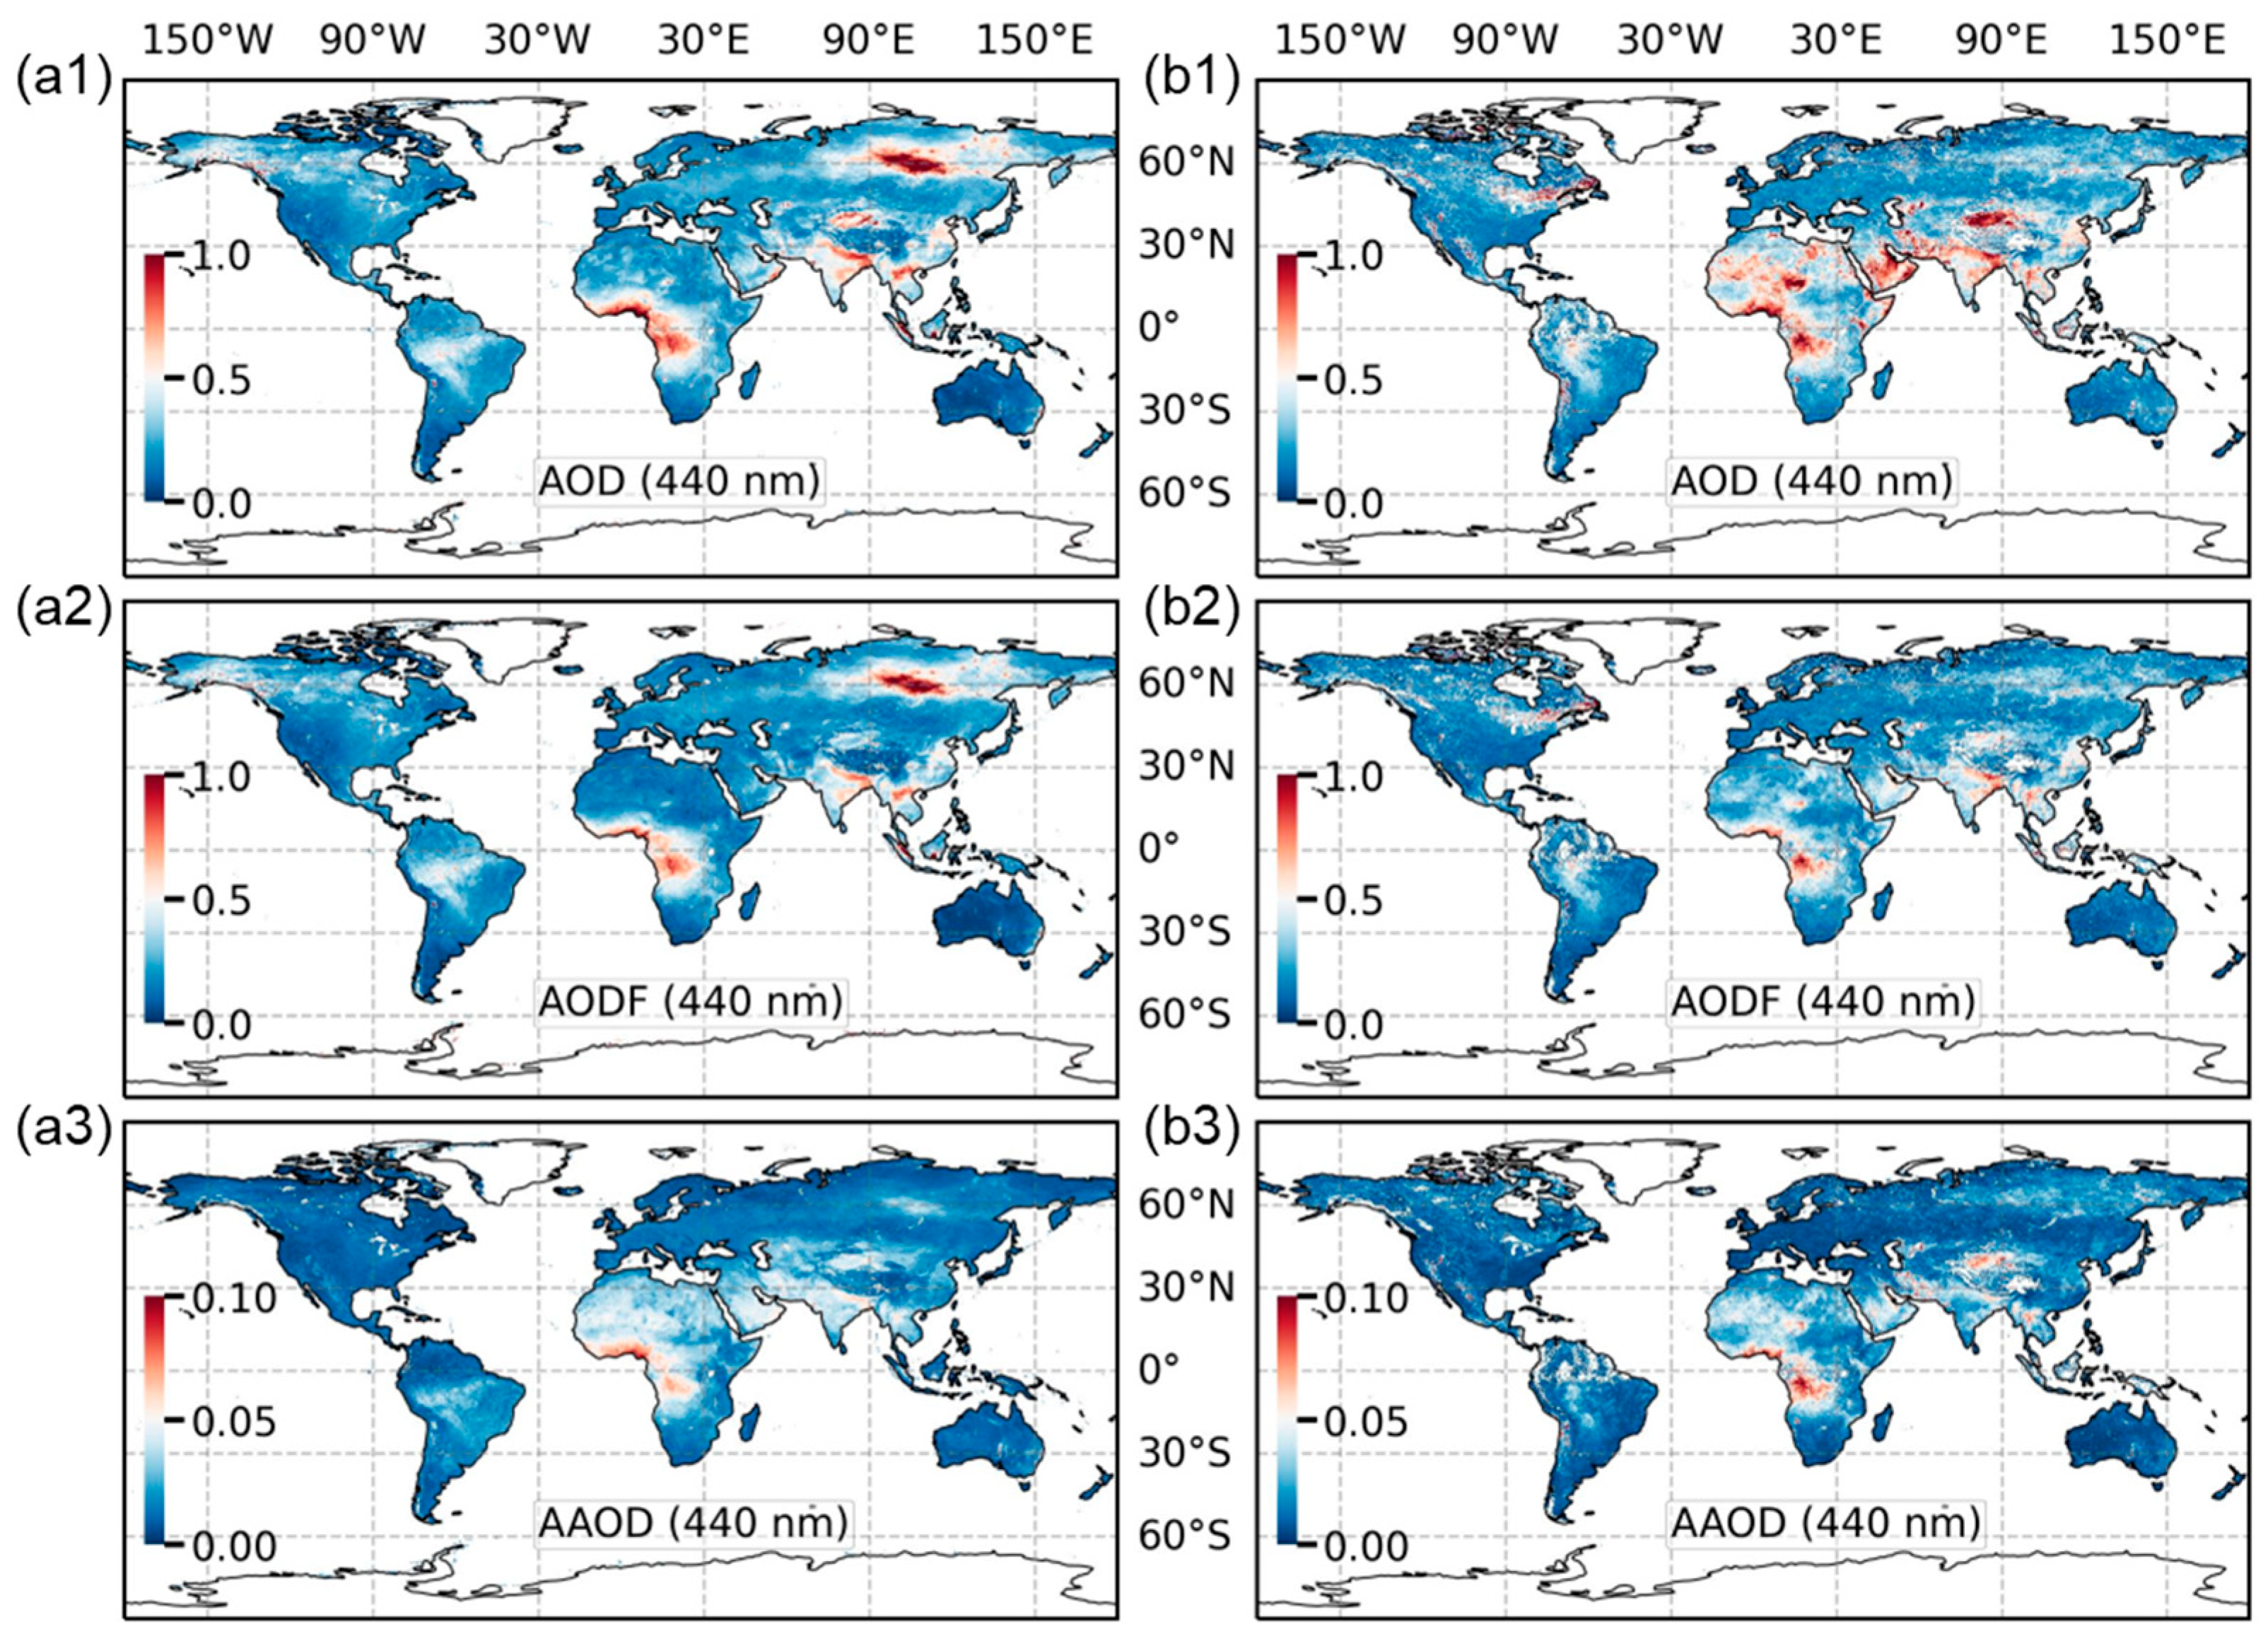
The retrieval results of this study have the same wavelength settings and spatial resolution as the TROPOMI/GRASP product, allowing a direct comparison of their spatial distributions. The currently available TROPOMI/GRASP product spans from March 2019 to November 2020. Therefore, DNN retrievals from March 2019 to February 2020 are selected for comparative validation of the model results in this section. Figure 8 shows the global spatial distributions of TROPOMI/DNN and TROPOMI/GRASP for different optical parameters at 440 nm. Meanwhile, the retrieval results of TROPOMI/DNN at all wavelengths are presented in Figure S5.
The spatial distribution of AOD reveals that high-value regions are primarily concentrated in the tropical rainforests of Africa and South America, South and Southeast Asia, and parts of Northeast Asia. These areas are significantly affected by biomass burning, leading to elevated aerosol concentrations. In contrast, relatively lower AOD values are observed across Europe, North America, and Oceania. This result shows a spatial pattern similar to that of TROPOMI/GRASP, indicating high consistency between the two methods at the large scale. In dust-affected regions, such as the Sahara, the AOD estimated in this study is lower than that from GRASP. In contrast, over Northeast Asia, the AOD retrieved in this study is substantially higher than the GRASP result, likely because aerosol concentrations from forest fire emissions are high in this region, whereas such cases are filtered out in the GRASP algorithm. The spatial pattern of AODF is generally similar to that of AOD. The AAOD retrieval results show that high-value regions are mainly concentrated in areas dominated by biomass-burning aerosols, particularly those affected by forest fire and biomass burning emissions. Meanwhile, the overall AAOD is lower than that retrieved by TROPOMI/GRASP. The global spatial comparison further indicates that the aerosol optical parameters retrieved by the proposed model and TROPOMI/GRASP exhibit high similarity at the large scale, demonstrating the capability of the proposed algorithm to capture global aerosol optical characteristics. The local differences in high- and low-value regions are likely attributable to differences in data preprocessing and input data between the two methods.
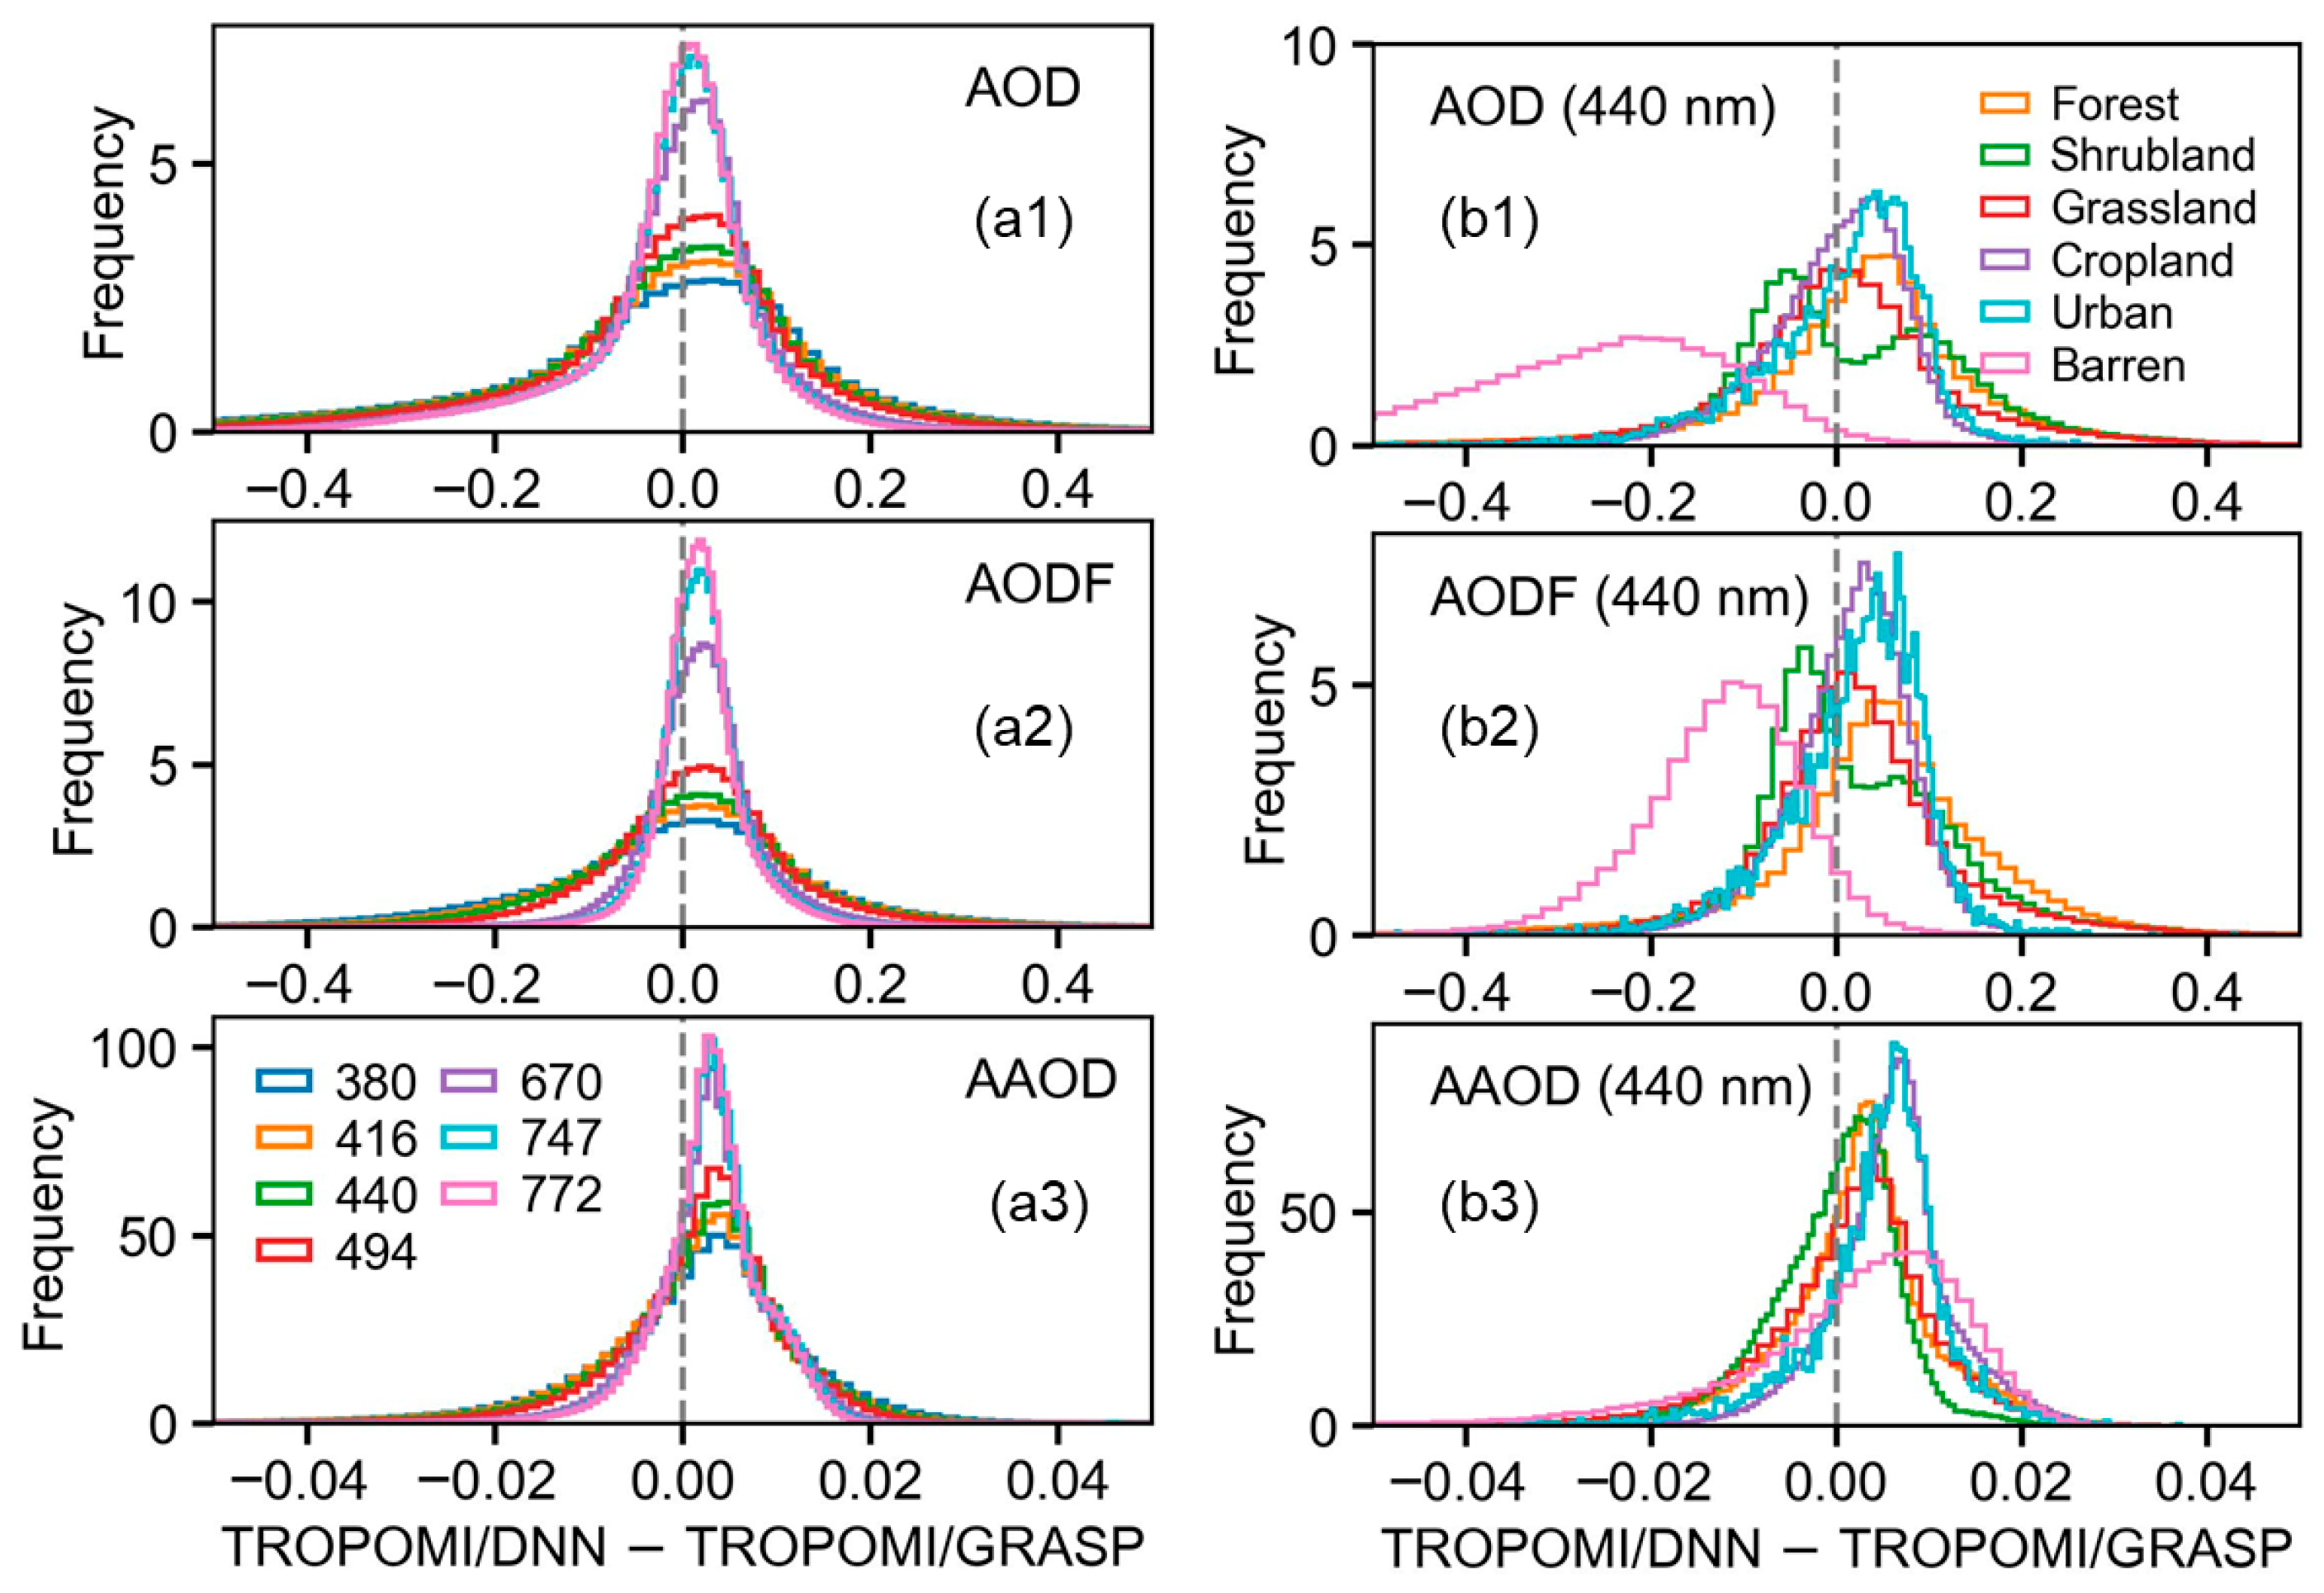
The global bias distributions between the two algorithms across multiple spectral bands are analyzed (Figure 9(a1–a3)), along with the retrieval discrepancies under different land cover types at 440 nm (Figure 9(b1–b3)). The AOD differences follow approximately a normal distribution, with a peak near zero, indicating high consistency between the two algorithms over most pixels. The distribution becomes broader at shorter wavelengths (380–416 nm), whereas differences are smaller at longer wavelengths (670–772 nm), reflecting differences in the scattering characteristics of fine and coarse particles. The AODF differences are slightly shifted toward positive values, indicating that the TROPOMI/DNN algorithm is more sensitive to fine-mode particles, yielding systematically higher AODF estimates. The AAOD difference distribution is more concentrated, indicating that TROPOMI/DNN exhibits a relatively conservative yet stable behavior in identifying absorbing aerosols. The differentiated analysis of aerosol retrieval discrepancies across land cover types (Figure 9(b1–b3)) shows that, except for barren land, the differences in aerosol optical parameters between TROPOMI/DNN and TROPOMI/GRASP are relatively small across other land cover types. Specifically, the AOD results align closely with TROPOMI/GRASP, while AODF and AAOD exhibit an overall overestimation. Notably, the different distribution over shrublands displays a bimodal pattern, which may be related to varying shrub species and regional characteristics. Over barren land, there is a significant discrepancy between the AOD and AODF results; this is likely attributed to the relatively poor performance of our model in dust-dominated regions.

4.3.2. Spatial Comparison of AOD

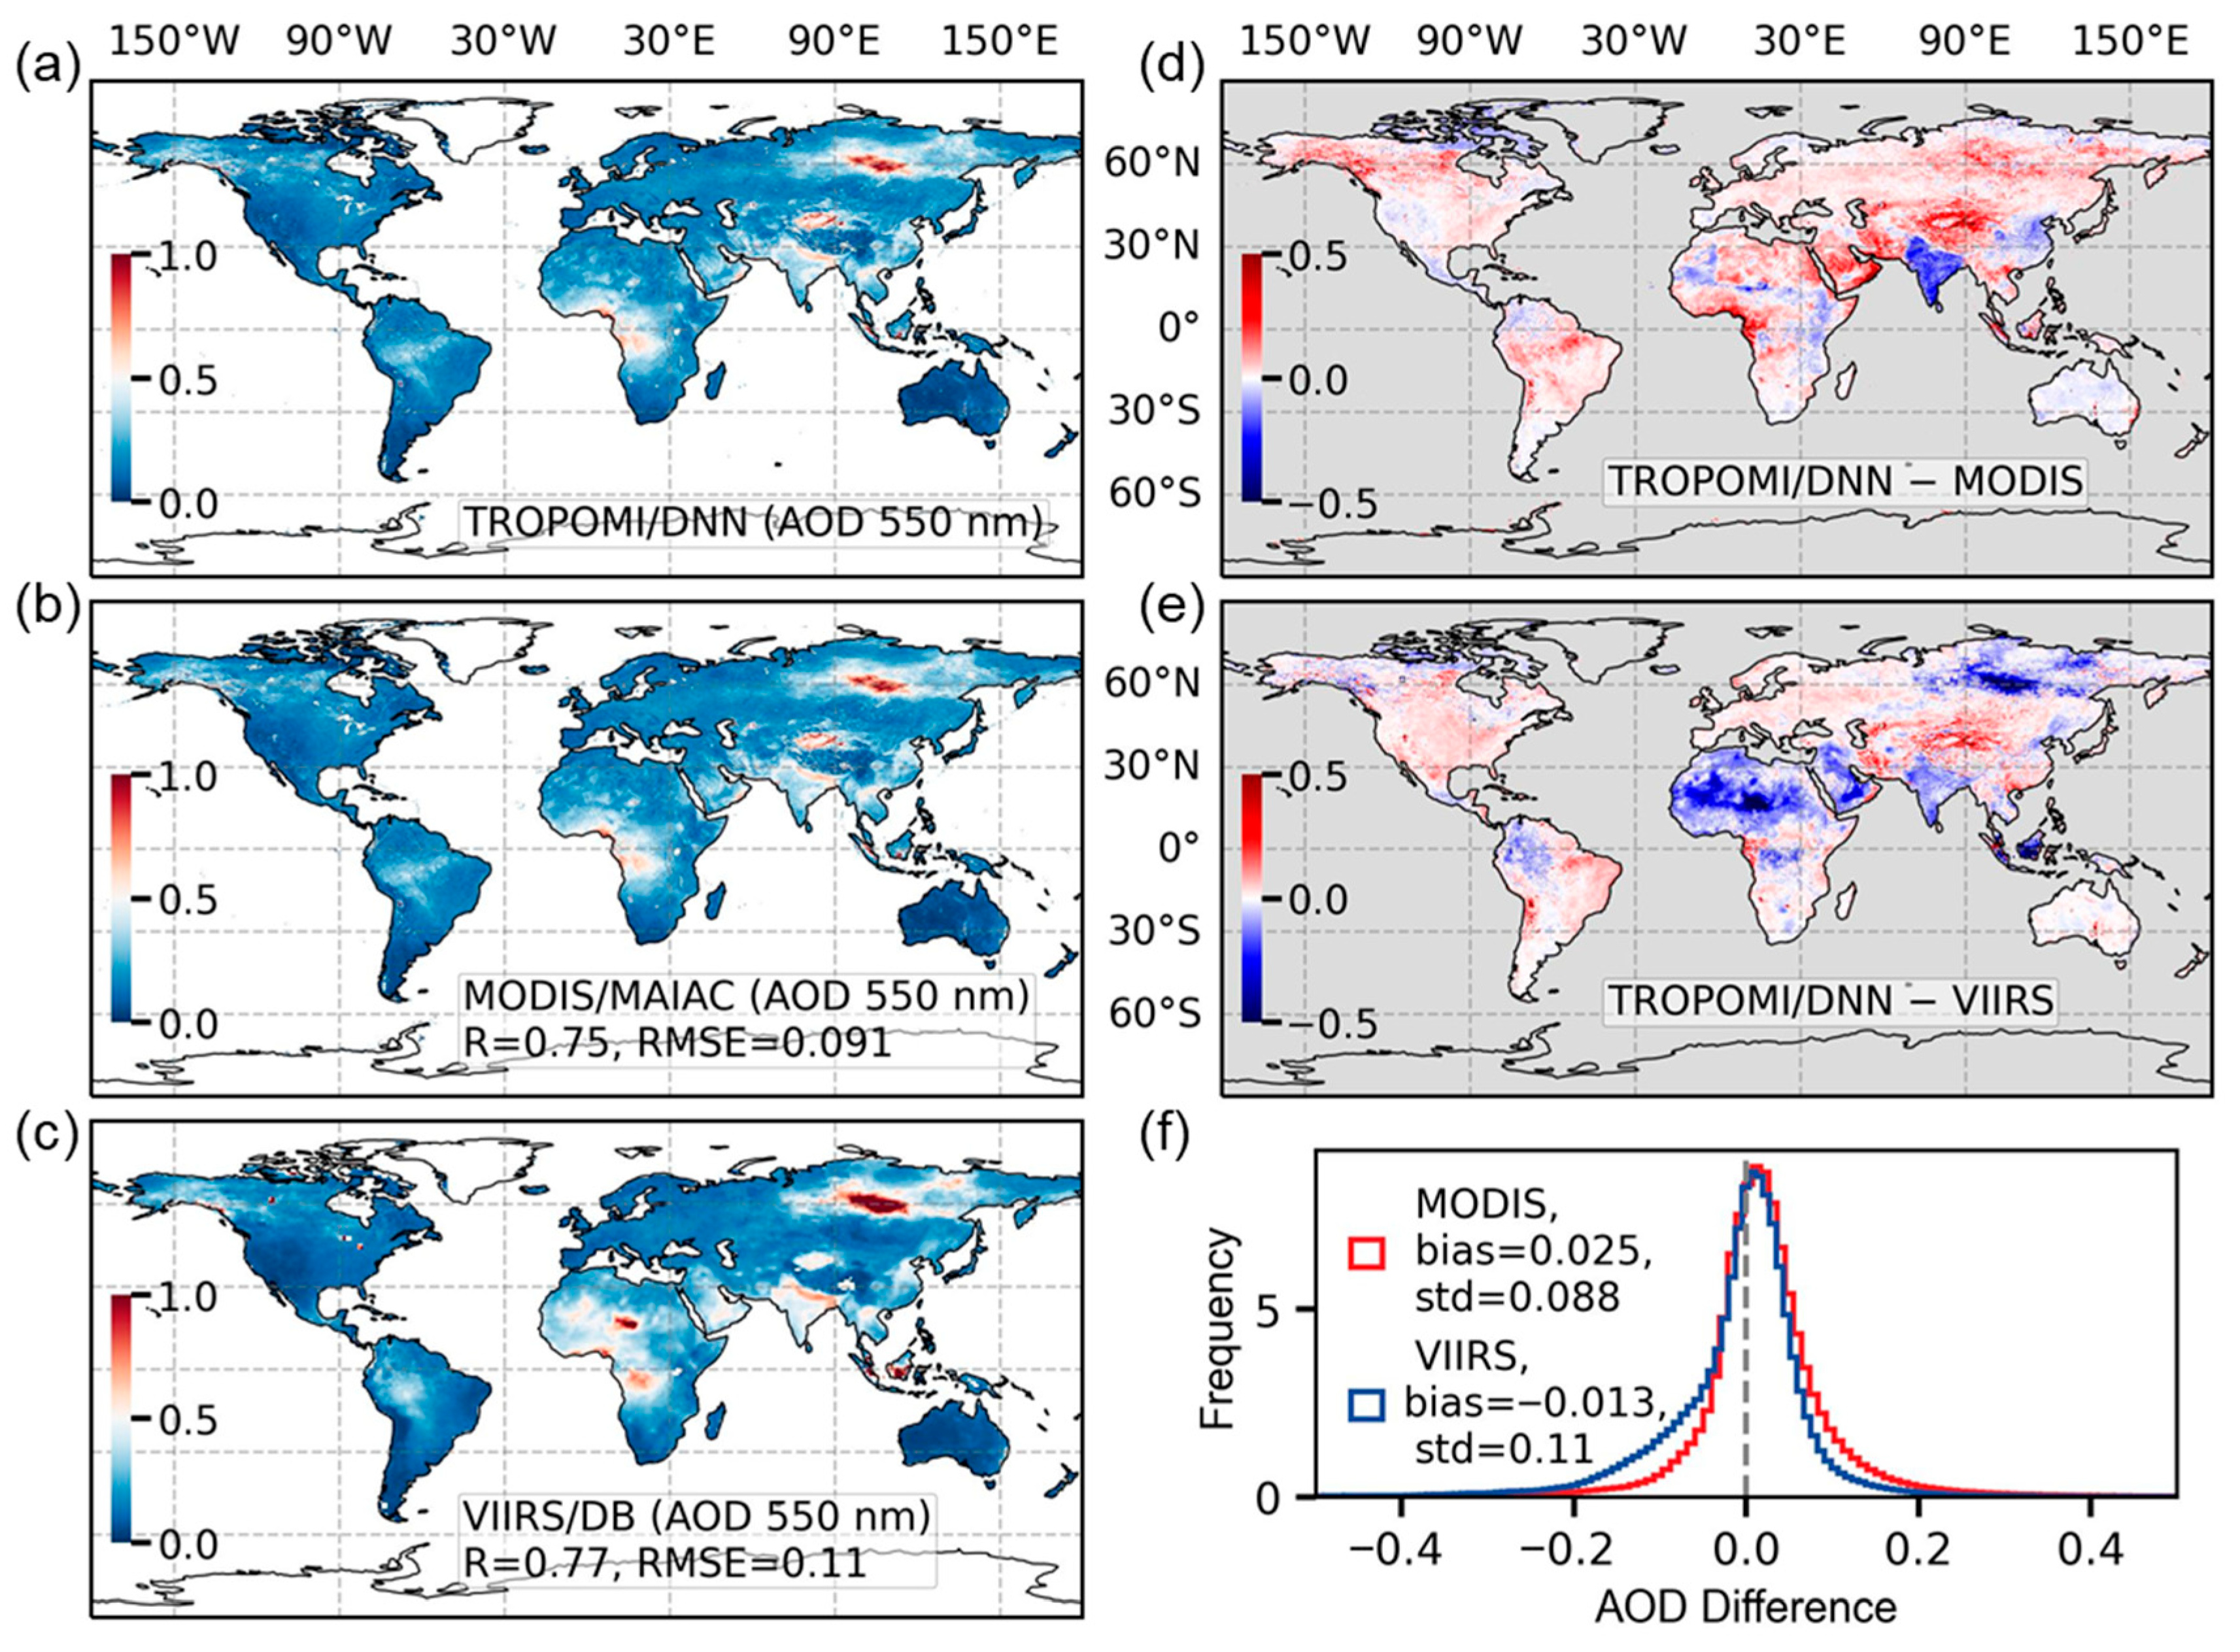
Based on data from 2019, this study selected MODIS/MAIAC and VIIRS/DB AOD products for a comparative analysis of global annual mean spatial distributions. Figure 10 presents the global spatial distribution of AOD at 550 nm in 2019 and reports the R and RMSE between TROPOMI/DNN and the MODIS and VIIRS products. In addition, the figure shows the pixel-by-pixel difference distributions and their overall probability density distributions. These results highlight both the similarities and differences among the satellite retrieval products. TROPOMI/DNN shows high spatial consistency with MODIS and VIIRS at the global scale, particularly in regions with high AOD. The elevated AOD in these areas reflects the combined effects of aerosol sources, including industrial emissions, biomass burning, and dust, further confirming the reliability of the TROPOMI/DNN model for identifying large-scale aerosol distribution patterns. Quantitatively, the pixel-by-pixel R between TROPOMI/DNN and MODIS and VIIRS are 0.75 and 0.77, respectively, with corresponding RMSE values of 0.091 and 0.11. These results are comparable to the performance reported for the TROPOMI/GRASP product [22]. Statistical analysis of the global probability density distributions of the differences further indicates that the AOD retrieved by TROPOMI/DNN exhibits a slight systematic overestimation relative to both MODIS and VIIRS. The overall biases (standard deviations, std) relative to the two satellite products are 0.025 (0.088) and −0.013 (0.11), respectively. By comparison, the corresponding biases of the TROPOMI/GRASP algorithm are −0.032 and −0.002, while the stds (0.10 and 0.14) are broadly comparable to those obtained in this study. These comparisons indicate that the TROPOMI/DNN model achieves a level of overall accuracy and stability in global AOD retrieval comparable to that of existing mature physical retrieval algorithms.
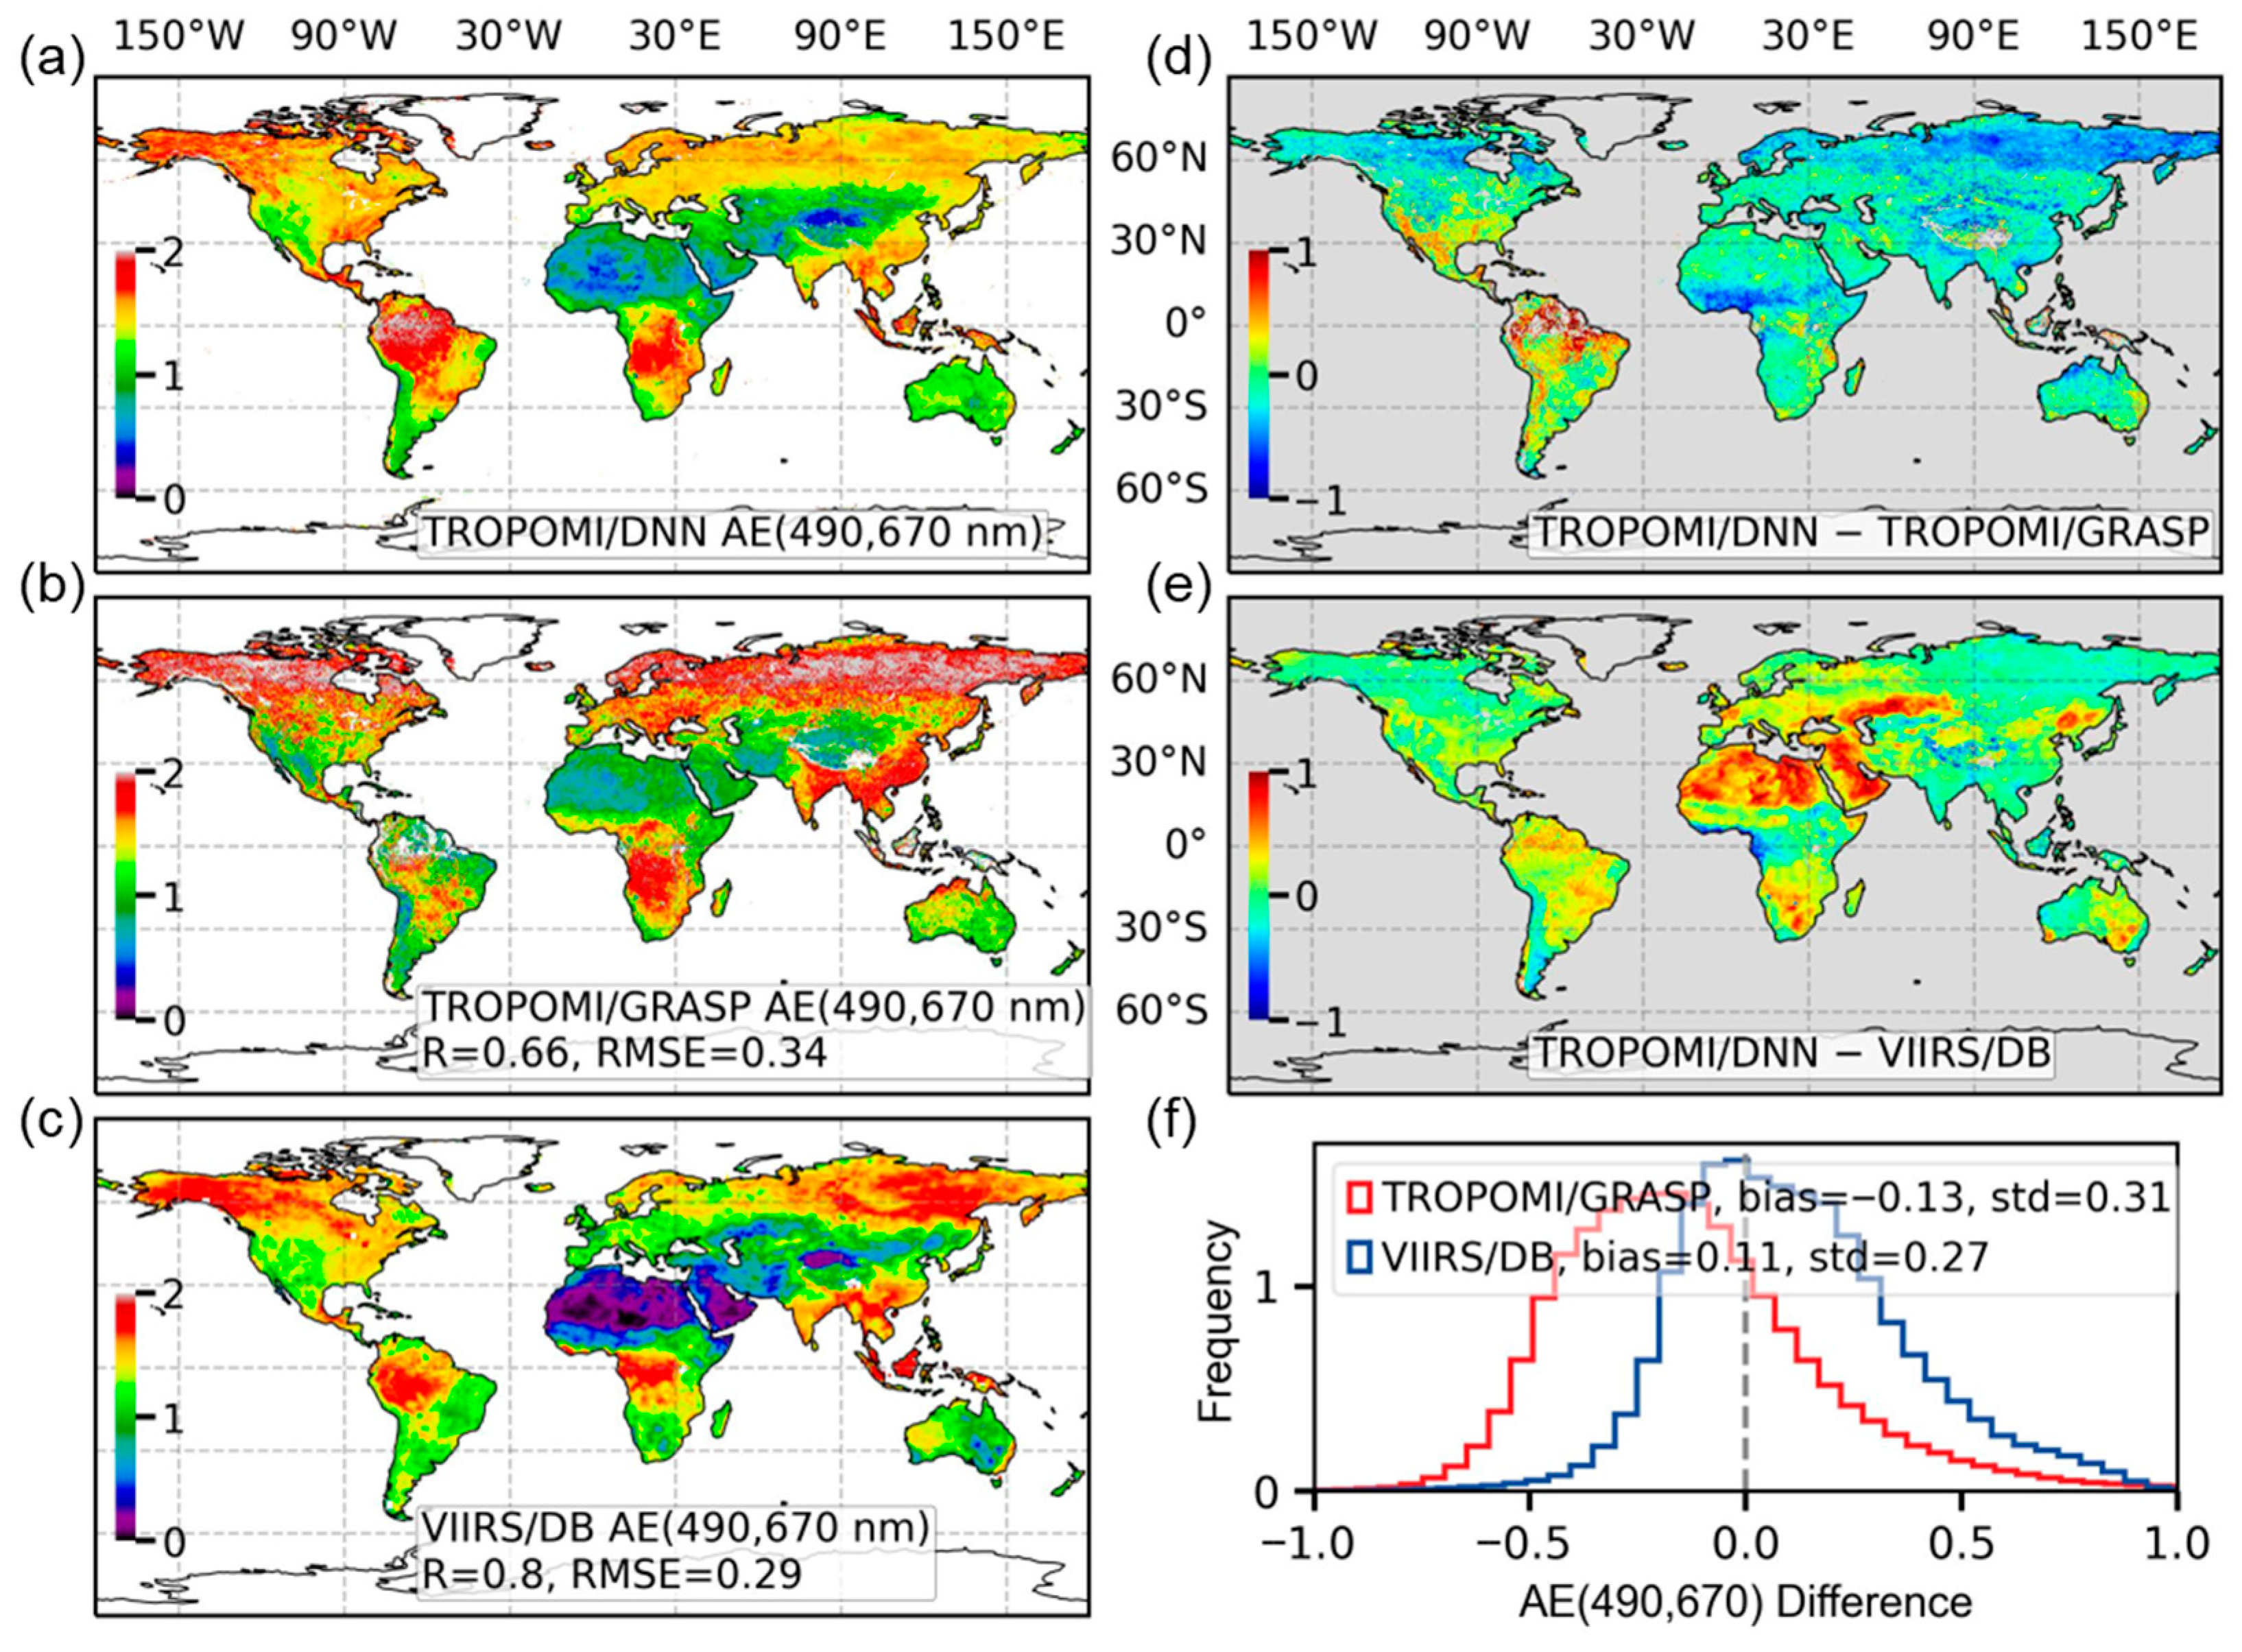
The AE reflects the wavelength dependence of AOD and the combined influence of particle size distribution. In this study, the AE between 490 and 670 nm derived from TROPOMI/DNN AOD was compared with the TROPOMI/GRASP and VIIRS/DB products to analyze its spatial distribution and differences (Figure 11). The TROPOMI/DNN AE generally ranges between 1 and 1.7, whereas those from TROPOMI/GRASP and VIIRS range from 1.0–2.0 and 0.4–1.5, respectively. The R (RMSE) of TROPOMI/DNN with these two products is 0.66 (0.34) and 0.80 (0.29), respectively. The AE differences between TROPOMI/DNN and the two reference products are mostly within the range of −1 to 1. Positive differences are mainly found over northern Africa, South America, and Asia, whereas slightly lower values occur over central Africa, South Asia, Central-South Asia, and parts of Australia. In addition, compared with TROPOMI/GRASP, TROPOMI/DNN shows lower AE values over the high latitudes of the Northern Hemisphere. The mean biases relative to TROPOMI/GRASP and VIIRS are −0.13 and 0.31, with a standard deviation of 0.11 and 0.27, respectively. The probability density curves further show that the overall discrepancy between this study and TROPOMI/GRASP is relatively large, with generally lower AE values in the TROPOMI/DNN results.

4.4. Application to Extreme Wildfire Events

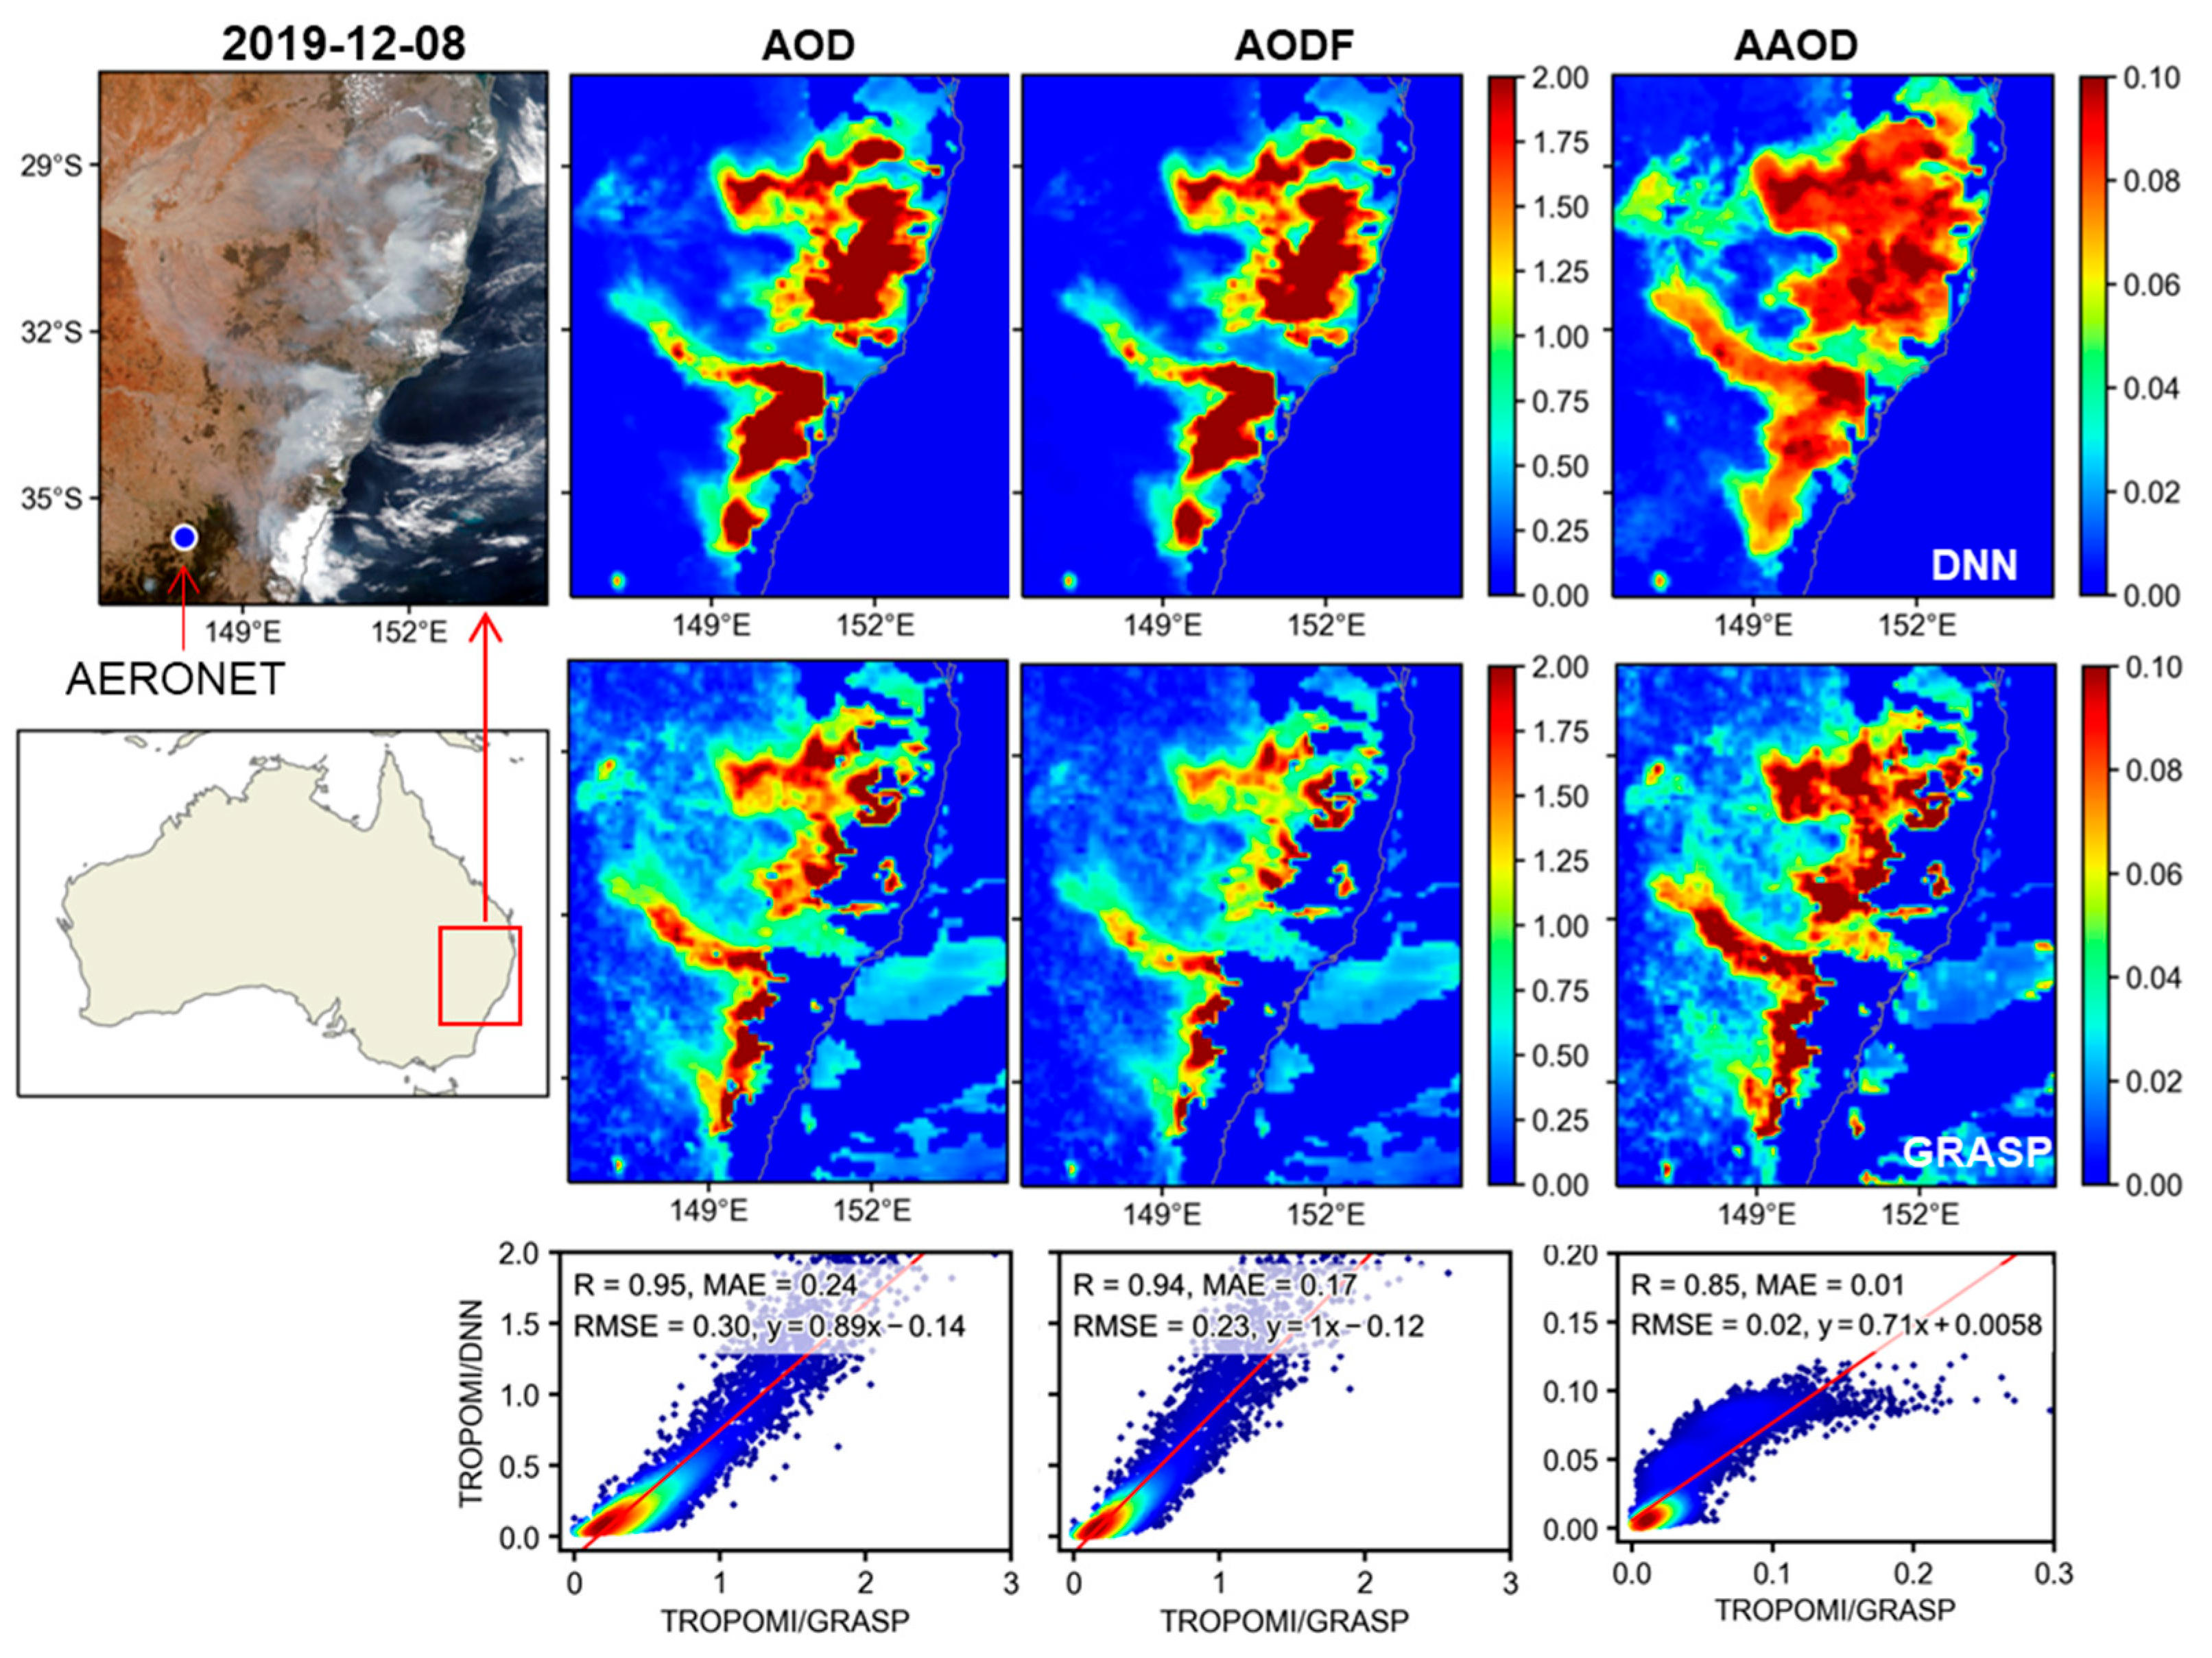
A comparative analysis was further conducted between the retrieval results of this study and those of TROPOMI/GRASP using forest fire case studies. Severe wildfires occurred along the east coast of Australia from September 2019 to February 2020. Figure 12 displays the satellite true-color imagery from the overpass on 8 December 2019, which includes AERONET AOD observations (represented by blue dots in the imagery), alongside the aerosol optical parameter retrieval results from TROPOMI/DNN and TROPOMI/GRASP. The remote sensing imagery clearly illustrates the emission of massive amounts of smoke on that day, which subsequently dispersed westward. The comparison shows that both TROPOMI/DNN and TROPOMI/GRASP successfully identify aerosols within the wildfire smoke and exhibit similar overall spatial patterns, although local differences remain. TROPOMI/DNN achieves more complete coverage of the smoke-affected region, with particularly better performance in areas with high aerosol loading. For pixels with TROPOMI/DNN AOD > 0.5, 33.32% of the corresponding TROPOMI/GRASP pixels were recovered. The pixel-by-pixel quantitative comparison further shows that the R for AOD, AODF, and AAOD are 0.95, 0.94, and 0.85, respectively, with corresponding RMSE values of 0.30, 0.23, and 0.02, indicating good agreement between the two algorithms. The AERONET AOD observation shown in the figure is also closer to the retrieval result of this study. Figure S6 illustrates a comparative analysis of a small-scale bushfire event in southern Australia on January 1, 2020. In this case, the TROPOMI/DNN algorithm exhibits excellent spatial continuity, effectively capturing the spatial variation characteristics of the smoke plumes and aerosol concentrations.
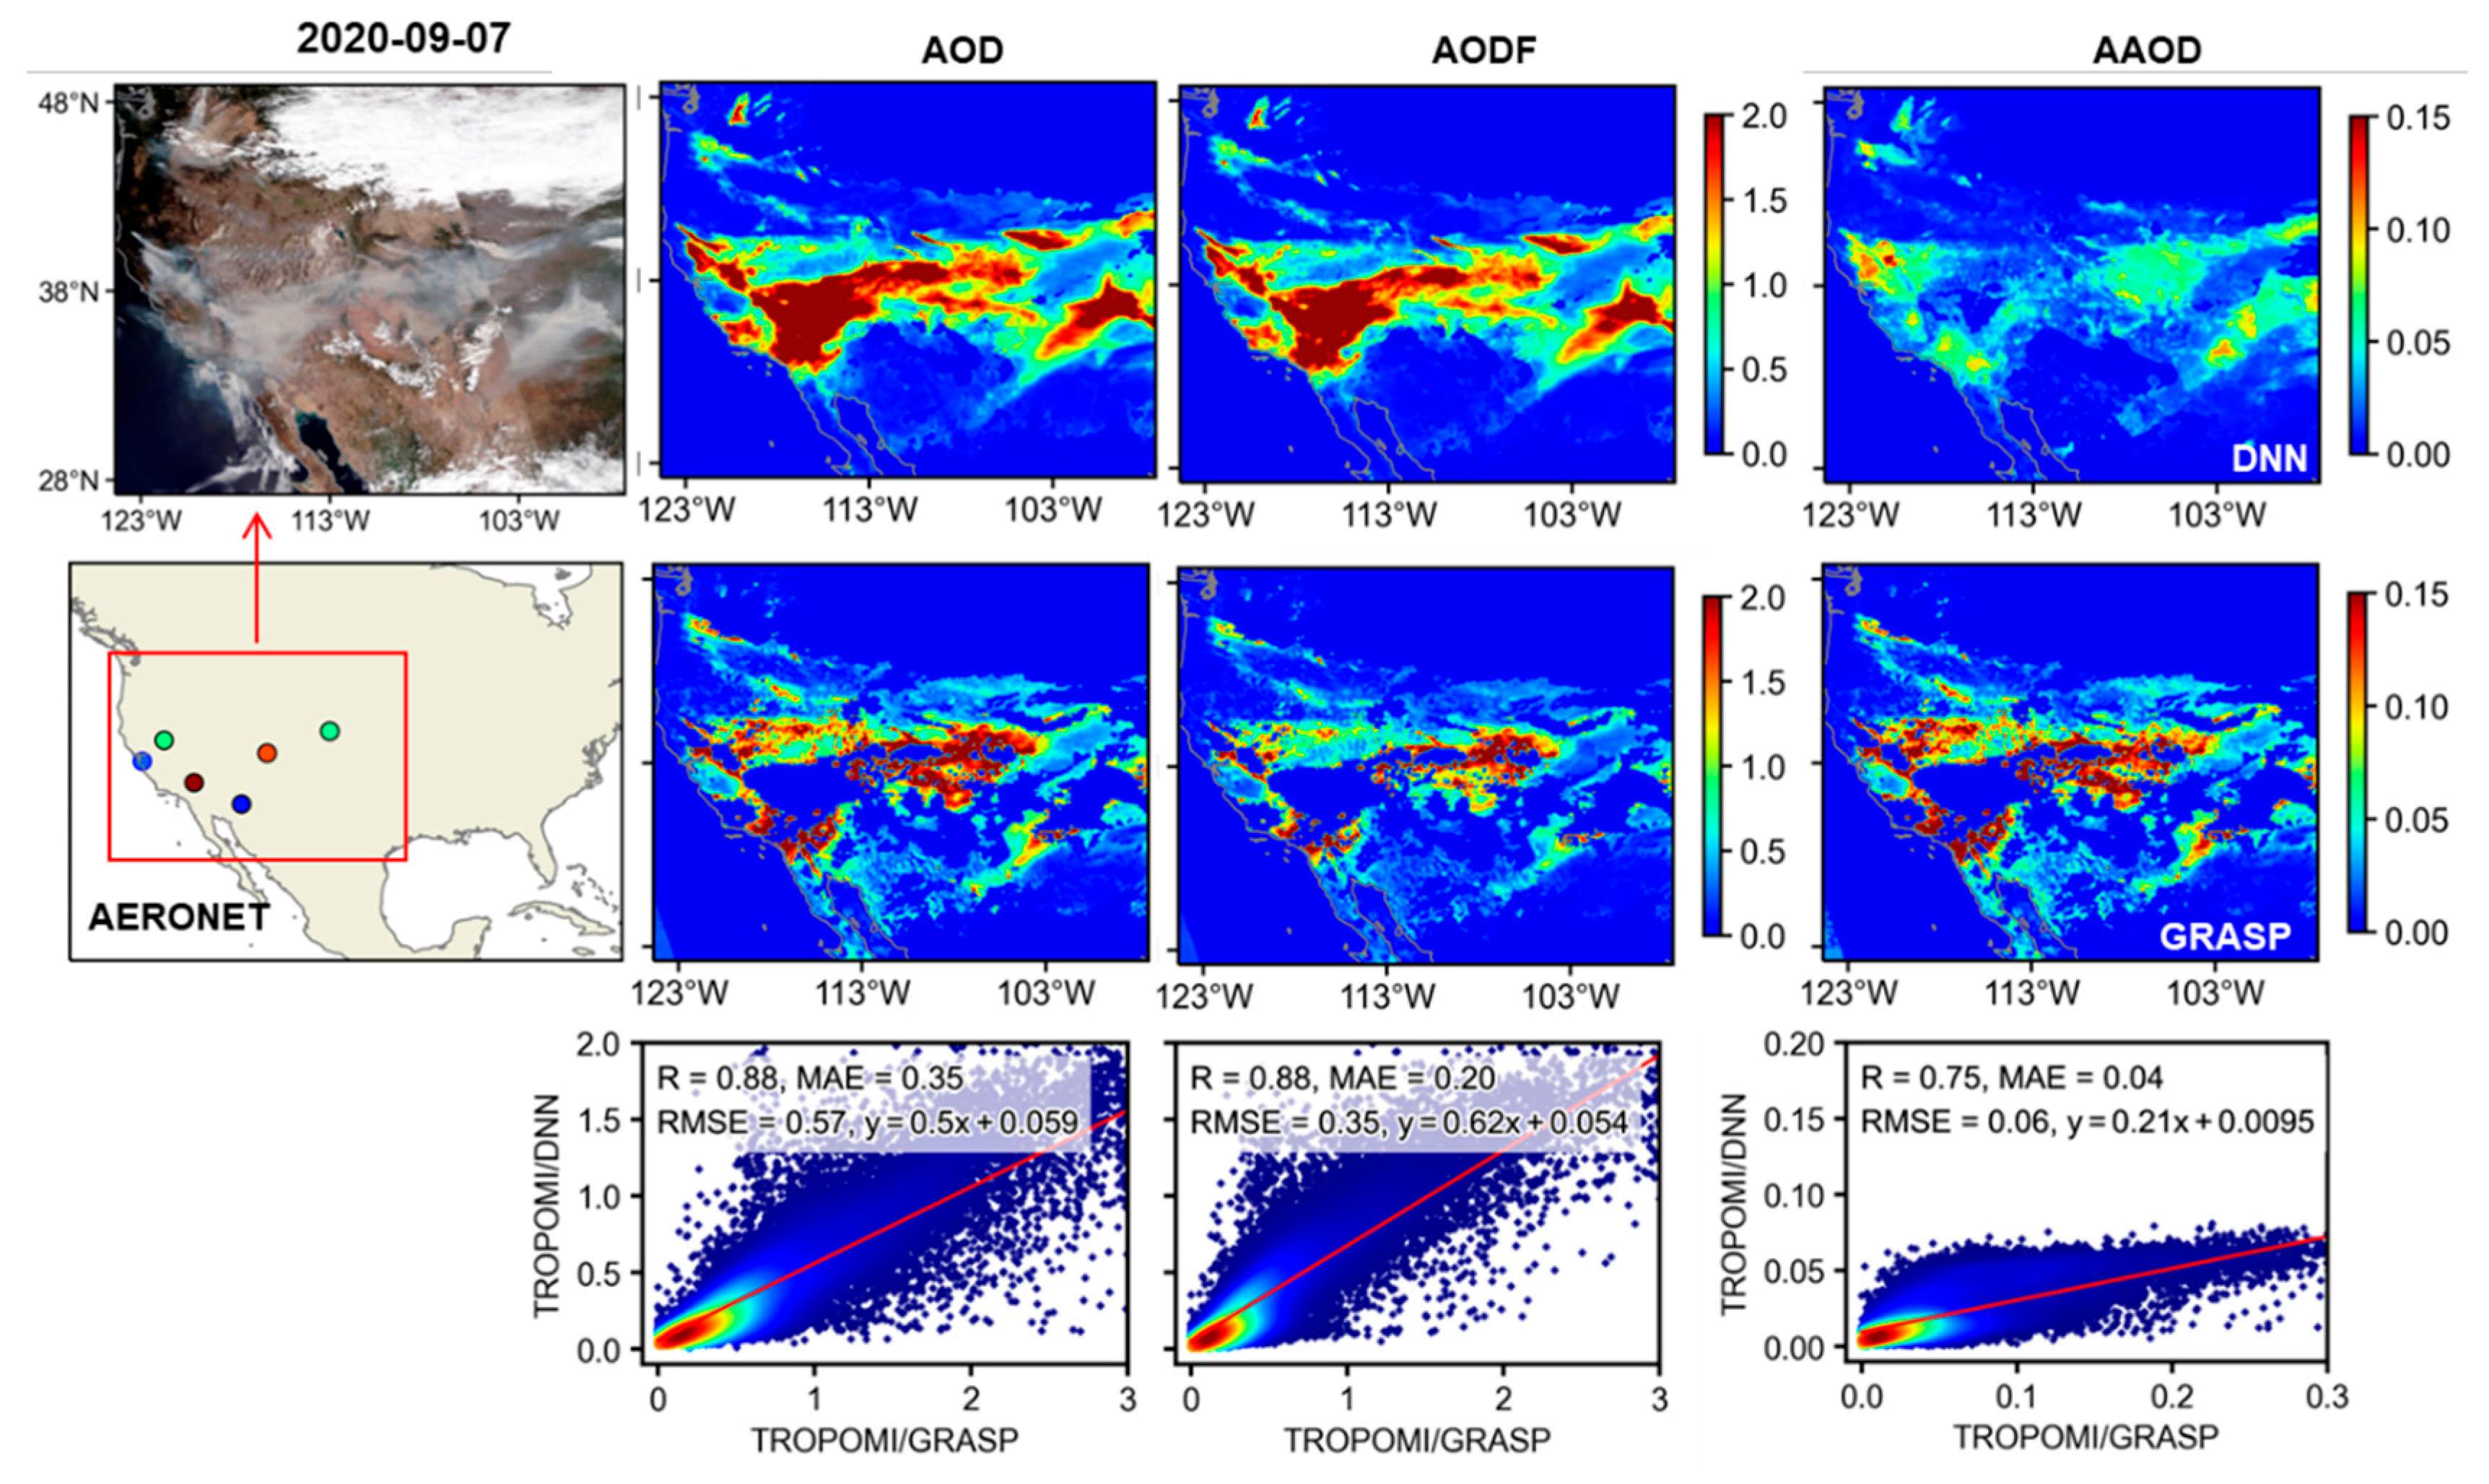
Figure 13 displays the aerosol optical parameters retrieved by different algorithms during a satellite overpass on 7 September 2020, capturing the California wildfires. Remote sensing imagery reveals that massive smoke plumes generated by the fires blanketed vast regions of the western United States. Spatial continuity analysis indicates that the TROPOMI/DNN achieves superior global spatial continuity in its estimations. In contrast, the TROPOMI/GRASP yielded significantly fewer effective retrieval results. For pixels with TROPOMI/DNN AOD > 0.5, 57.06% of the corresponding TROPOMI/GRASP pixels were recovered. The pixel-by-pixel comparison shows that the R between the two algorithms for AOD, AODF, and AAOD are 0.88, 0.88, and 0.75, respectively, with corresponding RMSE values of 0.57, 0.35, and 0.06. The AAOD results exhibit an underestimation. In addition, AOD observations from multiple AERONET stations show good agreement with the TROPOMI/DNN retrievals. Figure S7 presents the comparative analysis of a small-scale wildfire event near the northwest coast of California, USA, on 2 September 2020. This case further demonstrates the advantage of the TROPOMI/DNN algorithm in monitoring small-scale biomass burning events, particularly in maintaining spatial continuity and reducing surface interference.

5. Discussion

The SHAP analysis reveals distinct physical drivers for each aerosol parameter. For AOD, the dominance of observation geometry parameters, particularly VZA and SZA, is consistent with radiative transfer theory, which suggests that the incident and viewing geometries determine the atmospheric optical path length and multiple-scattering pathways, thereby influencing the cumulative scattering and absorption effects of aerosols within the surface-atmosphere system. This mechanism was confirmed in numerous radiative transfer simulations and satellite retrieval studies [23,35]. In contrast, FMF retrieval is largely driven by spectral indices derived from wavelength dependence, such as AE-based features (e.g., AE_670_747 and AE_494_772), which effectively characterize aerosol particle-size distributions and are key indicators for distinguishing fine-mode and coarse-mode aerosols [45]. Meanwhile, for AAOD, the importance of DOY likely reflects the strong seasonality of absorbing aerosols across different regions, including biomass-burning episodes, dust transport seasons, and seasonal anthropogenic emission patterns. As a temporal indicator at the annual scale, DOY does not act merely as a temporal index, but also as an indirect proxy for seasonally varying aerosol composition and atmospheric background conditions. Additionally, the high contribution of multi-wavelength AOD aligns with the physical mechanism that absorbing aerosol components respond differently across wavelengths, further supporting the seasonal and spectral influences on AAOD retrieval.
The wavelength-dependent performance of the AOD and FMF retrievals exhibits distinct trends, as shown in Figure 4. These trends can be explained by the wavelength-dependent behavior of aerosol optical properties and their impact on retrieval errors. For AOD, absolute errors are largely determined by the magnitude of the AOD values themselves. Shorter wavelengths generally correspond to larger AOD values, which naturally lead to larger absolute deviations and higher RMSE and MAE. Conversely, at longer wavelengths, AOD values are smaller, resulting in lower absolute errors and a decreasing trend in RMSE and MAE. For FMF, the error behavior is different due to both its ratio nature and the wavelength-dependent spectral contrasts. At longer wavelengths, the smaller AOD values make FMF more sensitive to minor variations in AODF, thereby amplifying retrieval errors. Additionally, spectral features that help discriminate fine- and coarse-mode aerosols are more pronounced at shorter wavelengths. Therefore, their effectiveness diminishes at longer wavelengths, further contributing to increased FMF errors.
The TROPOMI/DNN model shows higher correlation and lower errors in FMF retrieval compared to TROPOMI/GRASP (Figure 6). This difference is partly due to DNN retrieving FMF directly, while GRASP estimates it indirectly via AODF, which can introduce additional uncertainty. The DNN model also benefits from multi-wavelength spectral features and AE-based indicators sensitive to fine- and coarse-mode aerosols. Moreover, fewer low-FMF cases in GRASP may contribute to its lower performance. However, while DNN generally improves FMF retrieval, this advantage may not hold under all conditions, and we acknowledge this as a potential source of uncertainty. When compared with existing AAOD retrieval algorithms reported in the literature, the errors obtained in this study are lower than those of the model proposed by Bao et al. (MAE = 0.008, RMSE = 0.016) [28], and the correlation with AERONET is higher than that reported for the AAOD neural network model based on DPC polarization data developed by Dong et al. (R = 0.8) [27]. These findings further highlight the strong advantage of the neural network retrieval method proposed in this study for AAOD retrieval. Although overall validation statistics demonstrate strong retrieval performance, several uncertainty sources remain. These include uncertainties from spectral interpolation/extrapolation of AERONET labels, collocation errors between satellite and ground observations, and variations across surface types and aerosol regimes. Pixel-level uncertainty estimates are not provided in the current study and are identified as an important topic for future research.

6. Conclusions

This study developed a multi-wavelength, multi-parameter synergistic retrieval method based on a DNN for Sentinel-5P/TROPOMI. The proposed model enables simultaneous retrieval of AOD, FMF, and AAOD across seven target wavelengths within the 380–772 nm range. Target-specific feature sets were designed for different retrieval parameters, and Bayesian hyperparameter optimization, together with SHAP-based interpretability analysis, was incorporated to improve model efficiency and physical interpretability. This approach provides a new feasible pathway for multi-parameter aerosol retrieval from TROPOMI observations. Validation on an independent test dataset demonstrates the high accuracy of the proposed model. The AOD retrieval achieves an R of 0.960, with an MAE of 0.034 and an RMSE of 0.070, and 95.29% of the samples fall within the expected error range. The FMF retrieval also shows strong agreement (R = 0.955, MAE = 0.027, RMSE = 0.039). For AAOD, the comparison with AERONET yields R = 0.860 with low errors (MAE = 0.005, RMSE = 0.008). At the global scale, the results show high spatial consistency with MODIS, VIIRS, and GRASP products (R > 0.75). In high-aerosol-loading scenarios, such as wildfire events, the proposed method demonstrates better spatial continuity than GRASP, enabling a more complete representation of smoke plume distributions. Compared with existing methods that typically provide single-parameter or single-wavelength aerosol products, the proposed framework enables multi-parameter and multi-wavelength retrieval with improved spatial continuity under high aerosol loading conditions. However, the results also indicate a decrease in R at longer wavelengths and remaining uncertainties over bare land and desert regions. These findings suggest that future work should further improve the utilization of long-wavelength information and enhance the model’s generalization under challenging surface conditions, particularly over barren land and desert regions. Moreover, future work will further discuss the application of the proposed framework to aerosol-type discrimination. Overall, the proposed framework demonstrates strong performance in terms of accuracy, stability, and spatial coverage, providing reliable data and methodological support for absorbing aerosol monitoring, aerosol classification, and climate impact studies.

Supplementary Materials

The following supporting information can be downloaded at https://www.mdpi.com/article/10.3390/rs18081139/s1. Figure S1: Comparison of AOD spectral interpolation results: (a) linear fitting results; (b) second-order polynomial fitting results; and (c) discrepancies between the fitted results and actual observations; Figure S2: Comparative results of the linear interpolation and second-order polynomial interpolation methods at specific AERONET sites; Figure S3: Comparison of AAOD spectral interpolation results: (a) linear fitting results; (b) second-order polynomial fitting results; and (c) discrepancies between the fitted results and simulated observations; Figure S4: Neural network architecture for multi-wavelength multi-parameter aerosol retrieval; Figure S5: Global spatial distributions of 2019 annual mean AOD (a), AODF (b), and AAOD (c) at 7 wavelengths retrieved by the TROPOMI/DNN; Figure S6: Comparison of aerosol optical properties retrieved by TROPOMI/DNN and TROPOMI/GRASP during the Australian bushfires on January 1, 2020; Figure S7: Comparison of aerosol optical properties retrieved by TROPOMI/DNN and TROPOMI/GRASP during the California wildfires on September 2, 2020; Table S1: Statistical validation metrics for AOD fitting results using linear and second-order polynomial methods; Table S2: Statistical validation metrics for AAOD fitting results using linear and second-order polynomial methods; Table S3: Hyperparameter search space for the Neural Network; Table S4: Model performance across different spectral bands on the testing set; Table S5: Model performance across different spectral bands on the testing set using basic features; Table S6: Statistics of the differences between TROPOMI/DNN and TROPOMI/GRASP optical parameters at various wavelengths; Table S7: Statistics of optical parameter differences between TROPOMI/DNN and TROPOMI/GRASP, categorized by land cover types. References [67,68,69] are cited in the Supplementary Materials.

Author Contributions

Conceptualization, B.X. and M.F.; methodology, B.X.; software, B.X.; validation, B.X. and M.F.; formal analysis and investigation, B.X. and Y.L.; resources, H.W.; data curation, H.J.; writing—original draft preparation, B.X.; writing—review and editing, M.F. and Y.L.; visualization, B.X.; supervision, Y.F., J.T., and L.C.; funding acquisition, M.F. All authors have read and agreed to the published version of the manuscript.

Funding

This research was funded by the National Key Research and Development Program of China (Grant No. 2022YFB3904801) and the National Natural Science Foundation of China (Grant No. 42375132).

Data Availability Statement

The TROPOMI L1B and L2 products were downloaded from the NASA DISC website (https://disc.gsfc.nasa.gov/datasets/, accessed on 10 September 2025). The TROPOMI/GRASP data were obtained from the GRASP-OPEN website (https://www.grasp-open.com/, accessed on 6 September 2025). The MODIS and VIIRS data were downloaded from the LAADS DAAC website (https://ladsweb.modaps.eosdis.nasa.gov/, accessed on 20 September 2025). The ERA5 data were downloaded from the Copernicus Climate Data Store (https://cds.climate.copernicus.eu/datasets/reanalysis-era5-single-levels?tab=overview, accessed on 21 September 2025). The AERONET data were obtained from the AERONET website (https://aeronet.gsfc.nasa.gov/, accessed on 16 September 2025). The TROPOMI surface DLER data were downloaded from the TEMIS website (https://www.temis.nl/surface/albedo/tropomi_ler.php, accessed on 21 September 2025).

Acknowledgments

We acknowledge the AERONET team for providing the ground-based aerosol observations used in this study. We also thank the scientific teams responsible for processing and distributing the satellite and ancillary datasets utilized in this research.

Conflicts of Interest

The authors declare no conflicts of interest.

References

  1. Kaufman, Y.J.; Tanré, D.; Boucher, O. A Satellite View of Aerosols in the Climate System. Nature 2002, 419, 215–223. [Google Scholar] [CrossRef] [Scilit] [PubMed]
  2. Li, J.; Carlson, B.E.; Yung, Y.L.; Lv, D.; Hansen, J.; Penner, J.E.; Liao, H.; Ramaswamy, V.; Kahn, R.A.; Zhang, P.; et al. Scattering and Absorbing Aerosols in the Climate System. Nat. Rev. Earth Environ. 2022, 3, 363–379. [Google Scholar] [CrossRef] [Scilit]
  3. Kalisoras, A.; Georgoulias, A.K.; Akritidis, D.; Allen, R.J.; Naik, V.; Kuo, C.; Szopa, S.; Nabat, P.; Olivié, D.; van Noije, T.; et al. Decomposing the Effective Radiative Forcing of Anthropogenic Aerosols Based on CMIP6 Earth System Models. Atmos. Chem. Phys. 2024, 24, 7837–7872. [Google Scholar] [CrossRef] [Scilit]
  4. Intergovernmental Panel on Climate Change (IPCC). Short-lived Climate Forcers. In Climate Change 2021—The Physical Science Basis: Working Group I Contribution to the Sixth Assessment Report of the Intergovernmental Panel on Climate Change; Cambridge University Press: Cambridge, UK, 2023; pp. 817–922. [Google Scholar] [CrossRef] [Scilit]
  5. Sharma, S.; Chandra, M.; Kota, S.H. Health Effects Associated with PM2.5: A Systematic Review. Curr. Pollut. Rep. 2020, 6, 345–367. [Google Scholar] [CrossRef] [Scilit]
  6. Arfin, T.; Pillai, A.M.; Mathew, N.; Tirpude, A.; Bang, R.; Mondal, P. An Overview of Atmospheric Aerosol and Their Effects on Human Health. Environ. Sci. Pollut. Res. 2023, 30, 125347–125369. [Google Scholar] [CrossRef] [Scilit]
  7. Perumpully, S.J.; Gautam, S. Impact of Aerosols on Atmospheric Processes and Climate Variability: A Synthesis of Recent Research Findings. Geosyst. Geoenviron. 2025, 4, 100317. [Google Scholar] [CrossRef] [Scilit]
  8. Bellouin, N.; Boucher, O.; Haywood, J.; Reddy, M.S. Global Estimate of Aerosol Direct Radiative Forcing from Satellite Measurements. Nature 2005, 438, 1138–1141. [Google Scholar] [CrossRef] [Scilit]
  9. Anderson, T.L.; Wu, Y.; Chu, D.A.; Schmid, B.; Redemann, J.; Dubovik, O. Testing the MODIS Satellite Retrieval of Aerosol Fine-mode Fraction. J. Geophys. Res.-Atmos. 2005, 110, D18204. [Google Scholar] [CrossRef] [Scilit]
  10. Yan, X.; Zang, Z.; Li, Z.; Luo, N.; Zuo, C.; Jiang, Y.; Li, D.; Guo, Y.; Zhao, W.; Shi, W.; et al. A Global Land Aerosol Fine-Mode Fraction Dataset (2001–2020) Retrieved from MODIS Using Hybrid Physical and Deep Learning Approaches. Earth Syst. Sci. Data 2022, 14, 1193–1213. [Google Scholar] [CrossRef] [Scilit]
  11. Sand, M.; Samset, B.H.; Myhre, G.; Gliß, J.; Bauer, S.E.; Bian, H.; Chin, M.; Checa-Garcia, R.; Ginoux, P.; Kipling, Z.; et al. Aerosol Absorption in Global Models from AeroCom Phase III. Atmos. Chem. Phys. 2021, 21, 15929–15947. [Google Scholar] [CrossRef] [Scilit]
  12. Shin, S.-K.; Tesche, M.; Müller, D.; Noh, Y. Technical Note: Absorption Aerosol Optical Depth Components from AERONET Observations of Mixed Dust Plumes. Atmos. Meas. Tech. 2019, 12, 607–618. [Google Scholar] [CrossRef] [Scilit]
  13. Dehkhoda, N.; Noh, Y.; Joo, S. Long-Term Variation of Black Carbon Absorption Aerosol Optical Depth from AERONET Data over East Asia. Remote Sens. 2020, 12, 3551. [Google Scholar] [CrossRef] [Scilit]
  14. Kato, S.; Thorsen, T.J.; Ham, S.-H.; Loeb, N.G.; Ferrare, R.A.; Winker, D.M.; Barker, H.; Stephens, G.L.; Schmidt, S.; Meyer, K.G.; et al. Effect of Spectral Variability of Aerosol Optical Properties on Direct Aerosol Radiative Effect. Front. Remote Sens. 2022, 3, 904505. [Google Scholar] [CrossRef] [Scilit]
  15. Jiang, J.; Liu, J.; Jiao, D.; Zha, Y.; Cao, S. Evaluation of MODIS DT, DB, and MAIAC Aerosol Products over Different Land Cover Types in the Yangtze River Delta of China. Remote Sens. 2023, 15, 275. [Google Scholar] [CrossRef] [Scilit]
  16. Sayer, A.M.; Munchak, L.A.; Hsu, N.C.; Levy, R.C.; Bettenhausen, C.; Jeong, M.-J. MODIS Collection 6 Aerosol Products: Comparison between Aqua’s E-Deep Blue, Dark Target, and “Merged” Data Sets, and Usage Recommendations. J. Geophys. Res.-Atmos. 2014, 119, 13965–13989. [Google Scholar] [CrossRef] [Scilit]
  17. Yang, L.; Pei, X.; Si, Y.; Hu, X.; Fan, Y.; Ji, W.; Zhang, P.; Wang, L.; Lu, X.; Cheng, X. Aerosol Optical Depth Retrieval Over Ocean and Land From Fengyun-3F MERSI-III: First Results and Validation. IEEE J. Sel. Top. Appl. Earth Obs. Remote Sens. 2025, 18, 25235–25247. [Google Scholar] [CrossRef] [Scilit]
  18. Qin, W.; Fang, H.; Wang, L.; Wei, J.; Zhang, M.; Su, X.; Bilal, M.; Liang, X. MODIS High-Resolution MAIAC Aerosol Product: Global Validation and Analysis. Atmos. Environ. 2021, 264, 118684. [Google Scholar] [CrossRef] [Scilit]
  19. Keppens, A.; Pede, S.D.; Hubert, D.; Lambert, J.-C.; Veefkind, P.; Sneep, M.; Haan, J.D.; ter Linden, M.; Leblanc, T.; Compernolle, S.; et al. 5 Years of Sentinel-5P TROPOMI Operational Ozone Profiling and Geophysical Validation Using Ozonesonde and Lidar Ground-Based Networks. Atmos. Meas. Tech. 2024, 17, 3969–3993. [Google Scholar] [CrossRef] [Scilit]
  20. Lakkala, K.; Kujanpää, J.; Brogniez, C.; Henriot, N.; Arola, A.; Aun, M.; Auriol, F.; Bais, A.F.; Bernhard, G.; Bock, V.D.; et al. Validation of the TROPOspheric Monitoring Instrument (TROPOMI) Surface UV Radiation Product. Atmos. Meas. Tech. 2020, 13, 6999–7024. [Google Scholar] [CrossRef] [Scilit]
  21. Dubovik, O.; Fuertes, D.; Litvinov, P.; Lopatin, A.; Lapyonok, T.; Doubovik, I.; Xu, F.; Ducos, F.; Chen, C.; Torres, B.; et al. A Comprehensive Description of Multi-Term LSM for Applying Multiple a Priori Constraints in Problems of Atmospheric Remote Sensing: GRASP Algorithm, Concept, and Applications. Front. Remote Sens. 2021, 2, 706851. [Google Scholar] [CrossRef] [Scilit]
  22. Chen, C.; Litvinov, P.; Dubovik, O.; Bindreiter, L.; Matar, C.; Fuertes, D.; Lopatin, A.; Lapyonok, T.; Lanzinger, V.; Hangler, A.; et al. Extended Aerosol and Surface Characterization from S5P/TROPOMI with GRASP Algorithm. Part II: Global Validation and Intercomparison. Remote Sens. Environ. 2024, 313, 114374. [Google Scholar] [CrossRef] [Scilit]
  23. Tao, M.; Chen, J.; Xu, X.; Man, W.; Xu, L.; Wang, L.; Wang, Y.; Wang, J.; Fan, M.; Shahzad, M.I.; et al. A Robust and Flexible Satellite Aerosol Retrieval Algorithm for Multi-Angle Polarimetric Measurements with Physics-Informed Deep Learning Method. Remote Sens. Environ. 2023, 297, 113763. [Google Scholar] [CrossRef] [Scilit]
  24. Pelucchi, P.; Servera, J.V.; Stier, P.; Camps-Valls, G. Invertible Neural Networks for Probabilistic Aerosol Optical Depth Retrieval. IEEE Trans. Geosci. Remote Sens. 2025, 63, 4102813. [Google Scholar] [CrossRef] [Scilit]
  25. Wei, J.; Li, Z.; Peng, Y.; Sun, L.; Yan, X. A Regionally Robust High-Spatial-Resolution Aerosol Retrieval Algorithm for MODIS Images Over Eastern China. IEEE Trans. Geosci. Remote Sens. 2019, 57, 4748–4757. [Google Scholar] [CrossRef] [Scilit]
  26. Wang, W.; Li, B.; Chen, B. Comprehensive Reconstruction of Missing Aerosol Optical Depth in MAIAC Product: A Multi-Layer LightGBM Approach Leveraging Multi-Scale Spatio-Temporal Information. J. Clean. Prod. 2025, 523, 146384. [Google Scholar] [CrossRef] [Scilit]
  27. Dong, Y.; Li, J.; Zhang, Z.; Zheng, Y.; Zhang, C.; Li, Z. Machine Learning-Based Retrieval of Aerosol and Surface Properties Over Land From the Gaofen-5 Directional Polarimetric Camera Measurements. IEEE Trans. Geosci. Remote Sens. 2024, 62, 4106315. [Google Scholar] [CrossRef] [Scilit]
  28. Bao, F.; Wu, S.; Gao, J.; Yuan, S.; Liu, Y.; Huang, K. Continental Aerosol Properties and Absorption Retrieval Using Random Forest Machine Learning Method Specific to Geostationary Remote Sensing. Remote Sens. Environ. 2024, 311, 114275. [Google Scholar] [CrossRef] [Scilit]
  29. Liang, T.; Sun, L.; Li, H. MODIS Aerosol Optical Depth Retrieval Based on Random Forest Approach. Remote Sens. Lett. 2020, 12, 179–189. [Google Scholar] [CrossRef] [Scilit]
  30. Bao, F.; Huang, K.; Wu, S. The Retrieval of Aerosol Optical Properties Based on a Random Forest Machine Learning Approach: Exploration of Geostationary Satellite Images. Remote Sens. Environ. 2023, 286, 113426. [Google Scholar] [CrossRef] [Scilit]
  31. Sun, Y.; Hang, R.; Liu, Q.; Zhu, F.; Pei, H. Graph-Regularized Low-Rank Representation for Aerosol Optical Depth Retrieval. Int. J. Remote Sens. 2016, 37, 5749–5762. [Google Scholar] [CrossRef] [Scilit]
  32. Brakhasi, F.; Hajeb, M.; Fouladinejad, F. Discrimination aerosol form clouds using cats-ISS lidar observations based on random forest and SVM algorithms over the eastern part of middle east. Int. Arch. Photogramm. Remote Sens. Spat. Inf. Sci. 2019, XLII-4/W18, 235–240. [Google Scholar] [CrossRef] [Scilit]
  33. Shin, J.; Sim, J.; Tesche, M.; Yoon, J.; Kim, D.; Noh, Y. Machine Learning-Based Retrieval of Aerosol Size and Hygroscopicity Using Horizontal Scanning LiDAR and PM Data. npj Climate Atmos. Sci. 2025, 9, 3. [Google Scholar] [CrossRef] [Scilit]
  34. Just, A.C.; Liu, Y.; Sorek-Hamer, M.; Rush, J.; Dorman, M.; Chatfield, R.; Wang, Y.; Lyapustin, A.; Kloog, I. Gradient Boosting Machine Learning to Improve Satellite-Derived Column Water Vapor Measurement Error. Atmos. Meas. Tech. 2020, 13, 4669–4681. [Google Scholar] [CrossRef] [Scilit]
  35. Fan, Y.; Sun, L. Satellite Aerosol Optical Depth Retrieval Based on Fully Connected Neural Network (FCNN) and a Combine Algorithm of Simplified Aerosol Retrieval Algorithm and Simplified and Robust Surface Reflectance Estimation (SREMARA). IEEE J. Sel. Top. Appl. Earth Obs. Remote Sens. 2023, 16, 4947–4962. [Google Scholar] [CrossRef] [Scilit]
  36. Jiang, J.; Liu, J.; Jiao, D. Aerosol Optical Depth Retrieval for Sentinel-2 Based on Convolutional Neural Network Method. Atmosphere 2023, 14, 1400. [Google Scholar] [CrossRef] [Scilit]
  37. Liu, S.; Zhang, L. Deep Feature Gaussian Processes for Single-Scene Aerosol Optical Depth Reconstruction. IEEE Geosci. Remote Sens. Lett. 2024, 21, 5505705. [Google Scholar] [CrossRef] [Scilit]
  38. Yang, C.K.; Chiu, J.C.; Marshak, A.; Feingold, G.; Várnai, T.; Wen, G.; Yamaguchi, T.; van Leeuwen, P.J. Near-Cloud Aerosol Retrieval Using Machine Learning Techniques, and Implied Direct Radiative Effects. Geophys. Res. Lett. 2022, 49, e2022GL098274. [Google Scholar] [CrossRef] [Scilit]
  39. Gu, H.; Li, Z.; Zhang, L.; Chen, C.; Qie, L.; Qiu, Z.; Liu, Z.; Fan, C.; Wen, E.; Qian, Y. A Capsule Network Model for Aerosol Retrieval from DPC/Gaofen-5(02) Satellite Multi-Angle Polarimetric Observation. J. Remote Sens. 2025, 5, 1008. [Google Scholar] [CrossRef] [Scilit]
  40. Wei, J.; Wang, Z.; Li, Z.; Li, Z.; Pang, S.; Xi, X.; Cribb, M.; Sun, L. Global Aerosol Retrieval over Land from Landsat Imagery Integrating Transformer and Google Earth Engine. Remote Sens. Environ. 2024, 315, 114404. [Google Scholar] [CrossRef] [Scilit]
  41. Zhen, Y.; Yang, X.; Tang, H.; Shi, H.; Liu, Z. CALIPSO-Based Aerosol Extinction Profile Estimation from MODIS and MERRA-2 Data Using a Hybrid Model of Transformer and CNN. Sci. Total Environ. 2024, 954, 176423. [Google Scholar] [CrossRef] [Scilit]
  42. Zhang, L.; Gu, H.; Li, Z.; Liu, Z.; Zhang, Y.; Xie, Y.; Zhang, Z.; Ji, Z.; Li, Z.; Yan, C. A Sequence-to-Sequence Transformer Model for Satellite Retrieval of Aerosol Optical and Microphysical Parameters from Space. Remote Sens. 2024, 16, 4659. [Google Scholar] [CrossRef] [Scilit]
  43. Sun, J.; Veefkind, P.; van Velthoven, P.; Levelt, P.F. Aerosol Absorption Over Land Derived From the Ultra-Violet Aerosol Index by Deep Learning. IEEE J. Sel. Top. Appl. Earth Obs. Remote Sens. 2021, 14, 9692–9710. [Google Scholar] [CrossRef] [Scilit]
  44. Logothetis, S.-A.; Giannaklis, C.-P.; Salamalikis, V.; Tzoumanikas, P.; Raptis, P.-I.; Amiridis, V.; Eleftheratos, K.; Kazantzidis, A. Aerosol Optical Properties and Type Retrieval via Machine Learning and an All-Sky Imager. Atmosphere 2023, 14, 1266. [Google Scholar] [CrossRef] [Scilit]
  45. Kim, M.; Kim, J.; Lee, S.; Lim, H.; Cho, Y.; Lee, H.C.; Kuk, S.K. Aerosol Fine-Mode-Fraction Retrieval From GEO-KOMPSAT-2A/AMI Using a Deep Neural Network and Spectral Deconvolution Algorithm. IEEE Trans. Geosci. Remote Sens. 2025, 63, 4107712. [Google Scholar] [CrossRef] [Scilit]
  46. Tang, C.; Shi, C.; Letu, H.; Yin, S.; Nakajima, T.; Sekiguchi, M.; Xu, J.; Zhao, M.; Ma, R.; Wang, W. Development of a Hybrid Algorithm for the Simultaneous Retrieval of Aerosol Optical Thickness and Fine-Mode Fraction from Multispectral Satellite Observation Combining Radiative Transfer and Transfer Learning Approaches. Remote Sens. Environ. 2025, 319, 114619. [Google Scholar] [CrossRef] [Scilit]
  47. Kang, Y.; Kim, M.; Kang, E.; Cho, D.; Im, J. Improved Retrievals of Aerosol Optical Depth and Fine Mode Fraction from GOCI Geostationary Satellite Data Using Machine Learning over East Asia. Isprs J. Photogramm. Remote Sens. 2022, 183, 253–268. [Google Scholar] [CrossRef] [Scilit]
  48. Cao, M.; Zhang, M.; Su, X.; Wang, L. A Two-Stage Machine Learning Algorithm for Retrieving Multiple Aerosol Properties Over Land: Development and Validation. IEEE Trans. Geosci. Remote Sens. 2023, 61, 4105017. [Google Scholar] [CrossRef] [Scilit]
  49. Ji, D.; Sun, X.; Ritter, C.; Notholt, J. Retrieval of Aerosol Composition from Spectral Aerosol Optical Depth and Optical Properties Using a Machine Learning Approach. Atmos. Meas. Tech. 2026, 19, 421–436. [Google Scholar] [CrossRef] [Scilit]
  50. She, L.; Li, Z.; de Leeuw, G.; Wang, W.; Wang, Y.; Yang, L.; Feng, Z.; Yang, C.; Shi, Y. Time Series Retrieval of Multi-Wavelength Aerosol Optical Depth by Adapting Transformer (TMAT) Using Himawari-8 AHI Data. Remote Sens. Environ. 2024, 305, 114115. [Google Scholar] [CrossRef] [Scilit]
  51. Wu, G.; Li, Z.; Fu, C.; Zhang, X.; Zhang, R.; Zhang, R.; Zhou, T.; Li, J.; Li, J.; Zhou, D.; et al. Advances in Studying Interactions between Aerosols and Monsoon in China. Sci. China Earth Sci. 2015, 59, 1–16. [Google Scholar] [CrossRef] [Scilit]
  52. de Graaf, M. TROPOMI ATBD of the Aerosol Optical Thickness (S5P-KNMI-L2-0033-RP); KNMI: De Bilt, The Netherlands, 2024. [Google Scholar]
  53. Leloux, J.; Rozemeijer, N.; van Swol, R.; Vonk, F. Input/Output Data Specification for the TROPOMI L01b Data Processor; KNMI: De Bilt, The Netherlands, 2024. [Google Scholar]
  54. Litvinov, P.; Chen, C.; Dubovik, O.; Bindreiter, L.; Matar, C.; Fuertes, D.; Lopatin, A.; Lapyonok, T.; Lanzinger, V.; Hangler, A.; et al. Extended Aerosol and Surface Characterization from S5P/TROPOMI with GRASP Algorithm. Part I: Conditions, Approaches, Performance and New Possibilities. Remote Sens. Environ. 2024, 313, 114355. [Google Scholar] [CrossRef] [Scilit]
  55. Lyapustin, A.; Wang, Y.; Korkin, S.; Huang, D. MODIS Collection 6 MAIAC Algorithm. Atmos. Meas. Tech. 2018, 11, 5741–5765. [Google Scholar] [CrossRef] [Scilit]
  56. Friedl, M.A.; Sulla-Menashe, D.; Tan, B.; Schneider, A.; Ramankutty, N.; Sibley, A.; Huang, X. MODIS Collection 5 Global Land Cover: Algorithm Refinements and Characterization of New Datasets. Remote Sens. Environ. 2010, 114, 168–182. [Google Scholar] [CrossRef] [Scilit]
  57. Jackson, J.M.; Liu, H.; Laszlo, I.; Kondragunta, S.; Remer, L.A.; Huang, J.; Huang, H. Suomi-NPP VIIRS Aerosol Algorithms and Data Products. J. Geophys. Res. Atmos. 2013, 118, 12,673–12,689. [Google Scholar] [CrossRef] [Scilit]
  58. Lee, J.; Hsu, N.C.; Kim, W.V.; Sayer, A.M.; Tsay, S. VIIRS Version 2 Deep Blue Aerosol Products. J. Geophys. Res. Atmos. 2024, 129, e2023JD040082. [Google Scholar] [CrossRef] [Scilit]
  59. Zhou, P.; Wang, Y.; Xu, L.; Cheng, Z.; Ge, C.; Zhuang, L. Study of Aerosol Optical Properties Based on the AERONET Data. Natl. Remote Sens. Bull. 2022, 26, 953–970. [Google Scholar] [CrossRef] [Scilit]
  60. Smeets, J.; Kleipool, Q.; van Hees, R.; Sneep, M. Readme for TROPOMI Instrument Spectral Response Functions; Technical Report; KNMI: De Bilt, The Netherlands, 2018. [Google Scholar]
  61. Zhang, M.; Ma, Y.; Shi, Y.; Gong, W.; Chen, S.; Jin, S.; Wang, J. Controlling Factors Analysis for the Himawari-8 Aerosol Optical Depth Accuracy from the Standpoint of Size Distribution, Solar Zenith Angles and Scattering Angles. Atmos. Environ. 2020, 233, 117501. [Google Scholar] [CrossRef] [Scilit]
  62. Joshi, A.; Agrawal, S.; Chauhan, P. Reduction of Atmospheric Effects in Satellite Images During the COVID-19 Induced Lockdown. J. Indian Soc. Remote Sens. 2020, 48, 1613–1625. [Google Scholar] [CrossRef] [Scilit]
  63. Jiang, Z.; Huete, A.; Didan, K.; Miura, T. Development of a Two-Band Enhanced Vegetation Index without a Blue Band. Remote Sens. Environ. 2008, 112, 3833–3845. [Google Scholar] [CrossRef] [Scilit]
  64. Vermote, E.F.; Kotchenova, S. Atmospheric Correction for the Monitoring of Land Surfaces. J. Geophys. Res. Atmos. 2008, 113, S90. [Google Scholar] [CrossRef] [Scilit]
  65. Yang, L.; Ji, W.; Pei, X.; Si, Y.; Liu, H.; Chen, S.; Zhang, C.; Cheng, X.; Lu, X.; Wang, H. Global Evaluation of Fengyun-3 MERSI Dark Target Aerosol Retrievals over Land. Int. J. Digit. Earth 2024, 17, 1–24. [Google Scholar] [CrossRef] [Scilit]
  66. Jasper, S.; Hugo, L.; Adams, R.P. Practical Bayesian Optimization of Machine Learning Algorithms. In Proceedings of the 26th International Conference on Neural Information Processing Systems—Volume 2, Lake Tahoe, NV, USA, 3–6 December 2012; Volume 3, pp. 2951–2959. [Google Scholar]
  67. Ångström, A. On the Atmospheric Transmission of Sun Radiation and on Dust in the Air. Geogr. Ann. 1929, 11, 156–166. [Google Scholar] [CrossRef] [Scilit] [PubMed]
  68. Damadeo, R.P.; Sofieva, V.F.; Rozanov, A.; Thomason, L.W. An Empirical Characterization of the Aerosol Ångström Exponent Interpolation Bias Using SAGE III/ISS Data. Atmos. Meas. Tech. 2024, 17, 3669–3678. [Google Scholar] [CrossRef] [Scilit]
  69. Eck, T.F.; Holben, B.N.; Reid, J.S.; Dubovik, O.; Smirnov, A.; O’Neill, N.T.; Slutsker, I.; Kinne, S. Wavelength Dependence of the Optical Depth of Biomass Burning, Urban, and Desert Dust Aerosols. J. Geophys. Res.-Atmos. 1999, 104, 31333–31349. [Google Scholar] [CrossRef] [Scilit]
Figure 1. Technical workflow of this study.
Remotesensing 18 01139 g001
Figure 2. SHAP-based feature importance. Panels (a1c1) show the ranking of features with the largest absolute SHAP values for the AOD, FMF, and AAOD models, and panels (a2c2) show the relative contributions of different feature categories to each model.
Remotesensing 18 01139 g002
Figure 3. Model training loss function variation curves. (a) AOD, (b) FMF, (c) AAOD.
Remotesensing 18 01139 g003
Figure 4. Model performance across different spectral bands on the testing set. (a) AOD model statistical metrics, (b) FMF model statistical metrics, (c) AAOD model statistical metrics.
Remotesensing 18 01139 g004
Figure 5. Comparison of AOD retrieval accuracy at 440 nm between TROPOMI/DNN (a) and TROPOMI/GRASP (b) over globally matched AERONET test dataset from 2019 to 2021. The red line represents the fitted data curve, the diagonal line is the 1:1 line, and the other dashed lines indicate the error range indicators.
Remotesensing 18 01139 g005
Figure 6. Comparison of FMF and AODF retrieval accuracy at 440 nm between TROPOMI/DNN and TROPOMI/GRASP over globally matched AERONET test dataset from 2019 to 2021. Panels (a1,a2) show TROPOMI/DNN results, and panels (b1,b2) show TROPOMI/GRASP results. The red line represents the fitted data curve, the diagonal line is the 1:1 line, and the other dashed lines indicate the error range indicators.
Remotesensing 18 01139 g006
Figure 7. Comparison of AAOD retrieval accuracy at 440 nm between TROPOMI/DNN (a) and TROPOMI/GRASP (b) over globally matched AERONET test dataset from 2019 to 2021. The red line represents the fitted data curve, the diagonal line is the 1:1 line, and the other dashed lines indicate the error range indicators.
Remotesensing 18 01139 g007
Figure 8. Global spatial distribution of AOD, AODF, and AAOD retrieved by TROPOMI/DNN (a1a3) and TROPOMI/GRASP (b1b3), averaged from March 2019 to February 2020.
Remotesensing 18 01139 g008
Figure 9. Probability distributions of the differences between TROPOMI/DNN and TROPOMI/GRASP for different wavelengths (panel (a1a3)), and probability distributions across different land cover types (panel (b1b3)).
Remotesensing 18 01139 g009
Figure 10. Comparison of the global spatial distributions of AOD at 550 nm in 2019 from TROPOMI/DNN, MODIS/MAIAC, and VIIRS/DB. (a) TROPOMI/DNN AOD, (b) MODIS/MAIAC AOD, (c) VIIRS/DB AOD, (d) the differences between TROPOMI/DNN and MODIS/MAIAC, (e) the differences between TROPOMI/DNN and VIIRS/DB, and (f) the distribution of differences.
Remotesensing 18 01139 g010
Figure 11. Global spatial distribution comparison of AE (490, 670 nm) among TROPOMI/DNN, TROPOMI/GRASP, and VIIRS/DB, along with their corresponding difference maps and probability density distributions (2019). (a) TROPOMI/DNN AE, (b) TROPOMI/GRASP AE, (c) VIIRS/DB AE, (d) the differences be-tween TROPOMI/DNN and TROPOMI/GRASP, (e) the differences between TROPOMI/DNN and VIIRS/DB, and (f) the distribution of differences.
Remotesensing 18 01139 g011
Figure 12. Comparison of aerosol optical parameter retrieval results between TROPOMI/DNN and TROPOMI/GRASP for the Australian bushfires on 8 December 2019, along with their corresponding correlation scatter plots. The red box indicates the location of the fire.
Remotesensing 18 01139 g012
Figure 13. Comparison of aerosol optical parameter retrieval results between TROPOMI/DNN and TROPOMI/GRASP for the California wildfires on 7 September 2020, along with their corresponding correlation scatter plots. The red box indicates the location where the fire occurred, and the differently colored dots represent AERONET sites.
Remotesensing 18 01139 g013
Table 1. The selection of the TROPOMI wavelength in this study.
Wavelength/nm380416440494670747772
Band ID3456
Spatial Sampling5.5 × 3.5 km2
Spectral resolution1 nm
Spatial resolution0.09° (WGS84)
Table 2. Data used in this research.
Data SourceContentSpatial ResolutionPurpose
TROPOMI/L1BTOA Reflectance, SZA, VZA, SAA, VAA 5.5 × 3.5 km2Input features of the DNN
TROPOMI/L2 NO2TOC, Surface elevation5.5 × 3.5 km2Input features of the DNN
TROPOMI/L2 Aerosol IndexUVAI5.5 × 3.5 km2Input features of the DNN
TROPOMI/GRASPAOD, AODF, AAOD10 × 10 km2Comparison and verification
S5P NPP VIIRS CLOUDCloud cover5.5 × 3.5 km2Cloud identification
TROPOMI surface LERSurface reflectance0.125° × 0.125°Input features of the DNN
MODIS/MAIACAOD (550 nm)1 × 1 km2Comparison and verification
MODIS/MCD12C1Land cover type1 × 1 km2Input features of the DNN
VIIRS/DBAOD (550 nm), AE (490, 670 nm)1° × 1°Comparison and verification
ERA5Pressure, 2 m air temperature, 10 m u/v wind components, TCWV, BLH0.25° × 0.25°Input features of the DNN
AERONET/Level 1.5AOD, FMF, AAOD Training labels for the DNN
Table 3. Basic input features of the neural network input layer.
CategoryFeaturesSource
SpatiotemporalLongitude, Latitude, DOYTROPOMI/L1B
GeometrySZA, SAA, VZA, VAA
TOARTOAR 1
Atmospheric conditionTCWV, BLH, U/V wind, Pressure, Temperature, TOC, UVAI 2ERA5, TROPOMI/L2 UVAI
surfaceLand cover type, DEM, LER 3MODIS/MCD12C1, TROPOMI/L2 NO2, TROPOMI/L3 LER
1,3 Wavelengths: 380, 416, 440, 494, 670, 747, 772 nm. 2 UVAI feature is exclusively used for AAOD retrieval.
Table 4. Optimized hyperparameters of the neural network model.
Aerosol ParameterHidden LayersInitial Learning Rateβ1β2εBatch Size
AOD(512, 256, 128, 64,32)2.25 × 10−40.8630.9989.58 × 10−8512
FMF(512, 256, 128, 64,32)4.8 × 10−30.9010.9981.64 × 10−9512
AAOD(512, 256, 128, 64)1.14 × 10−30.9930.9891.86 × 10−9256
Disclaimer/Publisher’s Note: The statements, opinions and data contained in all publications are solely those of the individual author(s) and contributor(s) and not of MDPI and/or the editor(s). MDPI and/or the editor(s) disclaim responsibility for any injury to people or property resulting from any ideas, methods, instructions or products referred to in the content.