Article

Physical Properties in the Northern Ecuador Subduction Zone Appear to Contribute to the Occurrence of Moderate-to-Strong Earthquakes and Aftershock Propagation


1
State Key Laboratory of Earthquake Dynamics and Forecasting, Institute of Geology, China Earthquake Administration, Beijing 100029, China
2
School of Disaster Prevention and Mitigation Engineering, University of Emergency Management, Langfang 065201, China
*
Author to whom correspondence should be addressed.
Remote Sens. 2026, 18(19), 3353; https://doi.org/10.3390/rs18193353
Submission received: 23 July 2026 / Revised: 21 September 2026 / Accepted: 23 September 2026 / Published: 1 October 2026
(This article belongs to the Section Remote Sensing Image Processing)

Highlights

What are the main findings?
  • InSAR coseismic deformation revealed the surface deformation characteristics of the 2016 Mw 7.8 Ecuador earthquake, with a maximum displacement of ~60 cm.
  • The relocated aftershocks and historical earthquakes (Mw > 5.2) occurred in regions with a moderate Vp/Vs ratio (1.78–1.82).
What are the implications of the main findings?
  • A moderate Vp/Vs ratio (1.78–1.82) region may facilitate subduction zone earthquake rupture and propagation, whereas extremely high or low ratios act as physical barriers that inhibit rupture.
  • The multi-observational approach combining InSAR and seismology provides important constraints on earthquake nucleation and physical mechanisms.

Abstract

Megathrust faults in subduction zones often serve as seismogenic environments for destructive earthquakes. To verify whether the material properties of subduction zones influence aftershock propagation and earthquake magnitude, we investigated the northern Ecuador subduction zone using local 8G network data to locate seismicity in July 2016 and obtained the deformation field (the maximum deformation reached about 60 cm) of the 2016 Mw 7.8 earthquake from InSAR. Additionally, we refined the locations of moderate-to-large earthquakes (Mw > 5.2) over the past 20 years via surface waveform relocation and depth-phase modeling based on the global network data. We obtained 895 earthquake events for July 2016 (with horizontal uncertainties < 0.01° and vertical uncertainties < 2 km), and the relocation uncertainties of the historical moderate-to-large events were within 4 km. Both the aftershock and the relocated historical events are found to be concentrated in regions with moderate Vp/Vs ratios (~1.78–1.82), indicating that the material properties in these areas may facilitate subduction zone aftershock propagation and the nucleation of moderate-to-large earthquakes. In contrast, regions with high or low Vp/Vs ratios may act as barriers that inhibit earthquake rupture and constrain rupture scales.

1. Introduction

The megathrust faults at subduction zone plate interfaces often constitute the seismogenic environment for destructive large earthquakes, with their geometry and material properties jointly governing the processes of earthquake preparation, nucleation, and rupture propagation. Numerous studies have demonstrated that fault geometry plays a controlling role in earthquake rupture propagation along subduction zones, such as the multi-fault network structure in the Ecuador subduction zone [1], the geometric curvature of the Sumatra subduction zone [2], and the complex fault structures in the Aleutian–Alaska subduction zone [3]. These investigations have provided systematic insights into the manner in which along-strike variations in fault geometry—including changes in strike, dip, and curvature—regulate the rupture initiation, mediate the propagation trajectories, and ultimately control the cessation of seismic rupture. However, compared with geometric factors, research on the influence of subduction zone material properties—such as crustal rheological structure, sediment distribution, pore fluid pressure, and physical property variations of the subducting slab—on earthquake rupture propagation and resultant magnitude remains relatively limited and lacks systematic understanding. A recent study, through a detailed comparative analysis of two earthquakes in South America, has preliminarily revealed the physical control mechanism of subduction zone material properties on earthquake rupture processes [4], providing important observational constraints for this research direction. Nevertheless, this conclusion still requires further validation using additional earthquake cases from diverse subduction zone settings to establish a more universally applicable physical model. Moreover, whether the influence of such material properties is confined to the mainshock rupture process or also extends to the spatiotemporal evolution of aftershocks—potentially providing specific seismogenic environments for aftershock activity—remains unclear and urgently necessitates more in-depth integrated investigations.
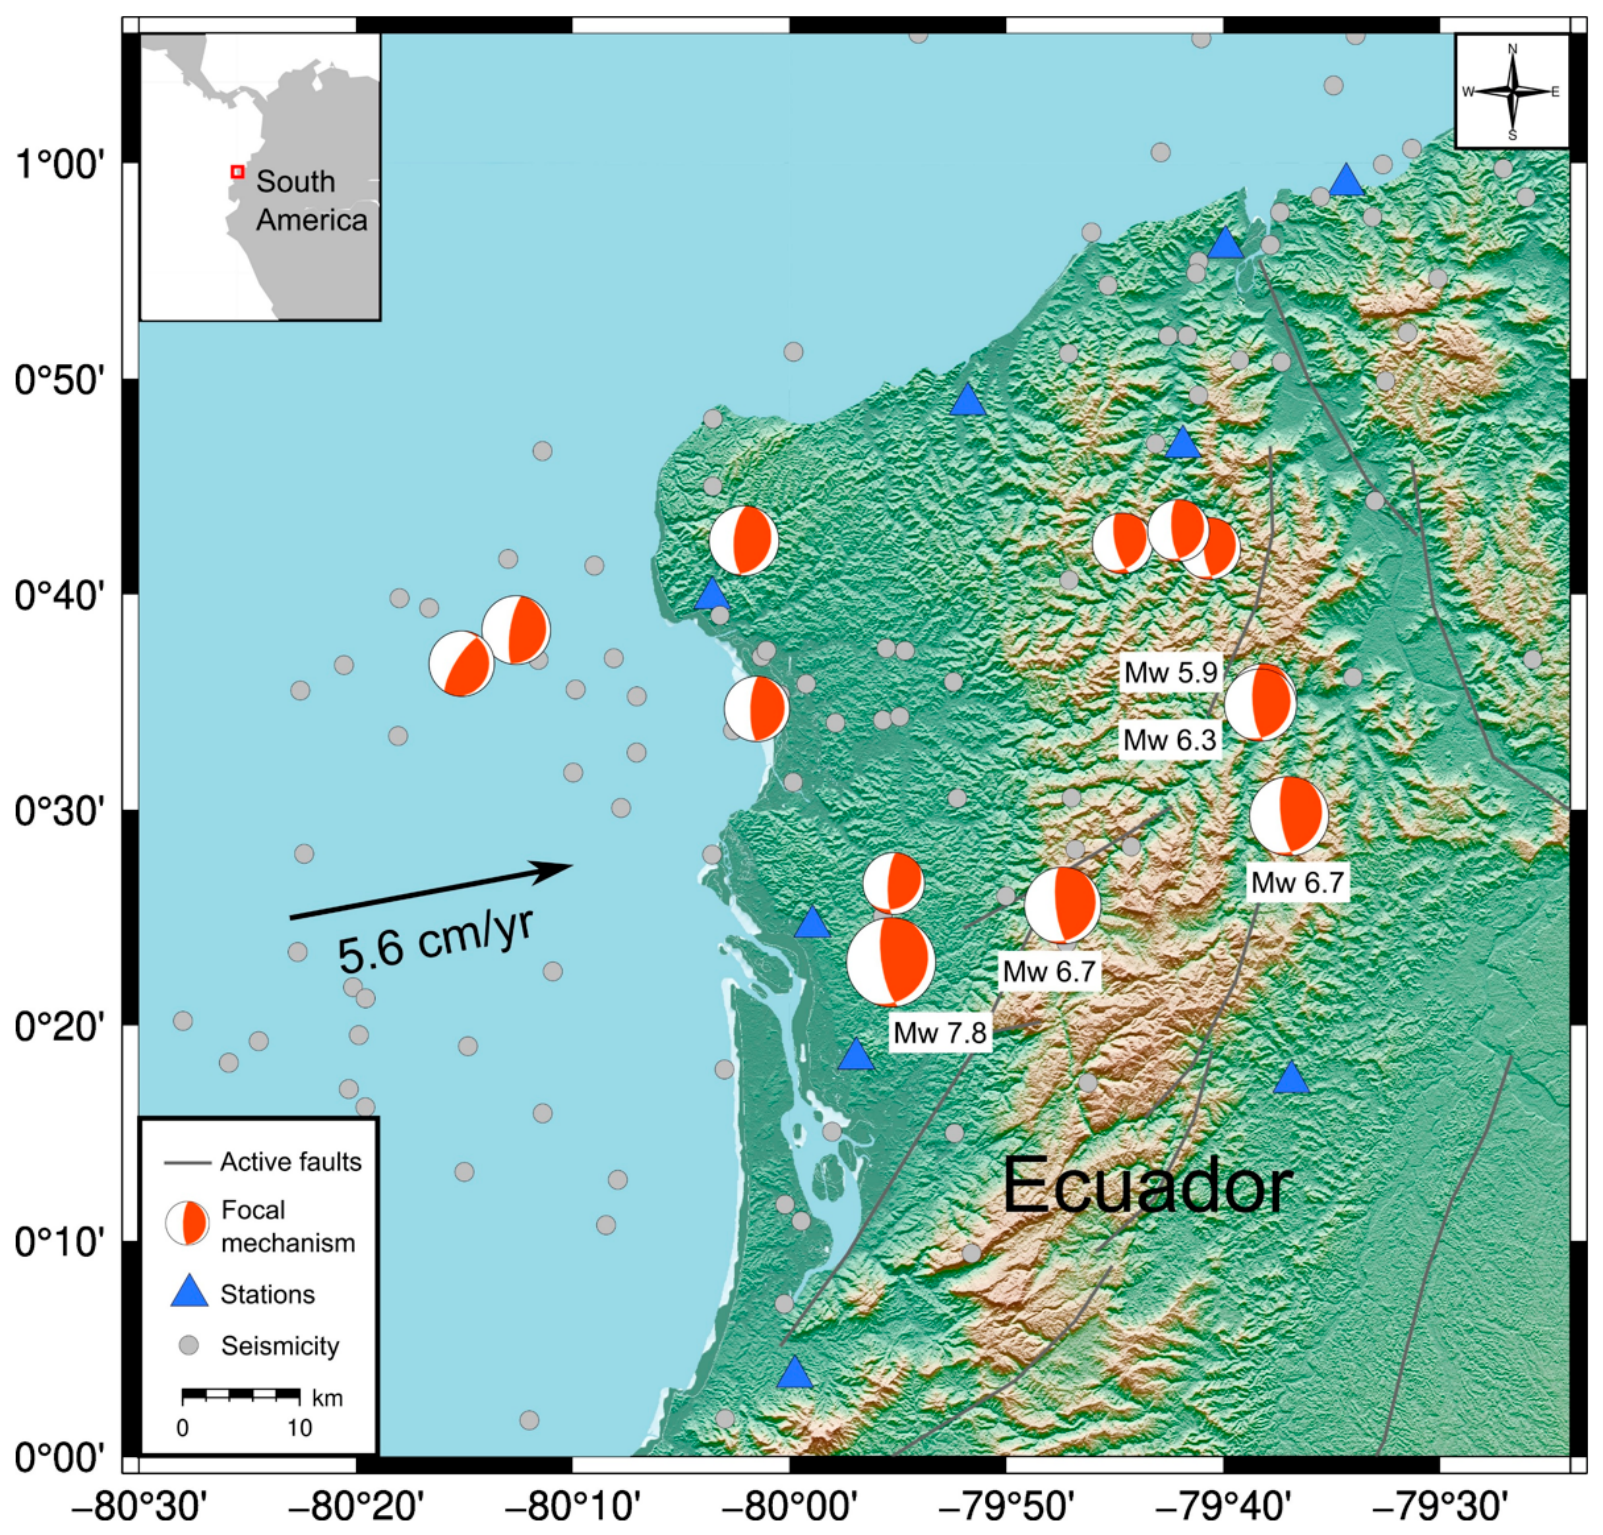
The Ecuadorian subduction zone is situated at the convergent plate margin between the Nazca Plate and the South American continent, where the two plates converge at a relative velocity of approximately 58 mm/a [5]. This long-term subduction process has not only shaped the primary structural framework of the Ecuadorian Andes but has also facilitated the progressive accretion of adjacent oceanic terranes [6,7], accompanied by intense and frequent seismic activity, rendering the region a natural laboratory for investigating the physical mechanisms of subduction zone earthquakes. On 16 April 2016, a thrust-type Mw 7.8 megathrust earthquake occurred in this region, representing the largest seismic event recorded along the Ecuadorian subduction zone in recent decades [8,9] (Figure 1). Beyond causing substantial damage and losses, this earthquake revealed the presence of so-called “supercycle” behavior (anomalously long recurrence intervals between clustered large earthquakes relative to plate-convergence rates) within this subduction zone [10]. Subsequent seismological investigations have further refined the fine-scale geometric structure of the plate interface in this region and preliminarily identified the spatial correspondence between local seismicity and the degree of interplate kinematic coupling [11], suggesting an intrinsic link between fault geometry and stress accumulation. Of particular note, the recent widespread application of machine learning methods in seismology—especially breakthroughs in phase picking and event association algorithms—has significantly enhanced the precision of earthquake relocation, enabling the construction of more complete and high-resolution seismic catalogs [12,13]. This technological advancement provides an unprecedented data foundation and opportunity for in-depth exploration of the fault geometry, spatiotemporal evolution of seismicity, and their potential relationships with material properties in the Ecuadorian subduction zone.
Due to the dense seismic network deployed in the Ecuadorian region, numerous studies have provided a wealth of seismological imaging results for this area, covering P- and S-wave velocity structures at scales ranging from the crust to the upper mantle. Lateral velocity variations within the subducting slab clearly delineate heterogeneous features along both strike and dip directions. Among these, deep-seated high-velocity bodies are closely associated with seamounts and subducted topography along the Carnegie Ridge, likely reflecting heterogeneities in material composition or thickness within the subducting plate, whereas low-velocity anomalies are interpreted as marking the boundary interface between the subducting and overriding plates [14,15]. On the landward side of the Carnegie Ridge, i.e., in the westernmost forearc and Coastal Cordillera region, seismic tomography generally reveals low P- and S-wave velocities accompanied by elevated Vp/Vs ratios. This combination of physical properties typically indicates increased rock porosity or enhanced fluid saturation, which may be attributed to fluid release during the subduction of the thickened oceanic crust of the Carnegie Ridge, thereby promoting enhanced hydration and alteration of the overriding plate as well as a marked increase in fracture density within fault zones [16]. Lateral variations in the forearc crustal structure and in the properties of the subducting oceanic crust are considered to exert an influence on the recurrence intervals and spatial distribution of large megathrust earthquakes in this region [15,17,18]. However, this hypothesis remains speculative at present and requires systematic quantitative validation through detailed coseismic rupture models of historical great earthquakes in Ecuador, the spatiotemporal distribution characteristics of aftershock sequences, and seismic records spanning longer historical periods, in order to establish a robust physical link between these factors.
Given the frequent seismic activity in northern Ecuador, the relatively high accuracy of the velocity structure model, and the favorable density of the seismic network, this study intends to utilize continuous recordings from the Ecuadorian 8G seismic network from July 2016 to perform high-precision relocation of earthquake events recorded during this period, thereby correcting their initial hypocentral localizations. Concurrently, by integrating teleseismic waveform data from the IRIS global seismic network, this study will employ surface-wave cross-correlation relocation and depth-phase matching methods to systematically refine the epicentral locations and focal depths of multiple historical moderate-to-large earthquakes (moment magnitude Mw > 5.2) in northern Ecuador, aiming to obtain more reliable hypocentral localizations. Regarding the construction and selection of the velocity model, this study directly adopts the latest three-dimensional velocity structure model published by Ponce et al. [14], which comprehensively accounts for lateral heterogeneity within the crust and uppermost mantle across the study region. The objective of this study is to systematically demonstrate, by comparing the refined spatial distribution characteristics of earthquakes—including mainshock locations, spatial clustering of aftershock sequences, and depth-profile patterns—with seismic velocity anomalies and physical-property gradients within the subduction zone interior and along the interplate boundary, how variations in material properties within the Ecuadorian subduction zone govern the spatiotemporal evolution of aftershock activity and further control the nucleation sites and recurrence patterns of moderate-to-large earthquakes in this region.

2. Data and Methods

2.1. InSAR Coseismic Process

This study utilizes the open-source GMTSAR software (v6.7) [19] platform to process Sentinel-1 SAR data for the extraction of surface deformation information. We used Sentinel-1A images acquired from 12 April 2016 to 24 April 2016, with track number T10962 and VV polarization. During the data preprocessing stage, to eliminate interferometric phase distortions caused by topographic phase contributions and the flat-Earth effect, this study jointly employed the Shuttle Radar Topography Mission (SRTM) 1-arc-second (approximately 30 m resolution) Digital Elevation Model (DEM) and precise orbit ephemeris data to systematically correct and remove the topographic phase component and the flat-Earth phase component from the interferometric phase.
To suppress the inherent phase noise in the interferogram and effectively enhance the signal-to-noise ratio of the interferometric fringes, thereby ensuring the accuracy of subsequent phase unwrapping and deformation inversion, this study applies a multilooking ratio of 1:4 in the azimuth and range directions, respectively (i.e., 1 look in azimuth and 4 looks in range), to reduce random noise through multilook averaging. On this basis, the Goldstein adaptive filtering algorithm is further introduced to smooth the interferometric phase. This algorithm can adaptively adjust the filtering intensity according to the local fringe density, thus maximizing the preservation of phase details while effectively suppressing noise.
In the phase unwrapping step, this study employs the minimum cost flow (MCF) algorithm based on Delaunay triangulation for two-dimensional phase unwrapping. This algorithm formulates the phase unwrapping problem as a global optimization problem and can effectively handle interferograms containing residual points and noisy regions. To ensure the reliability and accuracy of the unwrapping results and to effectively avoid interference from severely decorrelated regions—caused by factors such as land cover changes, dense vegetation, or the absence of strong scatterers—during the unwrapping process, this study sets a uniform coherence threshold (with a value of 0.07) prior to the unwrapping operation. Using this threshold, a mask is generated to exclude pixels with coherence coefficients below this value from participating in the unwrapping calculation. After unwrapping is completed, the final unwrapped phase results are transformed into a standard geographic coordinate system (e.g., WGS84 latitude/longitude projection) through geocoding, facilitating subsequent spatial registration and joint analysis with external geographic information data. For tropospheric delay correction, we applied the GACOS model in post-processing.

2.2. Local Network Relocation

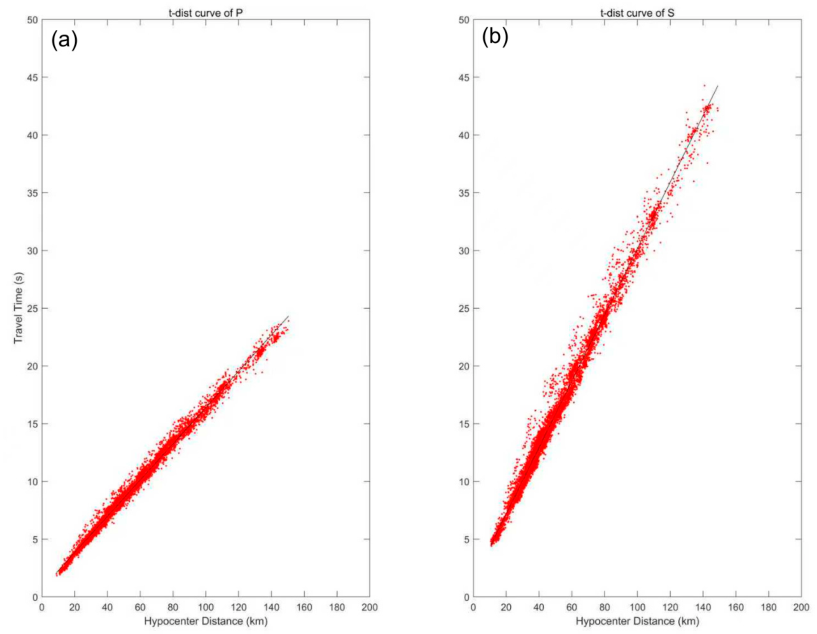
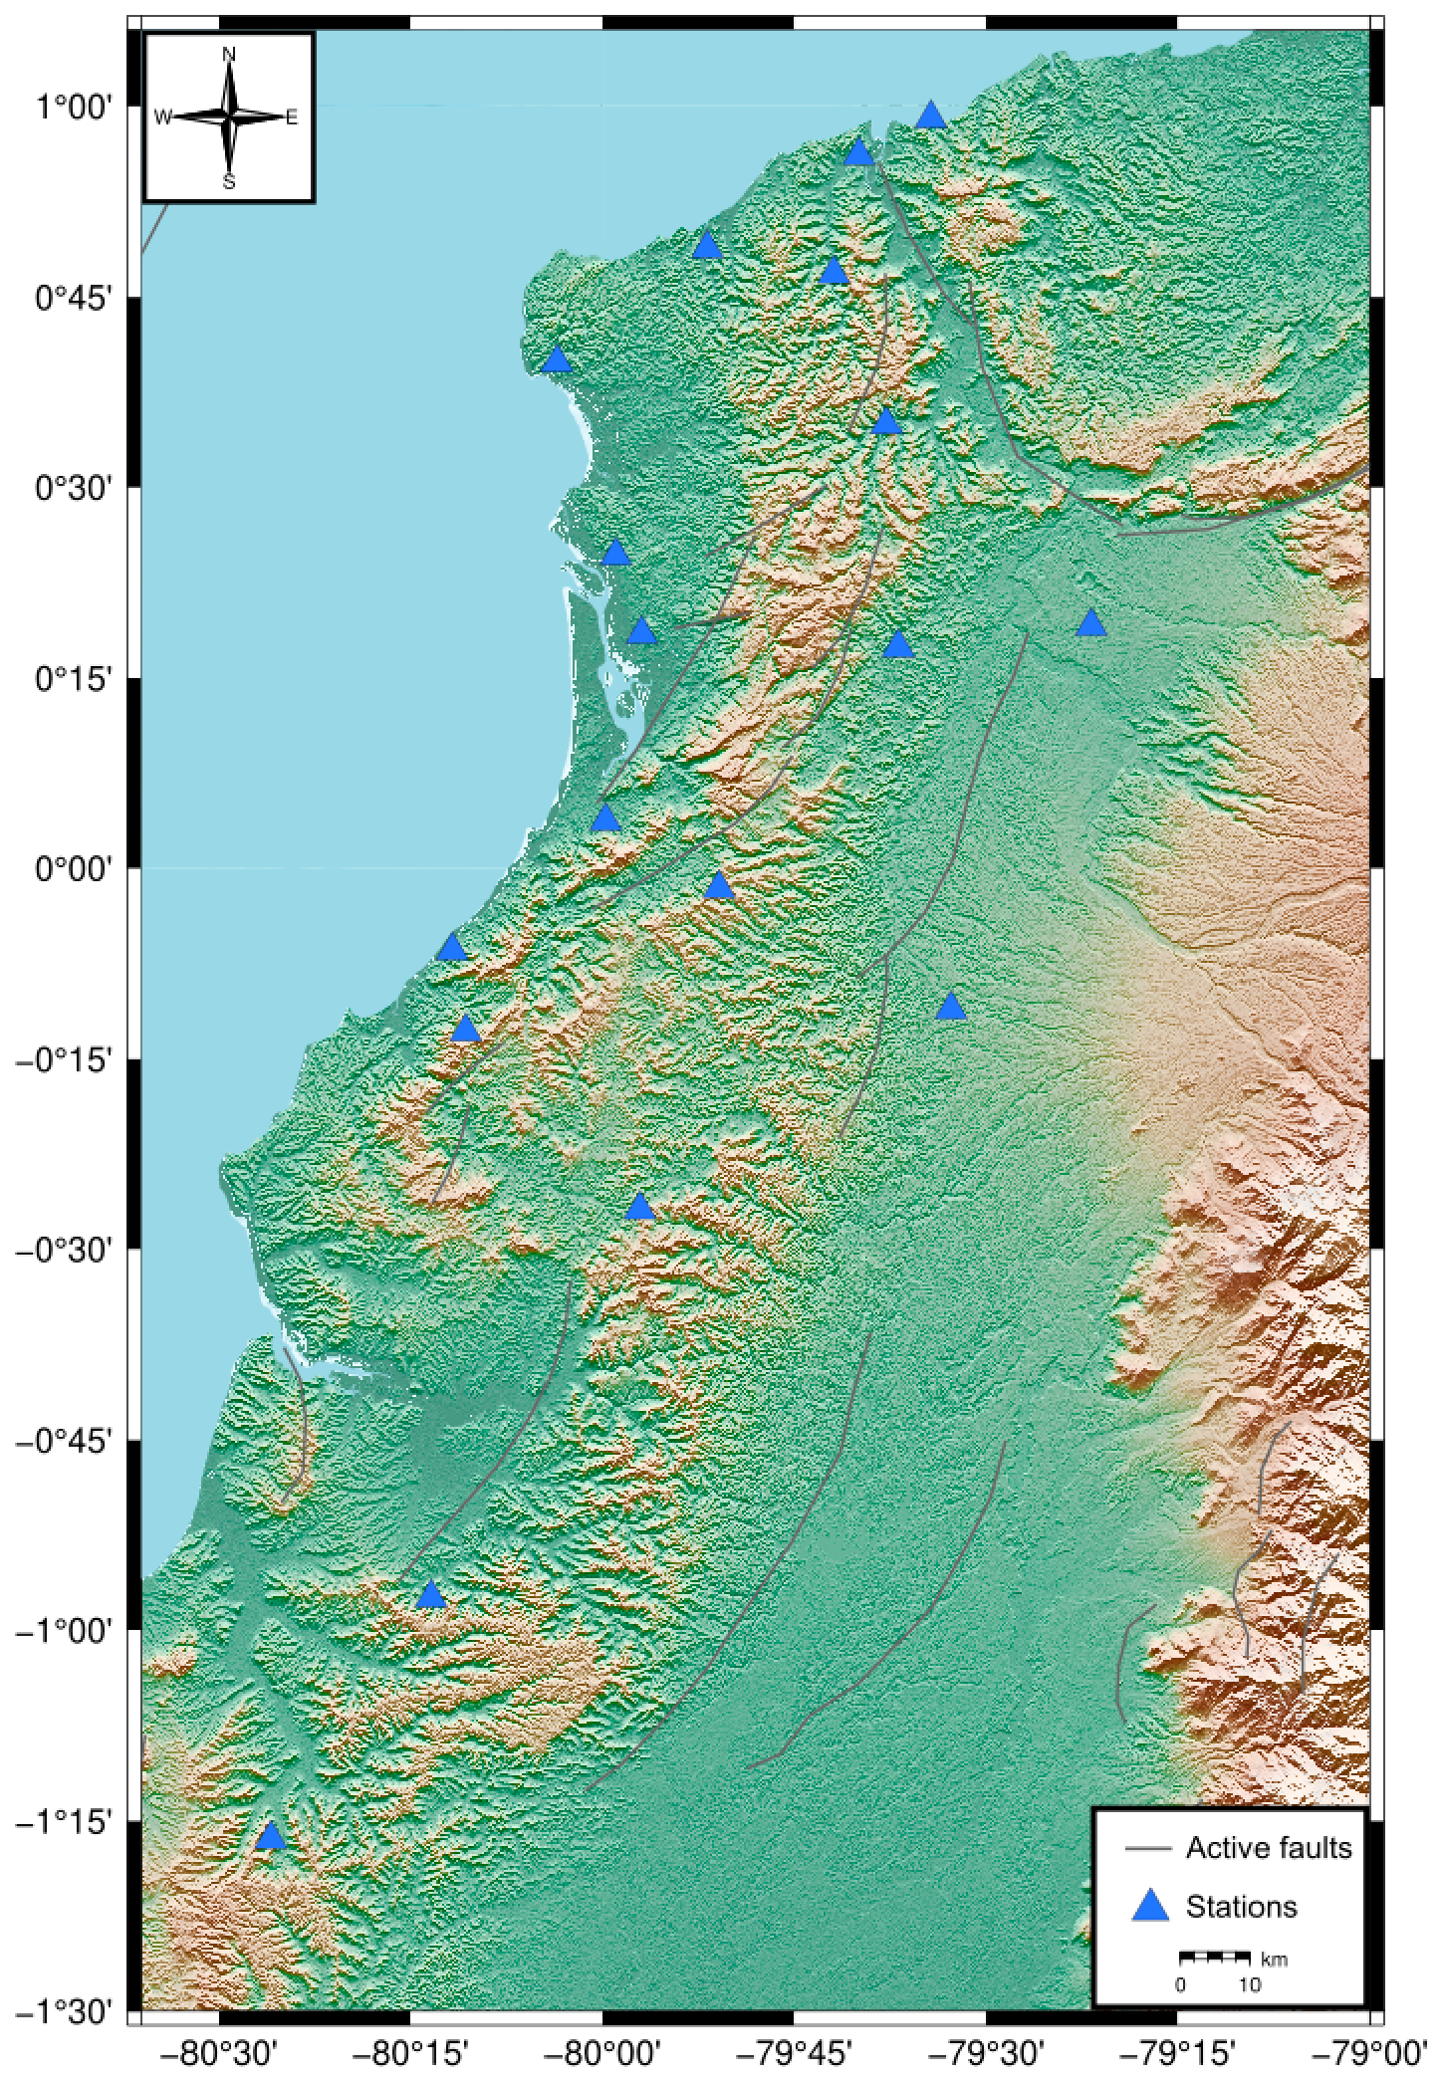
We downloaded 20 stations’ continuous waveform data for July 2016 from the IRIS Data Management Center (www.iris.edu) 8G network (the station distribution is shown in Figure 1), and the continuous waveforms were sampled at 0.01 s. We used the LOC-FLOW workflow [20] for Earthquake relocation. In this process, PhaseNet was employed for P-wave and S-wave phase picking, with a threshold of 0.3. The distance–travel time distributions for P and S waves are shown in Figure 2, and the linear trends indicate the reliability of the phase picks. We adopted the one-dimensional velocity model of León-Ríos et al. [17] for relocation, as this model is more suitable for the study region than the global velocity models PREM [21] and Crust1.0 [22], and its reliability has been demonstrated in multiple previous studies [23,24,25,26]. Phase association was conducted using REAL. Then, we used the VELEST code [27] to perform absolute locations, retaining events with time residuals within 0.3 s. Finally, we applied the HypoDD code [28] for relative relocation to mitigate the influence of the velocity model. The max number of neighbors per event was set as 20. The min number of links required to define a neighbor was set as 8. The min number of links per pair saved was set as 8. The max number of links per pair saved was set as 20. We calculated the focal magnitudes using the empirical formula of Hutton and Boore (1987) [29]. Additionally, we adopted the jackknife method to estimate the uncertainty of our relocated event locations. We built 20 different subsets of all phase arrival times, each with 10% of the travel-time data omitted but ensuring the remaining data covers all the events, and then used each subset to calculate the locations using the hypoDD program. Then, we compared the relocation results from all subsets with the location derived by using all of the data.

2.3. Surface Waveform Modeling

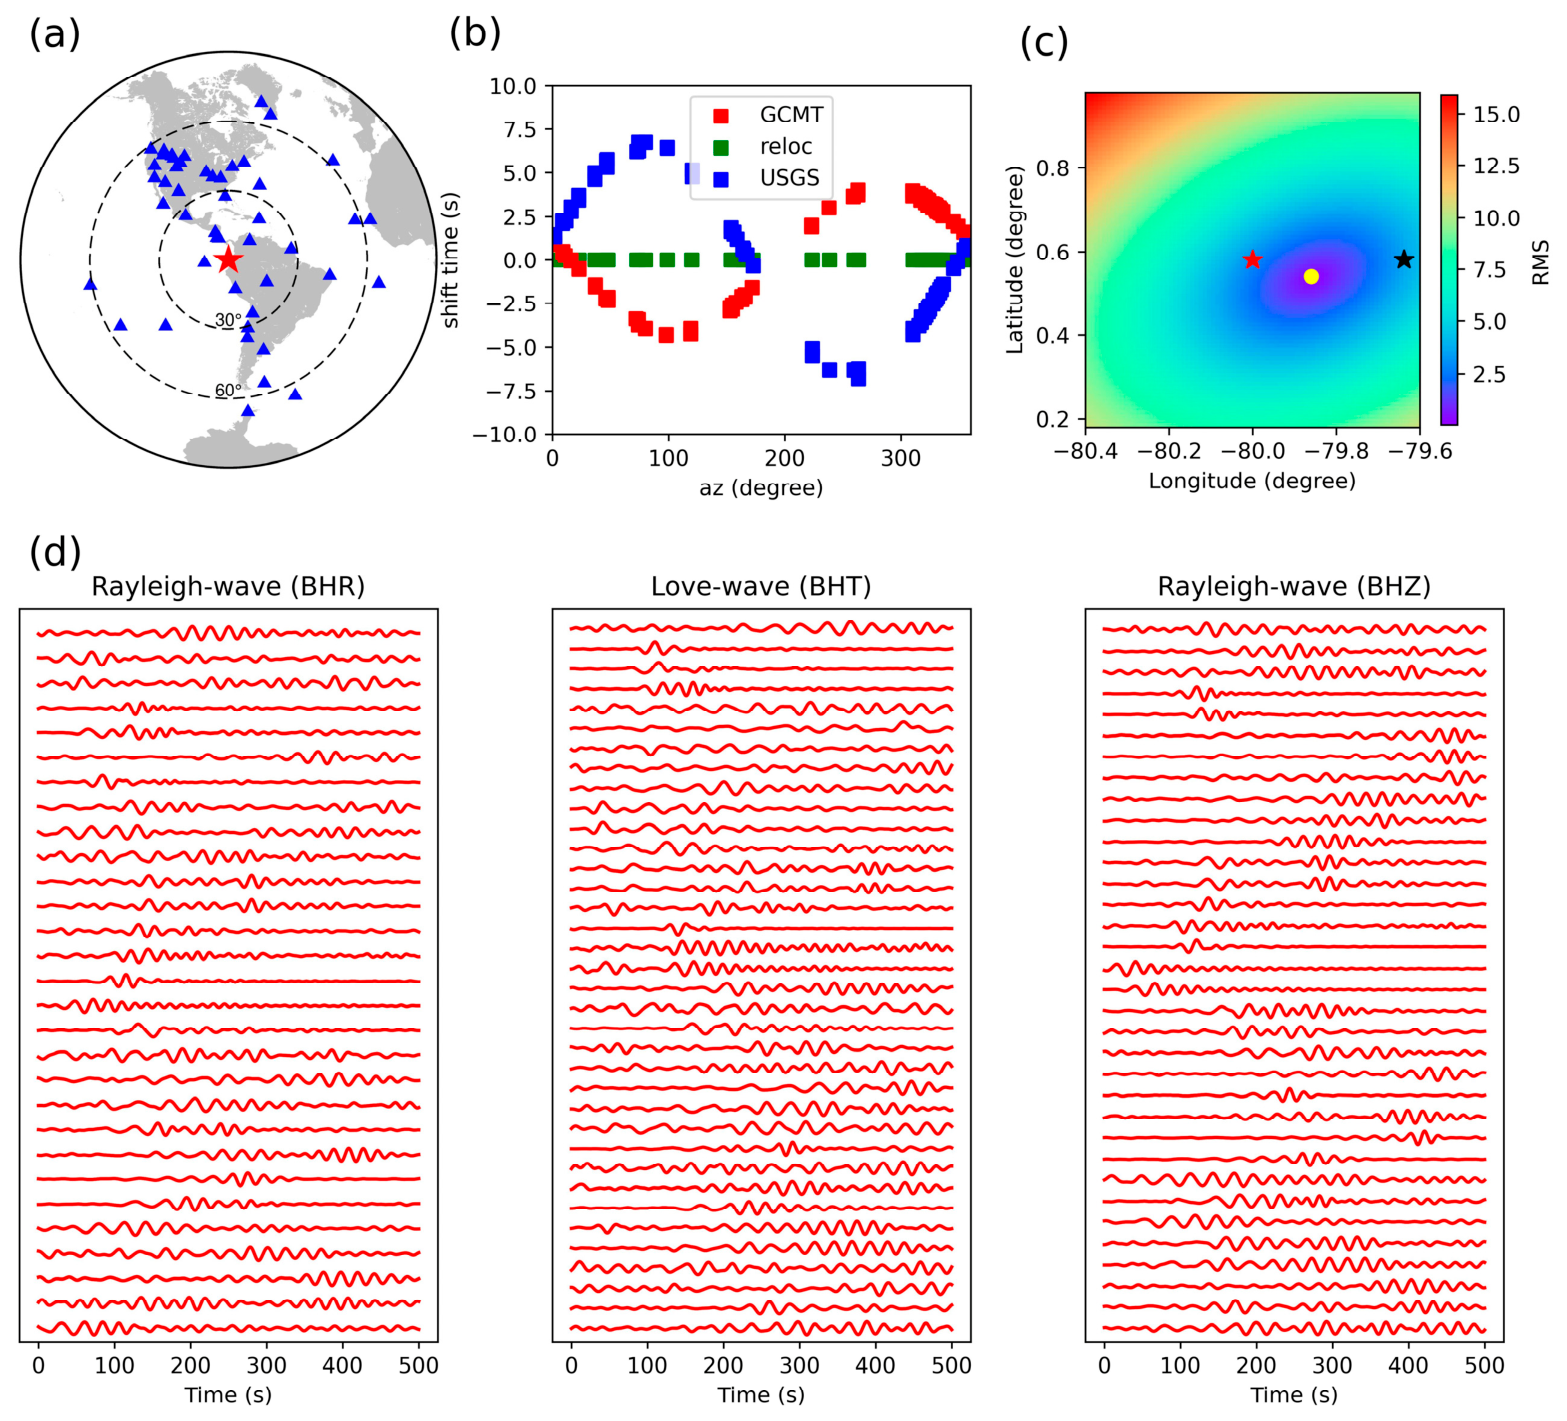
To verify the influence of material properties on moderate-to-strong earthquakes in the Ecuador subduction zone, the longitude and latitude of historical earthquakes and their uncertainties serve as an important constraint. Different earthquake catalogs typically report location uncertainties exceeding 20 km. Based on the Wang method [30], we performed horizontal relative relocation using teleseismic surface-wave cross-correlation. Surface waveform data for each event were downloaded from IRIS using ObsPy, with the instrument response subsequently removed. For relocation purposes, stations from the II, G, and GE networks were selected based on the long-term operational stability of their permanent observatories. Waveforms were downloaded for stations within epicentral distances of 10° to 90° and rotated to the great-circle path. We selected the 11 July 2016 Mw 5.9 event as the reference to perform surface waveform relocation for other historical earthquakes. Theoretically, for event pairs with similar focal mechanisms, the surface-wave time shifts recorded at the same stations reflect the magnitude of location deviation and follow a cosine relationship (Figure 3), that is, larger positional deviations correspond to larger time shifts. Waveforms were filtered between 0.01 Hz and 0.05 Hz. We set the time window from 100 s before to 400 s after the predicted surface-wave arrival, and each event pair was required to have a cross-correlation coefficient above 0.75. We then constructed an objective function and performed a grid search to determine the optimal location. The objective function was defined as the minimum root-mean-square (RMS) difference between the observed time shifts and the theoretical travel-time differences due to location offset, with a grid cell size of 0.01°. Bootstrap resampling was applied by randomly selecting 70% of the stations for each event to estimate the location uncertainty. Additionally, to evaluate the influence of variations in focal mechanism and depth, we synthesized theoretical waveforms using the FK program based on actual station epicentral distances and azimuths and tested the same relocation procedure on these synthetic data.

2.4. Depth-Phase Modeling

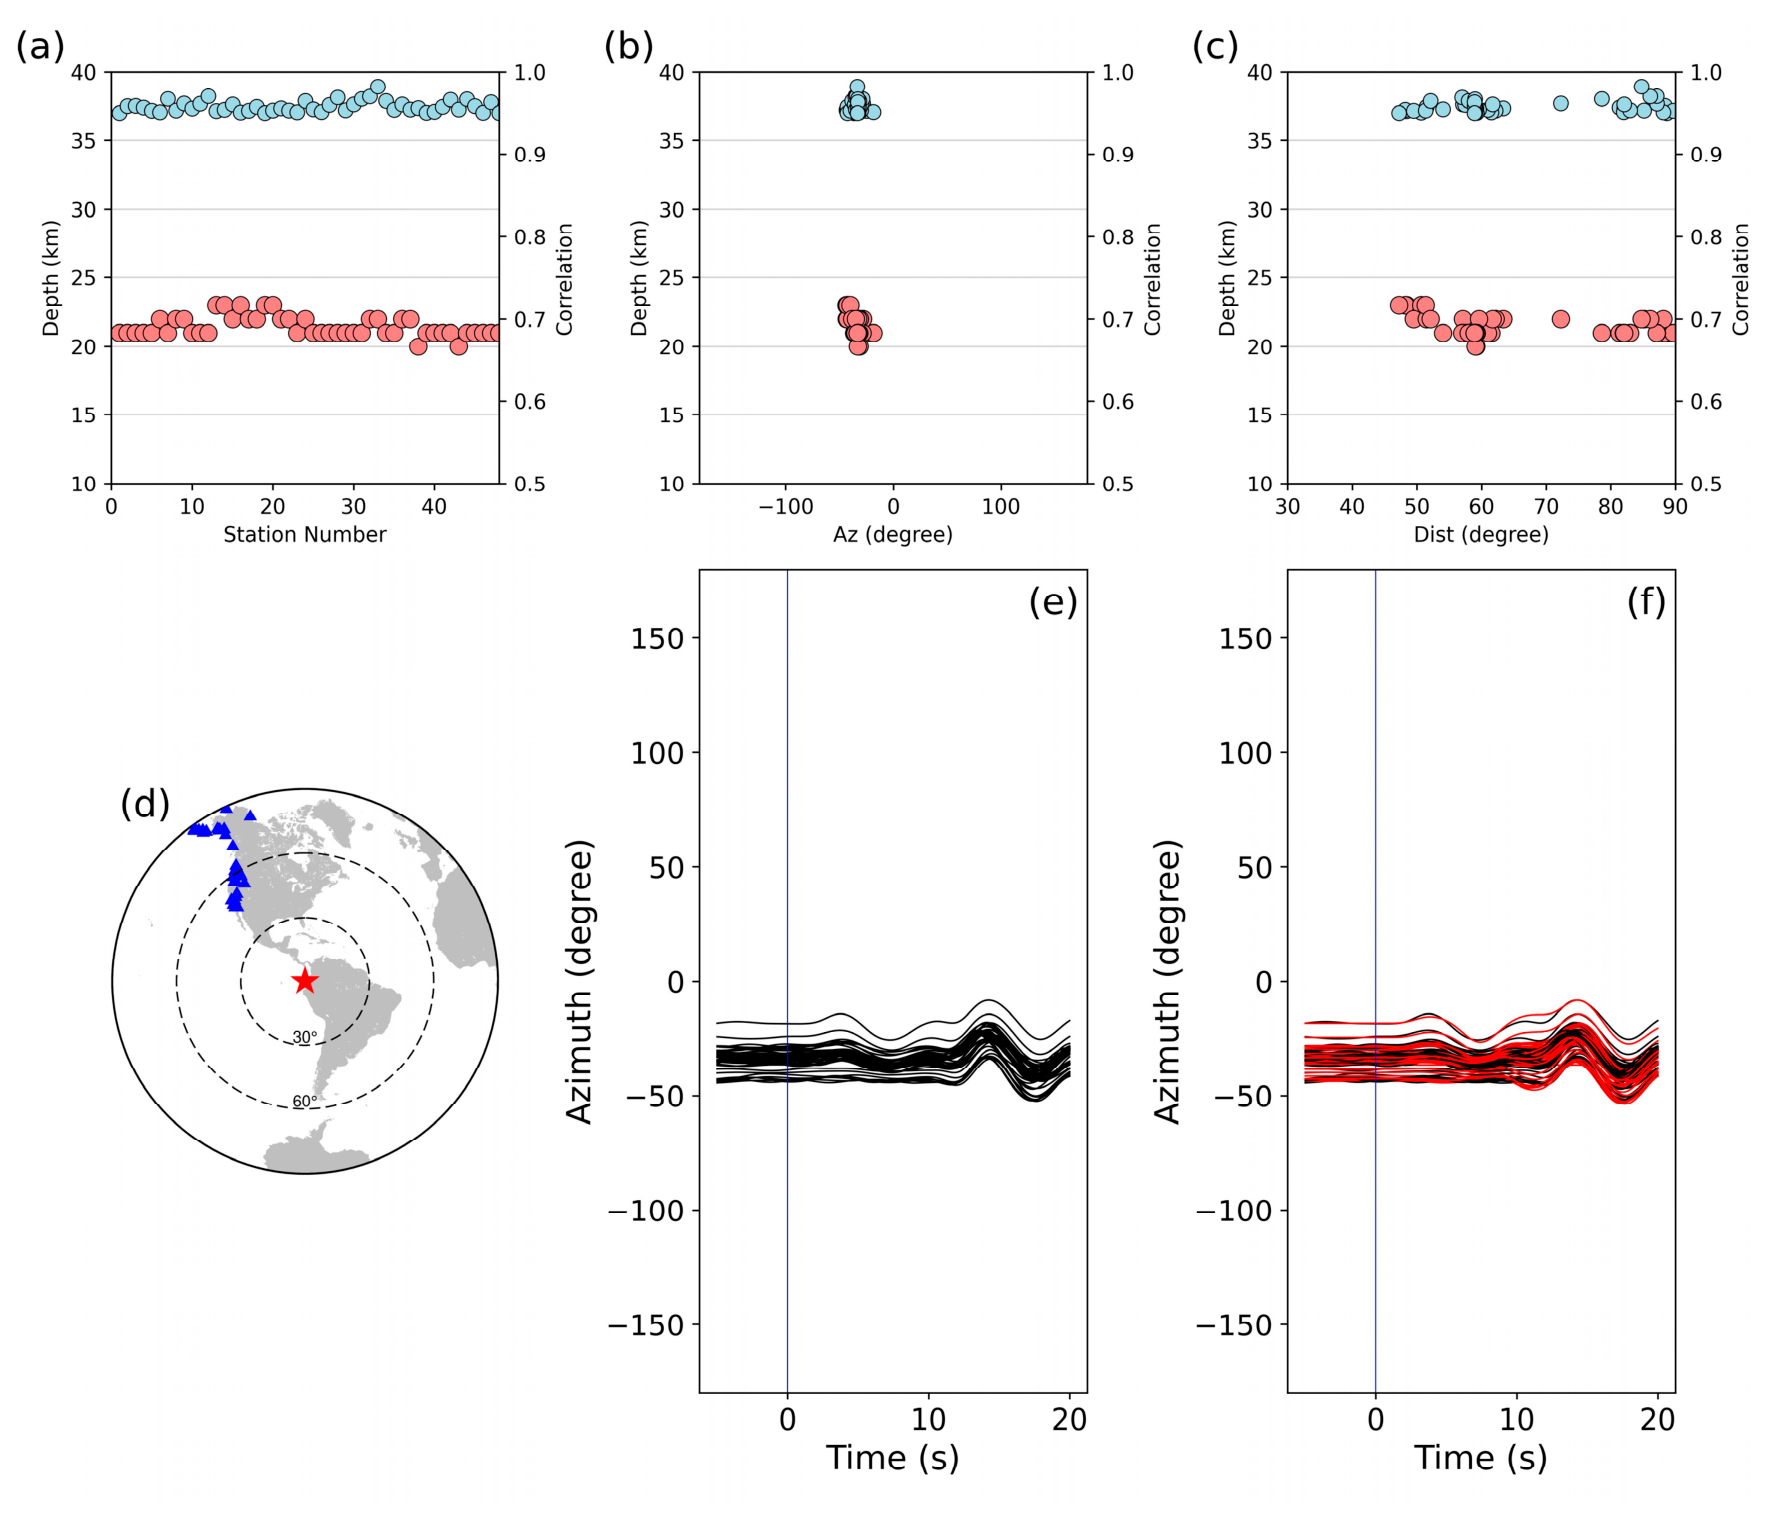
The depth parameter also plays a critical role in structural interpretation. We also downloaded the data from all available networks in IRIS, with waveforms downloaded for stations located at epicentral distances ranging from 30° to 90°. Based on the principles of the Wang method [31], we refined the depths of these earthquakes using depth-phase modeling. Theoretical waveforms were computed using the Multitel3 program [32], which incorporates crustal-reflected teleseismic phases such as P, pP, sP, PcP, pPcP, sPcP, S, sS, ScS, and sScS and offers high computational efficiency. Both observed and synthetic waveforms were filtered accordingly: for events of Mw ≥ 5.2, the frequency band of 0.02–0.2 Hz was used (Figure 4). The cross-correlation window was set from 5 s before to 20 s after the P-wave arrival. Waveform cross-correlation coefficients were required to exceed 0.8, with a maximum time shift allowed of 1 s. The final depth for each event was taken as the mean of all acceptable depth estimates, with uncertainties expressed as the standard deviation.

3. Results

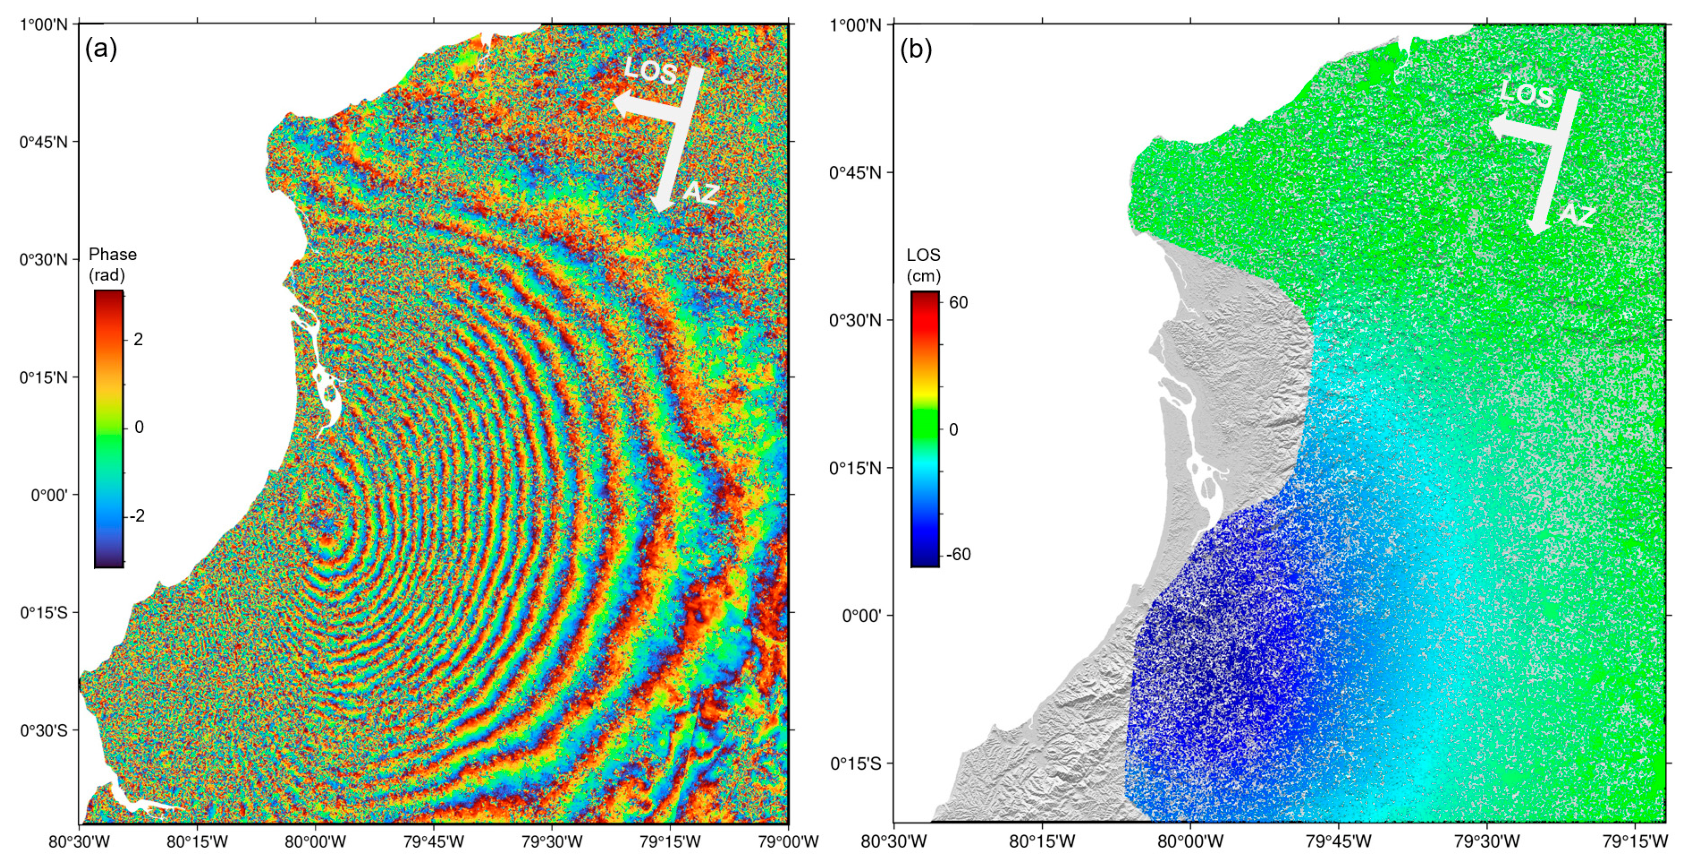
The coseismic LOS displacement field observed via InSAR (Figure 5) reveals significant surface deformation associated with the Mw 7.8 earthquake that struck Ecuador on 16 April 2016. The deformation field exhibits an overall elliptical pattern, with the long axis oriented approximately NE–SW, consistent with the strike of the Ecuadorian coastline and the regional subduction zone. Spatially, the deformation is predominantly concentrated in the coastal area near the epicenter, covering an affected region of approximately 200 km × 100 km. In the coastal zone, negative LOS displacements are observed, with a maximum deformation of about 60 cm; toward the northeastern inland area, the LOS displacements transition to positive values, with a maximum displacement of approximately 20 cm. From the coast inland, the deformation gradient changes sharply over a horizontal distance of about 30 km. Our results are consistent with previous studies [33,34]. Furthermore, the spatial decay characteristics of the LOS displacement field show that the deformation magnitudes decrease rapidly and approach zero in the inland areas farther from the coast, suggesting that the surface deformation effects of this earthquake are mainly confined to the offshore–coastal region.
In addition, we also processed the ascending-track data. Consistent with the results of Béjar-Pizarro et al. [33] and Yi et al. [34], the interferograms derived from the ascending-track data exhibited very poor coherence. Therefore, they were not subjected to phase unwrapping and are not presented in this study.
The InSAR coseismic deformation field provides regional-scale spatial distribution characteristics of surface deformation, offering a perspective on the shallow deformation behavior of the subduction zone that is independent of seismic relocations. Specifically, InSAR helps us identify zones where deformation gradients change markedly along the subduction strike—features that cannot be revealed by seismicity data alone. InSAR thus constitutes a valuable spatial reference framework for our interpretation.
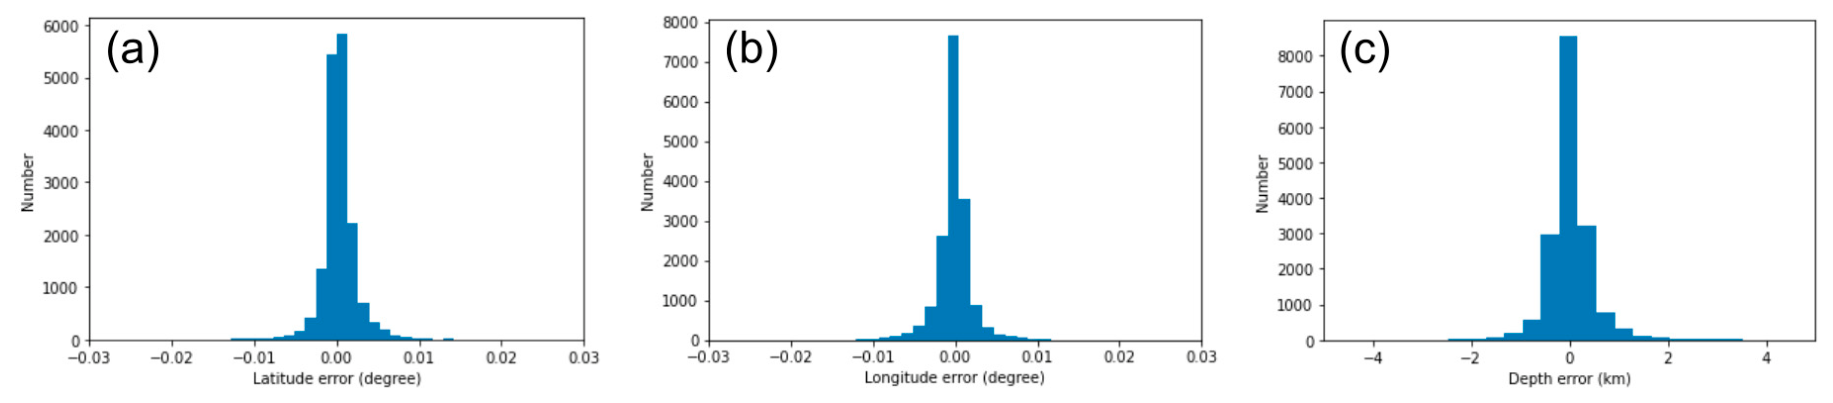
Through careful processing of the regional seismic network catalog data and the combined application of absolute and relative location methods, we successfully obtained high-precision hypocentral localizations for 895 seismic events within the study area. The local magnitudes (Ml) of aftershocks range from 0.44 to 4.19. These events encompass the mainshock, its aftershock sequence, and background microseismicity. The uncertainty assessment following relocation is shown in Figure 6. Statistical results indicate that the horizontal location uncertainties for the seismic events are generally below 0.01° (approximately 1 km), while the depth uncertainties are constrained to within 2 km (the Figure 6 jackknife scatter measures internal relocation precision and does not include velocity model uncertainty). This level of precision represents a significant improvement over conventional earthquake catalogs, enabling us to more clearly delineate the spatial distribution characteristics of seismicity and their correspondence with regional material units.
We have conducted a systematic relocation study of 13 historical moderate-to-strong earthquake events that occurred in northern Ecuador, with a primary focus on refining their horizontal positions and focal depths. To ensure the reliability of the relocation results, we consistently applied the focal mechanism solutions of a reference event as constraints for all events, a strategy that effectively mitigates systematic biases arising from differences in focal mechanisms. It is worth noting, however, that five of these events, located in submarine areas, exhibited relatively poor surface-wave cross-correlation results, likely due to the complexity and lateral heterogeneity of regional velocity structures. For the horizontal locations of these five events, we adopted the relocation results previously reported by Soto-Cordero et al. [26] and Agurto-Detzel et al. [35] for this region. The fitting results for some events show only one-sided azimuthal coverage, which may be due to the large azimuthal range covered by the ocean, and the final depth-matching results are consistent with those of previous studies [26,35].
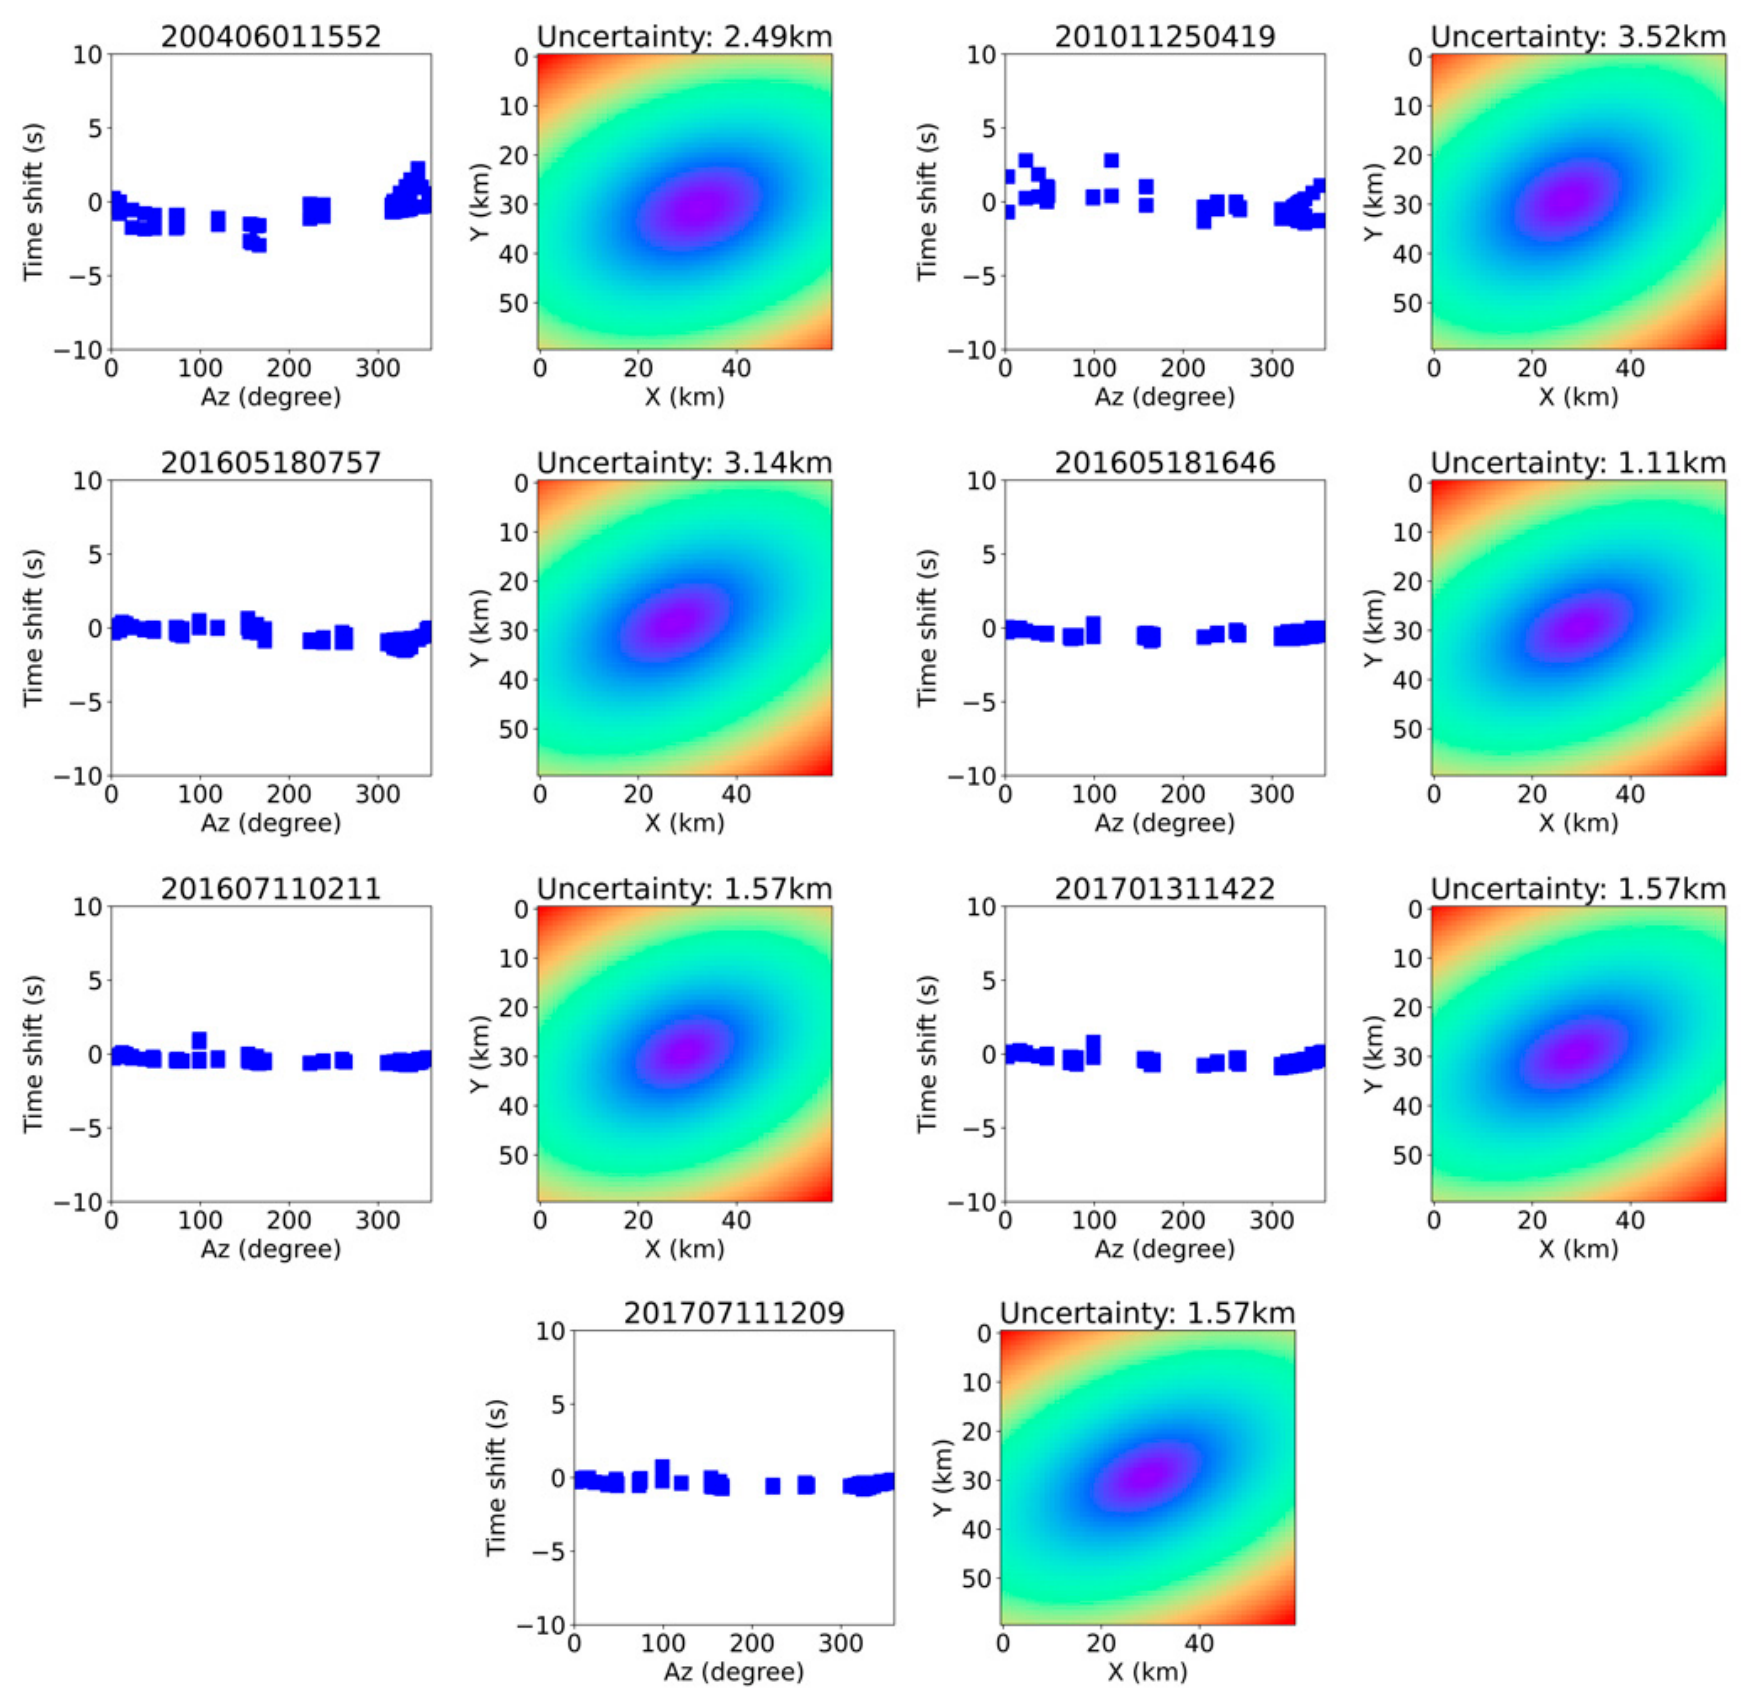
Through comparative analysis, we found that the epicentral locations and focal depths obtained from our relocation procedure yield substantially smaller uncertainties than those reported in the USGS and GCMT catalogs, demonstrating that our relocation strategy and data processing workflow offer clear advantages in improving the spatial resolution of these events. Figure 7 systematically evaluates the influence of focal mechanism assumptions and depth parameterization on the final relocation outcomes. The quantitative results indicate that the horizontal location uncertainties for all 13 events are less than 4 km, a level of precision that holds significant implications for regional seismogenic environment studies and seismic hazard assessments.
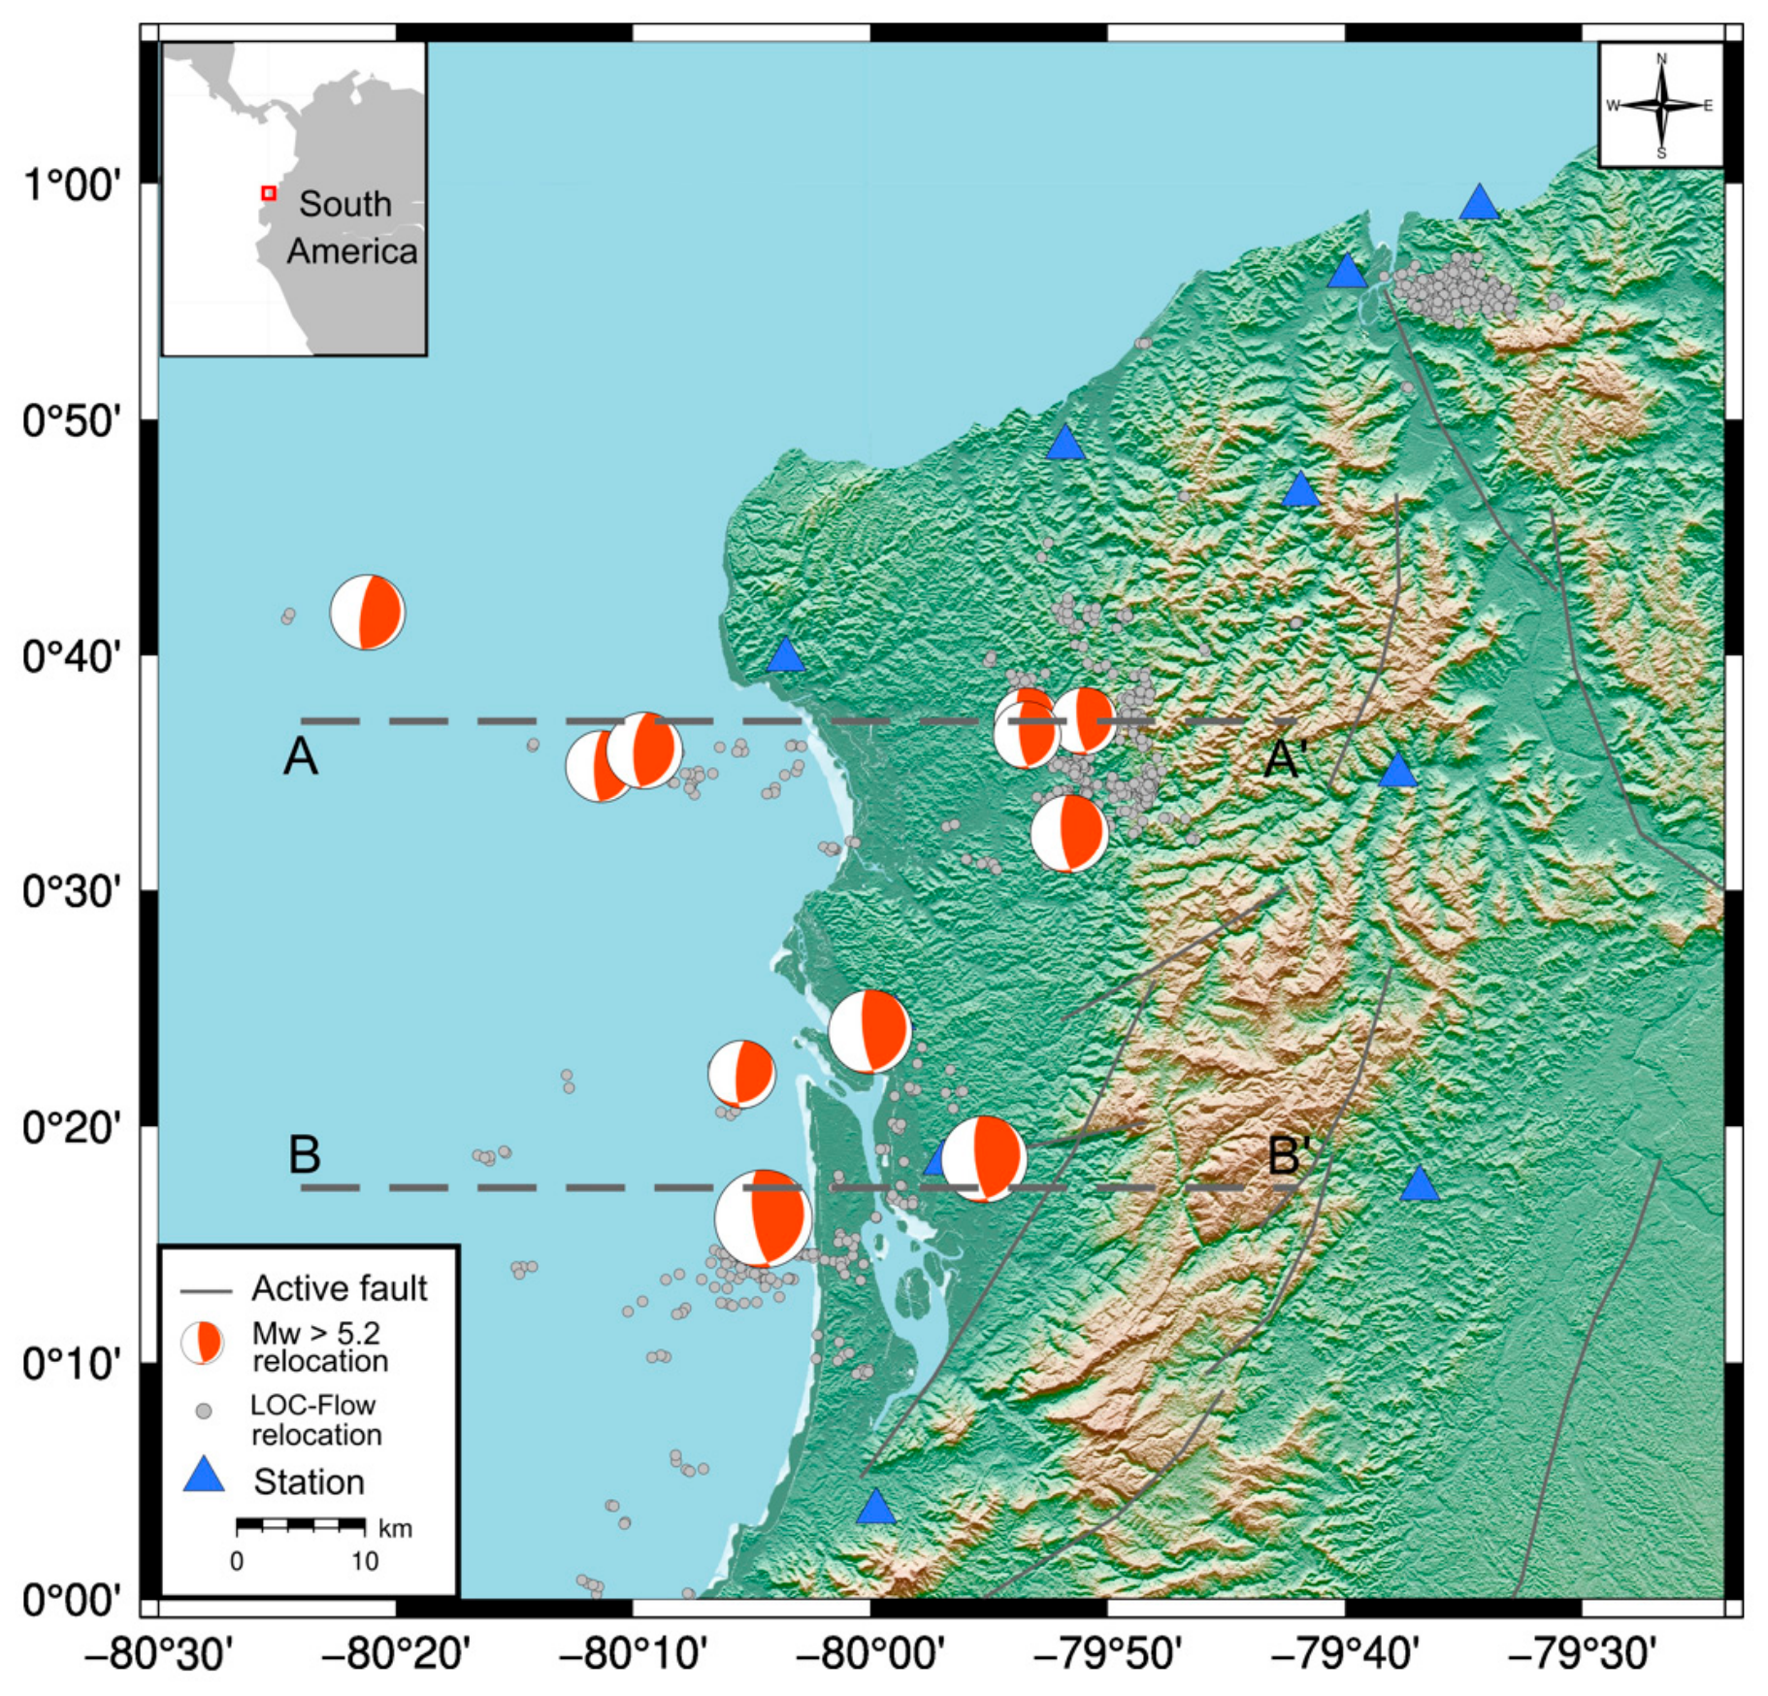
In terms of spatial distribution, the aftershock activity of the Mw 5.9 mainshock is predominantly developed to the east of the mainshock epicenter and exhibits a north–south trending pattern, suggesting that the mainshock rupture likely propagated in a nearly north–south direction (Figure 8). The focal depths of these aftershocks are mostly concentrated around 20 km, indicating that the predominant brittle deformation occurs within the middle to upper crust. Furthermore, a portion of the microseismic activity is distinctly distributed along the interface between the Carnegie Ridge subduction zone and the Ecuadorian continental margin, which may reflect the complex mechanical coupling state between the subducting slab and the overlying plate.
Notably, in the Esmeraldas region in the northeastern part of the study area, we observed a significant seismic cluster (Figure 8). The earthquake density within this cluster is markedly higher than in the surrounding areas, and it exhibits sustained spatiotemporal evolutionary activity, suggesting that its seismogenic mechanism may be related to local fluid perturbation rather than being a simple mainshock–aftershock sequence. The activity of the Esmeraldas earthquake swarm is not a primary focus of this study. Its spatiotemporal evolution will be addressed in Section 4.3 of the Discussion. For more detailed hypocentral characteristics of this swarm, readers are referred to Hoskins et al. [24].
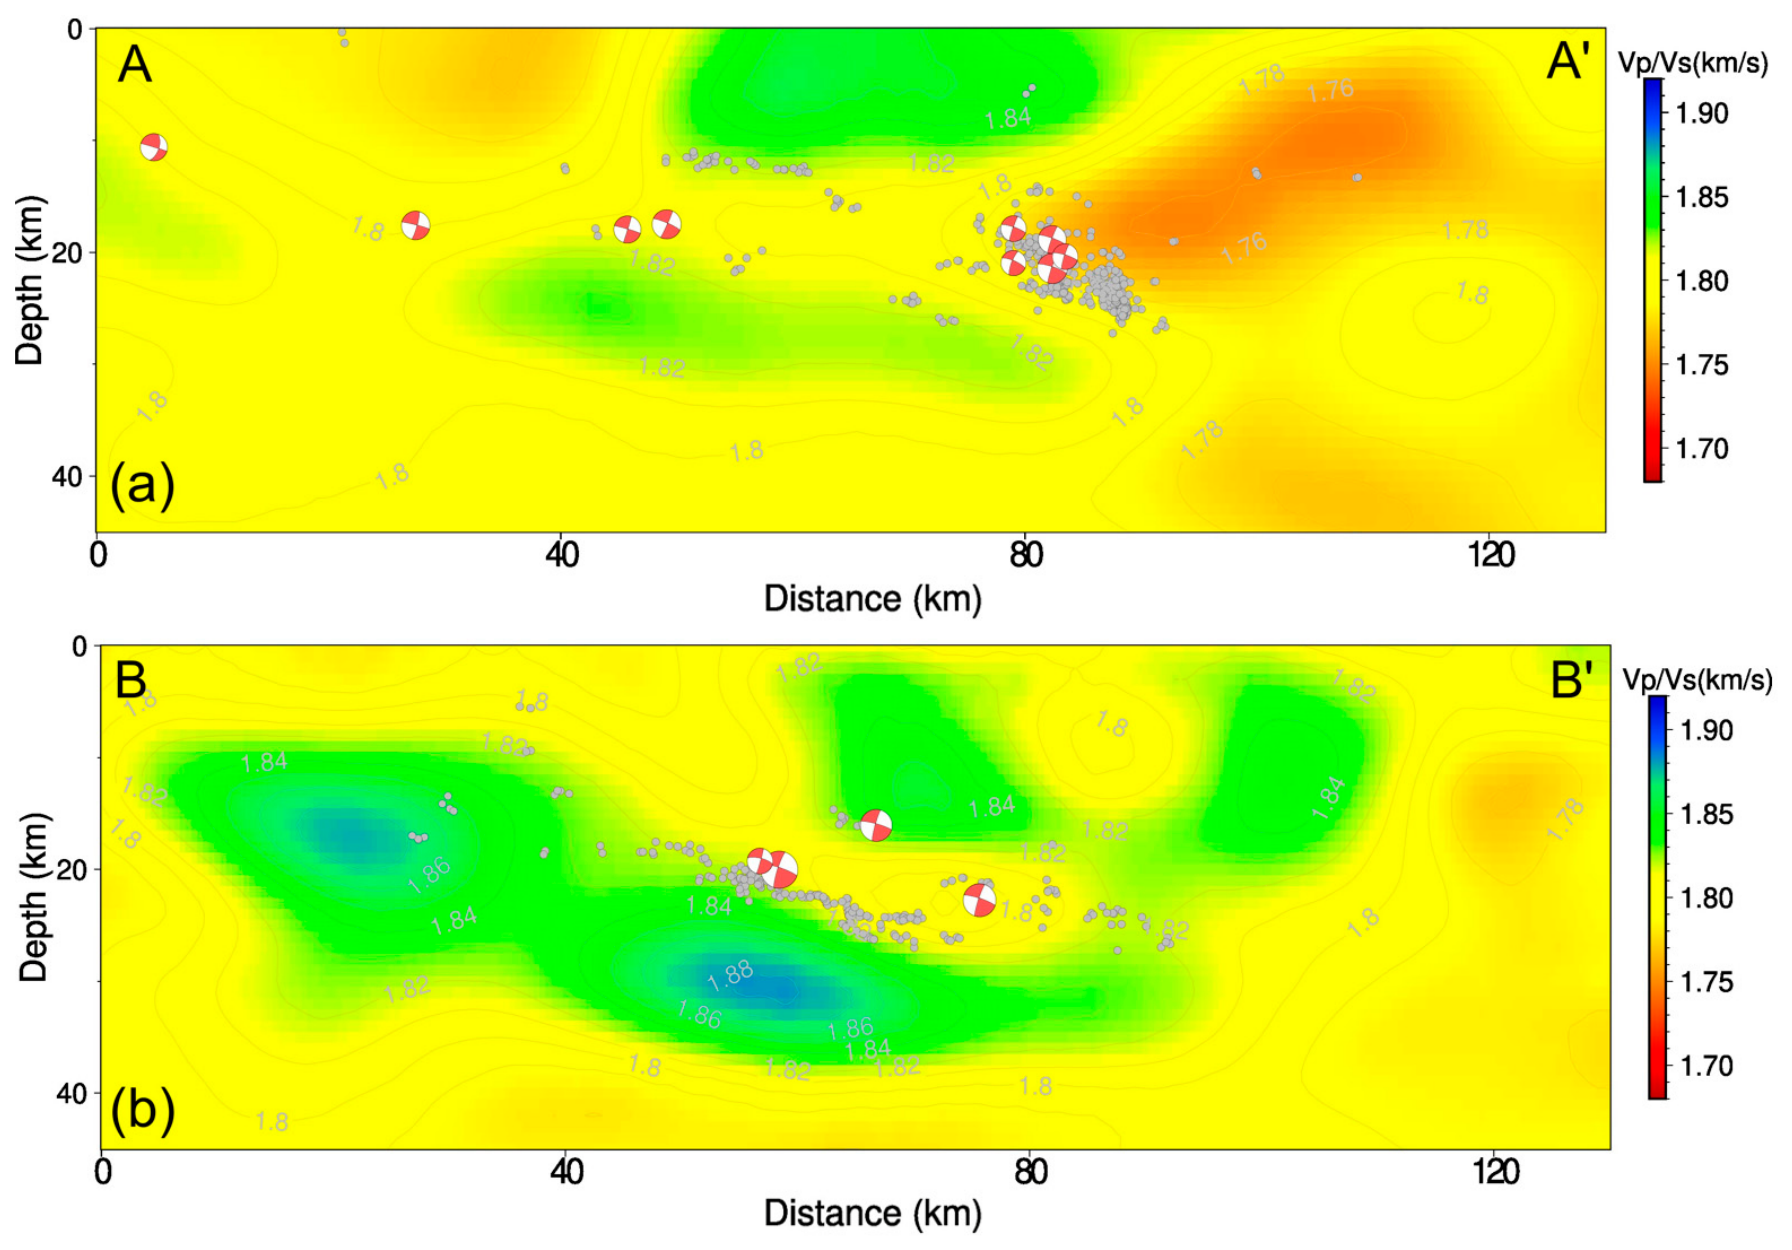
Figure 9 presents the Vp/Vs tomography results along the east–west trending cross-sections AA’ (Figure 9a) and BB’ (Figure 9b) across the hypocenter region. We used GMT tools to orthogonally project the discrete Vp/Vs data points from the three-dimensional model onto each profile line, converting them into a coordinate system of along-profile distance (km) versus depth (km). Subsequently, the minimum curvature spline interpolation method was applied to grid the projected discrete points into regular two-dimensional cross-sectional images, with grid spacings of 0.5 km horizontally and 1 km vertically. The profiles clearly show that the vast majority of seismic events—including the mainshock and the subsequent dense aftershock sequence—are not uniformly distributed across the entire section but are instead highly concentrated within a moderate Vp/Vs ratio range of approximately 1.78–1.82. Within the rock physics framework, this Vp/Vs range is commonly interpreted as an indicator of optimal coupling among crustal fluid distribution, pore connectivity, and effective stress state, which together provide the most favorable conditions for sustained brittle fracture propagation [4,36].
It is particularly noteworthy that the aftershock activity exhibits a pronounced “selective migration” pattern in space—its spatial extent tends to be concentrated within this moderate Vp/Vs “mechanically favorable zone” and shows no significant expansion into the anomalously high or low Vp/Vs regions flanking the section. Extremely high Vp/Vs ratios (typically indicative of high-pressure fluid entrapment or partial melting) and extremely low Vp/Vs ratios (generally reflecting dry, compact, or highly rigid rock masses) appear to impede rather than promote aftershock occurrence. This observational evidence suggests that the coseismic and postseismic stress adjustments triggered by the mainshock—along with their associated energy release and rupture propagation paths—are strongly governed by the intrinsic physical property heterogeneities of the medium. Within zones characterized by relatively uniform physical properties and a stable fluid–chemical environment, stress can be effectively released through successive small-scale fracturing. In contrast, at the boundaries where physical properties change abruptly, the sharp gradients in Vp/Vs ratio likely correspond to step changes in rock strength or permeability; such physical interfaces may act as “mechanical barriers” that inhibit rupture propagation across them rather than facilitating its extension.
The above observational characteristics are in good agreement with the independent findings of León-Ríos et al. [4] in the same region. This consistency not only robustly supports the reliability and precision of our earthquake relocation scheme but also deepens our integrated understanding of the physical state of the hypocentral-zone medium and the underlying mechanisms governing the evolution of aftershock activity in this region.
In addition, we independently constrained the focal depth of each event using depth phases (e.g., pP and sP), as illustrated in Figure 8. These depth-phase observations provide more robust depth constraints compared to travel-time data alone. Our combined surface-wave relocation and depth-phase modeling results reveal that all events are concentrated within regions of the crust or upper mantle characterized by moderate Vp/Vs ratios (Figure 9). As previously discussed, the Vp/Vs ratio serves as a key parameter reflecting the physical properties of rock media and the presence of pore fluids. Moderate Vp/Vs ratios typically suggest the possible development of crack networks or partial fluid saturation within the medium. Such specific material conditions may favor high differential stress accumulation and promote mechanical susceptibility to brittle failure. Consequently, we infer that the material properties of this region exert a significant influence on the nucleation and occurrence of moderate-to-strong earthquakes. This finding contributes to a deeper understanding of the seismotectonic processes in northern Ecuador and provides a scientific basis for future seismic hazard zonation and disaster mitigation efforts in the region.

4. Discussion

4.1. The Influence of Physical Properties on Aftershock Propagation

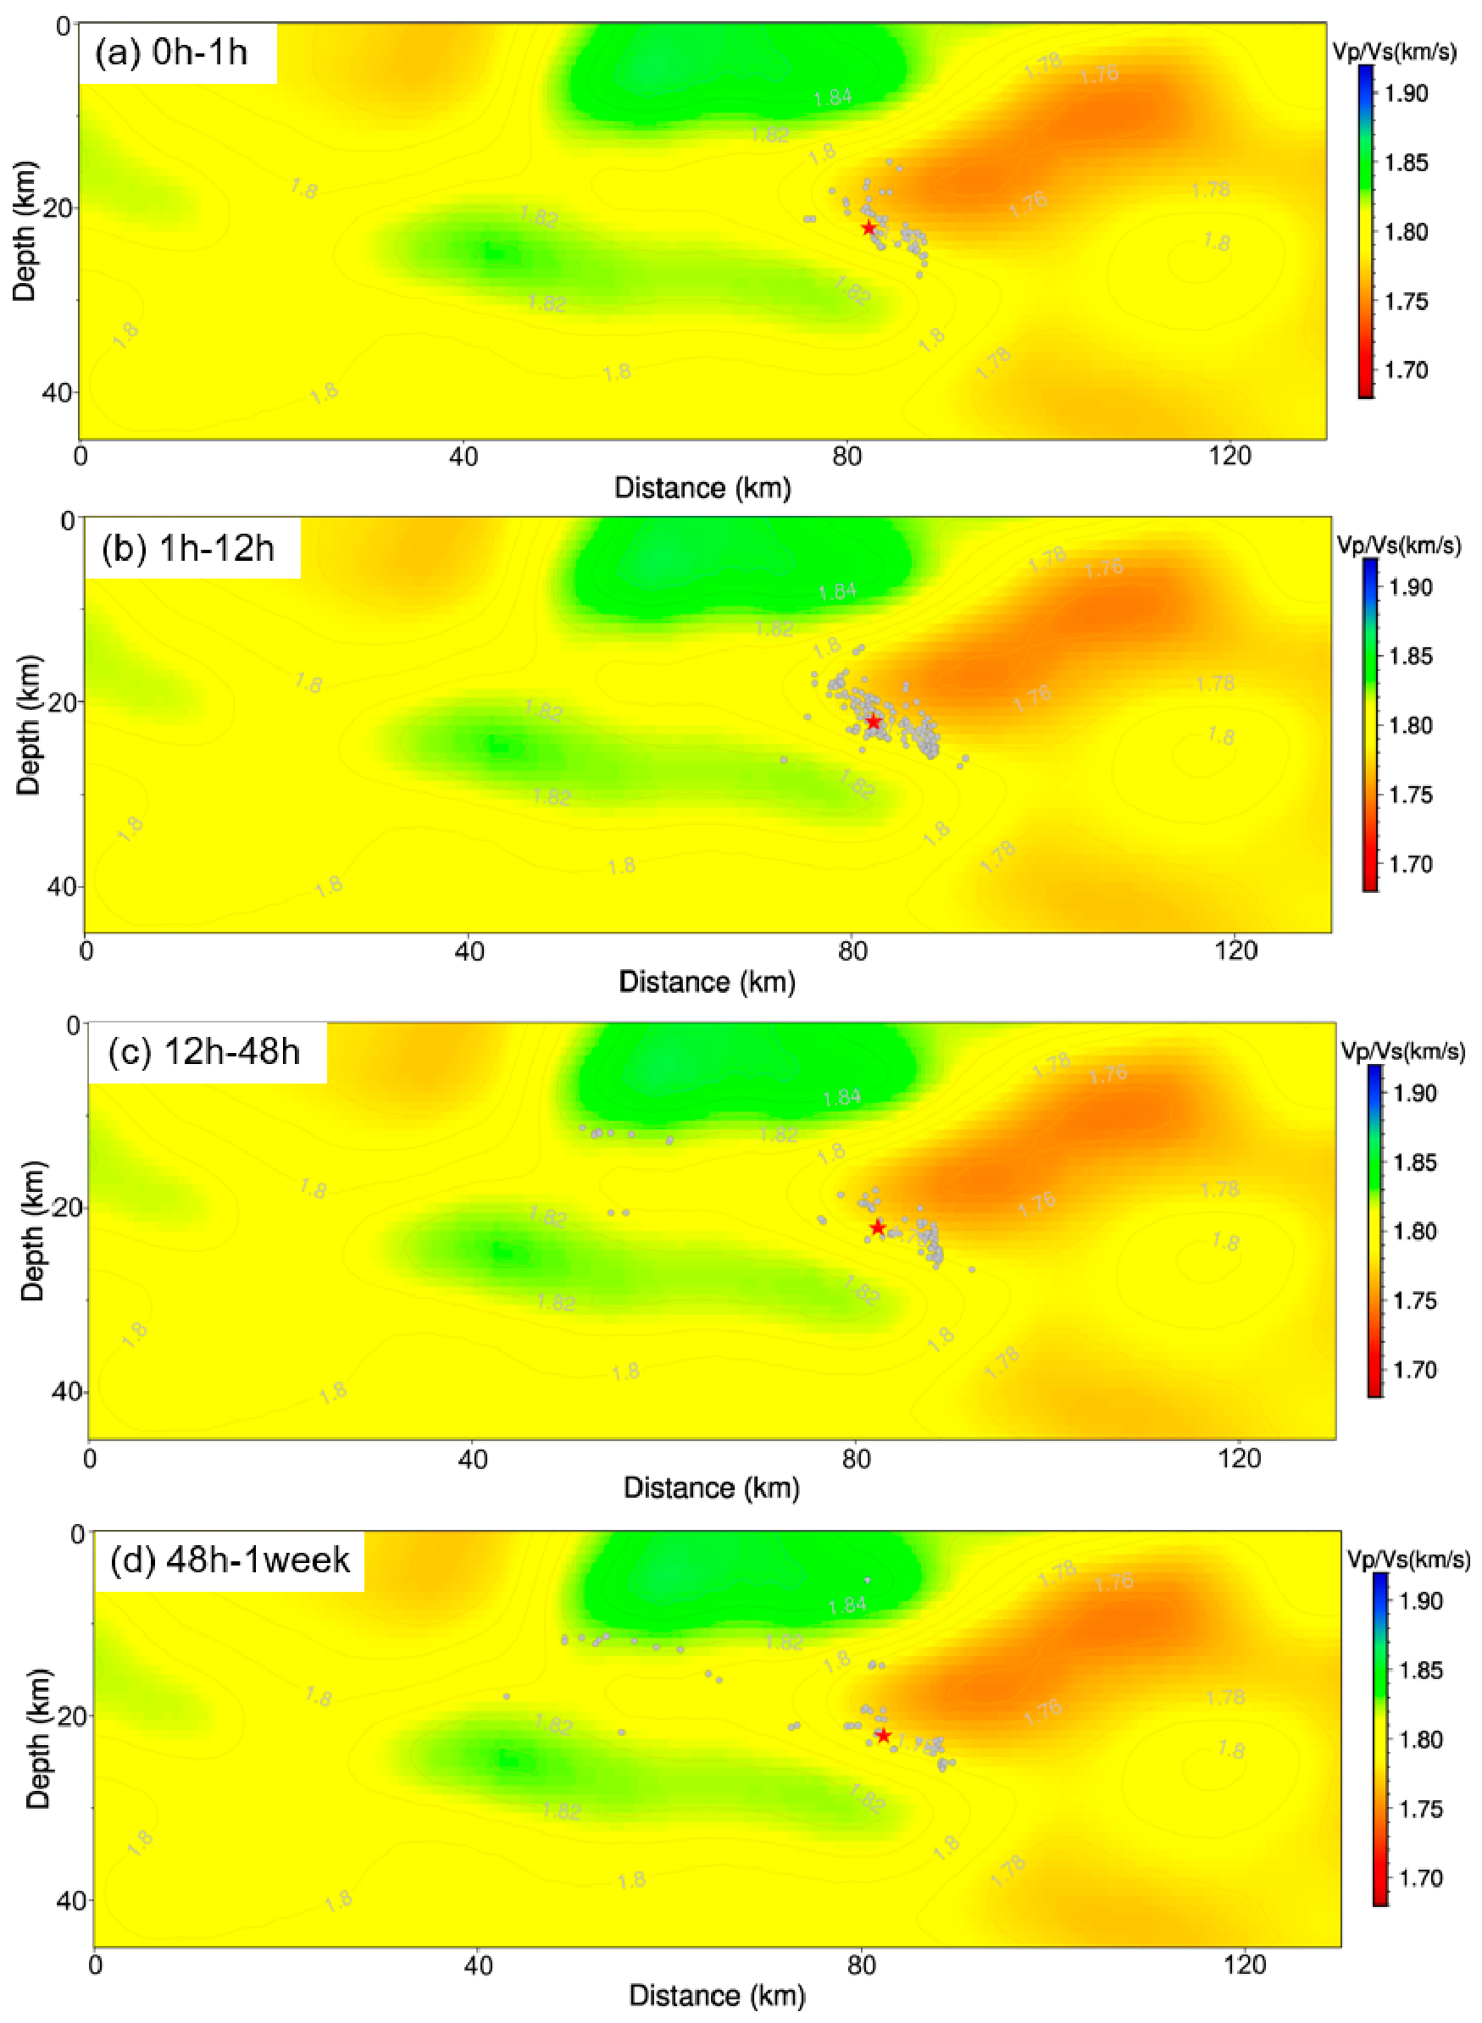
To investigate whether the Vp/Vs (compressional-to-shear wave velocity ratio) anomaly zone exerts an influence on the spatiotemporal propagation of aftershocks, we present the temporal evolution of aftershock activity in Figure 10. During the first hour following the mainshock (Figure 10a), aftershocks were predominantly located in the vicinity of the mainshock and began to expand outward along the boundary of the region characterized by Vp/Vs ratios of 1.78–1.82. Notably, the presence of a low-Vp/Vs anomaly in the shallow crust prevented the aftershocks from propagating vertically upward, suggesting that this low-Vp/Vs region may have acted as a barrier that impeded the upward extension of rupture. From 1 to 12 h after the mainshock (Figure 10b), aftershock activity increased markedly, with a significant rise in event frequency, and the spatial distribution remained concentrated along the boundary of the 1.78–1.82 Vp/Vs anomaly zone, indicating persistent influence of aftershock activity by this boundary belt. Between 12 and 48 h after the mainshock (Figure 10c), although the number of aftershocks decreased, their spatial locations continued to be confined within the boundary of the anomalous Vp/Vs zone, with no evident diffusion. From 48 h to one week after the mainshock, aftershock activity remained concentrated within the interior of the intermediate Vp/Vs ratio region, indicating that this zone continued to exert a constraining effect on aftershock distribution over an extended timescale (Figure 10).
Previously, León-Ríos et al. [4] proposed that the Vp/Vs ratio in subduction zones acts as a “mechanical sweet spot” that effectively governs the propagation of earthquake ruptures. Our findings further support this viewpoint and, building upon it, offer a new insight: this “mechanical sweet spot” effect is not limited to the mainshock rupture process but may also exert sustained constraints over the spatiotemporal evolution and propagation paths of aftershocks. In other words, the region delineated by Vp/Vs structural anomalies not only represents a mechanically favorable zone for rupture initiation but also constitutes a spatial boundary that aftershock activity struggles to cross, thereby profoundly influencing the migration and distribution patterns of aftershock sequences. This discovery provides a novel mechanical perspective for understanding the earthquake rupture process and subsequent aftershock activity and offers important reference constraints for incorporating crustal physical parameters into seismic hazard assessments.

4.2. Spatial Association Between Physical Properties and Moderate-to-Strong Earthquakes

The two large megathrust earthquake events that have occurred in South America demonstrate that seismic anomalies with Vp/Vs values either higher or lower than the regional average exhibit a spatial distribution that correlates well with the boundaries of earthquake ruptures, whereas intermediate values (approximately 1.8) may represent mechanically favorable “sweet spot” regions [4]. Such physical properties manifested at the subduction interface provide favorable conditions for the sustained propagation of ruptures and the migration of aftershocks.
Our relocation results, combined with depth-phase analysis, further reveal that historically documented moderate-to-large earthquakes are all located within regions where the Vp/Vs value is approximately 1.78–1.82, indicating that this ratio range at the subduction interface is conducive to the occurrence of large earthquakes. In contrast, high Vp/Vs anomalies either above or below the subduction interface generally correspond to zones of elevated fluid pressure and reduced rock strength (e.g., serpentinized mantle wedge). Such weakened regions may be incapable of accumulating sufficient strain energy to sustain brittle failure or their ductile deformation behavior may absorb and arrest rupture propagation. Low Vp/Vs anomalies, on the other hand, may represent extremely stiff and well-consolidated rocks; although such lithologies are capable of accumulating high stresses, the presence of high-strength heterogeneities may instead act as barriers that impede rupture propagation.
Thus, a Vp/Vs ratio of approximately 1.78–1.82 at the subduction interface represents an intermediate state relative to the background field—a mechanical “sweet spot”: it is neither so weak as to preclude rupture (as in high-Vp/Vs, fluid-rich zones) nor so strong as to terminate rupture (as in low-Vp/Vs, high-strength barrier zones), thereby providing a potentially favorable environment for the frequent occurrence of large earthquakes. In addition, the Vp/Vs ratio itself may merely be a manifestation of the material properties of the crustal structure in this region, whereas the controlling factors for earthquake nucleation and spatial distribution may be the interfaces/boundaries between materials with different physical properties. The overriding plate in Ecuador likely contains the basal boundaries of some exotic oceanic terranes [37]. The rapid spatial variations in Vp/Vs (i.e., physical-property boundaries) imply significant mechanical contrasts over short distances, and such interfaces of contrasting properties tend to concentrate stress under tectonic loading, thereby becoming favorable sites for earthquake nucleation. Our findings further suggest that moderate-to-large seismic activity in the Ecuador subduction zone is likewise governed by the material properties of the subduction zone region. This inference may provide some reference information for assessing the potential seismic hazard in this region. Nevertheless, our conclusions still require further validation through in-depth investigations of additional subduction zone earthquake case studies.

4.3. Spatiotemporal Evolution of the Swarm in the Esmeraldas Area

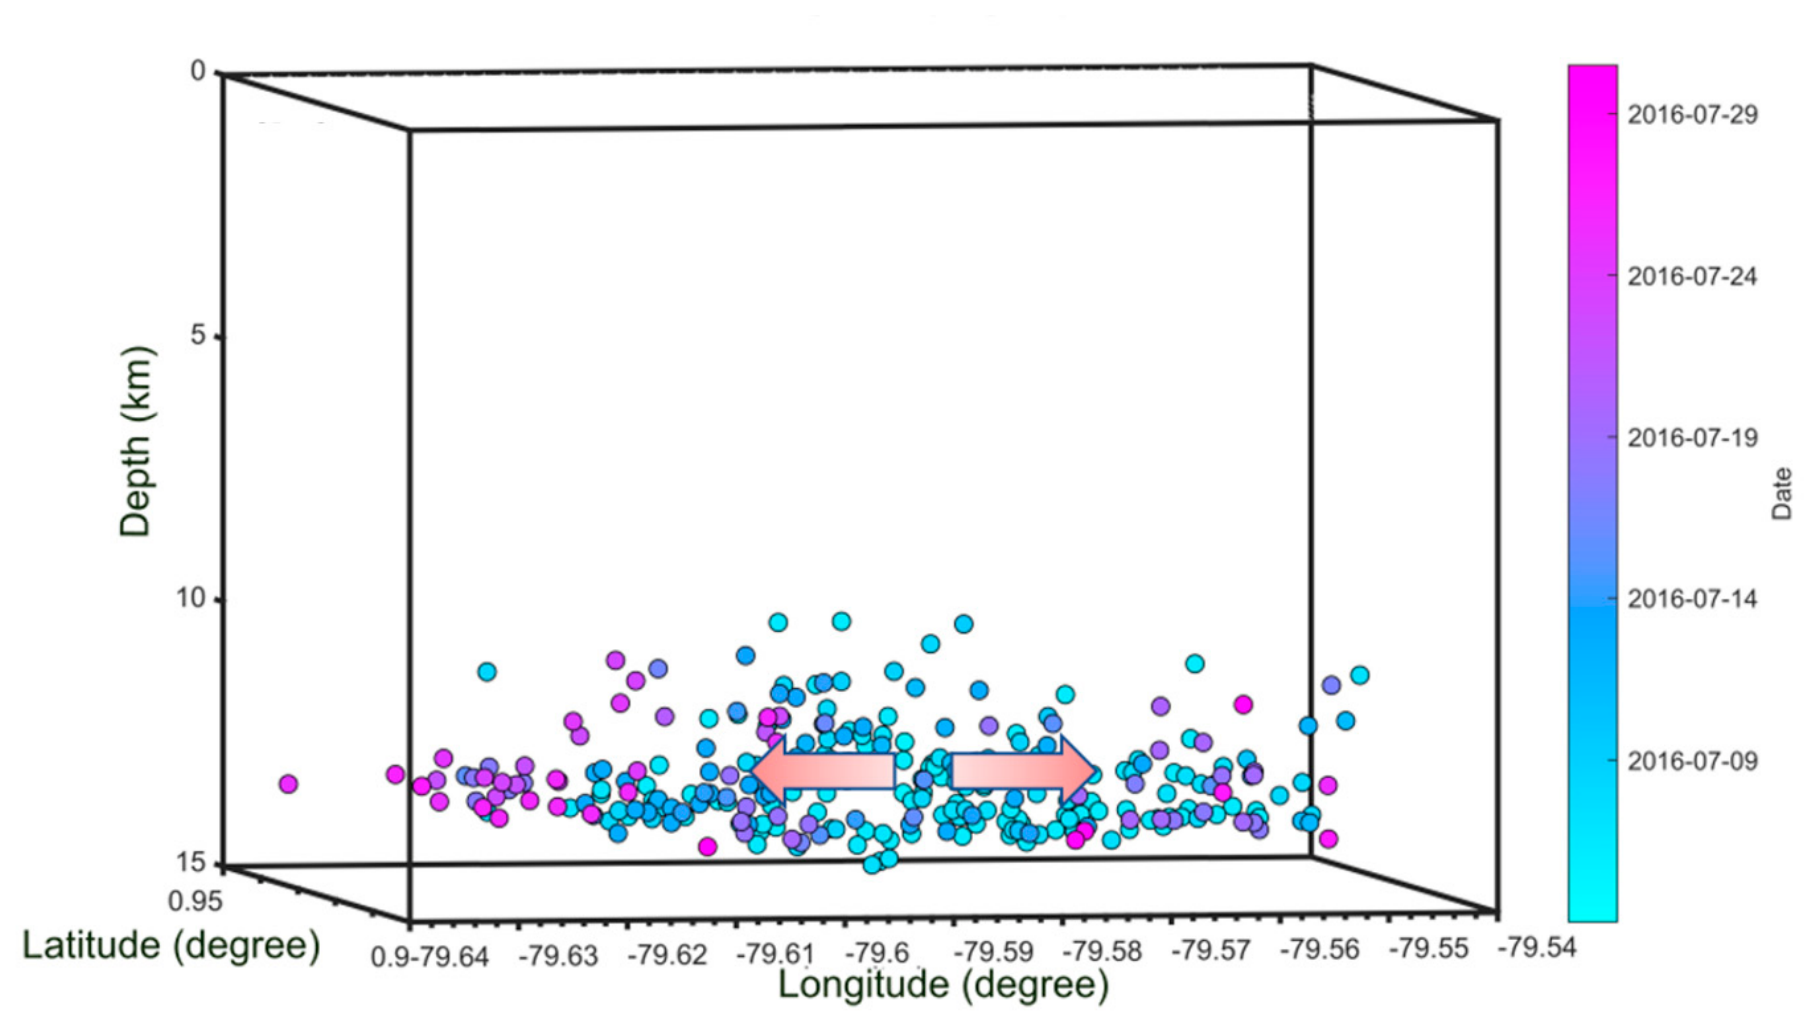
Our observations reveal a dense microseismic swarm in the Esmeraldas region, located in the northeast, during the period from July 5 to July 26. Microseismicity had already commenced on June 24, but the swarm activity was primarily concentrated in July [24]. Figure 11 illustrates the distribution of the earthquake swarm in July, showing a clear pattern of microseismic migration and diffusion. In Figure 9, we can see that the microseismic events gradually spread east–west over the following 23 days. The microseismic events in the Esmeralda region are located above the plate interface of the subduction zone [24,38] and are not continuous with the subduction zone interface. Nevertheless, large thrust earthquakes in the subduction zone have induced microseismic activity on the upper plate faults in the Esmeralda region. This is likely due to the triggering of fluid activity, variable slip modes, and shallow destructive seismic activity within the upper plate, which may occur across subduction zone segment boundaries and areas distal to the earthquake rupture zone, following megathrust earthquakes and associated slow slip events [24].

5. Conclusions

This study presents a comprehensive multiparametric investigation into the seismotectonic characteristics of the northern segment of the Ecuador subduction zone. Using data from the Ecuador 8G seismic network, we relocated seismicity that occurred in July 2016 and derived the coseismic deformation field of the 2016 Mw 7.8 earthquake through InSAR analysis. Furthermore, employing surface-wave relocation and depth-phase modeling techniques in conjunction with global teleseismic waveform data, we refined the hypocentral parameters of historical moderate-to-large earthquakes within the northern Ecuador subduction zone.
Our results reveal a possible correlation between the crustal Vp/Vs ratio and the spatial distribution of seismic activity. Regions characterized by moderate Vp/Vs ratios (1.78–1.82) appear to facilitate the diffusion of aftershocks and are more prone to hosting large-magnitude events. In contrast, areas with excessively high or low Vp/Vs ratios may act as physical barriers that impede rupture propagation and constrain the maximum earthquake magnitude. This finding suggests that lateral variations in crustal composition and fluid content, as reflected by the Vp/Vs ratio, play a critical role in modulating seismogenic behavior within this subduction zone.
The outcomes of this study may provide valuable constraints for seismic hazard assessment in the Ecuador subduction zone. Nevertheless, we acknowledge that the current conclusions are drawn from a limited dataset comprising a finite number of seismic events and a single mainshock case. To establish a more robust and generalizable framework, future investigations should incorporate a broader spectrum of subduction-zone earthquakes exhibiting diverse rupture characteristics, coupled with higher-resolution tomographic velocity models to better constrain the three-dimensional crustal structure. Such efforts will contribute to an improved understanding of the physical mechanisms governing earthquake nucleation, rupture propagation, and termination within complex subduction environments.

Author Contributions

Conceptualization, D.Z. and G.Z.; methodology, D.Z. and Q.H.; software, D.Z.; validation, Q.H.; formal analysis, D.Z. and Q.H.; investigation, G.Z.; resources, G.Z.; data curation, D.Z.; writing—original draft preparation, D.Z.; writing—review and editing, Q.H. and G.Z.; visualization, D.Z.; supervision, Q.H.; project administration, G.Z.; funding acquisition, G.Z. All authors have read and agreed to the published version of the manuscript.

Funding

This research was funded by the National Key Research and Development Program of China (Grant No. 2026YFE0106800), the National Natural Science Foundation of China (Grant No. 42274046) and the Xinjiang Regional Collaborative Innovation Program (2023E01023).

Data Availability Statement

The 8G network and teleseismic waveform data used in this study were obtained from the IRIS Data Management Center (www.iris.edu). Sentinel-1 images were copyrighted by the European Space Agency (ESA), through vertex.daac.asf.alaska.edu, and processed using GMTSAR.

Acknowledgments

During the preparation of this study, the authors used DeepSeek-V4 and ChatGPT-5.5. for the purposes of English translation and language polishing. The authors have reviewed and edited the output and take full responsibility for the content of this publication.

Conflicts of Interest

The authors declare no conflicts of interest.

Appendix A

Table A1. The results of the surface waveform relocation and depth-phase modeling.
DateMwLat (°)Lon (°)Horizontal Location SourceUncertainty (km)Depth (km)Strike (°)Dip (°)Rake (°)
1 June 2004 UTC15:525.30.62−79.89This study2.4920.962 ± 0.9163328133
25 November 2010 UTC04:195.40.37−80.09This study3.5225.500 ± 1.2855423138
16 April 2016 UTC23:587.80.268−80.075[26] 20.029 ± 0.6642721124
19 April 2016 UTC22:225.70.588−80.189[26] 17.966 ± 0.8501217100
20 April 2016 UTC08:336.00.697−80.353[26] 17.600 ± 0.940161597
20 April 2016 UTC08:356.10.5992−80.1586[35] 17.500 ± 1.1902025105
23 April 2016 UTC01:245.70.7037−80.5557[35] 10.610 ± 0.65841763
18 May 2016 UTC07:576.70.40−80.00This study3.1416.067 ± 1.2892818123
18 May 2016 UTC16:466.90.31−79.92This study1.1122.754 ± 0.9992821123
11 July 2016 UTC02:015.90.54−79.86This study (HypoDD)<0.0118.867 ± 1.5862222115
11 July 2016 UTC02:116.30.54−79.86This study1.5721.452 ± 0.9222821121
31 January 2017 UTC14:225.40.62−79.85This study1.5720.389 ± 0.8913221127
11 July 2017 UTC12:095.40.61−79.89This study1.5717.885 ± 1.2502822121
Figure A1. Distribution map of 8G stations used in this study. The blue triangles are seismic stations.
Remotesensing 18 03353 g0a1

References

  1. Chalumeau, C.; Agurto-Detzel, H.; Rietbrock, A.; Frietsch, M.; Oncken, O.; Segovia, M.; Galve, A. Seismological evidence for a multifault network at the subduction interface. Nature 2024, 628, 528–562. [Google Scholar] [CrossRef] [Scilit] [PubMed]
  2. Wang, X.; Wei, S.; Morales-Yáñez, C.; Duputel, Z.; Chen, L.; Hao, T.; Zhao, L. Plate interface geometry complexity and persistent heterogenous coupling revealed by a high-resolution earthquake focal mechanism catalog in Mentawai, Sumatra. Earth Planet. Sci. Lett. 2024, 637, 118726. [Google Scholar] [CrossRef] [Scilit]
  3. Qiu, Q.; Li, L.; Yang, X.; Lin, J.; Chua, C.T. Morphological differences across the Shumagin-Semidi fault segments control slip behaviors and tsunami genesis in the Aleutian-Alaska subduction zone. Quat. Sci. Adv. 2024, 15, 100215. [Google Scholar] [CrossRef] [Scilit]
  4. Leon-Rios, S.; Rietbrock, A.; Bie, L.; Beck, S.; Charvis, P.; Comte, D.; Galve, A.; Meltzer, A.; Roecker, S.; Ruiz, M.; et al. Physical Properties Controlling Earthquake Ruptures: Two Study Cases Along the South American Subduction Zone. Geophys. Res. Lett. 2026, 681, 119938. [Google Scholar] [CrossRef] [Scilit]
  5. Kendrick, E.; Bevis, M.; Smalley, R.; Brooks, B.; Vargas, R.B.; Lauría, E.; Fortes, L.P.S. The Nazca–South America Euler vector and its rate of change. J. South Am. Earth Sci. 2003, 16, 125–131. [Google Scholar] [CrossRef] [Scilit]
  6. Kerr, A.C.; White, R.V.; Patricia, M.E.; Tarney, J.; Saunders, A.D. No Oceanic Plateau—No Caribbean Plate? The Seminal Role of an Oceanic Plateau in Caribbean Plate Evolution; American Association of Petroleum Geologists: Tulsa, OK, USA, 2003. [Google Scholar] [CrossRef] [Scilit]
  7. Jaillard, E.; Ordoñez, M.; Suárez, J.; Toro, J.; Iza, D.; Lugo, W. Stratigraphy of the late Cretaceous–Paleogene deposits of the cordillera occidental of central ecuador: Geodynamic implications. J. South Am. Earth Sci. 2004, 17, 49–58. [Google Scholar] [CrossRef] [Scilit]
  8. Ye, L.; Kanamori, H.; Avouac, J.P.; Li, L.; Cheung, K.F.; Lay, T. The 16 April 2016, MW 7.8 (MS 7.5) Ecuador earthquake: A quasi-repeat of the 1942 MS 7.5 earthquake and partial re-rupture of the 1906 MS 8.6 Colombia–Ecuador earthquake. Earth Planet. Sci. Lett. 2016, 454, 248–258, Correction in Earth Planet. Sci. Lett. 2017, 458, 442–443. [Google Scholar] [CrossRef] [Scilit]
  9. Heidarzadeh, M.; Murotani, S.; Satake, K.; Takagawa, T.; Saito, T. Fault size and depth extent of the Ecuador earthquake (Mw 7.8) of 16 April 2016 from teleseismic and tsunami data. Geophys. Res. Lett. 2017, 44, 2211–2219. [Google Scholar] [CrossRef] [Scilit]
  10. Nocquet, J.M.; Jarrin, P.; Vallée, M.; Mothes, P.A.; Grandin, R.; Rolandone, F.; Delouis, B.; Yepes, H.; Font, Y.; Fuentes, D.; et al. Supercycle at the Ecuadorian subduction zone revealed after the 2016 Pedernales earthquake. Nat. Geosci. 2017, 10, 145–149. [Google Scholar] [CrossRef] [Scilit]
  11. Segovia, M.; Font, Y.; Régnier, M.; Charvis, P.; Galve, A.; Nocquet, J.; Jarrín, P.; Hello, Y.; Ruiz, M.; Pazmiño, A. Seismicity Distribution Near a Subducting Seamount in the Central Ecuadorian Subduction Zone, Space-Time Relation to a Slow-Slip Event. Tectonics 2018, 37, 2016–2123. [Google Scholar] [CrossRef] [Scilit]
  12. Zhu, W.; Beroza, G.C. PhaseNet: A deep-neural-network-based seismic arrival-time picking method. Geophys. J. Int. 2019, 216, 261–273. [Google Scholar] [CrossRef] [Scilit]
  13. Zhang, M.; Ellsworth, W.L.; Beroza, G.C. Rapid Earthquake Association and Location. Seismol. Res. Lett. 2019, 90, 2276–2284. [Google Scholar] [CrossRef] [Scilit]
  14. Ponce, G.; Meltzer, A.; Wickham-Piotrowski, A.; Hoskins, M.; Beck, S.; Ruiz, M.; Hernández, S.; Segovia, M.; Rodriguez, E. Insights into subduction zone complexity in the Northern Ecuadorian forearc from 3-D local earthquake tomography. Geophys. J. Int. 2025, 242, 189. [Google Scholar] [CrossRef] [Scilit]
  15. Koch, C.D.; Lynner, C.; Delph, J.; Beck, S.L.; Meltzer, A.; Font, Y.; Soto-Cordero, L.; Hoskins, M.; Stachnik, J.C.; Ruiz, M.; et al. Structure of the Ecuadorian forearc from the joint inversion of receiver functions and ambient noise surface waves. Geophys. J. Int. 2020, 222, 1671–1685. [Google Scholar] [CrossRef] [Scilit]
  16. Rodriguez, E.E.; Beck, S.L.; Meltzer, A.; Segovia, M.; Ruíz, M.; Hernández, S.; Roecker, S.; Lynner, C.; Koch, C.; Hoskins, M.C.; et al. Seismic imaging of the Ecuadorian forearc and arc from joint ambient noise, local, and teleseismic tomography: Catching the Nazca slab in the act of flattening. Geophys. J. Int. 2025, 241, 1553–1572. [Google Scholar] [CrossRef] [Scilit]
  17. León-Ríos, S.; Agurto-Detzel, H.; Rietbrock, A.; Alvarado, A.; Beck, S.; Charvis, P.; Edwards, B.; Font, Y.; Garth, T.; Hoskins, M.; et al. 1D-velocity structure and seismotectonics of the Ecuadorian margin inferred from the 2016 Mw7.8 Pedernales aftershock sequence. Tectonophysics 2019, 767, 228165. [Google Scholar] [CrossRef] [Scilit]
  18. Birkey, A.; Lynner, C.; Chai, C.; Maceira, M. Structure of the Ecuadorian Upper Plate From a Joint Seismic-Gravity Inversion. J. Geophys. Res. Solid Earth 2025, 130, e2024JB030667. [Google Scholar] [CrossRef] [Scilit]
  19. Sandwell, D.; Mellors, R.; Tong, X.; Wei, M.; Wessel, P. Open radar interferometry software for mapping surface deformation. Eos Trans. AGU 2011, 92, 234. [Google Scholar] [CrossRef] [Scilit]
  20. Zhang, M.; Liu, M.; Feng, T.; Wang, R.; Zhu, W. LOC-FLOW: An End-to-End Machine Learning-Based High-Precision Earthquake Location Workflow. Seismol. Res. Lett. 2022, 93, 2426–2438. [Google Scholar] [CrossRef] [Scilit]
  21. Dziewonski, A.M.; Anderson, D.L. Preliminary Reference Earth Model. Phys. Earth Planet. Inter. 1981, 25, 297–356. [Google Scholar] [CrossRef] [Scilit]
  22. Laske, G.; Masters, G.; Ma, Z.; Pasyanos, M. Update on CRUST1.0: A 1-degree global model of Earth’s crust. Geophys. Res. Abstr. 2013, 15, 2658. [Google Scholar]
  23. Hernández, M.J.; Michaud, F.; Collot, J.Y.; D’ACremont, E.; Proust, J.-N.; Barba, D. Evolution of the Manabí forearc basin in Ecuador: From the collision of Caribbean oceanic plateau to the build up of the Andes and Coastal Cordilleras. Tectonophysics 2024, 870, 230133. [Google Scholar] [CrossRef] [Scilit]
  24. Hoskins, M.C.; Meltzer, A.; Font, Y.; Agurto-Detzel, H.; Vaca, S.; Rolandone, F.; Nocquet, J.-M.; Soto-Cordero, L.; Stachnik, J.C.; Beck, S.; et al. Triggered crustal earthquake swarm across subduction segment boundary after the 2016 Pedernales, Ecuador megathrust earthquake. Earth Planet. Sci. Lett. 2021, 553, 116620. [Google Scholar] [CrossRef] [Scilit]
  25. León-Ríos, S.; Bie, L.; Agurto-Detzel, H.; Rietbrock, A.; Galve, A.; Alvarado, A.; Beck, S.; Charvis, P.; Font, Y.; Hidalgo, S.; et al. 3D Local Earthquake Tomography of the Ecuadorian Margin in the Source Area of the 2016 Mw 7.8 Pedernales Earthquake. J. Geophys. Res. Solid Earth 2021, 126, e2020JB020701. [Google Scholar] [CrossRef] [Scilit]
  26. Soto-Cordero, L.; Meltzer, A.; Bergman, E.; Hoskins, M.; Stachnik, J.C.; Agurto-Detzel, H.; Alvarado, A.; Beck, S.; Charvis, P.; Font, Y.; et al. Structural control on megathrust rupture and slip behavior: Insights from the 2016 Mw 7.8 Pedernales Ecuador earthquake. J. Geophys. Res. Solid Earth 2020, 125, e2019JB018001. [Google Scholar] [CrossRef] [Scilit]
  27. Kissling, E.; Ellsworth, W.L.; Eberhart-Phillips, D.; Kradolfer, U. Initial reference models in local earthquake tomography. J. Geophys. Res. 1994, 99, 19635–19646. [Google Scholar] [CrossRef] [Scilit]
  28. Waldhauser, F.; Ellsworth, W.L. A double-difference earthquake location algorithm: Method and application to the Northern Hayward Fault, California. Bull. Seismol. Soc. Am. 2000, 90, 1353–1368. [Google Scholar] [CrossRef] [Scilit]
  29. Hutton, L.K.; Boore, D.M. The ML scale in Southern California. Bull. Seismol. Soc. Am. 1987, 77, 2074–2094. [Google Scholar] [CrossRef] [Scilit]
  30. Wang, X.; Bradley, K.E.; Wei, S.; Wu, W. Active backstop faults in the Mentawai region of Sumatra, Indonesia, revealed by teleseismic broadband waveform modeling. Earth Planet. Sci. Lett. 2018, 483, 29–38. [Google Scholar] [CrossRef] [Scilit]
  31. Wang, X.; Wei, S.; Wu, W. Double-ramp on the Main Himalayan Thrust revealed by broadband waveform modeling of the 2015 Gorkha earthquake sequence. Earth Planet. Sci. Lett. 2017, 473, 83–93. [Google Scholar] [CrossRef] [Scilit]
  32. Qian, Y.; Ni, S.; Wei, S.; Almeida, R.; Zhang, H. The effects of core-reflected waves on finite fault inversions with teleseismic body wave data. Geophys. J. Int. 2017, 211, 936–951. [Google Scholar] [CrossRef] [Scilit]
  33. Béjar-Pizarro, M.; Álvarez Gómez, J.A.; Staller, A.; Luna, M.P.; Pérez-López, R.; Monserrat, O.; Chunga, K.; Lima, A.; Galve, J.P.; Martínez Díaz, J.J.; et al. InSAR-Based Mapping to Support Decision-Making after an Earthquake. Remote Sens. 2018, 10, 899. [Google Scholar] [CrossRef] [Scilit]
  34. Yi, L.; Xu, C.; Wen, Y.; Zhang, X.; Jiang, G. Rupture process of the 2016 Mw 7.8 Ecuador earthquake from joint inversion of InSAR data and teleseismic P waveforms. Tectonophysics 2018, 722, 163–174. [Google Scholar] [CrossRef] [Scilit]
  35. Agurto-Detzel, H.; Font, Y.; Charvis, P.; Régnier, M.; Rietbrock, A.; Ambrois, D.; Paulatto, M.; Alvarado, A.; Beck, S.; Courboulex, F.; et al. Ridge subduction and afterslip control aftershock distribution of the 2016 Mw 7.8 Ecuador earthquake. Earth Planet. Sci. Lett. 2019, 520, 63–76. [Google Scholar] [CrossRef] [Scilit]
  36. Halpaap, F.; Rondenay, S.; Ottemöller, L. Seismicity, Deformation, and Metamorphism in the Western Hellenic Subduction Zone: New Constraints From Tomography. J. Geophys. Res. Solid Earth 2018, 123, 3000–3026. [Google Scholar] [CrossRef] [Scilit]
  37. Li, C.; Beck, S.L.; Delph, J.R.; Ericksen, B.; Meltzer, A.; Lynner, C.; Ruíz, M.; Segovia, M.; Hernández, S.; Vaca, S.; et al. High-Resolution 3-D Lithospheric Structure of the Subducting Carnegie Ridge and the Ecuadorian Margin Imaged From Teleseismic Receiver Functions. Geophys. Res. Lett. 2026, 53, e2026GL122549. [Google Scholar] [CrossRef] [Scilit]
  38. Font, Y.; Segovia, M.; Vaca, S.; Theunissen, T. Seismicity patterns along the Ecuadorian subduction zone: New constraints from earthquake location in a 3-D a priori velocity model. Geophys. J. Int. 2013, 193, 263–286. [Google Scholar] [CrossRef] [Scilit]
Figure 1. Tectonic background of northern Ecuador. The red beach balls represent historical Mw > 5.2 earthquakes. The focal mechanism catalog is from the Global Centroid Moment Tensor catalog (GCMT); the location catalog is from the United States Geological Survey (USGS). The blue triangles represent 8G network stations (the distribution of all stations is shown in Figure A1).
Remotesensing 18 03353 g001
Figure 2. Hypocentral distance–travel time curves of the associated earthquakes. (a) Travel time and distance curve of P wave. (b) Travel time and distance curve of S wave.
Remotesensing 18 03353 g002
Figure 3. The results of surface waveform relocation for the 11 July 2016 Mw 6.3 event. (a) The distribution of global stations used for relocation. The blue triangles are seismic stations. The red star is the epicenter location. (b) Comparison of relocation result errors with GCMT and USGS. (c) RMS map of relocation. The red star, black star, and yellow dot represent GCMT, USGS, and our relocation results. (d) Fitting results of three-component surface waveforms.
Remotesensing 18 03353 g003
Figure 4. Depth-phase modeling results of the 11 July 2016 Mw 6.3 event. (a–c) Statistics of station count, azimuth, and epicentral distance with depth. The light blue dots represent cross-correlation values, and red dots in panels (a–c) are the optimal depths from depth phase modeling. (d) The distribution of global stations used for depth-phase modeling. The blue triangles are seismic stations. The red star is the epicenter location. (e,f) Fitting results of depth-phase modeling. The black and red lines represent observed and synthetic waveforms.
Remotesensing 18 03353 g004
Figure 5. Coseismic static displacement from InSAR. (a) Interferometric phase (descending tracks) of the 2016 Mw 7.8 earthquake. (b) Descending-track LOS displacement.
Remotesensing 18 03353 g005
Figure 6. The uncertainty of the HypoDD relocation. (a,b) The horizontal location uncertainty of the hypoDD relocation. (c) The Depth uncertainty of the hypoDD relocation.
Remotesensing 18 03353 g006
Figure 7. Synthetic test for the surface waveform relocation events, showing the distribution of time shifts versus azimuth and the RMS distribution for each event.
Remotesensing 18 03353 g007
Figure 8. The relocation results of the July 2016 seismicity and historical earthquakes in northern Ecuador. The red beach balls represent the historical earthquakes. The gray lines AA’ and BB’ are the profiles.
Remotesensing 18 03353 g008
Figure 9. (a) Seismicity cross-section along profile AA’ in Figure 8. (b) Seismicity cross-section along profile BB’ in Figure 8. The width of each profile is ±30 km. The gray lines are Vp/Vs contours. The gray dots are aftershocks. The red beach balls are historical moderate-to-strong earthquakes.
Remotesensing 18 03353 g009
Figure 10. The Spatiotemporal distribution profile of the aftershocks. The red star represents the initial Mw 5.9 event. The gray dots represent the aftershocks. The gray lines are Vp/Vs contours.
Remotesensing 18 03353 g010
Figure 11. The 2D and 3D spatiotemporal evolution of the swarms in the Esmeraldas area.
Remotesensing 18 03353 g011
Disclaimer/Publisher’s Note: The statements, opinions and data contained in all publications are solely those of the individual author(s) and contributor(s) and not of MDPI and/or the editor(s). MDPI and/or the editor(s) disclaim responsibility for any injury to people or property resulting from any ideas, methods, instructions or products referred to in the content.