Multiscale Estimation of Mangrove Biomass in Fujian Province Using UAV as a Bridging Scale


Highlights
- A multiscale biomass estimation framework integrating field plots, UAV observations, and Sentinel-2 imagery was developed for mangrove ecosystems.
- UAV-derived bridging labels substantially improved satellite-scale biomass estimation accuracy and enabled provincial-scale biomass mapping.
- The proposed UAV-bridged framework effectively alleviates the scale mismatch problem between field measurements and satellite observations.
- This approach provides a scalable pathway for blue-carbon monitoring and large-area biomass assessment in coastal ecosystems.
Abstract
1. Introduction
2. Materials and Methods
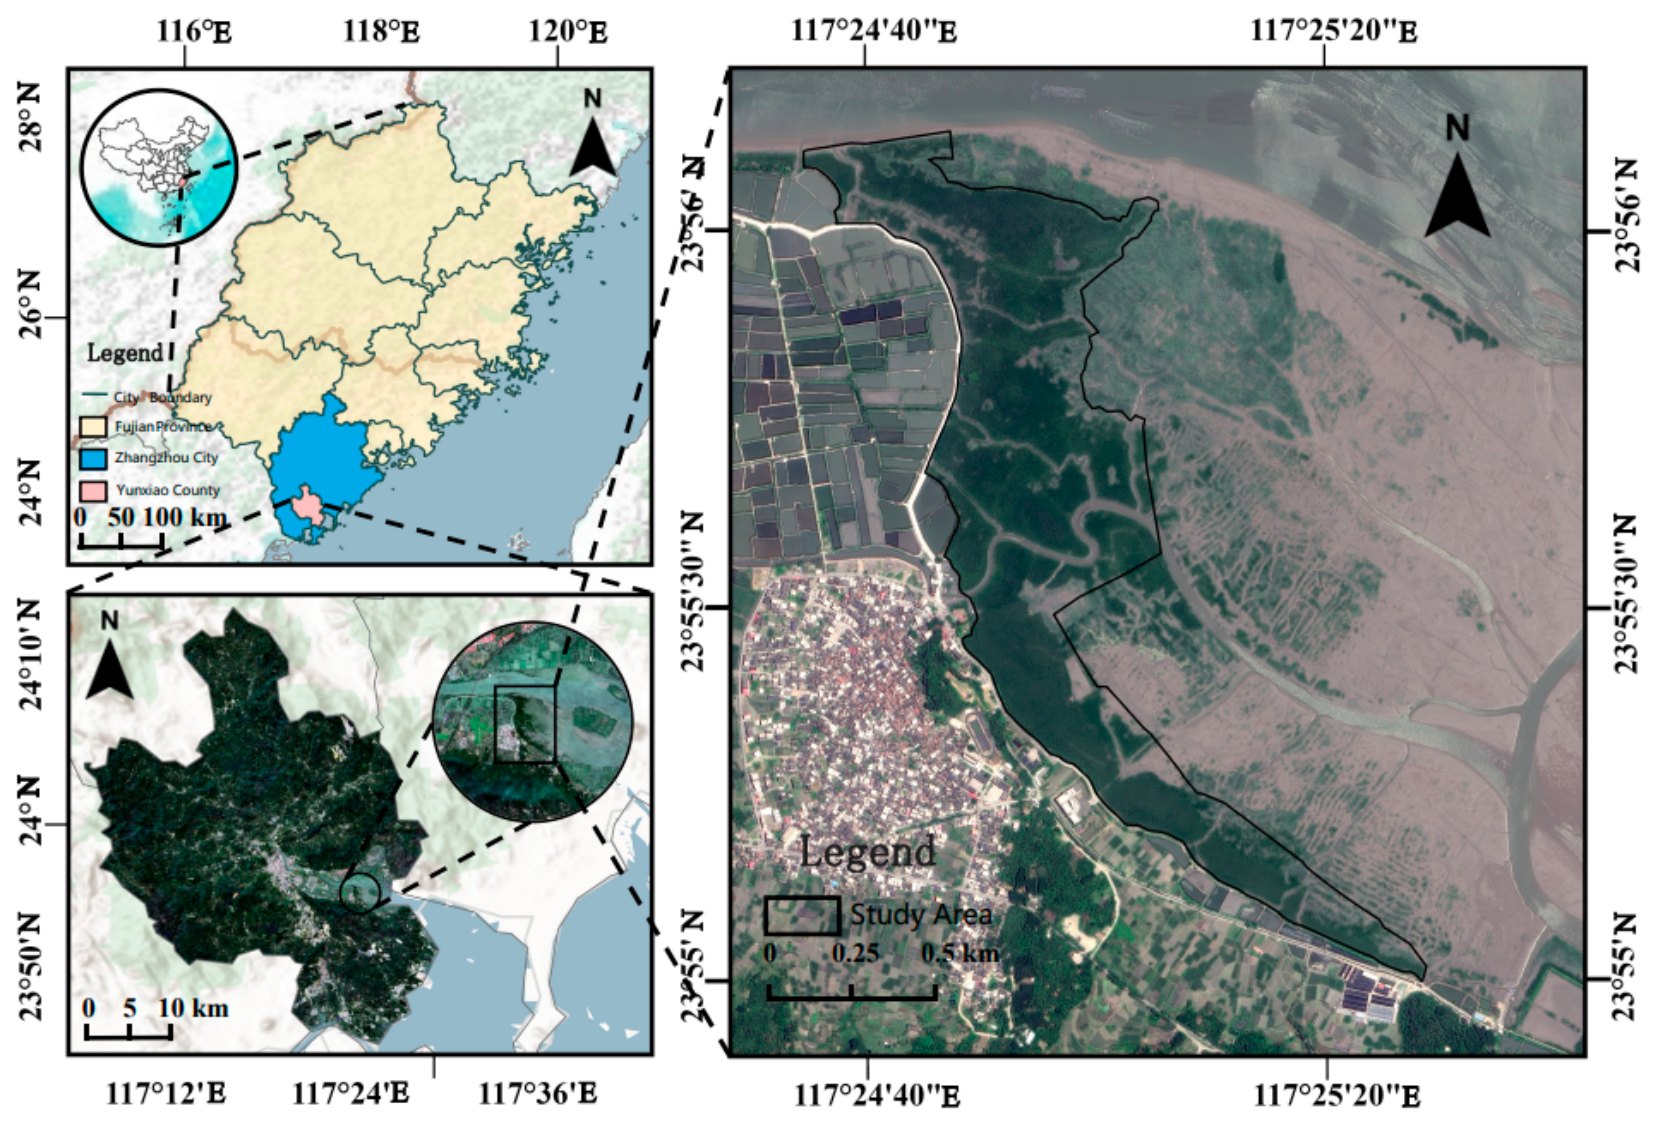
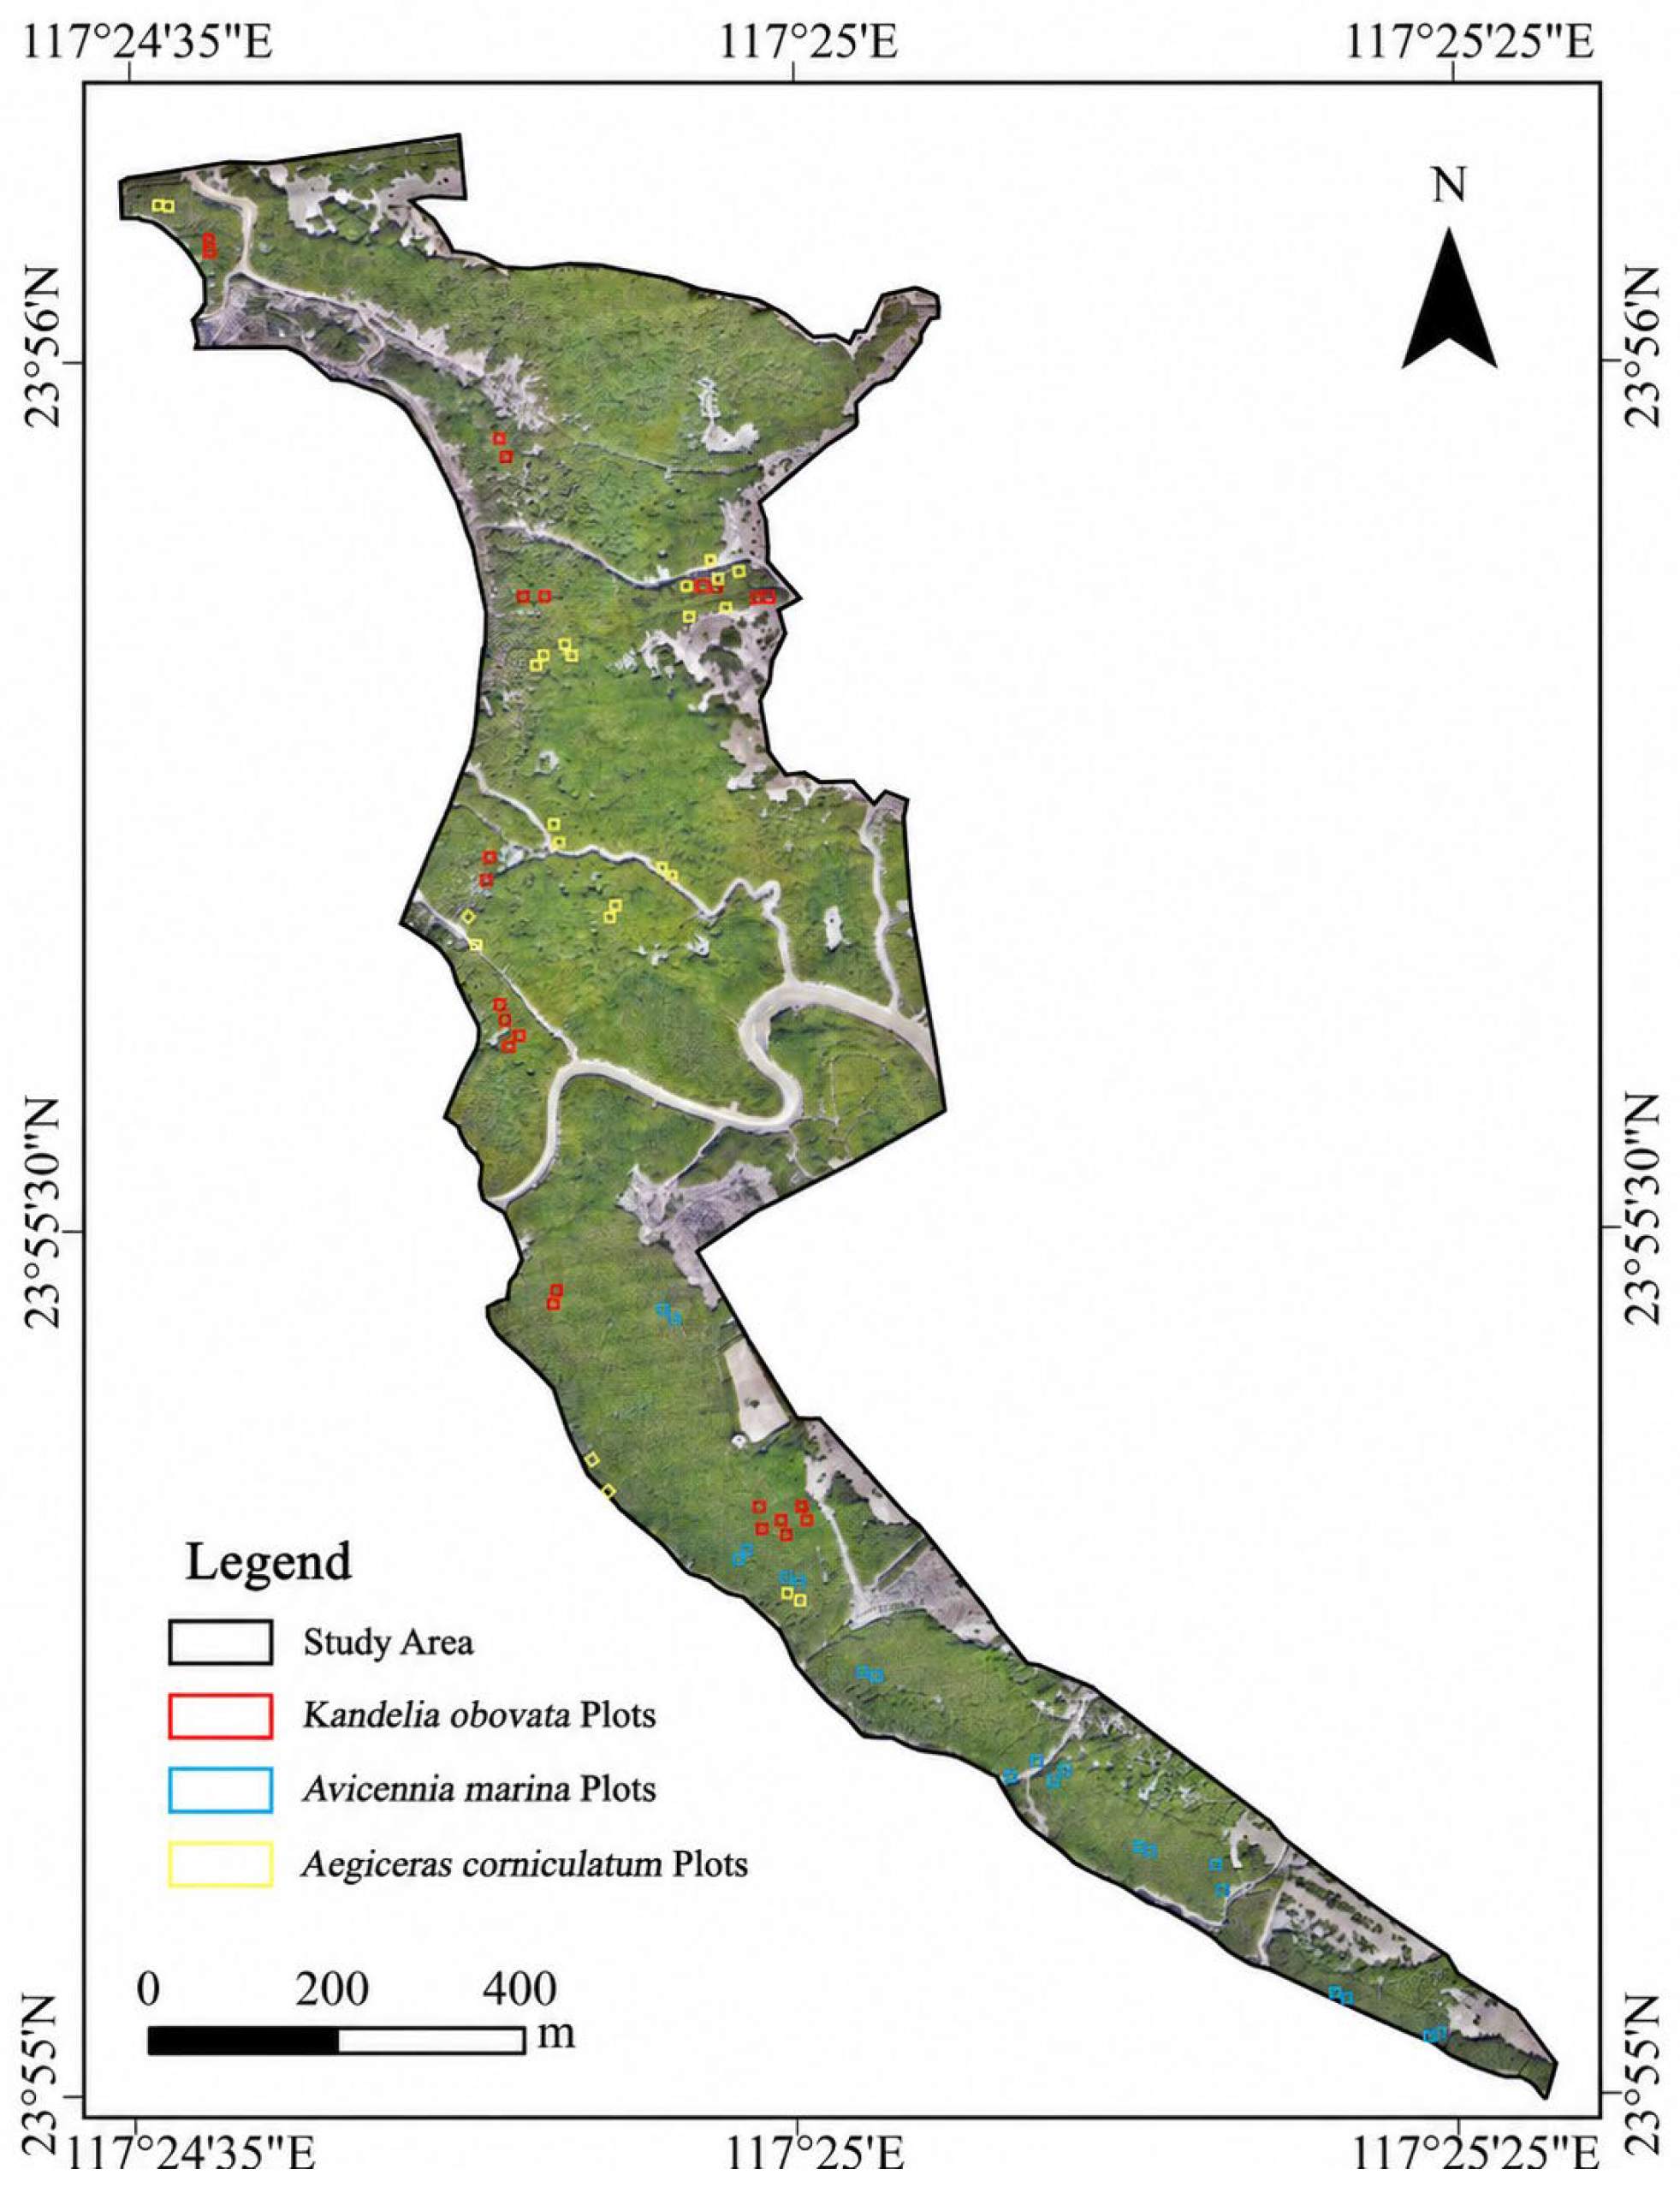
2.1. Study Area and Data Sources
2.2. Biomass Calculation of Field Plots
2.3. Feature Extraction and Selection
2.3.1. Feature Extraction
2.3.2. Multicollinearity Screening
2.3.3. RF-RFE-OOB Feature Selection
2.3.4. UAV-Scale Mangrove Biomass Modeling
2.3.5. Accuracy Assessment
2.3.6. UAV-Scale Mangrove Biomass Estimation
2.4. Scale Extrapolation and Satellite-Scale Mangrove Biomass Estimation
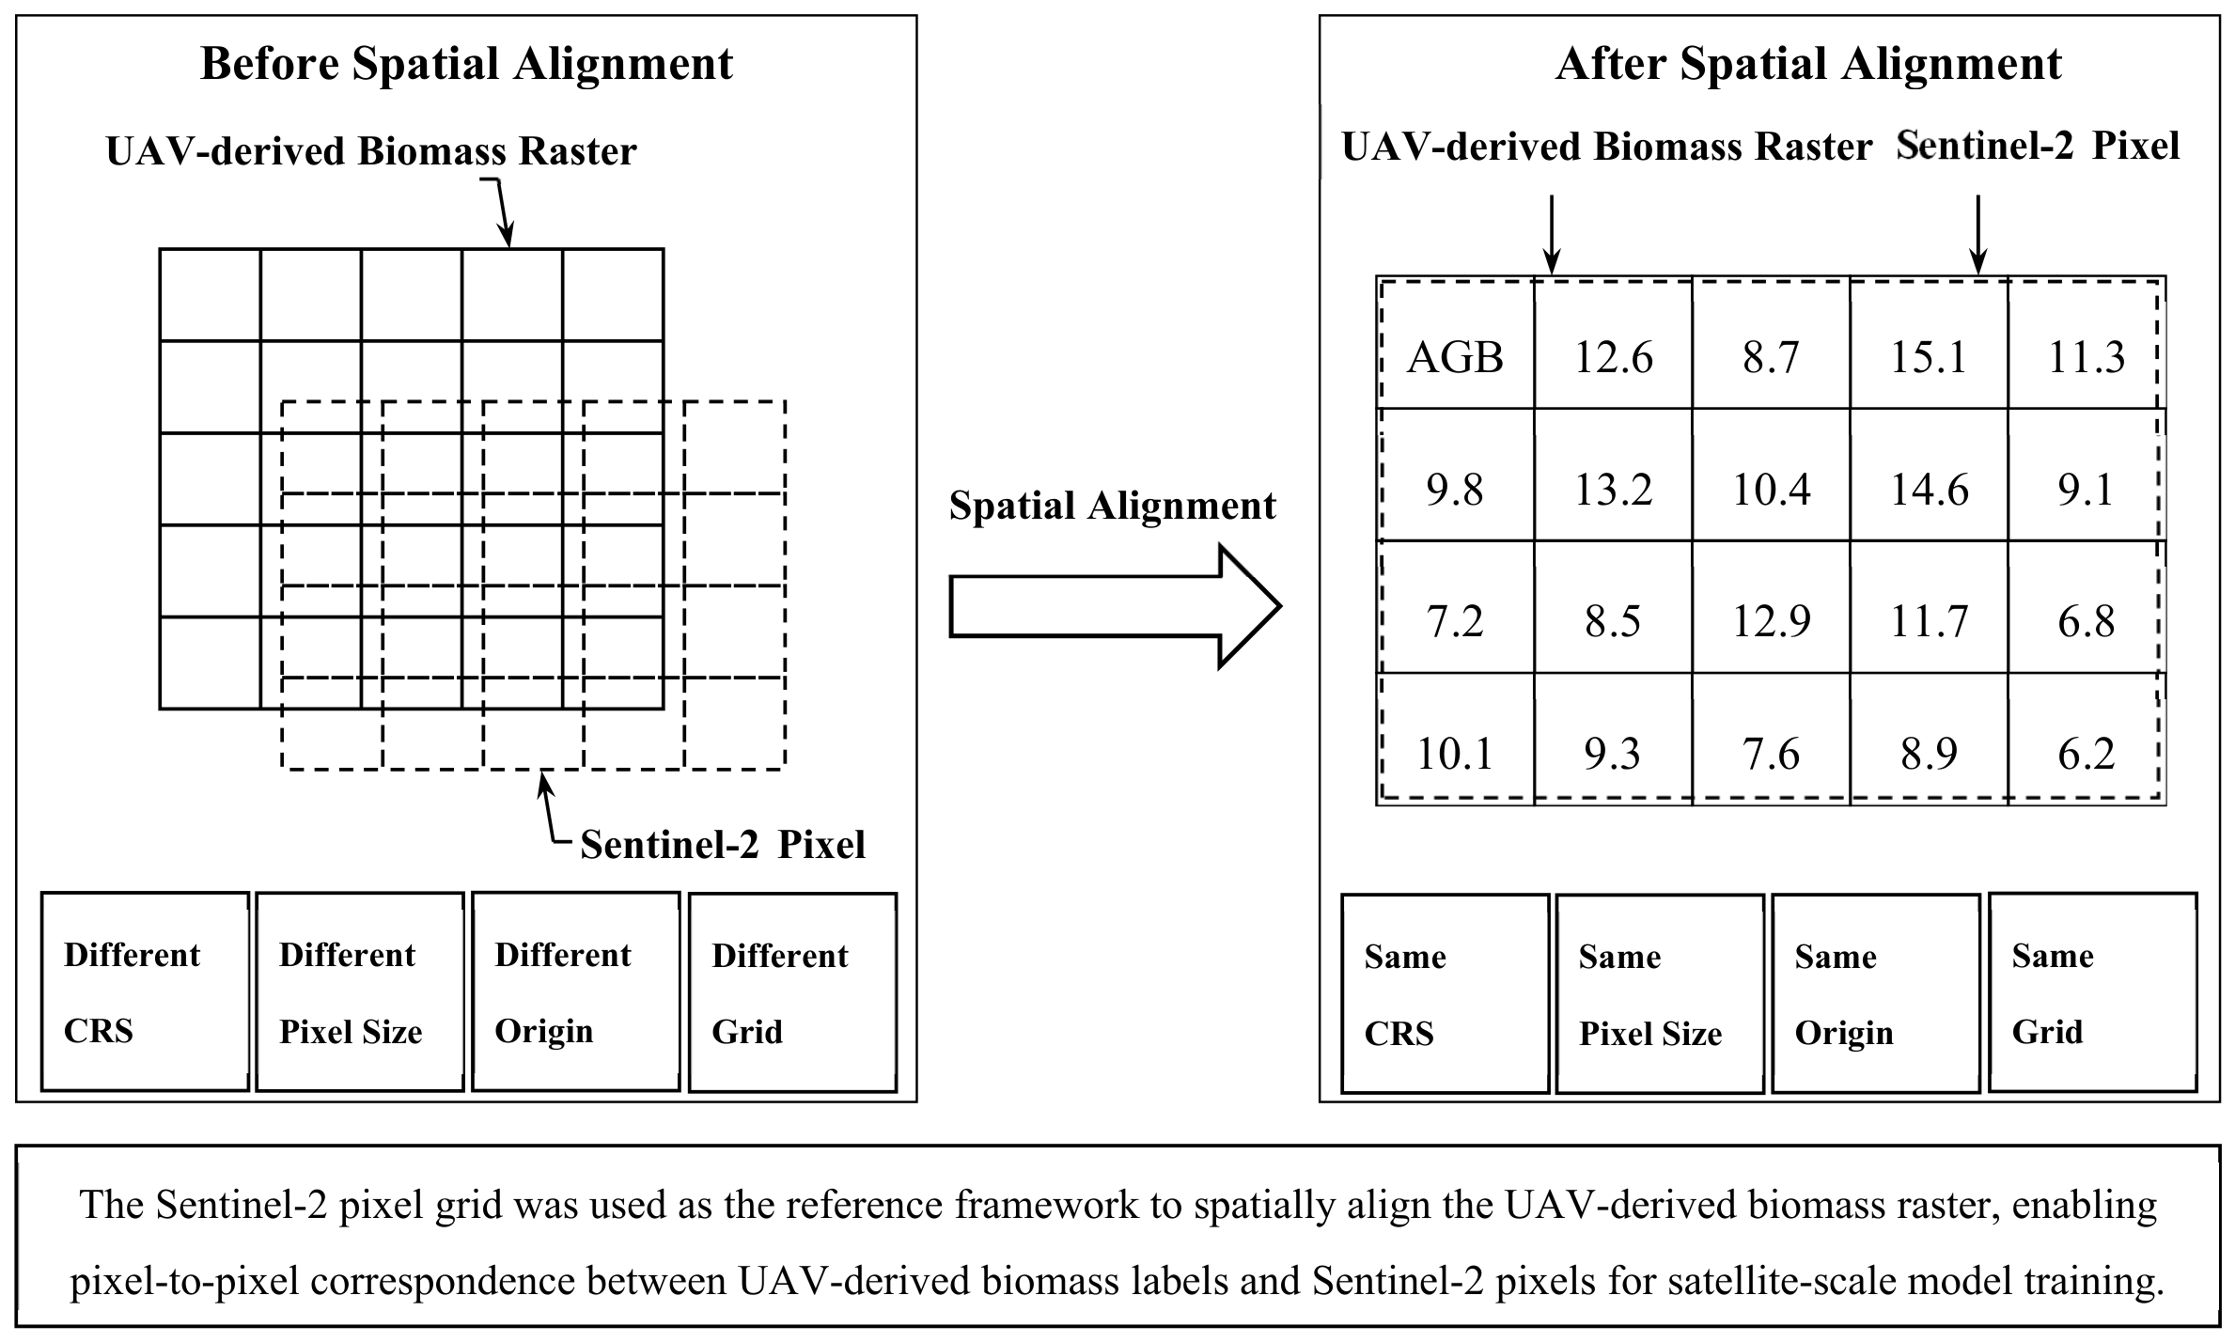
2.4.1. Spatial Alignment and Label Construction
2.4.2. Feature Construction and Selection
Band Resolution Harmonization
Feature Construction
Feature Selection Method
2.4.3. Control Extrapolation Scheme and Gain Validation
2.4.4. Satellite-Scale Mangrove Biomass Model Development
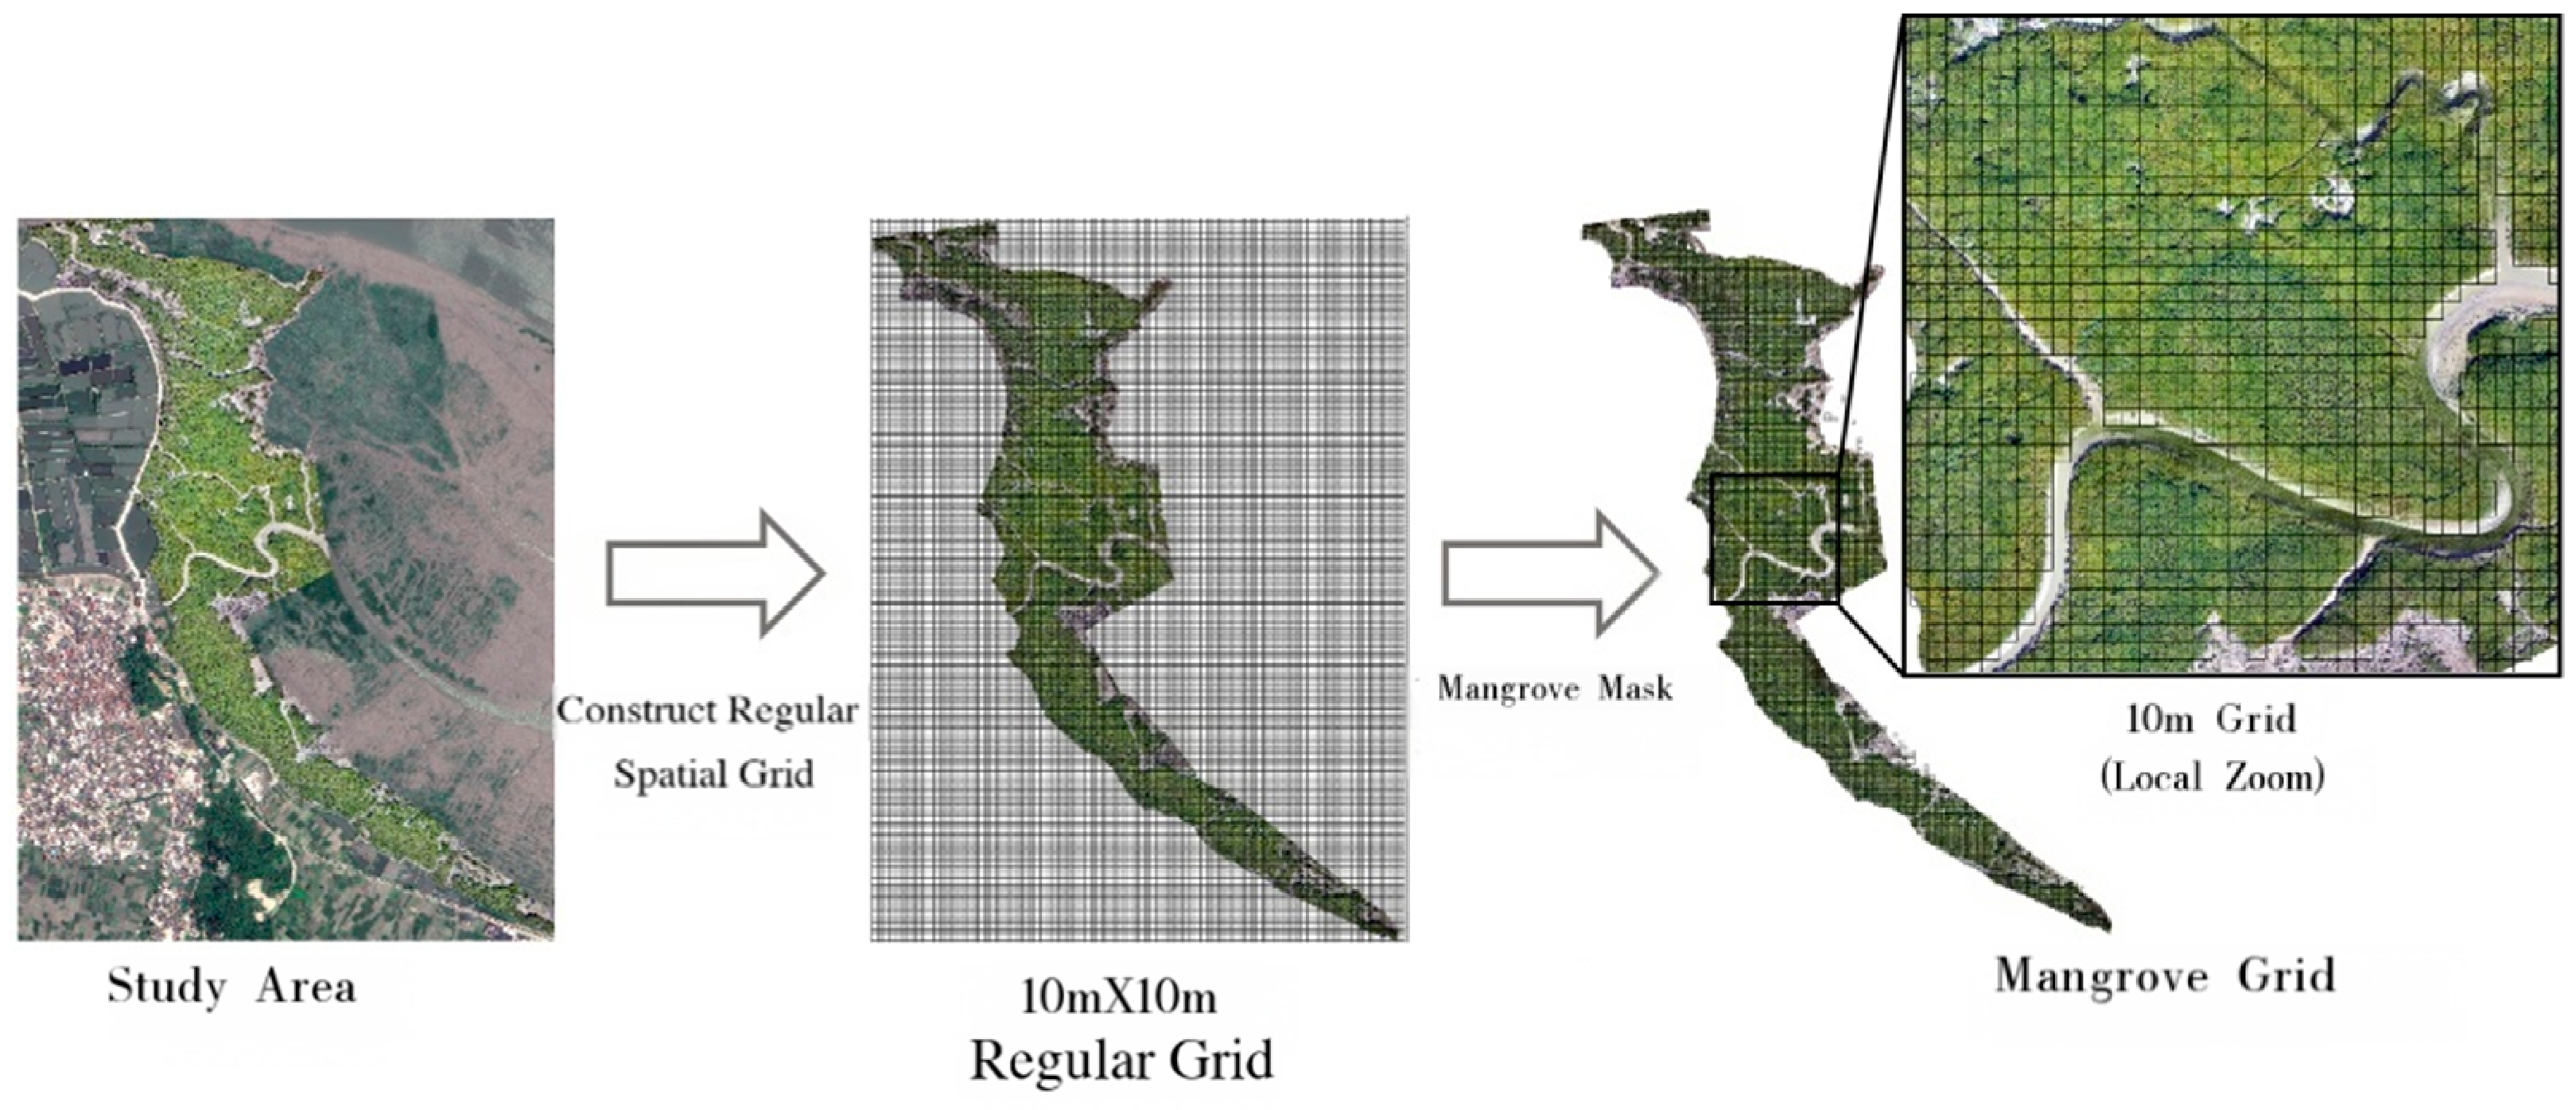
Construction of Training Samples
Model Development
2.4.5. Provincial-Scale Biomass Extrapolation and Mapping
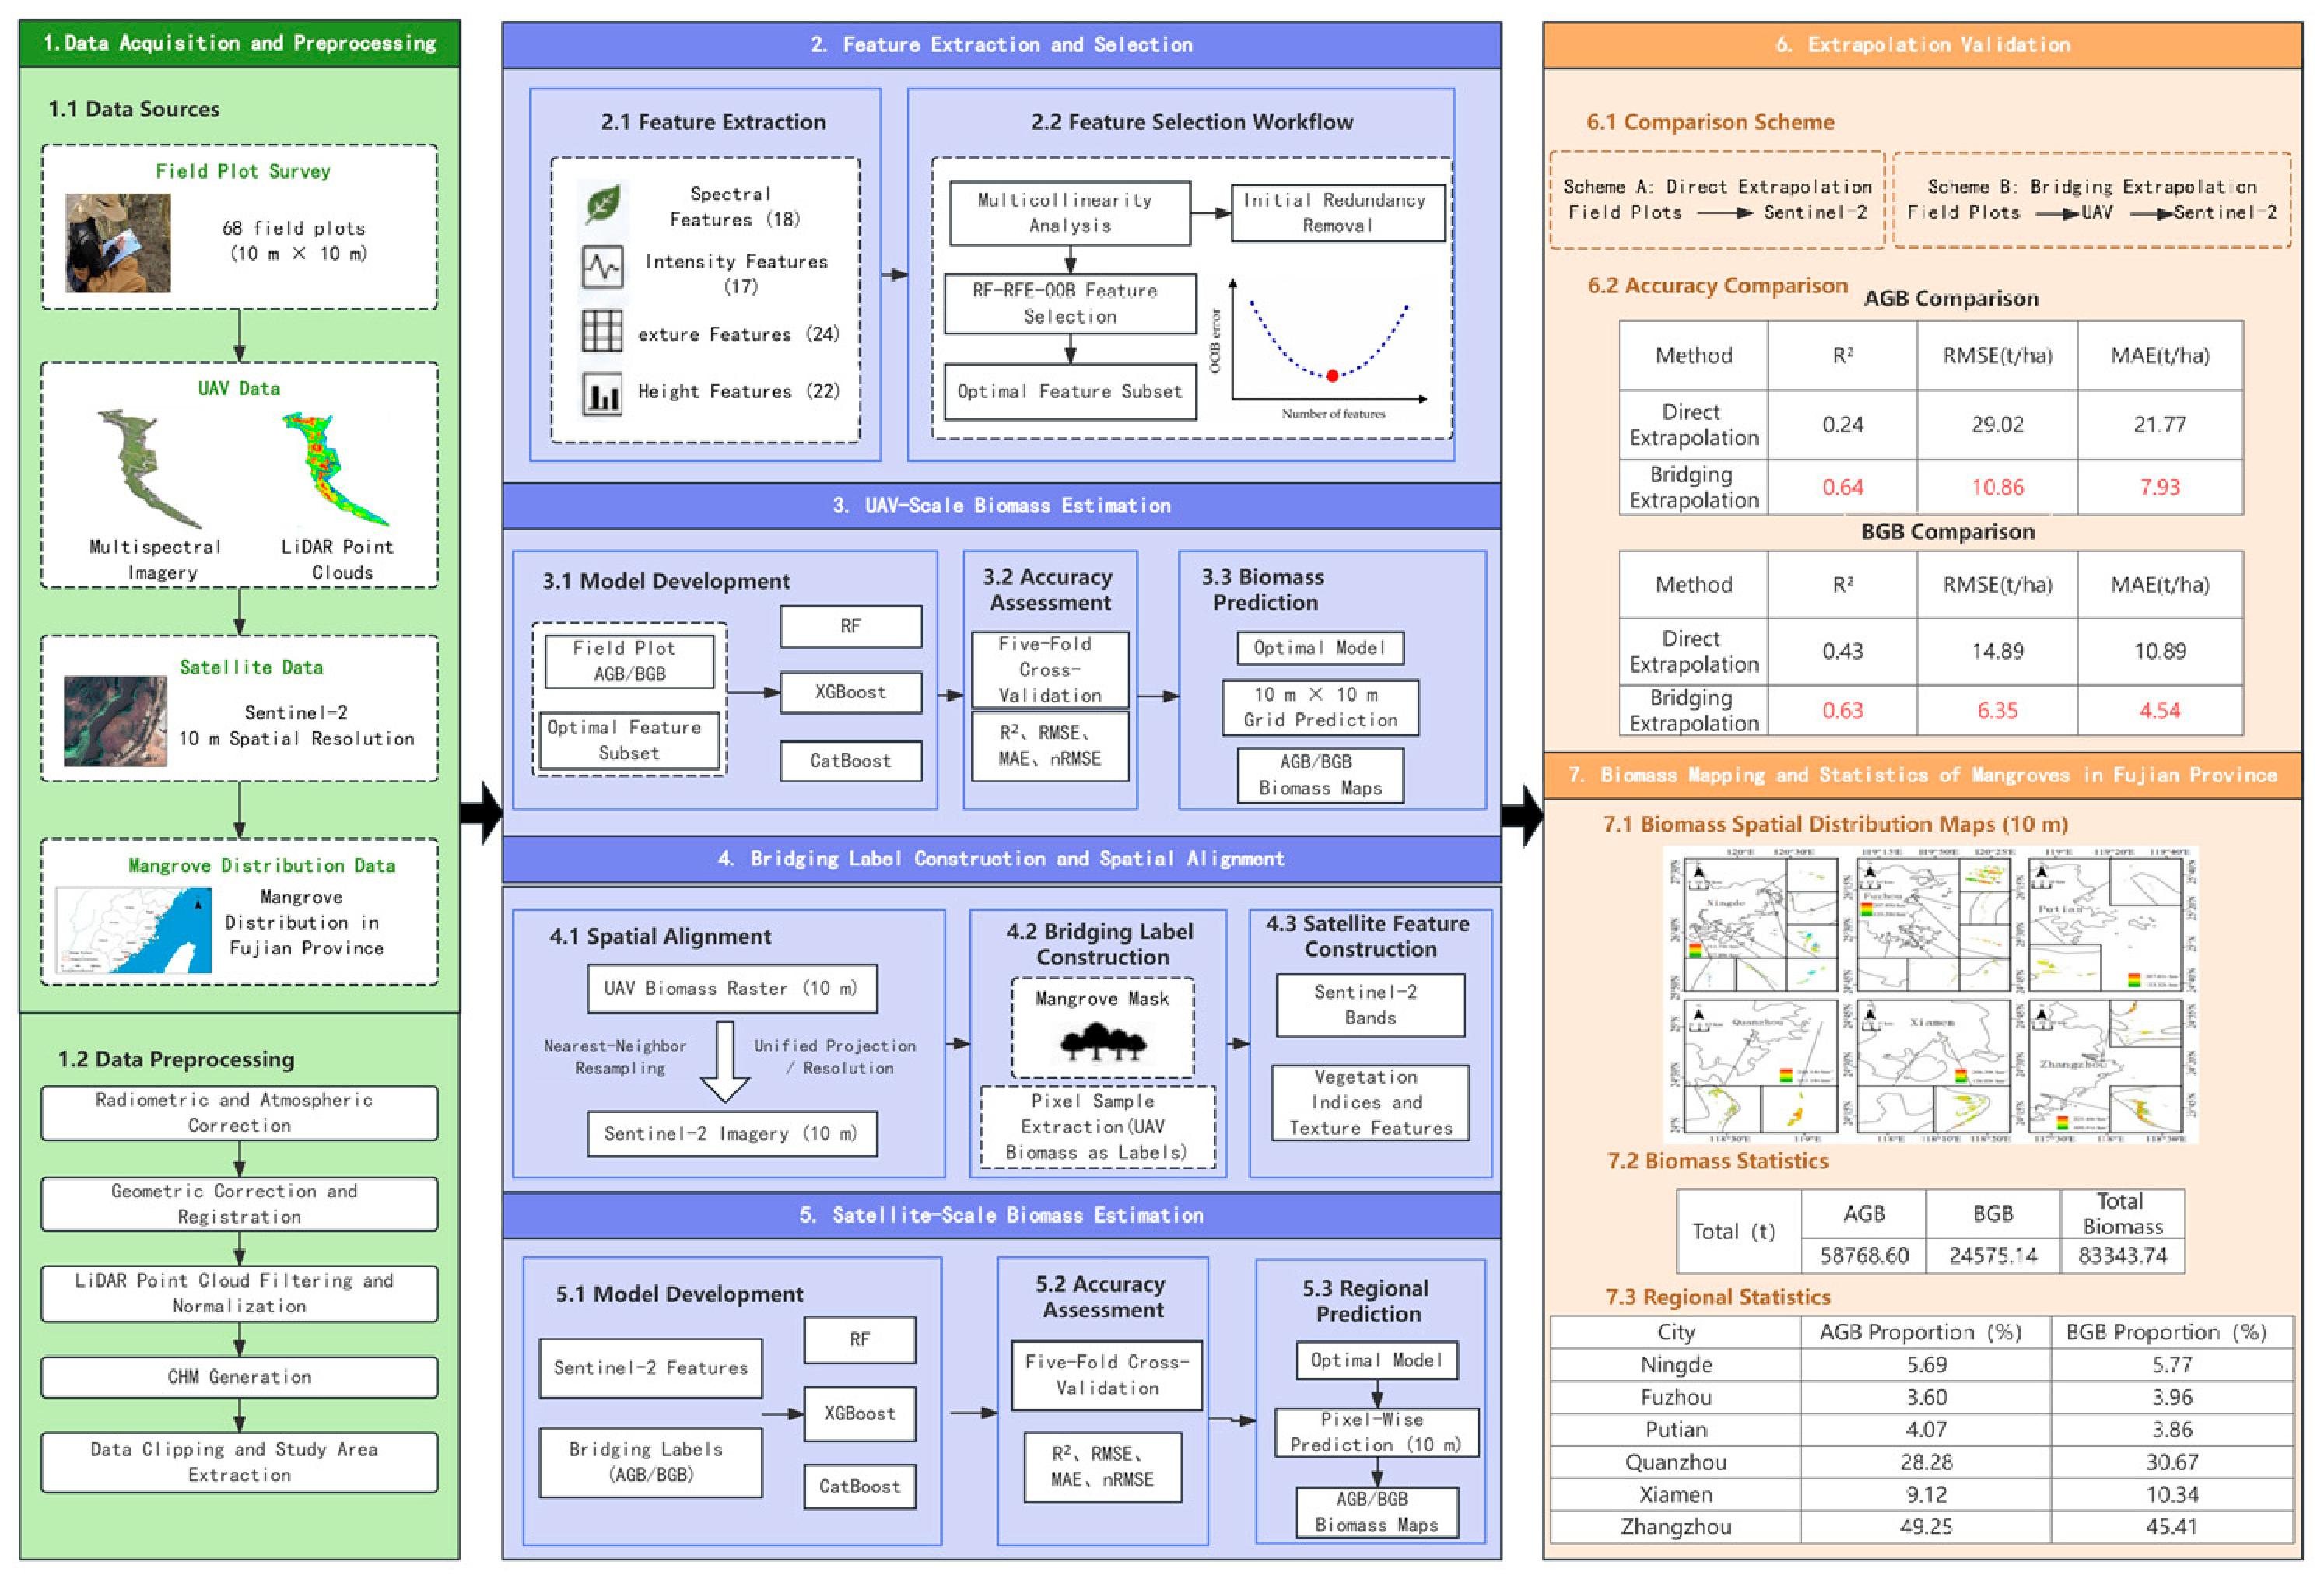
2.5. Workflow
3. Results and Analysis
3.1. Characteristics of Plot Biomass
3.2. Analysis of Feature Selection Results
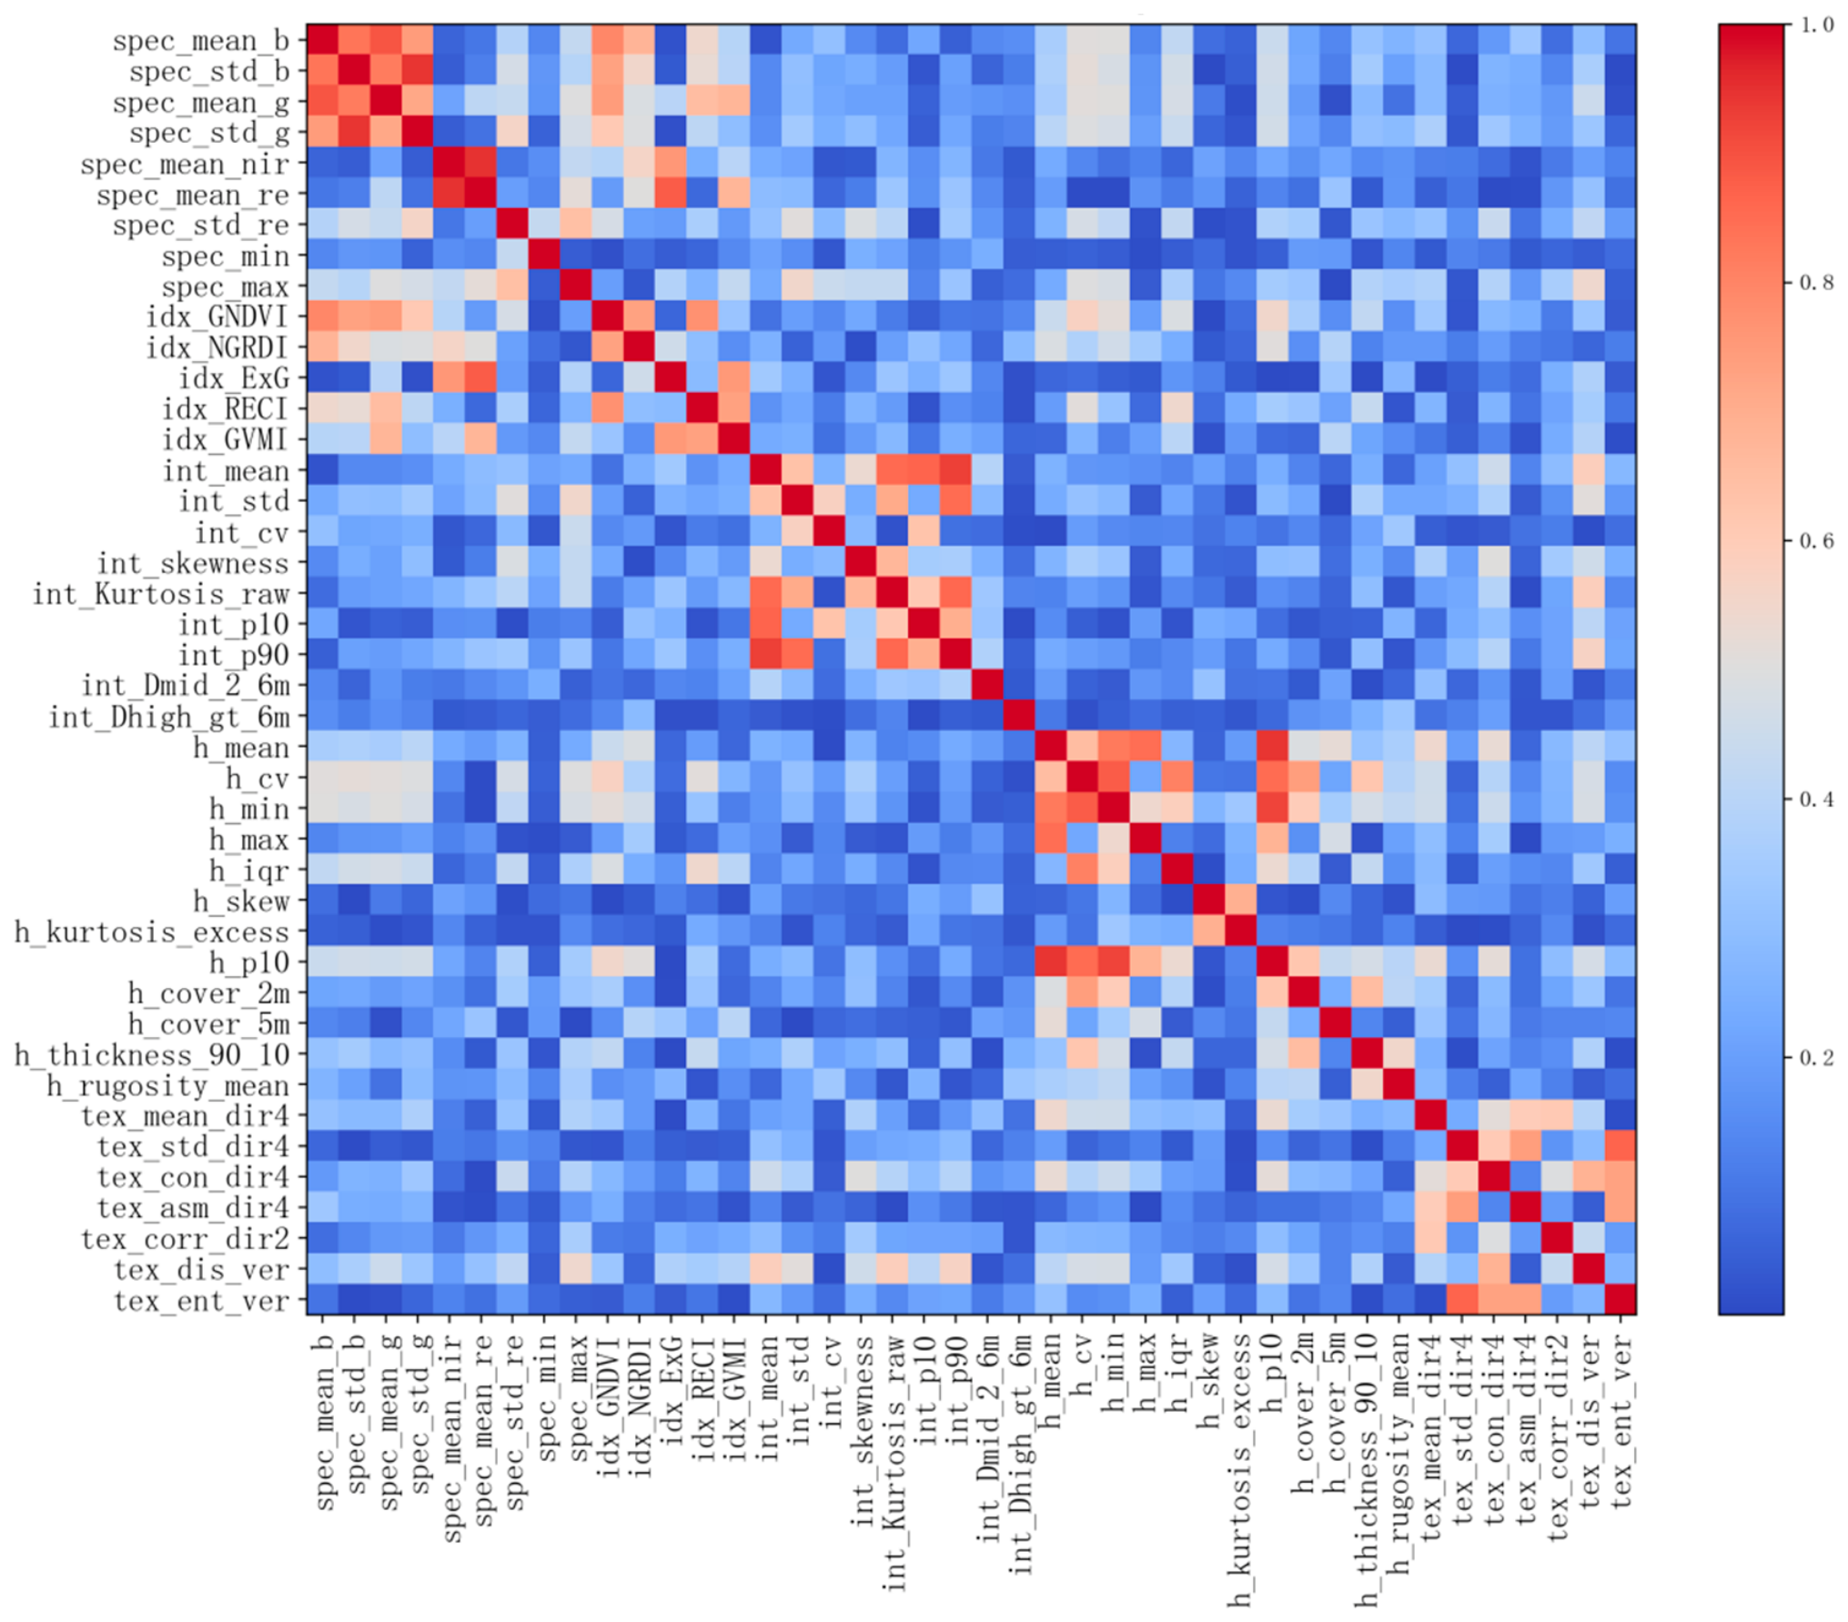
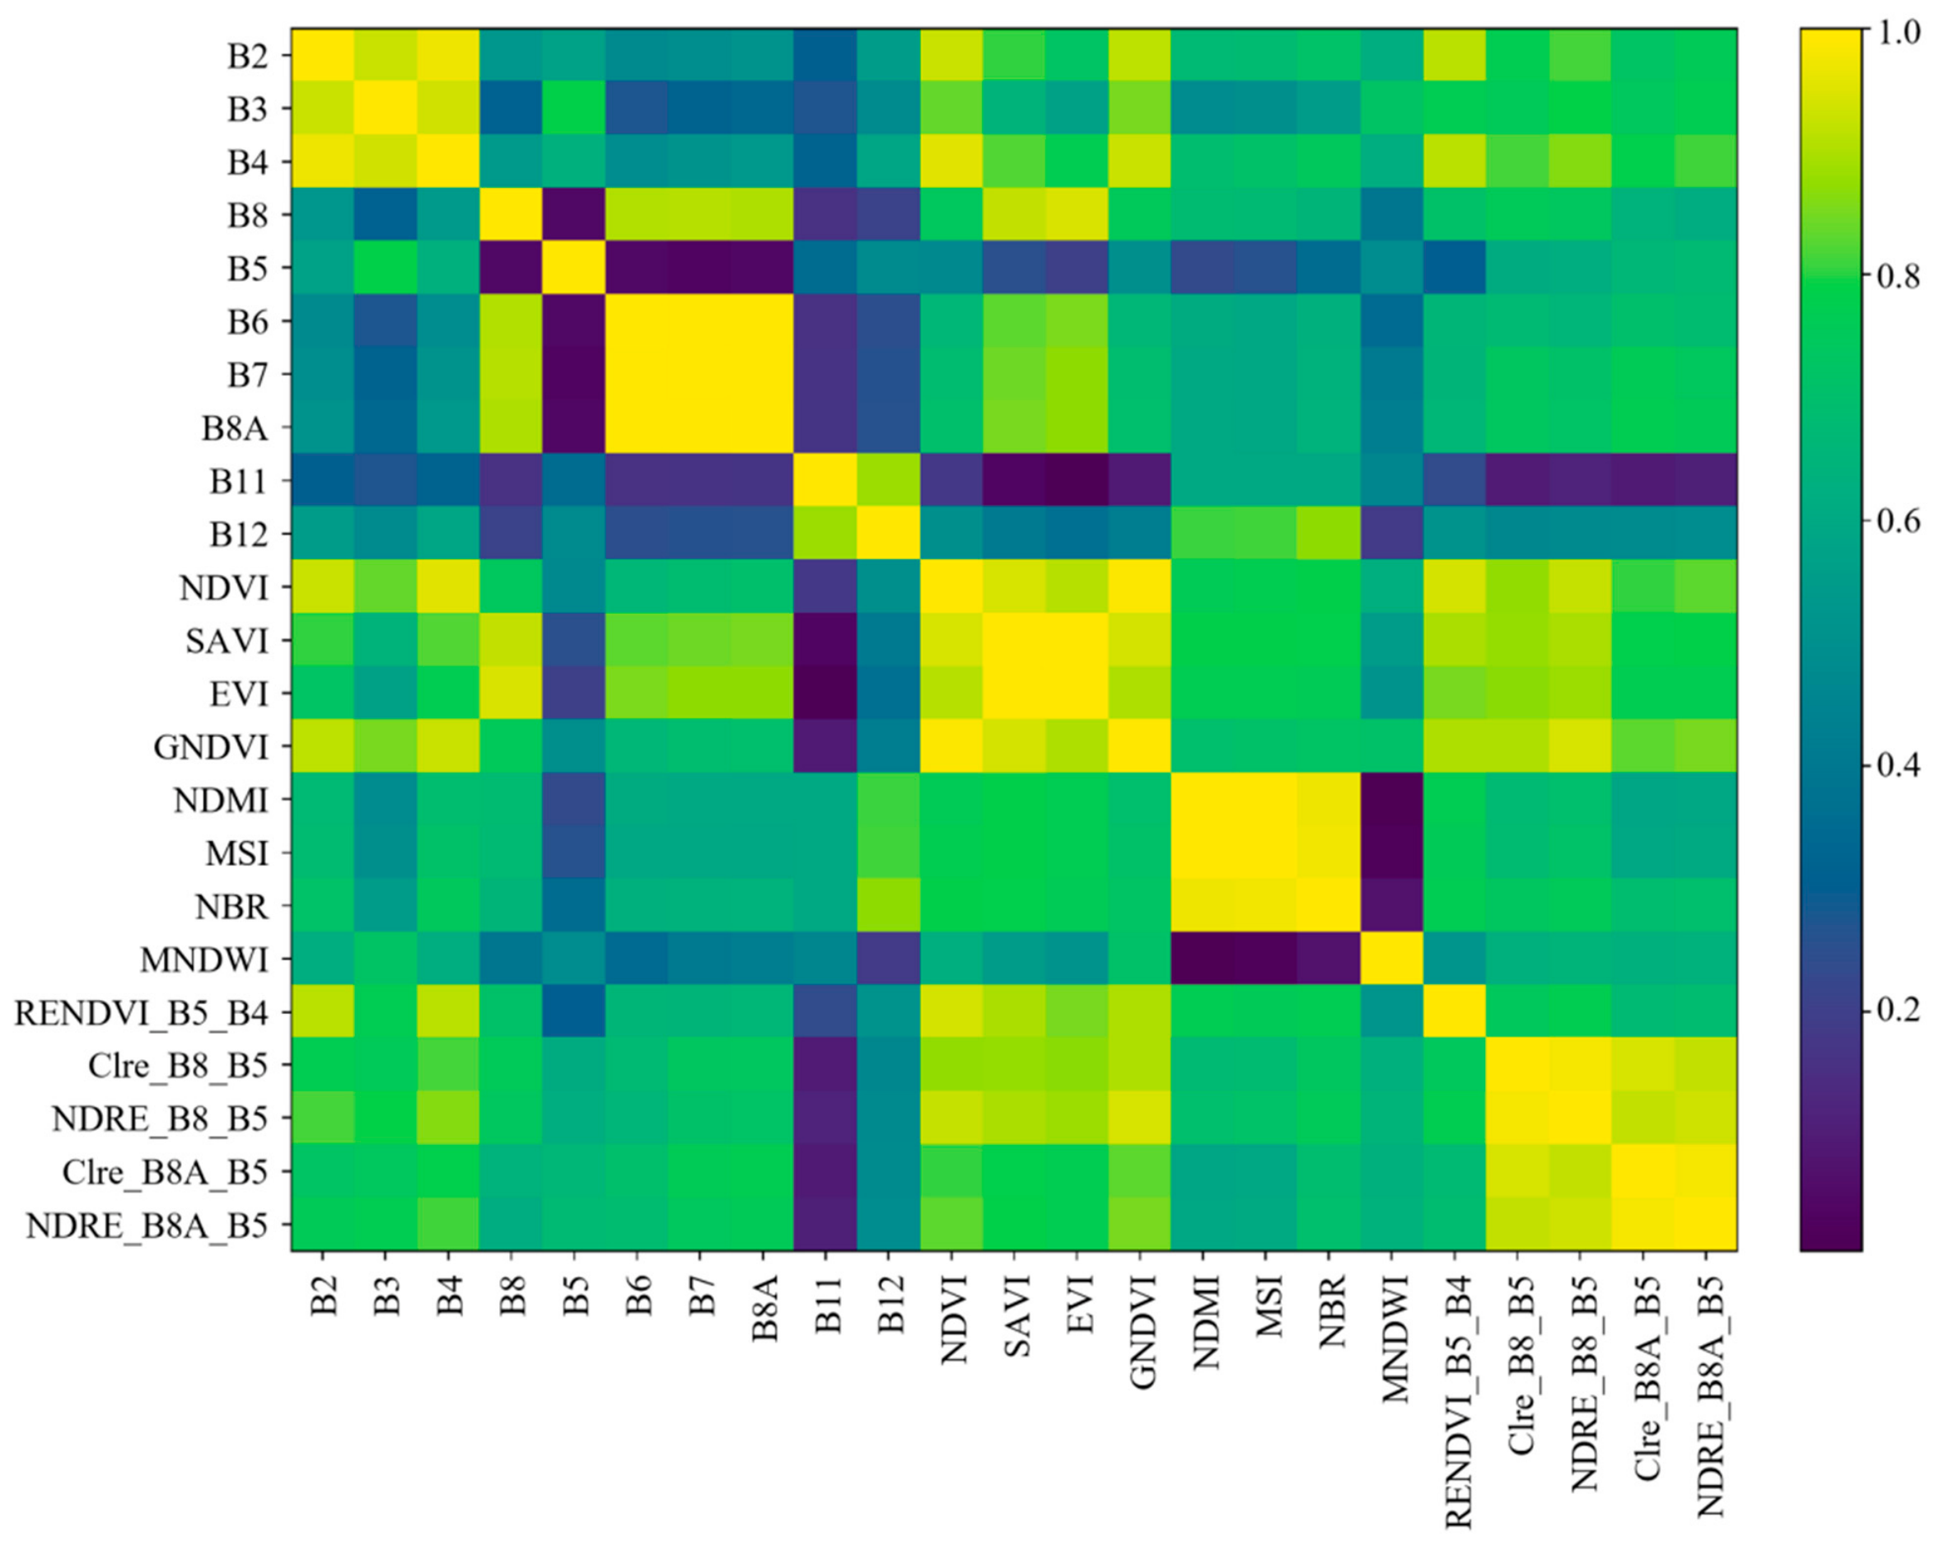
3.2.1. Results of Multicollinearity Screening
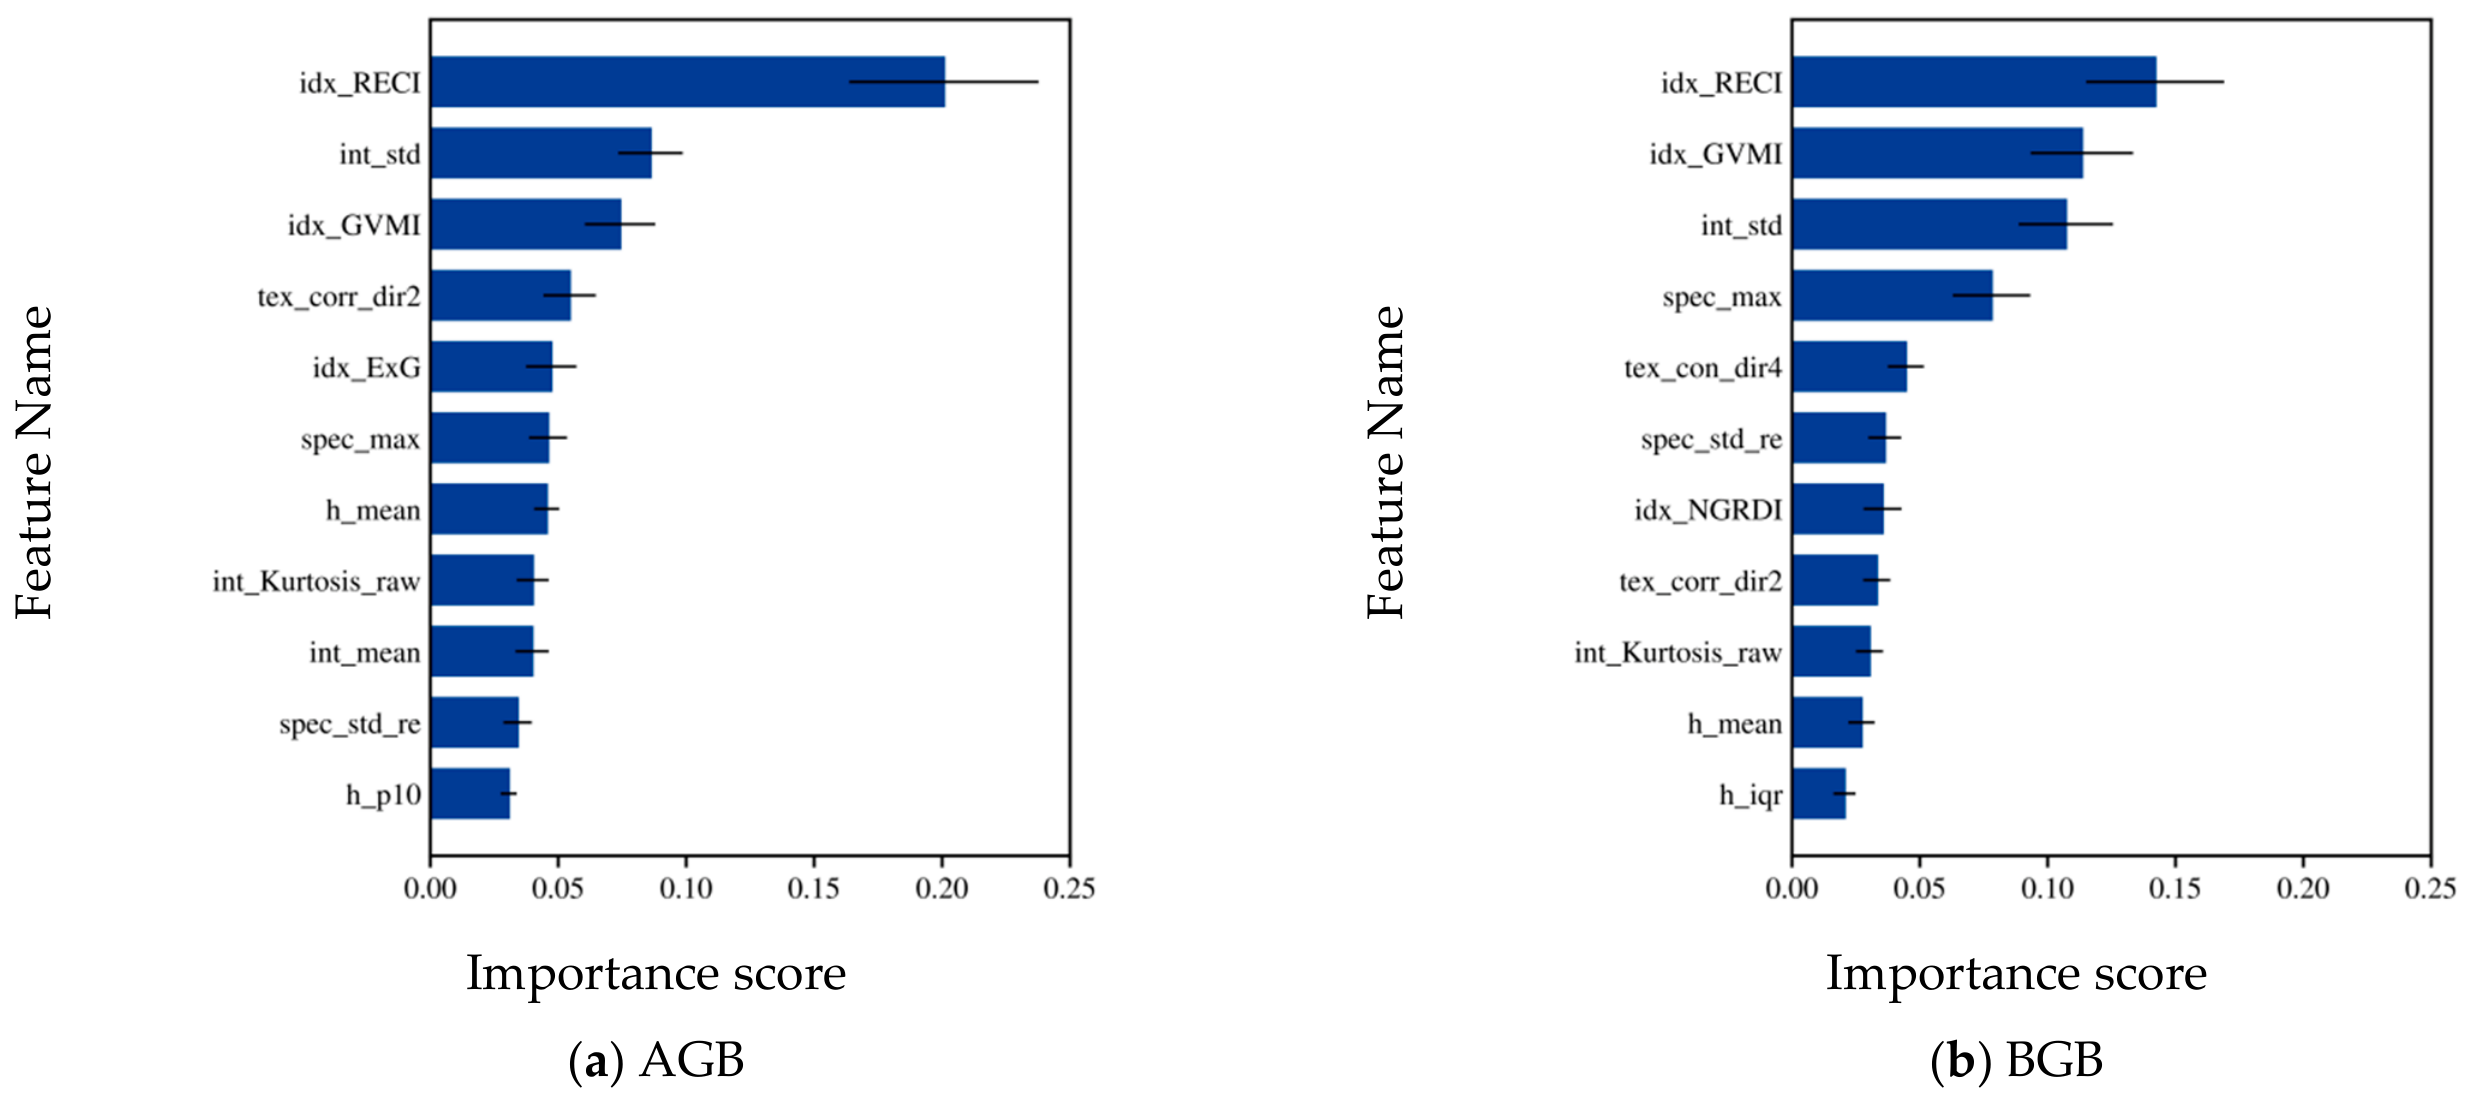
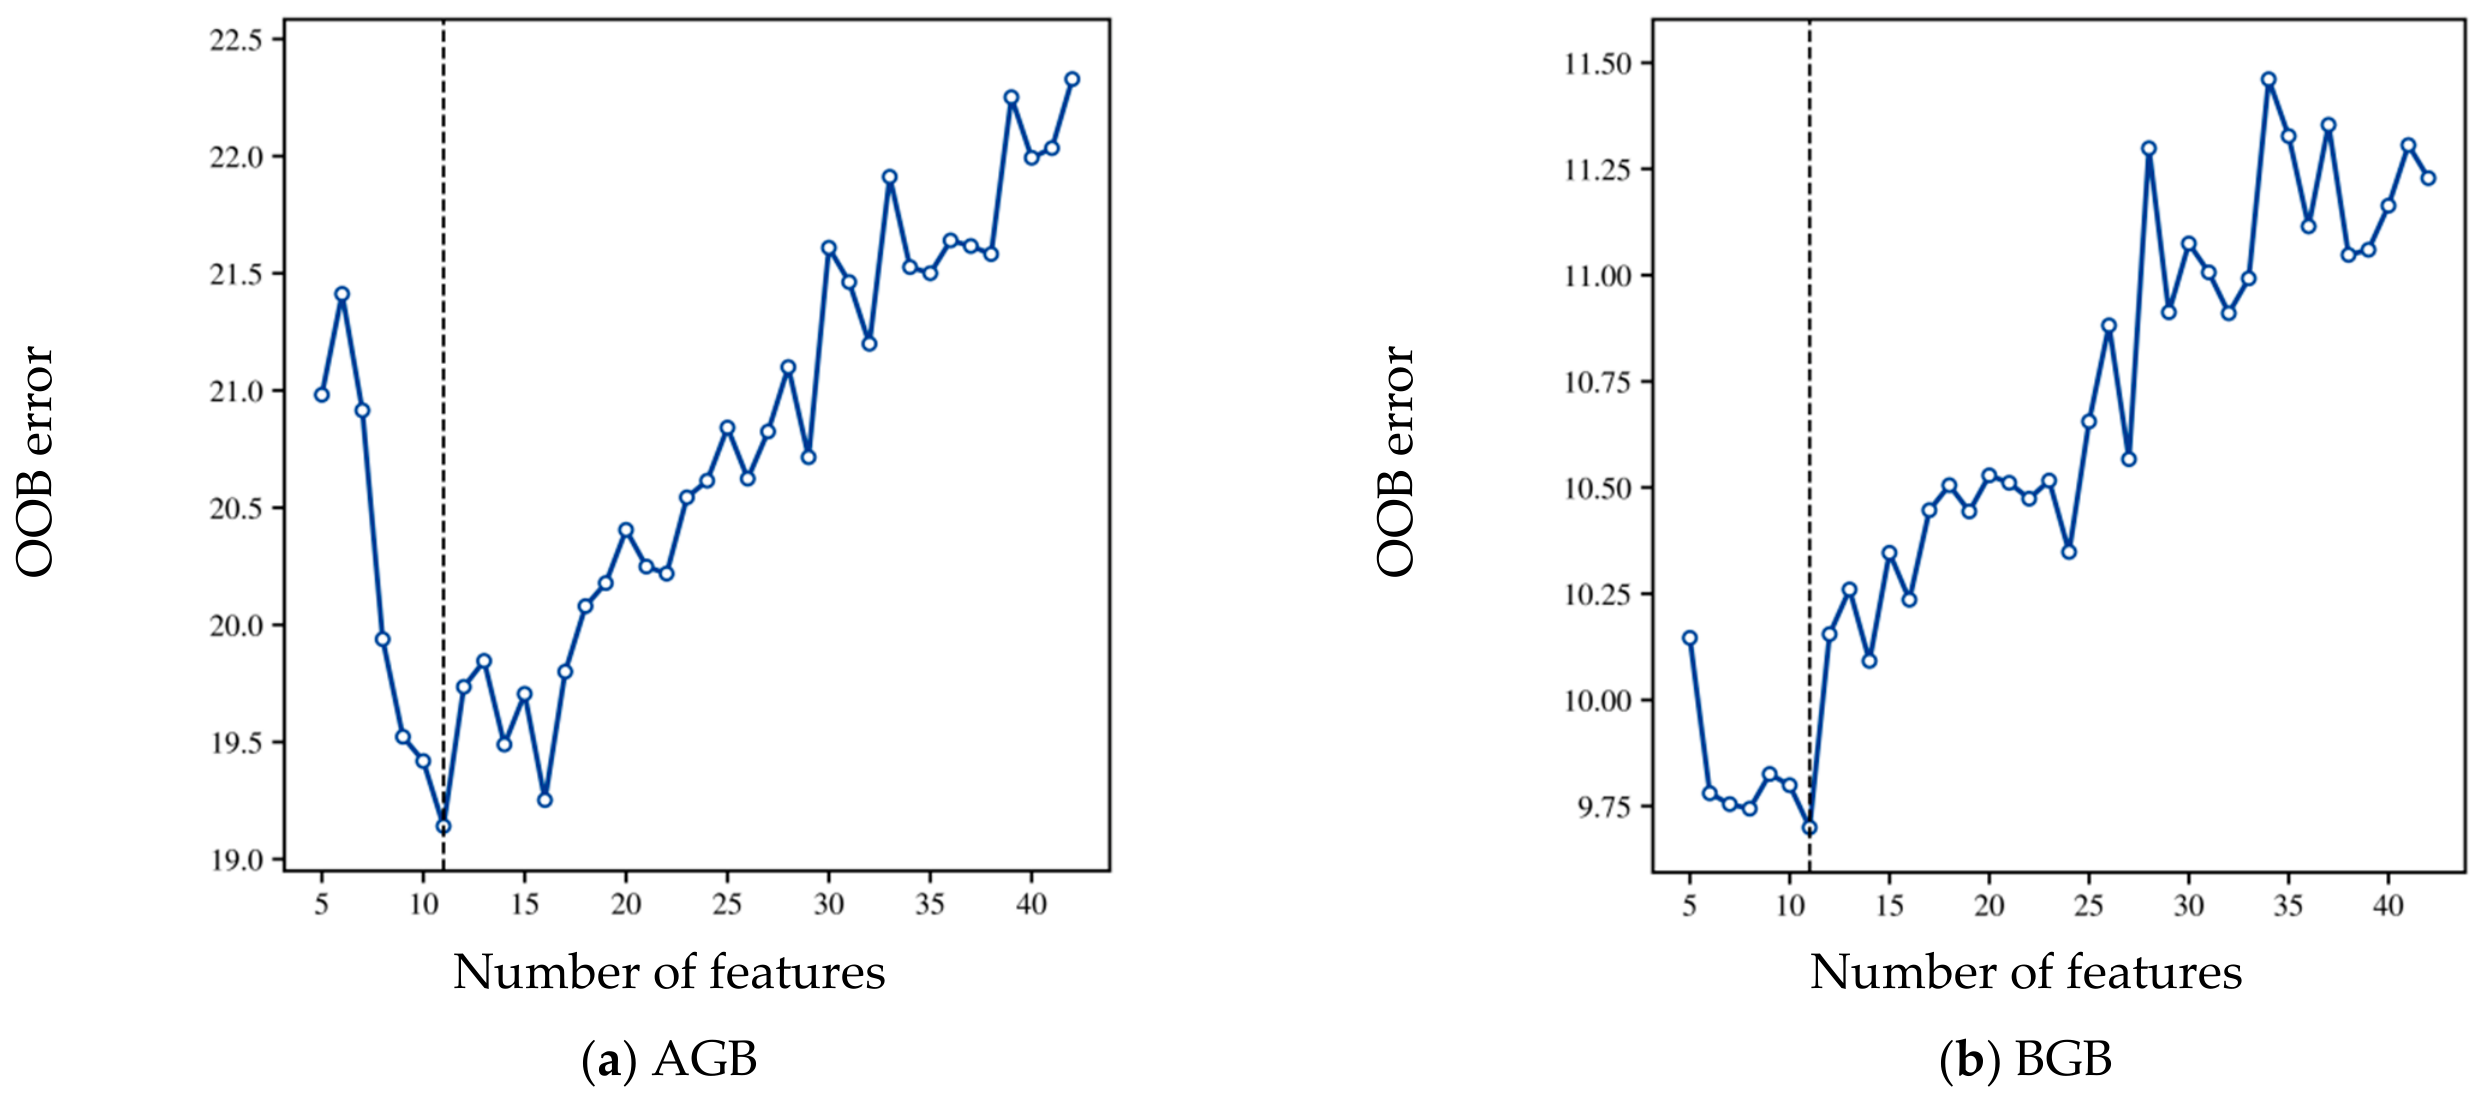
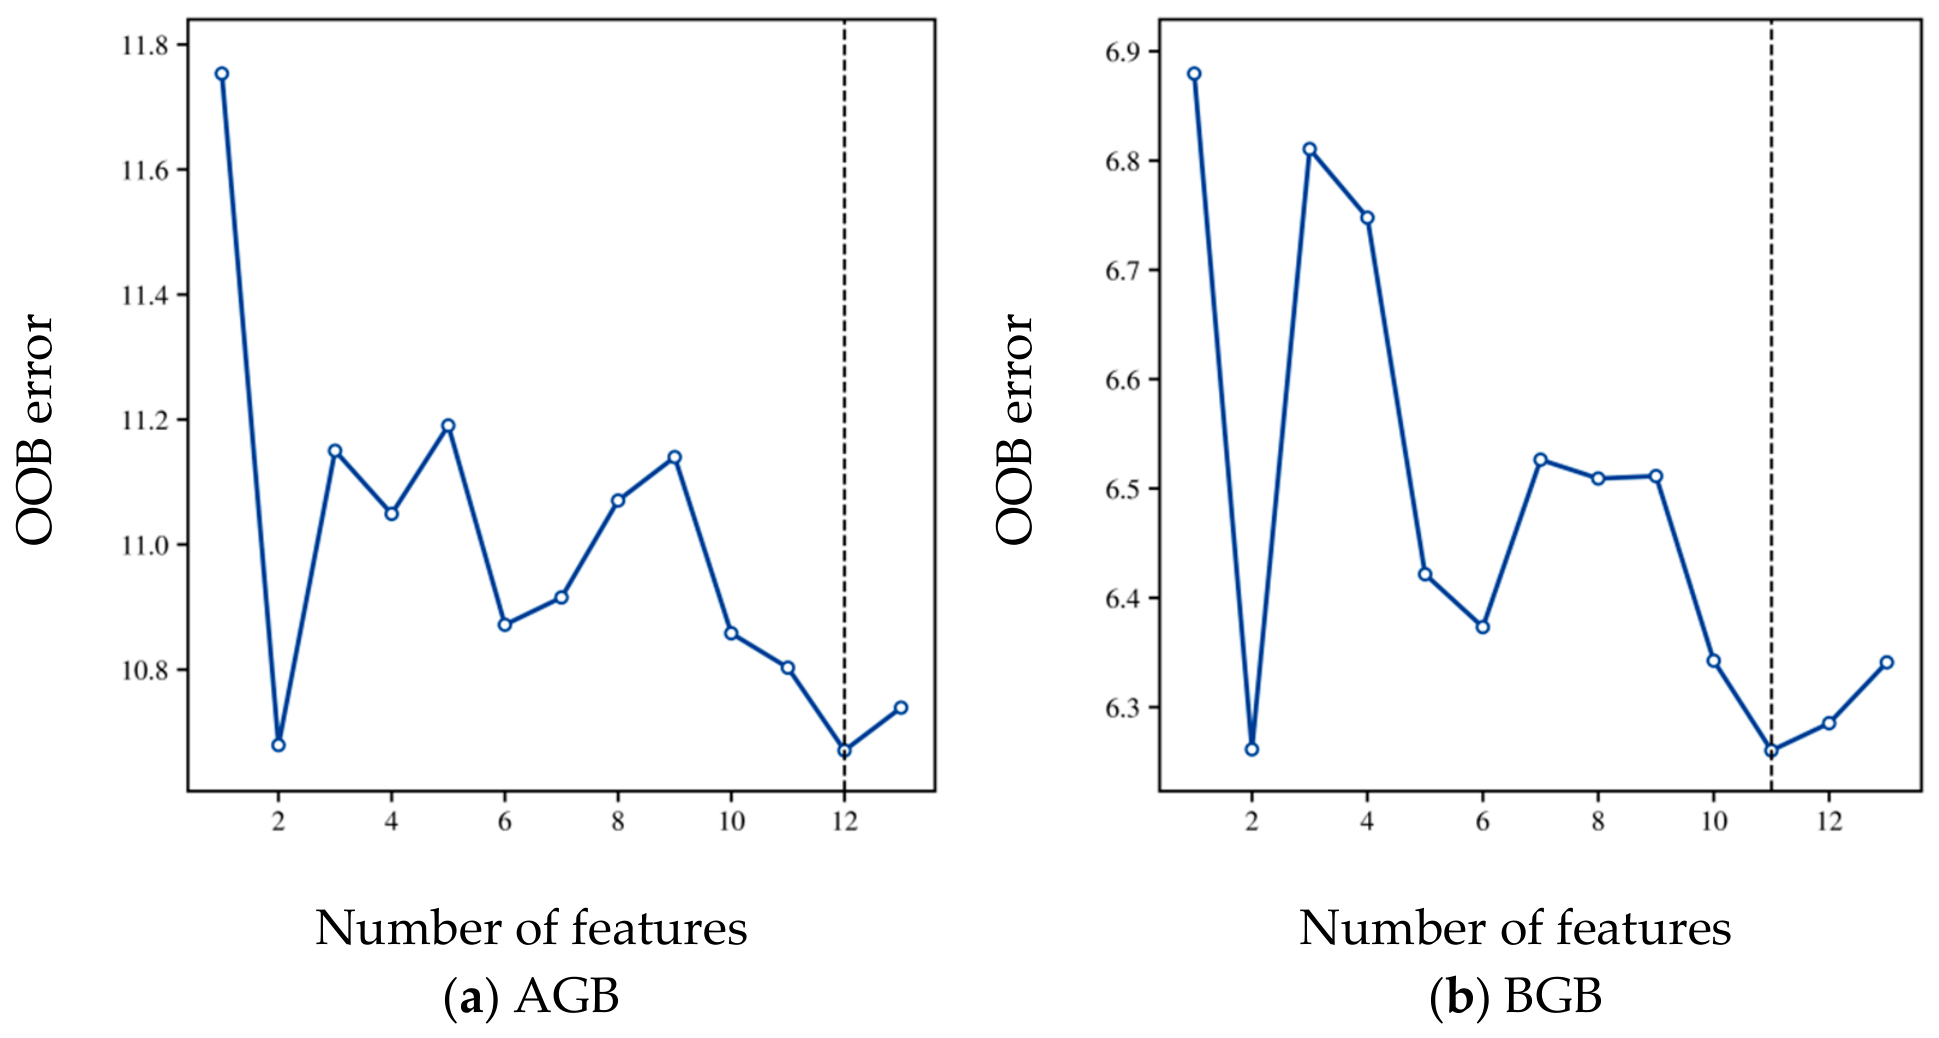
3.2.2. RF-RFE-OOB Feature Selection Results
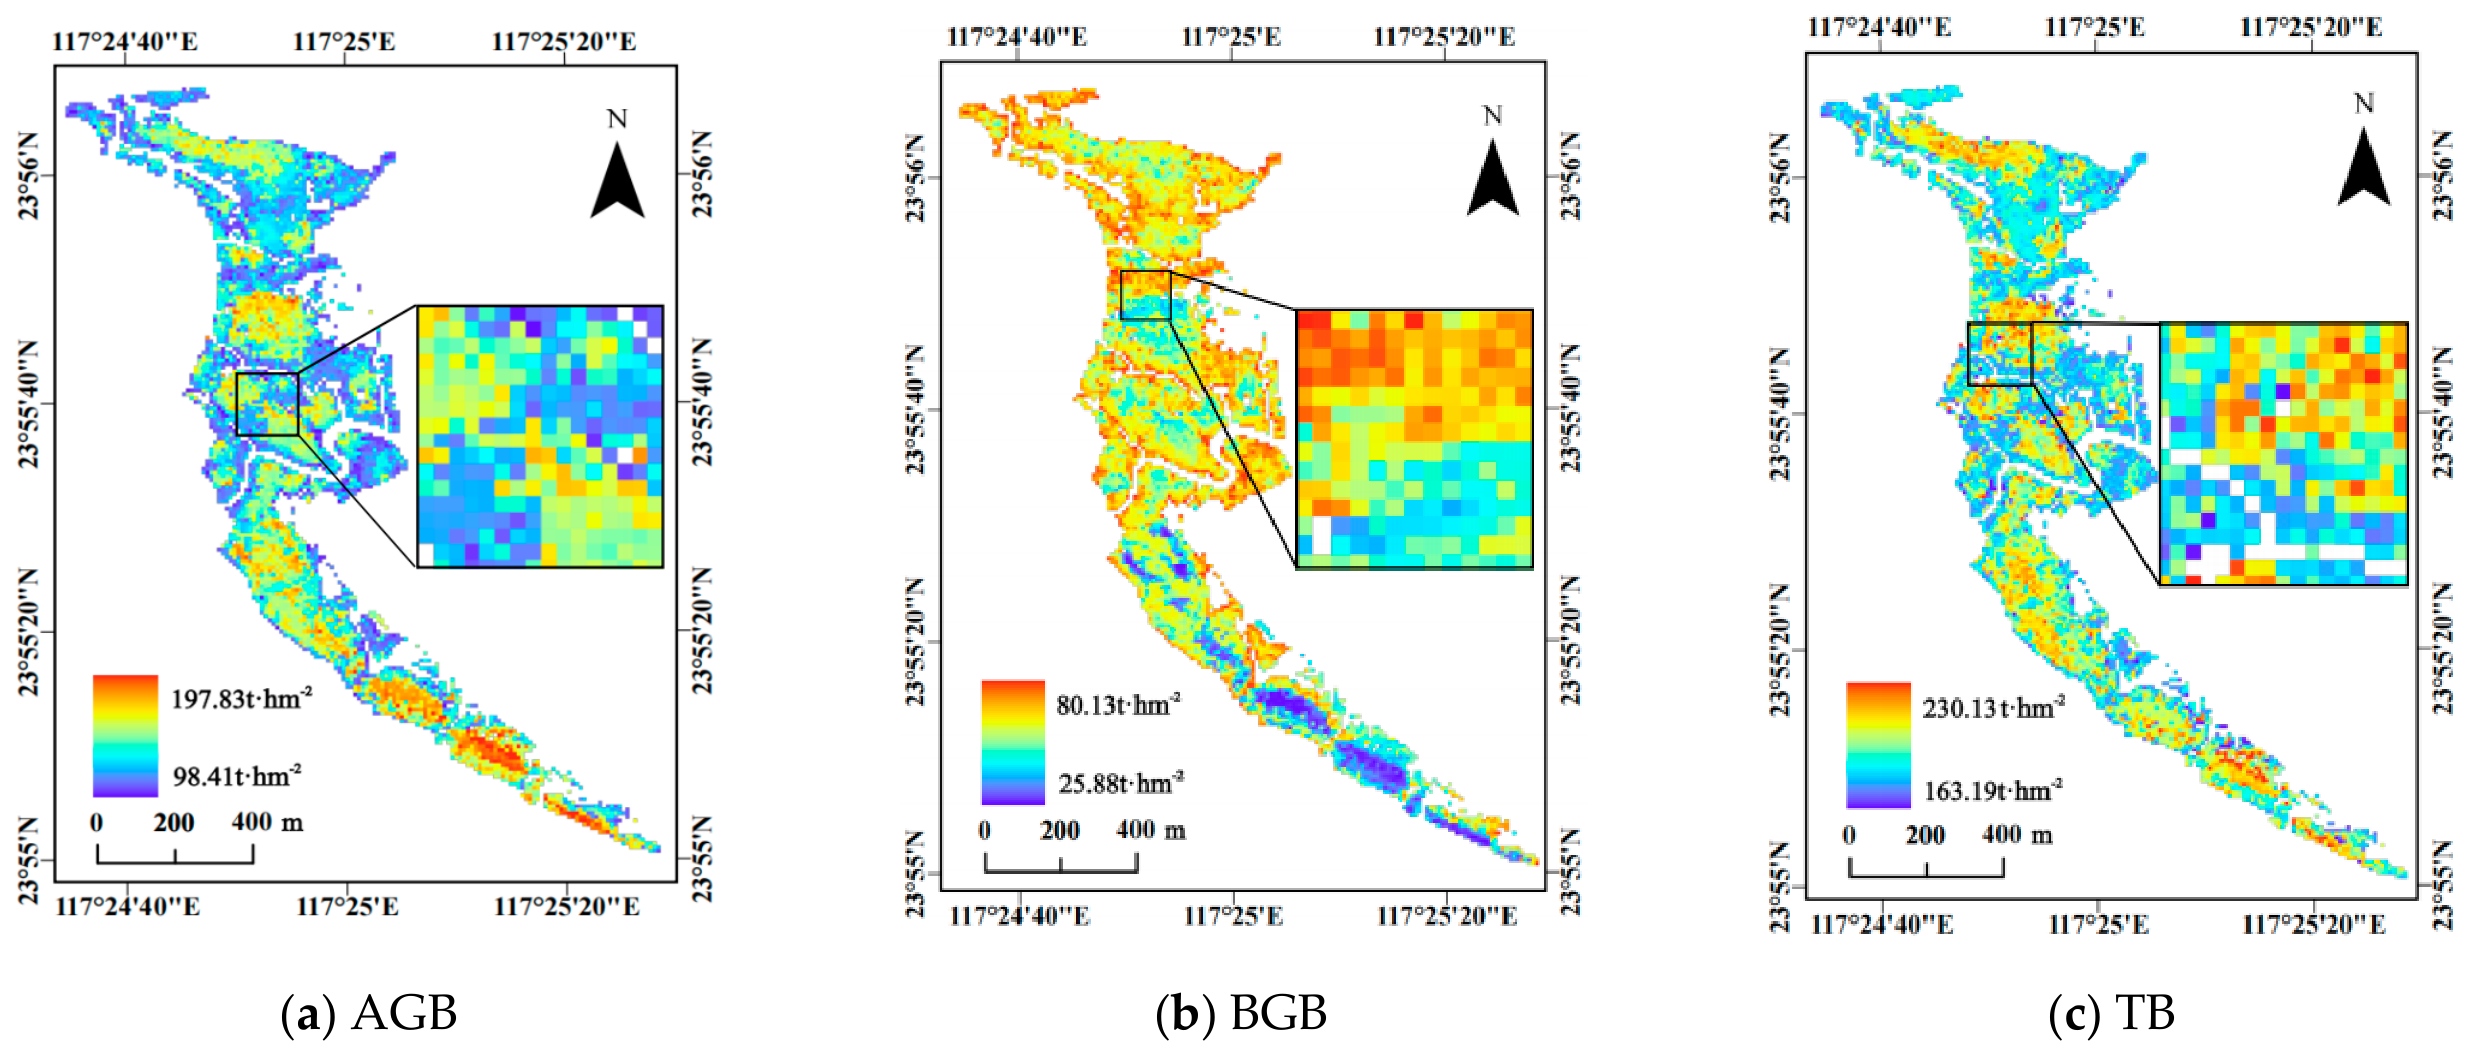
3.3. UAV-Scale Mangrove Biomass Estimation Results
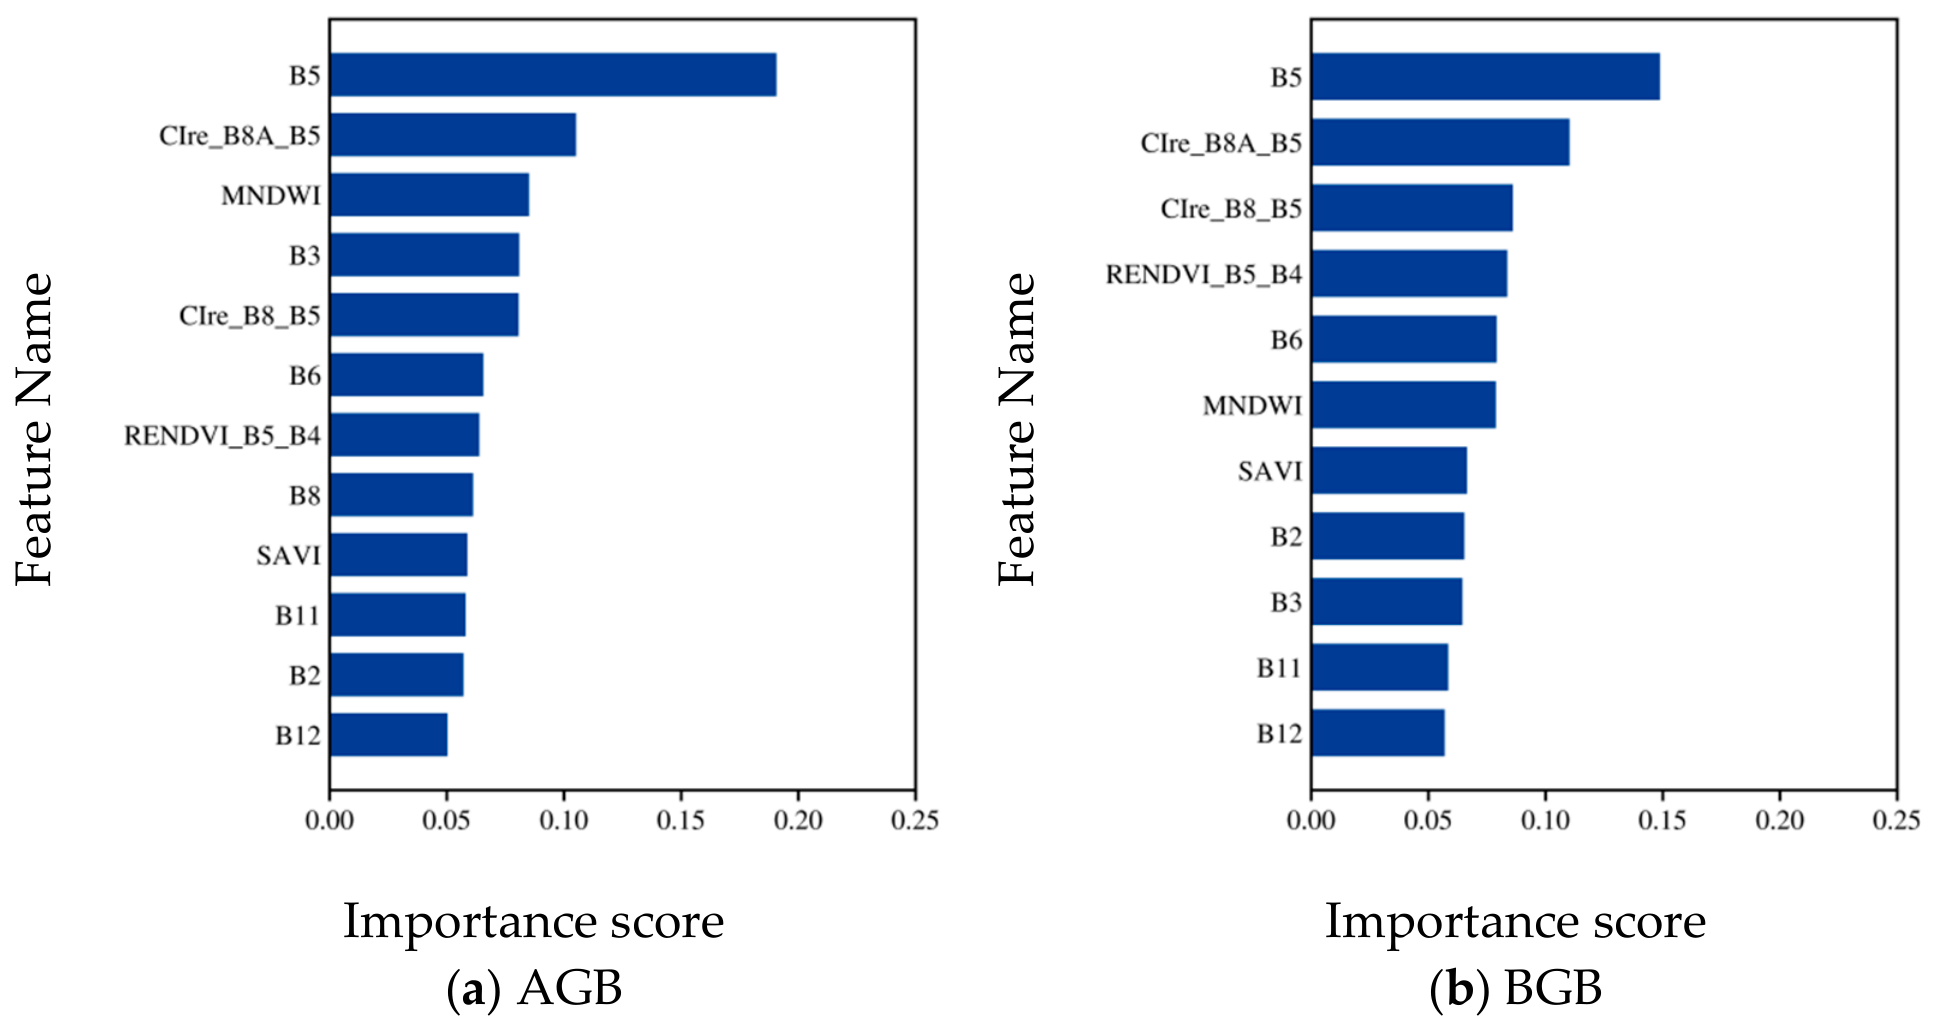
3.4. Satellite-Scale Feature Selection Results
3.5. Satellite-Scale Biomass Estimation Results
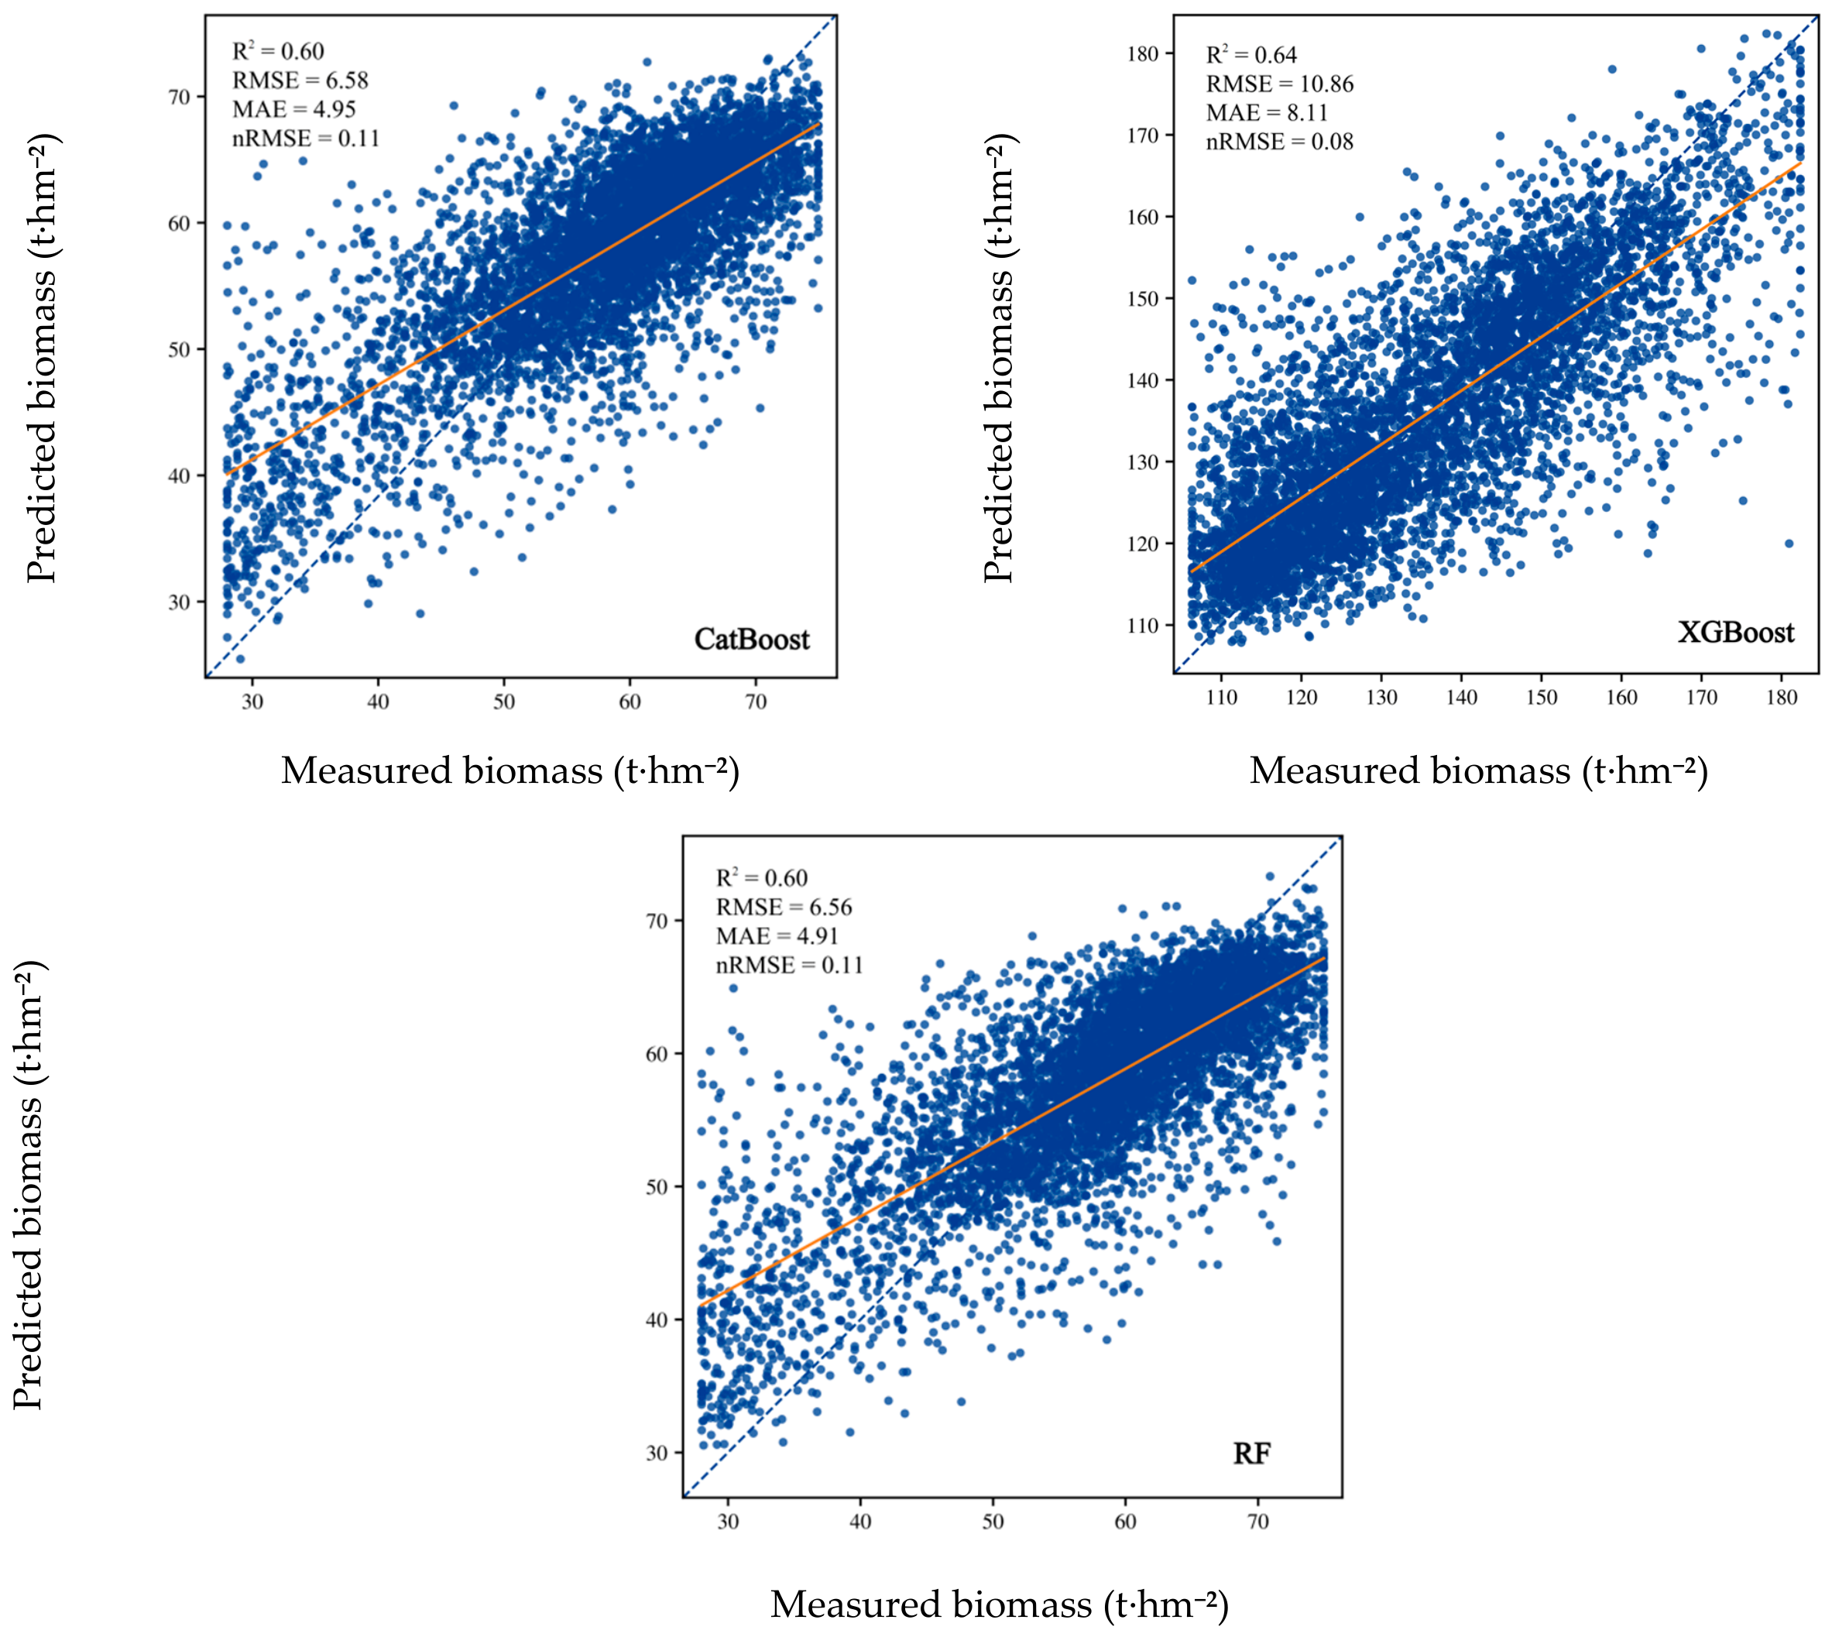
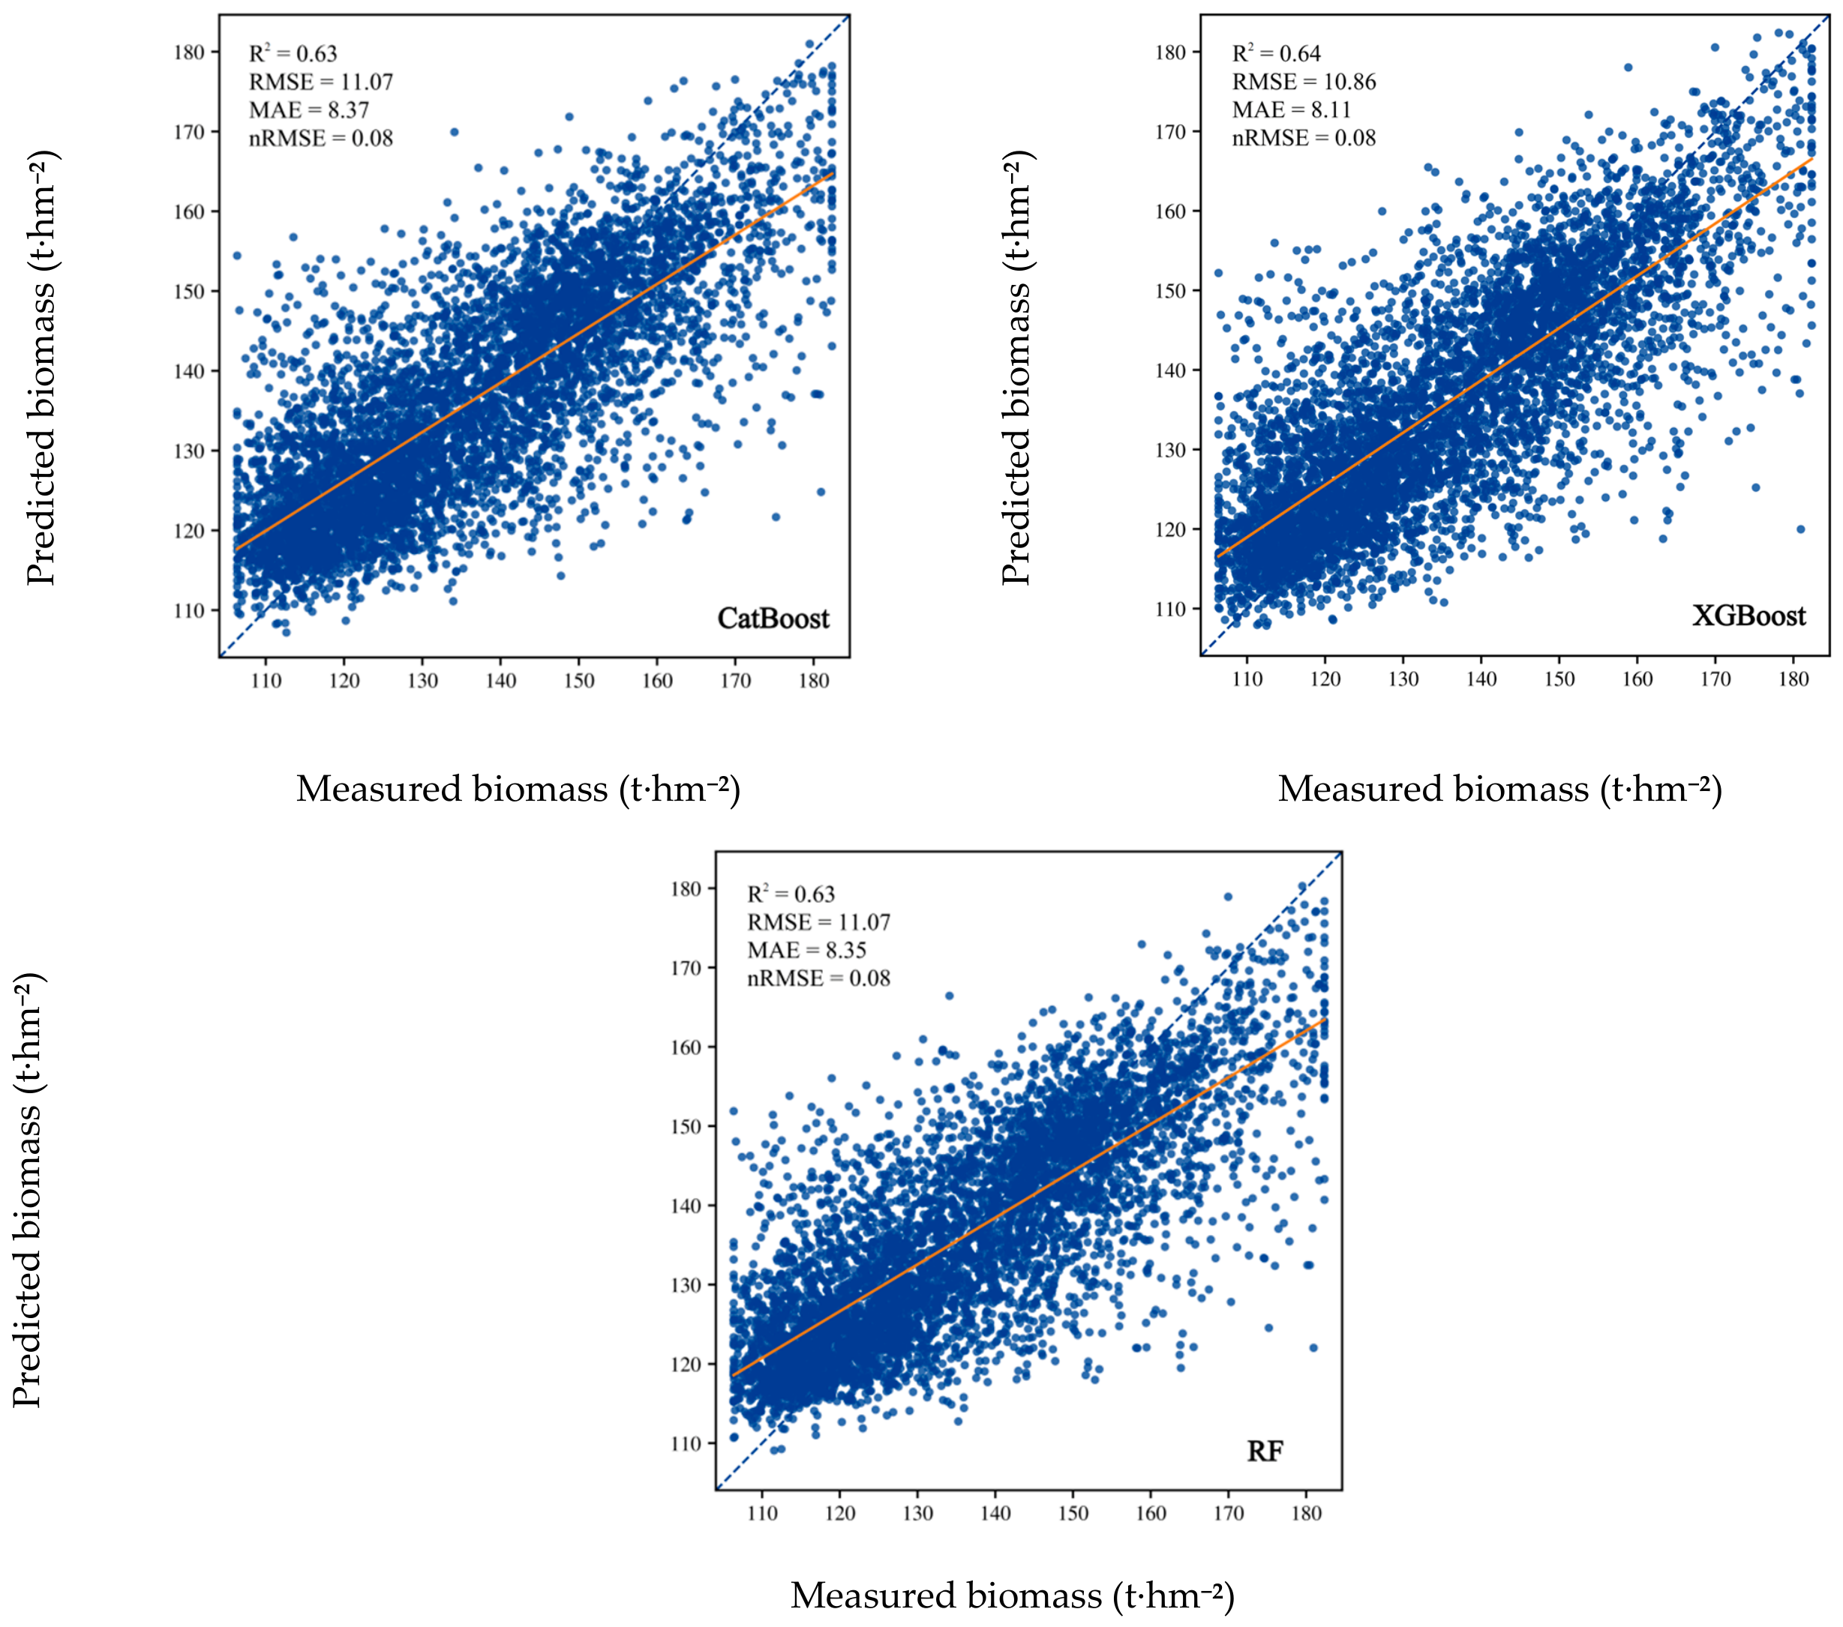
3.5.1. Model Accuracy Evaluation
3.5.2. Determination and Rationality Analysis of the Optimal Model
3.6. Accuracy Comparison Between Direct Extrapolation and UAV-Bridged Extrapolation
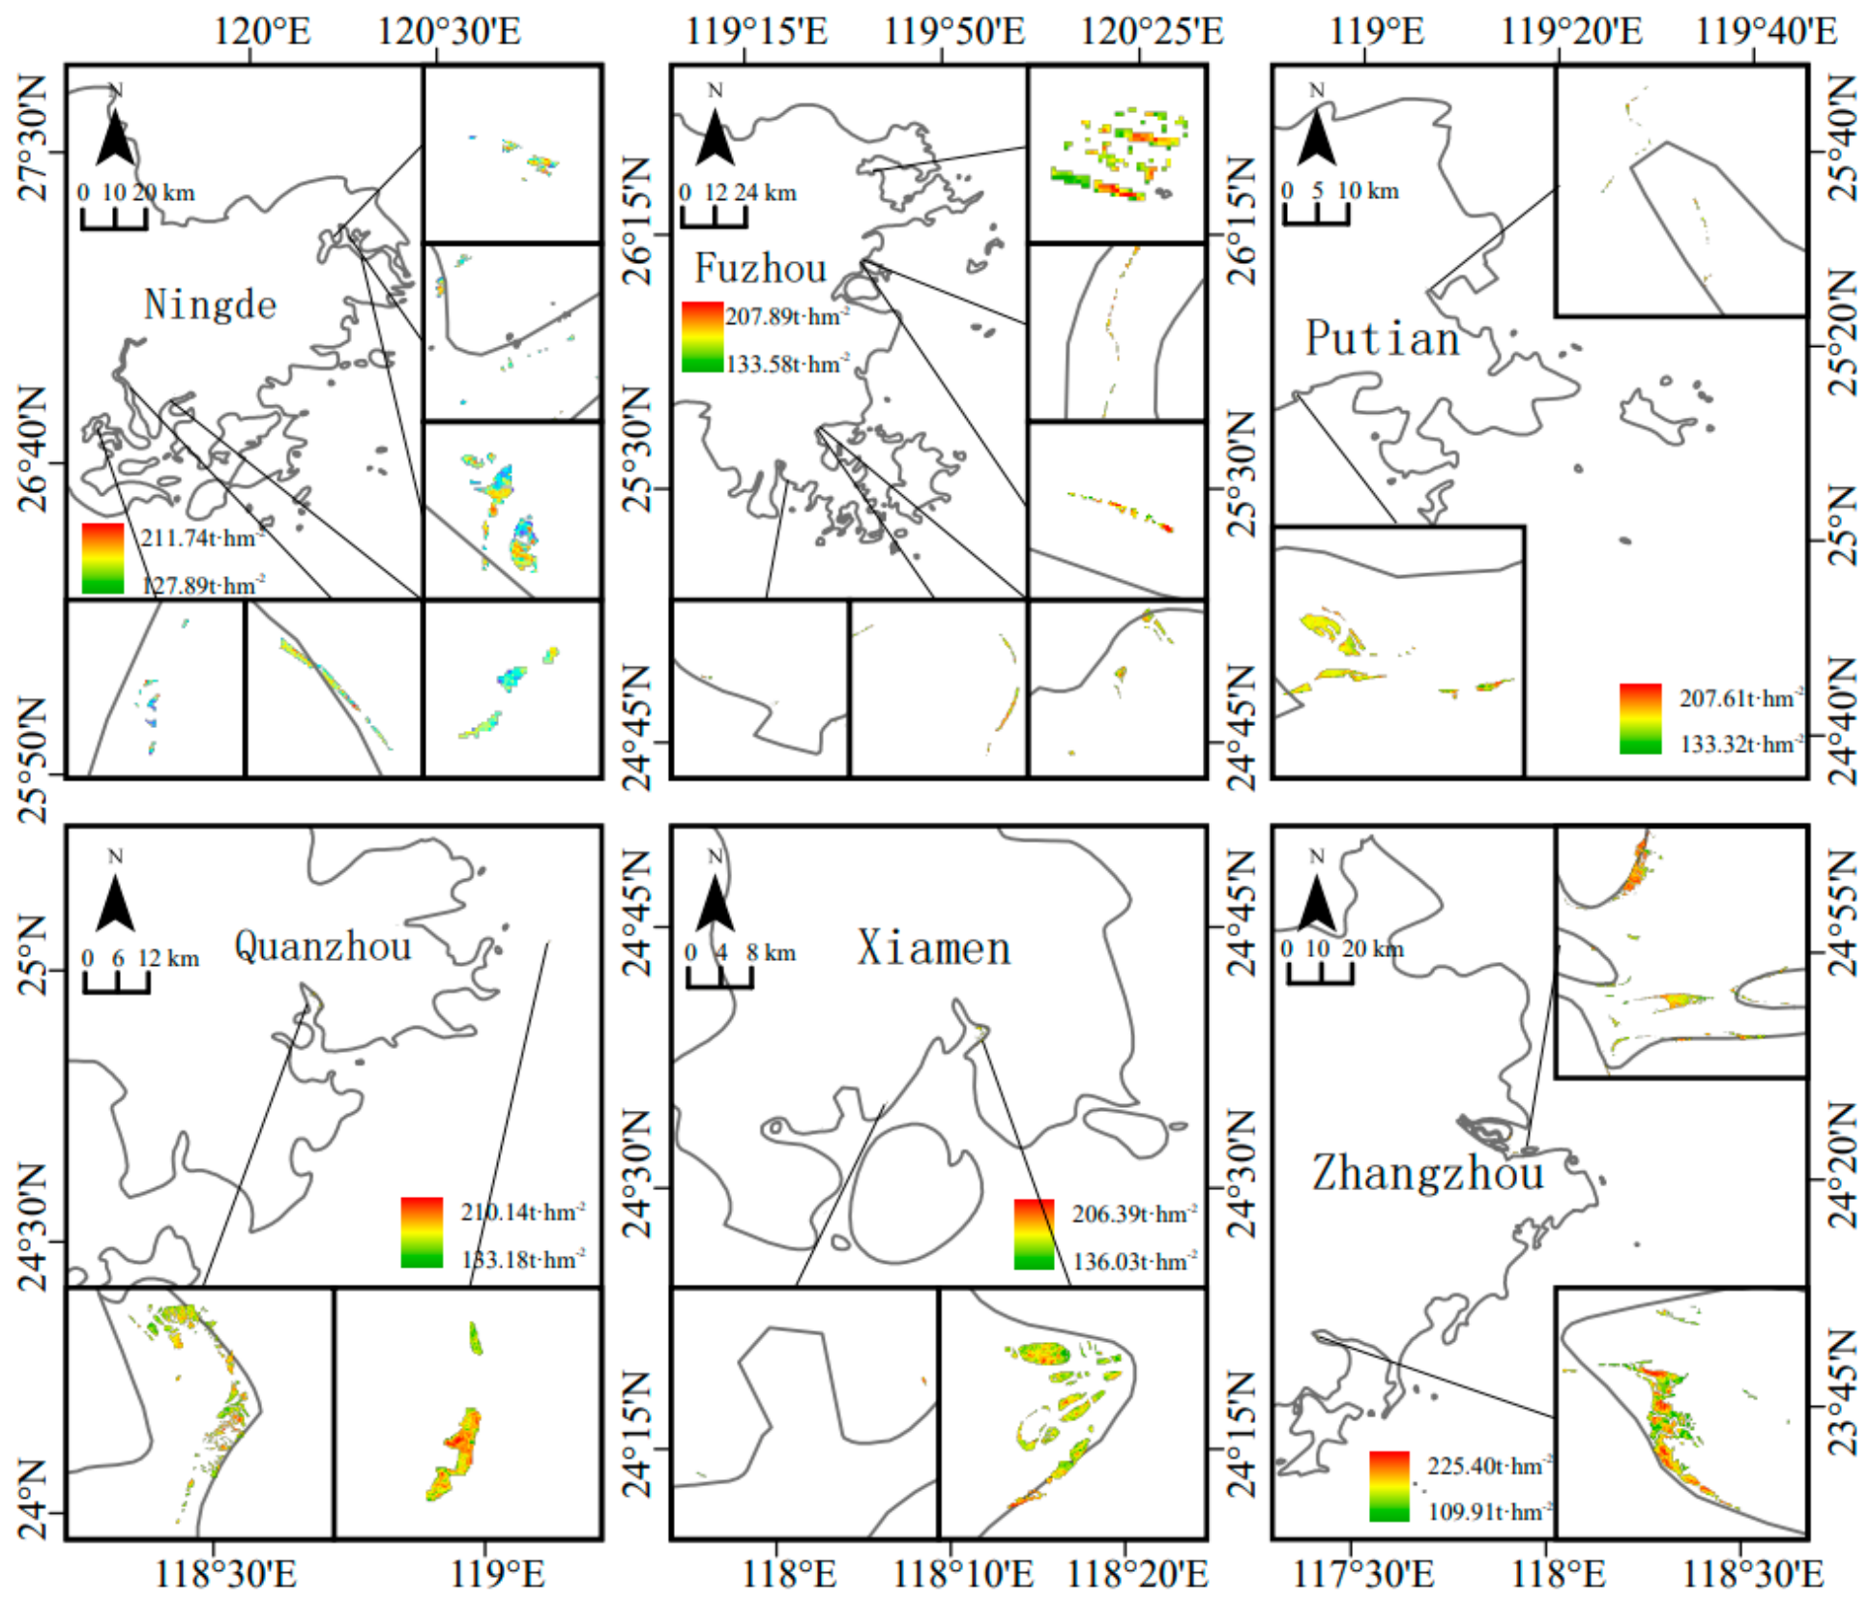
3.7. Spatial Distribution Pattern of Mangrove Biomass in Fujian Province
3.8. Total Biomass and Structural Characteristics of Mangroves in Fujian Province
4. Discussion
4.1. Role of the UAV Bridging Scale in Regional Biomass Extrapolation
4.2. Contribution of Multisource Remote Sensing Features to Mangrove Biomass Estimation
4.3. Comparison with Previous Biomass Estimates
4.4. Mechanism and Advantages of the UAV Bridging Framework
4.5. Limitations and Future Perspectives
5. Conclusions
- (1)
- Biomass estimation models developed using UAV multispectral imagery and LiDAR data exhibited strong predictive capability. After RF-RFE-OOB feature selection, the optimal models achieved R2 values of 0.69 and 0.78 for AGB and BGB estimation, respectively, indicating that multisource remote sensing information can effectively characterize variations in mangrove biomass.
- (2)
- The UAV bridging scale significantly improved the accuracy of satellite-scale biomass estimation. Compared with the direct extrapolation approach, the UAV-bridged approach increased the R2 of the AGB model from 0.24 to 0.64 and that of the BGB model from 0.43 to 0.63, effectively alleviating the scale mismatch between field plots and satellite pixels.
- (3)
- The total AGB and BGB of mangroves in Fujian Province were estimated at 58,768.60 t and 24,575.14 t, respectively, resulting in a total biomass of 83,343.74 t. Mangrove biomass generally exhibited a coastal distribution pattern, with high-biomass areas mainly concentrated in the coastal regions of Zhangzhou and Quanzhou.
Supplementary Materials
Author Contributions
Funding
Data Availability Statement
Conflicts of Interest
References
- Lin, P. Research on Mangrove Ecosystems in China; Xiamen University: Xiamen, China, 2002. (In Chinese) [Google Scholar]
- Zhu, J.J.; Yan, B. Blue carbon sink function and carbon neutrality potential of mangroves. Sci. Total Environ. 2022, 822, 153438. [Google Scholar] [CrossRef] [Scilit] [PubMed]
- Cao, Q.X. Remote Sensing Estimation of Mangrove Biomass and Carbon Storage in the Beibu Gulf Coastal Region; Chinese Academy of Forestry: Beijing, China, 2010. (In Chinese) [Google Scholar]
- Strain, E.M.A.; Kompas, T.; Boxshall, A.; Kelvin, J.; Swearer, S.; Morris, R. Assessing the coastal protection services of natural mangrove forests and artificial rock revetments. Ecosyst. Serv. 2022, 55, 101429. [Google Scholar] [CrossRef] [Scilit]
- Duke, N.C.; Meynecke, J.O.; Dittmann, S.; Ellison, A.M.; Anger, K.; Berger, U.; Cannicci, S.; Diele, K.; Ewel, K.C.; Field, C.D.; et al. A world without mangroves? Science 2007, 317, 41–42. [Google Scholar] [CrossRef] [Scilit] [PubMed]
- Weng, Q.; Lu, C.Y. Progress in the application of satellite remote sensing technology in mangrove ecological monitoring and research. J. Sanming Univ. 2006, 23, 141–147. (In Chinese) [Google Scholar]
- Giri, C. Observation and monitoring of mangrove forests using remote sensing: Opportunities and challenges. Remote Sens. 2016, 8, 783. [Google Scholar] [CrossRef] [Scilit]
- Jia, M.M.; Wang, Z.M.; Mao, D.H.; Huang, C.L.; Lu, C.Y. Spatial-temporal changes of China’s mangrove forests over the past 50 years: An analysis towards the Sustainable Development Goals (SDGs). Chin. Sci. Bull. 2021, 66, 3886–3901. (In Chinese) [Google Scholar] [CrossRef] [Scilit]
- Blasco, F.; Janodet, E.; Bellan, M.F. Natural hazards and mangroves in the Bay of Bengal. J. Coast. Res. 1994, 277–288. [Google Scholar]
- Pham, T.D.; Yokoya, N.; Xia, J.; Ha, N.T.; Le, N.N.; Nguyen, T.T.T.; Dao, T.H.; Vu, T.T.P.; Pham, T.D.; Takeuchi, W. Comparison of machine learning methods for estimating mangrove above-ground biomass using multiple source remote sensing data in the Red River Delta Biosphere Reserve, Vietnam. Remote Sens. 2020, 12, 1334. [Google Scholar] [CrossRef] [Scilit]
- Castillo, J.A.A.; Apan, A.A.; Maraseni, T.N.; Salmo, S.G. Estimation and mapping of above-ground biomass of mangrove forests and their replacement land uses in the Philippines using Sentinel imagery. ISPRS J. Photogramm. Remote Sens. 2017, 134, 70–85. [Google Scholar] [CrossRef] [Scilit]
- Kuenzer, C.; Bluemel, A.; Gebhardt, S.; Quoc, T.V.; Dech, S. Remote sensing of mangrove ecosystems: A review. Remote Sens. 2011, 3, 878–928. [Google Scholar] [CrossRef] [Scilit]
- Salum, R.B.; Souza-Filho, P.W.M.; Simard, M.; Silva, C.A.; Fernandes, M.E.B.; Cougo, M.F.; Do Nascimento, W.; Rogers, K. Improving mangrove above-ground biomass estimates using LiDAR. Estuar. Coast. Shelf Sci. 2020, 236, 106585. [Google Scholar] [CrossRef] [Scilit]
- Pham, T.D.; Yokoya, N.; Bui, D.T.; Yoshino, K.; Friess, D.A. Remote sensing approaches for monitoring mangrove species, structure, and biomass: Opportunities and challenges. Remote Sens. 2019, 11, 230. [Google Scholar] [CrossRef] [Scilit]
- Komiyama, A.; Ong, J.E.; Poungparn, S. Allometry, biomass, and productivity of mangrove forests: A review. Aquat. Bot. 2008, 89, 128–137. [Google Scholar] [CrossRef] [Scilit]
- Wang, D.; Wan, B.; Liu, J.; Su, Y.; Guo, Q.; Qiu, P.; Wu, X. Estimating aboveground biomass of the mangrove forests on northeast Hainan Island in China using an upscaling method from field plots, UAV-LiDAR data and Sentinel-2 imagery. Int. J. Appl. Earth Obs. Geoinf. 2020, 85, 101986. [Google Scholar] [CrossRef] [Scilit]
- Shi, Y.L.; Wang, Z.H.; Li, S.M.; Li, C.Y.; Xiao, P.Q.; Zhang, P.; Chang, X.G. Aboveground biomass inversion of sparse trees and shrubs based on optical remote sensing. Sci. Silvae Sin. 2022, 58, 13–22. (In Chinese) [Google Scholar]
- Wang, L.; Shi, C.; Tian, J.Y.; Song, X.N.; Jia, M.M.; Li, X.J.; Liu, X.M.; Zhong, R.F.; Yin, D.M.; Yang, S.S.; et al. Mangrove monitoring based on multisource remote sensing. Biodivers. Sci. 2018, 26, 838–849. (In Chinese) [Google Scholar] [CrossRef] [Scilit]
- Jayathunga, S.; Owari, T.; Tsuyuki, S. The use of fixed-wing UAV photogrammetry with LiDAR DTM to estimate merchantable volume and carbon stock in living biomass over a mixed conifer–broadleaf forest. Int. J. Appl. Earth Obs. Geoinf. 2018, 73, 767–777. [Google Scholar] [CrossRef] [Scilit]
- Lassalle, G.; Ferreira, M.P.; La Rosa, L.E.C.; Scafutto, R.; de Souza Filho, C.R. Advances in multi- and hyperspectral remote sensing of mangrove species: A synthesis and study case on airborne and multisource spaceborne imagery. ISPRS J. Photogramm. Remote Sens. 2023, 195, 298–312. [Google Scholar] [CrossRef] [Scilit]
- Xu, W.; Ouyang, X.; Xiao, X.; Hong, Y.; Zhang, Y.; Xu, Z.; Kwon, B.-O.; Yang, Z. A Review of Applying Drones and Remote Sensing Technology in Mangrove Ecology. Forests 2025, 16, 870. [Google Scholar] [CrossRef] [Scilit]
- Niu, X.; Chen, B.; Sun, W.; Feng, T.; Yang, X.; Liu, Y.; Liu, W.; Fu, B. Estimation of Coastal Wetland Vegetation Aboveground Biomass by Integrating UAV and Satellite Remote Sensing Data. Remote Sens. 2024, 16, 2760. [Google Scholar] [CrossRef] [Scilit]
- Navarro, A.; Young, M.; Allan, B.; Carnell, P.; Macreadie, P.; Ierodiaconou, D. The application of Unmanned Aerial Vehicles (UAVs) to estimate above-ground biomass of mangrove ecosystems. Remote Sens. Environ. 2020, 242, 111747. [Google Scholar] [CrossRef] [Scilit]
- Jiang, R.J.; Cheng, P.; Gao, J.H.; Wang, A.J. Effects of mangroves on the hydrodynamic processes of the tidal bottom boundary layer. Mar. Geol. Front. 2020, 36, 37–44. (In Chinese) [Google Scholar]
- Cao, J.; Liu, K.; Zhuo, L.; Liu, L.; Zhu, Y.; Peng, L. High-Resolution Mapping of Mangrove Species Height in Fujian Zhangjiangkou National Mangrove Nature Reserve Combined GF-2, GF-3, and UAV-LiDAR. Remote Sens. 2023, 15, 5645. [Google Scholar] [CrossRef] [Scilit]
- Gorelick, N.; Hancher, M.; Dixon, M.; Ilyushchenko, S.; Thau, D.; Moore, R. Google Earth Engine: Planetary-scale geospatial analysis for everyone. Remote Sens. Environ. 2017, 202, 18–27. [Google Scholar] [CrossRef] [Scilit]
- Jia, M.M. Spatial Distribution Dataset of Mangrove Species in China; International Research Center of Big Data for Sustainable Development Goals: Beijing, China, 2024. [Google Scholar]
- Tam, N.F.Y.; Wong, Y.S.; Lan, C.Y.; Chen, G.Z. Community structure and standing crop biomass of a mangrove forest in Futian Nature Reserve, Shenzhen, China. Hydrobiologia 1995, 295, 193–201. [Google Scholar] [CrossRef] [Scilit]
- Jin, C.; Wang, J.W.; Zheng, J.; Chen, Q.X.; Li, J.Q.; Lu, X. An assessment method of Kandelia obovata population biomass. Acta Ecol. Sin. 2012, 32, 3414–3422. (In Chinese) [Google Scholar] [CrossRef] [Scilit]
- He, Q.F.; Zheng, W.; Huang, X.R.; Liu, X.; Shen, W.H.; He, F. Carbon storage and allocation characteristics of mangroves in Qinzhou Bay, Guangxi. J. Cent. South Univ. For. Technol. 2017, 37, 121–126. (In Chinese) [Google Scholar]
- Wang, G.; Zhang, Q.P.; Guan, D.S. Distribution characteristics of biomass of plants in mangrove forest along latitude. Wetl. Sci. 2016, 14, 259–270. (In Chinese) [Google Scholar] [CrossRef]
- Otero, V.; Van De Kerchove, R.; Satyanarayana, B.; Martínez-Espinosa, C.; Fisol, M.A.B.; Ibrahim, M.R.B.; Sulong, I.; Mohd-Lokman, H.; Lucas, R.; Dahdouh-Guebas, F. Managing mangrove forests from the sky: Forest inventory using field data and unmanned aerial vehicle (UAV) imagery in the Matang Mangrove Forest Reserve, peninsular Malaysia. For. Ecol. Manag. 2018, 411, 35–45. [Google Scholar] [CrossRef] [Scilit]
- Wang, T.; Zhang, C.; Zhou, H. Estimation of aboveground biomass of major coniferous forests in Qujing City based on Landsat imagery. J. Zhejiang A&F Univ. 2025, 42, 1132–1141. (In Chinese) [Google Scholar]
- Dormann, C.F.; Elith, J.; Bacher, S.; Buchmann, C.; Carl, G.; Carré, G.; Marquéz, J.R.G.; Gruber, B.; Lafourcade, B.; Leitão, P.J.; et al. Collinearity: A review of methods to deal with it and a simulation study evaluating their performance. Ecography 2013, 36, 27–46. [Google Scholar] [CrossRef] [Scilit]
- Breiman, L. Random Forests. Mach. Learn. 2001, 45, 5–32. [Google Scholar] [CrossRef] [Scilit]
- Guyon, I.; Weston, J.; Barnhill, S.; Vapnik, V. Gene selection for cancer classification using support vector machines. Mach. Learn. 2002, 46, 389–422. [Google Scholar] [CrossRef] [Scilit]
- Chen, T.; Guestrin, C. XGBoost: A scalable tree boosting system. In Proceedings of the 22nd ACM SIGKDD International Conference on Knowledge Discovery and Data Mining; Association for Computing Machinery: New York, NY, USA, 2016; pp. 785–794. [Google Scholar]
- Prokhorenkova, L.; Gusev, G.; Vorobev, A.; Dorogush, A.V.; Gulin, A. CatBoost: Unbiased boosting with categorical features. In Advances in Neural Information Processing Systems 31 (NeurIPS 2018); HSE University: Moscow, Russia, 2018. [Google Scholar]
- Zhang, D.S.; Cong, L.X.; Quan, B.; Wang, Z.Q.; Wang, F. Remote sensing information extraction of Zhangjiangkou mangrove wetlands based on spectral characteristics. In Proceedings of the 2011 AASRI Conference on Artificial Intelligence and Industry Application (AASRI-AIIA 2011 V2); American Applied Sciences Research Institute: Wuhan, China, 2011; pp. 232–235. (In Chinese) [Google Scholar]
- Guo, X.; Wang, M.; Jia, M.; Wang, W. Estimating mangrove leaf area index based on red-edge vegetation indices: A comparison among UAV, WorldView-2 and Sentinel-2 imagery. Int. J. Appl. Earth Obs. Geoinf. 2021, 103, 102493. [Google Scholar] [CrossRef] [Scilit]
- Wen, X.; Liu, K.; Cao, J.; Zhu, Y.; Wang, Z. Estimation of Mangrove Aboveground Biomass in China Using Forest Canopy Height through an Allometric Equation. Trop. Geogr. 2023, 43, 1–11. [Google Scholar]








| Parameter | Specification |
|---|---|
| Positioning system | GNSS + RTK |
| RTK positioning accuracy | Horizontal: ±1 cm + 1 ppm; Vertical: ±1.5 cm + 1 ppm |
| Number of cameras | One RGB camera and five multispectral cameras |
| Camera specifications | RGB: 1/2.3-inch CMOS, 20 MP |
| Multispectral: 1/2.9-inch CMOS, 5 × 2 MP | |
| Spectral bands (center wavelength) | Blue (450 nm), Green (560 nm), Red (650 nm), Red-edge (730 nm), Near-infrared (840 nm) |
| Spectral bandwidth | Approximately 16–32 nm |
| Parameter | Specification | |
|---|---|---|
| DJI Matrice 300 RTK (DJI, Shenzhen, China) | Positioning system | GNSS + RTK |
| Absolute positioning accuracy | Horizontal: ±5 cm; Vertical: ±5 cm | |
| Zenmuse L1 (DJI, Shenzhen, China) | Laser wavelength | 905 nm |
| Maximum detection range | 450 m | |
| Point cloud ranging accuracy | ±3 cm | |
| Echo mode | Multiple returns | |
| Pulse repetition frequency | 160 kHz |
| Species | Allometric Equation | Region | Reference | Selected |
|---|---|---|---|---|
| Kandelia obovata | Futian, Guangdong | [28] | √ | |
| Cangnan, Zhejiang | [29] | |||
| Qinzhou Bay, Guangxi | [30] | |||
| Avicennia marina | Futian, Guangdong | [28] | √ | |
| Qinzhou Bay, Guangxi | [30] | |||
| Aegiceras corniculatum | Futian, Guangdong | [28] | √ | |
| Qinzhou Bay, Guangxi | [30] | |||
| General Equation | China | [31] |
| Feature Category | Feature Parameter | Variable Name | Formula | Description |
|---|---|---|---|---|
| Spectral Features | Mean | spec_mean | Represents the overall reflectance level | |
| Standard deviation | spec_std | Reflects spectral variability | ||
| Minimum | spec_min | Represents the lowest reflectance level | ||
| Maximum | spec_max | Represents the highest reflectance level | ||
| NIR/R ratio | spec_NIR_R | Characterizes the difference between chlorophyll absorption and near-infrared scattering | ||
| NIR/RE ratio | spec_NIR_RE | Characterizes differences in chlorophyll content and canopy structure | ||
| RE/R ratio | spec_RE_R | Enhances red-edge physiological responses | ||
| NDVI | idx_NDVI | Indicates vegetation growth and canopy greenness | ||
| GNDVI | idx_GNDVI | More sensitive to chlorophyll content | ||
| NDRE | idx_NDRE | Characterizes chlorophyll content and medium-to-high LAI variation | ||
| Chlorophyll Index Red Edge | idx_CI_RE | Indicates chlorophyll levels in dense vegetation | ||
| Ratio Vegetation Index | idx_RVI | Reflects vegetation cover conditions | ||
| Soil-Adjusted Vegetation Index | idx_SAVI | Reduces soil background effects | ||
| Two-Band Enhanced Vegetation Index | idx_EVI2 | Enhances response in dense vegetation | ||
| Spectral Features | Normalized Green–Red Difference Index | idx_NGRDI | Indicates canopy greenness | |
| Visible Atmospherically Resistant Index | idx_VARI | Provides partial resistance to atmospheric effects | ||
| Excess Green Index | idx_ExG | Highlights green vegetation components | ||
| Global Vegetation Moisture Index | idx_GVMI | Indicates vegetation water content | ||
| Intensity Features | Mean | int_mean | Represents overall return intensity | |
| Standard deviation | int_std | Reflects intensity variability | ||
| Coefficient of variation | int_cv | Reflects relative intensity variation | ||
| Skewness | int_skewness | Indicates asymmetry of intensity distribution | ||
| Kurtosis | int_kurtosis | Indicates peakedness of intensity distribution | ||
| Percentile | int_p | Represents intensity distribution at different levels | ||
| Layered point density | int_D | Represents point density at different height layers | ||
| Texture Features | Mean | tex_mean | Reflects overall brightness level | |
| Standard deviation | tex_std | Reflects texture variability | ||
| Homogeneity | tex_hom | Indicates texture uniformity | ||
| Contrast | tex_con | Indicates texture contrast intensity | ||
| Dissimilarity | tex_dis | Indicates gray-level differences | ||
| Entropy | tex_ent | Reflects texture complexity | ||
| Texture Features | Angular Second Moment | tex_asm | Reflects texture regularity | |
| Correlation | tex_corr | Indicates correlation between neighboring pixels | ||
| Height Features | Mean height | h_mean | Represents average canopy height | |
| Standard deviation | h_std | Reflects height variability | ||
| Coefficient of variation | h_cv | Reflects relative height variation | ||
| Minimum height | h_min | Represents lower canopy or ground height | ||
| Maximum height | h_max | Represents upper canopy height | ||
| Interquartile range | h_iqr | Reflects median height variation | ||
| Skewness | h_skew | Indicates asymmetry of height distribution | ||
| Kurtosis | h_kurtosis | Indicates peakedness of height distribution | ||
| Percentile | h_p | Represents height distribution at different levels | ||
| Canopy cover | h_cover | Indicates coverage of middle and upper canopy layers | ||
| Canopy thickness | h_thickness_90_10 | Represents vertical canopy thickness | ||
| Mean canopy rugosity | h_rugosity_mean | Indicates canopy surface roughness |
| Feature Variable | Feature Name | Formula | Description and Rationale |
|---|---|---|---|
| B2 | Blue Band | — | Reflects variations in canopy pigments |
| B3 | Green Band | — | Represents the green reflectance peak of vegetation |
| B4 | Red Band | — | Strong chlorophyll absorption region |
| B5 | Red-Edge Band 1 | — | Sensitive to variations in chlorophyll content |
| B6 | Red-Edge Band 2 | — | Enhances discrimination of high-biomass vegetation |
| B7 | Red-Edge Band 3 | — | Provides additional information on canopy structural gradients |
| B8 | Near-Infrared (NIR) Band | — | Highly sensitive to canopy structure and internal leaf scattering |
| B8A | Narrow NIR Band | — | Improves sensitivity to chlorophyll and canopy variations |
| B11 | Shortwave Infrared Band 1 (SWIR1) | — | Sensitive to vegetation water content and soil moisture |
| B12 | Shortwave Infrared Band 2 (SWIR2) | — | Reflects differences in vegetation water status and tissue structure |
| NDVI | Normalized Difference Vegetation Index | Indicates vegetation cover and biomass variation | |
| SAVI | Soil-Adjusted Vegetation Index | Reduces the influence of soil and bare tidal-flat backgrounds | |
| EVI | Enhanced Vegetation Index | Reduces atmospheric and background effects | |
| GNDVI | Green Normalized Difference Vegetation Index | Sensitive to variations in chlorophyll content | |
| NDMI | Normalized Difference Moisture Index | Reflects vegetation moisture conditions | |
| MSI | Moisture Stress Index | Indicates vegetation water status | |
| NBR | Normalized Burn Ratio | Reflects vegetation structure and moisture variation | |
| MNDWI | Modified Normalized Difference Water Index | Reduces interference from intertidal water bodies | |
| RENDVI_B5_B4 | Red-Edge Normalized Difference Vegetation Index | Enhances sensitivity to chlorophyll variations | |
| Clre_B8_B5 | Red-Edge Chlorophyll Index | Improves discrimination in high-biomass areas | |
| Clre_B8A_B5 | Enhances the expression of red-edge information | ||
| NDRE_B8_B5 | Red-Edge Chlorophyll Index | Mitigates the saturation effect of NDVI | |
| NDRE_B8A_B5 | Suitable for dense vegetation and high-biomass areas |
| Model | Parameter Settings |
|---|---|
| RF | n_estimators = 500 |
| max_depth = None | |
| min_samples_leaf = 1 | |
| XGBoost | n_estimators = 500 |
| learning_rate = 0.05 | |
| max_depth = 6 | |
| subsample = 0.8 | |
| colsample_bytree = 0.8 | |
| CatBoost | iterations = 500 |
| learning_rate = 0.05 | |
| depth = 6 | |
| loss_function = RMSE |
| Feature Type | No. of AGB Features | Selected AGB Features | No. of BGB Features | Selected BGB Features |
|---|---|---|---|---|
| Spectral Features | 5 | spec_std_re, spec_max, idx_ExG, idx_GVMI, idx_RECI | 5 | spec_std_re, spec_max, idx_GVMI, idx_NGRDI, idx_RECI |
| Intensity Features | 3 | int_mean, int_std, int_Kurtosis_raw | 2 | int_std, int_Kurtosis_raw |
| Texture Features | 1 | tex_corr_dir2 | 2 | tex_con_dir4, tex_corr_dir2 |
| Height Features | 2 | h_mean, h_p10 | 2 | h_iqr, h_mean |
| Total | 11 | — | 11 | — |
| Model | R2 | RMSE (t·hm−2) | nRMSE | MAE (t·hm−2) |
|---|---|---|---|---|
| CatBoost | 0.67 | 19.34 | 0.15 | 14.80 |
| XGBoost | 0.69 | 18.55 | 0.14 | 14.48 |
| RF | 0.65 | 20.36 | 0.15 | 15.88 |
| Model | R2 | RMSE (t·hm−2) | nRMSE | MAE (t·hm−2) |
|---|---|---|---|---|
| CatBoost | 0.78 | 9.52 | 0.17 | 7.13 |
| XGBoost | 0.74 | 10.38 | 0.18 | 7.21 |
| RF | 0.76 | 10.01 | 0.18 | 8.16 |
| Biomass Type | Feature Name | Number |
|---|---|---|
| AGB | B2, B3, B5, B6, B8, B11, B12, SAVI, MNDWI, RENDVI_B5_B4, CIre_B8_B5, CIre_B8A_B5 | 12 |
| BGB | B2, B3, B5, B6, B11, B12, SAVI, MNDWI, RENDVI_B5_B4, CIre_B8_B5, CIre_B8A_B5 | 11 |
| Biomass Type | Model | R2 | RMSE (t·hm−2) | nRMSE | MAE (t·hm−2) |
|---|---|---|---|---|---|
| AGB | CatBoost | 0.63 | 11.07 | 0.08 | 8.37 |
| XGBoost | 0.64 | 10.86 | 0.08 | 8.11 | |
| RF | 0.63 | 11.07 | 0.08 | 8.35 | |
| BGB | CatBoost | 0.60 | 6.58 | 0.11 | 4.95 |
| XGBoost | 0.63 | 6.35 | 0.08 | 4.69 | |
| RF | 0.60 | 6.56 | 0.11 | 4.91 |
| Biomass Type | Model | R2 | RMSE(t·hm−2) | MAE(t·hm−2) |
|---|---|---|---|---|
| AGB | CatBoost | 0.21 | 30.15 | 23.13 |
| XGBoost | 0.14 | 29.06 | 24.53 | |
| RF | 0.24 | 29.02 | 24.49 | |
| BGB | CatBoost | 0.42 | 14.59 | 11.35 |
| XGBoost | 0.43 | 14.89 | 11.36 | |
| RF | 0.39 | 15.60 | 12.79 |
| Biomass Type | Extrapolation Scheme | Optimal Model | R2 | RMSE (t·hm−2) | MAE (t·hm−2) | Improvement |
|---|---|---|---|---|---|---|
| AGB | Direct Extrapolation | RF | 0.24 | 29.02 | 24.49 | 0.40 62.58% 66.88% |
| Bridge Extrapolation | XGBoost | 0.64 | 10.86 | 8.11 | ||
| BGB | Direct Extrapolation | XGBoost | 0.43 | 14.89 | 11.36 | 0.20 57.35% 58.71% |
| Bridge Extrapolation | XGBoost | 0.63 | 6.35 | 4.69 |
| City | Area (hm2) | Area Proportion (%) | Total AGB (t) | Mean AGB Density (t·hm−2) | Total BGB (t) | Mean BGB Density (t·hm−2) |
|---|---|---|---|---|---|---|
| Ningde | 31.07 | 5.75 | 3346.84 | 123.66 | 1417.76 | 55.43 |
| Fuzhou | 20.24 | 3.75 | 2113.01 | 112.13 | 972.91 | 59.97 |
| Putian | 21.61 | 4.00 | 2392.20 | 115.06 | 947.43 | 52.67 |
| Quanzhou | 158.48 | 29.34 | 16,615.89 | 124.26 | 7537.13 | 57.77 |
| Xiamen | 52.33 | 9.68 | 5359.17 | 111.26 | 2540.40 | 64.27 |
| Zhangzhou | 256.47 | 47.48 | 28,941.49 | 129.31 | 11,159.51 | 50.41 |
| The total AGB of mangrove: 58,768.6 t; The total BGB of mangroves: 24,575.14 t | ||||||
| City | Total Biomass (t) | Proportion of Total Biomass (%) | Mean Biomass Density (t·hm−2) | Maximum Biomass Density (t·hm−2) | Minimum Biomass Density (t·hm−2) |
|---|---|---|---|---|---|
| Ningde | 4764.59 | 5.72 | 171.08 | 211.74 | 127.89 |
| Fuzhou | 3085.93 | 3.70 | 191.10 | 207.89 | 133.58 |
| Putian | 3339.63 | 4.01 | 181.73 | 207.61 | 133.32 |
| Quanzhou | 24,153.02 | 28.98 | 182.03 | 210.14 | 133.18 |
| Xiamen | 7899.57 | 9.48 | 170.54 | 206.39 | 136.03 |
| Zhangzhou | 40,101.00 | 48.12 | 194.72 | 225.40 | 109.91 |
| The total biomass of mangroves in Fujian Province: 83,343.74 t | |||||
Disclaimer/Publisher’s Note: The statements, opinions and data contained in all publications are solely those of the individual author(s) and contributor(s) and not of MDPI and/or the editor(s). MDPI and/or the editor(s) disclaim responsibility for any injury to people or property resulting from any ideas, methods, instructions or products referred to in the content. |
© 2026 by the authors. Licensee MDPI, Basel, Switzerland. This article is an open access article distributed under the terms and conditions of the Creative Commons Attribution (CC BY) license.
Share and Cite
Chen, S.; He, X.; Zhang, Y.; Zhang, X.; Cai, Z.; Lai, R. Multiscale Estimation of Mangrove Biomass in Fujian Province Using UAV as a Bridging Scale. Remote Sens. 2026, 18, 2831. https://doi.org/10.3390/rs18162831
Chen S, He X, Zhang Y, Zhang X, Cai Z, Lai R. Multiscale Estimation of Mangrove Biomass in Fujian Province Using UAV as a Bridging Scale. Remote Sensing. 2026; 18(16):2831. https://doi.org/10.3390/rs18162831
Chicago/Turabian StyleChen, Shuwei, Xi He, Yingbin Zhang, Xinhuang Zhang, Zhichao Cai, and Riwen Lai. 2026. "Multiscale Estimation of Mangrove Biomass in Fujian Province Using UAV as a Bridging Scale" Remote Sensing 18, no. 16: 2831. https://doi.org/10.3390/rs18162831
APA StyleChen, S., He, X., Zhang, Y., Zhang, X., Cai, Z., & Lai, R. (2026). Multiscale Estimation of Mangrove Biomass in Fujian Province Using UAV as a Bridging Scale. Remote Sensing, 18(16), 2831. https://doi.org/10.3390/rs18162831