Article

Quantifying Lateral Fluvial Dynamics Using Sentinel-2: Monitoring Medium-Large Rivers in Italy

1
Italian Institute for Environmental Protection and Research (ISPRA), 00144 Rome, Italy
2
Regional Environmental Agency of Piedmont Region (ARPA Piemonte), 10135 Turin, Italy
3
Hydrodata S.p.a., 10123 Turin, Italy
*
Author to whom correspondence should be addressed.
Remote Sens. 2026, 18(16), 2792; https://doi.org/10.3390/rs18162792
Submission received: 15 May 2026 / Revised: 10 July 2026 / Accepted: 12 July 2026 / Published: 18 August 2026

Highlights

What are the main findings?
  • Novel, semi-automated workflow to quantify riverbank retreat rates and eroded lengths using Copernicus Sentinel-2 time-series data (2016–2024).
  • Suitable precision with a Mean Absolute Deviation of 2.64 m/year for the bank retreat rate measurement and strong validation (CCC = 0.92), enabling systematic monitoring of river networks (channel widths exceeding ~40 m).
What are the implications of the main findings?
  • Integration of discharge data and infrastructure cadasters to identify the most dynamic river reaches along the Sesia River in Piedmont, Italy, and study long-term evolutionary trajectories, including a 10-year morphological forecast.
  • Facilitates a paradigm shift for regional authorities from labor-intensive assessments to dynamic, cost-effective monitoring, aligning with Water Framework Directive and Floods Directive goals for risk mitigation and ecological restoration.

Abstract

Understanding river channel evolution is essential for effective management, as lateral erosion shapes riverbeds, floodplains, and riparian habitats. Despite advancements in remote sensing, translating these technologies into operational tools for institutional monitoring remains a challenge. This study introduces a semi-automated framework designed to bridge this gap by quantifying lateral mobility and bank retreat rates in high-energy, gravel-bed rivers. The methodology utilizes a Random Forest classifier applied to Copernicus Sentinel-2 time series (2016–2024) across five rivers in Piedmont (Italy). By detecting pixel-level class shifts between water, vegetation, and sediment, the procedure provides a proxy for lateral mobility. Validated against 120 km of manual delineations, the model achieved high spatial accuracy for both bank retreat rates and eroded bank lengths measurements (Mean Absolute Deviation of 2.64 m/yr and 4.34%, respectively). Integrating discharge data and the hydraulic infrastructure cadaster of the Sesia River, the proposed framework effectively detects reaches prone to significant geomorphic changes, isolates their underlying drivers, simulates 10-year evolutionary trajectories, and demonstrates strong predictive capabilities regarding future channel–infrastructure interactions. This study marks a shift from sporadic, labor-intensive assessments to a dynamic, systematic monitoring framework. Leveraging free satellite data, it provides competent authorities with an objective, cost-effective tool to prioritize interventions, supporting flood risk reduction and river restoration.

1. Introduction

Understanding the historical evolution of river systems is crucial for effective management, flood risk reduction, and the establishment of realistic restoration goals. As noted by [1], healthy riverscapes require sufficient space within their valley bottoms to sustain sediment and vegetation regimes appropriate to their specific river type. Within this space, alterations in channel boundaries are driven by hydromorphological processes operating across multiple scales - bank, reach, and floodplain - encompassing both vertical and horizontal adjustments [2]. Horizontal shifts result in lateral erosion, leading to bank retreat, significant land loss, and the progressive conversion of floodplains into active channels. Such phenomena are key drivers of the morphological evolution of riverbeds, floodplains, and riparian habitats; however, they may pose substantial hazards to anthropogenic infrastructure, including flood defense systems, which have historically constrained natural fluvial dynamics, triggering profound morphological transformations [3,4,5]. Consequently, quantifying lateral river mobility is essential for informed river management and hazard mitigation. Experimental evidence at both field and laboratory scales describes bank retreat as a complex, intermittent process, rarely captured by empirical hydraulic relations [6,7]. Remote sensing-based approaches, instead, have proven more reliable for describing retreat along medium-to-large channels [8,9,10,11] provided the availability of traditionally monitored data at an adequate frequency. However, measuring bank retreat (m/yr), which requires both manual interpretation and overlapping of multi-temporal aerial images or LiDAR-derived DTMs [12,13,14], is a labor-intensive process often constrained by low temporal resolution (decades), which limits the ability to adapt management strategies in response to real-time evolution [14,15].
Although erosion varies across several scales, i.e., “event-based”, “seasonal”, and “long-term” scales [9], current remote sensing studies focus primarily on decadal-scale averages and limited spatial cases due to the high costs of collection and interpretation [16,17,18,19,20,21,22]. In recent decades, advancements in remote sensing and cloud computing have begun to bridge these spatial and temporal monitoring gaps. The availability of high-resolution satellite imagery with frequent revisit times (e.g., Copernicus Sentinel and NASA Landsat) allows for near real-time observation of river behavior at unprecedented scales [23,24,25]. Studies demonstrate that automated classification of active channels can reliably capture sandbar migration, vegetation colonization, and post-flood recovery [26,27,28]. By aggregating weekly Copernicus Sentinel data, researchers can produce composite images to classify wet channels, sediment, and vegetation [29], supporting flood risk assessment and restoration monitoring [30,31]. However, a critical gap remains, as the literature on the automation of bank retreat assessment is sparse, and sophisticated algorithms are seldom integrated into the practical workflows of competent territorial authorities. This study seeks to bridge this gap by transitioning conventional river banklines delineation toward an automated framework, translating scientific progress into practical tools for institutional use-specifically to support the integrated implementation of the EU Water Framework Directive (2000/60/EC) and Floods Directive (2007/60/EC). In this study, we adopt the process-based Morphological Quality Index (MQI) assessment approach within the Italian hydromorphological assessment framework, named IDRAIM [14,32], which integrates geomorphological functionality, artificiality and long-term channel changes at the reach scale [33]. Within this framework, two primary metrics describe lateral erosion: (i) the spatial extent of eroding banks, expressed as the percentage of bank length undergoing retreat within a reach; and (ii) the bank retreat rate, expressed as the average annual rate of lateral displacement (m/yr). These metrics reflect distinct aspects of morphodynamic activity [34]. While the retreat rate serves as an index of local erosional intensity, the total length of eroded banks reflects broader planform activity, and the introduction of new sediment and vegetation into the system [35,36,37].
We applied a Sentinel-2 based classifier to a 2016–2024 time series covering five medium-large rivers in the Piedmont region (NW Italy). The term medium-large-sized rivers refer to river systems whose active channel width is resolvable at the spatial resolution of Sentinel-2 imagery (~10 m), rather than a fixed geomorphological or hydrological classification. By analyzing multi-temporal sequences and aggregating weekly images into annual composites, bank erosion has been detected through pixel-level class-membership shifts at the spatial resolution of Sentinel-2 (10 × 10 m). This study aims to: (i) semi-automatically measure both annual and decadal bank retreat rates and the percentage of eroded lengths at the river reach scale; (ii) identify reaches characterized by significant geomorphic changes and investigate driving factors, such as flood events, tributary contributions, or hydraulic defense structures; and (iii) evaluate the predictive potential of bank retreat rates to forecast future interactions (10-year horizon) between river trajectories and existing hydraulic infrastructures.

2. Study Area

The study area encompasses four tributaries of the Po River-Sesia, Dora Baltea, Tanaro, and Scrivia, as well as a section of the Po River itself. They are all in the Piedmont region of northwestern Italy. The selection of the rivers lengths was guided by three main criteria: (i) morphological representativeness: the watercourses exhibit a variety of channel configurations (e.g., braided, wandering, sinuous), which are typical of Italian plain and Piedmont rivers; (ii) hydrological regimes: the basins include both Alpine-glacial (e.g., Sesia, Dora Baltea) and Apennine (e.g., Scrivia, Tanaro) watercourses, allowing for a comparative analysis of their hydrological and morphological responses; (iii) active channel width consistently exceeding 40 m, a threshold considered suitable for analysis using satellite imagery [26,29]. As can be seen from Figure 1a, most of the analyzed river lengths lie within lowland physiographic zones: the Po Valley, which was formed by these rivers, plays a fundamental role in the history and economy of the Piedmont region due to the presence of significant industrial and agricultural centers and several administrative provinces. As a result, these rivers have undergone profound morphological modifications in the past, primarily due to anthropogenic interventions such as gravel mining, channelization, and the construction of dams and hydraulic infrastructure [5]. Among the selected rivers, the Sesia River serves as the main case study of our work due to its high morphological dynamics, typical of an Alpine glacier-fed gravel-bed river. The Sesia River basin (Figure 1b) has a total surface area of approximately 3075 km2, 45% of which falls in mountainous areas. The Sesia River and its tributaries, Mastallone, Sessera, and Cervo, have origins in the Monte Rosa orographic group in the Pennine Alps (Figure 1b), which is one of the highest massifs in the Italian Alps (hosting over 15 peaks above 4000 m, and reaching a maximum elevation of 4634 m at Punta Dufour). The Sesia River basin is characterized by a complex geodynamic evolution related to the convergence and collision between the European and African plates. The basin exhibits a marked lithological and structural heterogeneity, as it includes units derived from continental margins (Austroalpine and Southalpine domains), remnants of oceanic crust, and European basement units [38]. This variability exerts a first-order control on erosion processes, influencing both substrate resistance and the degree of fracturing, which in turn affect bank stability and retreat rates at the reach scale. In addition, major tectonic lineaments, such as the Canavese Line, represent zones of mechanical weakness characterized by highly deformed rocks that are more prone to erosion and channel adjustment. These structural discontinuities locally enhance lateral mobility and contribute to the spatial organization of erosion patterns along the river network. The present-day morphology of the basin is further conditioned by Quaternary glacial and post-glacial evolution, which has shaped valley geometry, sediment availability, and slope stability. Glacial carving and subsequent deglaciation phases have produced overdeepened valleys and abundant sediment sources that are continuously reworked by fluvial processes. Within this framework, channel dynamics are primarily expressed during high-magnitude hydrological events, when increased stream power drives bank erosion, channel widening, and planform adjustments. Therefore, the observed patterns of bank retreat result from the combined influence of geological structure, lithological controls, inherited geomorphological conditions, and ongoing hydromorphological processes.
In this study, the Sesia River length considered goes from Varallo Sesia to Vercelli, varying in the channel morphology from sinuous to wandering and sinuous with alternate bars configurations. This diversity reflects spatial variations in confinement, sediment availability, and flow regime, and makes the Sesia River case study particularly suitable for analyzing lateral channel dynamics under different morphodynamic conditions. A reach-scale analysis of the geomorphometric parameters for the river segments illustrated in Figure 1c, derived from multi-temporal imagery (2019, 2021, and 2024), is detailed in Table S4 of the Supplementary Material.

3. Methods

3.1. River Corridor Classification from Sentinel-2 Imagery

We used the semi-automatic classifier developed in the framework of the “IRIS-Italian Research and development Initiative for Spaceborne river monitoring” project [39], based on Sentinel-2 data, freely available from the European Copernicus Programme for Earth Observation every 5 days across the entire Italian territory. This semi-automatic classifier, applied to the river corridor, identifies and discriminates between spatial units with similar textural and spectral characteristics that are known to constitute key geomorphic macro-units as described in [40]: water, vegetation, and dry exposed sediment.

3.2. Model Calibration

The ground truth dataset used for the calibration and validation of our classification model consists of two distinct datasets: (i) the drone dataset generated from DJI Phantom 4 Pro drone acquisitions at eight sites (16 sample in different rivers stretches in Italy) for each of which two measurement campaigns were carried out between September 2017 and October 2018; and (ii) the Sentinel-2 dataset generated from a manual classification activity carried out by the operator (via photointerpretation) based on the information provided by the 10 m RGB image derived from bands 2, 3, and 4 of Sentinel-2, to delineate areas to which a single class can be attributed without interpretation doubts, therefore defined as “pure”. This dataset was created using Sentinel-2 images referring to the drone acquisition dates, for which the images are characterized by a low presence of clouds along the river corridor. An in-depth description of the ground truth dataset collected can be found in [29], and in the Supplementary Material of this study.
From such dataset, five different experiments were conducted by varying the proportions of drone-acquired and satellite-derived data within the calibration and validation subsets (Table S1 of the Supplementary Material). For our study, the model calibrated with 50% of the drone dataset and 95% of the RGB-Sentinel-2 dataset was implemented (composing the validation set with the remaining data). The classification algorithm used was of the Random Forest Classifier type and was trained, using the free machine learning libraries Scikit-learn (https://scikit-learn.org/stable/, accessed on 1 September 2019) in Python 2.7, with the following hyperparameter settings: n_estimators = 50; max_depth = None; min_samples_split = 10; and random_state = 0. The input of model calibration was composed of 10 bands (bands 2, 3, 4, 5, 6, 7, 8, 8A, 11, and 12) of Sentinel-2, resampled at 10 m resolution. The performance of the model, evaluated through a 5-fold cross-validation, is reported in the Supplementary Material (Table S1).

3.3. Model Application

The classifier was conceived to be applied to the river corridor extent, defined as the set of morphological units with a direct or frequent connection to natural fluvial processes, including the channel area, transition zone, and riparian zone [14,32]. The delineation of the river corridor for each case study was performed manually in a GIS environment (QGIS 3.40.4) through photointerpretation of high-resolution orthophotos (20 cm) from the AGEA 2021 flight (Italian Agricultural Payments Agency), supplemented with Google Earth satellite imagery. The resulting vector geometry was divided into morphologically homogeneous reaches which are the fundamental spatial units for hydromorphological analysis [14,33] Each reach was progressively numbered from upstream to downstream, assigning distinct codes to different rivers: Sesia (SE_01–SE_35), Po River (reaches PO_01–PO_44), Scrivia (SC_01–SC_17), Tanaro (TA_01–TA_27), Dora Baltea (DO_01–DO_11) for a total of 134 reaches. Finally, the vector polygon of each fluvial corridor was rasterized with a spatial resolution of 10 m, following Sentinel-2 tiles (namely, TLQ, TMR, TMQ) that cover the study area. Such data was used as a spatial mask to limit the application exclusively to areas relevant for fluvial processes. The classifier was applied to the Sentinel-2 Level 2A products from 2016–2024, pre-processed following Theia atmospheric correction (Maja algorithm [41]) and rejecting satellite images with a cloud cover higher than 90% over the tile. It resulted in a total of 2001 single date images categorized into the three macro-unit classes (e.g., water, sediment, and vegetation). From this dataset, composite images in which the pixels are flagged based on their monthly classification frequency were produced by temporally aggregating the Sentinel-2 classified images. The annual-scale aggregation was evaluated for each class as the average value of the monthly occurrence, so that all pixels classified as water, sediment, or vegetation range from at least once a year to those classified as such throughout all 12 months (frequency value equal to 1).

3.4. Lateral Erosion Assessment from Sentinel-2

3.4.1. Identification of the Yearly Active Channel

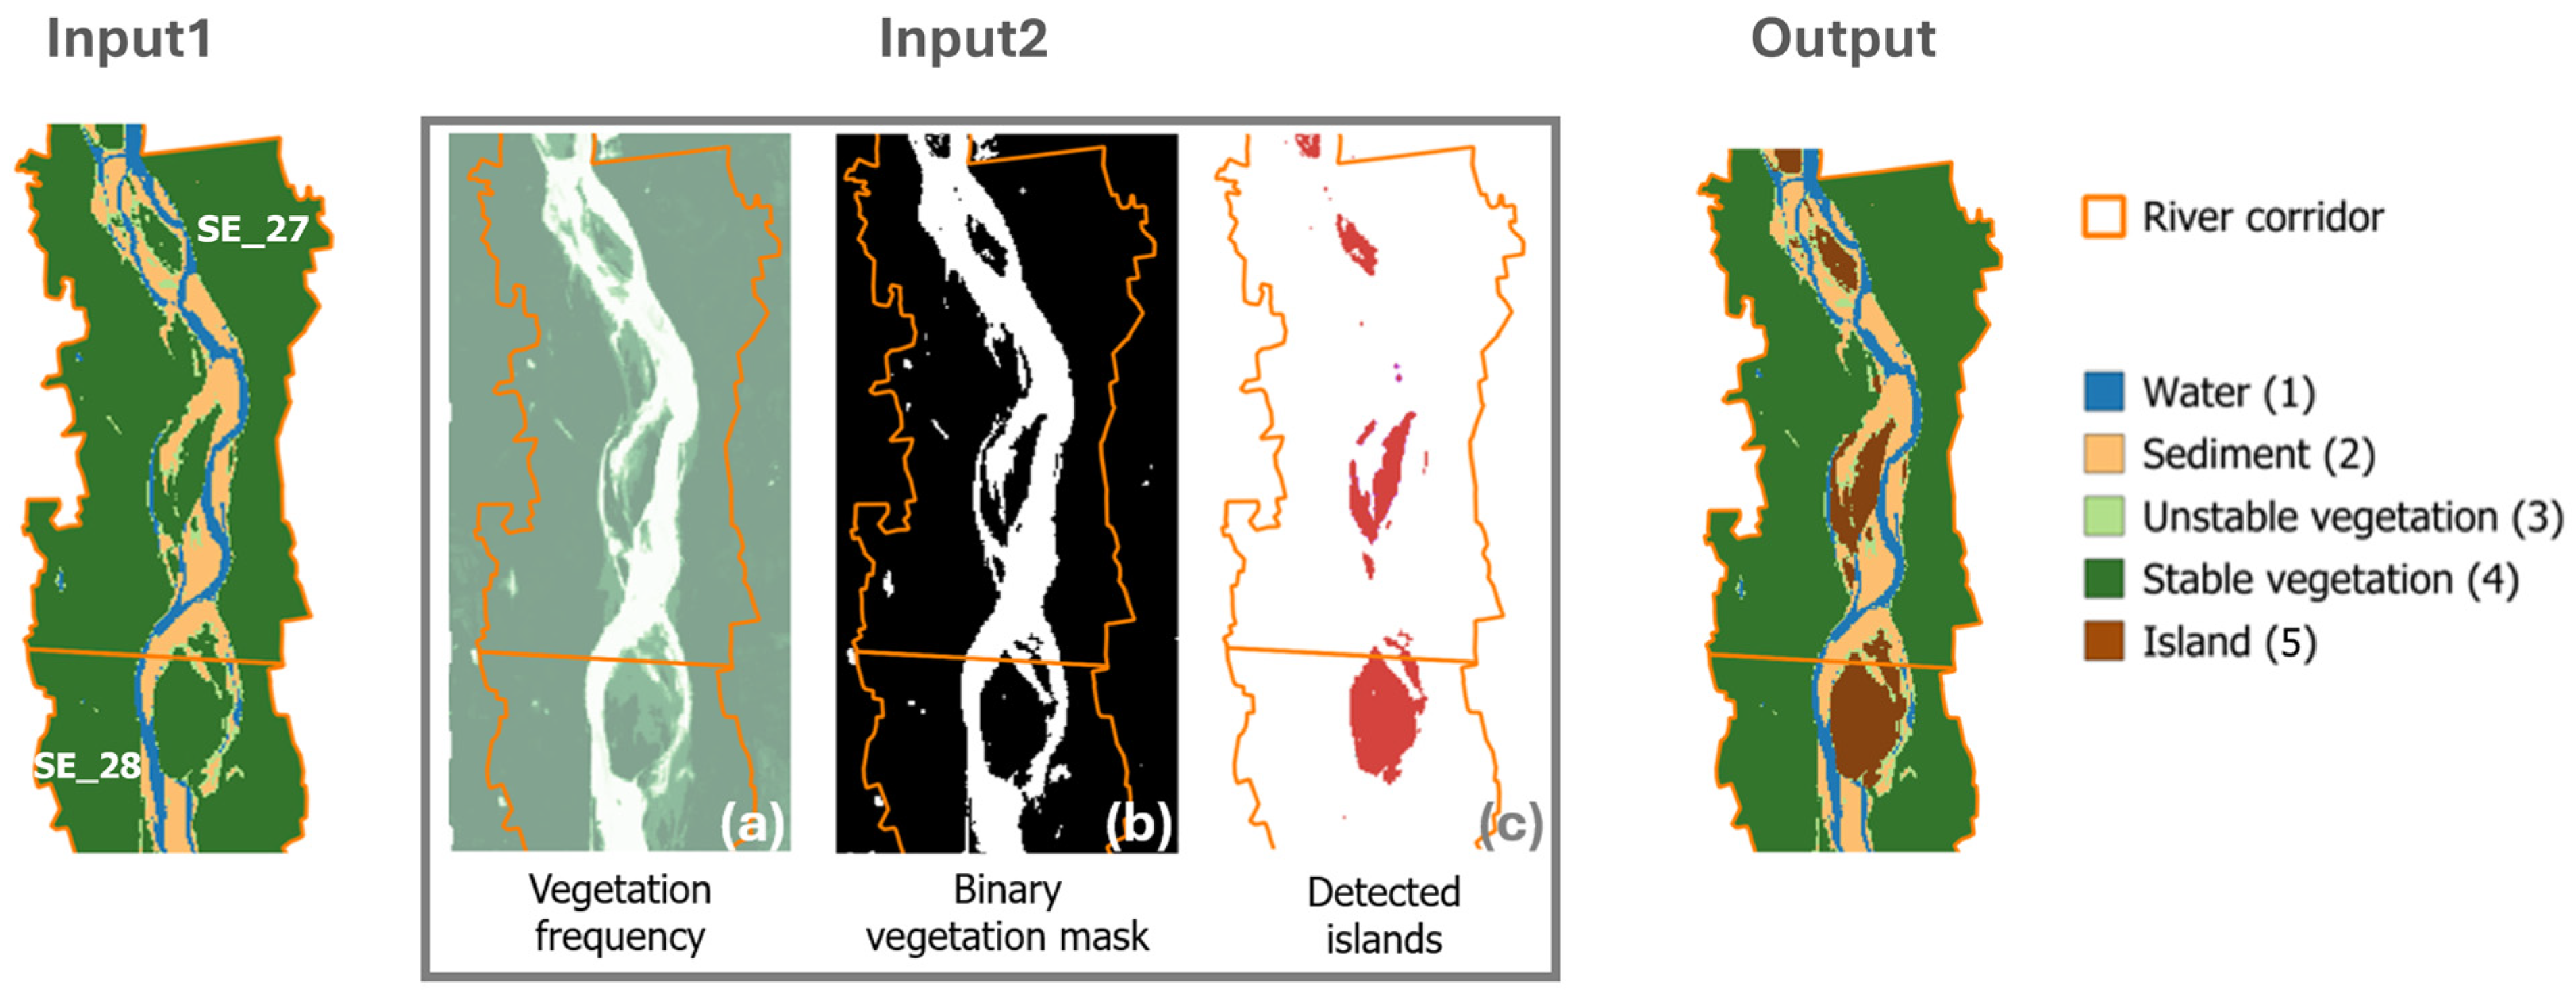
The first step in the procedure was devoted to identifying, within the river corridor, the yearly active channel from the Sentinel-2 yearly aggregation composite images, based on macro-unit monthly classification frequency. The active channel of a river is defined as the area occupied by low-flow channels and unvegetated or sparsely vegetated bars and islands where bed material load occurs and is the reference extent unit useful for estimating bank erosion rates [5,32,42]. In a remote sensing context, these elements correspond to areas classified as water and exposed sediment, which can be observed under varying hydrological conditions throughout the year. To derive a representative annual active channel from multi-temporal satellite imagery, a persistence-based approach was adopted, whereby pixels recurrently classified as water or sediment are interpreted as areas consistently involved in fluvial processes. In this framework, persistence is used as a proxy for geomorphological consistency, allowing for the exclusion of transient signals related to short-term hydrological fluctuations [43,44]. Frequency thresholds were therefore defined to balance the representation of persistent channel features and the inclusion of geomorphologically relevant but intermittently active areas. The results were validated against manually delineated active channels from high-resolution orthophotos (AGEA 2018 and 2021) and local knowledge of the river system acquired by ARPA Piemonte through IDRAIM monitoring. Higher thresholds emphasize highly persistent features associated with low-flow conditions (channel core), whereas lower thresholds progressively incorporate areas activated only under specific flow conditions. An intermediate threshold (frequency ≥ 0.5 for Water and Sediment classes) was selected as a compromise, capturing areas recurrently involved in fluvial processes while limiting the inclusion of ephemeral or noise-related features. Moreover, to discriminate between sparse, low-density vegetation and established riparian vegetation (mature trees/shrubs located on islands included), the frequency thresholds were identified as: <0.7 for “Non-Stable Vegetation”; ≥0.7 for “Stable Vegetation”. The resulting filtered rasters were thus composed of four bands, each corresponding to a specific class: Band 1: Water; Band 2: Sediment; Band 3: Non-Stable Vegetation; Band 4: Stable Vegetation. For the latter class, an additional processing step was implemented to distinguish stable vegetation on river islands from stable riparian vegetation (along the riverbanks). River islands were automatically detected on an annual basis through the workflow based on Python (v3.13.3), as detailed in Figure 2, where the annual active channel extent (Input 1), and the annual composite images of vegetation frequency (Figure 2a) were used as input. Within the latter layer, a threshold of ≥0.82 was applied to isolate highly persistent vegetation and generate a binary mask (Figure 2b). Islands were then identified as vegetated features surrounded by non-vegetated pixels and assigned a value of 5 (Figure 2c). This multi-step procedure produced as output the annual active channel rasters used for the yearly bank retreat analysis (Output).

3.4.2. Transect Based Measurement

To generate the validation dataset, we replicated the standard manual procedure for assessing riverbank retreat [14]. Following the production of the annual active channel rasters, the channel boundaries were digitized into vector polygons. Subsequently, river banklines were manually delineated for 21 cases (Table 1), which constitute approximately 20% of the total sample, across the five study rivers (Figure 1). This corresponds to an overall river length of approximately 120 km, encompassing various river morphological types: sinuous (S), sinuous with alternate bars (SBA), and wandering (W) reaches. The manual derivation of the banklines was performed for specific years exhibiting dynamic fluvial processes reported in Table 1.
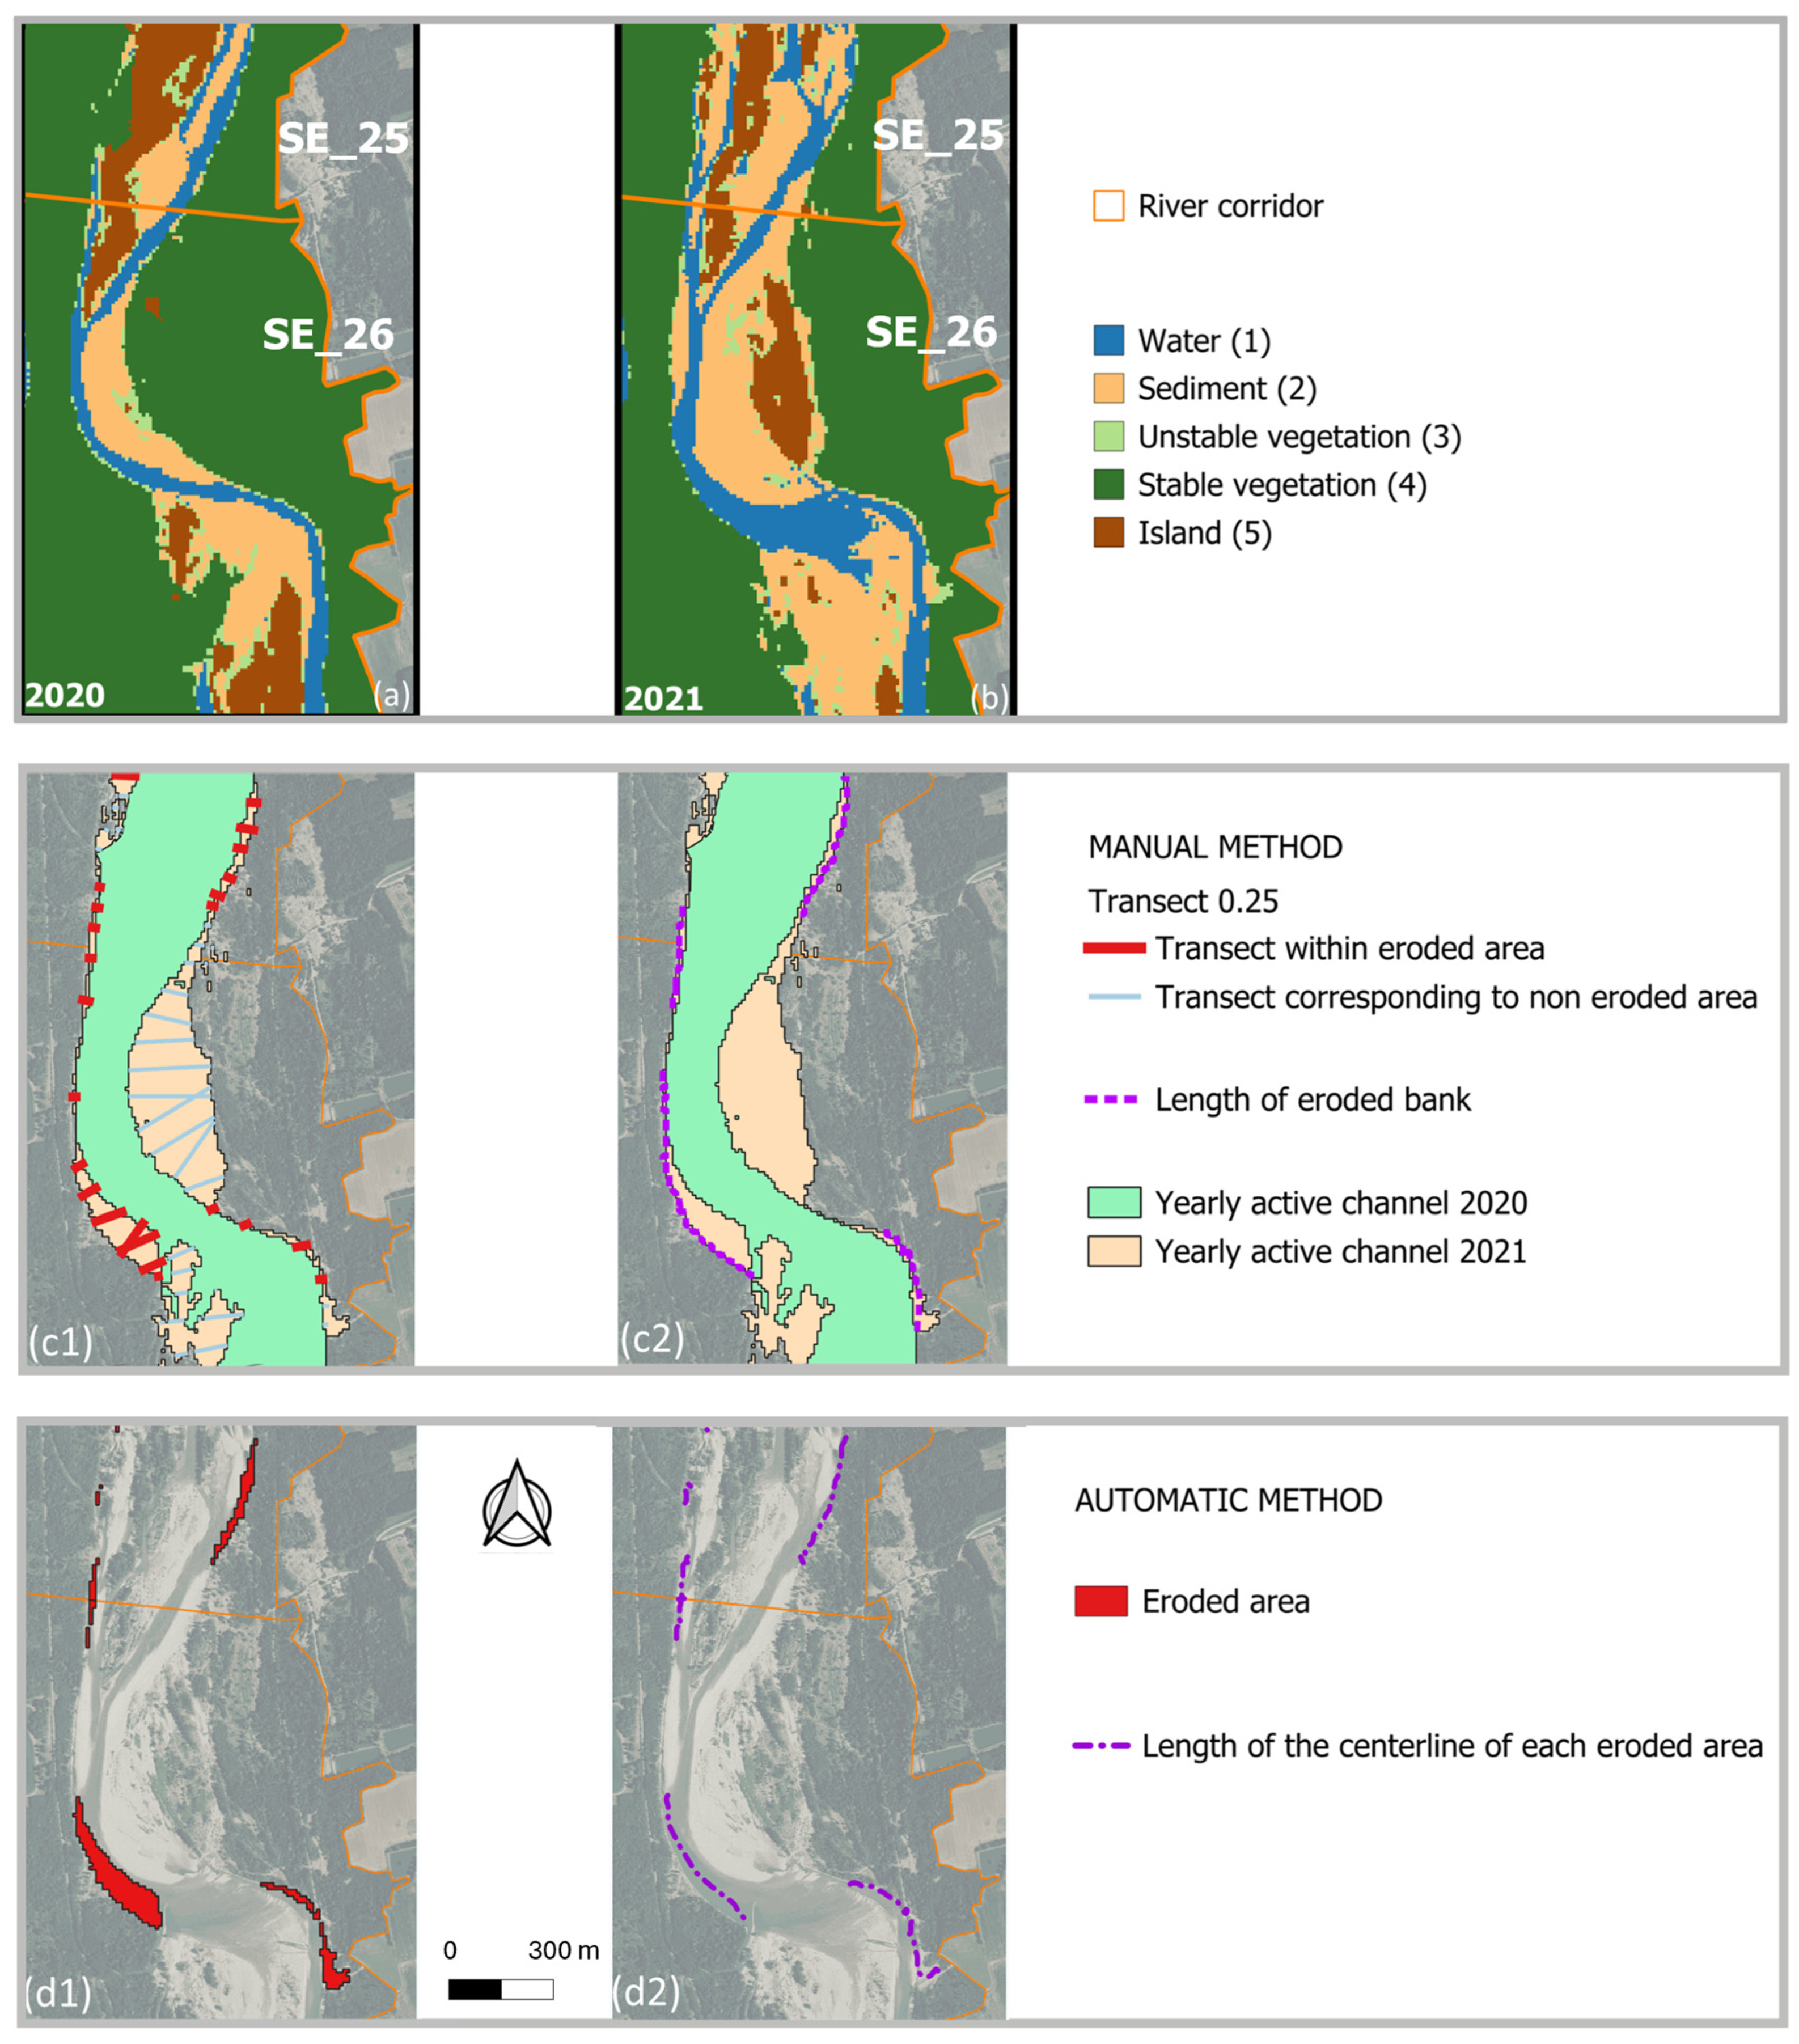
By comparing the most recent bank lines with those from the previous year, sections exhibiting clear evidence of erosion and lateral instability were identified using available auxiliary data, such as aerial photographs (AGEA, post-event imagery, and Google Earth). These portions were characterized by steep (often sub-vertical) escarpments with sparse or absent vegetation [14]. The transect method [14,15] was then employed to quantify the annual bank retreat rate. Transects were constructed perpendicular to the channel axis with a step size defined as 0.25, 0.5, or 1 time the reach-average channel width. These transects intersect the area defined by the geometric difference between the active channels of the two years under comparison (e.g., 2021 minus 2020). The total mean annual bank retreat rate (m/yr) for each river reach was calculated by the average of the lengths of transects located within erosion areas and corresponding to banklines classified as eroded. Additionally, the total length of eroded banks was obtained by summing the lengths of all identified eroded segments along both sides of the river (Figure 3c1,c2).

3.4.3. Automatic Pixels-Based Assessment

Annual bank retreat rates were semi-automatically quantified across the 134 river reaches of the five study rivers (Figure 1), in Python, by systematically comparing the raster of the yearly active channels (Output in Figure 2) of two consecutive years of the Sentinel-2 time series (2016–2024). The core logic involves detecting spatial transitions where a pixel classified as stable riparian vegetation (Class 4) in the reference year, shifts to water (Class 1), unstable vegetation (Class 3), or sediment (Class 2) in the subsequent year. This change is interpreted as a geomorphological indicator of lateral erosion signaling the loss of stable vegetation on the floodplain due to the lateral migration of the river active channel [45]. Here, to avoid overestimating erosion near islands and river bars, the classified dataset was first adjusted by reclassifying all cells of unstable vegetation and sediment (Classes 2 and 3) that in a year were adjacent to islands (Class 5) as belonging to island class membership. Moreover, only polygons with at least 20% of their perimeter in contact with stable vegetation cells (Class 4) were selected. The 20% threshold improves the agreement with manual measurements by removing spurious in-channel features and filtering out sediment bars not directly connected to bank erosion processes, resulting in more consistent estimates of both retreat rate and eroded length; the threshold was defined based on analyses performed against the manual dataset: the selected configuration provides the best compromise between inclusion of meaningful erosion signals and exclusion of noise. On this refined dataset, a binary raster was generated for each pair of consecutive years, assigning a value of 1 to pixels that changed from stable vegetation (Class 4) to water, sediment or unstable vegetation (Classes 1, 2, 3) in the subsequent year and converting the result into a vector layer of polygons, which represent the final vector of erosion polygons. Subsequently, the geometric analysis of each erosion polygon was conducted by extracting its median line using a skeletonization algorithm, the length of which was measured and then summed for each river reach.
For each reach, the retreat rate was calculated as the ratio between the sum of the retreating areas and the sum of the lengths of the corresponding centerlines. Moreover, the centerline of an eroded area was used to measure the length of the eroded bank at that location. By summing these lengths and expressing them as a percentage of the total bank length, the percentage of eroded banks within each homogeneous reach was obtained. Two measurements, relevant for lateral erosion assessment, were thus derived for each homogeneous reach: the yearly bank retreat rate and the lengths of eroded banks. In addition, to assess the temporal trend of the phenomenon, the average bank retreat rate over approximately one decade (from 2016 to 2024) was evaluated. The annual rates obtained for each reach were summed, and the result was divided by the total number of years analyzed (eight), thus yielding a medium-term average bank retreat rate specific to each river reach. Figure 3 summarizes the automatic and manual methodology for the reaches SE_25 and SE_26.
To assess the potential practical application of such procedure, the automatic methodology for riverbank retreat measurement was applied to 16 reaches of the Sesia River, accounting for a total length of 57 kilometers, from the confluence of the Mastallone Stream (SE_16) to the confluence of the Cervo stream (SE_31). This river stretch represents an excellent case study, as it encompasses three distinct physiographic units—mountainous, mountainous-hilly, and plain—and includes both confined and semi- to unconfined river sections, exhibiting a wide range of channel morphologies: sinuous (S), sinuous with alternating bars (SBA), wandering (W), braided (CI), and straight (R). Finally, to enable a more comprehensive analysis of the controlling factors that govern both the magnitude and variability of lateral erosion per river reach, the results obtained for the automatic bank retreat rate were integrated with additional morphological parameters such as the percentages of bank-proximal structures (levees or bank protections), the physiographic units, the main river confluences, and the riverbed typology.

3.4.4. Prediction of Lateral Channel Mobility

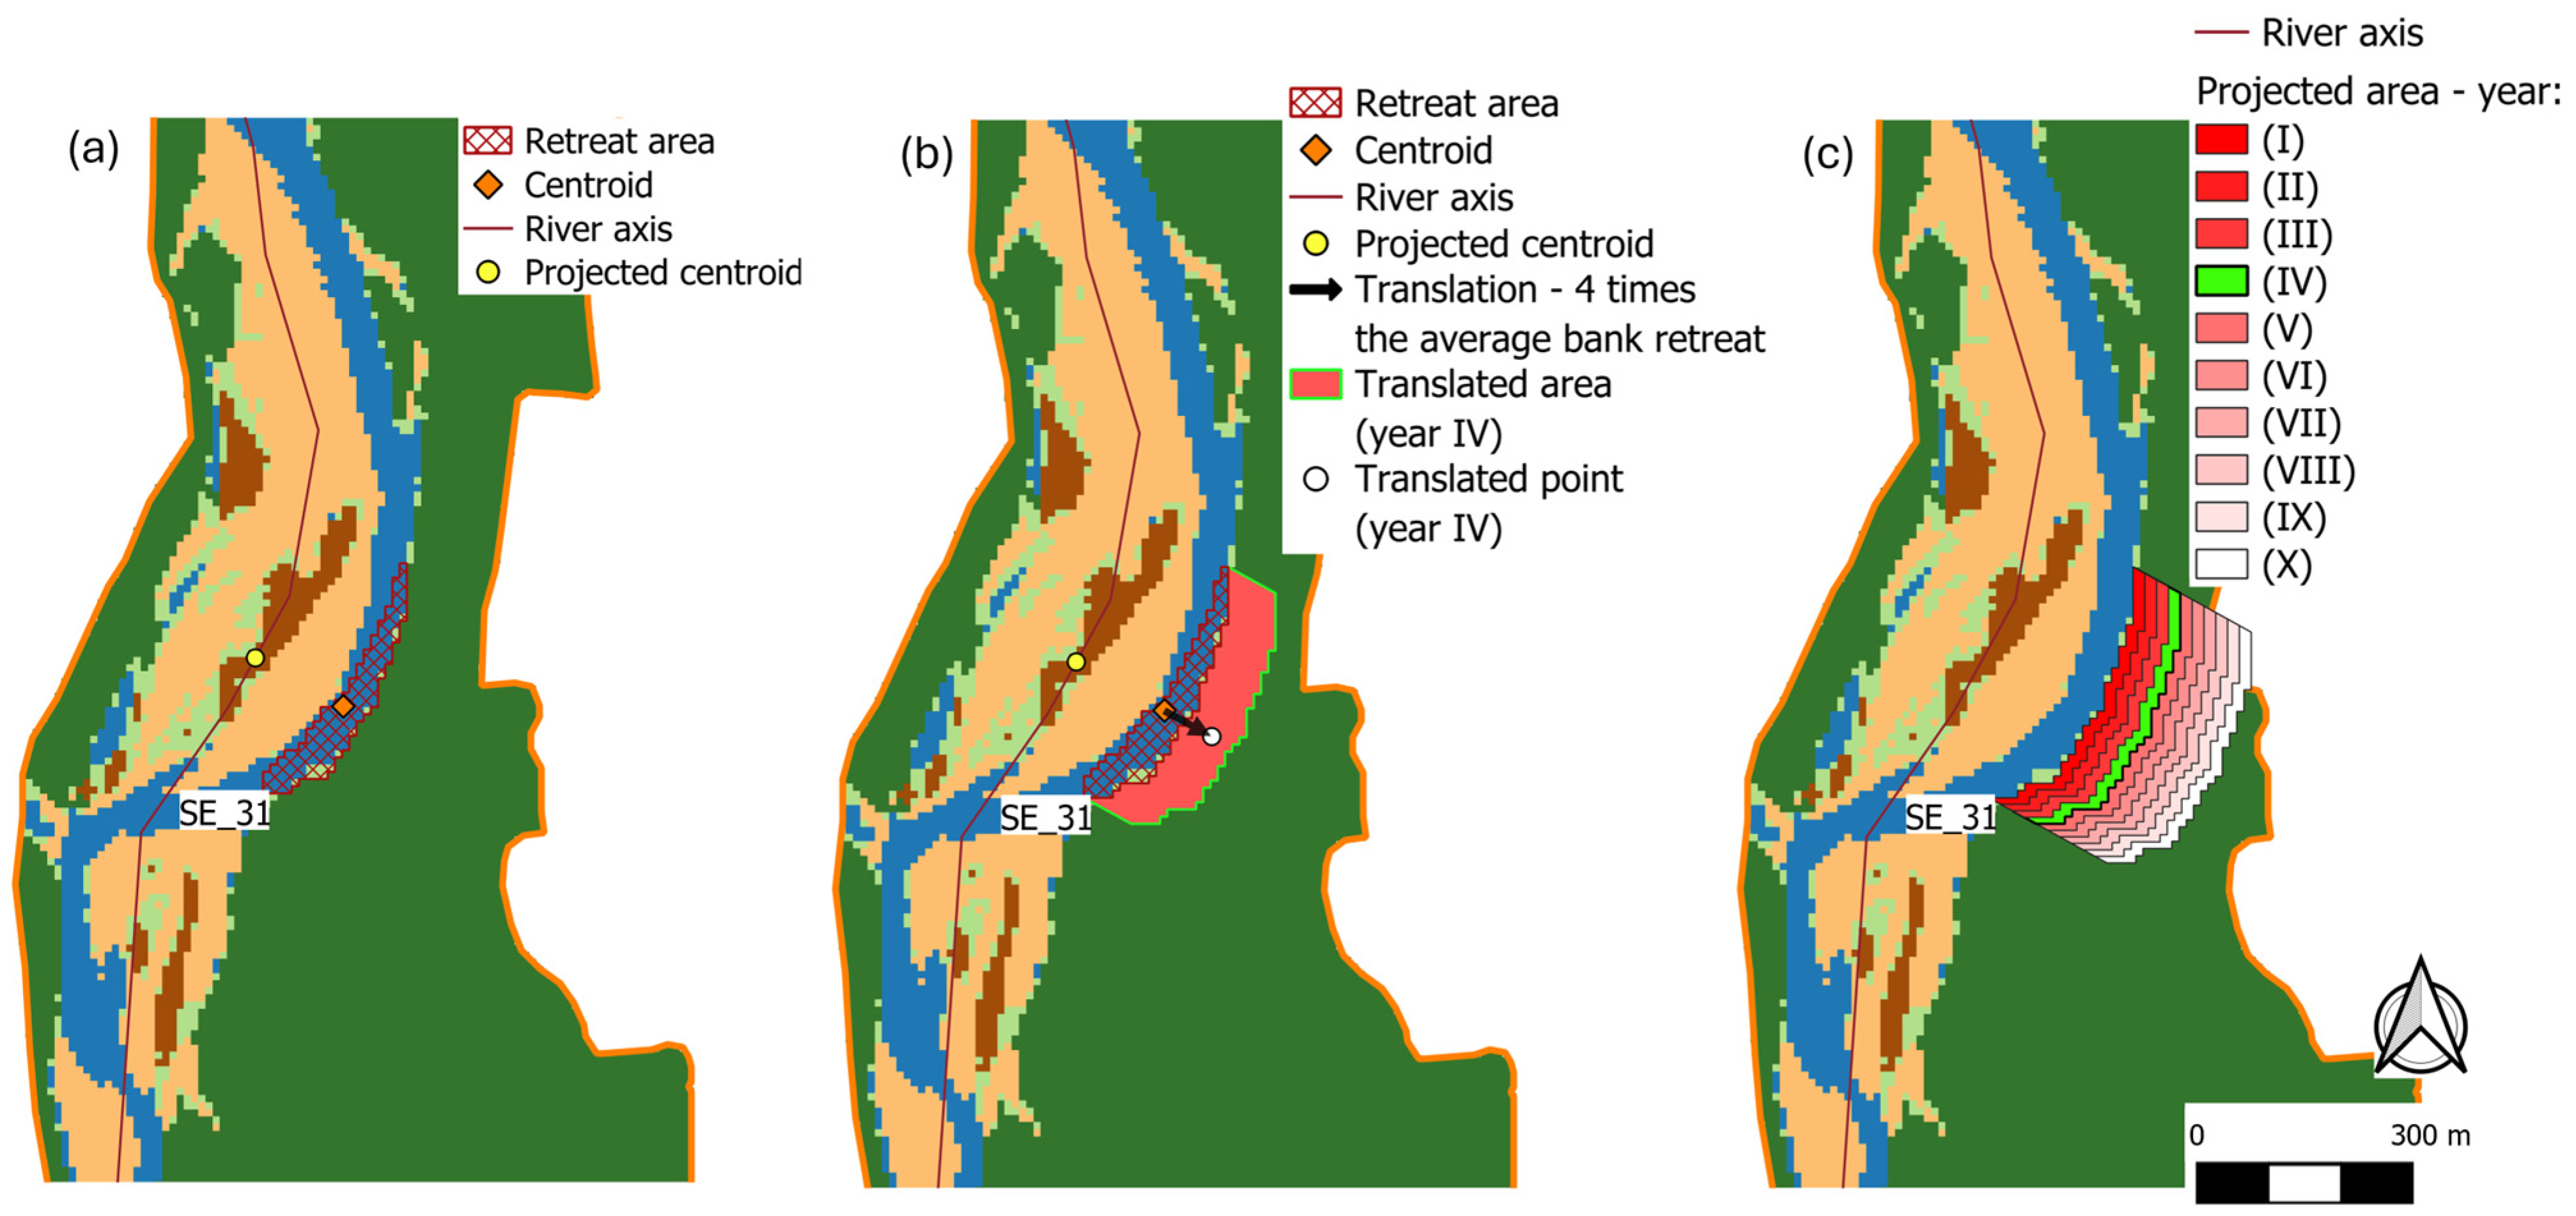
The automatic pixel-based bank retreat assessment was employed to test the prediction of lateral channel mobility along the Sesia River. The average rates computed for each reach between 2016 and 2024 served as the basis for a 10-year trend analysis. The starting point was set at 2021, immediately following the flood event that occurred in October 2020, to capture the post-event morphological trajectory. A geometric translation (Figure 4) was applied to each polygon identified as eroded area in 2020, following a direction perpendicular to the river axis (such an assumption is a simplification linked to geometric limitation, as stated in the discussion section of this paper). Specifically, the translation vector is defined by the segment connecting the polygon’s centroid to its orthogonal projection on the river axis. The vector originates at the centroid and points away from the axis, with a magnitude equal to the average bank retreat rate (calculated for the 2016–2024 period for each reach) scaled by a time-horizon coefficient (e.g., 1 for a 1-year projection and 10 for a 10-year projection). This procedure generated annual predictive polygons representing the potential erosion zone.
To evaluate the model’s reliability, the four-year forecast (2025) was validated against actual bank erosion triggered by a major flood on 17 April 2025. The observed erosion was manually delineated on 38 reaches within the lowland sections of the river significantly impacted by this event, using a combination of Copernicus imagery, Google Earth, and aerial images. By overlapping the predicted and observed geometries, we performed a comparative analysis of bank retreat rates and erosion lengths. This procedure allowed for a rigorous quantification of discrepancies and a qualitative assessment of the model’s predictive accuracy.

4. Results

4.1. Automatic Pixel-Based Assessment of Lateral Erosion from Sentinel-2

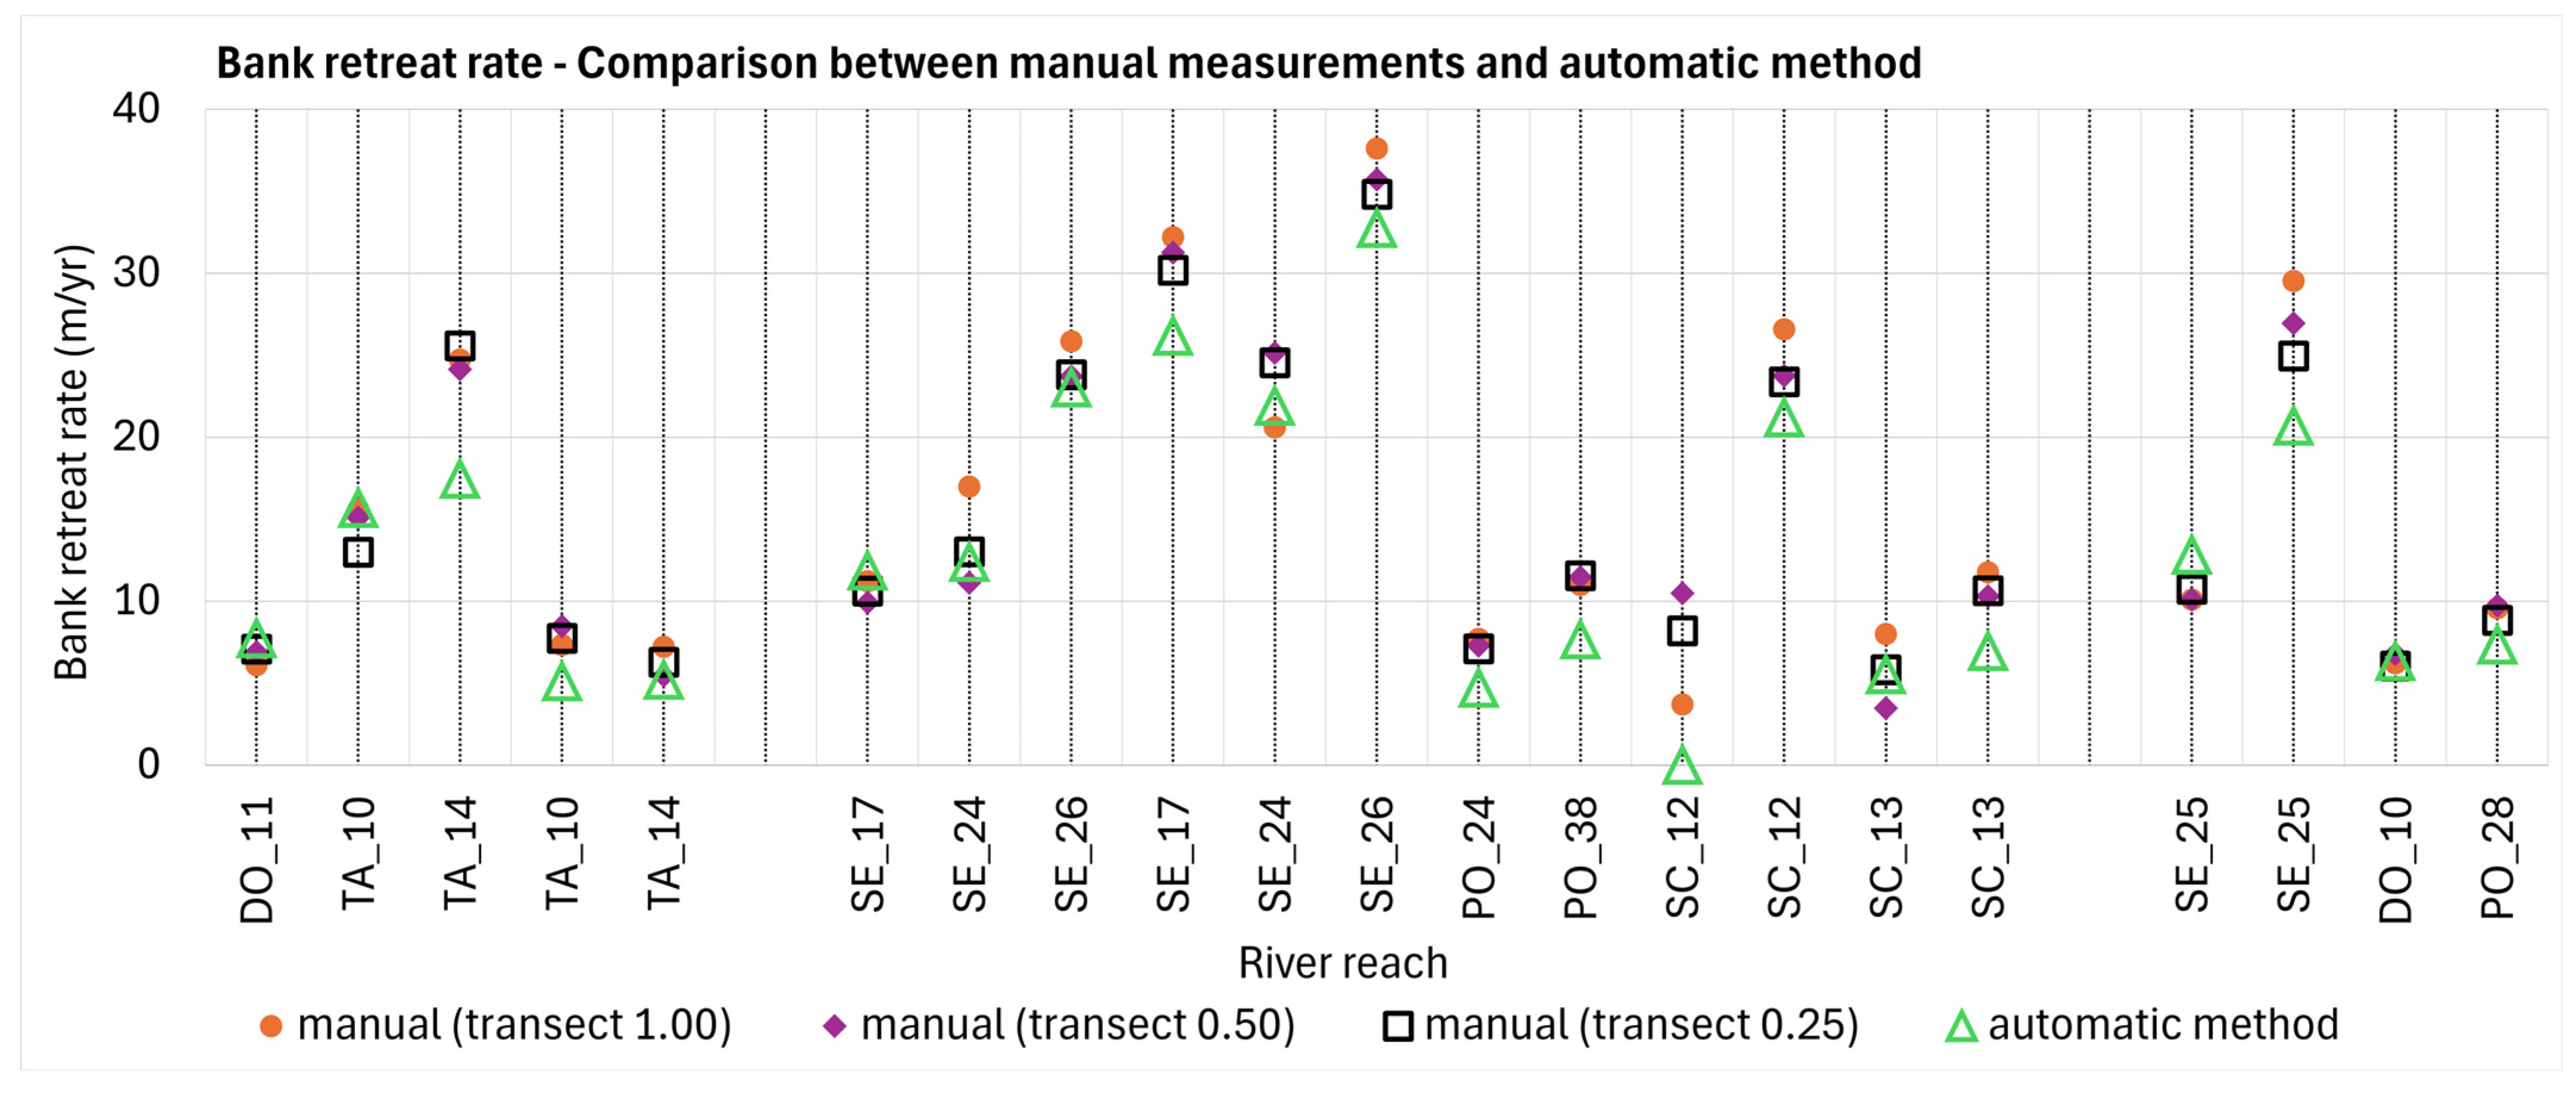
To assess the performance of the automatic procedure, the comparison with the manual procedure (Table 1) was carried out. Figure 5 illustrates the results yielded for the bank retreat rate by the two methodologies and their degree of agreement for each river’s reach.
The bank retreat rates (m/yr) derived from the Sentinel-2 based methodology show good consistency with the validation dataset across all analyzed river reaches. Overall, the errors of the methodology do not significantly change by using different step sizes in the transect method. Because we obtained better accuracy with step 0.25 in most cases (see also Table S3 in the Supplementary Material), we used such step size for our analysis.
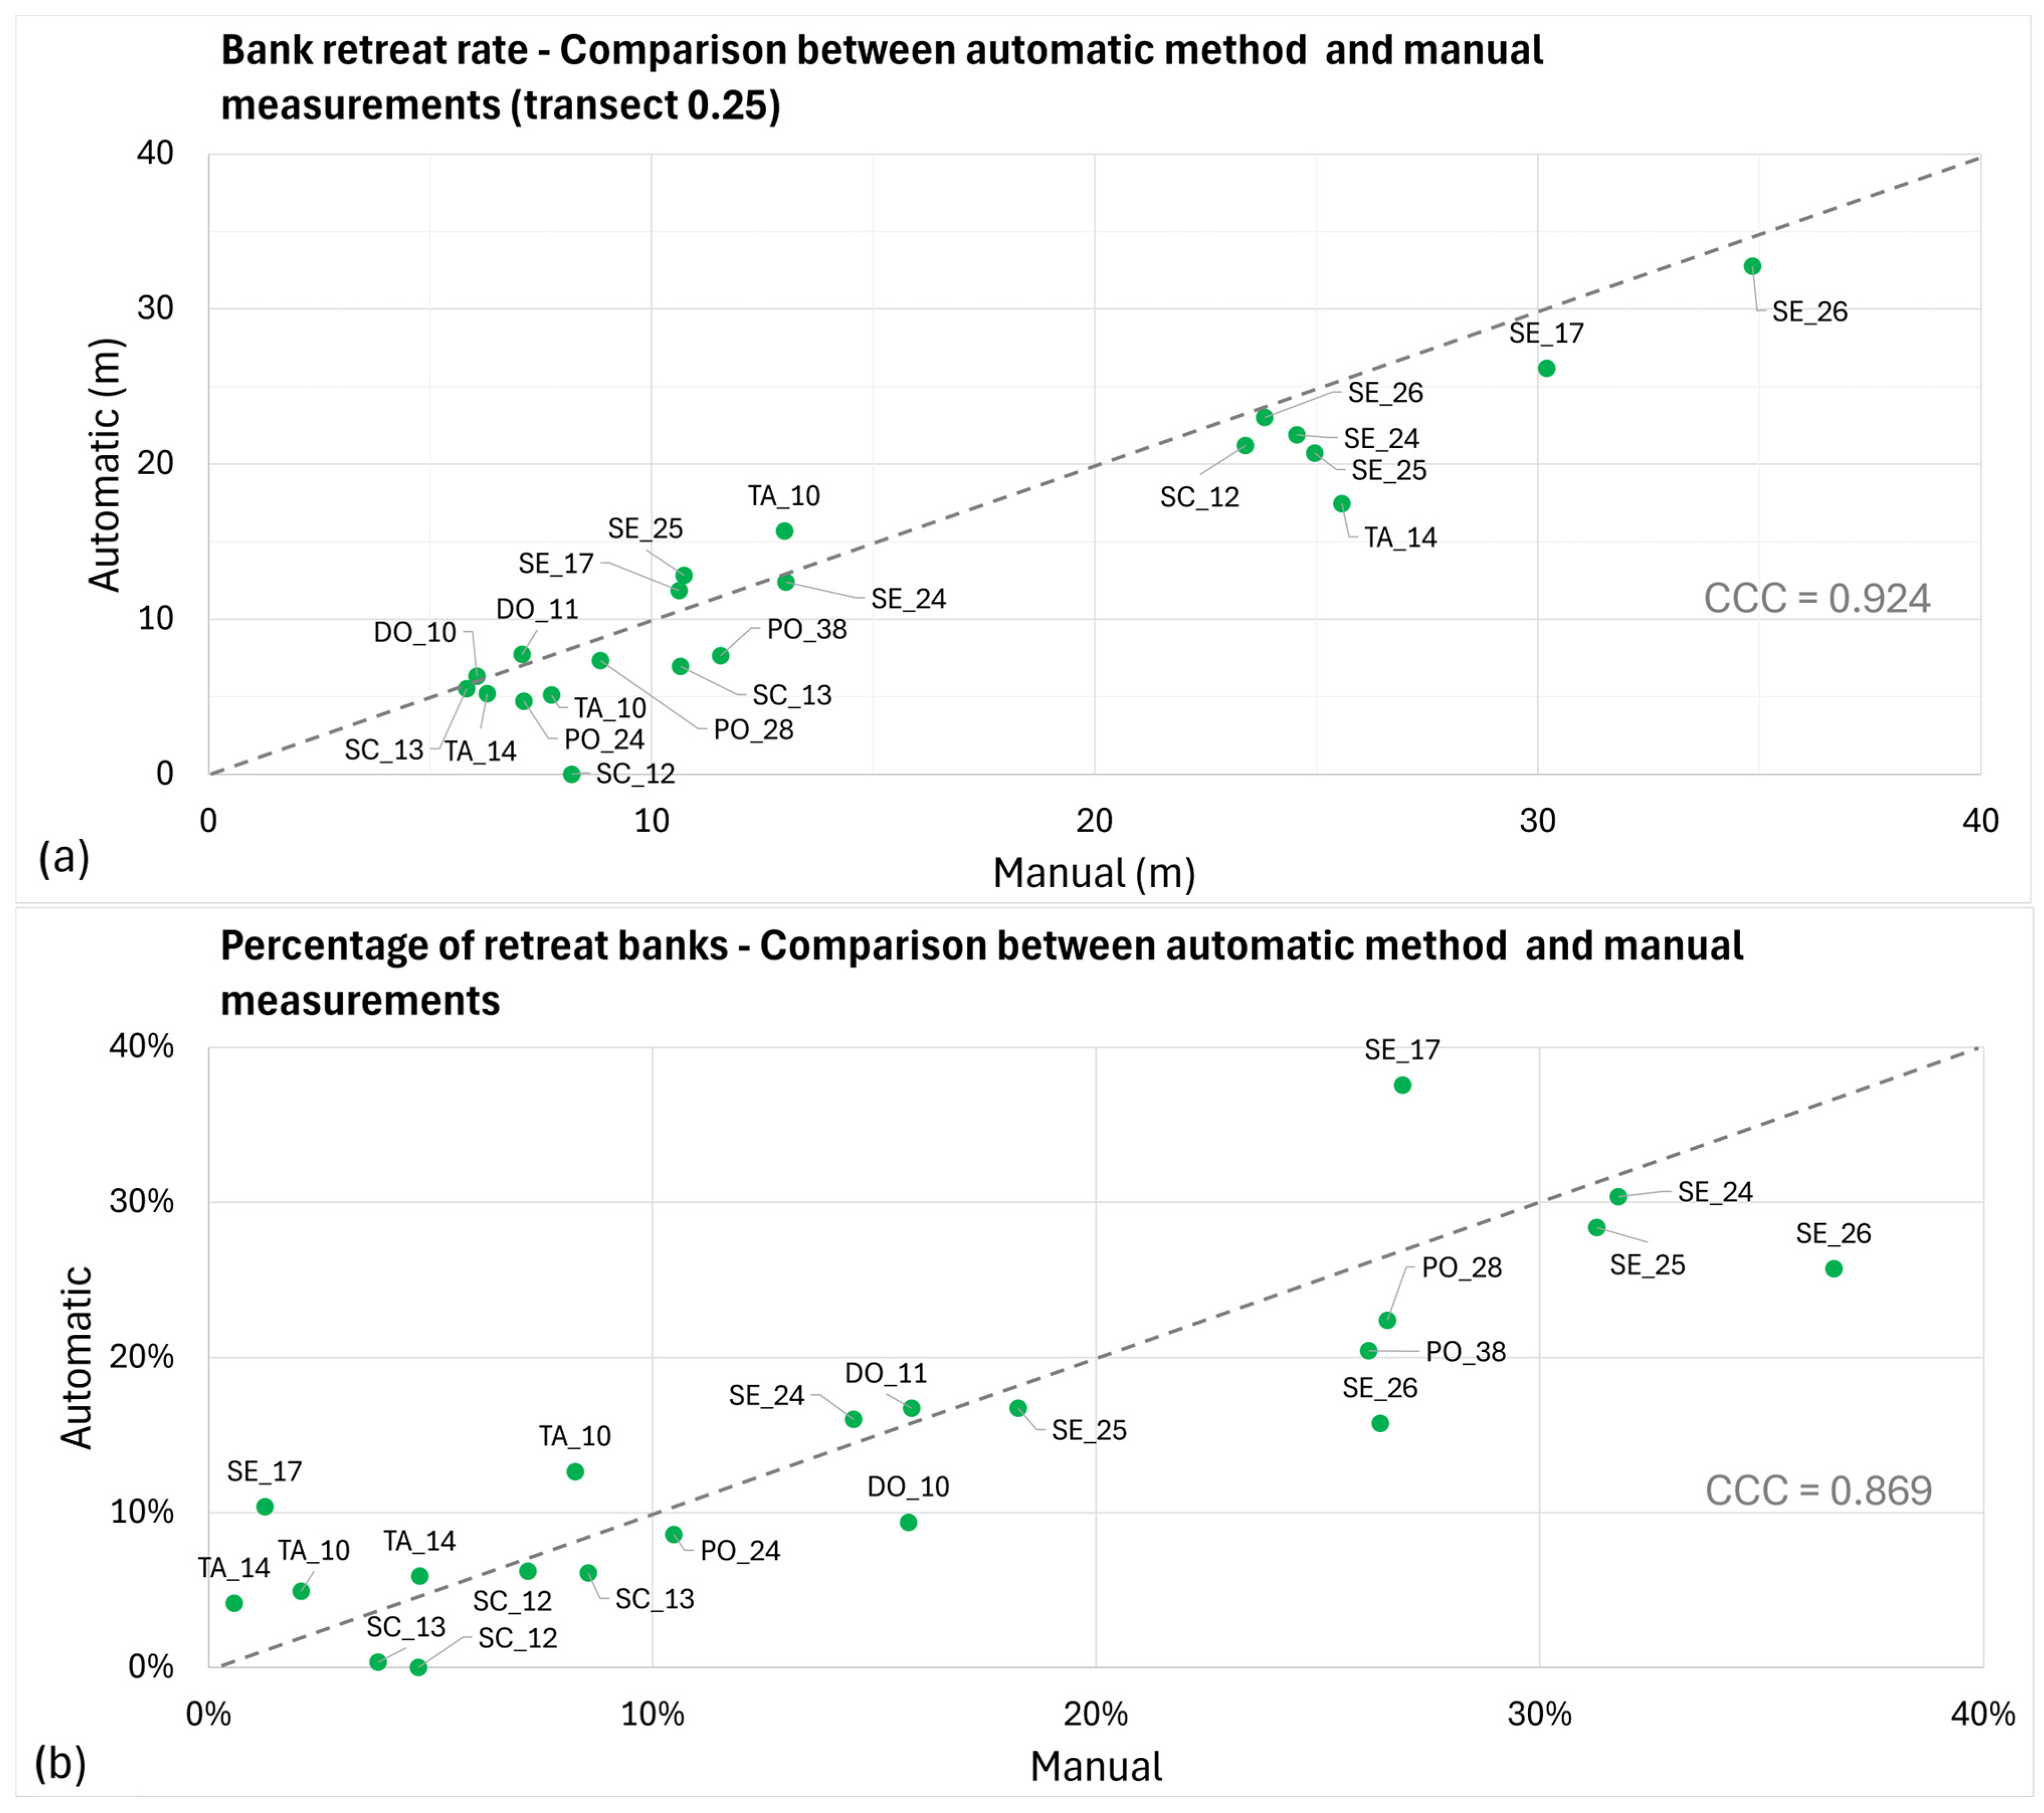
Figure 6 shows the scatter plot of values measured using the automatic method compared to the manual reference for 0.25 step size. The Concordance Correlation Coefficient (CCC) indicates high agreement between the two sets of measurements, with values of 0.92 and 0.87 for riverbank retreat rate and eroding length percentage, respectively; the latter (Figure 6b) also displays good agreement between automatically and manually-derived values, but with a slightly larger occurrence of outliers compared to the bank retreat values (Figure 6a).
Table 2 presents the Mean Absolute Deviation (MAD) and Relative Error (RE) of the automatically derived values compared to the manual measurements. These metrics represent the average error for each reach (derived from Table S3 in the Supplementary Material), aggregated by morphological class.
The results indicate that the automated procedure achieves high accuracy in estimating bank retreat rates, although its performance varies across morphological classes: the RE was 16% for both sinuous with alternate bars (SBA) and wandering (W) reaches, increasing to 25% for Sinuous (S) reaches. In most instances, the method maintains precision to at least the first decimal digit (as shown in Figure 5). Furthermore, the automated approach exhibits a slight systematic tendency to underestimate bank retreat across all morphological classes. Regarding the percentage of eroded banks, Table 2 demonstrates higher accuracy for the W type (16%) compared to the SBA (32%) and S (41%) types.

4.2. Bank Retreat Rate Along the Sesia River

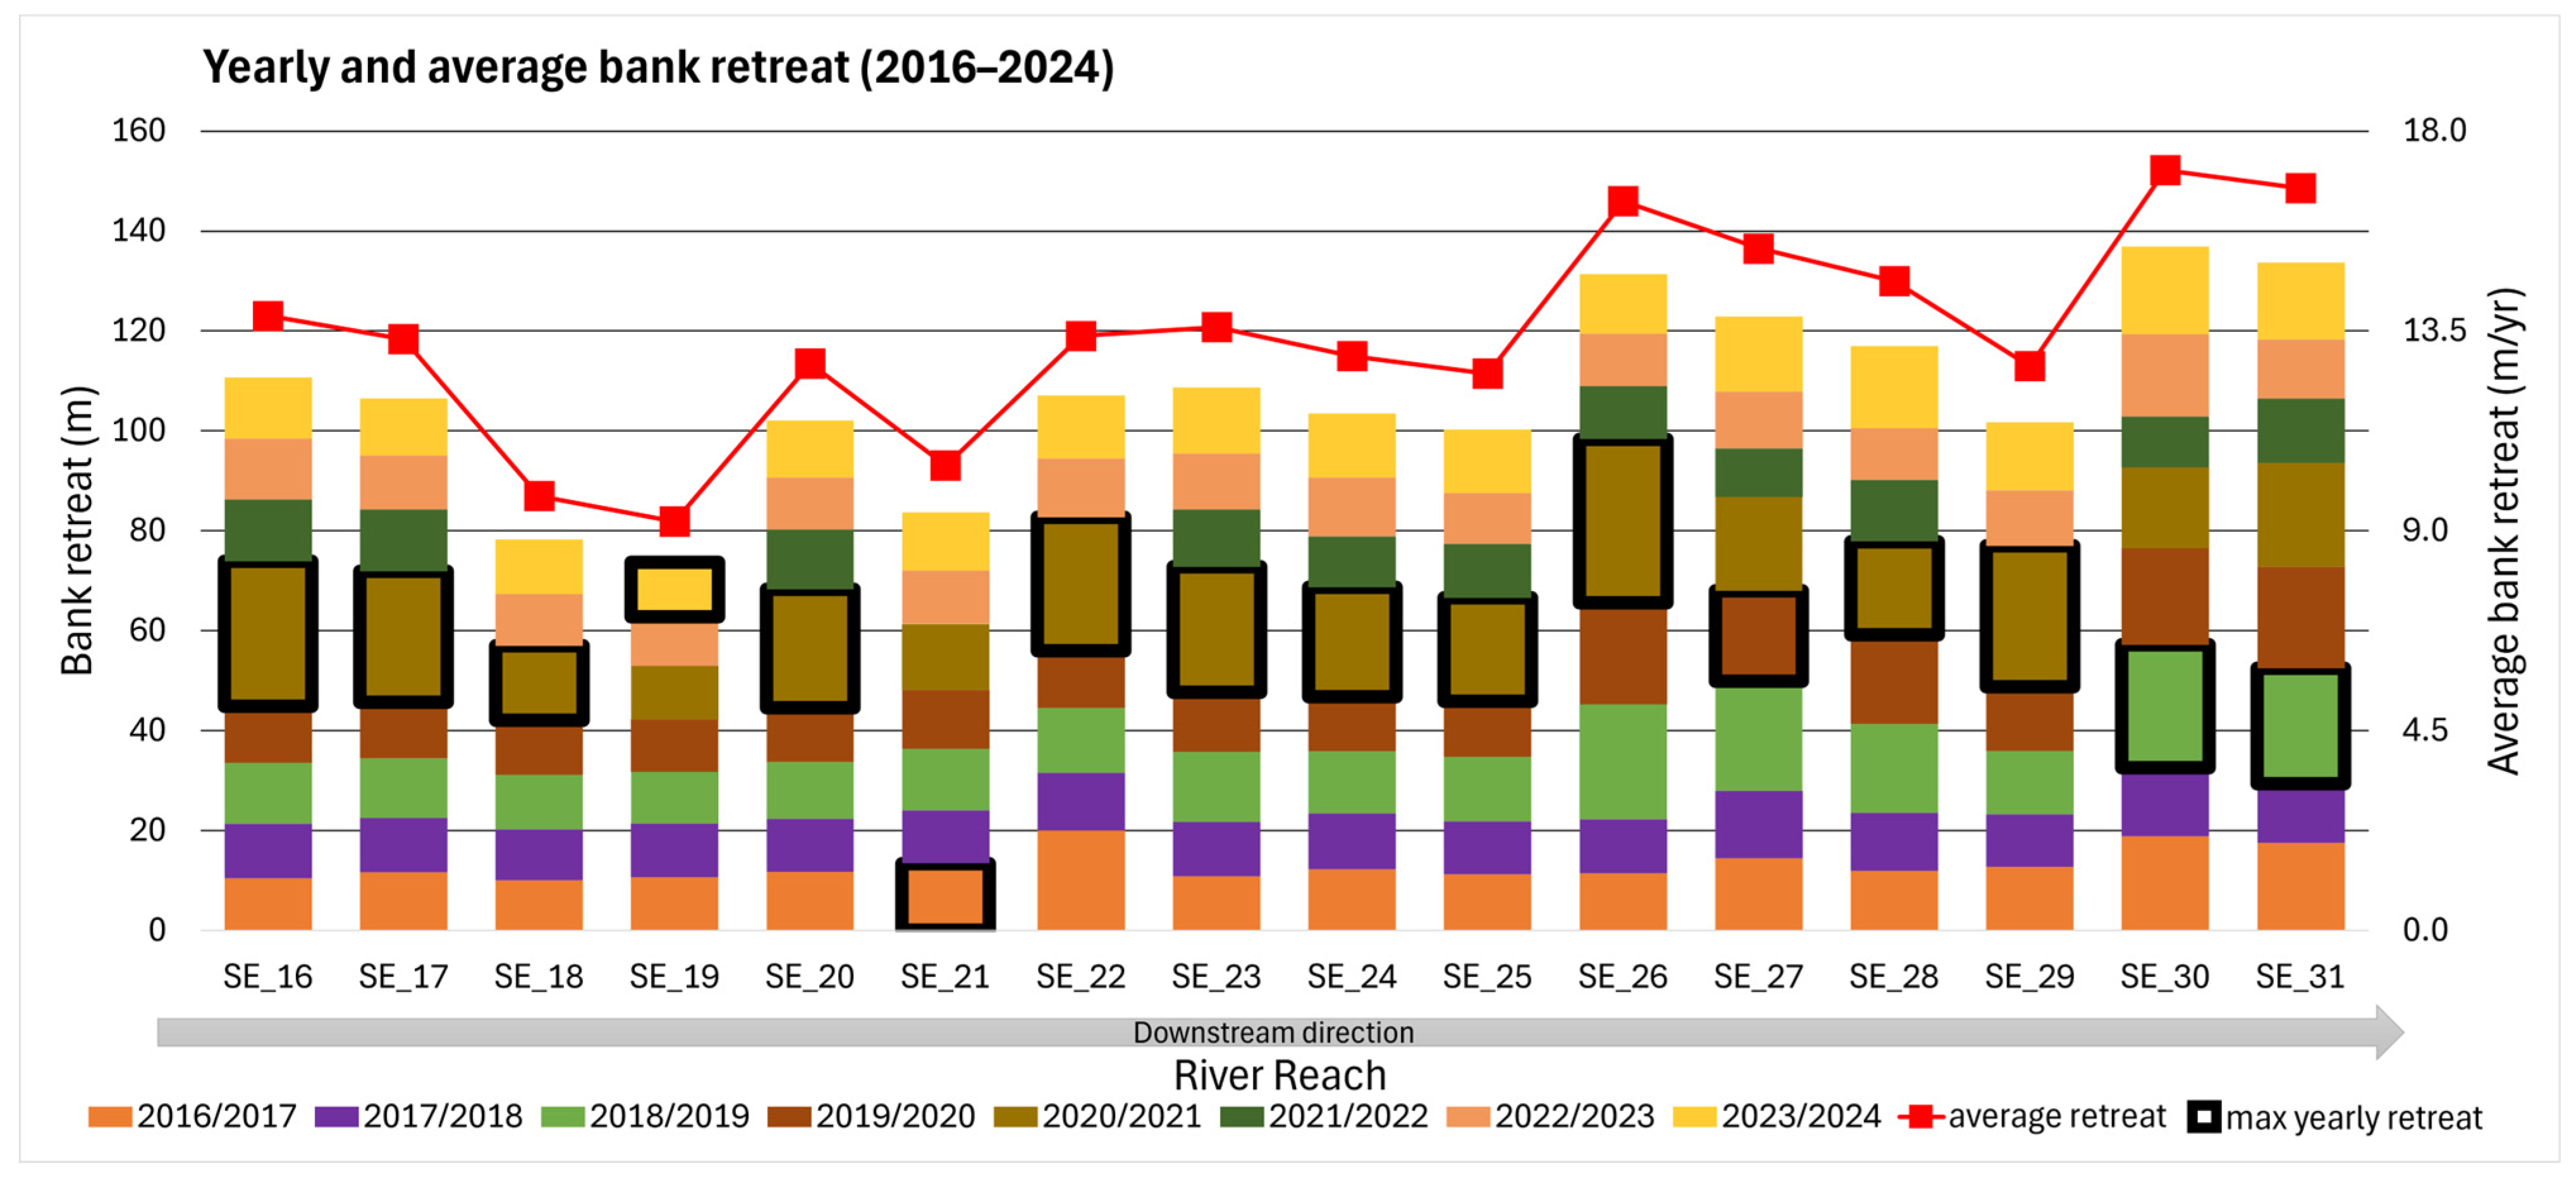
The automatic methodology for riverbank retreat measurement was applied to 16 reaches of the Sesia River. Figure 7 shows the yearly retreat rate (short-term retreat rate) as well as the decadal average bank retreat rate measured from 2016 to 2024 (medium-term retreat rate) for all reaches examined.
Results show a heterogeneous distribution of lateral erosion rates, varying through the years and through the different river reaches from upstream to downstream. The most striking feature of the graph is the dominance of the 2020 hydrological year for almost all river reaches, with peak values accounting for about 30 m of retreat rate for SE_16, SE_26, SE_30. Conversely, for all rivers reaches, the retreat rate was constantly low between 2022 and 2023.
The spatial variability in the riverbank retreat rate is further modulated by temporal fluctuations, as the annual retreat rates show significant interannual differences across all reaches.
As is evident from Figure 7, the medium-term average bank retreat rate reveals a spatially heterogeneous pattern of lateral erosion. In the mountainous upper reaches (SE_16–SE_21), erosion rates generally decrease in the downstream direction, except for SE_20. In the mountainous-hilly middle section and in the two transitional reaches at the entrance of the plain (SE_22–SE_25), retreat rates remain relatively stable and comparable, without a clear longitudinal trend. In contrast, the lowland plain reaches (SE_26–SE_31) exhibit the highest average retreat rates, with pronounced peaks in SE_26, SE_30, and SE_31. The spatial distribution of the investigated reaches shown in Figure 1 provides a geographic reference for the interpretation of these patterns. The recurrence of similar trends in non-contiguous reaches (e.g., SE_16–19 and SE_26–29), which correspond to markedly different geomorphological settings (mountain valley versus lowland plain), indicates that similar temporal patterns may emerge from different combinations of local controls and external forcing.

4.3. Reach-Scale Controls on Lateral Erosion

The reach-scale erosion rate was integrated with additional morphological parameters summarized in Table 3. The riverbed typology, inferred from AGEA 2015 aerial photographs and Google 2024 imagery, was included to study the fluvial-type transition undergone by the riverbed in a decadal timescale, following the 2020 flood.
The highest decadal average retreat rates are observed in the low plain (LP) reaches, particularly SE_26 (16.42 m/yr), SE_30 (17.12 m/yr), and SE_31 (16.71 m/yr).
In contrast, Mountain (M) and Intermontane Plain (IP) reaches generally show lower average rates, with SE_18 (9.78 m/yr) and SE_19 (9.21 m/yr) exhibiting the lowest values. Looking at the yearly bank retreat registered in 2020/2021, some peak values accounting for about 30 m of retreat rate are evident for some reaches, exceeding 32 m/yr in SE_26, 29 m/yr in SE_16, and 28m/yr in SE_29. In contrast, the 2021/2022 annual retreat rate shows minimal or zero retreat measured in several reaches (SE_18, SE_19, SE_22, SE_29). The riverbed morphological type and its transition over time give us relevant information, as it influences the magnitude and variability of erosion: transitional reaches (SE_20: S→W; SE_28: CI→ SBA; SE_30: W→CI) show mean retreat rates of 15.8 m/yr, with peaks > 20 m/yr (SE_26, SE_30); stable reaches (SE_16: S→S; SE_18: R→R;) show moderate, relatively constant retreat rates (mean = 11.2 m/yr), indicating equilibrium conditions.
Moreover, the spatial variability in the bank retreat rate reflects both local geomorphic controls (confinement, substrate, channel morphology) and the differential hydrological response of the two main tributaries, the Mastallone and Sessera streams, unevenly affected by precipitation events. Sediment and flow inputs from these tributaries introduce longitudinal discontinuities in shear stress and sediment supply, amplifying lateral erosion, especially in the distribution of the erosive processes of the 2020 event in specific downstream segments, particularly within the low-gradient alluvial plain.

4.4. Prediction of Lateral Channel Mobility Along the Sesia River

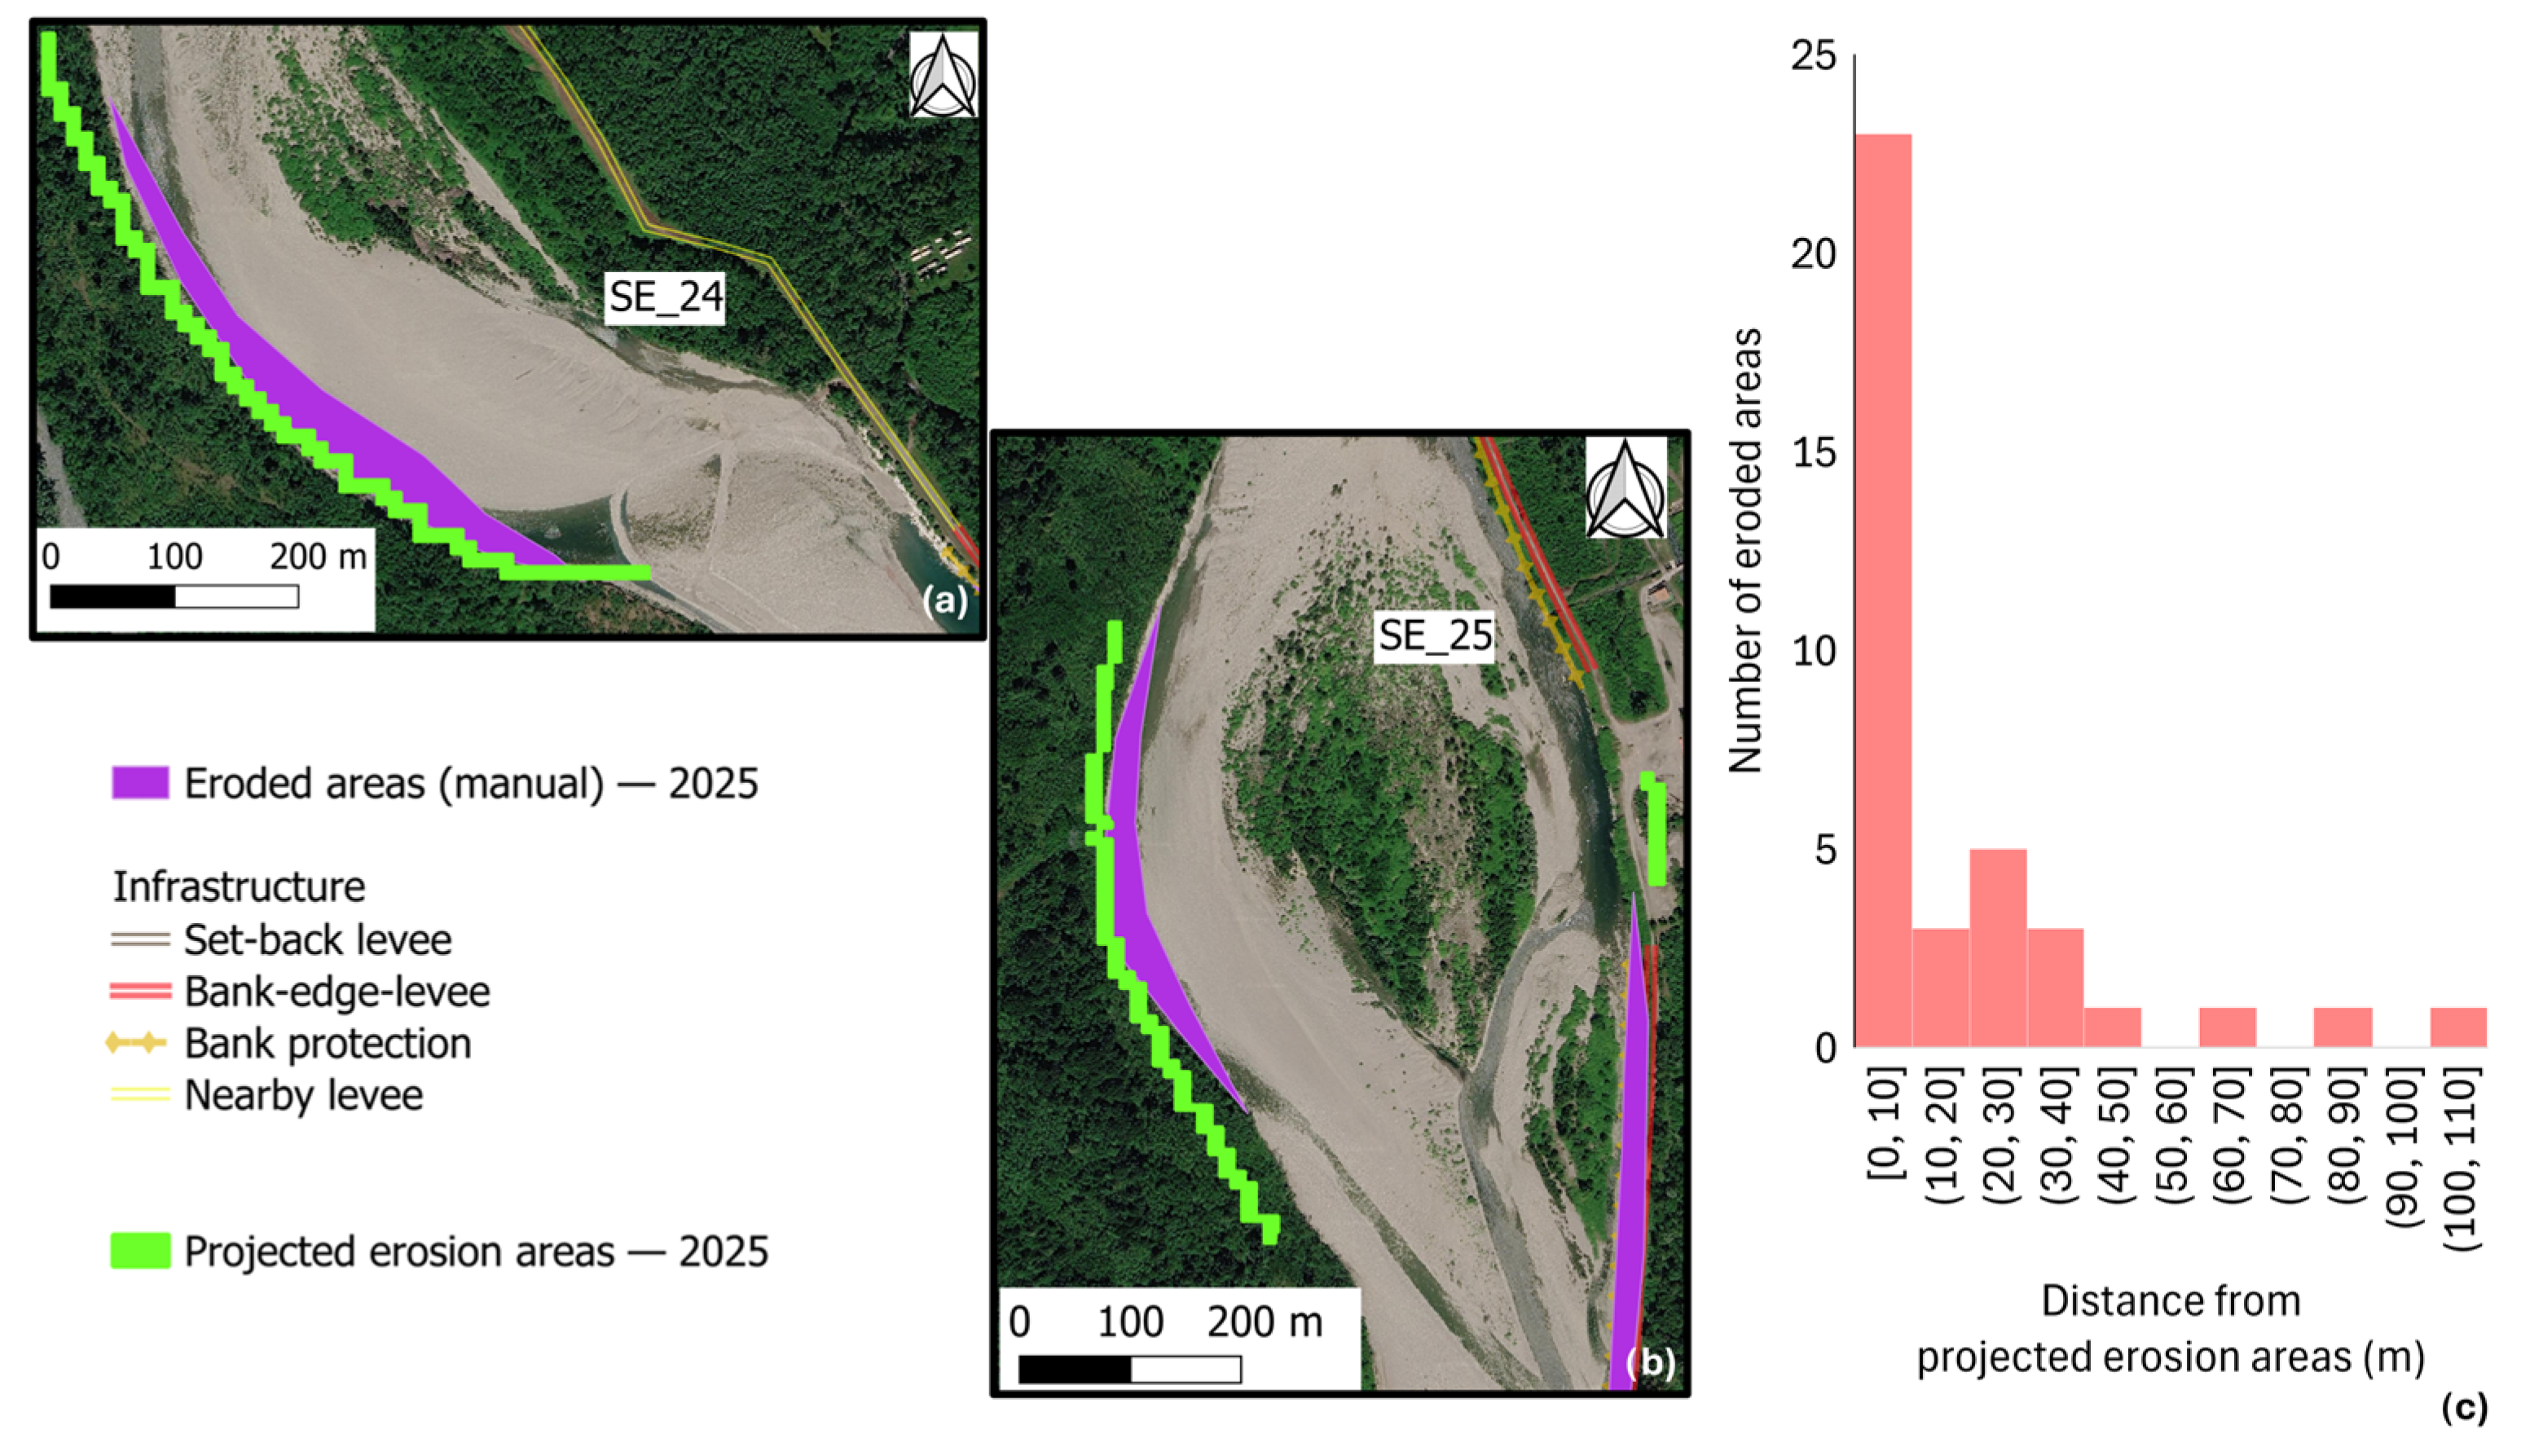
Based on the results obtained for the medium-term average bank retreat rate (m/yr), we tested a possible prediction of the Sesia River channel evolution. To jointly assess the reliability of this approach, the predicted bank geometries in the fourth year (2025) were compared, for qualitative validation, with the actual eroded areas observed during the April 2025 flood event, manually delineated from Google Earth images 2025 and available aerial photos. Figure 8a,b show an example of the results obtained for this analysis for the reaches SE_24_to SE_25.
The green polygons represent the automatically generated areas of potential riverbank migration for the fourth year (2025), derived by applying the decadal average retreat rate to the 2020 erosion polygons (Figure 4). This assessment was conducted across 10 reaches affected by the 2025 event, within which 38 cases of eroded banks were identified. In 35 out of these 38 cases, a high degree of correspondence (e.g., spatial overlap) was observed between the two geometries. The spatial agreement between observed and predicted erosion was evaluated in terms of minimum distance (using “Shortest lines between features” algorithm, integrated in QGIS), showing that most observed erosion areas are located within short distances (0–30 m) from predicted areas, which indicates a strong correspondence in the identification of erosion-prone zones. In addition, land-use and hydraulic infrastructure layers (BDTRE and GEmMA, ARPA Piemonte) were used to examine how such features influence or correspond to lateral river migration.

5. Discussion

This study presents a semi-automated framework based on Sentinel-2 data for quantifying two primary metrics of lateral erosion processes: the bank retreat rate (average annual rate of lateral displacement) and the spatial extent of eroding banks (percentage of bank length undergoing retreat within a reach). By analyzing the annual delineation of the active channel, bank erosion is detected through pixel-level class-membership shifts, effectively capturing lateral migration at the native spatial resolution of Sentinel-2 (10 × 10 m). The pixel-based automatic method assumes, as a geomorphological indicator of lateral erosion, the loss/shift of stable vegetation towards classes of water, unstable vegetation, or sediment in the consecutive years examined. This approach, validated against a manually delineated dataset, offers the distinct advantage of being both computationally efficient and replicable across diverse medium-large river systems (width > 40 m), significantly reducing the time-intensive labor associated with traditional retreat rate measurements [14,15]. Currently, the proposed methodology is semi-automatic as it involves three manual steps, the outcomes of which depend on operator expertise and dataset availability: (i) identification of homogeneous reaches; (ii) delineation of the river corridor to apply the Sentinel-2 classifier; and (iii) identification of the thresholds to isolate the active channel. Regarding the identification of homogeneous reaches (point i), while automated delineation of these units remains a promising area of research, this remains a routine procedure for Italian Regional Environmental Agencies (e.g., ARPA Piemonte) to assess morphological status under the Water Framework Directive (2000/60/EC). Regarding the second and third steps, in our study, the application of suitable thresholds (point iii) successfully isolated the active channel and delineated annual banklines. Moreover, the step of river island detection was also essential to increase the accuracy of the method and effectively exclude stable vegetated surfaces not involved in lateral migration resulting from the disappearance of vegetation inside the channel (Class 4). Threshold identification was validated through photointerpretation of high-resolution orthophotos (20 cm) and Google Earth imagery across morphologically distinct systems-ranging from the braided channels of the Sesia River to the sinuous Tanaro River, demonstrating consistent performance across diverse planimetric configurations. Our approach was driven by the need for a straightforward, accessible procedure in the absence of standardized remote sensing procedures for heterogeneous river contexts. Despite its relative simplicity, the classification model used in this study performed comparably to more complex approaches reported in the literature [23,46]. Consistent with previous findings [26], model errors were primarily concentrated at the interfaces of macro-units, where ‘mixed pixels’ predominate. Occasional classification errors also emerged in specific instances, such as within Po River reaches, where submerged features were misidentified as vegetation. Such discrepancies are likely attributable to the presence of cloud shadows or floating organic macro-debris. Nevertheless, our workflow is compatible with advanced classification algorithms and recent automatic workflow for active channel identification [43,44], which could further reduce misclassification errors, as well as avoid the need for thresholds, leading to a more objective and automatic procedure.

5.1. Reliability of Sentinel-2 Data for Lateral Erosion Assessment

To validate our procedure, a dataset representing around 20% of the study areas was analyzed. Overall, combining data from all five rivers was essential to validate the regional scalability of the workflow, as the morphological diversity provided by the Po, Sesia, Dora Baltea, Tanaro, and Scrivia (spanning 134 reaches) ensures the framework is robust and not overfitted to a single catchment. The transect method [14,15] was implemented at three spacing intervals (0.25, 0.5, and 1.0 of the river width), finally adopting the 0.25 width interval in our analysis (Figure 5). It should be noted that spacing below this threshold was deemed impractical due to the increased manual effort and the 10 m spatial resolution of Sentinel-2. Results indicate high agreement between manual and automatic datasets, showing a Concordance Correlation Coefficient (CCC) of about 0.9 for both the metrics. Table 2 reports the errors categorized by river morphological type. The overall results demonstrate that bank retreat rates can be measured with an average accuracy of 2.64 m/yr (MAD), while the eroded river length is captured with a Mean Absolute Deviation of 4.34%. For comparison, manual digitization of high-resolution satellite or aerial imagery-considered the benchmark for bank retreat calculations-typically maintains a delineation error below 1–2 m [21]. These results fall within an acceptable range for the scope of this research and prove suitable for practical applications in supporting river management strategies. Table S3 in the Supplementary Material shows the errors obtained for estimating lateral erosion via satellite for each river reach. Overall, the methodology demonstrates satisfactory performance across all river typologies, although comparisons among morphological types are limited by sample size heterogeneity. For the SBA class (n = 12), the results vary: three cases showed moderate performance (errors of about 30%), four were of high quality (errors between 10% and 20%), and five achieved errors below 10%. In contrast, the W class exhibited slightly superior performance, with errors consistently below 20%. The S class performed similarly to the SBA class regarding bank retreat rates. Instances of lower accuracy are attributable to several primary factors. First, discrepancies in bank retreat rates and eroded lengths arose from inherent methodological constraints, specifically, the thresholds set for active channel identification, the procedure used for islands detection, and the 20% threshold defined for the minimum area coverage requirement. These constraints led to the exclusion of certain eroded areas that were manually identified but fell below the automated detection threshold (e.g., case PO_38, Table S3 in the Supplementary Material). Furthermore, in cases such as SC_12, the manually delineated eroded area was smaller than the satellite resolution (10 m). Consequently, while the automated procedure recorded a null retreat rate, the manual assessment yielded a non-zero value. This spatial resolution constraint is clearly reflected in the morphology-specific relative errors (Table 1). In highly sinuous reaches, bank retreat often manifests as narrow, localized failures at or below the sub-pixel boundary of a 10 m Sentinel-2 cell. Conversely, wandering channels exhibit large-scale, multi-pixel bar and bank adjustments that are inherently easier to resolve. This geometric discrepancy is particularly evident when comparing length versus area: when erosion occurs along elongated but extremely narrow bank segments, the sensor fails to detect the linear feature, whereas the impact on the total eroded area remains negligible. Consequently, the relative error for sinuous reaches is significantly higher when computed as a percentage of eroded river length (41% vs. 16% for wandering reaches) than when evaluated in terms of total bank retreat area (25% vs. 16%, respectively).
Since our method is currently in an early stage of development, future end-users (e.g., river management authorities) must account for the limitations identified during operational validation. For instance, given the model’s tendency to underestimate retreat rates (indicated by the ~13% negative bias observed in our study), it may be appropriate to apply a suitable correction factor or, alternatively, to interpret the automated outputs as a lower-bound baseline for actual bank retreat.

5.2. Different Timescales of Bank Retreat Rate for the Sesia River

Due to its high morphological dynamics, the Sesia River was selected as our primary case study, serving as a high-resolution laboratory for predictive modeling and validation supported by extensive field and drone datasets. Within this framework, bank retreat was measured over two timescales: annual and decadal (2016–2024).

5.2.1. Short-Term (Annual) Timescales

The annual timescale analysis (Figure 7) captures the heterogeneity of short-term erosion patterns across river reaches, specifically highlighting the disproportionate impact of high-magnitude geomorphic events. The most striking feature is the dominance of the 2020 hydrological year, driven by an intense precipitation event in October 2020. This event generated a peak discharge of 3200 m3/s at the Borgosesia hydrometer, surpassing the historical maximum registered in September 1948 (3070 m3/s) and corresponding to a return period greater than 100 years. During this event, the entire active channel underwent widespread bed and lateral erosion [47], leading to significant bank instability and retreat rates. Our results exemplify that rare, high-magnitude floods drive most morphological changes in high-energy river systems [48,49]. This is reflected in the 2021 active channel delineation, which captured the structural reorganization initiated by the October 2020 flood. The bank retreat that we measured in this event is consistent with observations in other gravel-bed Alpine rivers [50,51] where flood events with a return period of over 100 years have caused average retreat rates between 5 and 15 m/yr. In the hilly and lowland section of the basin, the flood magnitude was comparable to the 1968 event, which had an estimated return period of about 30 years. Notably, in the following years (2021–2023), retreat rates dropped to near-zero, reflecting the extreme and prolonged drought that affected the Piedmont region [52].
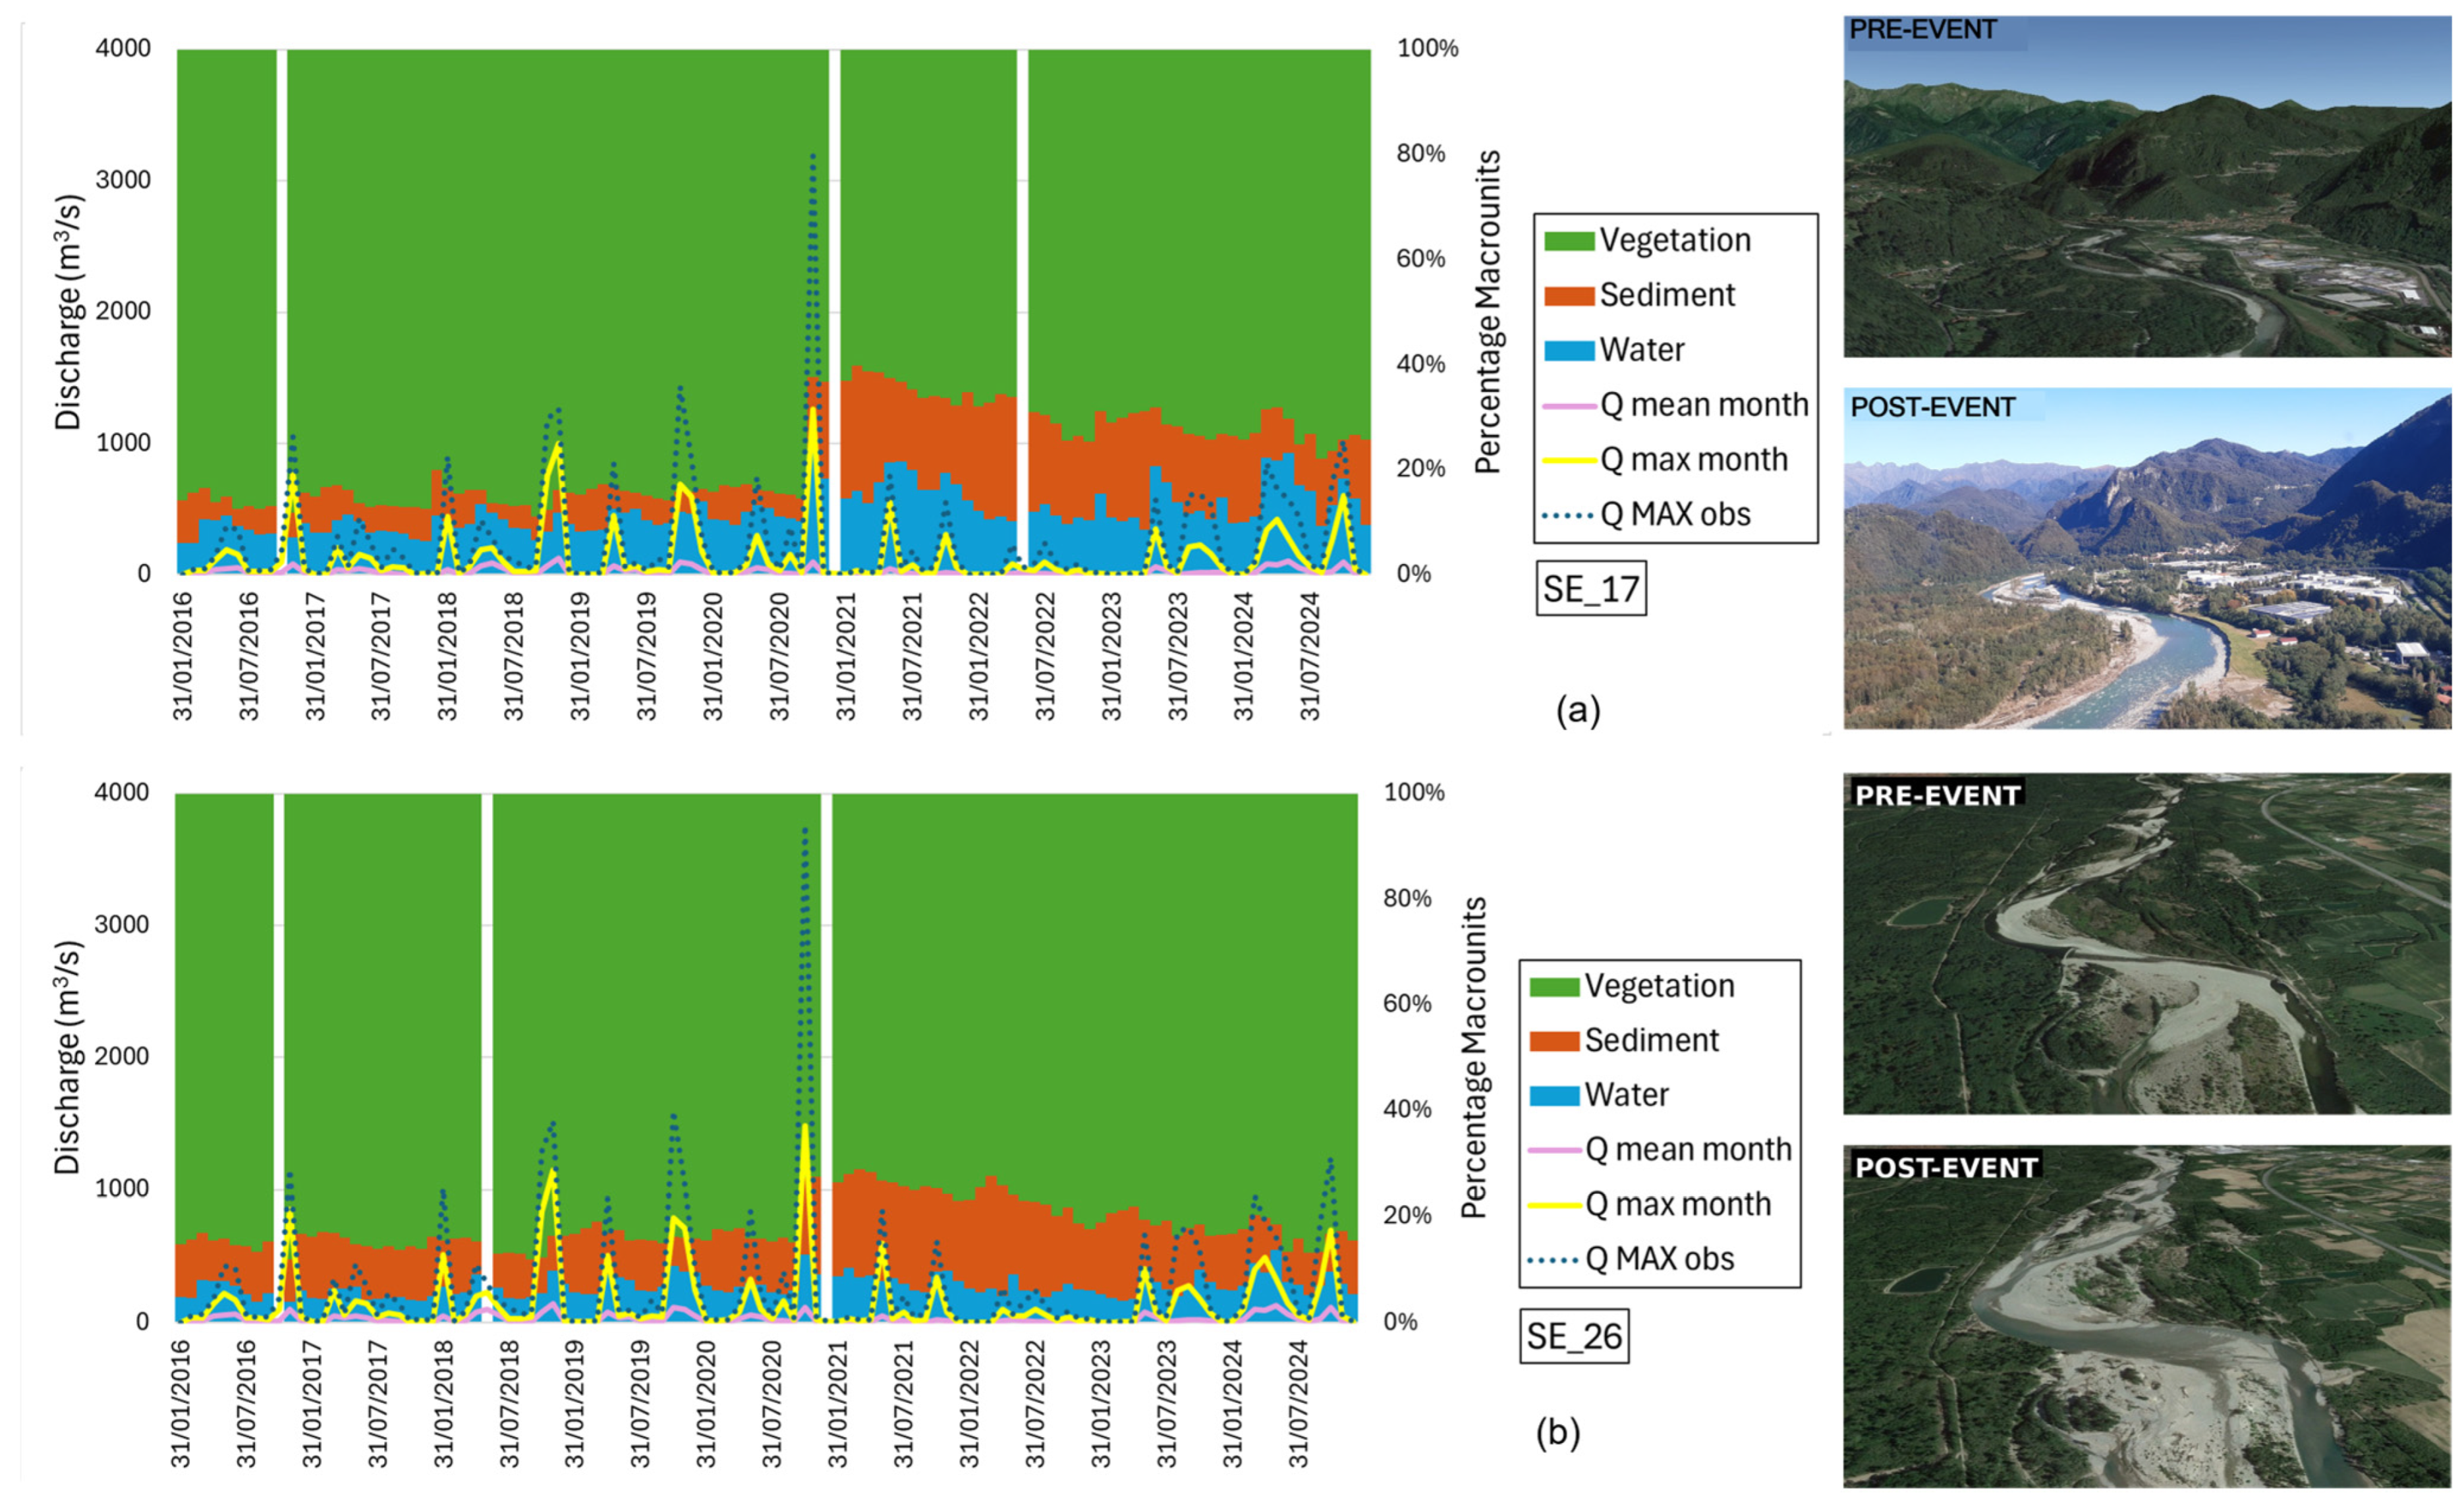
Figure 9 illustrates the monthly distribution of the percentage of macro-units within the river corridor of two key reaches (SE_17 and SE_26, Figure 1b).
Notably, in conjunction with the peak discharge of October 2020, both reaches experienced a marked reduction in stable vegetation. However, they have divergent post-flood recovery. SE_17, located downstream of the Mastallone Stream confluence, experienced a dramatic shift: vegetation cover collapsed, while sediment and open water expanded from 14.5% to 37.7%, nearly doubling the channel width (92.73%). Four years later, this reach has not reverted to pre-flood conditions, suggesting a potential permanent reorganization, to be confirmed by future satellite monitoring. Conversely, SE_26, located downstream of the Sessera Stream confluence, where the flood intensity was lower, the channel width changes were comparatively modest (48.47%) and the channel morphology tended to revert to its pre-event configuration within a few years following the 2020 flood event. These findings underscore the importance of evaluating river systems as dynamic trajectories rather than static entities and show how remote sensing can be a powerful tool for this purpose. This analysis could be further refined by employing different temporal aggregations for Sentinel-2 composites, such as seasonal or event-based groupings, to better isolate erosion drivers. This would enable a clearer distinction between the stabilizing effects of riparian vegetation [53,54] and the contribution of sediment transport to bank retreat [55,56] across various river types. A marked shift in macro-unit composition is evident following the extreme flood event of 3 October 2020, particularly in SE_17, where vegetation was largely replaced by sediment and open water-highlighting the strong coupling between peak flow dynamics and fluvial land-cover changes in the river corridor.

5.2.2. Medium-Term (Decadal) Timescale

While short-term monitoring captures event-driven pulses, the medium-term analysis (2016–2024) provides insights into the morphodynamic behavior of the Sesia River and its interaction with anthropogenic pressures [56,57,58]. Our analysis of 16 morphological homogeneous reaches (Figure 7, Table 3) highlights the variability along the river course and identifies the reaches most affected by the higher retreat rates. Consistently with studies on Alpine gravel-bed rivers [45,51], the highest erosion occurs mainly in transitional rivers where channel morphology tends to change over time (e.g., SE_26) as their inherent morphological instability is the primary driver of lateral migration. The recurrence of identical trends in non-contiguous sectors (e.g., SE_16–19 and SE_26–29) with markedly different geomorphological settings suggests that convergent evolutionary trajectories can emerge from distinct combinations of local controls and external drivers. For instance, upstream reaches may be regulated by sediment supply from tributary inputs, as observed in the Mastallone Stream basin during the 2020 flood event, whereas downstream segments are more strongly affected by low-gradient conditions and subsequent depositional processes in the alluvial plain. Furthermore, hydrological forcing varied significantly among the analyzed years, with floods affecting different sub-basins with distinct peak timings and magnitudes. These variations led to the differential activation of sediment sources and erosional mechanisms along the river network. Consequently, bank retreat dynamics reflect the superposition of site-specific constraints and temporally variable hydrology. A detailed process-based and geomorphometric investigation would be required to fully disentangle these overlapping mechanisms. In addition, our findings show that lateral erosion intensity is governed primarily by the reach’s morphological trajectory rather than anthropogenic control (Table 3). Indeed, bank defenses do not consistently suppress erosion, and no consistent inverse relationship emerges between defense coverage (levees, revetments) and retreat rates. Reaches with high defense coverage (e.g., SE_20: 65%; SE_29: 69%) exhibit retreat rates (12.7–12.8 m/yr) comparable to, or even higher than, those of lightly defended reaches (SE_18: 9.8 m/yr, 24% defenses), and experienced high peak erosion during the 2020 flood event (Table 3). This suggests that while defense structures may provide local stability, they often fail during extreme events or trigger compensatory erosion processes upstream and downstream. Moreover, reaches characterized by low lateral continuity and high longitudinal discontinuity (dams, weirs, and groins) correlate with elevated retreat rates, as disrupted sediment transport promotes downstream degradation.

5.2.3. River Trajectories and Interactions with River Infrastructures

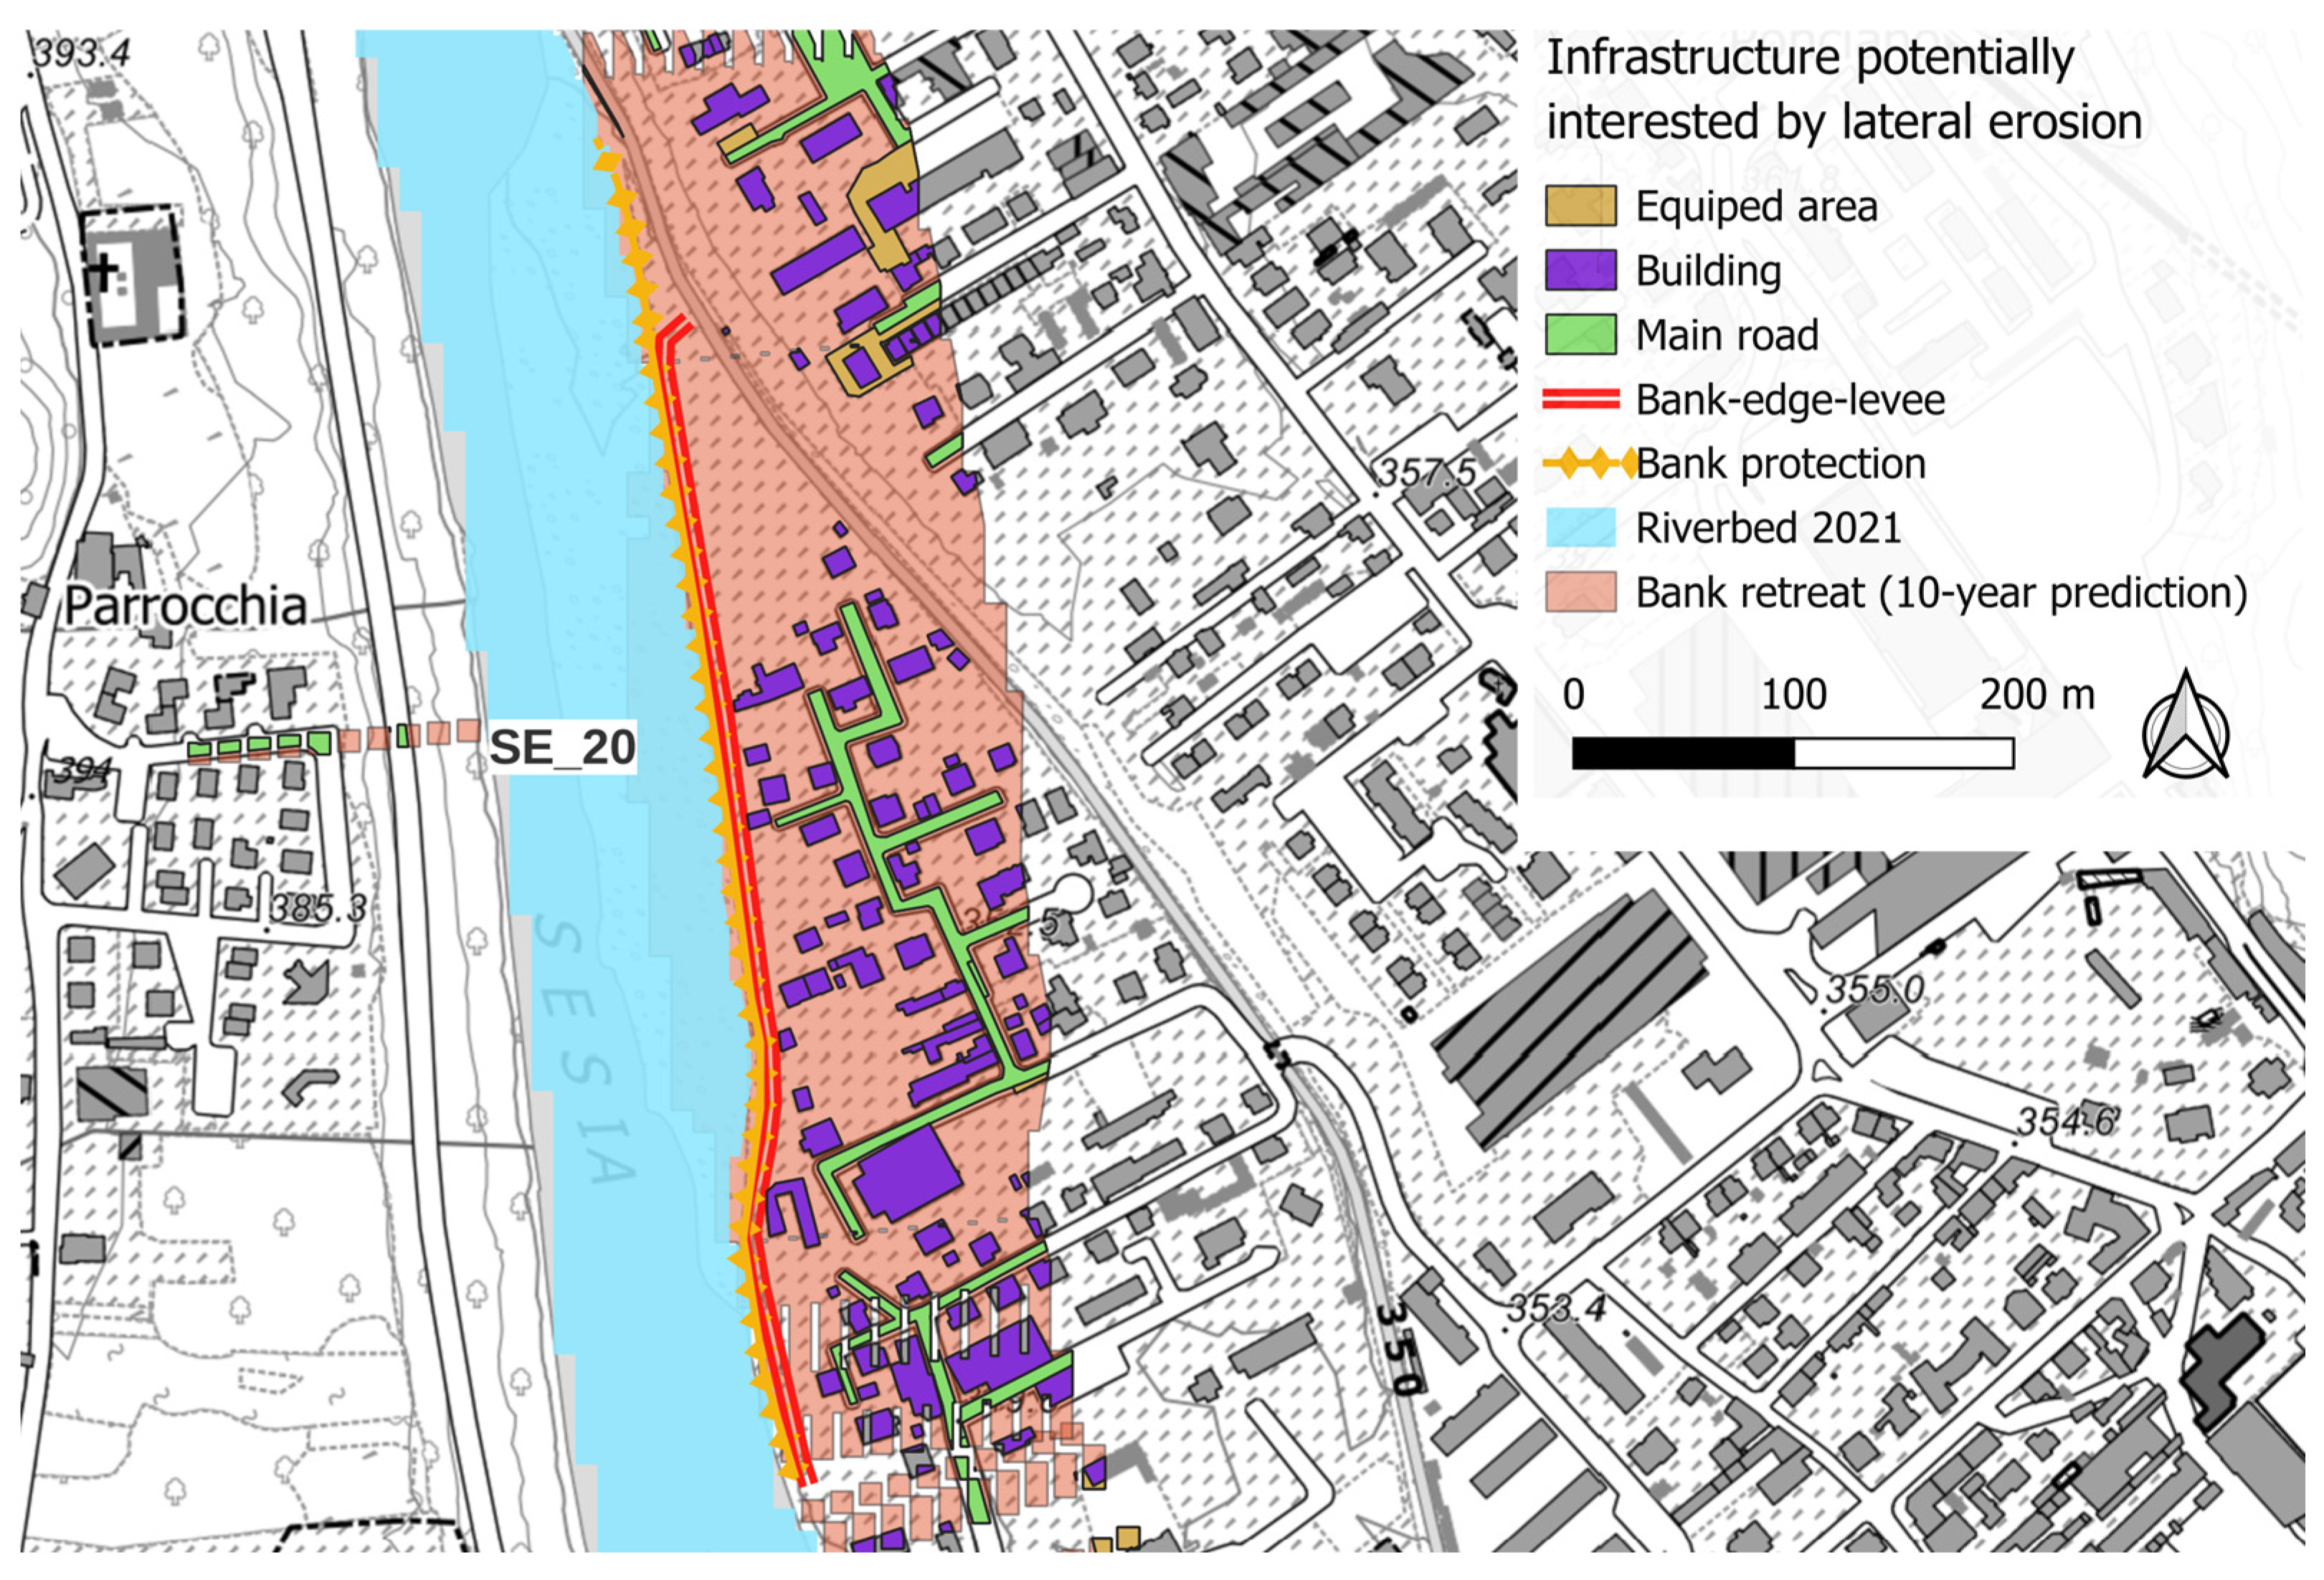
For the Sesia River, we tested a preliminary evolutionary model by intersecting 10-year erosion forecasts with land-use data (BDTRE Piedmont) and hydraulic infrastructure datasets (BDTRE and GEmMA, ARPA Piemonte). By shifting the focus toward medium-term evolutionary patterns, this approach translates geomorphic predictions into actionable flood risk assessments, including the evaluation of flood defense prioritization and adequacy. Figure 10 shows an example of the predicted geomorphic changes and the overlap with the urban area of Isola-Borgosesia. Notably, several buildings in this area were inundated during the 2020 flood despite existing flood protections, highlighting a mismatch between engineered defenses and actual floodplain dynamics under extreme conditions.
Although this predictive model does not explicitly account for lateral structures—where erosion is often confined to the toe—a comparison with the April 2025 event showed substantial agreement between predicted and observed bank retreat (Figure 8). To date, validation has been limited to a qualitative assessment of 38 significantly impacted reaches; however, a more robust, quantitative, and automated evaluation remains a priority for future development. Furthermore, assuming a constant retreat rate is a simplification, as river courses may change dramatically through processes such as channel avulsion and factors such as sediment supply, flood duration, and discharge intensity mean that hydrologically similar events can yield vastly different morphodynamics. Also, a limitation of our method concerns the assumption of a geometric translation shifts of erosion polygons perpendicular to the river axis, implicitly assuming a consistent translation direction. In our study, exploring all possible directional scenarios would have been computationally impractical at the reach scale. Nevertheless, the aim of this study is to identify and possibly quantify zones characterized by intense channel interaction, specifically focusing on floodplain areas (outside the active channel) where erosion could interfere with critical infrastructure such as levees, roads, or hydraulic structures. We therefore claim that while definitive predictions remain elusive due to the inherent non-linearity and episodic nature of fluvial processes [59], our approach shows great promise for proactive river management, moving beyond static models toward an adaptive “warning system” that can identify and prioritize the most vulnerable river reaches. We consider the application of our semi-automated methodology highly promising as a first-stage satellite screening tool that can be updated annually thanks to the continuous availability of Sentinel-2 data, allowing for the identification of river reaches that are most geomorphologically active and should be monitored more closely in the future, even through more detailed assessments and alternative technologies deployed by competent authorities. Such an approach will partially mitigate the limitations mentioned above, by progressively incorporating observed channel adjustments and updating river channel trajectories.

6. Conclusions

This study advances the automation of lateral channel mobility assessments, specifically quantifying bank retreat rates and eroded river length in high-energy, gravel-bed rivers. By leveraging freely available Copernicus Sentinel-2 imagery, the proposed methodology offers a highly replicable and automated framework for the systematic screening of entire river networks (widths > 40 m), facilitating the prioritization of reaches that require granular, high-resolution investigation. Moreover, our findings underscore that while extreme events drive dominant morphological changes, long-term stability depends on the delicate balance between natural resilience and anthropogenic pressures. Managing these systems as dynamic trajectories rather than static entities is essential; specifically, reducing artificial constraints in transitional zones is vital for maintaining natural processes and enhancing flood risk mitigation in Alpine environments. By linking current geomorphic evaluations to medium-term evolutionary trajectories, our approach provides a rigorous, up-to-date understanding of channel adjustments, moving from sporadic, labor-intensive assessments toward a dynamic, almost near-real-time monitoring framework. The effective implementation of such a framework, in alignment with the Water Framework Directive and Floods Directive objectives, necessitates a multidisciplinary synergy between public administrations, the scientific community, and the technological sector.

Supplementary Materials

The following supporting information can be downloaded at: https://www.mdpi.com/article/10.3390/rs18162792/s1, Table S1: Results of the various calibration and validation experiments using the drone and RGB-Sentinel-2 (RGB-S2) ground truth datasets for the Random Forest classifier; Table S2: Performance of Exp. #5 classifier across the three classes identified as water, sediment, and vegetation; Figure S1: The relative importance of each Sentinel-2 band used as a predictor within Exp. #5 classifier, expressed via the Mean Decrease Impurity (MDI) metric, on the y axis; Table S3: Measurements obtained for estimating lateral erosion (bank retreat rate and length of eroded banks) per river reach, aggregated by morphological class. The corresponding errors (absolute and relative errors) are reported for both the automatic and manual procedure, for the three-step size tested in the manual transect method application; Table S4: Summary of the main geomorphometric parameters of the 16 Sesia River reaches, including slope, length, sinuosity, braiding and anastomosing indices, bar coverage, active channel area, and channel width for 2019, 2021, and 2024. References [29,60] are cited in the Supplementary Materials.

Author Contributions

Conceptualization, G.M., D.S., C.G. (Claudia Giampani) and B.L.; Methodology, G.M., D.S., C.G. (Claudia Giampani), M.C., C.G. (Chiara Girelli), M.M. and E.P.; Software, G.M., D.S. and M.C.; Validation, G.M., D.S., C.G. (Claudia Giampani), M.C., C.G. (Chiara Girelli), M.M. and E.P.; Formal analysis, G.M., D.S. and M.C.; Investigation, G.M., D.S., C.G. (Claudia Giampani), M.C., C.G. (Chiara Girelli), M.M. and E.P.; Resources, C.G. (Claudia Giampani), C.G. (Chiara Girelli), M.M. and E.P.; Data curation, G.M., D.S., M.C. and C.G. (Claudia Giampani); Writing—original draft, G.M., D.S., C.G. (Claudia Giampani) and M.M.; Writing—review & editing, G.M., D.S., C.G. (Claudia Giampani), M.M., M.C., S.M. and M.B.; Visualization, D.S., C.G. (Claudia Giampani) and M.M.; Supervision, B.L., S.M. and M.B.; Project administration, G.M., S.M. and M.B.; Funding acquisition, S.M. and M.B. All authors have read and agreed to the published version of the manuscript.

Funding

This research was funded by the Italian Ministry of Environment and Energy Security in the context of the Piano Operativo Ambiente, under the Fondo Sviluppo e Coesione (FSC) 2014–2020.

Data Availability Statement

The original contributions presented in this study are included in the article/Supplementary Material. Further inquiries can be directed to the corresponding author.

Acknowledgments

This study was conducted in the context of a collaboration scientific agreement between ISPRA and ARPA Piemonte, in the framework of the Italian project named “RasPo-Rete ambientale Strategica del distretto del fiume Po” (Po River Basin District’s Strategic Environmental Network). This research utilizes the satellite-based tool developed within the framework of the “IRIS: Italian Research and development Initiative for Spaceborne river monitoring” (2017–2021). The initiative was coordinated by ISPRA, with the participation of the Politecnico di Milano and Durham University and funded by the ASI (Italian Space Agency) and ISPRA under the “Sentinel Collaborative Ground-Segment Thematic Platform for Habitat Mapping”. We wish to express our sincere gratitude to all colleagues involved in the IRIS project, with special thanks to Patrice Carbonneau, Barbara Belletti, Simone Bizzi, Marco Micotti and Federico Filipponi for their invaluable contributions for the Sentinel-2 prototype classifier developed. We also acknowledge the EU Copernicus Programme for Earth Observation that freely provides Sentinel-2 data used in this work.

Conflicts of Interest

Author Davide Salvalaggio was employed by the company Hydrodata S.p.a. The remaining authors declare that the research was conducted in the absence of any commercial or financial relationships that could be construed as a potential conflict of interest.

References

  1. Glassic, H.C.; Al-Chokhachy, R.; Wheaton, J.; Macfarlane, W.W.; Jordan, C.E.; Murphy, B.; Shahverdian, S.; Bennett, S.; Bouwes, N.; Fryirs, K.; et al. Principles of Riverscape Health. Wires Water 2025, 12, e70028. [Google Scholar] [CrossRef] [Scilit]
  2. Alabyan, A.M.; Chalov, R.S. Types of river channel patterns and their natural controls. Earth Surf. Process. Landf. 1998, 23, 467–474. [Google Scholar] [CrossRef]
  3. Belletti, B.; Garcia de Leaniz, C.; Jones, J.; Bizzi, S.; Börger, L.; Segura, G.; Castelletti, A.; van de Bund, W.; Aarestrup, K.; Barry, J.; et al. More than one million barriers fragment Europe’s rivers. Nature 2020, 588, 436–441. [Google Scholar] [CrossRef] [Scilit] [PubMed]
  4. Brenna, A.; Bizzi, S.; Surian, N. How multiple anthropic pressures may lead to unplanned channel patterns: Insights from the evolutionary trajectory of the Po River (Italy). Catena 2024, 234, 107598. [Google Scholar] [CrossRef] [Scilit]
  5. Surian, N.; Rinaldi, M.; Pellegrini, L. Channel adjustments and implications for river management and restoration. Geogr. Fis. Din. Quat. 2011, 34, 145–152. [Google Scholar] [CrossRef] [Scilit]
  6. Nardi, L.; Campo, L.; Rinaldi, M. Quantification of riverbank erosion and application in risk analysis. Nat. Hazards 2013, 69, 869–887. [Google Scholar] [CrossRef] [Scilit]
  7. Zhao, K.; Coco, G.; Gong, Z.; Darby, S.E.; Lanzoni, S.; Xu, F.; Zhang, K.; Townend, I. A Review on Bank Retreat: Mechanisms, Observations, and Modeling. Rev. Geophys. 2022, 60, e2021RG000761. [Google Scholar] [CrossRef] [Scilit]
  8. Aman, M.A.; Chu, H. Long-term river extent dynamics and transition detection using remote sensing: Case studies of Mekong and Ganga River. Sci. Total Environ. 2023, 876, 162774. [Google Scholar] [CrossRef] [Scilit] [PubMed]
  9. Lawler, D.M. The measurement of river bank erosion and lateral channel change: A review. Earth Surf. Processes Landf. 1993, 18, 777–821. [Google Scholar] [CrossRef] [Scilit]
  10. Mandarino, A.; Maerker, M.; Firpo, M. Channel planform changes along the Scrivia River floodplain reach in northwest Italy from 1878 to 2016. Quat. Res. 2018, 91, 620–637. [Google Scholar] [CrossRef] [Scilit]
  11. Thakur, P.K.; Laha, C.; Aggarwal, S.P. River bank erosion hazard study of river Ganga using remote sensing and GIS. Nat. Hazards 2012, 61, 967–987. [Google Scholar] [CrossRef] [Scilit]
  12. Grove, J.; Croke, J.; Thompson, C. Quantifying different riverbank erosion processes during an extreme flood event. Earth Surf. Processes Landf. 2013, 38, 1393–1406. [Google Scholar] [CrossRef] [Scilit]
  13. Piégay, H.; Darby, S.E.; Mosselman, E.; Surian, N. A review of techniques available for delimiting the erodible river corridor: A sustainable approach to managing bank erosion. River Res. Appl. 2005, 21, 773–789. [Google Scholar] [CrossRef] [Scilit]
  14. Rinaldi, M.; Gurnell, A.M.; del Tánago, M.G.; Bussettini, M.; Hendriks, D. Classification of river morphology and hydrology to support management and restoration. Aquat. Sci. 2016, 78, 17–33. [Google Scholar] [CrossRef] [Scilit]
  15. Surian, N.; Rinaldi, M.; Pellegrini, L. Linee Guida per L’analisi Geomorfologica Degli Alvei Fluviali e Delle Loro Tendenze Evolutive; CLEUP: Padova, Italy, 2009. [Google Scholar]
  16. Donovan, M.; Belmont, P. Timescale dependence in river channel migration measurements. Earth Surf. Processes Landf. 2019, 44, 1530–1541. [Google Scholar] [CrossRef] [Scilit]
  17. Greenberg, E.; Chadwick, A.J.; Ganti, V. A generalized area-based framework to quantify river mobility from remotely sensed imagery. J. Geophys. Res. Earth Surf. 2023, 128, e2023JF007189. [Google Scholar] [CrossRef] [Scilit]
  18. Greenberg, E.; Chadwick, A.J.; Li, G.K.; Ganti, V. Quantifying channel mobility and floodplain reworking timescales across river planform morphologies. Geophys. Res. Lett. 2024, 51, e2024GL108537. [Google Scholar] [CrossRef] [Scilit]
  19. Langhorst, T.; Pavelsky, T. Global observations of riverbank erosion and accretion from Landsat imagery. J. Geophys. Res. Earth Surf. 2023, 128, e2022JF006774. [Google Scholar] [CrossRef] [Scilit]
  20. Pekel, J.-F.; Cottam, A.; Gorelick, N.; Belward, A.S. High-resolution mapping of global surface water and its long-term changes. Nature 2016, 540, 418–422. [Google Scholar] [CrossRef] [Scilit] [PubMed]
  21. Chalov, S.R.; Ivanov, V.; Shkolnyi, D.; Pavlyukevich, E.; Habel, M.; Kurakova, A.; Botavin, D.; Chalova, A.; Golovlev, P.; Kamyshev, A.; et al. The Northern Eurasian Riverbank Migration multi-tool dataset (NERM). Earth Syst. Sci. Data 2025, 17, 5615–5639. [Google Scholar] [CrossRef] [Scilit]
  22. Sylvester, Z.; Durkin, P.; Covault, J.A. High curvatures drive river meandering. Geology 2019, 47, 263–266. [Google Scholar] [CrossRef] [Scilit]
  23. Carbonneau, P.E.; Bizzi, S. Global mapping of river sediment bars. Earth Surf. Processes Landf. 2023, 49, 15–23. [Google Scholar] [CrossRef] [Scilit]
  24. Crivellaro, M.; Vitti, A.; Zolezzi, G.; Bertoldi, W. Characterization of Active Riverbed Spatiotemporal Dynamics through the Definition of a Framework for Remote Sensing Procedures. Remote Sens. 2024, 16, 184. [Google Scholar] [CrossRef] [Scilit]
  25. Leenman, A.S.; Eaton, B.C. Remote sensing of laboratory rivers. Earth Surf. Processes Landf. 2024, 49, 58–81. [Google Scholar] [CrossRef] [Scilit]
  26. Bozzolan, E.; Brenna, A.; Surian, N.; Carbonneau, P.; Bizzi, S. Quantifying the Impact of Spatiotemporal Resolution on the Interpretation of Fluvial Geomorphic Feature Dynamics From Sentinel 2 Imagery: An Application on a Braided River Reach in Northern Italy. Water Resour. Res. 2023, 59, e2023WR034699. [Google Scholar] [CrossRef] [Scilit]
  27. Cavallo, C.; Papa, M.N.; Negro, G.; Gargiulo, M.; Ruello, G.; Vezza, P. Exploiting Sentinel-2 dataset to assess flow intermittency in non-perennial rivers. Sci. Rep. 2022, 12, 21756. [Google Scholar] [CrossRef] [Scilit] [PubMed]
  28. Nones, M.; Guerrero, M.; Schippa, L.; Cavalieri, I. Remote sensing assessment of anthropogenic and climate variation effects on river channel morphology and vegetation. Earth Surf. Processes Landf. 2024, 49, 1632–1652. [Google Scholar] [CrossRef] [Scilit]
  29. Carbonneau, P.E.; Belletti, B.; Micotti, M.; Lastoria, B.; Casaioli, M.; Mariani, S.; Marchetti, G.; Bizzi, S. UAV-based training for fully fuzzy classification of Sentinel-2 fluvial scenes. Earth Surf. Process. Landf. 2020, 45, 3120–3140. [Google Scholar] [CrossRef] [Scilit]
  30. Freihardt, J.; Frey, O. Assessing riverbank erosion in Bangladesh using time series of Sentinel-1 radar imagery in the Google Earth Engine. Nat. Hazards Earth Syst. Sci. 2023, 23, 751–770. [Google Scholar] [CrossRef] [Scilit]
  31. Rossi, D.; Zolezzi, G.; Bertoldi, W.; Vitti, A. Monitoring Braided River-Bed Dynamics at the Sub-Event Time Scale Using Time Series of Sentinel-1 SAR Imagery. Remote Sens. 2023, 15, 3622. [Google Scholar] [CrossRef] [Scilit]
  32. Rinaldi, M.; Surian, N.; Comiti, F.; Bussettini, M. A methodological framework for hydromorphological assessment, analysis and monitoring (IDRAIM) aimed at promoting integrated river management. Geomorphology 2015, 251, 122–136. [Google Scholar] [CrossRef] [Scilit]
  33. Gurnell, A.M.; Rinaldi, M.; Belletti, B.; Bizzi, S.; Blamauer, B.; Braca, G.; Buijse, A.D.; Bussettini, M.; Camenen, B.; Comiti, F.; et al. A multi-scale hierarchical framework for developing understanding of river behaviour to support river management. Aquat. Sci. 2016, 78, 1–16. [Google Scholar] [CrossRef] [Scilit]
  34. Rinaldi, M.; Belletti, B.; Bussettini, M.; Comiti, F.; Golfieri, B.; Lastoria, B.; Marchese, E.; Nardi, L.; Surian, N. New tools for the hydromorphological assessment and monitoring of European streams. J. Environ. Manag. 2017, 202, 363–378. [Google Scholar] [CrossRef] [Scilit] [PubMed]
  35. Brenna, A.; Bizzi, S.; Surian, N. A width-based approach to estimating historical changes in coarse sediment fluxes at river reach and network scales. Earth Surf. Processes Landf. 2022, 47, 2560–2579. [Google Scholar] [CrossRef] [Scilit]
  36. Qin, C.; Zheng, F.; Wells, R.R.; Xu, X.; Wang, B.; Zhong, K. A laboratory study of channel sidewall expansion in upland concentrated flows. Soil Tillage Res. 2018, 178, 22–31. [Google Scholar] [CrossRef] [Scilit]
  37. Scorpio, V.; Comiti, F.; Liébault, F.; Piegay, H.; Rinaldi, M.; Surian, N. Channel changes over the last 200 years: A meta data analysis on European rivers. Earth Surf. Processes Landf. 2024, 49, 2651–2676. [Google Scholar] [CrossRef] [Scilit]
  38. Falletti, P.; Giampani, C.; Girelli, C. Itinerari Geologici in Piemonte; ARPA Piemonte: Torino, Italy, 2007. [Google Scholar]
  39. Manfreda, S.; Miglino, D.; Saddi, K.C.; Jomaa, S.; Eltner, A.; Perks, M.; Peña-Haro, S.; Bogaard, T.; van Emmerik, T.H.; Mariani, S.; et al. Advancing river monitoring using image-based techniques: Challenges and opportunities. Hydrol. Sci. J. 2024, 69, 657–677. [Google Scholar] [CrossRef] [Scilit]
  40. Belletti, B.; Rinaldi, M.; Bussettini, M.; Comiti, F.; Gurnell, A.M.; Mao, L.; Nardi, L.; Vezza, P. Characterising physical habitats and fluvial hydromorphology: A new system for the survey and classification of river geomorphic units. Geomorphology 2017, 283, 143–157. [Google Scholar] [CrossRef] [Scilit]
  41. Lonjou, V.; Desjardins, C.; Hagolle, O.; Petrucci, B.; Tremas, T.; Dejus, M.; Makarau, A.; Auer, S. MACCS-ATCOR joint algorithm (MAJA). In Proceedings of the SPIE 10001, Remote Sensing of Clouds and the Atmosphere XXI, Edinburgh, UK, 28–29 September 2016. [Google Scholar] [CrossRef] [Scilit]
  42. Liébault, F.; Piégay, H. Causes of 20th century channel narrowing in mountain and piedmont rivers of southeastern France. Earth Surf. Processes Landf. 2002, 27, 425–444. [Google Scholar] [CrossRef] [Scilit]
  43. Bozzolan, E.; Matteligh, E.; Brenna, A.; Cecchetto, M.; Surian, N.; Carbonneau, P.; Bizzi, S. Enhancing active channel delineation in alluvial rivers using monthly aggregation of Sentinel-2 imagery. Earth Space Sci. 2026, 13, e2025EA004642. [Google Scholar] [CrossRef] [Scilit]
  44. Cecchetto, M.; Bozzolan, E.; Brenna, A.; Doolaeghe, D.; Taffetani, E.; Surian, N.; Bertoldi, W.; Bizzi, S. Beyond water: Mapping sediment bars to enhance satellite monitoring of river dynamics. Geophys. Res. Lett. 2026, 53, e2025GL119584. [Google Scholar] [CrossRef] [Scilit]
  45. Surian, N.; Rinaldi, M. Morphological response to river engineering and management in alluvial channels in Italy. Geomorphology 2003, 50, 307–326. [Google Scholar] [CrossRef] [Scilit]
  46. Carbonneau, P.E. Global Semantic Classification of Fluvial Landscapes with Attention-Based Deep Learning. Remote Sens. 2024, 16, 4747. [Google Scholar] [CrossRef] [Scilit]
  47. Luino, F. (Ed.) L’evento Alluvionale del 2–3 Ottobre 2020 in Piemonte; Geologia dell’Ambiente, Supplemento al n. 4/2021; Società Italiana di Geologia Ambientale (SIGEA): Rome, Italy, 2021; Available online: https://hdl.handle.net/20.500.14243/456621 (accessed on 3 March 2025).
  48. Bertoldi, W.; Zanoni, L.; Tubino, M. Assessment of morphological changes induced by flow and flood pulses in a gravel bed braided river: The Tagliamento River (Italy). Geomorphology 2010, 114, 348–360. [Google Scholar] [CrossRef] [Scilit]
  49. Costa, J.E.; O’Connor, J.E. Geomorphically effective floods. In Natural and Anthropogenic Influences in Fluvial Geomorphology; Geophysical Monograph Series; American Geophysical Union: Washington, DC, USA, 1995; Volume 89, pp. 45–56. [Google Scholar] [CrossRef] [Scilit]
  50. Ruiz-Villanueva, V.; Piégay, H.; Scorpio, V.; Bachmann, A.; Brousse, G.; Cavalli, M.; Comiti, F.; Crema, S.; Fernández, E.; Furdada, G.; et al. River widening in mountain and foothill areas during floods: Insights from a meta-analysis of 51 European Rivers. Sci. Total Environ. 2023, 903, 166103. [Google Scholar] [CrossRef] [Scilit] [PubMed]
  51. Scorpio, V.; Comiti, F. Channel changes during and after extreme floods in two catchments of the Northern Apennines (Italy). Geomorphology 2024, 463, 109355. [Google Scholar] [CrossRef] [Scilit]
  52. Filipponi, F.; Colazzo, G.; Vassoney, E.; Comoglio, C.; Filippa, G. Sentinel-2 Reveals Record-Breaking Po River Shrinking Due to Severe Drought in 2022. Remote Sens. 2025, 17, 1070. [Google Scholar] [CrossRef] [Scilit]
  53. Camporeale, C.; Perucca, E.; Ridolfi, L.; Gurnell, A.M. Modeling the interactions between river morphodynamics and riparian vegetation. Rev. Geophys. 2013, 51, 379–414. [Google Scholar] [CrossRef] [Scilit]
  54. Picco, L.; Pellegrini, G.; Iroumé, A.; Lenzi, M.A.; Rainato, R. The role of in-channel vegetation in driving and controlling the geomorphic changes along a gravel-bed river. Geomorphology 2023, 437, 108803. [Google Scholar] [CrossRef] [Scilit]
  55. Delai, F.; Moretto, J.; Picco, L.; Rigon, E.; Ravazzolo, D.; Lenzi, M.A. Analysis of morphological processes in a disturbed gravel-bed river (Piave River): Integration of LiDAR data and colour bathymetry. J. Civ. Eng. Archit. 2014, 8, 639–648. [Google Scholar] [CrossRef] [Scilit][Green Version]
  56. Simon, A.; Curini, A.; Darby, S.E.; Langendoen, E.J. Bank and near-bank processes in an incised channel. Geomorphology 2000, 35, 193–217. [Google Scholar] [CrossRef] [Scilit]
  57. ASCE Task Committee on Hydraulics, Bank Mechanics, and Modeling of River Width Adjustment. J. Hydraul. Eng. 1998, 124, 881–902.
  58. Zolezzi, G.; Luchi, R.; Tubino, M. Modeling morphodynamic processes in meandering rivers with spatial width variations. Rev. Geophys. 2012, 50, RG4005. [Google Scholar] [CrossRef] [Scilit]
  59. Zhao, K.; Lanzoni, S.; Coco, G.; Xu, F.; Zhang, K.; Gong, Z. Variability in alluvial river width driven by intermittent bank collapse. Proc. Natl. Acad. Sci. USA 2026, 123, e2525442123. [Google Scholar] [CrossRef] [Scilit] [PubMed]
  60. Louppe, G.; Wehenkel, L.; Sutera, A.; Geurts, P. Understanding variable importances in forests of randomized trees. Adv. Neural Inf. Process. Syst. 2013, 26. [Google Scholar]
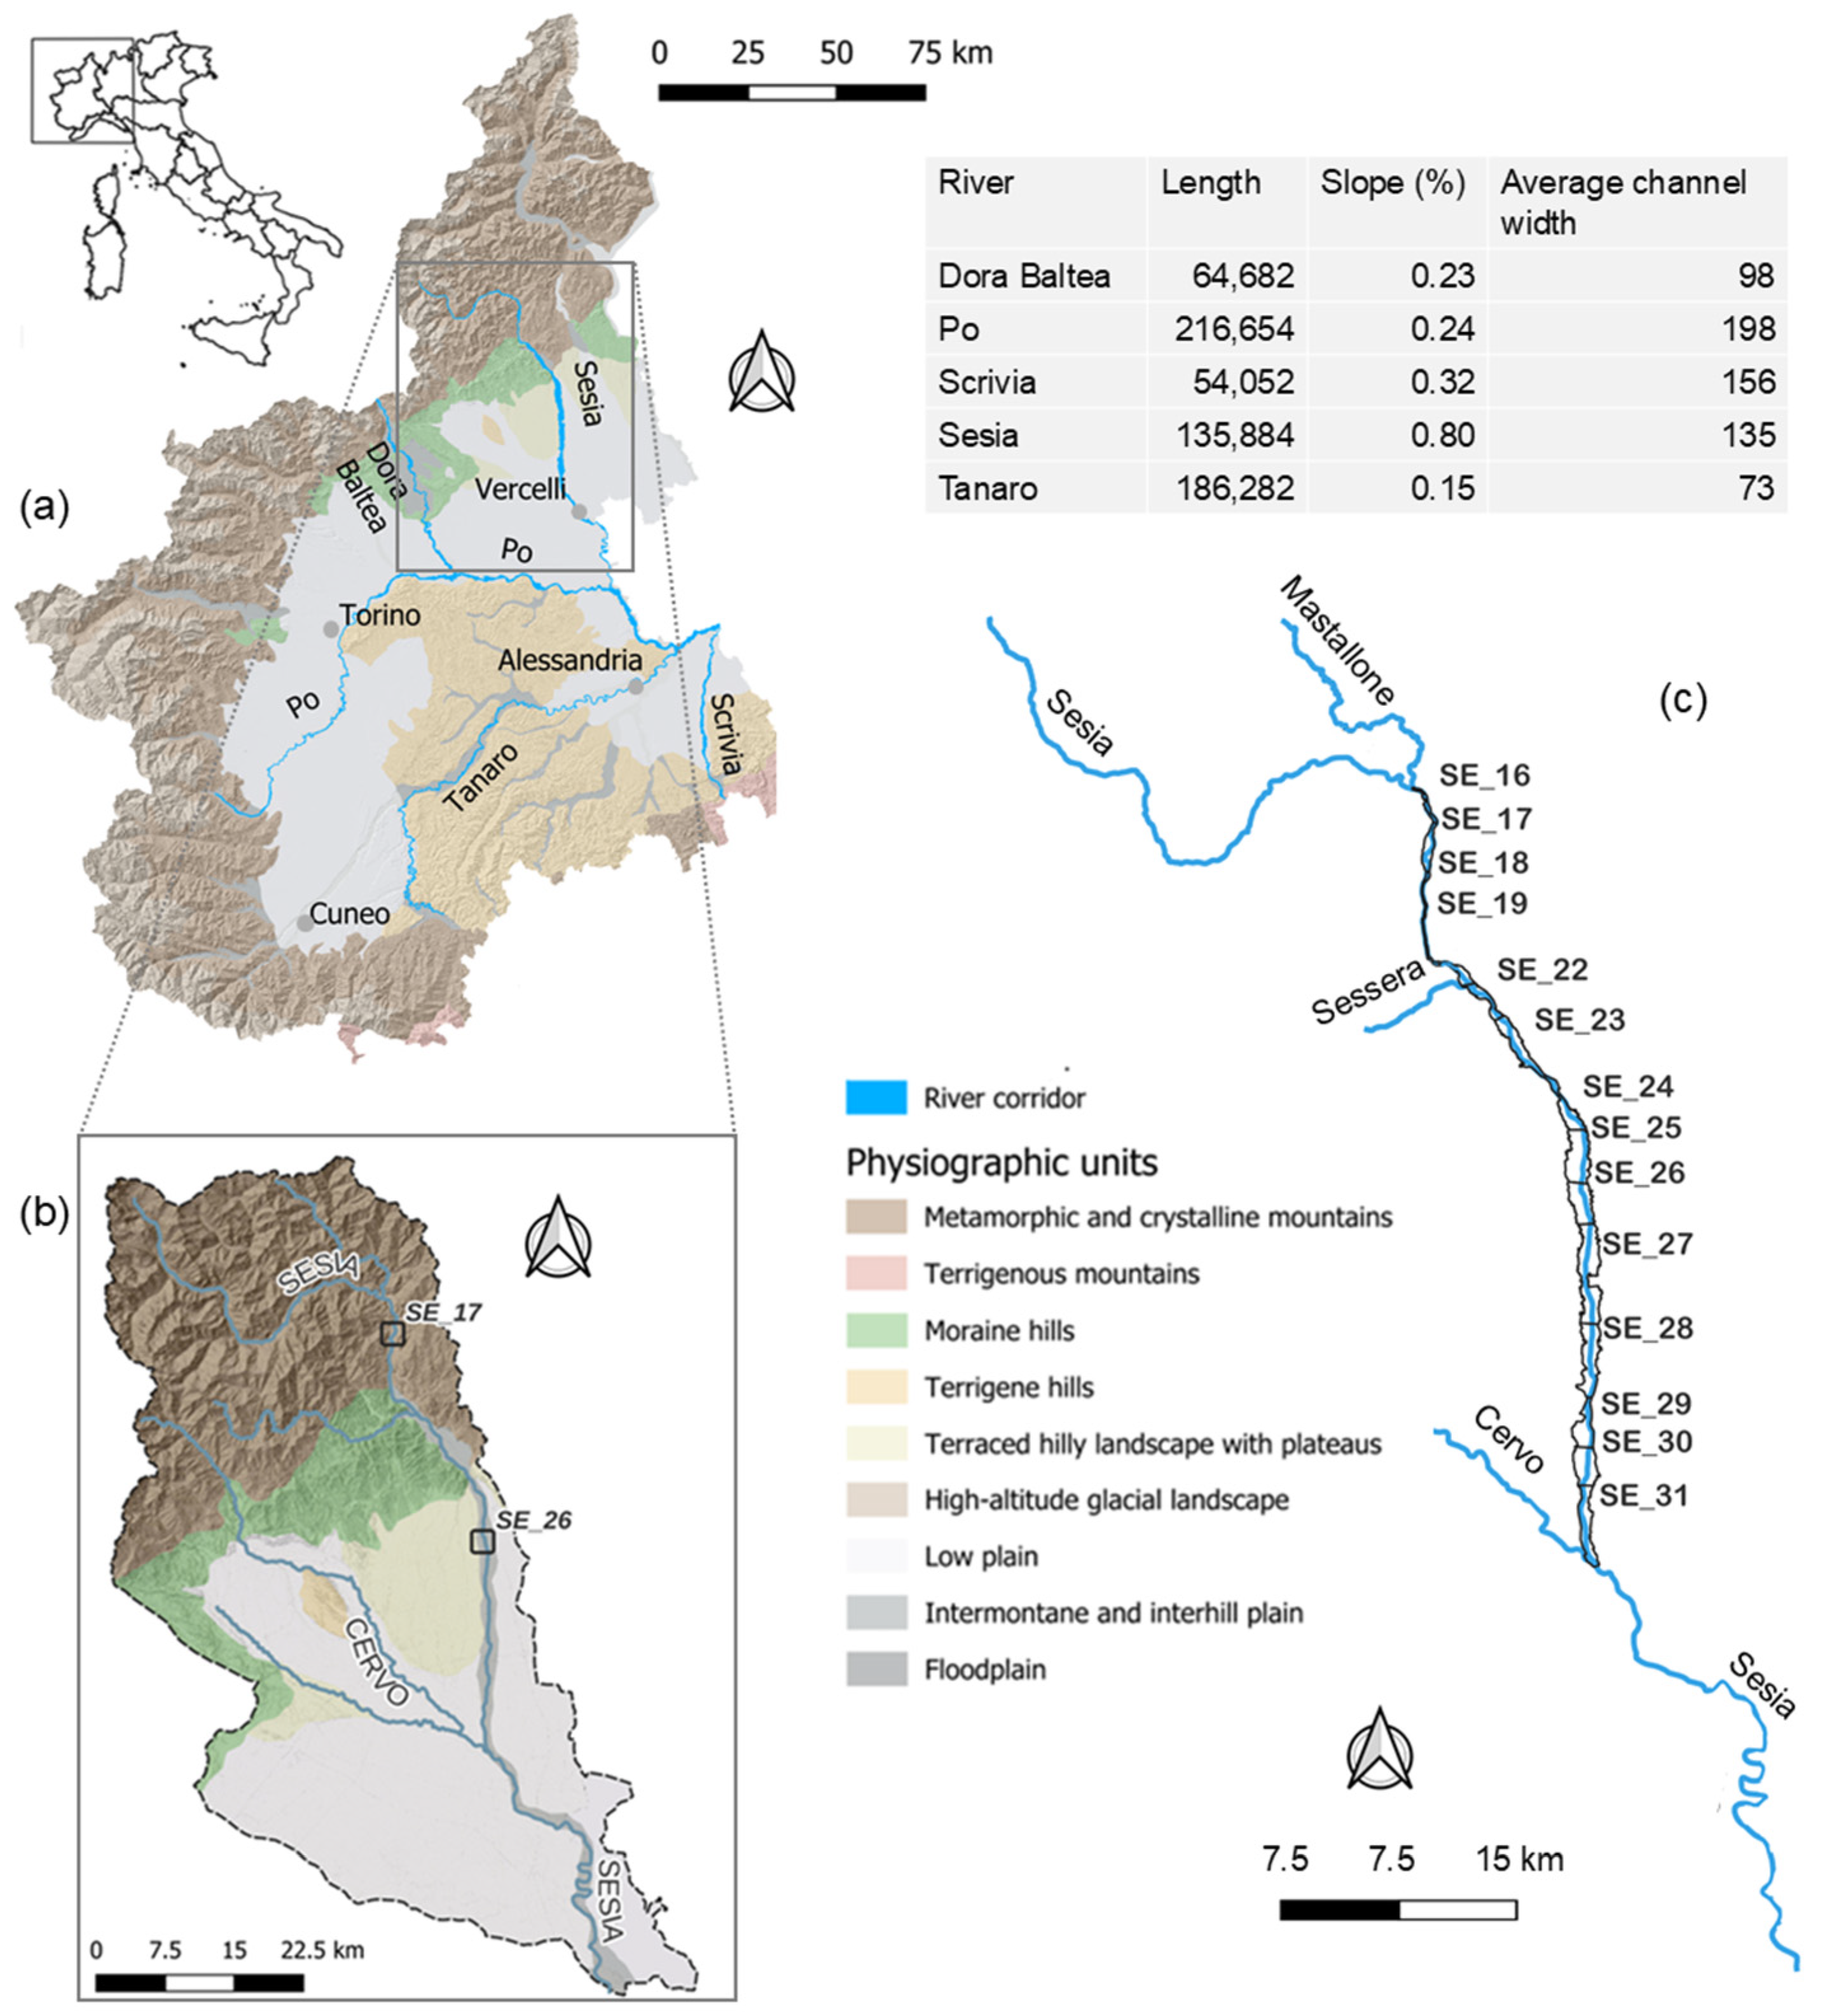
Figure 1. Map of the river network featuring the five case studies, their corresponding physiographic units, and the major cities in the Piedmont region located along their banks (a); the accompanying table reports the length, slope, and average channel width of each river. The Sesia River basin, which serves as the primary case study, highlights the contribution of key tributaries and the locations (black squares) of reaches SE_17 and SE_26, which are detailed in the results and discussion sections (b). Downstream spatial distribution of all analyzed reaches along the Sesia River (c).
Remotesensing 18 02792 g001
Figure 2. Workflow for island identification and yearly active channel delineation for SE_27 and SE_28 Sesia River reaches, in 2021. Input 1, composed of four bands, is the annual filtered raster resulting from the application of the combination of frequency thresholds selected for each membership. Input 2 is obtained via the thresholding of the vegetation frequency map (≥0.82) (a), the identification of surrounded non-vegetated areas (b), differentiated labeling of holes, and the final classification of fluvial islands (Class 5) (c). The yearly active channel is composed of 5 bands corresponding to classes 1, 2, 3, 4 and 5 in Output.
Remotesensing 18 02792 g002
Figure 3. Manual and automatic methodological procedures used to assess the bank retreat rate. Above, the classified rasters of the river corridor for the year 2020 (a) and for the year 2021 (b) for two reaches of the Sesia River. From these rasters, the yearly active channel (classes 1,2,3,5) was converted into vector polygon in the two years and the transect manual delineation with step size of 0.25 was applied (c1) to identify eroded banks the areas deriving from the difference of the corresponding active channels (c2). Below are the results of the automated pixel-based method for the identification of bank retreat areas (d1) and the length of bank retreated (d2).
Remotesensing 18 02792 g003
Figure 4. Workflow of the retreat area translation procedure for predicting lateral channel mobility: (a) computation of the centroid and its projection onto the river axis; (b) definition of the translation vector (originating at the centroid, perpendicular to the axis, with a magnitude matching the average bank retreat rate); (c) scaling applied using a time-horizon coefficient of 4, showing the resulting predicted erosion geometries from a 1-year to a 10-year projection.
Remotesensing 18 02792 g004
Figure 5. Comparison between manual and automatic methodology for bank retreat rate evaluation. On the x-axis are reported the codes of each river reach used in the validation (Table 1), grouped by morphological type; on the y-axis, the bank retreat rate (m/yr) measured, respectively, with the standard manual methodology exploiting three transects step size, and the automatic pixels-based method, exploiting classified satellite images.
Remotesensing 18 02792 g005
Figure 6. Scatter plot of values measured using the automatic method compared to the manual reference, with a 0.25 step size, showing (a) bank retreat rate and (b) percentage of retreat banks. The gray dotted line represents perfect agreement (bisector, y = x). The Concordance Correlation Coefficient (CCC) indicates the agreement between the two sets of measurements.
Remotesensing 18 02792 g006
Figure 7. Yearly bank retreat measured automatically from Sentinel-2 at the reach scale; different colors refer to different years. Black squares indicate the maximum value of bank retreat measured for each river reach. The red line with square markers indicates the decadal average bank retreat rate measured between 2016 and 2024 at the reach scale.
Remotesensing 18 02792 g007
Figure 8. Examples (a,b) of the overlap between the areas predicted to be eroded in 2025 (green areas) and the effective eroded areas (purple areas), manually delineated by comparing the images before and after the 2025 flood event. The main river infrastructures are also reported as additional layer for evaluation. Histogram (c) displays the minimum distance between each observed eroded bank and the predicted 2025 erosion area, along the Sesia River reaches under investigation.
Remotesensing 18 02792 g008
Figure 9. The graphs show the temporal evolution of macro-unit percentages (water, sediment, and vegetation) within the river corridor for reaches SE_17 (a) and SE_26 (b). Superimposed on the same plots are a time series of mean daily discharge, monthly maximum mean discharge, and observed instantaneous peak flows. The two images on the right depict a section of reach SE_17 before (a) and after (photograph provided by the Piedmont region) (b) the 2020 flood event. Note the significant increase in channel width and the extensive bank erosion that affected areas previously used as airstrip. Gaps in the time series represent periods of missing Sentinel-2 data, primarily due to cloud interference or acquisition issues.
Remotesensing 18 02792 g009
Figure 10. Intersection of the 10-year erosion forecasts (in red light color) with land-use (Piedmont Region Cartographic Base BDTRE 2025) and hydraulic infrastructure datasets (BDTRE and GEmMA, ARPA Piemonte). In green and violet colors are indicated those buildings of the urban area of Isola-Borgosesia (SE 20) that, despite the presence of bank protection structures, would be potentially affected by lateral erosion.
Remotesensing 18 02792 g010
Table 1. Codes, dates, and river types of the validation dataset used for the manual measurement of bank retreat and length of eroded banks.
River NameReach CodeYearsType
Dora BalteaDO_10, DO_112019–2021W, S
SesiaSE_17, SE_24, SE_25, SE_262018–2021 and 2020–2021SBA, W
PoPO_24, PO_28, PO_382018–2021SBA, W
ScriviaSC_12, SC_132016–2017, 2017–2019, 2019–2020, and 2019–2021SBA
TanaroTA_10, TA_142016–2017 and 2018–2021S
Table 2. Obtained manual and automatic mean values, Mean Absolute Deviation (MAD) and Relative Error (RE), expressed by river type for bank retreat and the percentage of eroded banks, with a 0.25 transect step size.
Bank Retreat (m/yr)Percentage of Eroded Banks (%)
River TypeMean Value–Manual
(m)
Mean Value–Automatic
(m)
MAD
(m)
Relative ErrorMean Value–ManualMean Value–AutomaticMADRelative Error
S11.9410.233.04256.31%8.88%2.57%41%
SBA16.9914.512.6816%16.54%14.79%5.28%32%
W12.6511.802.0316%22.96%19.22%3.74%16%
ALL14.9612.982.6418%15.32%14.23%4.34%28%
Table 3. The table reports the bank retreat rates calculated from satellite data for the 16 reaches of the Sesia River, on a yearly basis from 2016 to 2024 and the average (AVG) rate. Additional information on the percentages of bank-proximal defences (BD) (levees or bank protections), the Physiographyc Unit (PU) and the channel types (inferred from AGEA 2015 aerial photographs and Google Satellite 2024 imagery) are also reported.
Bank Retreat
ReachPUType 2015Type 2024BD (%)2016–20172017–
2018
2018–
2019
2019–
2020
2020–
2021
2021–
2022
2022–
2023
2023–
2024
AVG
Rate
(m)
Mastallone Stream confluence
SE_16MSS2910.4110.9712.1811.2729.0512.3812.1912.2713.84
SE_17MABSS1011.6510.9311.8611.2126.1812.3910.8311.4813.32
SE_18MSTST2410.0810.1610.9210.9514.850.0010.4210.859.78
SE_19MSCCSCC1810.6110.7810.410.4210.740.009.8710.839.21
SE_20IPWW6511.7410.6311.3810.7723.7211.9910.411.4812.76
SE_21IPSTST013.410.6812.2411.8313.160.0010.7211.6810.46
Sessera Stream confluence
SE_22IPABSABS2620.0711.521311.4426.680.0011.7812.6213.39
SE_23IPWABS1710.8710.8814.0411.8525.1411.4911.1913.2313.59
SE_24LPABSS4112.2111.2312.3910.9521.910.1911.8112.7912.93
SE_25LPWW2311.2210.6612.8311.1520.710.8410.2112.6812.54
SE_26LPABSS311.4210.8423.0220.332.7610.6710.5411.8316.42
SE_27LPWW4614.4213.5521.9318.118.769.7711.3414.9915.36
SE_28LPBABS2811.9411.6517.7517.8218.6812.3510.4516.3314.62
SE_29LPABSW6912.7710.4712.7212.828.220.0011.1313.5612.71
SE_30LPWB818.8713.7124.5419.3916.1510.2516.4617.5717.12
SE_31LPABSS2217.511.8623.0920.3320.7812.9111.7815.4216.71
(M) mountain; (IP) intermontane plain; (LP) low plain; (ST) Straight; (S) sinuous;(W) wandering; (B) braided; (ABS) alternate-bar sinuous channel; (SCC) single-thread confined channel. Color scale: Dark shading = high values; light shading = low values.
Disclaimer/Publisher’s Note: The statements, opinions and data contained in all publications are solely those of the individual author(s) and contributor(s) and not of MDPI and/or the editor(s). MDPI and/or the editor(s) disclaim responsibility for any injury to people or property resulting from any ideas, methods, instructions or products referred to in the content.