1. Introduction
With the expansion of transportation infrastructure, China’s total highway mileage has become the largest in the world [
1]. This progress, however, has been accompanied by the frequent emergence of pavement distress; the sheer length of roadways renders maintenance exceptionally challenging, and routine distress inspection consumes considerable human and material resources. In engineering practice, such inspection typically relies on two complementary modalities. The first is ground-level close-range inspection using maintenance vehicles or motorcycles as carriers, which yields high-resolution images rich in crack detail. The second is a wide-area aerial survey employing UAVs as platforms, capable of rapidly covering extensive road segments and identifying conspicuous distress zones [
2,
3]. These two modalities differ fundamentally in imaging viewpoint, object scale, and background complexity. From the ground viewpoint, crack textures are clearly resolved but the field of view is constrained; from the drone viewpoint, coverage is broad yet targets are small in scale and susceptible to interference from illumination variations and shadows [
4,
5]. Similar distribution discrepancy problems have also been observed in multi-source remote sensing applications, where different acquisition conditions or sensing modalities introduce heterogeneous feature characteristics. Recent studies have explored adaptive representation strategies to improve the robustness of models under such heterogeneous inputs by reducing modality-related feature variations [
6]. Feature-alignment methods such as DANN [
7], JAN [
8], and ADDA [
9] attempt to close this gap by learning domain-invariant representations, but their adversarial training protocols prove sensitive to dataset scale and hyperparameter configuration, and their performance can degrade sharply when the source domain contains limited training samples. In this paper, we term this phenomenon the Mixed-View Domain Gap, which constitutes the central challenge in realizing cooperative multi-platform inspection.
From the perspective of detection target characteristics, pavement distresses themselves exhibit pronounced morphological diversity and class imbalance [
10]. Longitudinal and transverse cracks are typically elongated strip-like features that occupy an extremely small proportion of an image—with a median normalized area of approximately 0.3%—and are highly susceptible to feature signal loss during deep convolution [
11]; Alligator cracking presents as irregular textures with an interwoven, reticulated pattern, characterized by indistinct boundaries and a tendency to be confused with traces of pavement repair. Potholes, despite being relatively conspicuous as targets, occur infrequently and thus constitute a representative few-shot category. Repaired regions closely resemble intact pavement in both texture and color, yet exhibit a co-occurrence relationship with crack-type distresses, thereby introducing additional detection ambiguity [
12]. The five aforementioned distress categories differ markedly in scale distribution, shape characteristics, and inter-class similarity, collectively demanding that a detection model simultaneously possess fine-grained feature extraction capability, multi-scale receptive field coverage, and the capacity to disentangle inter-class features.
Existing pavement crack detection methods can be categorized into three stages according to their technical paradigm. Early approaches were predominantly grounded in traditional image processing, extracting geometric features of crack regions through edge detection operators (e.g., Canny, Sobel) or threshold-based segmentation methods (e.g., Otsu) [
13,
14]. These methods operate on the premise that cracks appear as dark linear structures, an oversimplification that fails when the task expands to transverse cracks, longitudinal cracks, alligator cracking, potholes, and repairs. These categories exhibit pronounced heterogeneity along three dimensions: morphology (linear, reticulated, and block-like patterns), scale (ranging from millimeter-level hairline fissures to decimeter-level potholes), and texture (rough depressed surfaces versus smooth patched areas). Such a widely dispersed feature space cannot be simultaneously captured by fixed, hand-crafted rules; moreover, these methods are highly sensitive to disturbances such as uneven illumination, oil stains, and road markings, resulting in limited generalization capacity.
Subsequent machine-learning-based methods introduced statistical learning frameworks such as support vector machines (SVM) and random forests [
15,
16]; however, these approaches remained contingent on hand-crafted feature engineering—designers were required to pre-specify what constitutes a discriminative feature. The inter-class similarity across multiple distress categories (e.g., the textural resemblance between alligator cracking and block cracking) and the intra-class variability (e.g., the pronounced morphological divergence of the same crack type under different degrees of wear) jointly render the manual construction of a sufficiently separable high-dimensional representation exceedingly difficult.
In recent years, deep-learning-based methods have achieved substantial progress in this domain by virtue of their end-to-end automatic feature learning capability [
17,
18]. Faster R-CNN, as a representative two-stage detector, first generates region proposals through a region proposal network (RPN) and subsequently performs classification and regression on these proposals, yielding high localization accuracy; however, its serial architecture leads to comparatively slow inference speed [
19]. SSD circumvents the proposal generation step by directly predicting objects across multiple feature maps at different scales, thereby achieving faster inference, yet its recall for fine cracks remains insufficient [
20]. RetinaNet introduces Focal Loss to effectively mitigate the foreground–background class imbalance; nevertheless, its anchor box design still requires manual pre-specification [
21]. FCOS dispenses with the anchor mechanism entirely, but its centerness branch operates under the assumption that the central region of a target yields a clear semantic response—an assumption that is compromised in the case of pavement cracks, whose frequently irregular and elongated shapes give rise to ambiguous center region definitions [
22].
Among recent advances in single-stage detectors, the YOLO series has emerged as the preferred choice for industrial deployment, owing to its superior balance between accuracy and speed [
23]. YOLOv5 has been widely adopted by virtue of its mature engineering ecosystem [
24], although its C3 module offers limited capability in multi-scale feature fusion. YOLOv8 introduces the C2f module, which improves feature extraction efficiency [
25], yet exhibits suboptimal recall for extremely small objects at the nano scale. YOLOv10 proposes NMS-free consistent matching training [
26]; however, the stability of this approach on small- to medium-scale datasets remains a subject of debate. YOLOv26 [
27]—the most recent iteration—continues to advance performance on general-purpose benchmarks, but the effectiveness of its intricate attention mechanisms on crack datasets has yet to be thoroughly validated. YOLOv11 incorporates systematic optimizations across several key components, namely the C3k2 module (cross-stage partial connection with multi-scale convolutional branch fusion), the SPPF module (cascaded pooling for spatial context aggregation), and the C2PSA attention mechanism, thereby achieving a favorable trade-off between model compactness and detection accuracy [
28].
This paper adopts YOLOv11n as the baseline model based on the following four considerations. First, the C3k2 module, through its fusion design of cross-stage partial connections and multi-scale convolutional branches, achieves complementary extraction of multi-scale distress features under a constraint of merely approximately 2.6M parameters, which facilitates simultaneous coverage of the scale spectrum spanning small drone targets and near-field ground-level objects. Second, the SPPF module efficiently aggregates multi-granularity spatial context via cascaded pooling, thereby aiding the suppression of background interference—such as oil stains and road markings—when leveraging global information from the ground viewpoint. Third, the C2PSA attention mechanism enhances the model’s perceptual weighting of critical crack regions without incurring notable inference overhead, exerting a positive effect on the detection of low-contrast cracks. Fourth, as a mature version within the Ultralytics ecosystem that has undergone extensive community validation, YOLOv11n surpasses more recent experimental iterations in terms of training stability, multi-platform deployment support, and the accumulated body of hyperparameter tuning experience, all of which are conducive to the reproducibility and practical deployment of subsequent improvements.
To address the aforementioned Mixed-View Domain Gap, this paper proposes a crack detection framework termed VCDH-Net (Viewpoint-Conditioned Dual-Head Network), which implements progressive improvements across three levels—architecture, feature, and detail:
(1) Viewpoint-Conditioned Dual-Head Detection (VCDH). Built on top of a shared Backbone and Neck, this architecture introduces a lightweight viewpoint classifier (view head, 16.6 K parameters) along with two parallel viewpoint-specific detection heads (Drone Head and Ground Head). During training, the detection loss is routed according to the viewpoint label, compelling each head to learn exclusively from data acquired under its corresponding viewpoint. At inference, the view head automatically predicts the viewpoint and routes the features to the appropriate detection head, thereby eliminating any need for manual annotation. VCDH achieves parameter efficiency by sharing backbone feature extraction while attaining viewpoint adaptation through head specialization, addressing the Mixed-View Domain Gap at the architectural level.
(2) Lightweight Structure Enhancement (LSE). Cracks are inherently elongated linear structures, for which standard convolution kernels (3 × 3) exhibit limited representational capacity in capturing such geometric patterns. Operating at the two highest-resolution levels of the Neck—namely P3 (80 × 80) and P4 (40 × 40)—LSE extracts directionally sensitive local structural features characteristic of cracks through a four-branch parallel architecture (identity + DW3 × 3 + DW1 × 5 + DW5 × 1) and injects them into the original features via a residual connection. All convolutional layers are zero-initialized, ensuring that the training starting point is equivalent to that of the original model and leaving the COCO pretrained weights undisturbed. LSE leverages geometric priors of cracks rather than data-driven channel selection, contains merely 353 K parameters, and strengthens the representation of elongated cracks at the feature level.
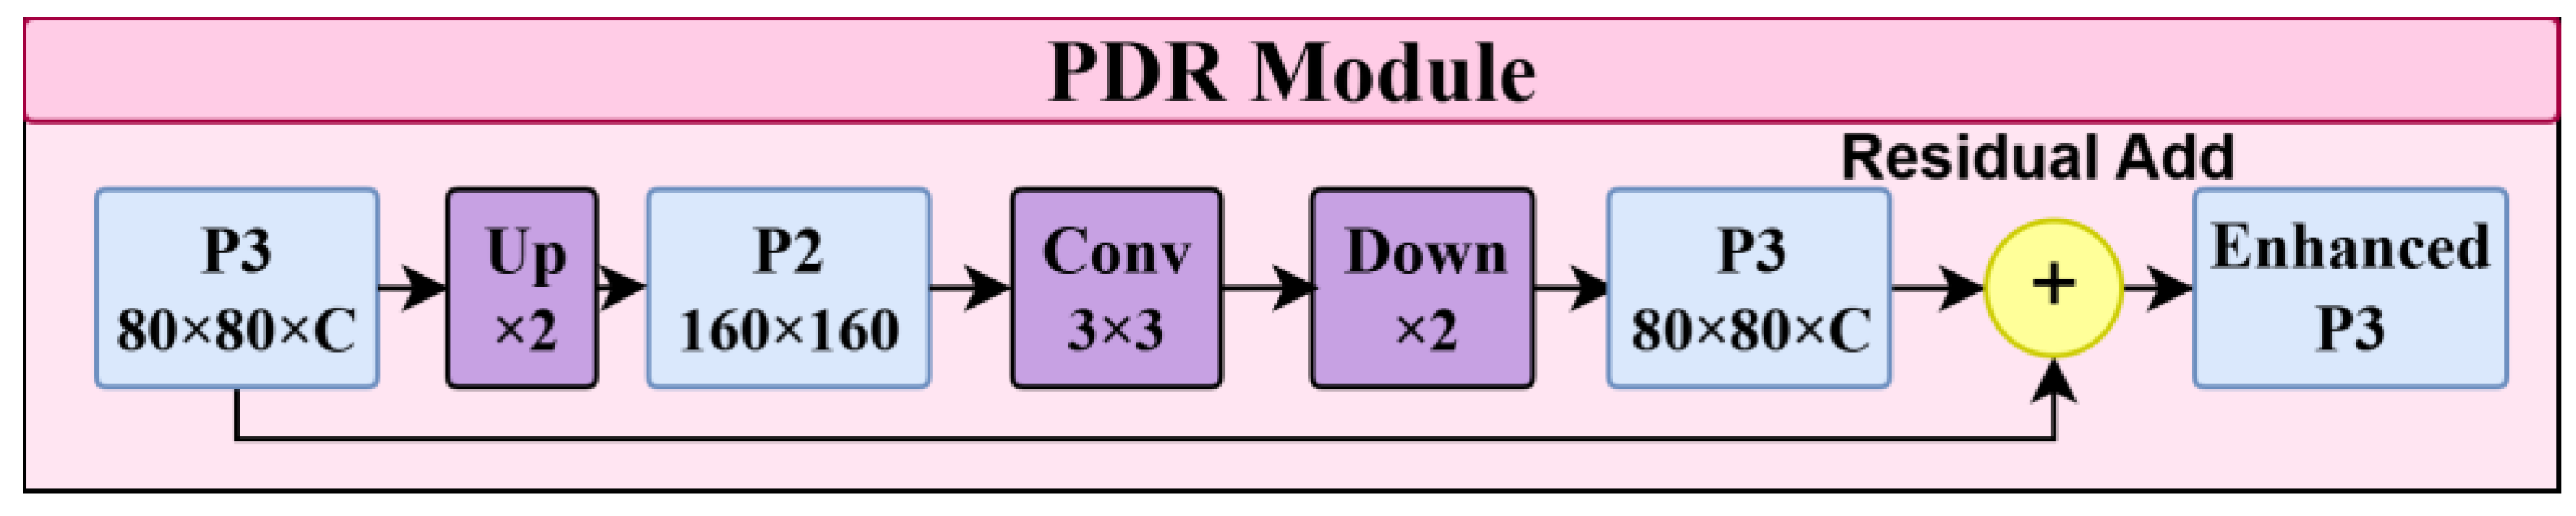
(3) Pyramid Detail Refinement (PDR). Under the drone viewpoint, crack widths frequently fall below 10 pixels, and the P3 level (80 × 80 resolution) remains insufficient to fully preserve their spatial details. PDR upsamples P3 features to the P2 resolution (160 × 160), performs feature enhancement in this high-resolution space, and then downsamples the result back to P3 as a residual supplement—all with only 44 K parameters. This module operates exclusively on the Drone detection branch, providing super-resolution supplementation for small aerial cracks at the detail level without interfering with the Ground branch.
Furthermore, this paper introduces a Cross-Viewpoint Comprehensive evaluation framework (CVCS), which defines three metrics—Cross-View Gap (CV-Gap), Worst-View Score (VWS), and Cross-View Balance (CVB)—to enable multi-dimensional quantitative assessment of the cross-viewpoint robustness of mixed-viewpoint detection models.
The main contributions of this paper are summarized as follows:
A VCDH dual-head detection framework is proposed, addressing the Mixed-View Domain Gap at the architectural level.
An LSE lightweight structure enhancement module is designed, strengthening the geometric representation of cracks at the feature level.
A PDR pyramid detail refinement module is introduced, supplementing the spatial information of small aerial cracks at the detail level.
A CVCS cross-viewpoint evaluation framework is constructed, enabling comprehensive assessment of mixed-viewpoint detection models.
2. Materials and Methods
2.1. RDD 2022 Dataset
2.1.1. Dataset Description
The experimental data used in this study are sourced from the RDD2022 (Road Damage Dataset 2022) [
29], a dataset constructed and publicly released by Arya et al. It encompasses 47,420 pavement images collected across six countries—Japan, India, the Czech Republic, Norway, the United States, and China—and provides annotations for longitudinal cracks (D00), transverse cracks (D10), alligator/reticulated cracks (D20), potholes (D40), and repairs (Repair). A defining characteristic of RDD2022 is its multi-platform, multi-viewpoint acquisition strategy: it includes both ground-level images captured at close range by vehicle-mounted smartphones and overhead images acquired by UAVs, thereby furnishing a foundation for validating model robustness in cross-viewpoint scenarios [
30].
From RDD2022, this paper selects and merges two subsets of consistent provenance. The China_MotorBike subset was acquired using a smartphone mounted on a motorcycle traveling at approximately 30 km/h (original resolution 512 × 512), representing a typical ground-level close-range viewpoint. The China_Drone subset was captured vertically by a three-axis gimbal camera carried on a DJI Matrice 600 Pro hexacopter (original resolution 512 × 512), constituting an overhead drone viewpoint. Both subsets were collected along roads in the vicinity of Nanjing, China, sharing an identical geographic region yet differing markedly in imaging viewpoint. After being uniformly resized to 640 × 640 pixels, the two subsets were merged to form the experimental dataset used in this paper.
The statistical information for each subset is presented in
Table 1.
As shown in
Table 1, the training, validation, and test sets are partitioned through stratified splitting at a ratio of 7:2:1, ensuring that the proportion of the two viewpoint classes within each subset remains consistent with the overall distribution. Each image is annotated with a viewpoint label (Drone = 1, Ground = 0), stored in the viewpoints field of the dataset configuration file, which serves viewpoint routing and loss assignment during the training phase.
2.1.2. Mixed-View Characteristics
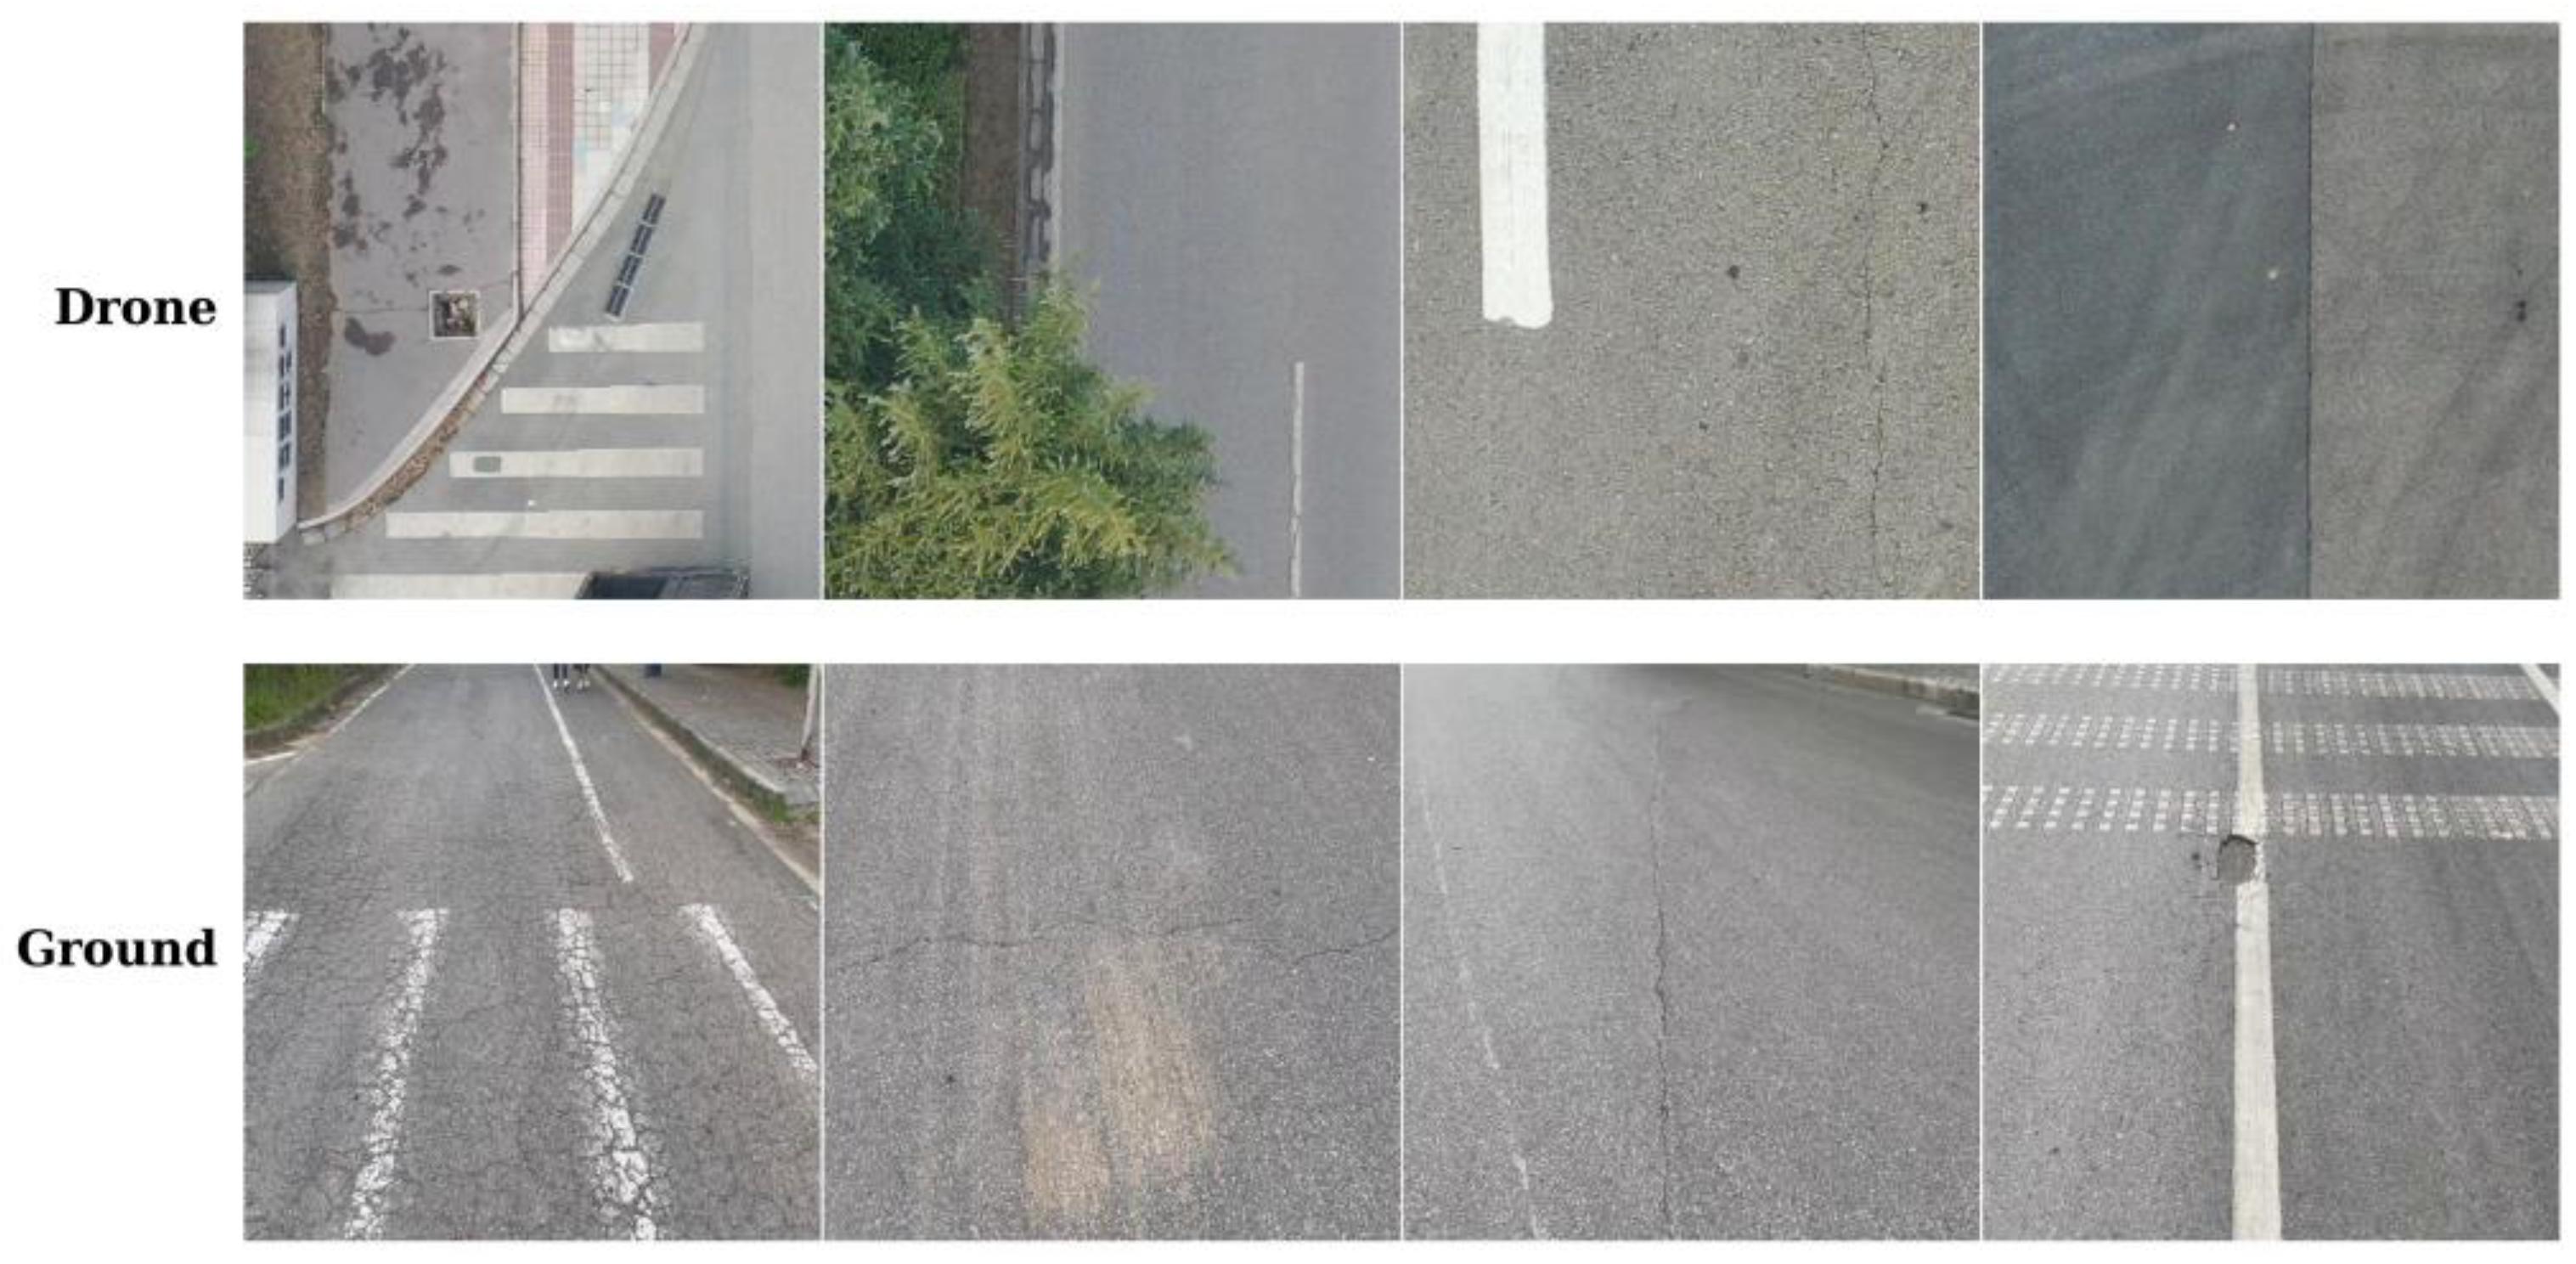
The two viewpoints exhibit systematic differences along three dimensions, as illustrated in
Figure 1. The first is scale discrepancy: the median normalized object area in the Drone subset is merely 0.51% (with 10.3% of objects falling below 0.1%), whereas the corresponding value for the Ground subset reaches 1.8%. In terms of absolute pixel dimensions, a typical Drone-view crack measures 6–12 pixels in width at 640 × 640 resolution. After five successive 2× downsampling stages in the YOLOv11n backbone, the P5 feature map (20 × 20) carries a spatial stride of 32 pixels. A crack of 10-pixel width thus collapses to approximately 0.3 pixels at this coarsest scale, rendering its structural information unrecoverable at P5 and motivating the need for higher-resolution feature refinement in the Drone branch. The second is textural discrepancy: cracks captured from the Ground viewpoint exhibit sharp edges and pronounced directionality, whereas those from the Drone viewpoint suffer from reduced contrast and blurred edges owing to atmospheric scattering. The third is background discrepancy: the Drone field of view encompasses diverse background elements including pavement surfaces, road markings, vehicles, trees, and shadows, while the Ground field of view concentrates on the pavement yet is densely polluted by asphalt texture noise. Collectively, these three dimensions constitute the Mixed-View Domain Gap.
2.1.3. Data Augmentation Strategy
During training, the default data augmentation strategy of YOLOv11n is adopted, encompassing HSV color space perturbation (h = 0.015, s = 0.7, v = 0.4), horizontal flipping (probability 0.5), Mosaic augmentation (probability 1.0, disabled during the final 10 epochs), random scaling (scale = 0.5), and translation (translate = 0.1). During validation and testing, only size normalization (640 × 640 letterbox) is applied, with no further augmentation.
2.2. Overall Framework
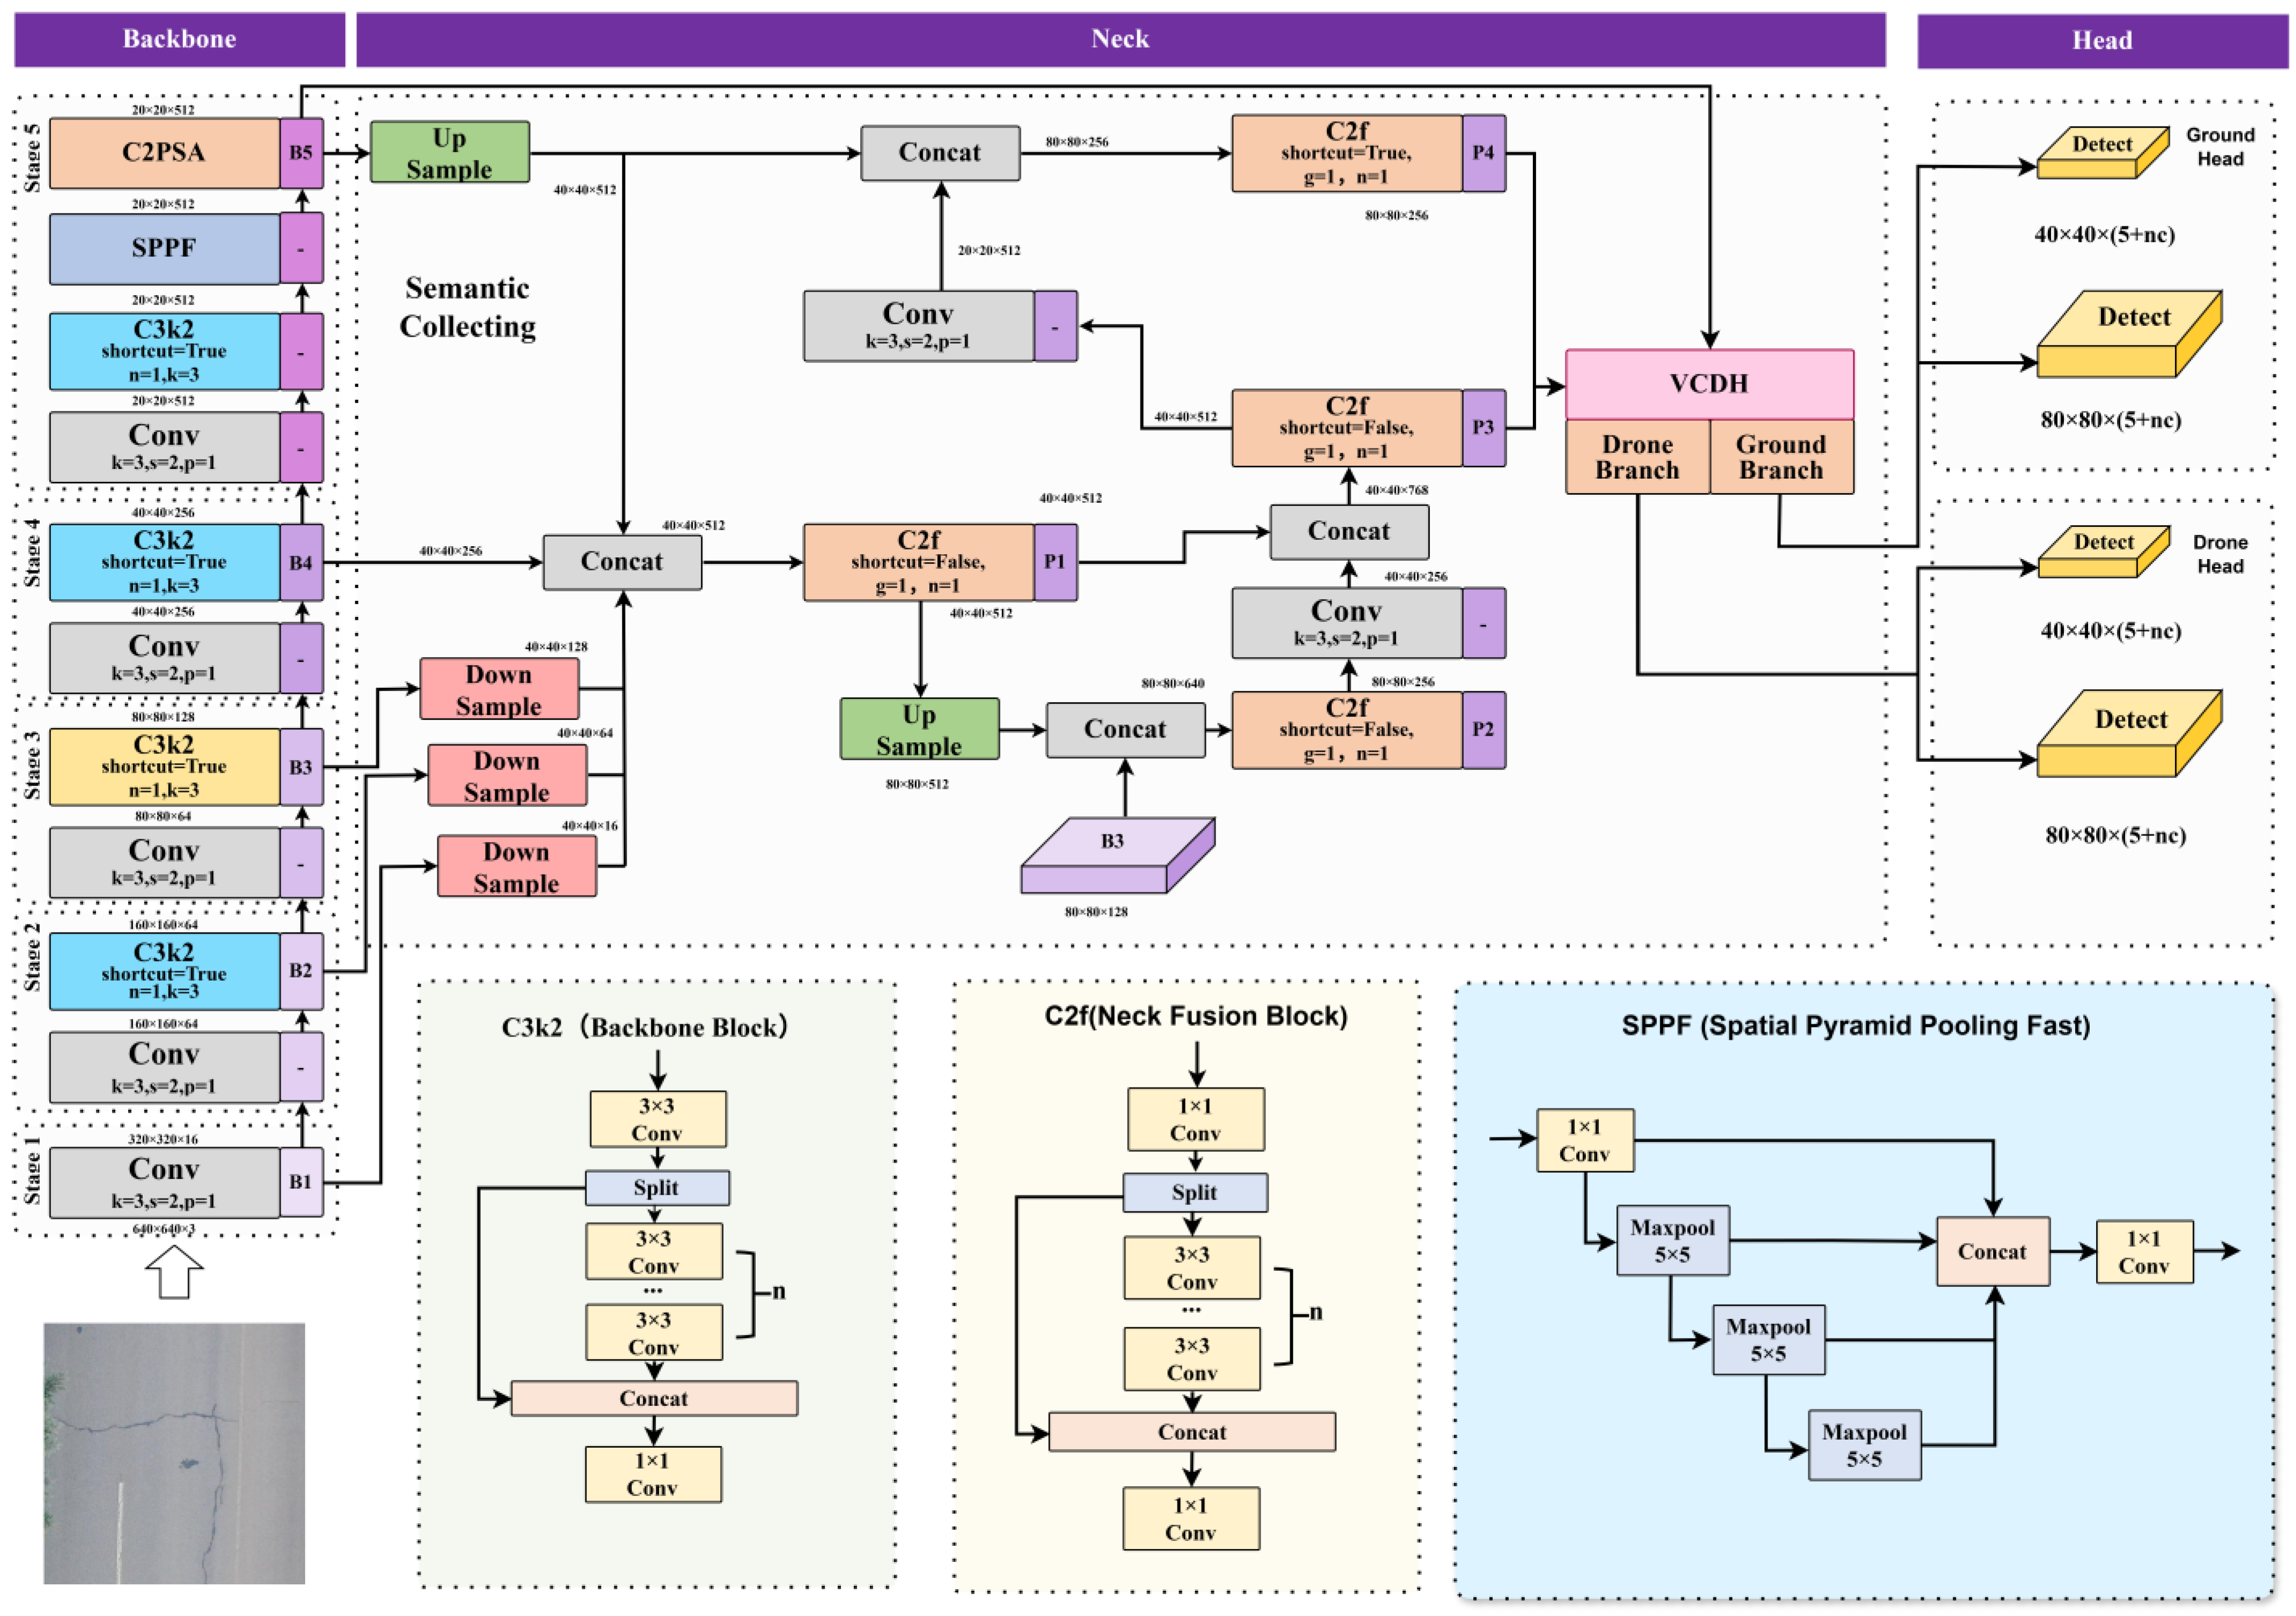
The overall architecture of VCDH-Net is illustrated in
Figure 2. The shared Backbone and Neck (adopting the standard YOLOv11n structure) produce feature maps at three scales: P3 (80 × 80), P4 (40 × 40), and P5 (20 × 20). The P5 features are fed into a lightweight viewpoint classifier (view_head, 16.6K parameters) to predict the viewpoint category. Subsequently, the features pass through a View Adapter (1 × 1 Conv + DW 3 × 3 + Residual) before entering two parallel branches: the Drone branch (LSE@P3, P4 → PDR → Drone Head) and the Ground branch (LSE@P3, P4 → Ground Head). During training, the detection loss is routed to the corresponding detection head according to the viewpoint label; during inference, the view_head automatically predicts the viewpoint and selects the appropriate detection head, requiring no manual input whatsoever.
The proposed VCDH-Net framework consists of three complementary modules that address different challenges in mixed-view crack detection. Specifically, the VCDH module alleviates the feature distribution discrepancy between Drone and Ground viewpoints through viewpoint-aware dual-head detection. The LSE module enhances directional crack representations at the P3 and P4 feature levels to preserve structural information of thin cracks. Furthermore, the PDR module is introduced only into the Drone branch to recover fine-grained details that are easily lost during repeated downsampling. These three modules operate at different stages of the detection pipeline and jointly improve viewpoint adaptability and fine-crack detection performance while maintaining a lightweight architecture.
2.3. Viewpoint-Conditioned Dual-Head Detection (VCDH)
Given an image
, drawn from a mixed-viewpoint dataset, its associated viewpoint label is denoted as
(0 = Ground, 1 = Drone). A conventional single-head detector processes all images through a shared detection head
with the optimization objective formulated as:
where
and
denote the Backbone and Neck, respectively. Owing to the systematic shift between the Drone and Ground data distributions in the feature space, the shared detection head
is compelled to strike a compromise between the two domains during optimization, resulting in overall performance degradation.
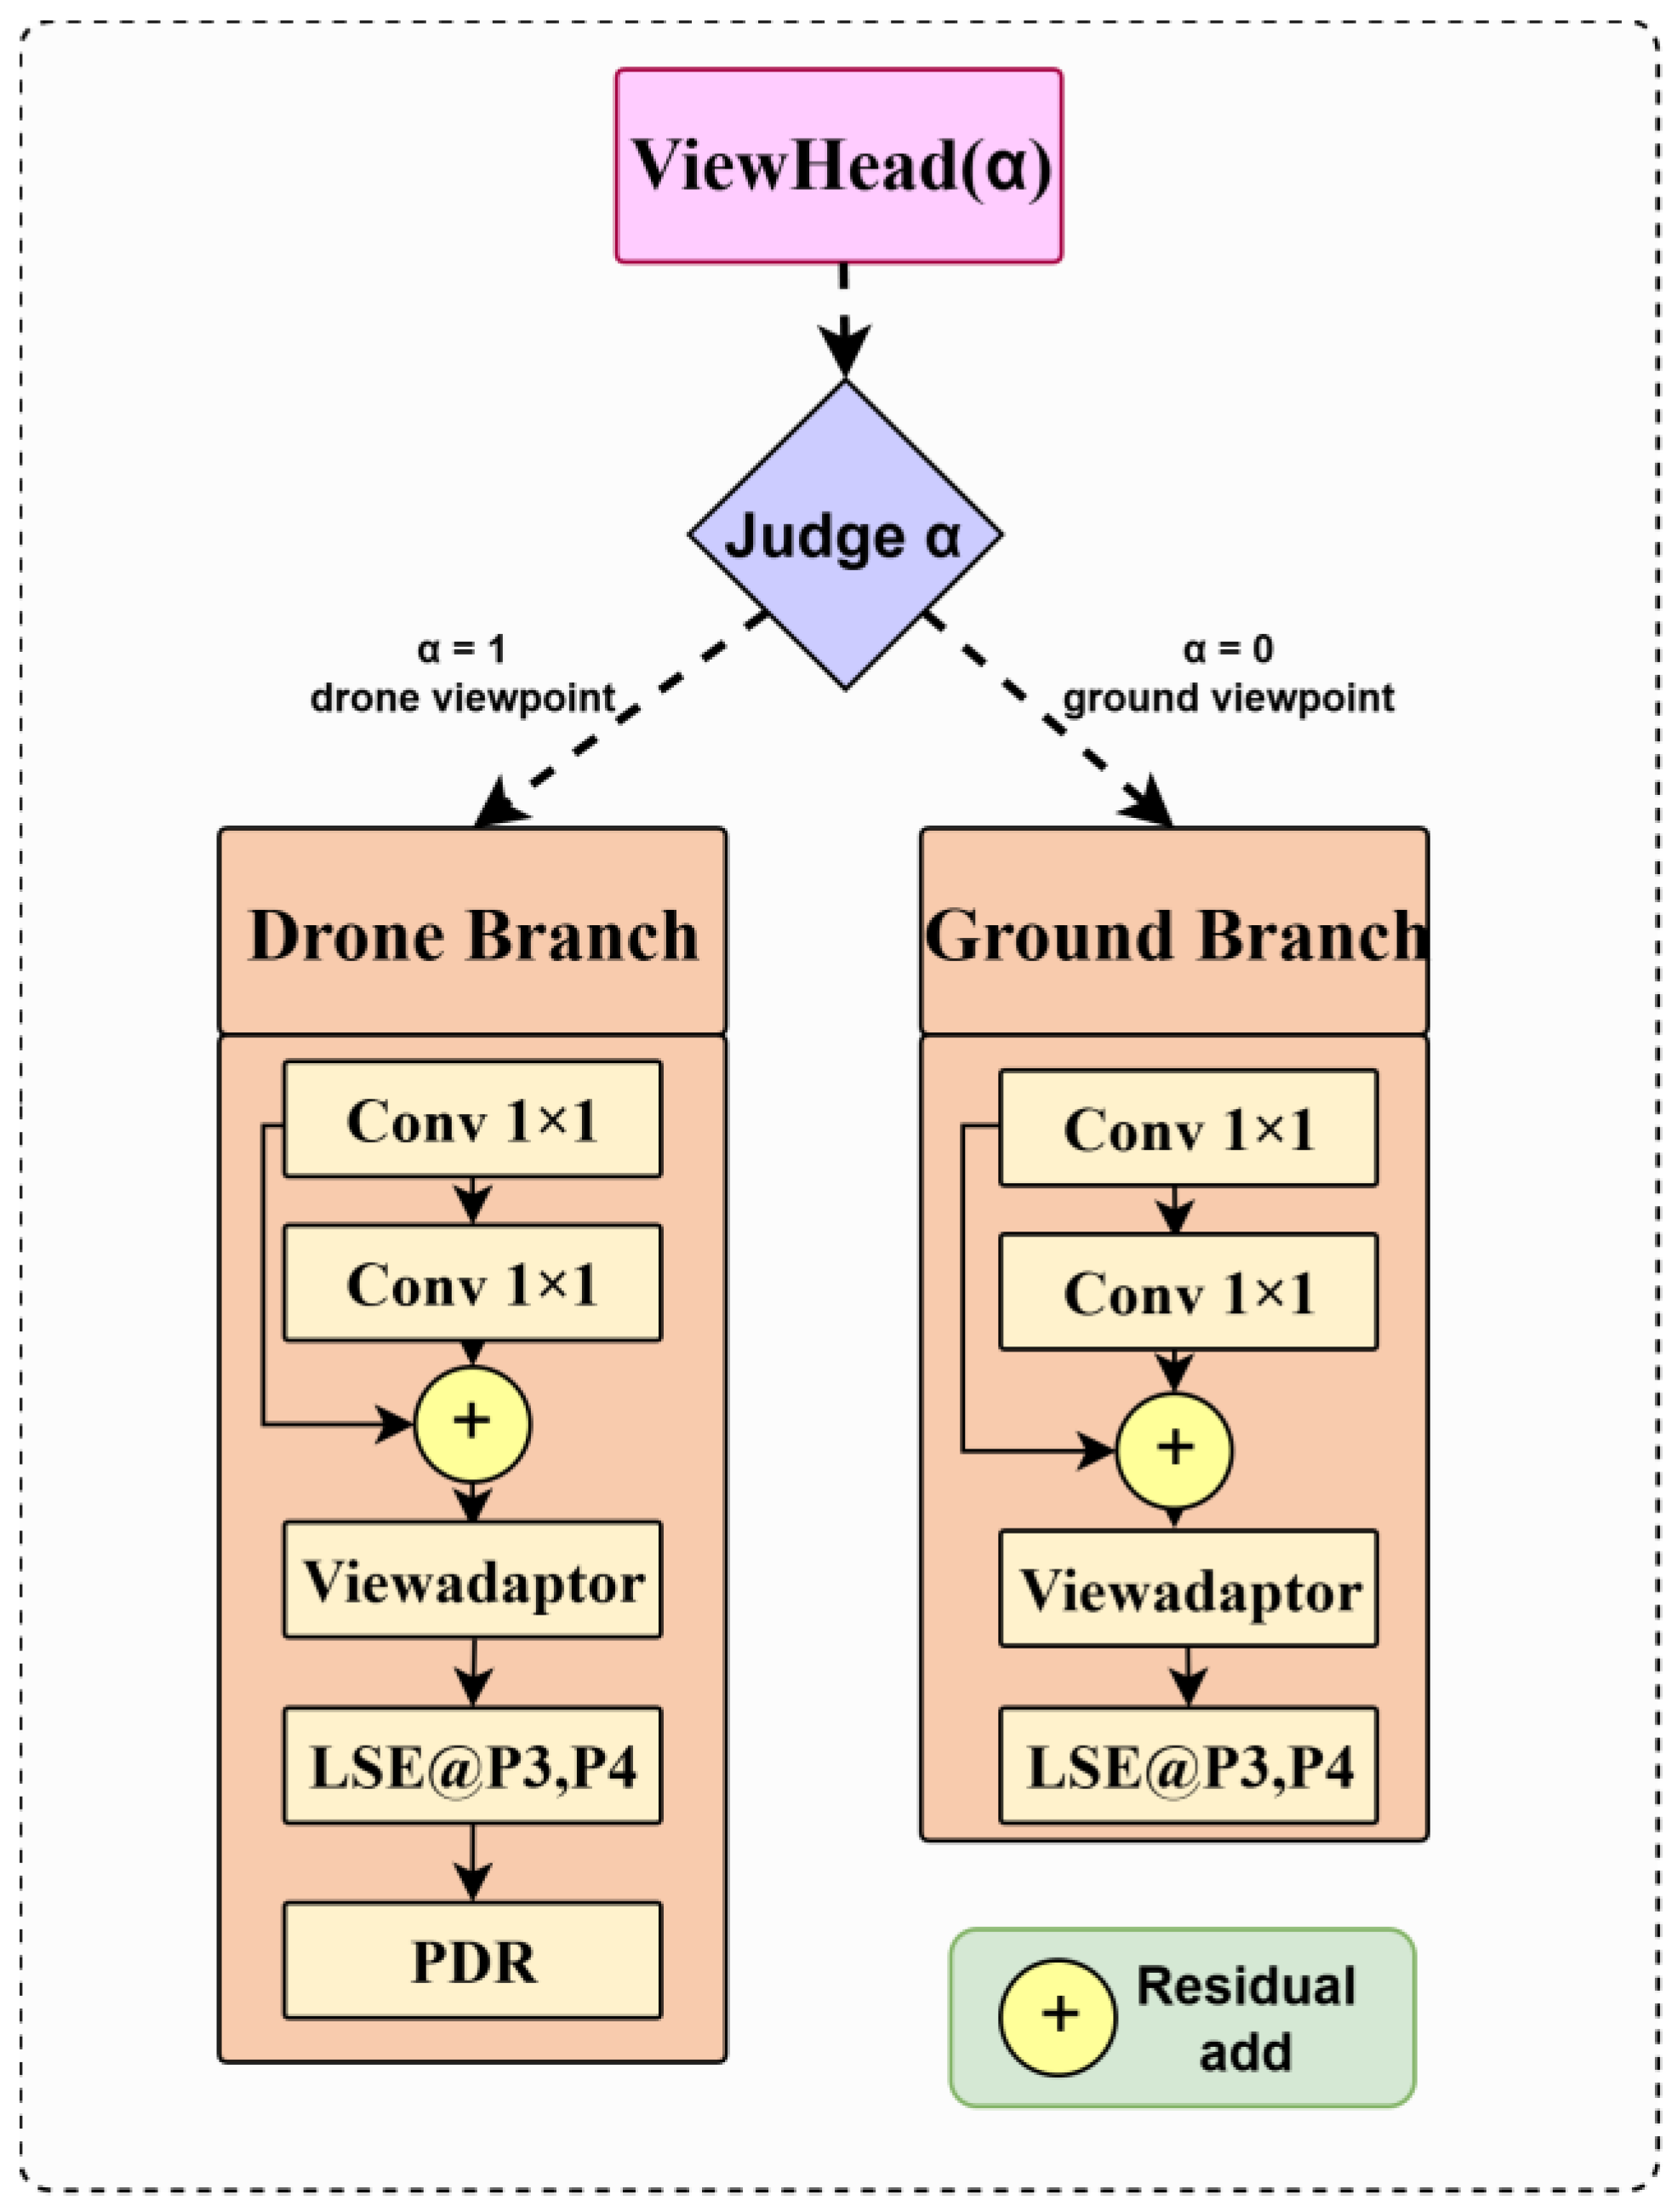
VCDH replaces the shared detection head in a conventional single-head detector with two parallel viewpoint-specific detection heads, (Drone Head) and (Ground Head), and introduces a lightweight viewpoint classifier (view head) to predict viewpoint information. The structures of these three components are as follows:
Viewpoint classifier. Taking the P5 feature map from the Neck as input, this classifier first applies global average pooling and then passes the result through a two-layer fully connected network (256 → 64 → 2) to output viewpoint category logits. The classifier adopts the same training strategy as the YOLOv11n detection head, being jointly optimized with the detection task during training, and contains merely 16.6 K parameters.
Viewpoint-specific detection heads. Both the Drone Head and the Ground Head adopt the standard YOLOv11n detection head structure, comprising a bounding box regression branch (cv2) and a classification branch (cv3), with each group accounting for approximately 432 K parameters. The two heads share an identical structure yet maintain independent weights, enabling each to learn viewpoint-adaptive features from the supervisory signals of its own viewpoint.
View Adapter. Inserted between the Neck outputs and each branch module (LSE/PDR/detection head), a lightweight channel adapter (1 × 1 Conv + DW3 × 3 + Residual) is introduced, with approximately 90 K parameters. The adapter is zero-initialized, behaving as an identity mapping at the early stage of training and progressively learning to furnish differentiated initial feature spaces for different viewpoint branches.
The structural diagram of VCDH is presented in
Figure 3.
For each training image, the view head computes the viewpoint classification loss
(cross-entropy), while the detection loss is routed according to the viewpoint label
:
where
and
denote the feature maps after processing by the Drone branch and the Ground branch, respectively. The total loss is formulated as:
where
is set to 0.5. This routing mechanism ensures that each detection head learns exclusively from positive samples belonging to its own viewpoint, thereby preventing the confounding of supervisory signals across viewpoints.
- 2
Inference Phase
The view head first predicts the viewpoint category
, after which the output head is selected according to
:
Experimental results indicate that the view head achieves a classification accuracy exceeding 94% on the test set, which is sufficient to support reliable inference routing.
VCDH is built on a shared representation, specialized detection philosophy. Compared with training independent models per viewpoint, sharing the Backbone and Neck preserves the cross-viewpoint transferability of generic crack features, while the additional parameter cost is limited to two detection heads (approximately 864 K) and a view head (16.6 K), far below the total of two independent models (2 × 2.59 M = 5.18 M). Compared with a unified single-head detector, VCDH avoids inter-domain compromise in feature representation by specializing each detection head to its own viewpoint. The core value of VCDH lies not in the immediate accuracy gain, but in establishing the correct domain of action for LSE and PDR: each enhancement module operates strictly within its dedicated branch, without perturbing the optimization of the other viewpoint.
During inference, the viewpoint classifier predicts the viewpoint category of the input image before detection. According to the predicted viewpoint, the corresponding detection head is activated while the other branch remains inactive. Therefore, the proposed framework performs viewpoint-aware dynamic routing without requiring manual viewpoint annotation during deployment. Although incorrect viewpoint prediction may introduce routing errors, the influence is limited because the two viewpoints exhibit relatively distinct visual characteristics. In this study, the viewpoint classifier achieves a classification accuracy above 94%, indicating that reliable routing can be maintained under practical conditions.
2.4. Lightweight Structure Enhancement (LSE)
Cracks exhibit pronounced directionality and elongated geometry in their morphological appearance—transverse cracks extend along the horizontal direction, while longitudinal cracks extend along the vertical direction. In contrast, interfering elements in the pavement background, such as asphalt texture, repair traces, and oil stains, typically manifest as isotropic distributions or irregular block-like patterns [
31,
32]. Recent studies in remote sensing image analysis have also demonstrated that separating informative structural patterns from complex background interference is important for improving fine-grained feature representation, where frequency-guided feature refinement strategies have been explored to suppress irrelevant responses while preserving discriminative structural information [
33]. The standard 3 × 3 convolution kernels employed in the YOLOv11n detection head respond uniformly to local features across all directions, rendering them incapable of distinguishing directional cracks from isotropic background. Moreover, after five successive downsampling stages in the Backbone, the spatial resolution of the P5 feature map (20 × 20) is no longer sufficient to preserve the geometric structure of fine cracks.
Unlike general object boundaries, pavement cracks usually present elongated and anisotropic patterns. Their visual structures are mainly distributed along horizontal, vertical, or diagonal directions, while the width information is limited. Therefore, asymmetric convolution kernels are introduced to enhance directional responses. The 1 × 5 and 5 × 1 kernels provide larger receptive fields along specific orientations with negligible additional computational cost, enabling the network to capture thin crack structures more effectively than standard square kernels.
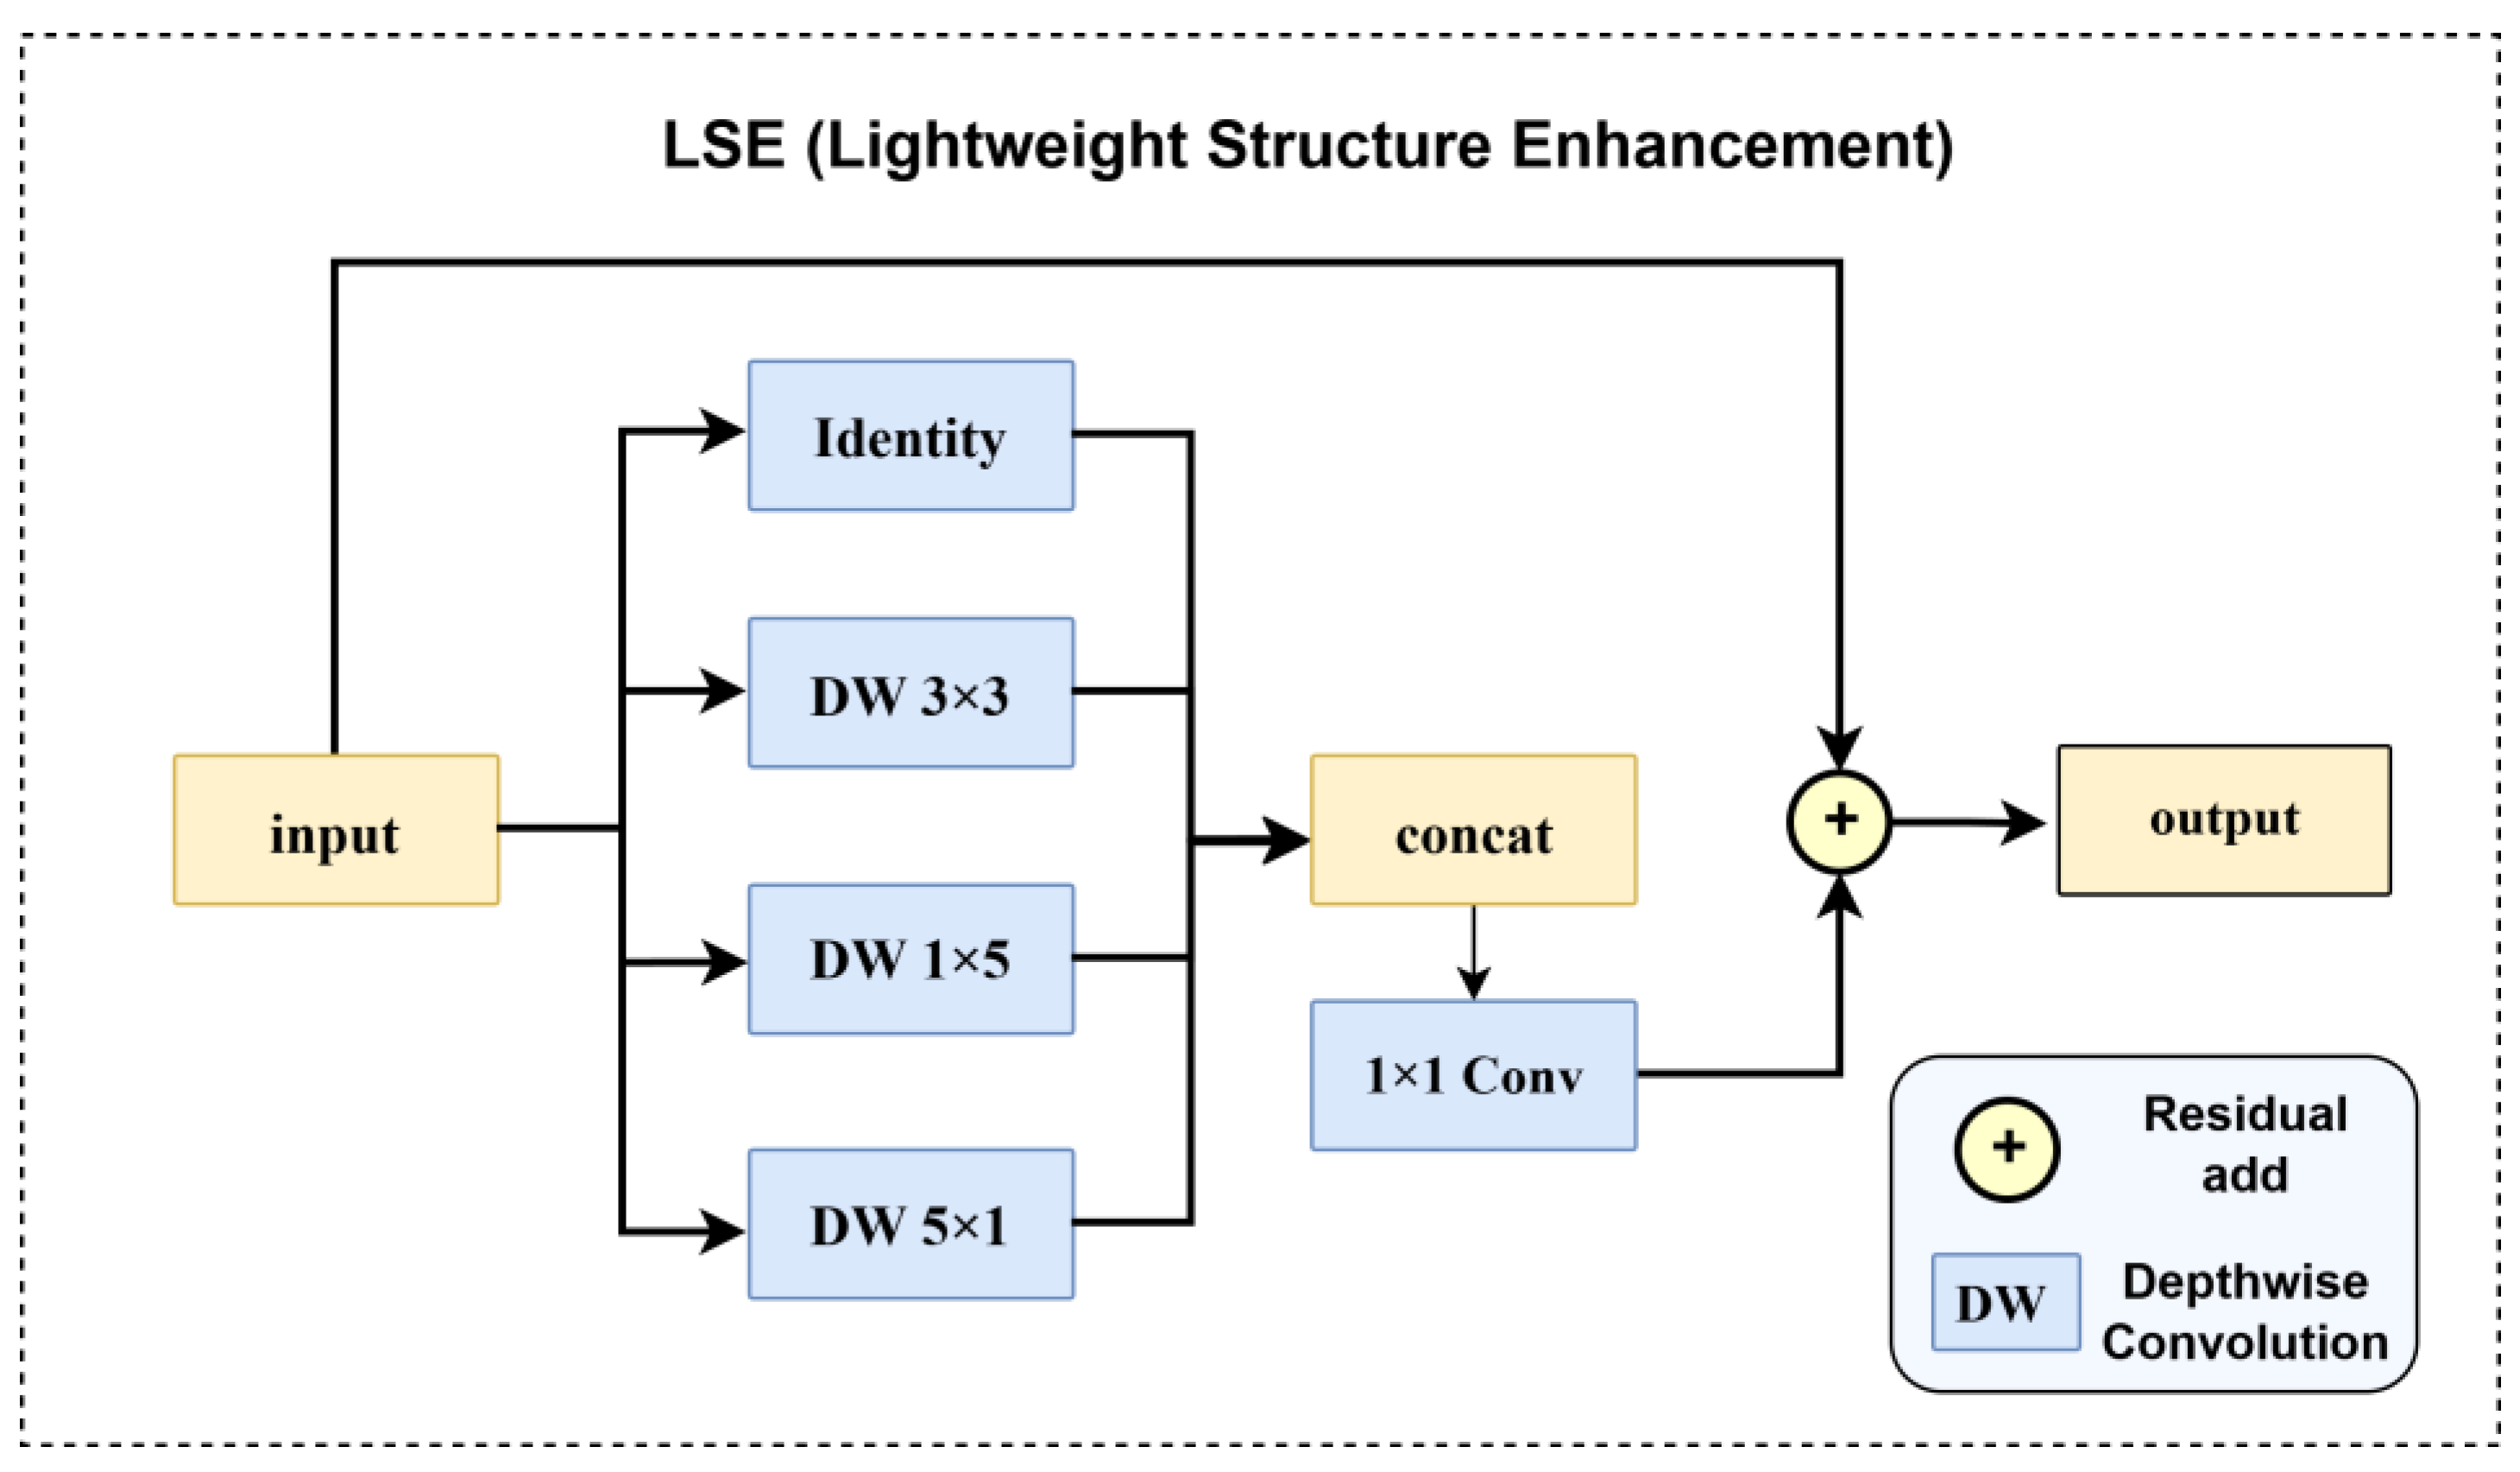
The LSE module is applied at two levels of the Neck output—P3 (80 × 80) and P4 (40 × 40)—with a core structure comprising a four-branch parallel crack-aware enhancement, as illustrated in
Figure 4.
For an input feature
, the four branches extract the following: (a) the original features via an identity mapping; (b) local contrast through a 3 × 3 depthwise separable convolution (
); (c) horizontally elongated structures through a 1 × 5 depthwise separable convolution (
) and (d) vertically elongated structures through a 5 × 1 depthwise separable convolution (
). The outputs of the four branches are concatenated along the channel dimension, fused by a 1 × 1 convolution, and subsequently added back to the original features via a residual connection:
,
and
all employ depthwise separable convolutions with the number of groups set equal to the number of input channels, so as to minimize the parameter count. This four-branch architecture enables the module to simultaneously capture crack geometric features along different orientations:
and
exhibit heightened response sensitivity to horizontal and vertical elongated cracks, respectively;
serves as a supplement covering cracks with irregular orientations; and the identity branch preserves the fidelity of the original features.
With respect to level selection, LSE is activated exclusively at P3 and P4, with no enhancement applied at the P5 level. At the P5 level (20 × 20), the spatial resolution is too low for the elongated geometric structure of cracks to remain discernible; applying enhancement at this scale is not only ineffective, but actually degrades generalization performance by introducing scene-level background noise, such as global pavement texture and shadow distributions.
The weights of all newly introduced convolutional layers (, , and the 1 × 1 fusion convolution) are initialized to zero. This design ensures that, at the starting point of training, the output of LSE is identical to its input (), allowing the model to begin from the original YOLOv11n feature space and progressively acquire crack geometry enhancement capability. Consequently, the feature representation established by the COCO pretrained weights is not disrupted by random initialization.
Unlike generic channel/spatial attention mechanisms such as SE (Squeeze-and-Excitation) [
34], CBAM (Convolutional Block Attention Module) [
35] and CA (Coordinate Attention) [
36], LSE does not rely on data-driven gating functions to learn “what to attend to.” Instead, it directly encodes the geometric priors of cracks—directionality and elongation—into the module architecture. The asymmetric convolution kernels of DW 1 × 5 and DW 5 × 1 inherently favor linear features, obviating the need to learn “what orientation a crack should be” from limited data. In small-data scenarios (the training set in this paper contains only 3058 images), this prior proves to be more stable and less prone to overfitting than data-driven attention mechanisms. The introduction of task-specific geometric priors into network architectures has recently been explored in remote sensing image analysis, where structural constraints were demonstrated to improve fine-grained feature representation under limited annotation conditions [
37]. Inspired by this concept, the proposed LSE module incorporates directional convolutional priors to enhance crack-shaped structures.
2.5. Pyramid Detail Refinement (PDR)
2.5.1. Motivation
Although LSE strengthens the structural features of cracks at the P3 level (80 × 80), certain fine cracks under the aerial viewpoint measure merely 3–5 pixels in width. At the P3 resolution, each pixel corresponds to an 8 × 8 pixel region in the original image, meaning that the spatial details of cracks remain incomplete at this level. A straightforward remedy would be to introduce an additional higher-resolution detection layer—for instance, a P2 layer at 160 × 160. However, this would necessitate modifications to the detection head structure of YOLOv11n, including adjustments to the stride configuration, anchor settings, and NMS logic. Such modifications are highly invasive and risk destabilizing the Ground branch [
38].
2.5.2. Module Design
PDR adopts a non-invasive super-resolution enhancement scheme: rather than introducing an additional detection layer, it upsamples P3 features into a higher-resolution space, performs enhancement therein, and subsequently feeds the refined features back to P3 as a residual supplement through a downsample pathway. The specific process is illustrated in
Figure 5 and formulated as follows:
The transposed convolution (ConvTranspose) upsamples P3 from 80 × 80 to 160 × 160 resolution while compressing the channel dimension from 64 to 32 to reduce computational overhead. Subsequently, a standard convolution (Conv2d with stride = 2) processes the features in this 160 × 160 space and then downsamples them back to the original P3 resolution and channel count. All layers are zero-initialized, such that at the training starting point the residual term equals zero, and the module behaves as an identity mapping. The entire module contains merely approximately 44 K parameters (one transposed convolution of 8.2 K and one stride-2 convolution of 35.8 K), accounting for roughly 1.2% of the total 3.62 M.
2.5.3. Design Rationale
The PDR module temporarily projects the P3 features into a higher-resolution latent space (160 × 160), where the fine-grained geometric characteristics of thin cracks can be more effectively preserved. The refined features are subsequently reintegrated into the original P3 representation through a residual pathway, enabling detail enhancement while maintaining the original detection pipeline. Unlike approaches that introduce an additional P2 detection head, such as the four-scale detection strategies adopted in YOLO-P2 and Gold-YOLO, PDR does not modify the detection head, anchor/stride configuration, or the subsequent non-maximum suppression procedure. Consequently, the computational overhead remains negligible, preserving the lightweight nature and inference efficiency of YOLOv11n. Furthermore, the minimalist architecture adopted in PDR—a single upsampling operation followed by a single downsampling refinement stage—was selected based on empirical observations. More elaborate P2 processing strategies, including deeper convolutional refinement and attention-based feature enhancement, consistently produced inferior performance on the mixed-view crack dataset, suggesting that a lightweight refinement pathway provides a more favorable balance between representation capability and generalization under limited training data.
2.6. Training Strategy
All experiments are conducted under a unified training configuration to ensure comparability across ablation studies. The Backbone and Neck parameters are initialized with the pretrained weights of YOLOv11n trained on the COCO dataset [
39] while the newly introduced modules (view head, view adapter, LSE, and PDR) adopt the zero-initialization strategy described earlier. The cv2/cv3 convolutional layers of the Drone Head and Ground Head are initialized by loading the detection head weights from the pretrained model, thereby endowing both heads with an identical learning starting point.
The optimizer and hyperparameter settings are as follows. Stochastic Gradient Descent (SGD) is adopted as the optimizer, with an initial learning rate of 0.01, momentum of 0.937, and a weight decay of . A cosine annealing schedule is employed for learning rate decay, with the minimum learning rate set to 1% of the initial value (lrf = 0.01), and a linear warmup is applied over the first 3 epochs (warmup epochs = 3). The batch size is set to 16, and all input images are uniformly resized to 640 × 640 pixels. Training is conducted for a total of 300 epochs, with an early stopping patience of 50.
During training, the default data augmentation strategy of YOLOv11n is applied, which encompasses HSV color space perturbation (h = 0.015, s = 0.7, v = 0.4), horizontal flipping (probability 0.5), Mosaic augmentation (probability 1.0, disabled during the final 10 epochs), random scaling (scale = 0.5), and translation (translate = 0.1). During validation and testing, only size normalization (640 × 640 letterbox) is performed, with no further augmentation applied.
The total loss consists of two components: the detection loss and the viewpoint classification loss. The detection loss adopts the standard YOLOv11n loss formulation (CIoU box loss + BCE classification loss + DFL loss [
40]), while the viewpoint classification loss employs cross-entropy loss. No additional loss weighting or dynamic adjustment is performed during training. Preliminary experiments conducted in this work revealed that loss-level modifications—such as applying adaptive re-weighting to the box loss (e.g., CALLoss/CARL) or imposing viewpoint-aware weighting on the classification loss (e.g., VAFM)—yielded observable improvements in the training curves (i.e., loss descent), yet none of these modifications translated into consistent accuracy gains on the test set. Accordingly, only the standard loss formulation is retained in the final configuration.
2.7. Evaluation Metrics
2.7.1. Standard Detection Metrics
This paper adopts the standard evaluation metrics commonly used in the object detection community: mAP50-95 (the mean Average Precision averaged over 10 IoU thresholds ranging from 0.50 to 0.95 with a step size of 0.05) and Precision. All metrics are reported on the merged test set (438 images) as well as separately on the viewpoint-split Drone subset (229 images) and Ground subset (209 images).
2.7.2. Cross-View Evaluation Metrics (CVCS)
To evaluate the cross-viewpoint robustness of a model in mixed-viewpoint scenarios, this paper introduces three novel CVCS (Cross-View Crack Sensitivity) metrics:
1. Cross-View Gap (CV-Gap). This metric quantifies the performance deviation between the two viewpoints:
A smaller CV-Gap indicates that the model adapts more uniformly to different viewpoints. When a model exhibits a severe bias toward one viewpoint (e.g., markedly superior performance on the Ground viewpoint relative to the Drone viewpoint), the CV-Gap increases, exposing potential deficiencies of the model in mixed-viewpoint scenarios.
2. Worst-View Score (VWS). This metric takes the mAP50-95 of the lower-performing viewpoint:
VWS directly reflects the practical usability floor of a model in mixed-viewpoint scenarios. Compared with reporting only the merged metric (merged mAP50-95), VWS ensures that the detection weakness on the inferior viewpoint is not concealed by the inflated overall score contributed by the dominant viewpoint. In real-world inspection settings, the Drone viewpoint offers extensive coverage and high inspection efficiency; should its detection performance be critically low, the entire system cannot be deployed reliably.
3. Cross-View Balance (CVB). This metric jointly considers overall performance and viewpoint equilibrium:
CVB imposes a viewpoint imbalance penalty on the merged mAP—as the CV-Gap increases (indicating that the model is skewed toward one viewpoint), the CVB decreases. This metric encourages models to pursue high overall accuracy while preserving cross-viewpoint consistency.
Collectively, these three metrics constitute a complete evaluation framework for mixed-viewpoint detection models: CV-Gap diagnoses the direction and magnitude of bias, VWS assesses the reliability of practical deployment, and CVB provides a composite score to guide model selection.
3. Results
3.1. Experimental Settings
All experiments are conducted on a workstation equipped with an NVIDIA GeForce RTX 4060 Laptop GPU (8 GB VRAM). The software environment consists of PyTorch 2.5.1, CUDA 12.4, and Ultralytics 8.4.63. The training configuration remains identical to that described in
Section 2.6: an SGD optimizer (lr
0 = 0.01, momentum = 0.937, weight_decay = 5 × 10
−4), a batch size of 16, an input resolution of 640 × 640, 300 training epochs, linear warmup over the first 3 epochs, and an early stopping patience of 50. Unless otherwise specified, all metrics are reported on the merged test set (438 images) as well as separately on the viewpoint-split Drone subset (229 images) and Ground subset (209 images). The primary evaluation metric is the mean Average Precision averaged over IoU thresholds from 0.50 to 0.95 with a step size of 0.05 (mAP50-95), defined as:
where mAP at a single threshold is the mean of per-class Average Precision (AP):
Precision (
P) and Recall (R) are reported as auxiliary metrics:
where
TP,
FP, and
FN denote true positives, false positives, and false negatives, respectively. The standard mAP50 (mAP evaluated at a single IoU threshold of 0.50) is also reported for reference.
3.2. Comparison with State-of-the-Art Methods
The merged mAP follows the standard COCO protocol: the model runs inference on all 438 test images, the full set of predictions merges into one pool, and a single precision-recall curve determines the final score. This global pooling means the merged mAP differs from a simple sample-size-weighted average of the Drone-only and Ground-only subsets. High-confidence predictions from Ground images (where cracks appear larger) contribute to recall without dragging down precision across the pooled curve. As a result, the merged mAP consistently exceeds the arithmetic weighted mean by roughly 0.01–0.02.
The full model (VCDH + LSE + PDR), DANN, and the YOLOv11n baseline were each trained five times with random seeds {42, 123, 256, 512, 1024}. Over these five runs, the baseline achieves a mean mAP50-95 of 0.5633 ± 0.0017, the full model achieves 0.5788 ± 0.0012, and DANN achieves 0.5782 ± 0.0018.
As
Table 2 shows, VCDH-Net leads all methods with an mAP50-95 of 0.5788, outperforming the YOLOv11n baseline by 0.0155 (+2.8%). DANN achieves the closest performance to VCDH-Net, with a merged mAP50-95 of 0.5782, which is slightly lower than the 0.5788 obtained by the proposed method. This result indicates that adversarial feature alignment can effectively alleviate viewpoint-related distribution discrepancies. However, the comparison based solely on the merged mAP50-95 does not fully reflect the advantages of VCDH-Net in mixed-viewpoint crack detection. In addition to maintaining comparable overall accuracy, VCDH-Net achieves consistently better performance across multiple evaluation indicators. Specifically, the proposed model obtains higher mAP50, precision, recall, and F1-score than DANN, demonstrating more comprehensive detection capability. More importantly, VCDH-Net explicitly models viewpoint-specific characteristics through the dual-head architecture. The Drone-view and Ground-view mAP50-95 values reach 0.4883 and 0.6524, respectively, and the proposed model achieves a CVB of 0.4965, indicating improved balance between different viewpoints. In contrast, DANN adopts a single shared detection head and performs implicit feature alignment, making it difficult to distinguish whether performance improvements originate from effective adaptation of a specific viewpoint. Furthermore, the viewpoint classifier in VCDH-Net provides explicit routing information during inference, offering additional interpretability for practical deployment. Therefore, although DANN achieves competitive merged accuracy through adversarial domain adaptation, VCDH-Net provides a more comprehensive solution by jointly considering detection accuracy, cross-viewpoint consistency, and deployment-oriented interpretability. JAN trails slightly at 0.5748. ADDA falls further to 0.5467, below even the baseline. ADDA trains exclusively on Ground images in its first stage, and the 1377 source-domain samples prove insufficient; the second-stage adversarial fine-tuning cannot recover adequate Drone-view performance. The spread among these three methods confirms that feature-alignment approaches depend heavily on training protocol and dataset scale in this setting.
YOLOv26n holds second among the YOLO nano series at 0.5728, with YOLOv8n next at 0.5660. YOLOv5n (0.5522) and YOLOv10n (0.5533) perform similarly. The heavier general-purpose detectors lag considerably: Faster R-CNN and RetinaNet score only 0.3762 and 0.3418 in mAP50-95, and their mAP50 values sit 25 to 30 points below VCDH-Net. FCOS reaches 0.4793, trailing all YOLO nano variants.
VCDH-Net records a precision of 0.8445, the highest among all methods that report this metric. DANN (0.8422) and YOLOv26n (0.8444) come close. ADDA drops to 0.7804, reflecting the gap between successful and struggling domain adaptation strategies. On the parameter side, the three domain adaptation methods add zero architectural overhead over YOLOv11n, keeping their counts at 2.58 to 2.59 M. VCDH-Net uses 3.62 M parameters, roughly 1/11 of Faster R-CNN (41.32 M). The parameter growth over baseline traces mainly to the dual-head structure (Ground Head and Drone Head, each approximately 432 K) and the LSE module (353 K); PDR adds only 44K. VCDH-Net draws 8.90 GFLOPs, slightly more than the domain adaptation baselines (6.3 to 6.4) and far less than the ResNet-50 detectors (34.9 to 134.4). Single-image inference runs at roughly 7.7 ms on an RTX 4060. These budgets sit comfortably within the real-time envelope for both vehicle and UAV platforms.
3.3. Alternative Designs Considered
Several alternative designs were evaluated during development and ultimately set aside in favor of the final VCDH+LSE+PDR configuration. These are briefly noted here to clarify the design rationale.
Attention mechanisms. Channel and spatial attention modules were tested as alternatives to LSE for feature enhancement. On a dataset of 3058 training images, these data-driven modules exhibited unstable convergence and overfitting, consistent with the known difficulty of training attention mechanisms on small detection datasets. LSE, by encoding geometric priors (asymmetric 1 × 5 and 5 × 1 depthwise convolutions) directly into architecture, provided more stable optimization with fewer parameters.
LSE placement variants. Applying LSE to only the Drone branch, only the P3 level, or all FPN levels (P3–P5) was tested. The two-branch, P3 + P4 configuration used in the final design yielded the best cross-view balance: Drone-only LSE left Ground features unenhanced, P5-level LSE showed negligible benefit (crack structures at P5 resolution are too coarse), and all-level LSE introduced redundant parameters without metric gain.
Cross-view consistency losses. Explicit consistency regularization between the two branch feature spaces was attempted. These losses added training complexity (auxiliary loss weighting, convergence sensitivity) without improving the CVB metric beyond what the dual-head architecture already achieved through viewpoint-specialized optimization.
3.4. Ablation Study
Table 3 presents the ablation study results for each module, revealing the hierarchical dependency relationships among the three modules. Each configuration is analyzed in detail below.
VCDH alone (Row 2): The mAP50-95 marginally shifts from 0.5633 to 0.5637, remaining essentially on par with the baseline. The Drone score decreases to 0.4621 (−0.0077) and the Ground score drops to 0.6404 (−0.0022). This is attributable to a data dilution effect: under the dual-head framework, the number of effective training samples available to each detection head is reduced by approximately 44–54%. five independent runs, the VCDH-only configuration achieves 0.5637 ± 0.0022, compared with 0.5633 ± 0.0017 for the baseline (paired t-test: t = 1.16, p ≥ 0.05). The single-run difference is small and should not be interpreted as an independent gain. This row serves as a dependency verification experiment rather than a performance claim.
VCDH + PDR without LSE (Row 3): This configuration is not a candidate architecture but a control experiment designed to test the dependency between PDR and LSE. PDR upsamples P3 features to P2 resolution and refines them at that scale; this refinement only benefits detection when the P3 features already carry well-localized crack activations, which LSE is designed to provide. Without LSE, the upsampled P2 feature maps retain imprecise crack boundaries. PDR’s refinement step amplifies these localization errors rather than correcting them, pushing mAP50-95 down to 0.5611 with Drone recovering only marginally to 0.4648. This result does not imply that PDR lacks independent value; it confirms that the P2 super-resolution pathway requires the geometric preconditioning supplied by LSE—the hierarchical dependency that underpins the full pipeline design.
VCDH + LSE (Row 4): The mAP50-95 rises sharply to 0.5723 (+0.0086), surpassing the baseline. The Drone score climbs to 0.4716 (+0.0095) and the Ground score reaches 0.6479 (+0.0075), yielding simultaneous gains across both viewpoints.
VCDH + LSE + PDR (full model, Row 5): The mAP50-95 attains 0.5788 (+0.0065 over the +LSE configuration). The Drone score surges to 0.4883 (+0.0167, +3.5%), and the Ground score further improves to 0.6524 (+0.0045). With merely 44 K parameters, PDR accounts for 42% of the total improvement contributed by the full model over the LSE-only baseline.
3.5. Computational Complexity
Table 4 details the computational cost introduced by each module. The +VCDH configuration adds 0.63 M parameters over the baseline. This net increase reflects the addition of two viewpoint-specific detection heads (Drone Head and Ground Head, approximately 432 K each), the view_head (16.6 K), and two View Adapters, partially offset by the removal of the original single detection head. The LSE module contributes 353K parameters distributed across P3 and P4. PDR contributes merely 44 K parameters, accounting for less than 1.2% of the total parameter count. The full model achieves a single-image inference latency of 7.7 ms (approximately 130 FPS), far exceeding the real-time threshold of 30 FPS and thereby satisfying the requirements of both vehicle-mounted and UAV-based inspection platforms.
It is worth noting that deeper P2 processing architectures were evaluated during the development process—including attention-based refinement schemes and multi-layer convolution processing schemes. Although these designs possess higher parameter capacity, they exhibited convergence instability and varying degrees of overfitting at the training scale of 3058 images. The minimalist single-layer design of PDR, despite its limited capacity, demonstrates optimal generalization performance in the small-data regime of this specific crack detection task.
3.6. Cross-View Evaluation
Table 5 presents a comprehensive cross-viewpoint robustness evaluation of each model variant using the CVCS framework, revealing the performance characteristics of each configuration across different evaluation dimensions.
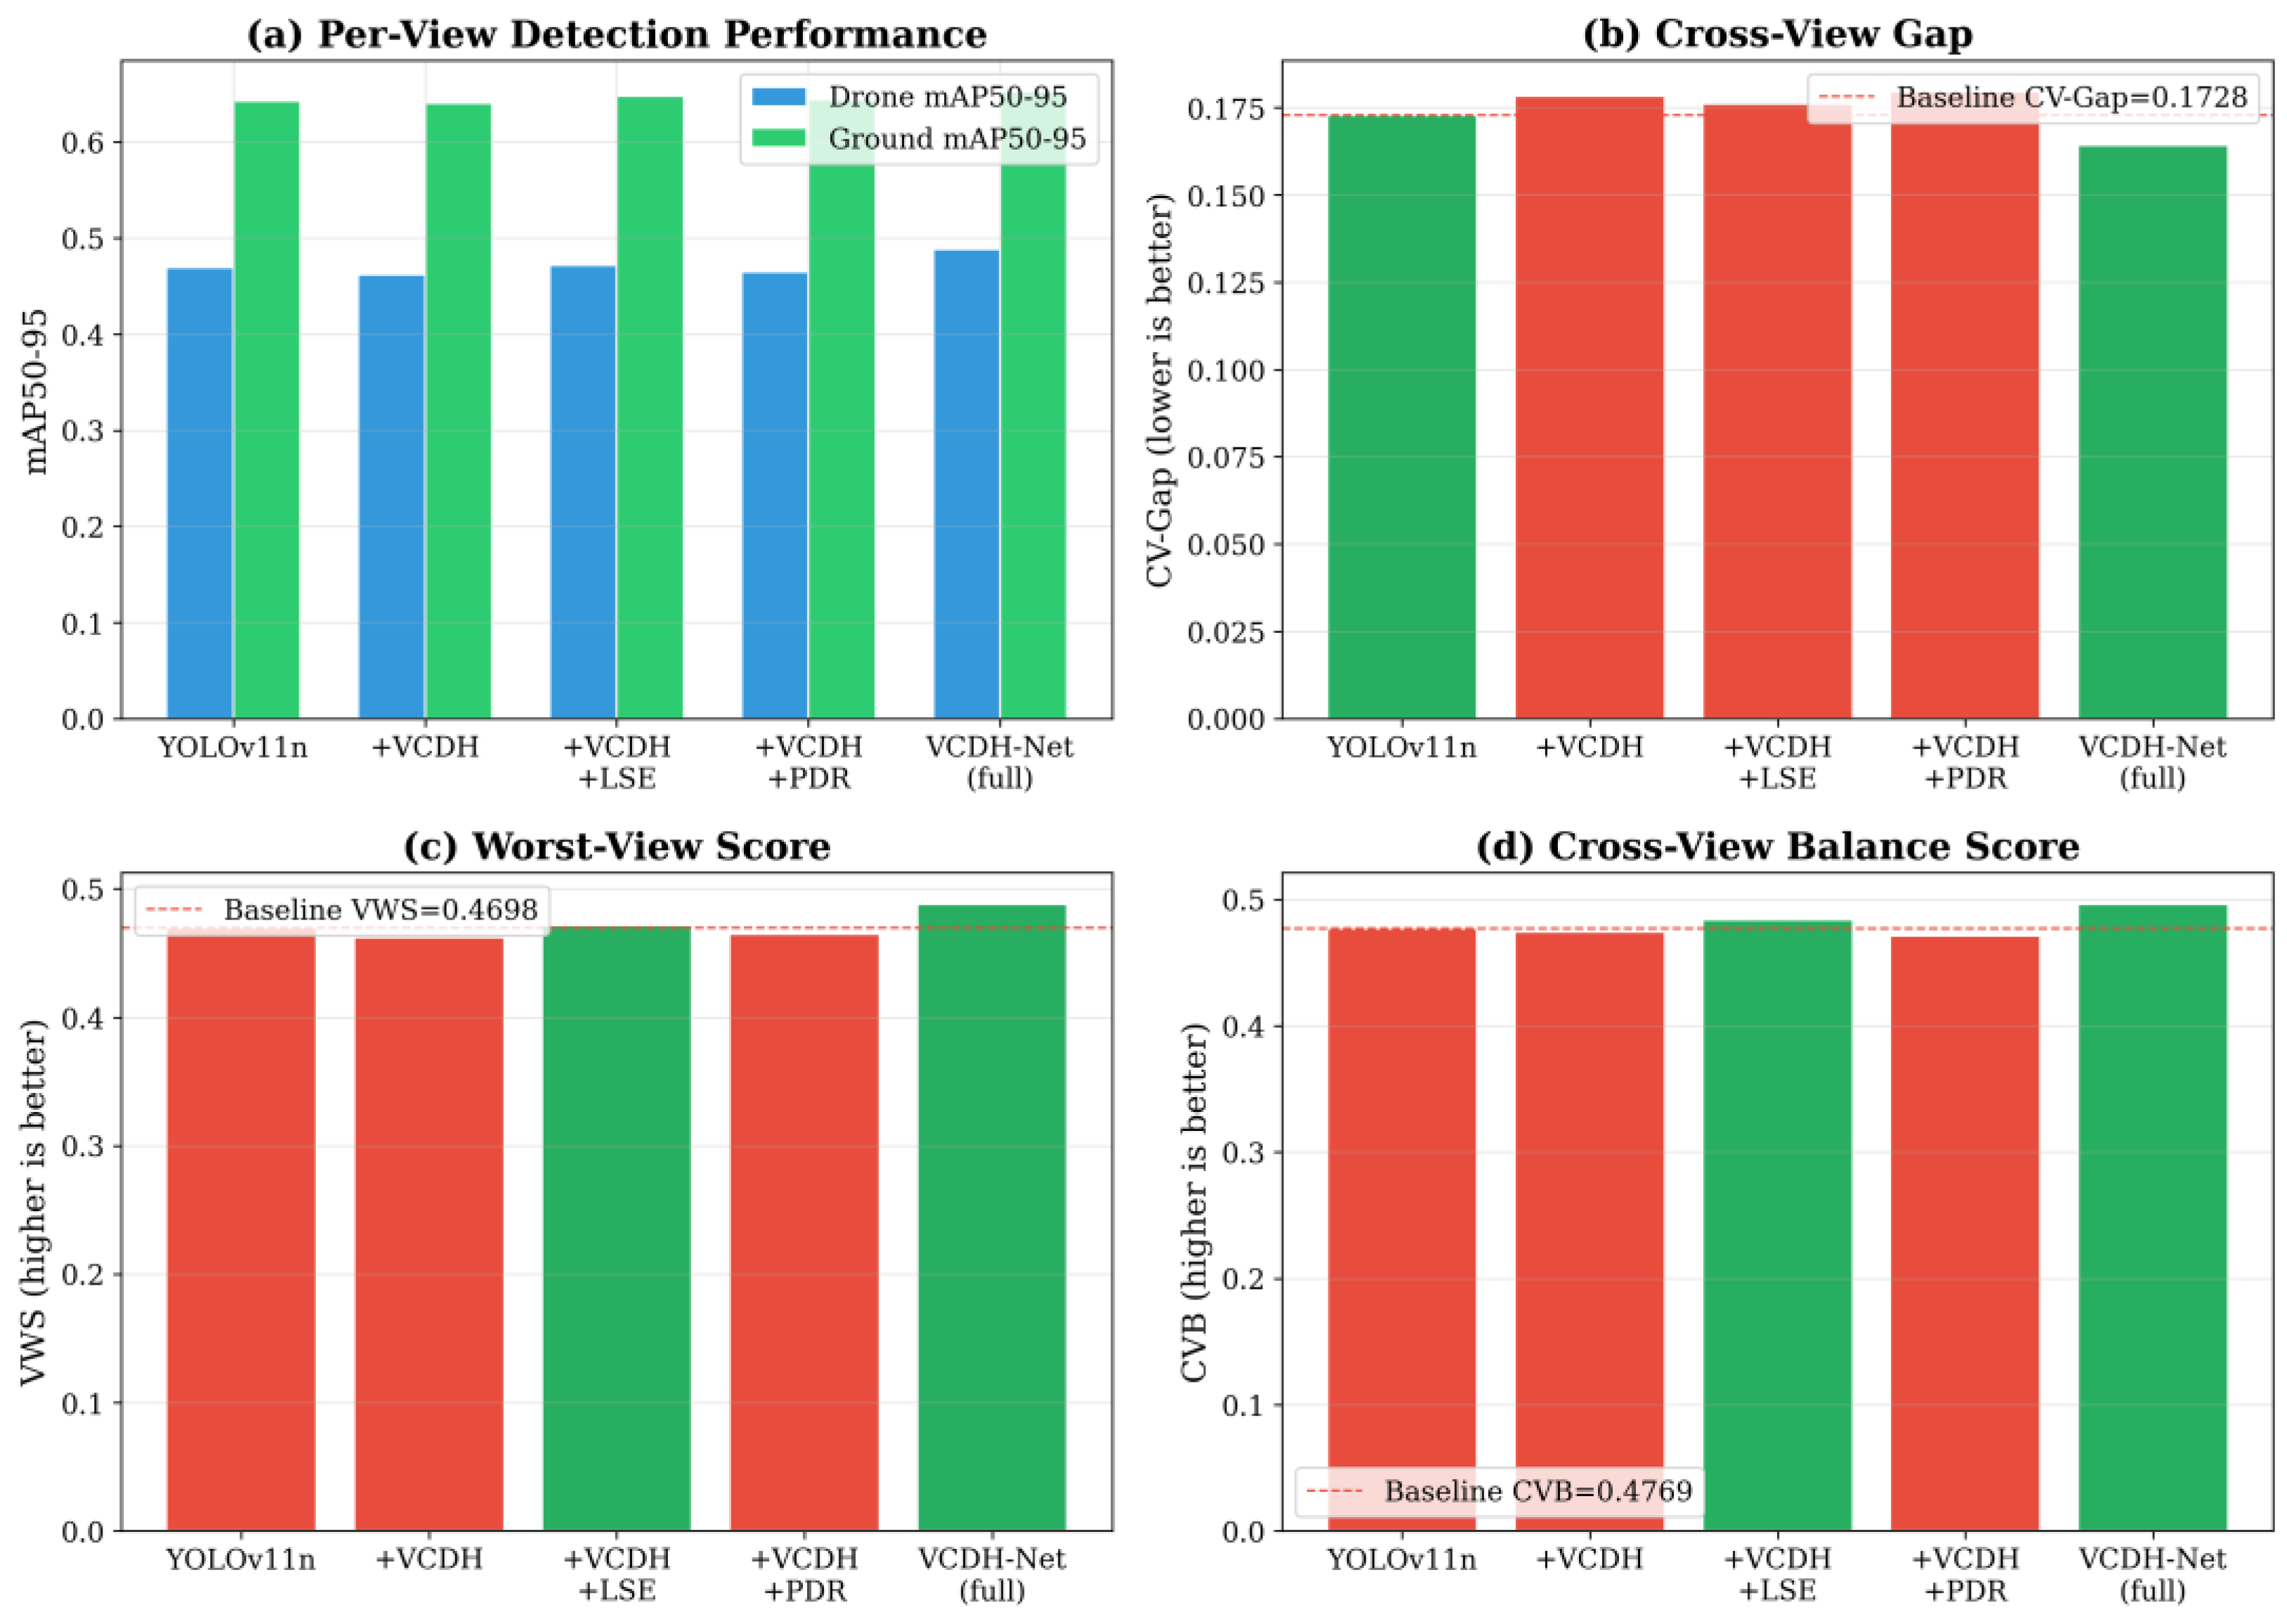
As shown in
Figure 6: (a) viewpoint-wise mAP50-95 comparison—the full model achieves the best performance on both viewpoints; (b) CV-Gap comparison—the full model yields the smallest cross-viewpoint gap; (c) VWS comparison—the full model attains the highest worst-view score; (d) CVB comparison—the full model obtains the best overall balance score. Green bars indicate improvement over the baseline, while red bars indicate degradation relative to the baseline.
The full VCDH-Net achieves the best performance across all three CVCS metrics. The CV-Gap narrows to 0.1642 (−0.0086 vs. the YOLOv11n baseline, −0.0120 vs. +LSE), indicating that the incremental addition of PDR substantially reduces the performance disparity between the two viewpoints. This reduction stems from the targeted improvement of the weaker Drone viewpoint (+0.0167 mAP50-95 vs. +LSE), rather than being achieved at the expense of degrading Ground-viewpoint performance. It constitutes a balanced improvement of the “rising tide lifts all boats” variety, as opposed to a leveling-down regression that merely averages out the disparity by suppressing the stronger side.
VWS reaches 0.4883 (+0.0185 vs. the YOLOv11n baseline, +3.9%), attaining the highest worst-view score among all configurations. From an engineering deployment standpoint, VWS arguably represents the single most important metric: it quantifies the minimum detection quality that the inspection system can guarantee, regardless of which viewpoint is active. The Drone viewpoint offers extensive coverage and high inspection efficiency; should its detection performance be critically low, the entire system cannot be deployed reliably—no matter how well the Ground viewpoint performs. The 3.9% improvement in VWS signifies a substantive enhancement in the reliability of UAV-based inspection.
CVB attains a score of 0.4965 (+0.0196 vs. YOLOv11n, +4.1%), jointly reflecting the dual contributions of the overall accuracy improvement (+0.0155 mAP50-95) and the enhanced cross-viewpoint balance (−0.0086 CV-Gap). The monotonically increasing trend from +VCDH (CVB = 0.4746) through +LSE (0.4842) to the full model (0.4965) provides convergent evidence that the three modules collaboratively contribute to cross-viewpoint robustness.
It is noteworthy that the VCDH-only configuration underperforms the single-head baseline across all three CVCS metrics (CV-Gap widens to 0.1783, VWS drops to 0.4621, and CVB declines to 0.4746). This result reinforces the core finding of the ablation study: structural decoupling alone—in the absence of corresponding support at the feature and detail levels—is not merely insufficient, but may even exert a detrimental effect. The full VCDH + LSE + PDR configuration realizes the intended design synergy: structural decoupling provides the prerequisite condition, geometric enhancement delivers feature quality, and detail refinement furnishes targeted improvement for the Drone viewpoint.
3.7. Visualization Results
Qualitative analysis through visualization further corroborates the effectiveness of each module proposed in this paper.
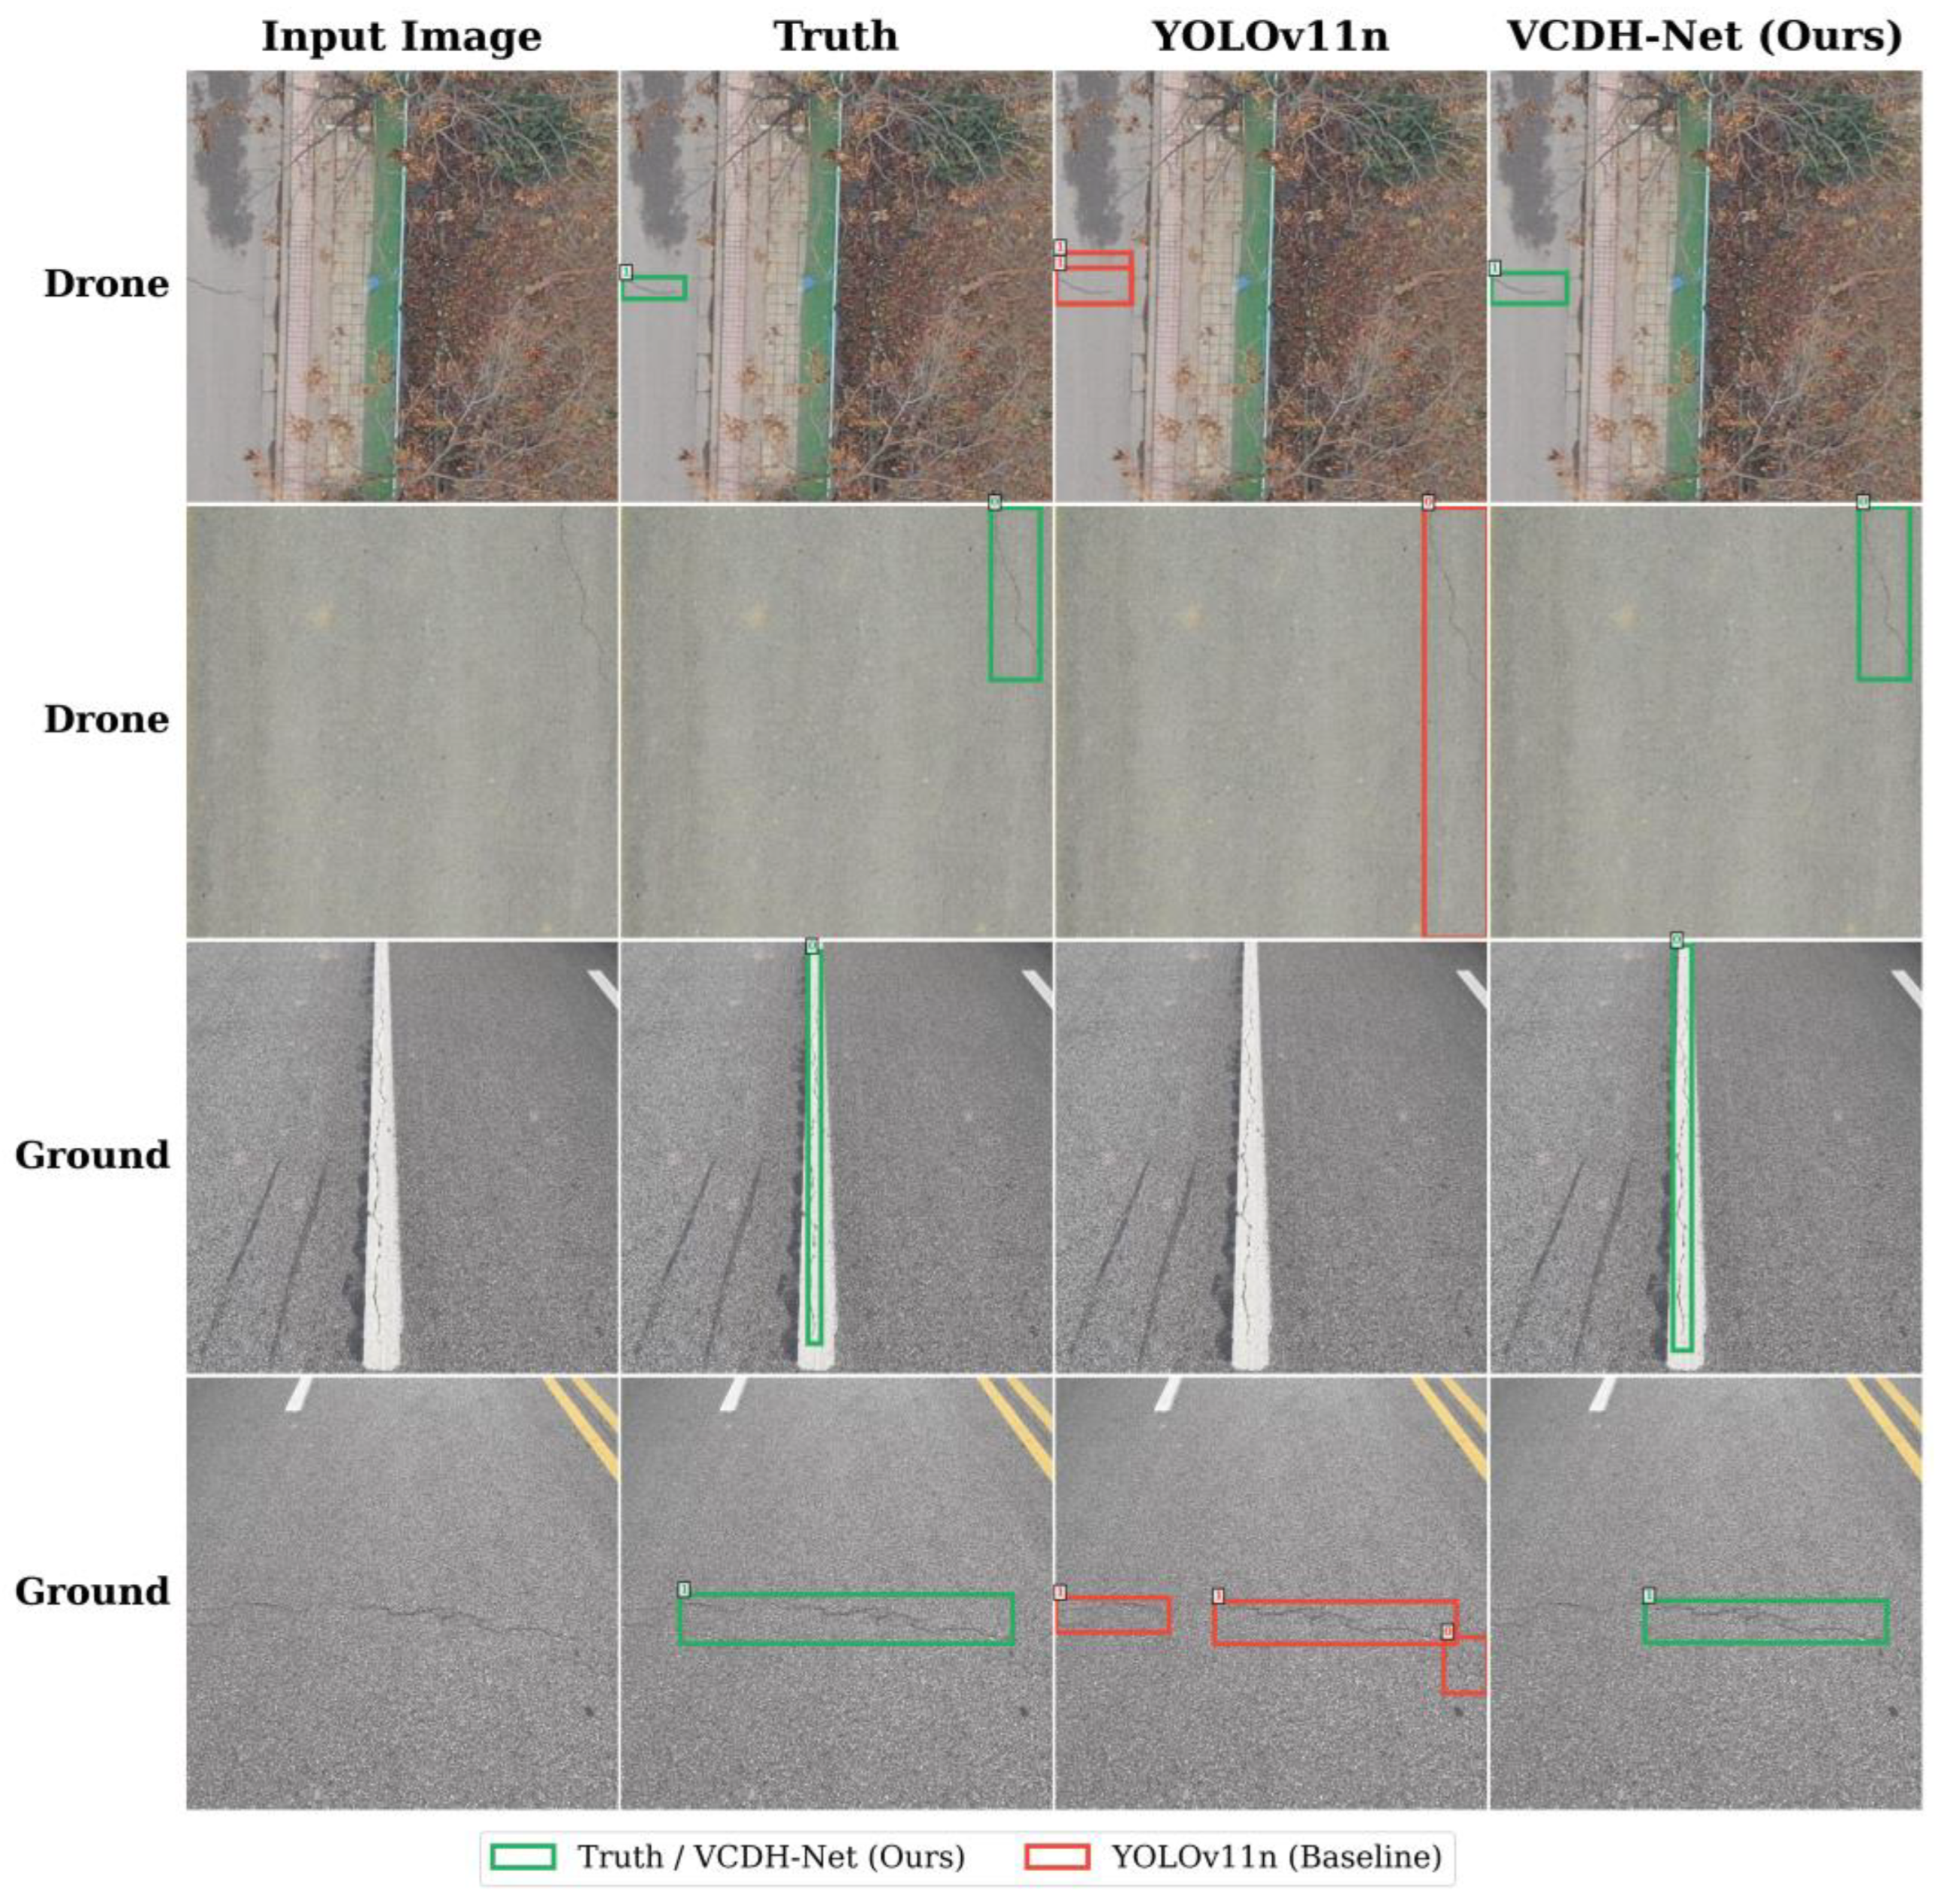
The detection result comparison (
Figure 7) presents the detection outputs of YOLOv11n and VCDH-Net in representative Drone and Ground scenarios. In the Drone scenario, YOLOv11n either misses transverse cracks narrower than 5 pixels or produces bounding boxes with coarse boundaries, whereas the full model successfully detects them and yields more compact localization. In the Ground scenario, the full model discriminates crack boundaries against the asphalt texture background with greater precision, and cases in which oil stains or road markings are misidentified as cracks are notably reduced.
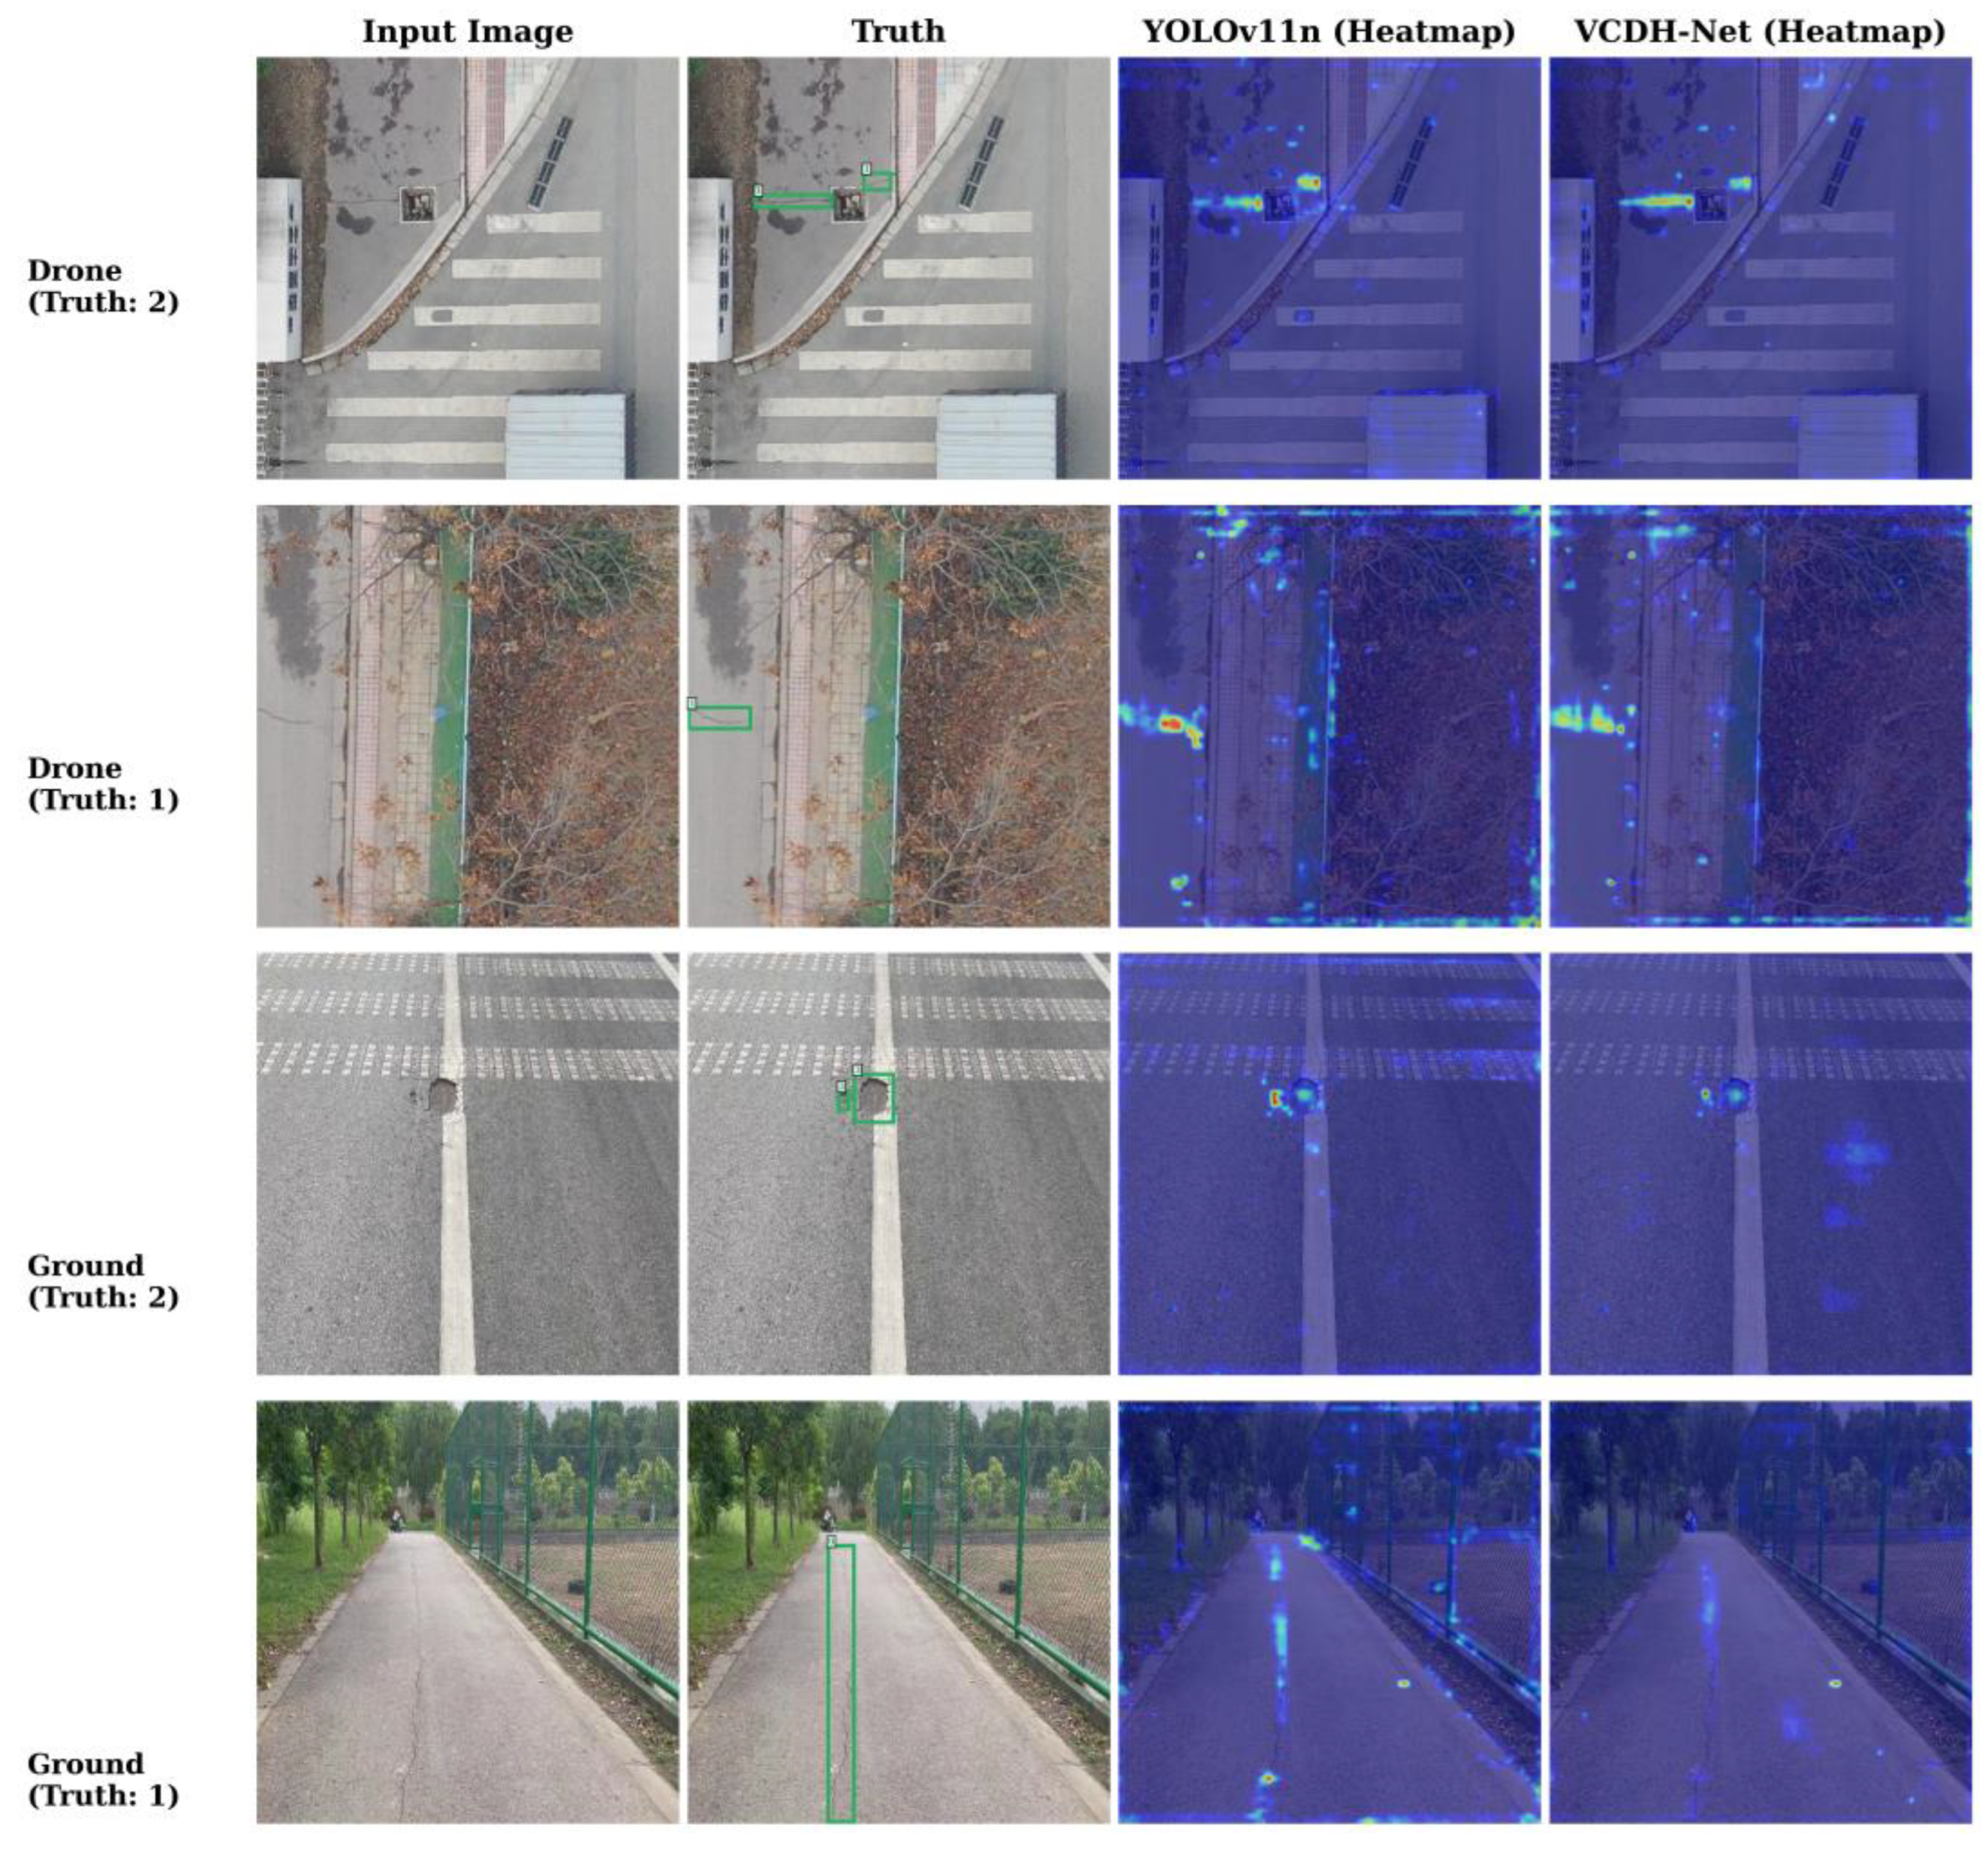
The Grad-CAM heatmaps (
Figure 8) compare the attention distributions of the model under different module configurations. The full model concentrates its attention more precisely on the actual crack regions rather than on background textures, and yields more complete attention coverage over fine cracks in the Drone viewpoint.
As shown in
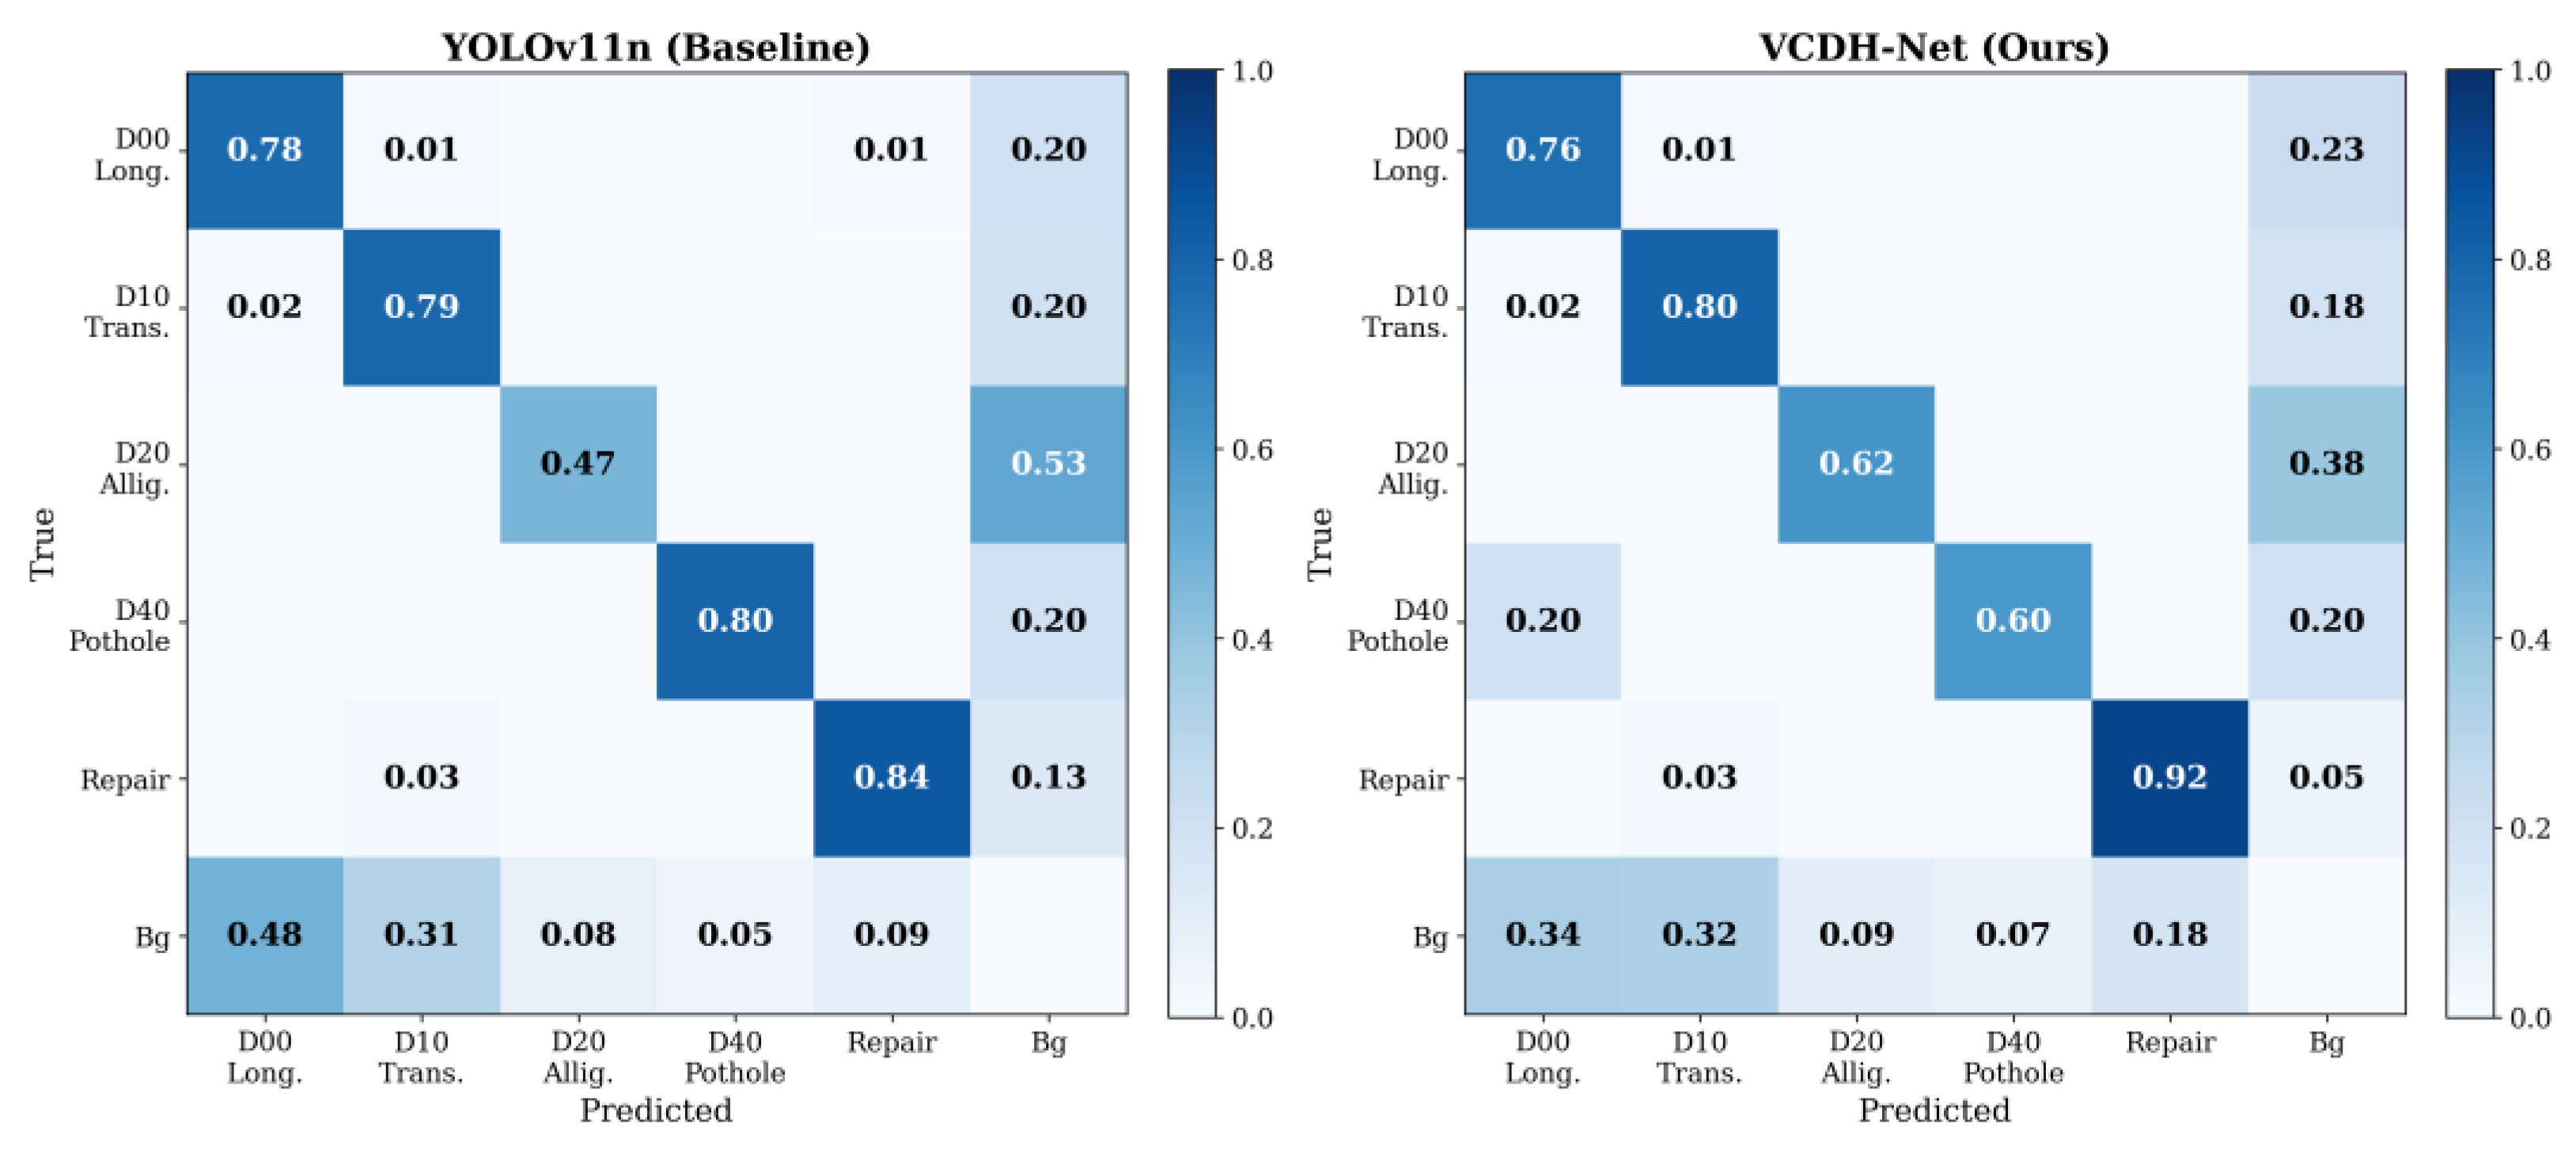
Figure 9, the normalized confusion matrices of YOLOv11n and VCDH-Net provide further insight into the class-level prediction behavior. VCDH-Net achieves improvements for the elongated crack categories, indicating that the proposed LSE module enhances the representation of directional crack structures through asymmetric convolution operations (DW 1 × 5 and DW 5 × 1). Meanwhile, the recognition accuracy of D20 (alligator cracking) increases from 0.47 to 0.62, suggesting that the improved structural representation also benefits irregular crack patterns. However, the diagonal accuracy of D40 (pothole) decreases from 0.80 to 0.60, with part of the samples being misclassified as D00. This phenomenon is mainly related to the crack-oriented design objective of the proposed framework. Since LSE introduces directional priors to strengthen thin and elongated pavement structures, regions within potholes that contain crack-like linear textures may become more likely to be associated with crack categories. Nevertheless, VCDH-Net is primarily designed to improve mixed-view pavement crack detection rather than general pavement distress classification. The enhanced recognition of crack-related categories, particularly small and elongated cracks that are difficult to detect in UAV imagery, demonstrates the effectiveness of the proposed method.
As shown in
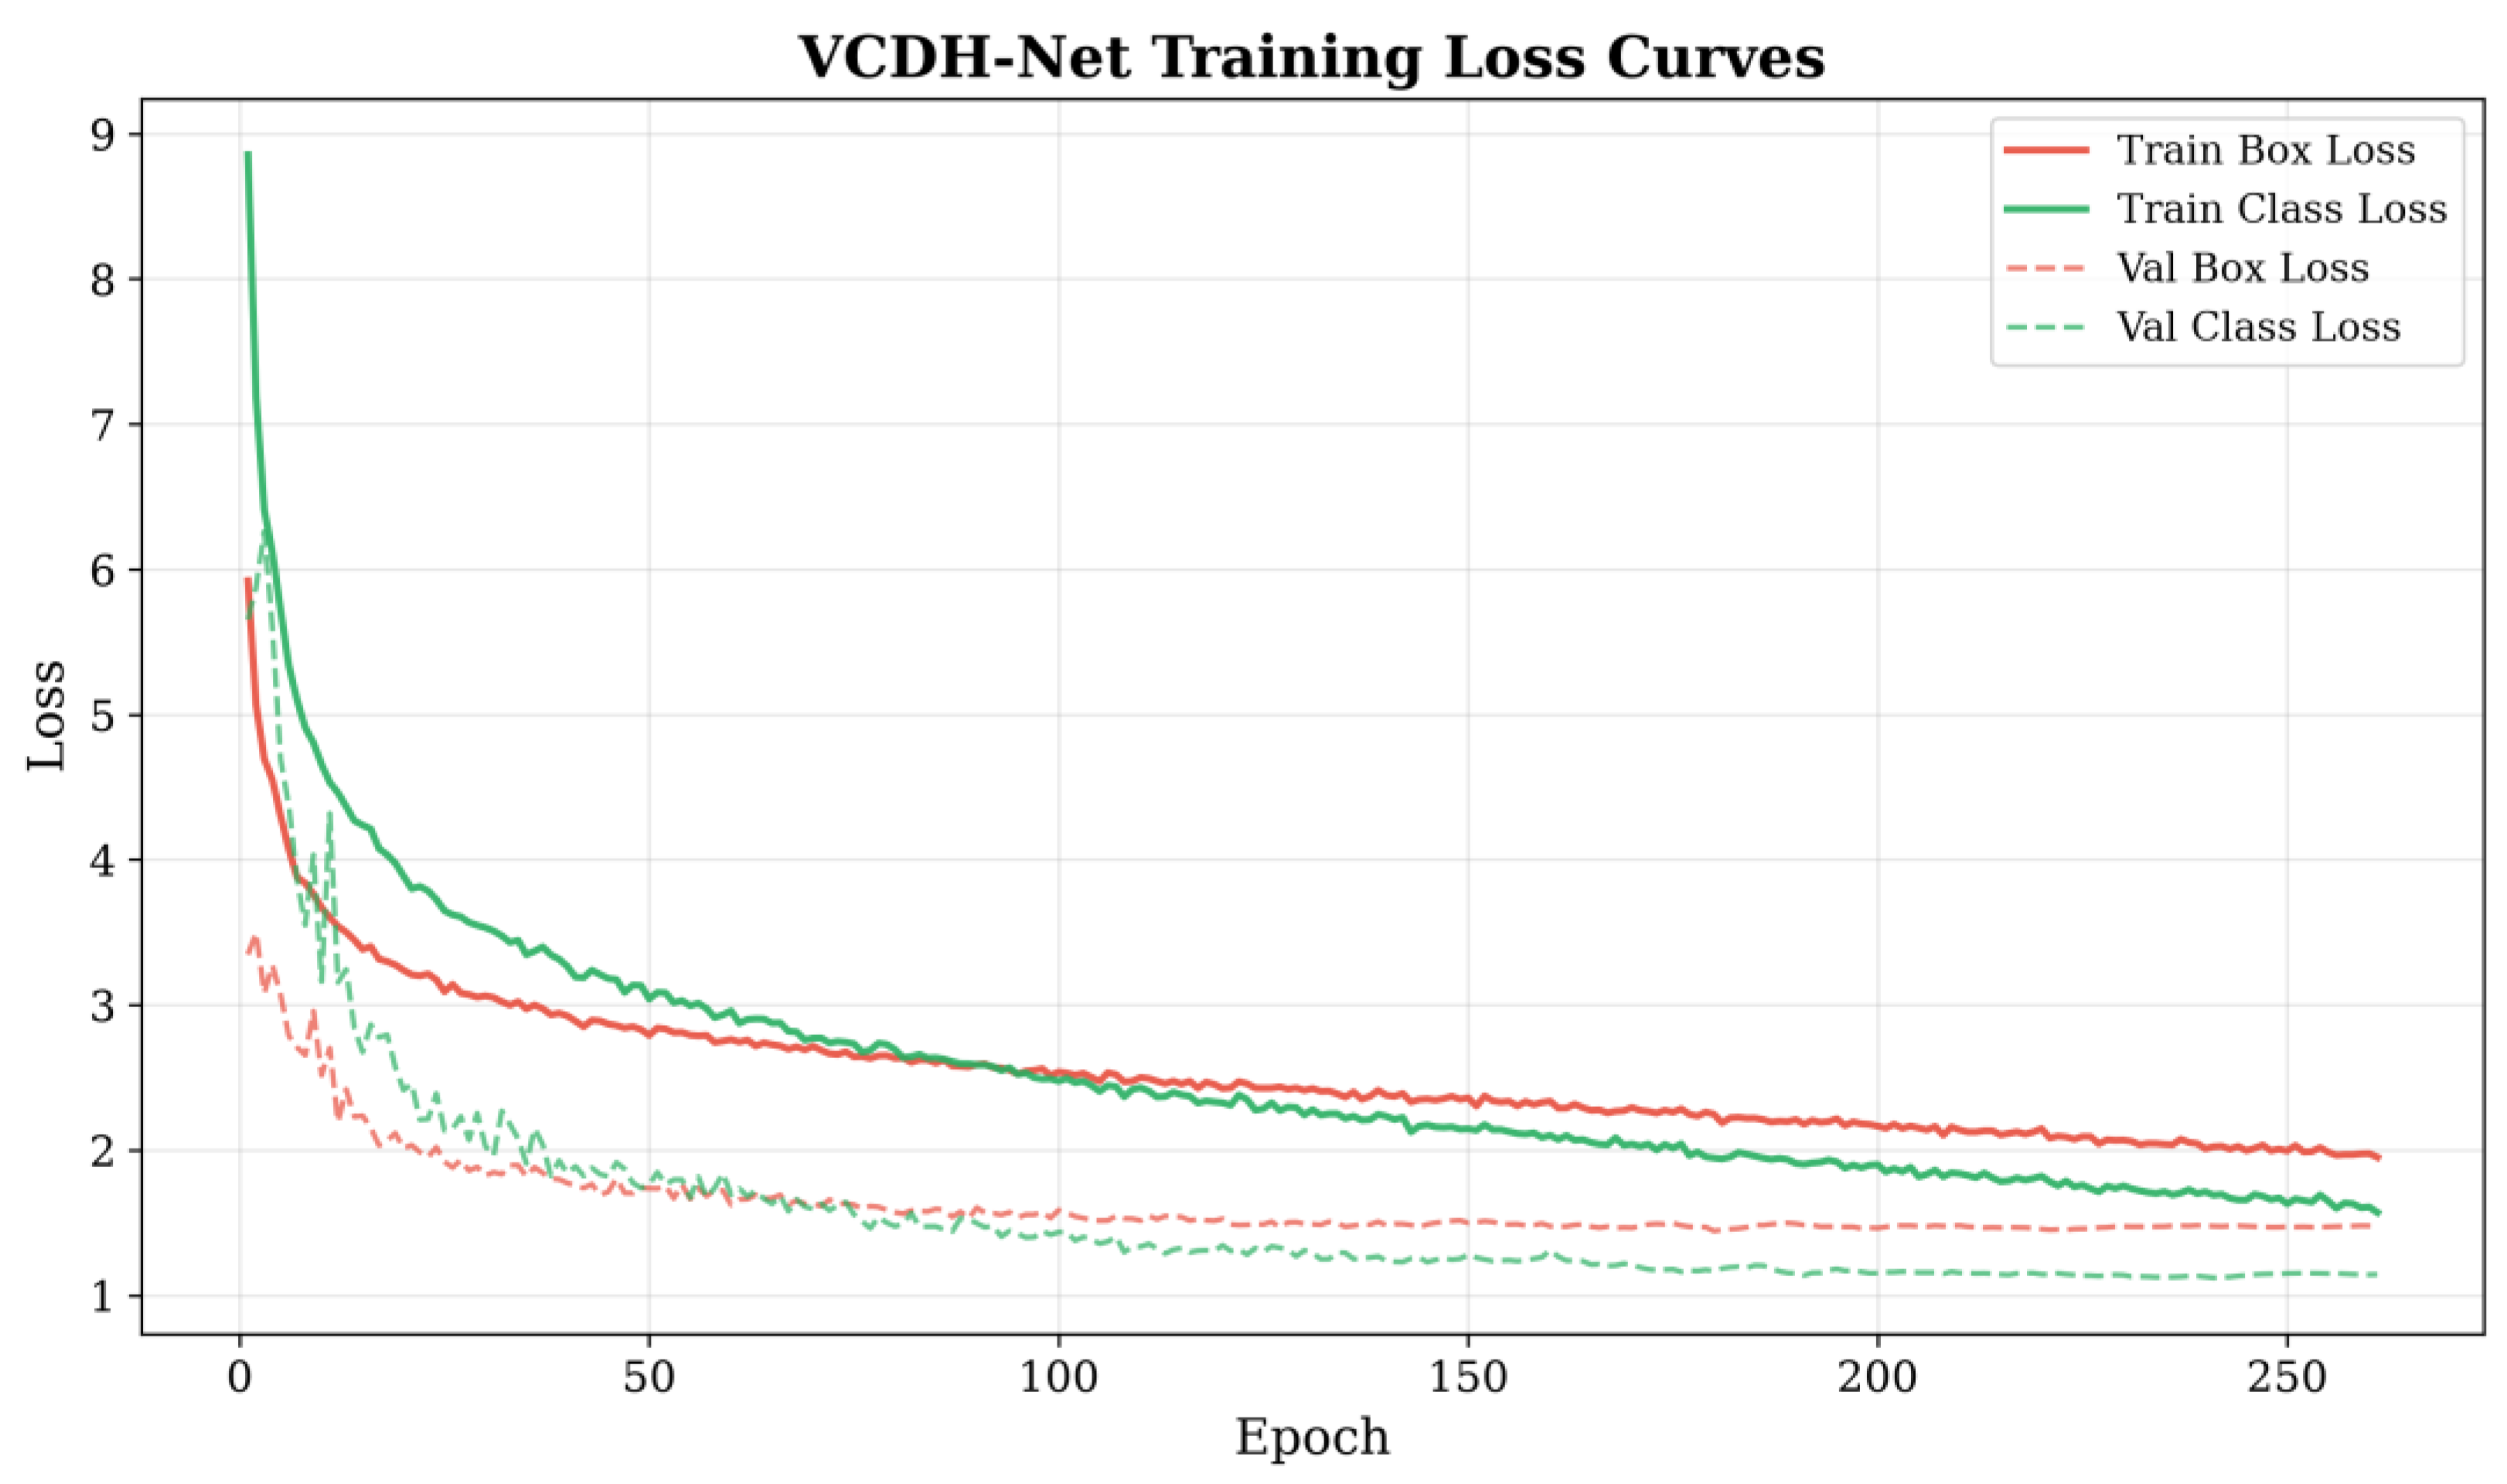
Figure 10, the training and validation loss curves of VCDH-Net demonstrate stable convergence throughout the optimization process. The box regression loss and classification loss decrease rapidly during the early training stage and gradually stabilize as the number of epochs increases, without significant oscillation or divergence.
It should be noted that the absolute loss values in this figure should not be directly compared with those of the original YOLOv11n baseline. The proposed VCDH-Net adopts a viewpoint-conditioned dual-head architecture, where the overall optimization objective consists of the losses from two viewpoint-specific detection branches and an additional viewpoint classification branch. In contrast, the baseline model optimizes only a single detection head. Therefore, the aggregated loss magnitude reflects different optimization objectives and cannot serve as a direct indicator for model superiority.
Instead, the loss evolution in
Figure 10 mainly demonstrates the optimization stability of the proposed framework. Despite the increased structural complexity introduced by viewpoint-specific routing and additional feature enhancement modules, VCDH-Net achieves smooth convergence and stable validation behavior. This indicates that the proposed architecture does not introduce optimization difficulties, while the performance improvements reported in
Table 2 mainly originate from improved viewpoint-specific feature representation and reduced cross-view interference rather than from minimizing the absolute training loss.
To further investigate the detection capability of VCDH-Net under different crack morphologies, a class-wise quantitative evaluation was conducted on the merged test set. As shown in
Table 6, the AP50–95 and Recall values of each crack category are compared between YOLOv11n and the proposed method.
VCDH-Net achieves consistent improvements for most crack categories. Specifically, the AP50–95 of D00 increases from 0.5142 to 0.5377, while D10 and D20 improve from 0.4982 to 0.5131 and from 0.4865 to 0.5133, respectively. These improvements indicate that the proposed LSE module effectively enhances the representation of elongated and irregular crack structures through directional feature extraction.
For D40, although the AP50–95 improves from 0.5741 to 0.5836, the gain is relatively smaller compared with other categories. This phenomenon is reasonable because potholes exhibit larger regional appearances rather than thin linear structures, and therefore benefit less from the directional enhancement strategy designed for crack morphology. The Repair category shows only marginal improvement, which may be attributed to its relatively high baseline performance and limited room for further enhancement.
Overall, the class-wise results demonstrate that VCDH-Net improves detection performance across different crack categories while maintaining robustness for categories with distinct visual characteristics.
It should be noted that the confusion matrix in
Figure 9 and the AP50–95 and Recall values in
Table 6 reflect different aspects of detection performance. The confusion matrix is computed at a fixed IoU threshold of 0.50 and the default Ultralytics confidence threshold, with per-row normalization to the true class count. AP50–95 integrates precision-recall behavior across ten IoU thresholds from 0.50 to 0.95, and Recall is reported as the per-class macro-average. A class may show a moderate diagonal value in the confusion matrix while achieving improved AP50–95 if its detection quality improves under stricter localization criteria. These two representations are therefore complementary rather than numerically equivalent.
4. Discussion
4.1. Effectiveness of the Proposed Framework
The experimental results presented in
Section 3 demonstrate that VCDH, LSE, and PDR do not function as independently operating enhancement components; rather, they constitute a hierarchically structured framework in which three complementary dimensions—structural decoupling, geometric feature enhancement, and spatial detail refinement—operate in synergy. The ablation study (
Table 3) provides systematic evidence for this synergistic relationship.
At the structural level, VCDH establishes the prerequisite for subsequent improvements by decoupling the optimization spaces of the two viewpoints. When VCDH operates alone, the mAP50-95 remains essentially unchanged (Row 2: 0.5637 vs. 0.5633), a result consistent with the data dilution hypothesis—each detection head receives only approximately half of the training samples. This finding, however, does not negate the VCDH design. The critical contribution of VCDH lies in furnishing LSE and PDR with the correct “scope of effect”: each enhancement module operates within its dedicated branch, without perturbing the optimization direction of the other viewpoint. Were LSE and PDR to be applied directly to the shared features of a single-head model, the high-frequency detail reinforcement required by the Drone viewpoint would engender gradient conflicts with the noise-smoothing optimization direction favored by the Ground viewpoint. VCDH eliminates this conflict through structural viewpoint decoupling, which serves as the precondition for the stable gains achieved by the subsequent modules.
At the feature level, LSE bridges structural decoupling and effective detection through geometry-prior-driven enhancement. The bidirectional gains observed in Row 4 (+0.0095 Drone, +0.0075 Ground) validate the efficacy of a key design choice: the geometric priors encoded by LSE—directionality and elongation—are viewpoint-agnostic. Horizontal and vertical cracks are present in both viewpoints, and the asymmetric convolution kernels contribute positively to crack detection irrespective of viewpoint. This universality substantiates the design decision of applying LSE to both branches rather than restricting it to the Drone branch alone.
At the detail level, PDR leverages the dual prerequisites established by VCDH (domain focusing) and LSE (feature localization) to achieve targeted, high-efficiency enhancement. Contributing 42% of the total improvement with merely 44K parameters, PDR demonstrates an outstanding efficiency ratio. This efficiency, however, is contingent upon the preceding modules: without the high-response activation regions for cracks established by LSE, the features received in the P2-resolution space suffer from ambiguous localization, and the subsequent refinement operations introduce more noise than meaningful detail (Row 3: 0.5611, below the baseline).
The synergistic relationship among the three modules can be summarized as follows: VCDH separates two tasks that require different tools, LSE sharpens the feature representation, and PDR enhances fine-grained details—but exclusively within the Drone workspace. Each component is indispensable, and their combination produces a synergistic effect that exceeds the sum of their individual contributions.
4.2. Cross-View Robustness Analysis
The CVCS evaluation framework (CV-Gap, VWS, CVB) introduced in this paper provides a more nuanced characterization of cross-viewpoint detection performance than a single merged mAP alone. The results in
Table 5 reveal several important patterns.
1. Baseline imbalance. YOLOv11n exhibits a pronounced CV-Gap of 0.1728, with the Ground mAP50-95 (0.6426) exceeding the Drone mAP50-95 (0.4698) by 36.8%. This imbalance is structural rather than incidental: the Backbone of YOLOv11n is pretrained on COCO, a dataset dominated by ground-level natural images, and its standard FPN design (P3–P5) implicitly optimizes for objects within a specific scale and texture regime. Cracks in the Drone viewpoint, being smaller in scale and texturally distinct, fall outside this implicitly optimized range. The VWS of 0.4698 quantitatively captures the practical consequence—in a real-world dual-platform deployment, the Drone component would constitute the reliability bottleneck, irrespective of how well the Ground component performs.
2. CVB trajectory as framework validation. The monotonic increase in CVB from the baseline (0.4769) through +VCDH+LSE (0.4842) to the full model (0.4965) furnishes convergent evidence that the progressive design of VCDH-Net systematically improves cross-viewpoint balance. Each module contributes to CVB through a distinct mechanism: VCDH supplies the structural precondition (even though it does not immediately translate into metric gains due to data dilution); LSE enhances both viewpoints through geometric priors, naturally narrowing the gap—the weaker viewpoint (Drone) benefits more substantially from improved feature quality; and PDR delivers targeted improvement to the Drone viewpoint, directly shrinking the CV-Gap. The CVB trajectory thus mirrors the design logic from structural precondition through feature enhancement to targeted detail refinement.
3. Deployment value of VWS. The improvement of VWS from 0.4698 to 0.4883 (+3.9%) carries the most significant practical implication for engineering deployment. In a real-world inspection system, the worst-performing viewpoint determines the overall system reliability—cracks missed by the UAV are not compensated for by cracks detected by ground-level equipment at a different location. The improvement in VWS indicates that VCDH-Net not only elevates the overall accuracy but, more critically, raises the reliability floor—the most valuable metric in safety-critical infrastructure inspection.
4.
Geographic scope and generalization. The necessity of evaluating cross-domain consistency is not limited to pavement crack detection. Similar cross-domain consistency challenges have also been investigated in remote sensing applications, where observations collected from different sensors or acquisition conditions may introduce significant distribution discrepancies and affect model robustness. For example, heterogeneous SAR data fusion methods have explored adaptive feature representation strategies to improve the reliability of urban surface interpretation under varying observation conditions [
41]. These studies highlight that model performance should be assessed not only by overall accuracy but also by its capability to maintain stable predictions under varying observation conditions. The above analysis is conducted on the China subset of RDD2022, which is the only subset that provides paired dual-viewpoint images (drone aerial and ground-level) of the same road segments. The remaining five country subsets (Japan, India, Czech Republic, Norway, United States) contain exclusively single-viewpoint ground-level imagery and therefore do not constitute test beds for cross-viewpoint domain shift. The results reported here are obtained on roads in and around Nanjing under a specific set of illumination and pavement conditions. Whether the proposed architecture generalizes to other geographic regions, pavement materials, or climatic conditions remains an open question. Validation on multi-viewpoint datasets covering broader geographic diversity awaits the availability of such data in the public domain.
4.3. Limitations and Future Work
Despite the significant effectiveness demonstrated by VCDH-Net, several limitations merit discussion and point to directions for future research.
1.
Insufficient environmental robustness. The dataset employed in this study was primarily collected under daytime natural illumination conditions. Performance under adverse conditions—such as low-light nighttime scenarios, rain-induced reflections, fog, and strong glare—has yet to be evaluated. Infrared imaging, which is insensitive to illumination variations, can reveal subsurface thermal anomalies associated with crack structures [
42].
2. Joint class–viewpoint sparsity. The 3058 training images are distributed across five classes and two viewpoints, resulting in extremely limited sample sizes for certain rare class–viewpoint combinations. This constrains the model’s ability to learn robust representations for minority classes, particularly under the weaker Drone viewpoint. Future work may explore targeted data augmentation strategies (e.g., viewpoint-aware generative adversarial networks for cross-viewpoint sample synthesis), few-shot learning techniques tailored to rare class–viewpoint pairs, or balanced sampling strategies that account for the joint distribution of class and viewpoint.
3. Architectural scalability of detail enhancement. The minimalist single-layer design of PDR was chosen on the basis of empirical stability on a dataset of 3058 images. On larger-scale datasets, deeper P2 processing architectures—encompassing multi-layer convolutional refinement, attention-based feature aggregation, and learnable upsampling operators—may reach a higher performance ceiling. Investigating how the scaling behavior of the detail enhancement module evolves with dataset size constitutes a natural extension of this work.
4.
Potential of Transformer architectures. The VCDH framework is currently instantiated with a CNN backbone (YOLOv11n). Vision Transformer architectures [
43,
44] have demonstrated remarkable capability in modeling long-range spatial dependencies, a property highly relevant to crack detection, where cracks span substantial spatial extents yet possess extremely narrow cross-sections. Adapting the VCDH dual-head paradigm to a Transformer backbone—in which the self-attention mechanism may inherently capture the directional features explicitly encoded by LSE—represents a direction worth exploring. The challenge lies in preserving the parameter efficiency and inference speed that render the CNN-based VCDH-Net practically deployable.
4.4. Deployment Considerations
The design choices in VCDH-Net carry practical implications for edge deployment. At 3.62 M parameters and 8.90 GFLOPs, the full model fits within the memory and compute budget of typical UAV onboard processors such as the NVIDIA Jetson Orin NX. Single image inference on an RTX 4060 Laptop GPU takes approximately 7.7 ms, and the conditional execution pattern of the dual-head architecture means only one detection head runs per frame, keeping the per-inference cost close to that of a standard single-head YOLOv11n. The PDR module adds only 44 K parameters via a lightweight upsample-refine-downsample path that leaves the detection head structure untouched; it can be removed on severely resource-constrained platforms with a minimal accuracy drop of roughly 0.65 mAP50-95. All components rely on standard convolution and pooling operations supported by ONNX and TensorRT, allowing straightforward model export and quantization without custom operator registration. These properties make the framework suitable for real-time onboard crack inspection on commercial drone hardware without architectural modification.
5. Conclusions
This paper addresses the pronounced domain gap between Ground and Drone viewpoints in mixed-viewpoint pavement crack detection by proposing VCDH-Net, a viewpoint-conditioned dual-head detection framework with progressive improvements at the structural, feature, and detail levels. On a dual-viewpoint dataset collected from roads in and around Nanjing, China, VCDH-Net achieves an mAP50-95 of 0.5788 (+2.7% over the YOLOv11n baseline), and the Worst-View Score rises from 0.4698 to 0.4883 (+3.9%). Within the tested geographic and viewpoint conditions, these results confirm that the proposed framework effectively narrows the cross-viewpoint performance gap while maintaining a lightweight architecture. Generalization to other regions, pavement materials, and climatic conditions requires further validation on multi-viewpoint datasets with broader coverage, which are not yet publicly available.
The three progressive contributions of this paper are as follows. At the structural level, VCDH achieves detection head specialization through a viewpoint classifier and a routing mechanism, enabling viewpoint-adaptive detection at merely 24% of the parameter cost of independent models. At the feature level, LSE (deployed at P3 and P4) replaces data-driven generic attention with geometry-driven asymmetric convolutions, stably enhancing the representation of directional crack structures in small-data settings. At the detail level, PDR supplements the spatial details of small Drone-view cracks through a super-resolution residual pathway with only 44 K parameters. Furthermore, the CVCS cross-viewpoint evaluation framework furnishes multi-dimensional metrics that transcend the single mAP in assessing mixed-viewpoint detection performance.
Future work will focus on multi-viewpoint extension, multi-modal fusion, exploration of Transformer architectures, and lightweight deployment on edge devices.