Article

Monitoring Spatiotemporal Forest Fragmentation in Urban Landscapes: An Improved Urban Fringe Mapping Approach Using Time-Series Remote Sensing Data


Zhejiang Provincial Key Laboratory of Wetland Intelligent Monitoring and Ecological Restoration, Institute of Remote Sensing and Earth Sciences, Hangzhou Normal University, Hangzhou 311121, China
*
Author to whom correspondence should be addressed.
Remote Sens. 2026, 18(14), 2405; https://doi.org/10.3390/rs18142405
Submission received: 9 June 2026 / Revised: 8 July 2026 / Accepted: 15 July 2026 / Published: 20 July 2026
(This article belongs to the Special Issue Remote Sensing Applied in Urban Environment Monitoring)

Highlights

What are the main findings?
  • A temporal precedence of urban fringe degradation over the core was observed, with fragmentation peaking during edge expansion.
  • The sharpest losses occurred in high-forest cities, and the most severe fragmentation was observed in the island of Zhoushan.
What are the implications of the main findings?
  • A transferable multi-dimensional framework incorporating nighttime LST was applied for spatiotemporally comparable urban fringe mapping.
  • Multi-dimensional fusion outperformed any single dimension, with nighttime light being optimal.

Abstract

Urban fringe forests deliver critical ecosystem services yet face irreversible loss and complex degradation under urbanization, while their fragmentation dynamics relative to core forests remain largely unquantified owing to the lack of a spatiotemporally consistent mapping approach. To address this gap, a multi-source remote sensing framework integrating land cover, population, nightlight, and land surface temperature data was developed to delineate urban fringe boundaries and quantify forest dynamics in Zhejiang Province via area-weighted centroids and landscape metrics, where high forest cover and a polycentric urban structure create a highly heterogeneous and dynamic fringe environment, enabling separate quantification of spatiotemporal fragmentation patterns for urban fringe and core forests from 2004 to 2024. The results are as follows: (1) The four dimensions (land, population, economy, and environment) produced spatiotemporally distinct boundaries, with multi-dimensional integration outperforming any single indicator and nighttime light being the best. Meanwhile, the total fringe area grew from 2989.04 to 3990.66 km2 over two decades, with the fastest growth in 2004–2014 and the most rapid boundary shifts in 2014–2019. (2) The fringe forest proportion dropped from 24.72% to 18.37%, with the largest decline in southwestern high-forest cities. Meanwhile, Hangzhou and Ningbo fringe forests increasingly assumed the main ecological carrier role formerly held by core forests, with their centroids moved southwestward most markedly in 2009–2014 and displaying a more consistent direction than core forests. (3) Fragmentation metrics showed a higher patch density and splitting index but lower connectivity in the fringe than in the core, with intensification peaking in Zhoushan and coinciding with intensive edge expansion in 2009–2014, followed by later responses in the core. This study provides a transferable multi-dimensional remote sensing methodology for urban fringe mapping indicating that fringe forests may serve as early-warning signals of urbanization-induced forest degradation, enabling spatially targeted forest management across varied urban contexts.

1. Introduction

Urban fringe areas serve as a rapidly expanding frontier of human settlement and a critical interface for service provision and climate vulnerability, thereby mitigating the environmental impacts of urbanization [1,2]. Unlike those in core urban areas, forests in these zones suffer from largely irreversible loss due to complete land conversion amidst complex changes, including deforestation driven by sprawling low-density development, as well as afforestation, fragmentation, and degradation under mixed land-use pressures [3,4]. By providing essential ecosystem services such as regulating local climate, mitigating urban heat islands, sustaining biodiversity, and offering recreation for rapidly growing peri-urban populations under accelerated land conversion, forests in these zones have been prioritized as a core research frontier by leading international forest and sustainability organizations [5,6,7].
Compared with conventional field-based ecological investigations, satellite remote sensing, equipped with passive and active sensors, has been adopted as the predominant and efficient approach for spatiotemporally consistent monitoring of forest dynamics in urban fringe areas [8,9]. As the most fundamental topic within this domain, the mapping of urban fringe areas remains challenging due to the conceptual complexity and spatiotemporal heterogeneity inherent to the fringe [10,11]. Conventionally, six dimensions including land, population, economy, environment, public facilities and building morphology, have been extensively utilized to characterize urban fringe areas [12,13]. Land features have been identified as the most fundamental dimension for urban fringe delineation, attributed primarily to the sharp gradients in built-up density observed across the urban–rural gradient [14,15]. In contrast, population and economic indicators are generally treated as supplementary dimensions that capture the intensity of human activities, whereas the remaining three categories are considered complementary features [16,17,18]. Updated remote sensing products, such as land use maps, global population grids, and nighttime light data, have earned their reputation as common proxies for human activities and urbanization, an advantage benefiting urban fringe identification [19,20,21]. However, existing remote sensing studies on urban fringe delineation have commonly relied on the decay gradient of selected dimensions, such as land, population, or economic indices measured from the city center within political-administrative units [22,23]. Its limitations include an insufficient characterization of the complex features of urban fringe areas and a neglect of gradient effects from polycentric or county-level centers, which lead to systematic boundary misplacement, most notably a pronounced underestimation of fringes around secondary centers and an irreversible loss of multi-dimensional information [17,24]. Following urban fringe delineation, subsequent remote sensing studies have quantified forest changes by estimating spatiotemporal patterns, biophysical parameters and ecosystem functions [25,26,27]. Systematic tracking of fragmentation dynamics is increasingly recognized as the most sensitive indicator of urbanization-driven forest degradation in critically vulnerable fringe zones, thereby emerging as a key international research priority [28,29,30]. A critical research gap remains in the spatiotemporally explicit and comparable quantification of multidimensional urban fringe identification. Consequently, the dynamics of fringe forests, particularly their fragmentation patterns relative to urban cores, have been insufficiently explored.
To address this gap, a remote sensing-based method was developed for the spatiotemporally explicit and efficient analysis of forest fragmentation dynamics in urban landscapes via an improved and comparable delineation of urban fringe areas in Zhejiang Province. Zhejiang has a forest coverage of approximately 61% and a pronounced polycentric urban structure. This combination makes its urban fringe zones highly dynamic and heterogeneous, as evidenced by mixed land use patterns, sharp built-up density gradients, and ongoing urban–rural transitions [31,32]. Nevertheless, long-term quantitative studies on forest change within these critical fringe zones remain scarce. The existing literature has largely focused on provincial-scale forest loss assessments or city-level fragmentation analyses, without systematically tracking the temporal evolution of fragmentation in the urban fringe [33,34]. Accordingly, in this study, a multidimensional remote sensing framework was developed to identify urban fringe areas by integrating county-level administrative centers and multi-source data (land cover maps, population count grids, nighttime light data, and land surface temperature datasets) from 2000 to 2024. Urban forest dynamics were subsequently quantified via area changes, area-weighted centroids, and landscape pattern indices. Finally, a descriptive comparison of the spatiotemporal evolution characteristics of forest fragmentation in the urban fringe and core areas was presented for Zhejiang over the past two decades.

2. Materials and Methods

2.1. Study Area

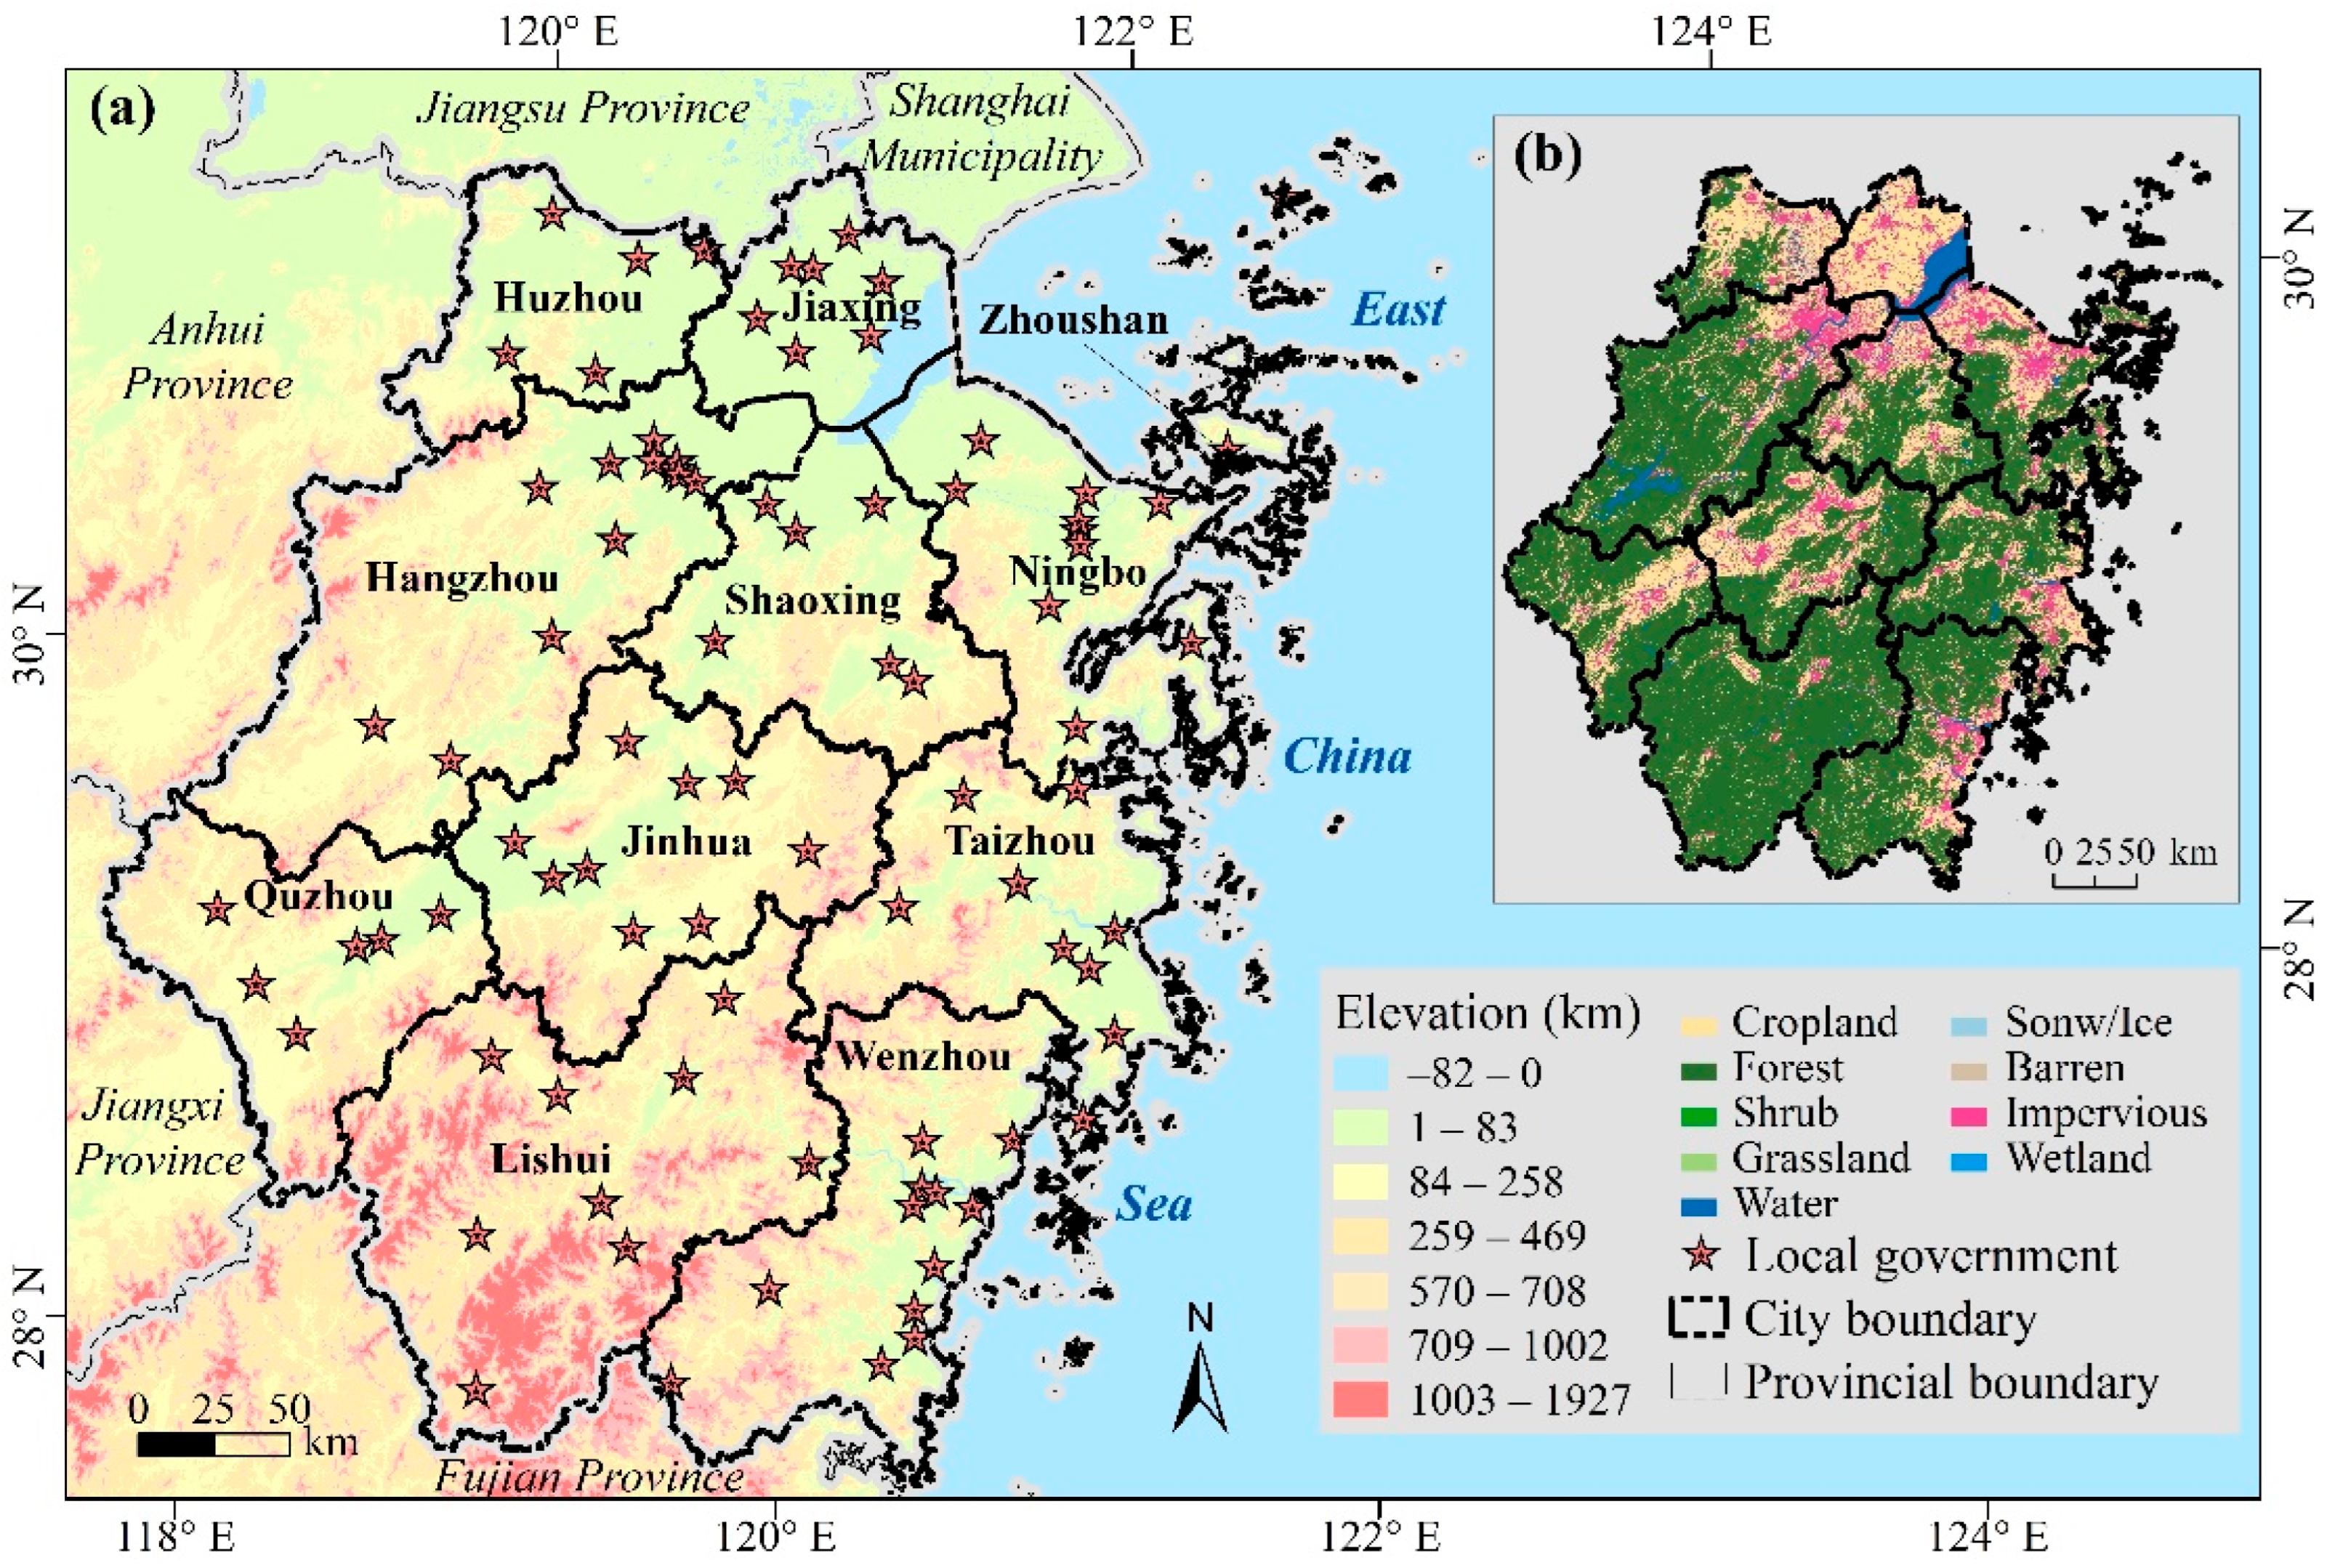
The study area, i.e., Zhejiang Province (118°1′23″–122°50′3″E, 27°8′37″–31°10′51″N) is situated in the southern part of the Yangtze River Delta, eastern China, covering a land area of approximately 104,458 km2 (Figure 1). The province is characterized by a rugged, hilly terrain that accounts for approximately 70% of its total area, with a general topographic gradient descending from southwest to northeast [35]. It experiences a typical subtropical monsoon climate, with abundant annual precipitation and a mean annual temperature ranging from 15 to 18 °C [36]. These favorable natural conditions support dense vegetation cover; the province’s forest coverage rate reached approximately 61% in recent years, making it one of the most heavily forested provinces in eastern China [37]. This region is also one of the most economically dynamic and urbanized provinces in China. By 2024, its permanent urban population exceeded 75% of the total, and the province has long maintained the smallest urban–rural income gap nationally (a ratio of 1.83 in 2024) [38]. Its urban system exhibits a pronounced polycentric structure, with multiple growth poles. This polycentric pattern has driven spatially heterogeneous urban expansion, creating diverse and dynamic urban–rural gradients across the province, especially in county-level administrative units, where population and economic factors are distributed unevenly [39]. A total of 89 county-level governments belonging to 11 prefecture-level cities are adopted as the basic units to capture urban–rural gradients across multidimensional elements, thereby enabling the delineation of spatiotemporally explicit patterns of urban fringe areas and forest dynamics at the level of individual polycentric prefecture-level cities as well as the whole province.

2.2. Data and Preprocessing

In this study, four remote sensing products spanning 2004–2024 were employed to extract multidimensional indices and thereby comprehensively identify urban fringe areas. These products included the China Land Cover Dataset (CLCD), LandScan Global population count grids, National Polar-Orbiting Partnership Visible Infrared Imaging Radiometer Suite-Like (NPP-VIIRS-like) nighttime light data, and the Moderate Resolution Imaging Spectroradiometer (MODIS) nighttime land surface temperature (LST) dataset (Table 1). Based on training samples and Landsat imagery, CLCD land-cover maps were generated annually on the Google Earth Engine platform using a random forest classifier, achieving an overall accuracy of 79% and gaining recognition for reliable land-use area estimation [40]. These maps were downloaded for the corresponding locations and years and then reclassified into two categories: built-up land (impervious surfaces in CLCD) and non-built-up land (all other CLCD types). Subsequently, the Fishnet tool in ArcGIS 10.2 was used to quantify built-up land density—defined as the proportion of built-up land area within each grid cell—at a spatial resolution of 1 km.
Exploiting census and remotely sensed data within a multivariable machine learning modeling framework, the LandScan Global products developed by Oak Ridge National Laboratory have been widely used to accurately map wall-to-wall population across multiple scales [41]. These LandScan Global grids were downloaded and then extracted for the study area. Then, using the Fishnet tool in ArcGIS 10.2, the total population was calculated at a spatial resolution of 1 km, which also directly yields population density (in persons per square kilometer).
By effectively harmonizing DMSP-OLS and NPP-VIIRS nighttime light data sources, the NPP-VIIRS-like dataset has demonstrated its capability to monitor socioeconomic activities in urban areas and their long-term dynamics [42]. In this study, NPP-VIIRS-like products were downloaded and then extracted for the study area using the ArcGIS 10.2 software. The nighttime light intensity was calculated at a spatial resolution of 1 km with the Fishnet tool in ArcGIS 10.2.
The annual 1-km nighttime LST dataset for China, derived from the MODIS 8-day 1 km LST product (MOD11A2), was obtained from the Resource and Environmental Science Data Platform. Nighttime LST was chosen over daytime LST to capture the thermal inertia of impervious surfaces and anthropogenic heat release, as it eliminates direct solar interference and is temporally consistent with the nighttime light data used in this study. The underlying MOD11A2 product has been validated to Stage 2, with its accuracy assessed across widely distributed locations and time periods [43,44]. Nighttime LST is less affected by solar geometry and more directly reflects the thermal inertia of impervious surfaces and anthropogenic heat release, enabling a clear distinction between the persistently warmer built-up core and the cooler, more heterogeneous urban fringe areas [45].
All data sources were processed within a unified 1 km buffer framework centered on county-level administrative seats, rather than via uniform raster resampling. The original projection of each data source was retained during buffer generation to ensure accurate distance calculations, while the Albers equal-area conic projection was applied only for final area measurement.

2.3. Methods

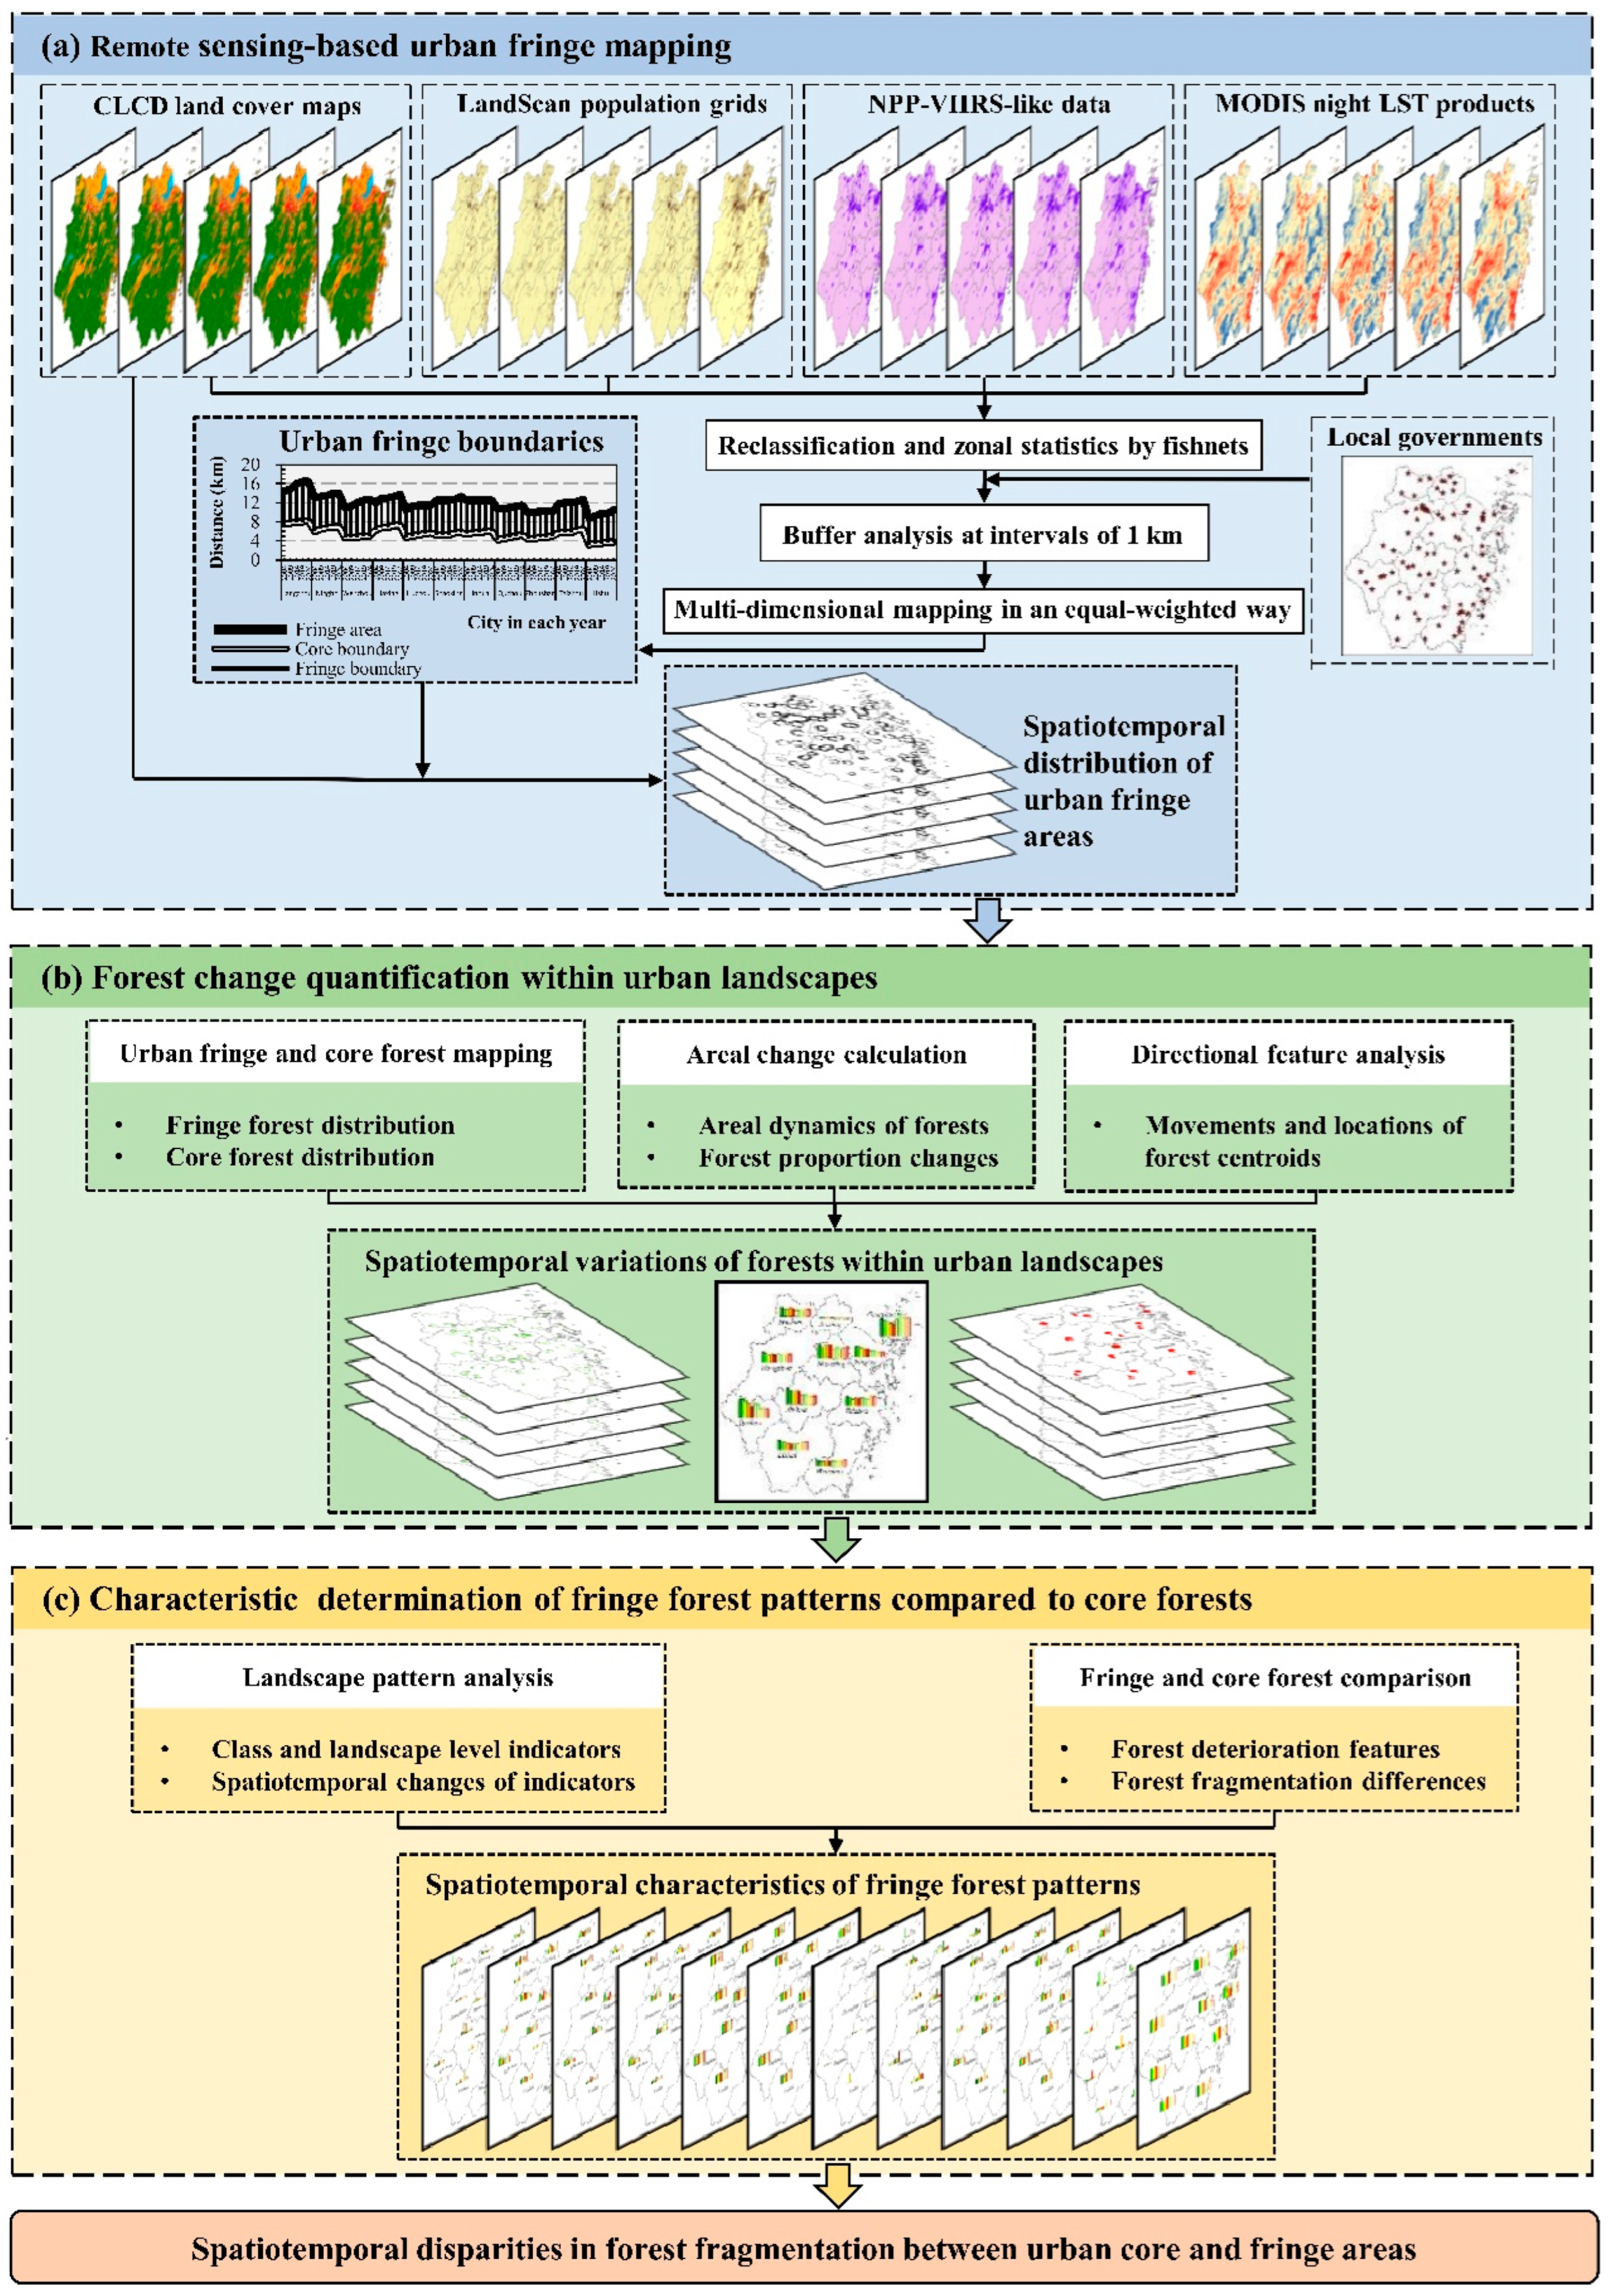
The workflow comprises three major sections to characterize spatiotemporal differences in forest fragmentation between urban fringe and core areas using multidimensional remote sensing data (Figure 2). Indeed, urban fringe areas of Zhejiang Province were identified based on multidimensional remote sensing data and the locations of local governments. Then, using land-cover maps and area-weighted centroids, the spatiotemporal variations in forests within urban landscapes were illustrated. Subsequently, a spatiotemporal pattern analysis using landscape pattern indices was conducted. Finally, spatiotemporal pattern variations in forest fragmentation within urban landscapes were described by comparing the core and fringe areas. All comparisons in this study were descriptive and based on directly computed landscape metrics.

2.3.1. Identification of Urban Fringe Areas

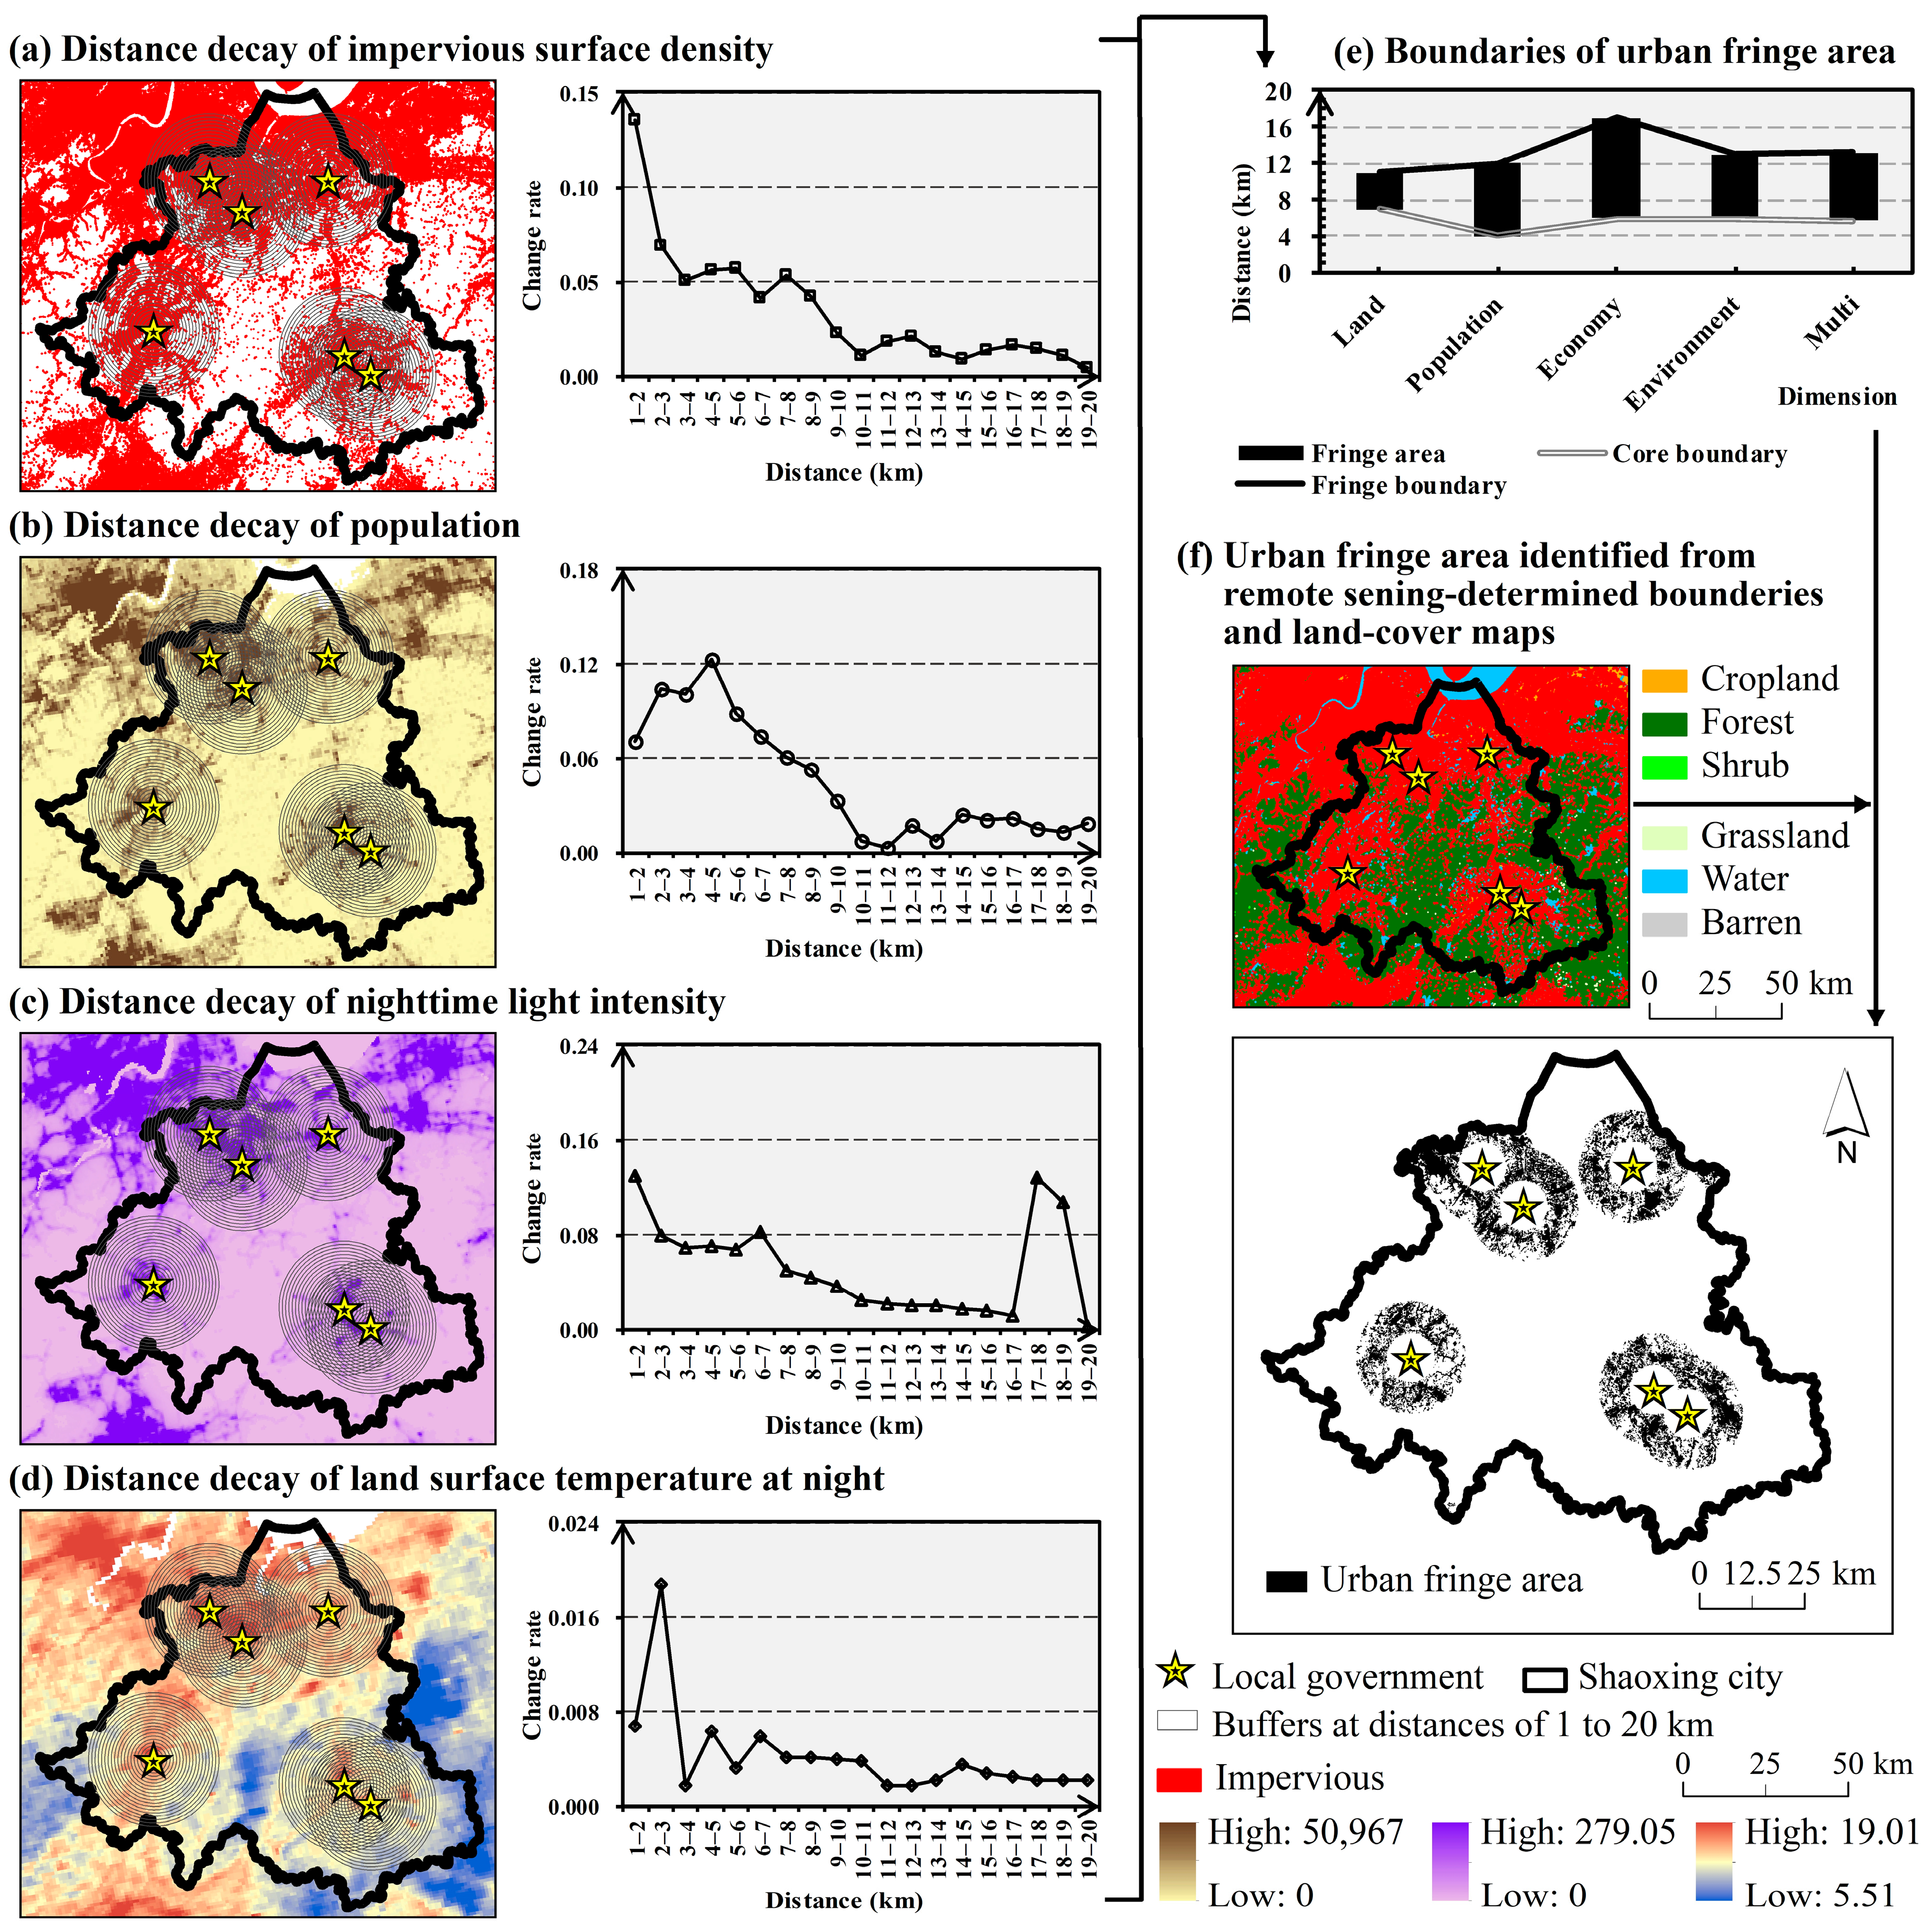
Based on the preprocessed land use maps, the final boundaries of urban fringe areas within Zhejiang Province were identified via three steps with the ArcGIS 10.2 software: (1) Taking county-level local governments as focal points, a series of concentric buffer zones were established at 1 km intervals from 1 to 20 km [46,47], where the 1 km interval was chosen to align with the coarsest common resolution between the multi-source datasets for consistent cross-dimensional analysis. For each city and each yearly dimension, the rate of decline in the corresponding dimensional indices across consecutive buffer zones was then calculated, as illustrated in Figure 3a–d. (2) The distance range over which a sustained decline first occurred for three or more consecutive buffers was defined as the fringe boundary for that dimension of each year, a criterion adopted because a single-buffer decline is prone to local noise, two buffers may still reflect transient fluctuations, and three buffers represent the minimum span to confirm a sustained decay trend. This threshold was constrained by the observed data patterns, as no city exhibited four consecutive buffers of decline across any dimension (Figure S1), making a higher threshold infeasible for the current dataset. The final urban fringe boundary for each city was determined by averaging the fringe boundaries obtained from all four dimensions with an equal-weighted approach [48,49], as shown in Figure 3e. (3) Subsequently, a spatial-patch-selecting procedure was applied based on land-cover maps, resulting in the final spatial distribution of urban fringe areas for each city in each year (Figure 3f).

2.3.2. Quantification of Forest Dynamics Within Urban Fringe Areas

An area-weighted centroid is defined as the point determined by the area-weighted geometric center of polygons to determine the migration trend of urban forests [50]. These centroids of forests within urban fringe and core areas for each city and the whole province were mapped respectively to delineate the direction of changes between 2004 and 2024 as follows:
X t   =   i = 1 N C t i · X t i / i = 1 N C t i Y t   =   i = 1 N C t i · Y t i / i = 1 N C t i
where Xt and Yt are the longitude and latitude of a centroid of forests within urban fringe and core areas for each city or the whole province in year t, respectively; Cti is the area of forest patch i in year t; Xti and Yti are the longitude and latitude of forest patch i in year t; and N is the total patch number of forests. If forests grow or reduce equally in every direction, the area-weighted centroid remains invariant; otherwise, its centroid moves toward the direction in which the forests expand or decrease more [51].

2.3.3. Determining Urban Forest Fragmentation Patterns

The spatiotemporal heterogeneity of human activities in urban fringe versus core areas imposes pressure on urban forests, which may result in divergent patterns of vegetation fragmentation and landscape connectivity loss between the two regions [52,53]. The relevant indices to quantify the landscape and class configuration of forests within urban fringe and core areas were computed with Fragstats 4.2 as presented in Table 2 [54,55]. The twelve metrics selected were organized into six core dimensions of landscape structure, encompassing area-edge metrics, density and richness, shape complexity, aggregation–dispersion, connectivity, and core-area and diversity attributes. This metric set is a widely adopted combination in urban forest fragmentation studies and enables comprehensive characterization of the contrasting landscape patterns between fringe and core areas [52,55]. Separate analyses of forests in urban fringe and core areas will be performed using class-level landscape pattern indices, at the per-city and Zhejiang Province scales. Likewise, at the landscape level, separate calculations of landscape pattern indices will be conducted for urban fringe areas versus core areas, for each city, and for the entire province.

3. Results

3.1. Spatiotemporal Distribution of Urban Fringe Areas

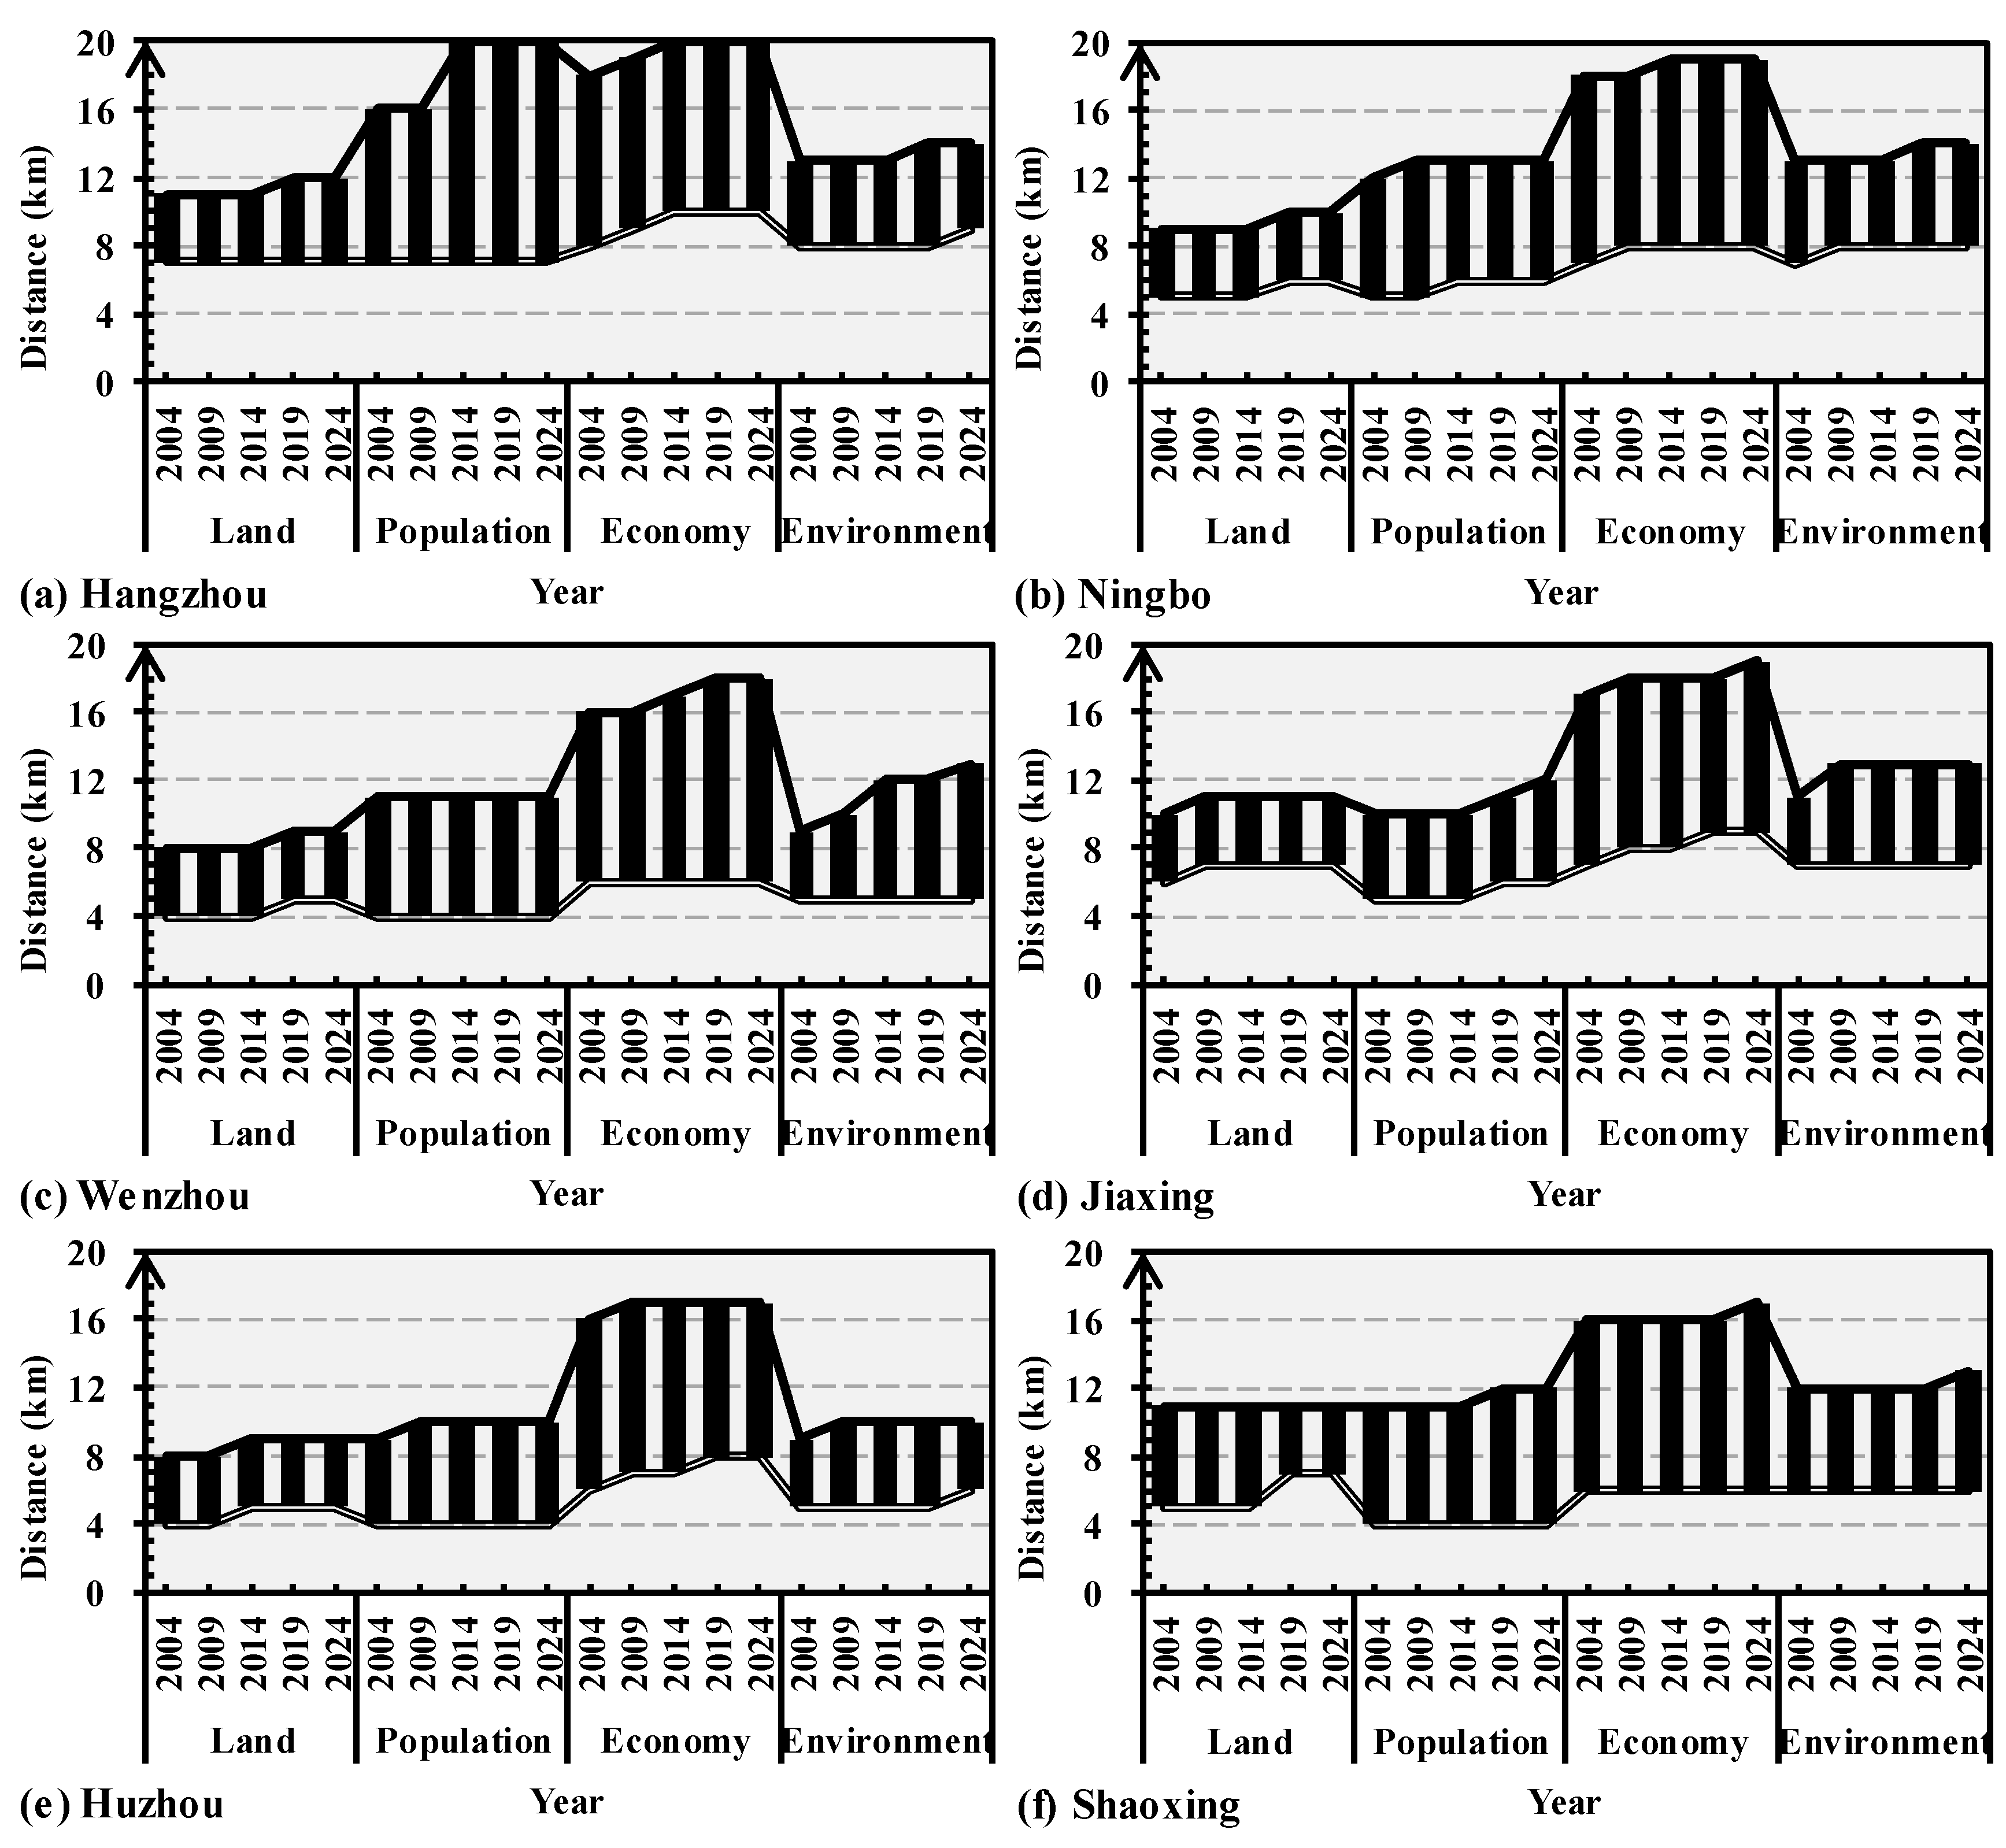
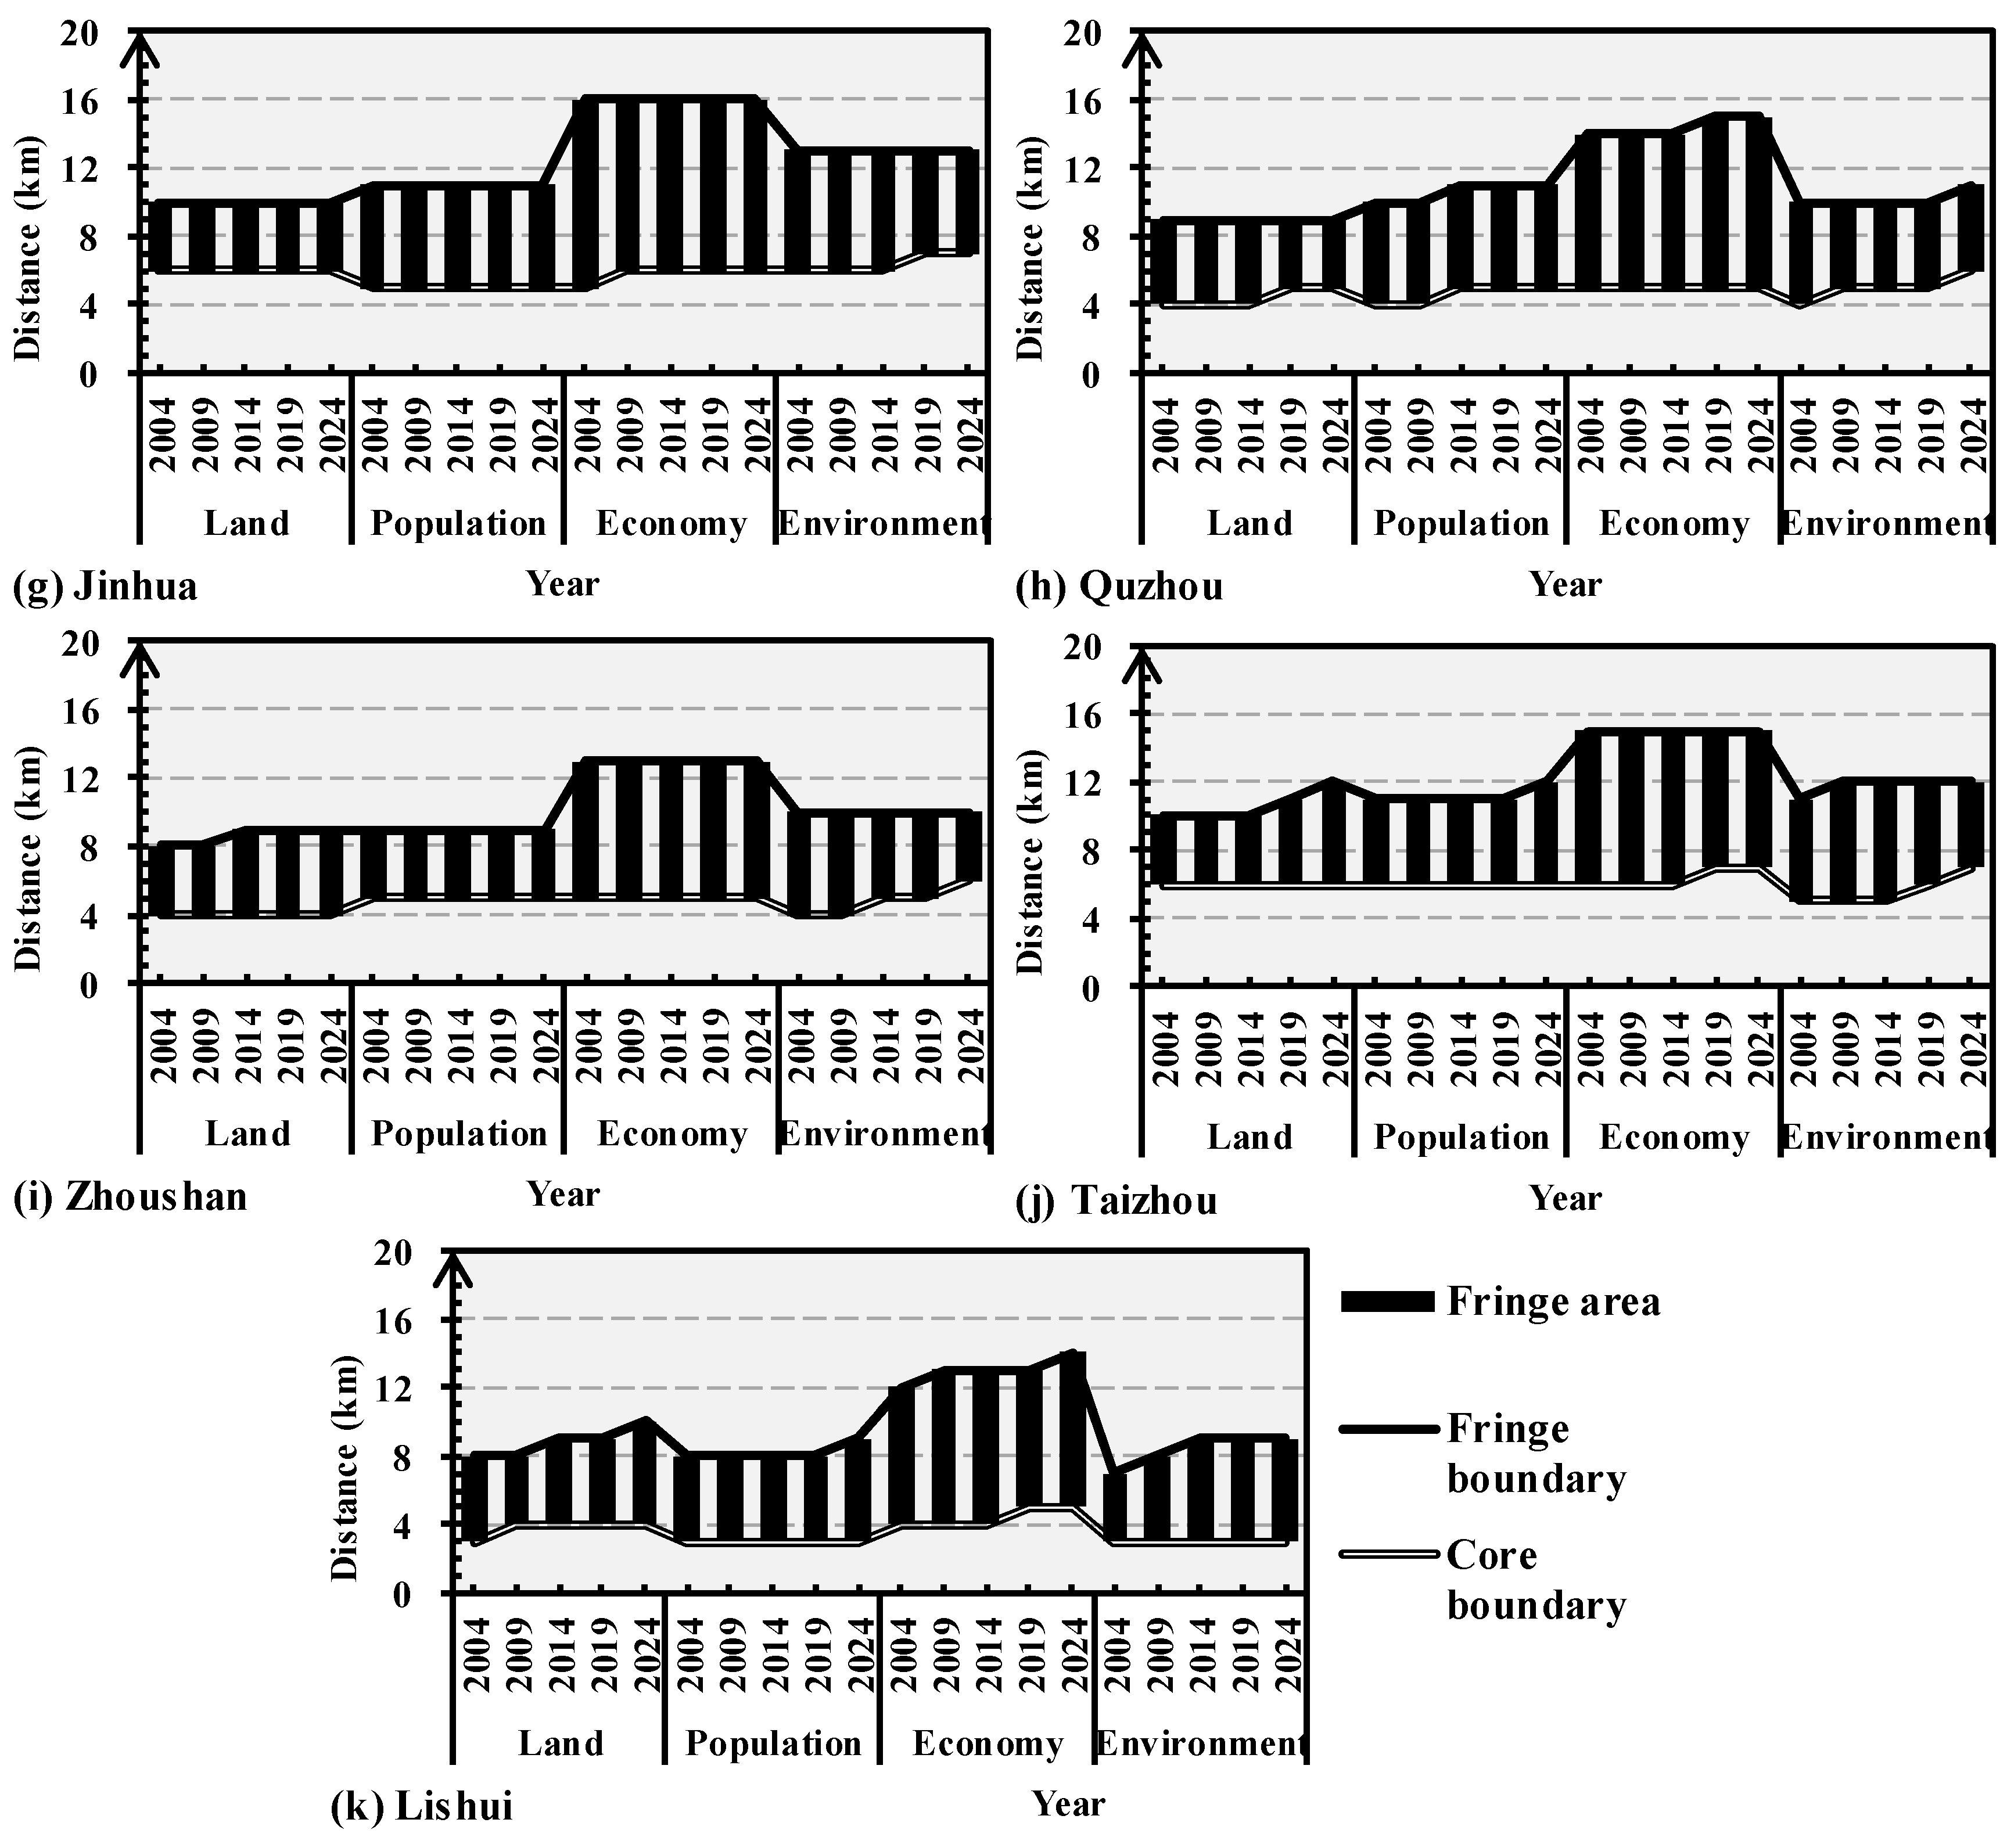
Figure 4 presents the urban fringe boundaries for each city, dimension, and year using the rate of decline in the dimensional indices, which was computed across successive buffer zones (Figure S1). In general, the economic dimension (nighttime light intensity) produced the widest urban fringe, followed by the population dimension, whereas the environmental dimension (nighttime LST) and the land dimension (built-up density) yielded the most constrained widths. Although the urban fringe areas of all dimensions exhibited an overall outward expansion over the study period, the temporal variation in fringe boundaries was limited, falling within a range of 1–4 km.
Spatiotemporal variability was observed in the remotely sensed urban fringe boundaries both different prefecture-level cities and different dimensions in Zhejiang Province. Among all dimensions, Lishui had the closest urban fringe boundaries to the city center, followed by Zhoushan and Quzhou, with Hangzhou having the farthest. The ordering for the other cities differed by dimension. In the population dimension, the inter-city variability in temporal changes of urban fringe areas was the largest: Hangzhou showed an expansion of 4 km, whereas Wenzhou, Jinhua, and Zhoushan experienced no change. The environmental dimension was the only one in which fringe expansion occurred in all cities. In the land dimension, Jinhua remained unchanged in its urban fringe areas over the period of 2004–2024, while in the economic dimension, Zhoushan exhibited no change over the past two decades.
For the land dimension, most cities displayed fringe-boundary changes in 2014–2019; for population, in 2009–2014; for economy, in 2004–2009; and for environment, in 2019–2024. Across all dimensions, Jinhua had the smallest boundary shifts among the 11 cities, while Hangzhou had the largest. Recent changes have largely stabilized. Except for Taizhou and Lishui, the other cities experienced their main dynamics during the first 15 years. Over the last five years, Hangzhou, Wenzhou, Huzhou, and Zhoushan narrowed their environmental fringe by 1 km; Jiaxing expanded outward by 1 km in population and economy; Shaoxing expanded 1 km in economy and environment; Quzhou’s environmental-dimension fringe shifted outward by 1 km at both its inner and outer boundaries; Taizhou expanded by 1 km in land and population but narrowed by 1 km in environment; and Lishui expanded by 1 km in land, population, and economy. Recent fringe changes have mainly occurred in the environmental dimension.
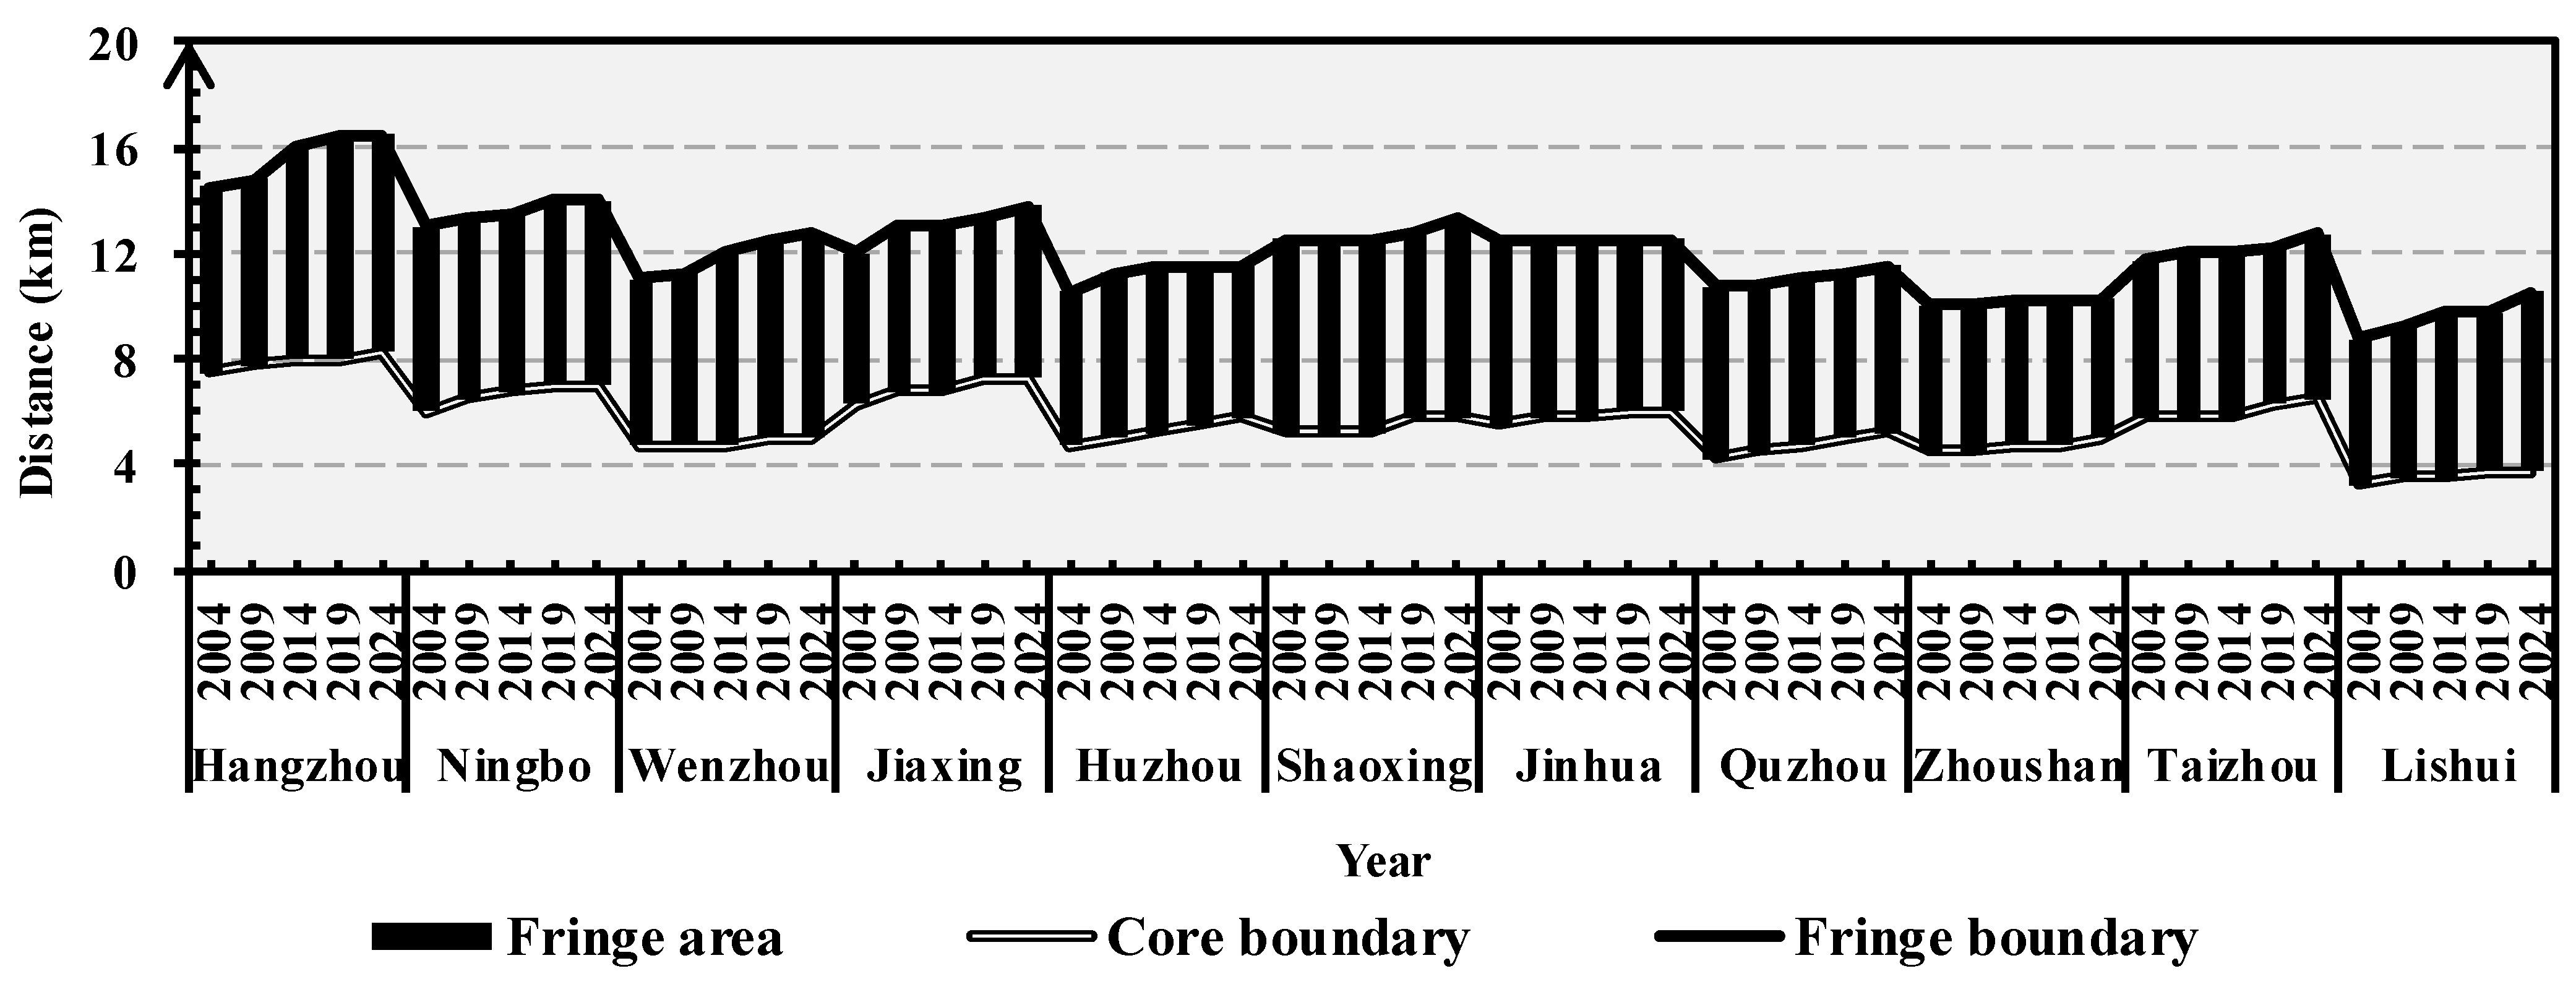
The final urban fringe boundaries, as the averages of four dimensions, are shown in Figure 5. In Hangzhou, the outer boundary expanded across all stages, while the inner boundary remained unchanged only in 2014–2019. The fastest change occurred in 2009–2014. Ningbo expanded during the first 15 years, with the most rapid change in 2014–2019, and then stabilized. Wenzhou showed a stable inner boundary and continuous outer expansion and changed fastest in 2009–2014. Huzhou exhibited the opposite, i.e., a stable outer boundary and persistent inner expansion, with the most substantial shift in 2004–2009. Intermittent inner expansion was detected in Jiaxing, with outer boundary expanding, except in 2009–2014, with the most intense boundary movement in 2014–2019. No boundary changes were detected in Shaoxing during the first decade, with the greatest change in 2014–2019. Jinhua had a static outer boundary and episodic inner expansion (greatest in 2014–2019). Quzhou featured continuous inner expansion and episodic outer expansion (most pronounced in 2019–2024). Sporadic expansion was found in Zhoushan, Taizhou, and Lishui, with the fastest changes occurring in 2009–2014 (Zhoushan) and 2019–2024 (Taizhou, Lishui), respectively. Overall, Hangzhou experienced the most frequent changes, and most cities recorded their fastest boundary changes during 2014–2019.
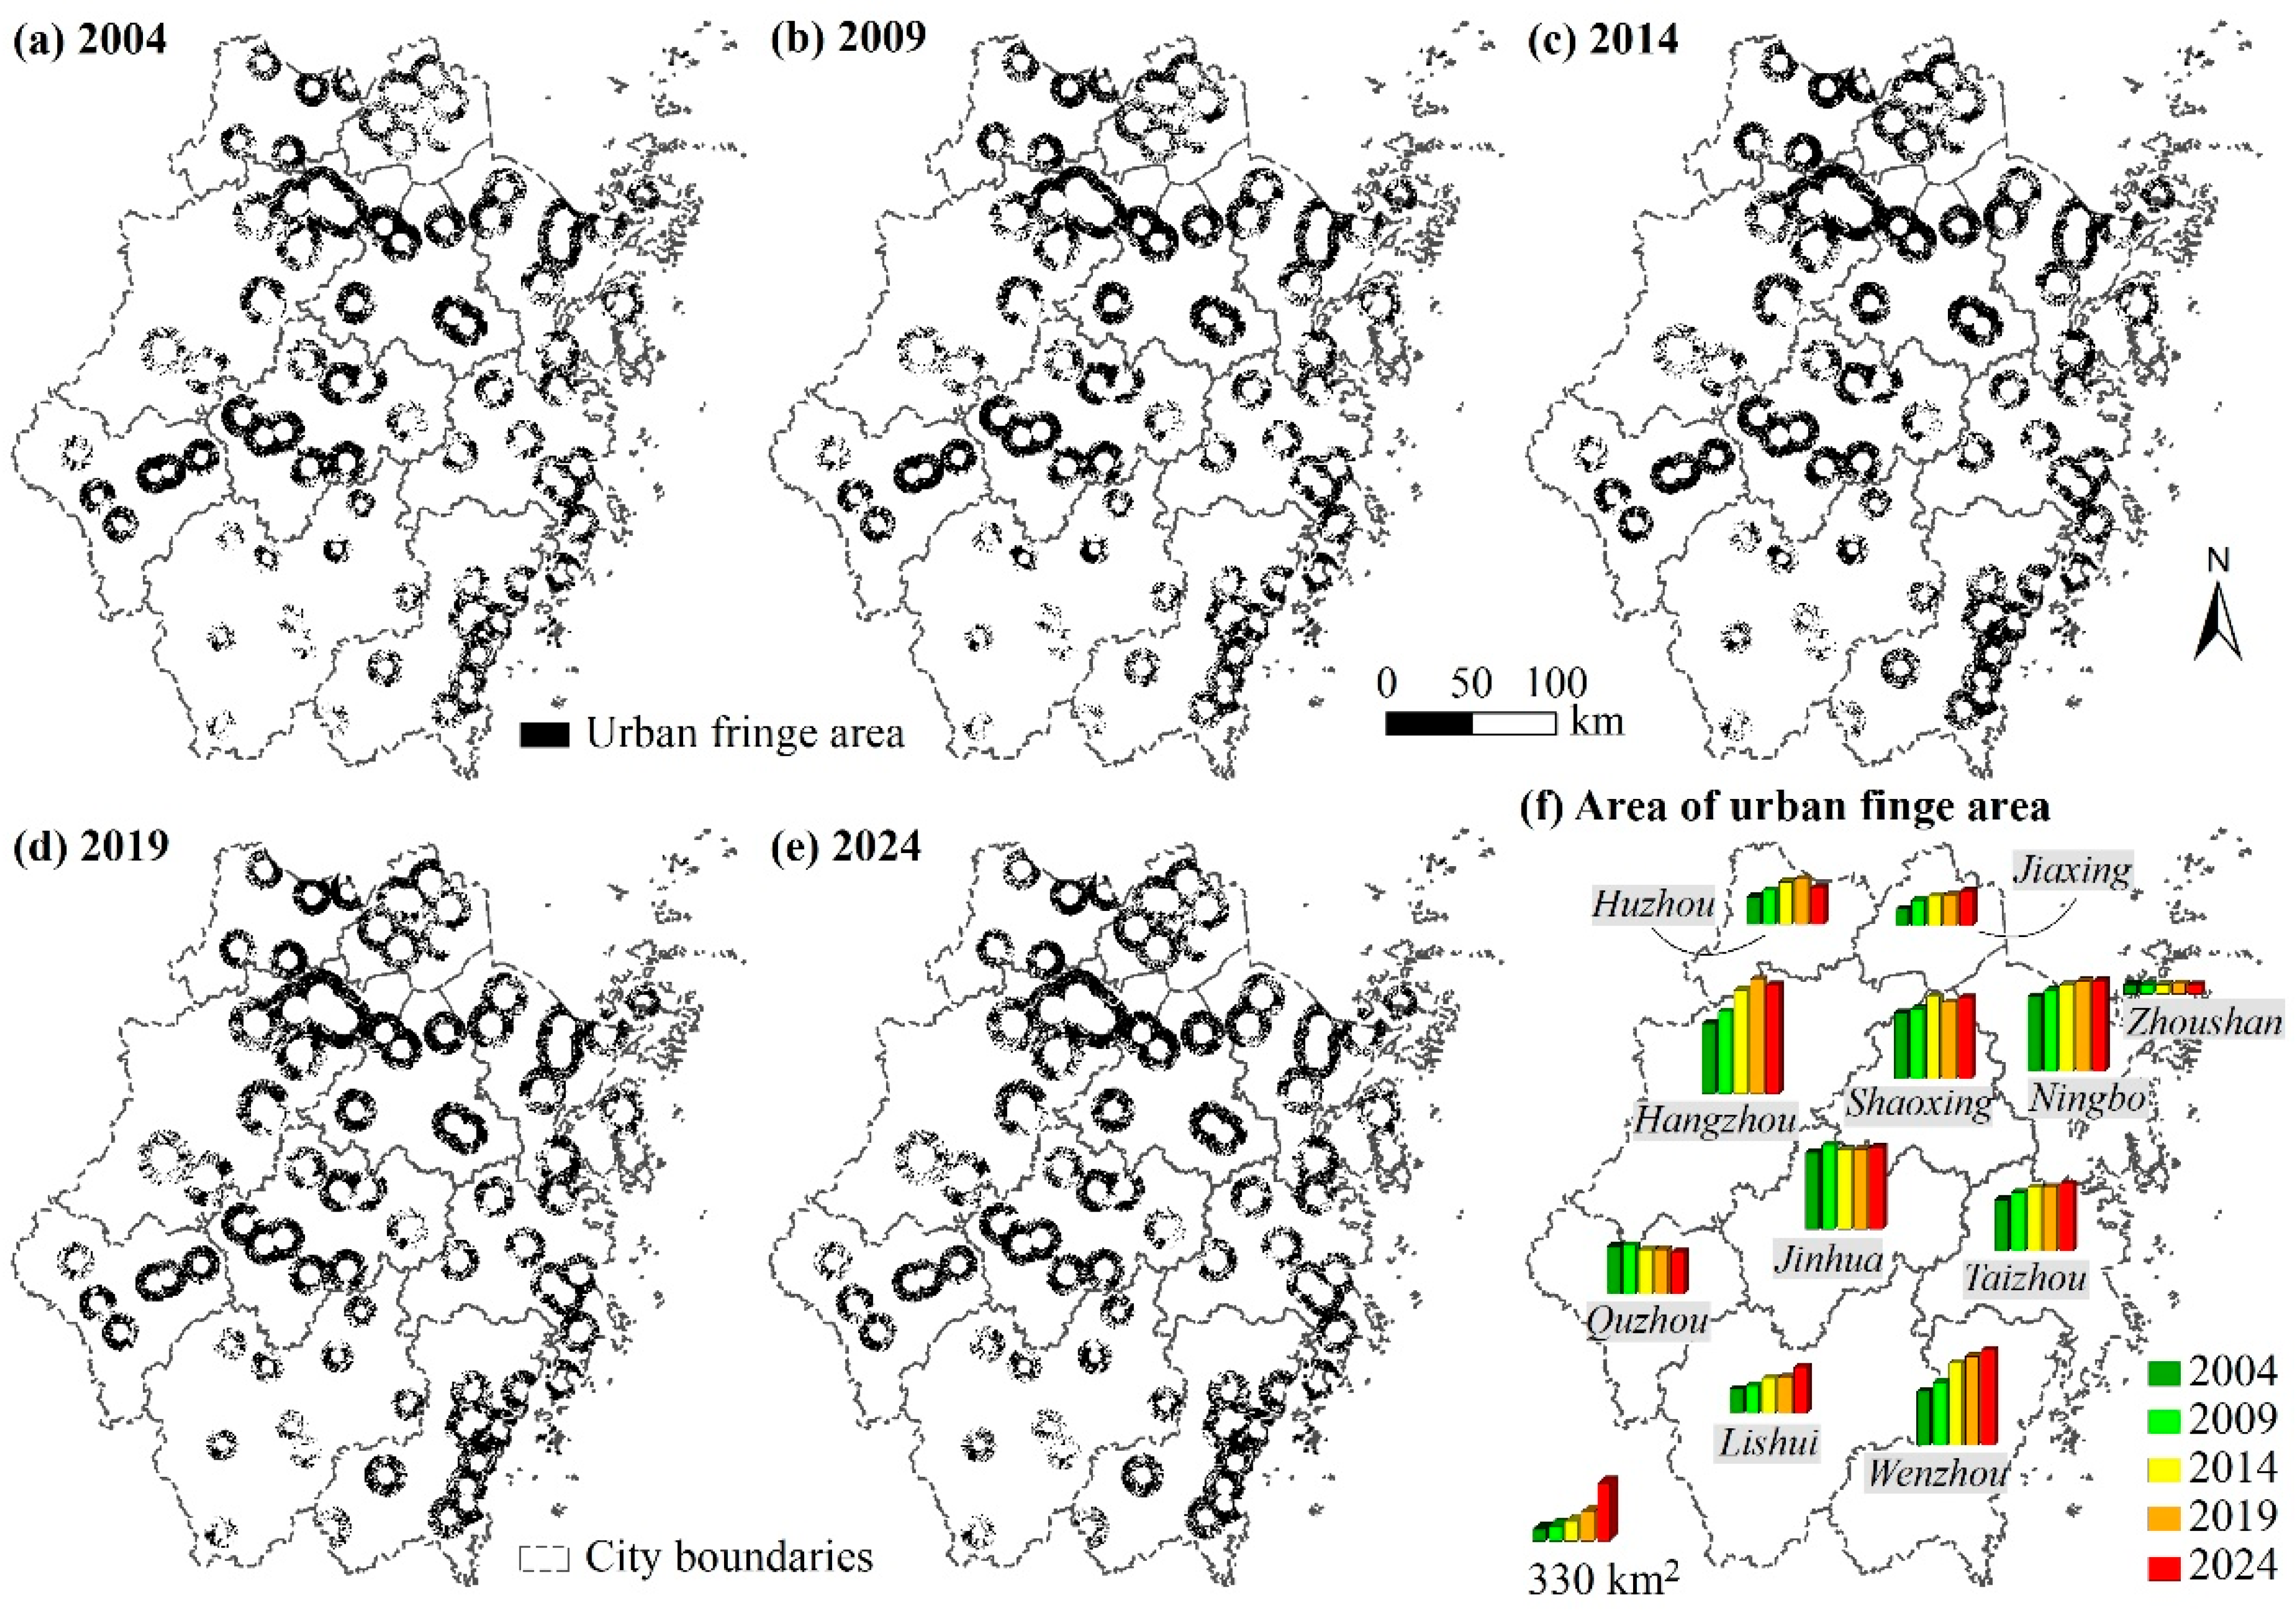
Using the derived boundaries and annual CLCD land-cover patches, the distribution and area statistics of urban fringe areas for each city across all years are presented in Figure 6. Over the past two decades, the total fringe area in Zhejiang Province was expanded from 2989.04 km2 to 3990.66 km2. The fastest increases were recorded during 2004–2009 and 2009–2014, with average annual rates of 2.56% and 2.55%, respectively, followed by a marked deceleration in the most recent decade, especially 2014–2019. Substantial spatiotemporal variations were observed across the 11 cities. Relatively extensive fringe areas were found in Hangzhou, Ningbo, Jinhua, and Wenzhou, while more limited ones were detected in Zhoushan, Lishui, and Huzhou. Over time, continuous increases were observed in Ningbo, Wenzhou, Jiaxing, Taizhou, and Lishui. In Hangzhou, the fringe area was first enlarged and then slightly reduced over the last five years. A similar pattern was noted in Huzhou, although its 2024 area was notably smaller than that in 2014. In Shaoxing, the fringe area was initially augmented, then reduced in 2019, and later increased again; meanwhile, its area in 2024 remained slightly below that in 2014. More pronounced fluctuating trends were observed in Jinhua: the area first expanded and then contracted, followed by continuous growth from 2014 to 2024, though the 2024 area remained slightly lower than that in 2009. The most frequent fluctuations were recorded in Quzhou and Zhoushan, but with only minor differences across stages. Overall, the largest area change rates for most cities were recorded during 2009–2014. Relatively high rates were found in Jiaxing, Huzhou, Lishui, Wenzhou, and Hangzhou and relatively low rates were observed in Quzhou, Jinhua, and Ningbo.

3.2. Spatiotemporal Variations in Forests Within Urban Landscapes

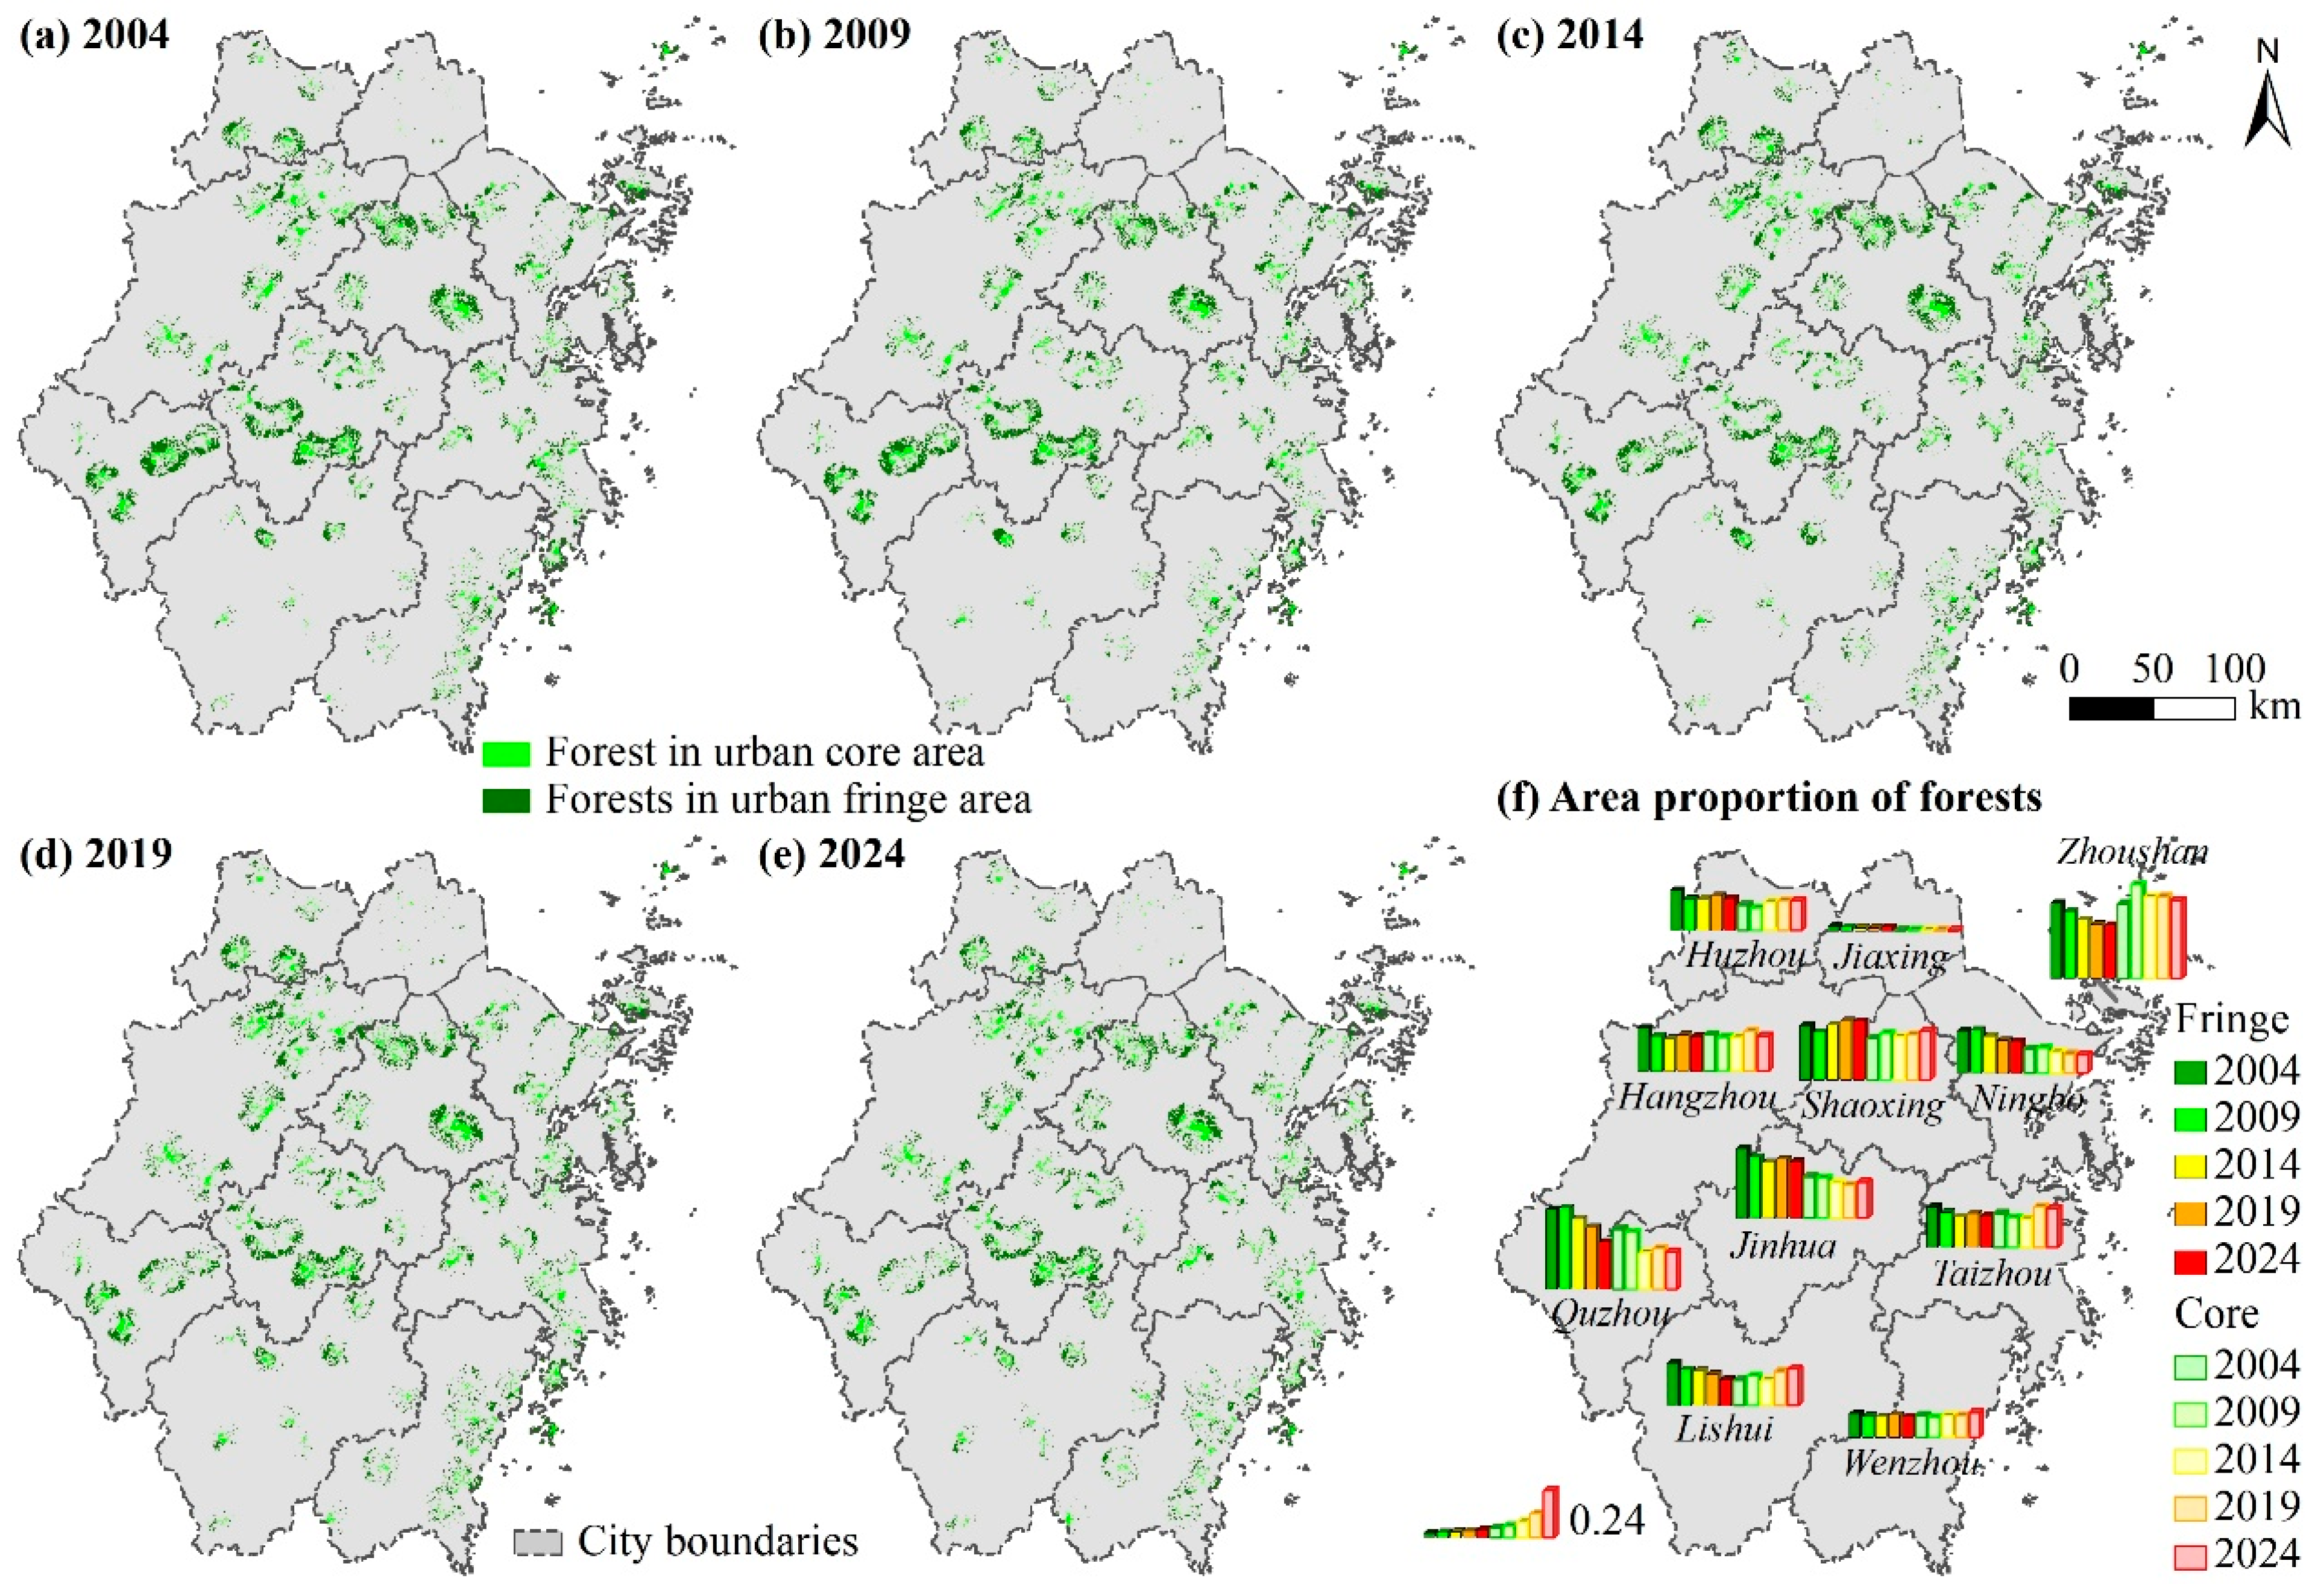
Forest dynamics in urban fringe and core areas of Zhejiang Province are illustrated in Figure 7. Within the fringe, the forest area first decreased, then increased, and finally decreased again, rising slightly from 732.98 to 733.27 km2, with the largest change rate of 4.43% recorded during 2014–2019. The fringe forest proportion fell from 24.72% to 18.37% after a decline–rise–decline trajectory. The steepest drop of −11.98% occurred in 2004–2009. In the core, the forest area increased from 258.61 to 332.71 km2, with the peak change of 20.74% in 2014–2019; meanwhile, its proportion declined from 16.65% to 15.29%, with the greatest drop of −9.75% in 2009–2014.
However, marked differences were observed in the spatiotemporal dynamics of the forest area between the urban fringe and core zones of Zhejiang Province. During 2004–2024, the forest proportion in the urban fringe areas was slightly increased only in Shaoxing from 27.71 to 29.91%, while it was decreased in all other cities. The largest rates of decrease in the proportion were recorded in Quzhou (−40.66%), Lishui (−39.27%), and Zhoushan (−29.45%), with the remaining cities showing decline rates in the proportion below the provincial average of −25.66%. A persistent decline was observed in Jinhua, Zhoushan, and Lishui. In Hangzhou, Wenzhou, and Taizhou, an increase was detected only during 2014–2019, accompanied by decreases in the other three periods, consistent with the provincial trend. For Ningbo and Quzhou, an increase was found solely in 2004–2009. Jiaxing experienced increases in two stages across 2004–2024, whereas Huzhou and Shaoxing showed increases during 2009–2019. The fastest declines in forest proportion for urban fringe areas in most cities occurred during 2004–2009, and most increases were observed during 2014–2019. In parallel, although a slight overall decline was observed in the forest proportion of Zhejiang’s urban core areas, an increase was detected in most cities. The most pronounced rise was recorded in Lishui, with a growth rate of 41.79%. Decreases were found only in Hangzhou, Ningbo, Jiaxing, Jinhua, and Quzhou, among which Quzhou experienced the largest drop (−37.68%). Only Hangzhou (−4.55%) and Zhoushan (4.52%) showed change rates above the provincial average of −8.19% (i.e., less negative or positive). Temporally, only one stage of increase was identified in Ningbo (2004–2009), Wenzhou (2009–2014), Jiaxing (2019–2024), Jinhua (2019–2024), Quzhou (2014–2019), and Taizhou (2014–2019), with decreases occurring in the other three stages. Among these, Quzhou and Taizhou followed the provincial trend. Two stages of increase were observed in Hangzhou (2009–2019) and Zhoushan (2004–2009 and 2014–2019). For Huzhou, a decrease was found only in 2004–2009, while increases were noted in the remaining stages. In contrast, Shaoxing and Lishui exhibited a decrease only in 2009–2014. The fastest declines in forest proportion across most core cities occurred during 2009–2014, whereas most increases were observed during 2014–2019.
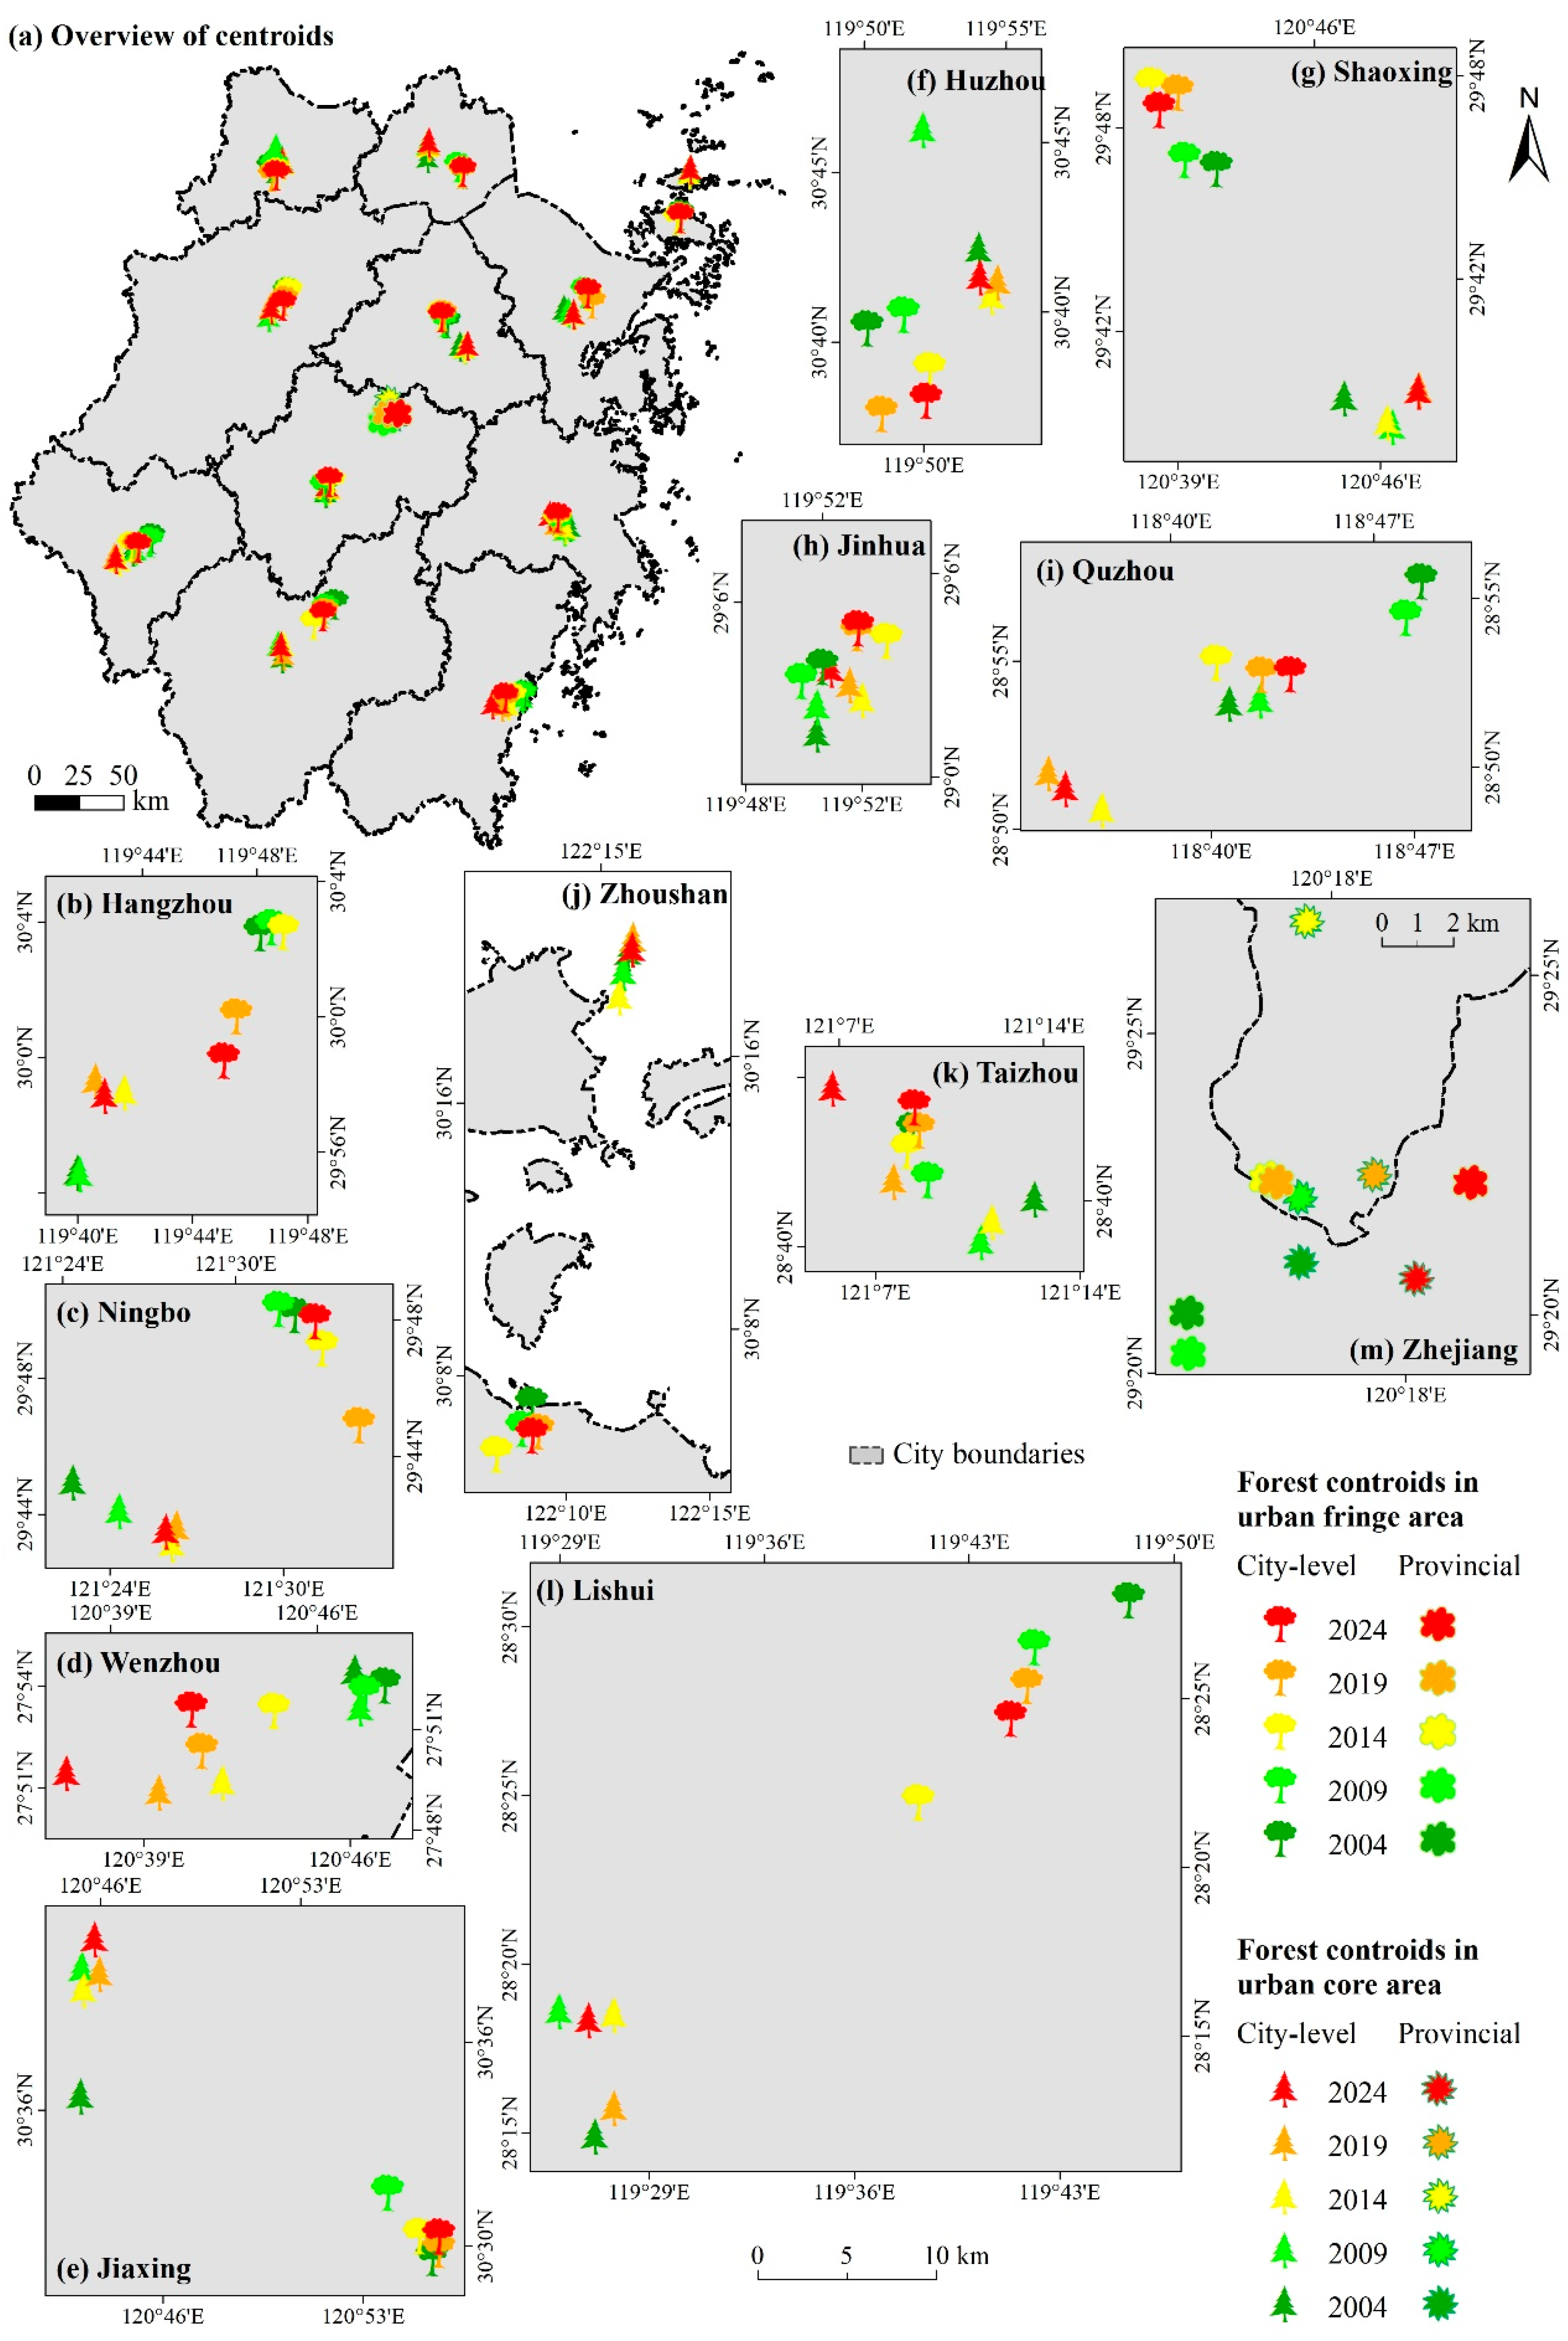
Between 2004 and 2024, the area-weighted centroids of forests in the urban fringe and core areas of Zhejiang Province exhibited distinct spatial divergence and temporal phasing (Figure 8). Overall, the fringe centroids shifted predominantly southwestward or west–southwestward, whereas the core centroids moved mainly northeastward or north–northeastward, indicating opposing directional tendencies. Temporally, the largest centroid displacements in the fringe for most cities (e.g., Hangzhou, Wenzhou, Jinhua, Quzhou, Zhoushan, and Lishui) were concentrated in 2009–2014; conversely, the peak displacement periods for the core varied more widely, with some cities (e.g., Ningbo, Jiaxing, and Huzhou) experiencing their maximum shifts in 2014–2019 or earlier. At the provincial level, the fringe centroid followed a “west–northeast–east” trajectory, with the greatest shift recorded in 2009–2014; the core centroid exhibited a “north–southeast” stepwise movement, also peaking in 2009–2014.
Overall, the urban fringe areas exhibited a substantially greater net loss of forest area and a larger decline in forest proportion compared with cores. The fastest decline in forest proportion occurred during 2004–2009 in the fringe, but during 2009–2014 in the core; increases in forest proportion for both zones were mostly concentrated in 2014–2019. Persistent declines in the fringe forests were observed in Jinhua, Zhoushan, and Lishui, whereas most core cities showed increases or fluctuations. Unlike the core’s mainly northeastward shift, fringe forest centroids moved predominantly southwestward, with the largest shifts in 2009–2014 and a more consistent direction.

3.3. Disparities in Forest Fragmentation Between Urban Fringe and Core Areas

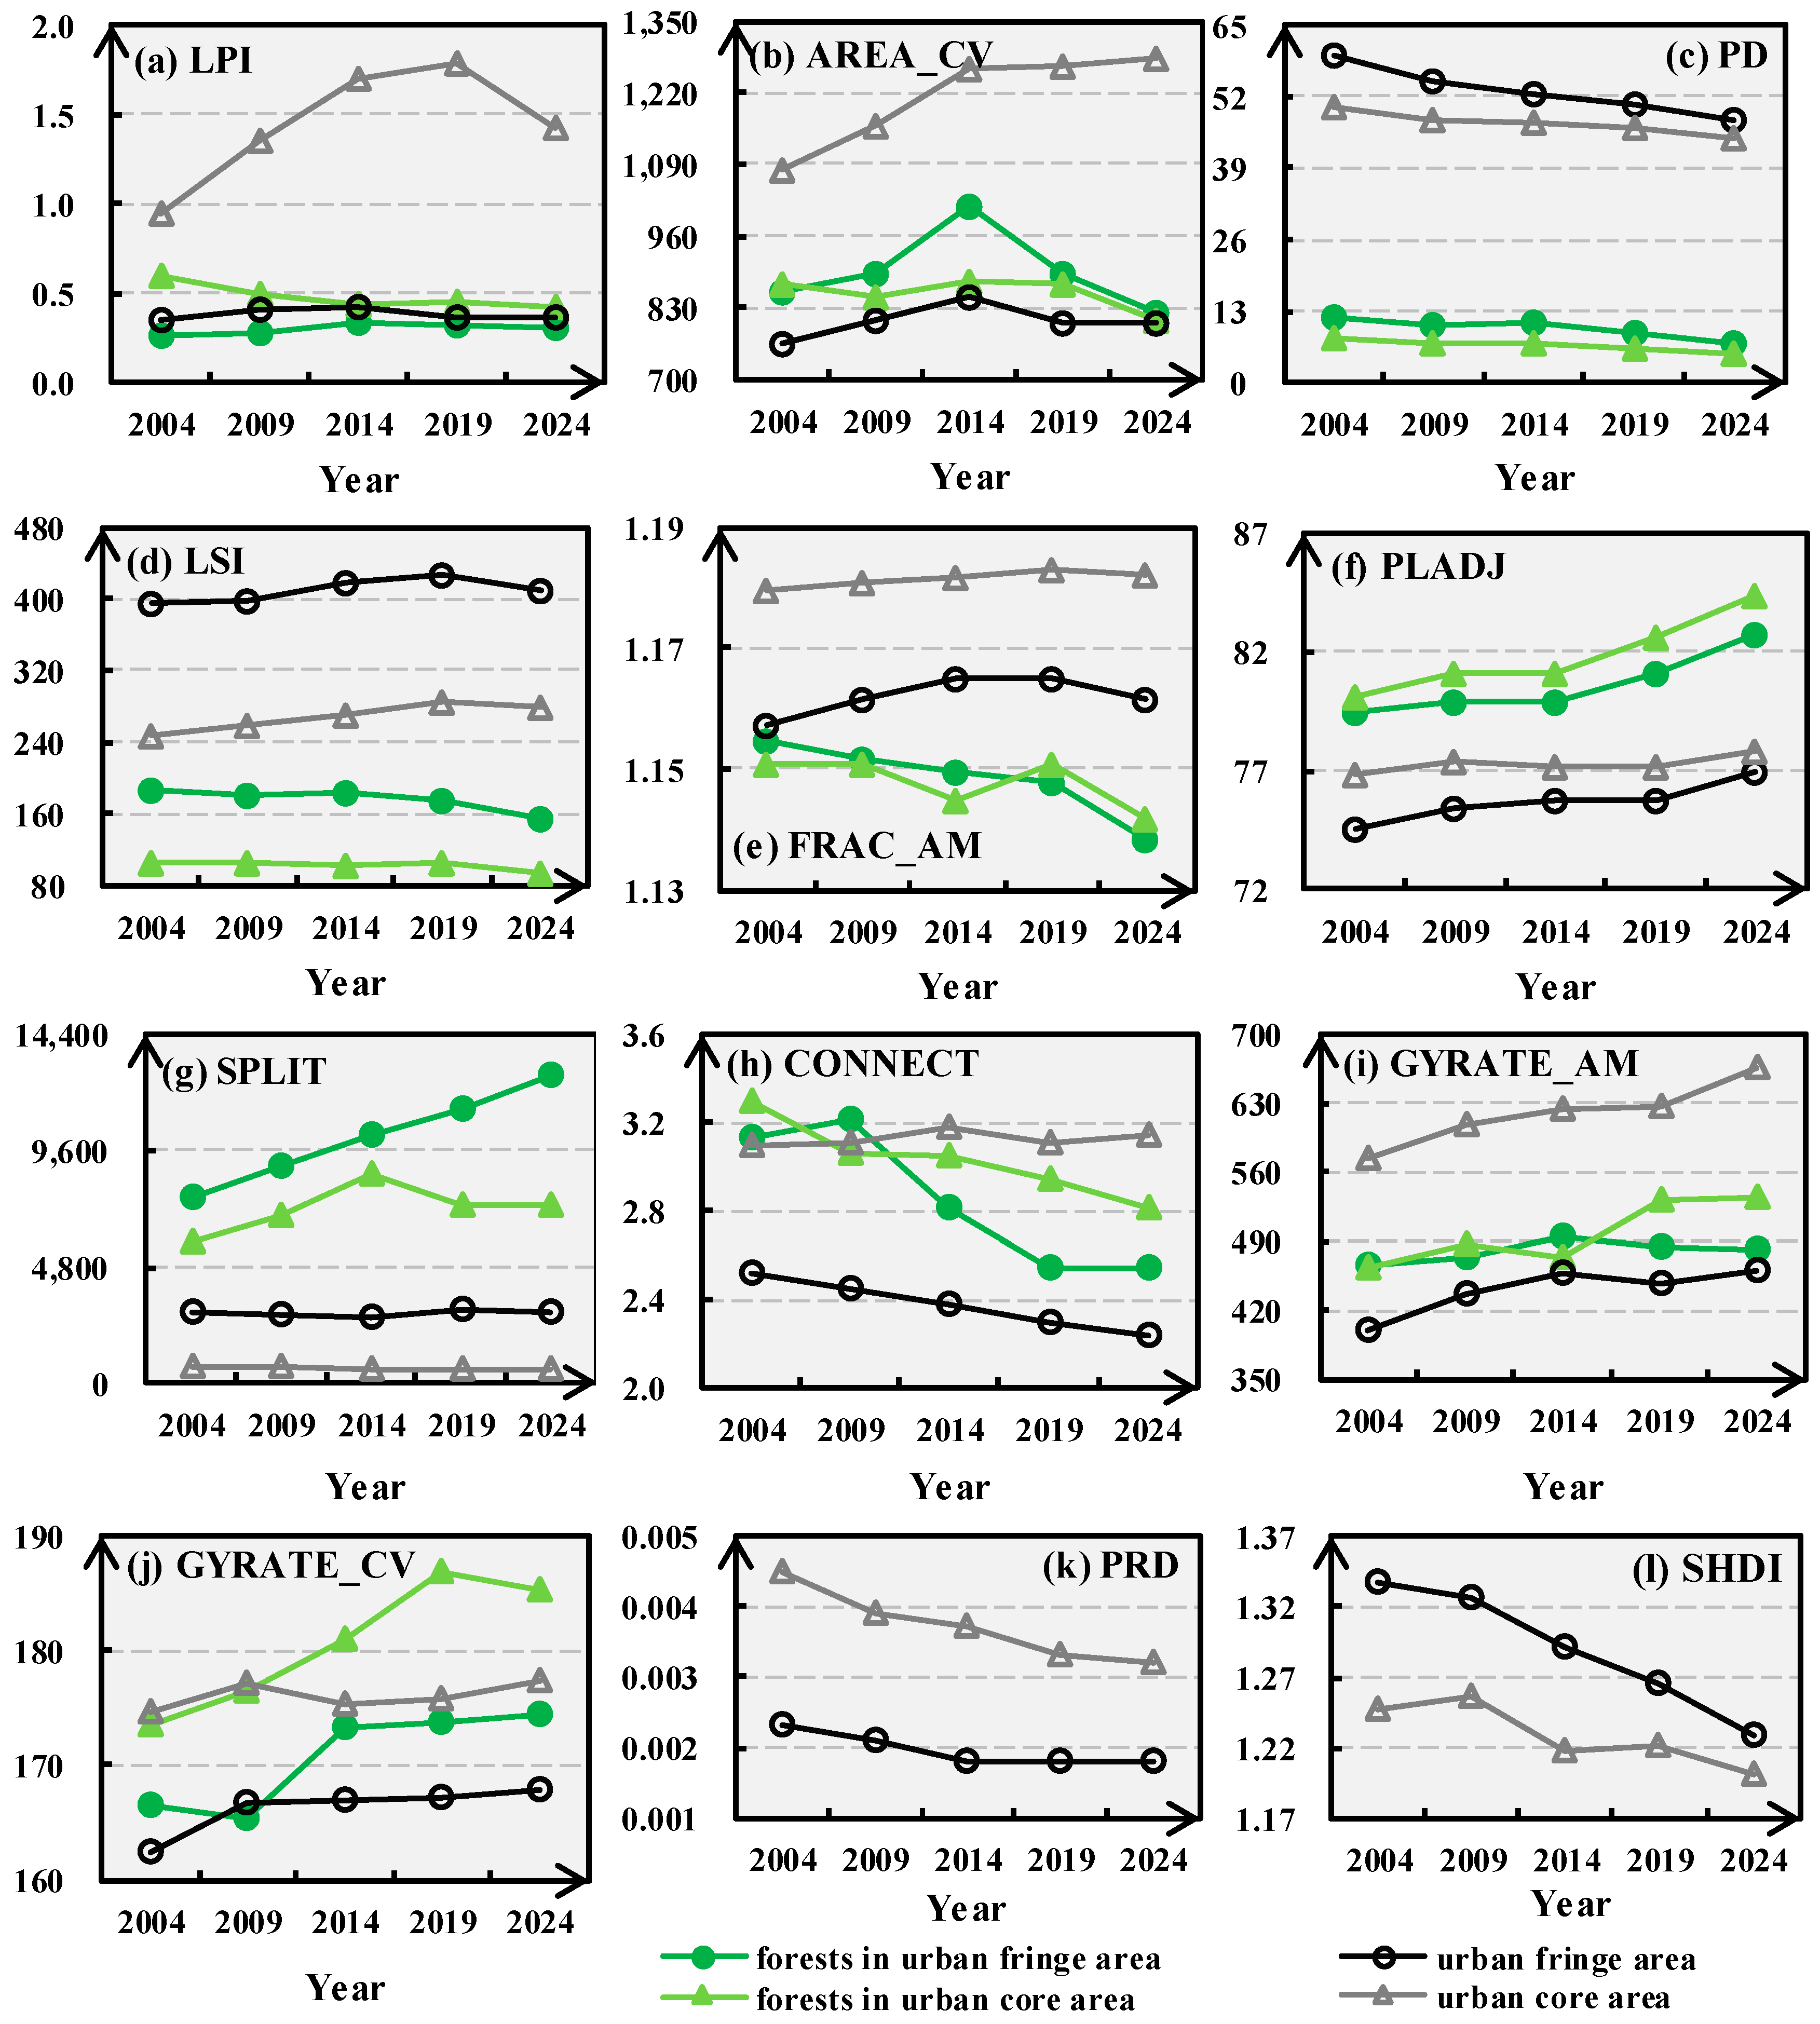
Over the past two decades, the forest pattern in the urban fringe areas of Zhejiang Province was characterized by substantially higher fragmentation, lower connectivity, considerably more variable patch sizes, and a lack of large dominant patches compared with the core (Figure 9). The most consistent observed contrasts between fringe and core areas can be summarized as follows: PD and SPLIT values were substantially higher in the fringe, while CONNECT and PLADJ remained lower, reflecting a transition from continuous forest cover to scattered patch mosaics; GYRATE_AM and GYRATE_CV were considerably smaller, indicating smaller patch extents and more variable sizes; and SHDI was greater in the fringe landscape, suggesting more diverse land uses but with the forest component being more fragmented. The complete temporal trajectories of all landscape metrics for each city are presented in Figure 9 for detailed reference.
The fragmentation of urban fringe forests in Zhejiang Province exhibited distinct temporal phases: as an intensifying fragmentation period in 2004–2009, with the high PD, a brief rise then fall in CONNECT, and a decline in GYRATE_CV; a turning period in 2009–2014, obtaining peaks in the LPI, AREA_CV, and GYRATE_AM, as well as a persistent decline in FRAC_AM and a rising SPLIT; a relatively stable period in 2014–2019, with most indices leveling off; and a divergence period in 2019–2024.
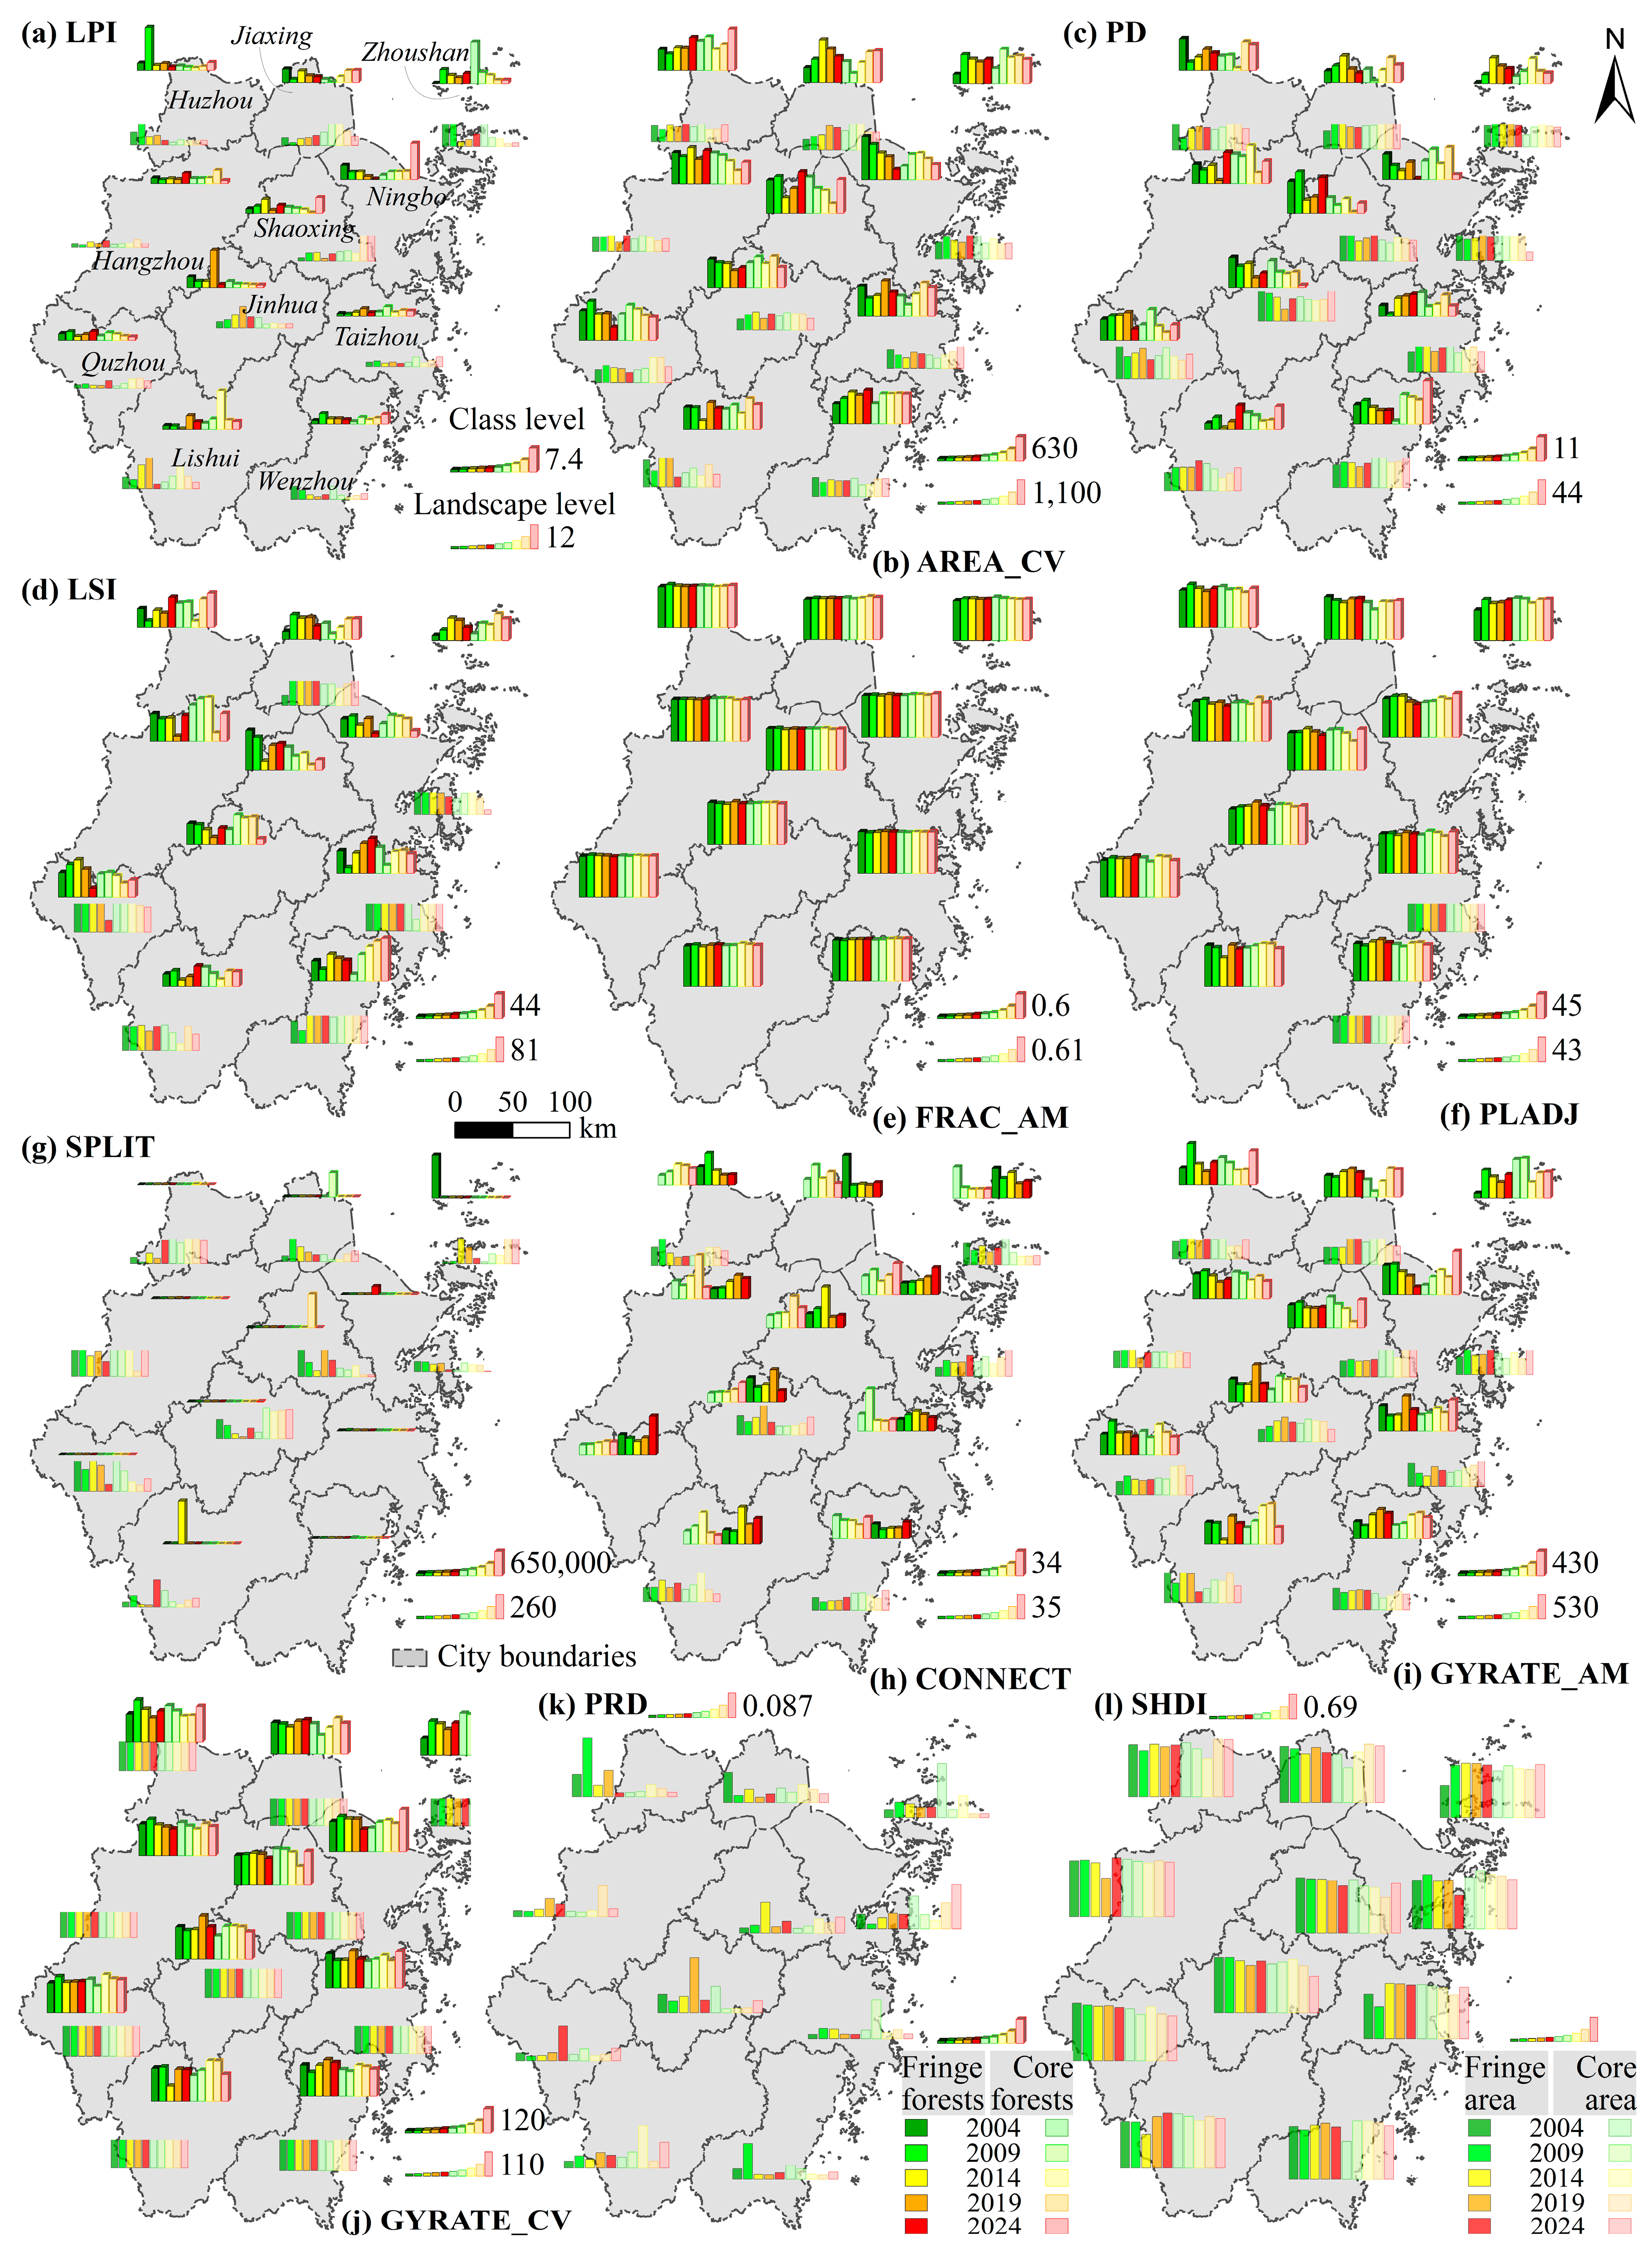
Across cities in Zhejiang Province over the past two decades, forest fragmentation in the urban fringe consistently exceeded that in the core, as indicated by the substantially larger values of PD and SPLIT, notably smaller values of CONNECT and aggregation PLADJ, considerably less GYRATE_AM, and a greater SHDI in the urban fringe areas (Figure 10). Temporally, the most intensive fragmentation in the fringe occurred during 2009–2014: the largest LPI, AREA_CV, and GYRATE_AM peaked around 2014 and then declined; CONNECT briefly increased in 2009 before a persistent decrease; and SPLIT together with the GYRATE_CV, started to rise after 2009. A relative stabilization followed from 2014 to 2019, whereas the period of 2019–2024 witnessed a divergence, e.g., core forests’ FRAC_AM values surpassed those of the fringe in several cities. Among all cities, Zhoushan, Wenzhou, and Lishui exhibited the most severe fringe fragmentation, with the highest PD and SPLIT values and continuously decreasing CONNECT. Hangzhou and Ningbo showed opposite trends in the fringe versus core LPI.
In summary, the urban fringe forests were substantially more fragmented, with smaller and more dispersed patches, weaker connectivity, and simpler shapes, whereas the overall fringe landscape exhibited higher diversity and complexity. Fragmentation of urban fringe forests showed the sharpest increase during 2009–2014; although it was slightly alleviated afterward, it remained considerably greater than that in the core, with the most pronounced deterioration concentrated in the cities of Zhoushan, Wenzhou, and Lishui.

4. Discussion

4.1. Remote Sensing-Based Urban Fringe Area Identification

The distinct characteristics of each dimension in delineating urban fringe areas are illustrated in this study based on the identification results from four dimensions widely used in urban–rural gradient studies (Figure S1 and Figure 4). The average commuting distances of major Chinese cities released by Baidu Maps by the end of 2024 [56] (listed in Table 3) were compared with the inner boundaries of urban fringe areas identified in this study. It was found that the economic dimension, derived from the gradient of nighttime light intensity, yielded results that were relatively close to those estimated from transportation big data, followed by the environment and land, whereas the population showed a considerable discrepancy. The inner boundaries of urban fringe areas derived from the integrated four-dimensional results agreed more closely with transport-big-data estimates than those from any single dimension (Table 3). Commuting distance and nighttime light both reflect human activity intensity to some extent; therefore, the observed correspondence is presented as an external consistency check rather than a formal independent validation. The primary support for the multidimensional approach rests on the internal consistency among four independent data sources and its capacity to explain inter-city differences, as demonstrated in Table 3, rather than on agreement with commuting data. For Wenzhou and Shaoxing, however, the inner fringe boundaries identified using single-dimensional and multidimensional methods were located closer to the city center—i.e., a broader fringe zone—than indicated by the transport data. This disagreement is consistent with the fundamental mismatch between the polycentric, cluster-based spatial structures of these two cities and the monocentric commuting-shed assumption embedded in commuting big data [57,58]. The poor performance of commuting data in these polycentric cities highlights the limitations of relying solely on commuting-based approaches, and supports the need for a multi-dimensional remote sensing framework. The high consistency for Hangzhou and Ningbo reflects a spatial development stage in which the physical expansion of the built-up area is synchronized with functional commuting connectivity, both still organized around a dominant urban core [59,60]. The successful implementation of the dual-core polycentric urban structure of Hangzhou and the cluster-based pattern of Ningbo maintained a strong commuting catchment centered on the main urban area. Consequently, urban fringes in these two cities were well captured using the commuting-shed approach. In contrast, Wenzhou and Shaoxing are in an early stage of accelerated polycentric transition, where the pace of commuting network development lags rapid physical urban expansion [61]. Furthermore, commuting big data capture only daytime job-housing flows, entirely missing nocturnal anthropogenic heat and economic activity intensities, as well as impervious surface expansion, all of which reflect actual urbanization extent [47,62]. Thus, this study integrated land, population, economy and environment dimensions, which provides a more comprehensive characterization of urban fringes than single-indicator or commuting-based methods, particularly in polycentric urban systems.
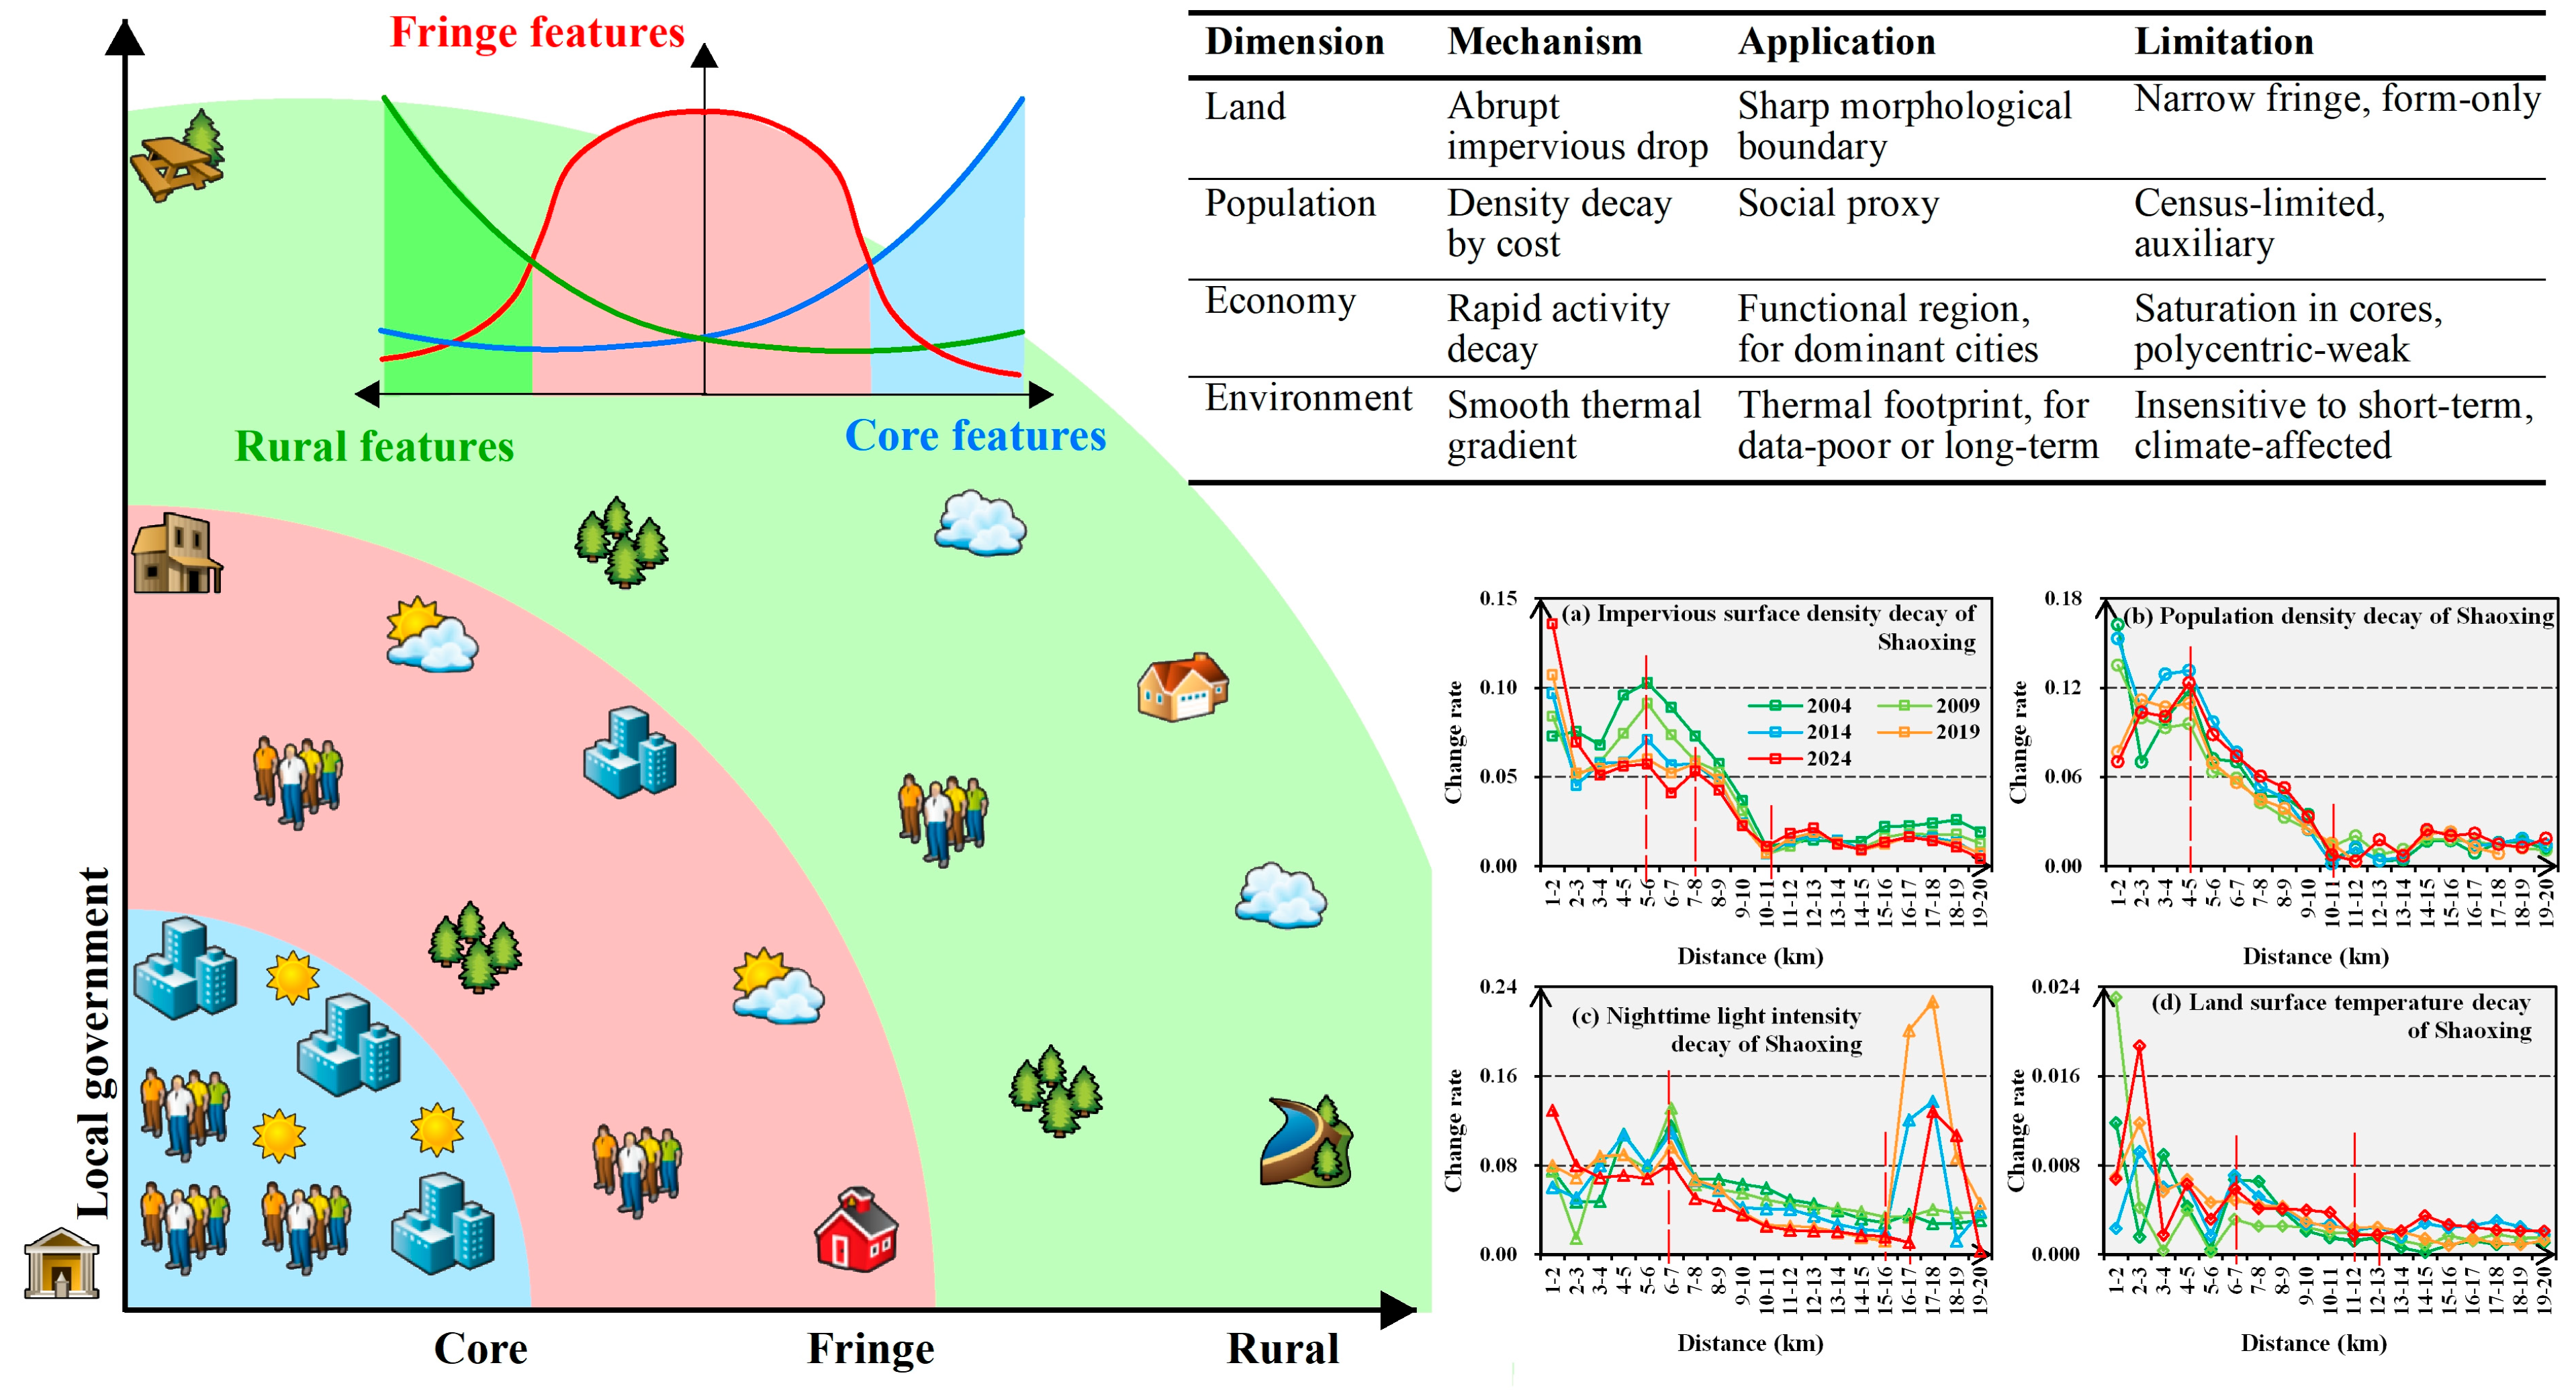
Among the four dimensions, the economy and population dimensions captured broader and more dynamic urban fringe areas, reflecting anthropogenic activities. The environmental and land dimensions delineated more stable and narrower transitions, likely corresponding to physical thermal and impervious surface gradients. The differences between the four dimensions in delineating urban fringe areas from their underlying physical processes are as follows (Figure 11): the land dimension (built-up density) represents impervious surface expansion and is useful for identifying morphological boundaries [63]; the population dimension (gridded population) is limited by census data and should only serve as a supplementary indicator [64]; the economic dimension (nighttime light) aligns closely with commuting boundaries and is suitable for rapidly urbanizing or areas with a dominant urban core [65,66]; and the environmental dimension (nighttime LST) captures thermal gradients and is appropriate for regions lacking high-quality socioeconomic data, or for analyzing long-term, gradual physical urbanization processes [67]. Previous studies have mostly used nighttime LST as a supplementary indicator for urban heat islands or built-up extraction, rarely employing it independently for systematic urban fringe delineation [45,68]. Nighttime LST was adopted as an independent dimension to characterize the physical thermal footprint of urban fringes, contributing to a better understanding of surface property changes across urban–rural transitions. Further evaluation with additional independent datasets is needed in future work. Equal-weight averaging was preliminarily adopted in this study. Future improvements can be explored, including adjusting dimension weights according to urban spatial structure and multi-scale validation.
This study integrated built-up density, gridded population, nighttime light, and nighttime LST to map urban fringe areas, including nighttime LST as the main incremental contribution. The results indicate that multi-source fusion outperforms individual indicators in capturing urban–rural heterogeneity. Nighttime light intensity is recommended as the primary dimension for delineating functional urban fringes, followed by nighttime LST and built-up density for characterizing physical fringes. The proposed multidimensional remote sensing framework demonstrates potential for robustness and transferability beyond commuting-based approaches constrained by administrative boundaries and monocentric assumptions, although further validation with more independent datasets across diverse urban systems is needed.

4.2. Spatiotemporal Characteristics of Forest Fragmentation Within Urban Landscapes

The area changes, centroid movements and landscape pattern analysis revealed that the urban fringe areas exhibited a net reduction in forest area, a persistent decline in forest proportion, opposite centroid shifts, and comprehensively intensified fragmentation compared with the core (Figure 7, Figure 8, Figure 9 and Figure 10). In other words, the urban fringe areas suffered more severe forest loss, higher volatility, and more pervasive and sustained degradation. Regarding landscape metrics, patch density and splitting index in the fringe remained consistently higher than in the core, while connectivity and aggregation remained lower, indicating a marked transition from continuous forest cover to scattered patch mosaics [33,69]. Spatially, forest resources in Zhejiang are concentrated in the southwest but sparse in the northeast; the most severe fringe fragmentation occurred precisely in the transitional zone between the southwestern forest region and the northeastern urban agglomerations [70]. Among these, the southwestern high-forest cities (Lishui and Quzhou) experienced the largest declines in fringe forest proportion, while the island city of Zhoushan also recorded a substantial drop.
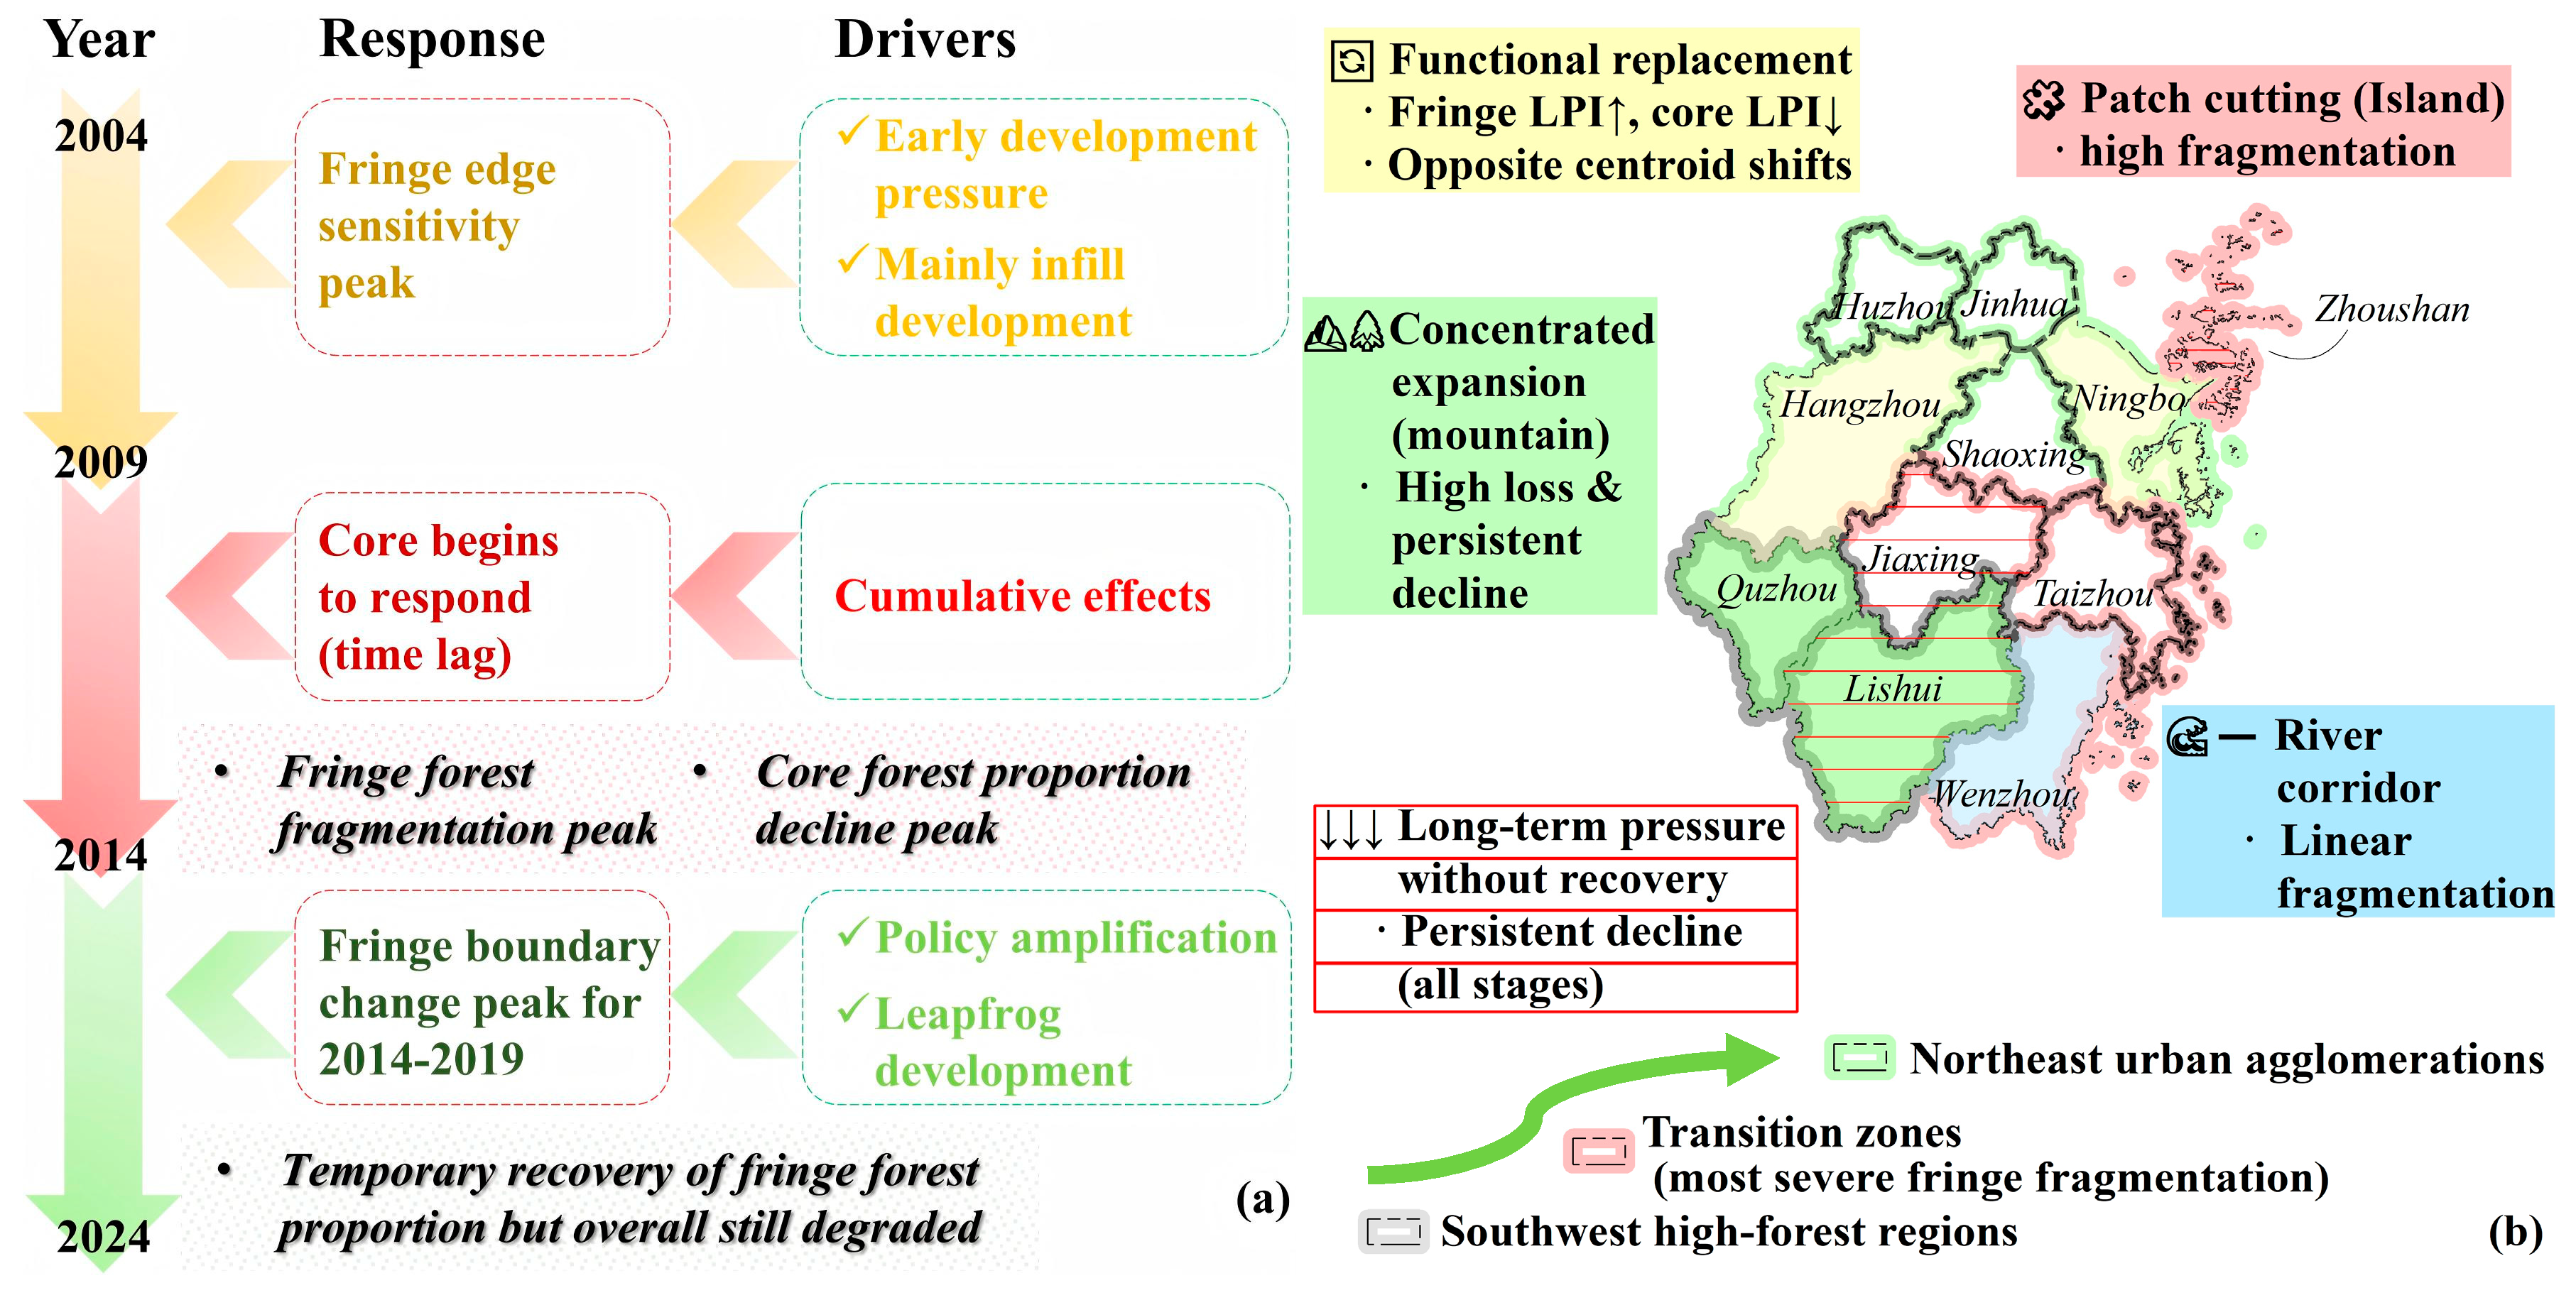
Temporally, 2009–2014 was identified as the critical turning period for fringe forest degradation, during which most indices peaked, followed by only partial mitigation without reversing the overall deterioration (Figure 12a). A distinct temporal divergence was detected among the fastest change windows. The early (2004–2009) sensitivity of the urban fringe areas to initial development pressures was identified, while later responses were observed in the core, with core changes generally following those in the fringe. This temporal offset is consistent with the consolidated nature of the core, where cumulative agglomeration and redevelopment effects are required before significant changes can be registered [71]. The peak magnitude of fringe boundary expansion (2014–2019) was decoupled from the earlier sensitivity peaks (2004–2014), a pattern that aligns with a shift from localized infill to large-scale leapfrog development, further coinciding with national policies promoting new-type urbanization and rural revitalization implemented after 2014 [72]. Additionally, the peak of forest fragmentation coincided with intensive edge expansion, and the delayed response of the core aligned with the diffusion-coalescence model, whereby urbanization-driven forest disturbances propagated outward from the fringe and reached the core after a temporal offset [31,72].
Three categories of cities require special attention regarding their urban fringe forest issues as illustrated in Figure 12b. (1) Lishui and Quzhou, as the primary forest-bearing regions of the province, showed the most dramatic declines in fringe forest proportion with persistent decreasing trends, facing the highest risk of high-value forest loss due to urban expansion. (2) Zhoushan recorded the highest patch density and splitting index alongside persistently declining connectivity, representing the most severe fragmentation; meanwhile, Wenzhou’s fringe forest proportion increased only during 2014–2019 and decreased in all other periods, with its ribbon-like urban expansion along river corridors exacerbating linear fragmentation of forest patches [4,33]. (3) Fringe and core forest centroids of Hangzhou and Ningbo shifted in opposite directions; Hangzhou showed an increasing largest patch index in the fringe but a decreasing one in the core, suggesting that fringe forests are replacing core forests as the main carriers of urban forest ecological functions, though fragmentation is intensifying simultaneously [73,74]. Furthermore, the persistent declines in fringe forest proportion observed in Jinhua, Zhoushan, and Lishui underscore the long-term degradation trend.
Thus, this study leveraged multi-dimensionally derived urban fringe boundaries to further reveal the distinctive forest changes in the fringe compared with the core within urban landscapes. Temporally, forest degradation signals in the fringe consistently preceded those in the core, with 2009–2014 identified as the critical turning point of fragmentation intensification. Spatially, the southwestern high-forest cities (Lishui and Quzhou) experienced the sharpest declines in forest proportion, the island city of Zhoushan exhibited the highest fragmentation, and fringe forests in Hangzhou and Ningbo are progressively replacing core forests as the main carriers of urban forest ecological functions. These findings provide empirical evidence that fringe forests respond to urban expansion with higher sensitivity and more consistent directional trends, whereas core forests display greater spatial inertia and later responses.

4.3. Uncertainty and Urban Managements

The uncertainties in this study primarily stem from the isotropic simplification of circular buffers regarding directional urban heterogeneity, the subjectivity of the empirical gradient threshold (i.e., the lack of systematic sensitivity testing for the “three-consecutive-buffer” criterion), the equal-weight averaging of four remote sensing dimensions, and the inherent biases of multi-source remote sensing data. A further fundamental uncertainty arises from the dynamic nature of the urban fringe boundaries, which may cause changes in forest area or proportion to partially reflect variations in the statistical extent rather than purely “actual forest changes” within a fixed geography. However, this dynamic boundary design is a necessary choice dictated by our research question concerning the spatiotemporal evolution of forest patterns along the urban-rural gradient. Specifically, concentric buffers assume isotropic urban expansion, which overlooks the directional influence of terrain and transport corridors, though this limitation is partially offset by multi-city and multi-dimensional cross-validation. The scale mismatch between the 1 km urban fringe identification and the 30 m fragmentation analysis is also acknowledged; however, its influence on boundary localization is limited because the fringe is a transitional zone rather than a fixed line. Densely spaced 1 km concentric buffers combined with multi-city sensitivity testing were employed to make the gradient threshold transferable and thereby mitigate these uncertainties [75]. Furthermore, binarized CLCD land-cover was used to suppress mixed-pixel misclassification. Annual aggregation of nighttime LST was used to dampen rainy-season high-humidity bias, and multi-step cross-calibration was applied to nighttime light data to reduce cross-sensor inconsistencies [44]. A synergistic integration of four independent dimensions as a multi-dimensional cross-validation framework was adopted, although equal-weight averaging was used. Multi-source fusion in this study remained more robust than any single dimension (Table 3), treating LandScan population grids only as an auxiliary dimension to alleviate rural underestimation [76,77]. Multi-angle quantification using area-weighted centroids and landscape pattern indices further enhanced the robustness of the conclusions [69]. The CLCD land cover dataset has an overall accuracy of approximately 79%, and its classification accuracy for forests in Zhejiang Province may introduce uncertainty. The commuting data used for external reference were derived from only four cities and are not fully independent of the nighttime light dimension; therefore, the commuting comparison should be interpreted as a supplementary consistency check rather than a formal validation. Additionally, the temporal analyses were conducted at five-year intervals (2004, 2009, 2014, 2019, and 2024), which limits the temporal resolution for precisely determining the lag duration between fringe and core responses. While the data consistently show that degradation signals appeared earlier in the fringe than in the core across all intervals, the exact lead time should be interpreted with caution. The observed pattern is best characterized as a qualitative temporal precedence rather than a quantitatively precise lag. Future improvements may incorporate directional buffers, machine learning-based adaptive breakpoint detection, systematic sensitivity analysis of the threshold criterion using higher-resolution remote sensing products or finer-scale analytical frameworks, dynamic weight optimization, nonlinear fusion frameworks, and more independent external datasets (e.g., POI density and mobile signaling data) for more robust cross-validation.
The urban fringe boundary expansion, area growth, and forest dynamics revealed a pronounced spatiotemporal coupling (Figure 5, Figure 6, Figure 7, Figure 8, Figure 9, Figure 10 and Figure 11). The accelerated fringe expansion period (2009–2014) coincided with the peak of forest loss and fragmentation, and cities with greater expansion exhibited more drastic centroid shifts and faster increases in patch density [78]. The linear expansion in ribbon-shaped polycentric cities directly induced physical dissection of forest patches, manifested as persistently declining connectivity [79]. Conversely, the concentric expansion in strong-core polycentric cities drove a transition from continuous forest cover to functionally substituted fragmentation, as indicated by the rising largest patch index but falling aggregation [72]. Considering the spatiotemporal patterns of fringe forest degradation and their close coupling with urban expansion morphologies in Zhejiang Province, the following management recommendations are proposed. Differentiated interventions should be implemented according to the specific expansion patterns and degradation magnitudes observed. In ribbon-shaped polycentric cities (e.g., Wenzhou and Zhoushan), where connectivity declined persistently with the highest observed PD and SPLIT values, linear sprawl should be curbed using ecological wedges of at least 500 m in width to interrupt physical dissection of forest patches [26,80]. A balance between function spillover and forest retention should be maintained in strong-core polycentric cities (e.g., Hangzhou and Ningbo), where fringe LPI increased while core LPI decreased, with priority given to the 10–20 km ring forest belt around the urban core to mitigate functional-substitution fragmentation [31,77]. For high-forest cities (e.g., Lishui and Quzhou), where the fringe forest proportion declined by approximately 40%, ecological red lines should be prioritized to prevent further high-value forest loss. Meanwhile, urban growth boundaries should be scientifically delineated to control disorderly fringe expansion [81]. Furthermore, an integrated urban-fringe-rural forest ecological network to enhance connectivity should be constructed to effectively mitigate forest fragmentation in urban fringes [82]. The observed fragmentation patterns in fringe forests have direct implications for ecosystem services and biodiversity, as the persistent loss of connectivity and the transition to scattered patch mosaics may compromise carbon sequestration capacity, habitat quality, and species dispersal in peri-urban landscapes. Future research should further investigate these ecological consequences via targeted field surveys and integrate socioeconomic factors to better inform adaptive management strategies.

5. Conclusions

The spatiotemporal variations in forest fragmentation in urban landscapes, as characterized via comparison between fringe and core forests, remain inadequately described due to the lack of an efficient, comprehensive, and spatiotemporally comparable framework for delineating urban fringe areas. In this study, a multidimensional remote sensing approach was developed by integrating land-cover, gridded population, nighttime light, and land surface temperature data to delineate urban fringe boundaries across Zhejiang Province from 2004 to 2024. Area-weighted centroids and landscape metrics were subsequently applied to compare forest pattern dynamics. The main results are as follows: (1) The fastest fringe expansion occurred during 2004–2014, with the most frequent boundary shifts observed in Hangzhou. (2) Across the observation periods, fringe forests tended to exhibit degradation earlier than core forests, with core responses following those in the fringe. The sharpest declines in forest proportion concentrated in the southwestern high-forest cities (Lishui and Quzhou), whereas fringe forests in Hangzhou and Ningbo progressively replaced core forests as the main ecological carriers of urban forest functions. (3) Remarkably higher fragmentation levels were detected in the fringe, peaking in Zhoushan, where fragmentation intensification coincided with intensive edge expansion (2009–2014). The core areas showed a corresponding intensification in the subsequent period, suggesting a temporal offset in response. Nighttime light intensity was identified as the most suitable dimension for delineating functional fringes in cities with a dominant core. Meanwhile, nighttime land surface temperature and built-up density better characterized physical thermal and impervious surface gradients, highlighting the advantage of multi-dimensional integration over any single indicator. Collectively, this study provides a transferable multi-dimensional remote sensing methodology for fringe delineation and evidence that fringe forests may serve as early indicators of urbanization-driven degradation, thereby supporting spatially explicit urban forest management across diverse urban systems within the uncertainties acknowledged in the Discussion Section.

Supplementary Materials

The following supporting information can be downloaded at: https://www.mdpi.com/article/10.3390/rs18142405/s1, Figure S1: Distance decay curves of four dimensions (land, population, economy, environment) in Zhejiang Province (2004–2024), derived from change rates of dimensional indices across consecutive buffers. Subplot labels combine city letters (ak) and dimension numerals (iiv).

Author Contributions

Conceptualization, L.C.; methodology, L.C.; software, L.C. and X.T.; validation, L.C. and X.T.; formal analysis, L.C.; investigation, L.C. and X.T.; resources, L.C.; data curation, L.C.; writing—original draft preparation, L.C.; writing—review and editing, L.C. and X.T.; visualization, L.C.; supervision, L.C.; project administration, L.C.; funding acquisition, L.C. All authors have read and agreed to the published version of the manuscript.

Funding

This research was funded by the National Natural Science Foundation of China, grant number 42101323 and the Natural Science Foundation of Zhejiang Province, China, grant number LQ22D010001.

Data Availability Statement

The NPP-VIIRS-like nighttime light data were downloaded from Harvard Dataverse (https://dataverse.harvard.edu/dataverse/harvard, accessed on 16 February 2026). These CLCD land use maps were acquired from Zendo Data Centre (https://zenodo.org/, accessed on 20 February 2026). The grids of LandScan Global population count were accessed by Oak Ridge National Laboratory (https://landscan.ornl.gov/, accessed on 24 February 2026). The commuting monitoring report for major Chinese cities 2024 was downloaded from Baidu Map (https://jiaotong.baidu.com/reports/, accessed on 13 February 2026).

Acknowledgments

The National Earth System Science Data Center (http://www.geodata.cn, accessed on 14 January 2026) was thanked for providing geographic information data. The National Natural Science Foundation of China (No. 42101323) and the Natural Science Foundation of Zhejiang Province, China (No. LQ22D010001) were gratefully acknowledged for the funding support.

Conflicts of Interest

The authors declare no conflicts of interest.

Abbreviations

The following abbreviations are used in this manuscript:
CLCDChina Land Cover Dataset
DMSP-OLSDefense Meteorological Satellite Program Operational Linescan System
NPP-VIIRSNational Polar-Orbiting Partnership Visible Infrared Imaging Radiometer Suite
MODISModerate Resolution Imaging Spectroradiometer
LSTLand surface temperature
LPILargest Patch Index
AREA_CVPatch Size Coefficient of Variation
PDPatch Density
PRDPatch Richness Density
LSILandscape Shape Index
FRAC_AMArea-Weighted Fractal Dimension Index
PLADJsPercentage of Like Adjacencies
SPLITSplitting Index
CONNECTConnectance Index
GYRATE_AMArea-Weighted Mean Radius of Gyration
GYRATE_CVCoefficient of Variation of Radius of Gyration
SHDIShannon’s Diversity Index

References

  1. Hutchings, P.; Willcock, S.; Lynch, K.; Bundhoo, D.; Brewer, T.; Cooper, S.; Keech, D.; Mekala, S.; Mishra, P.P.; Parker, A.; et al. Understanding rural–urban transitions in the Global South through peri-urban turbulence. Nat. Sustain. 2022, 5, 924–930. [Google Scholar] [CrossRef]
  2. Qu, S.; Li, D.; Yu, X.; Huang, F.; Zhang, Y.; Gao, J. Growing inequality of ecosystem service distribution in China’s urban–rural transition zones: Implications for SDG 11.3. npj Urban Sustain. 2026, 6, 76. [Google Scholar] [CrossRef]
  3. Kalfas, D.; Kalogiannidis, S.; Papadopoulou, C.I.; Chatzitheodoridis, F. The value of periurban forests and their multifunctional role: A scoping review of the context of and relevant recurring problems. In Modern Cartography Series; Sahana, M., Ed.; Elsevier: Amsterdam, The Netherlands, 2024; Volume 11, pp. 329–345. [Google Scholar]
  4. Zhou, L.; Wei, L.; Lopez-Carr, D.; Dang, X.; Yuan, B.; Yuan, X. Identification of irregular extension features and fragmented spatial governance within urban fringe areas. Appl. Geogr. 2024, 157, 103172. [Google Scholar] [CrossRef]
  5. Francini, S.; Chirici, G.; Chiesi, L.; Costa, P.; Caldarelli, G.; Mancuso, S. Global spatial assessment of potential for new peri-urban forests to combat climate change. Nat. Cities 2024, 1, 286–294. [Google Scholar] [CrossRef]
  6. Kodym, A.; Lapin, K.; Sanyal, D. Ecological Connectivity in Urban and Semi-Urban Forests. In Ecological Connectivity of Forest Ecosystems; Lapin, K., Oettel, J., Braun, M., Konrad, H., Eds.; Springer: Cham, Switzerland, 2025; pp. 365–381. [Google Scholar]
  7. Anav, A.; Gualtieri, M.; Sorrentino, B.; D’Elia, I.; Sicard, P.; Paoletti, E.; De Marco, A. Leveraging peri-urban forests to reduce temperature and air pollution-related urban mortality in European cities. Commun. Earth Environ. 2026, 7, 62. [Google Scholar] [CrossRef]
  8. Fang, W.; Fan, Z.; Cai, Y.; Wang, Y.; Bai, Y.; Feng, Q. A remote sensing-based assessment of biomass carbon global temporal trends in urban forests. Sustain. Prod. Consum. 2025, 58, 267–276. [Google Scholar] [CrossRef]
  9. Favoreti, A.L.F.; Albuquerque, J.W.; Rodrigues, B.N.; Canteras, F.B.; Molina Junior, V.E. The impact of land use and land cover on regulating ecosystem services provided by green infrastructures in Campinas, Brazil. Environ. Dev. Sustain. 2026; in press.
  10. Wang, C.; Sun, X.; Liu, Z.; Xia, L.; Liu, H.; Fang, G.; Liu, Q.; Yang, P. A novel full-resolution convolutional neural network for urban-fringe-rural identification: A case study of urban agglomeration region. Landsc. Urban Plan. 2024, 249, 105122. [Google Scholar] [CrossRef]
  11. Wu, W.; Zhou, L.; Wang, S.; Wei, W.; Chen, Z.; Zhang, Q.; Wang, W. Identification of Urban Fringe Areas and Assessment of Their Landscape Ecological Risks in Xi’an, China. Chin. Geogr. Sci. 2025, 35, 1013–1029. [Google Scholar] [CrossRef]
  12. Shi, Z.; Liu, M.; Tian, G.; Kovács, K.F. Web of science-based literature review of peri-urban areas: A comparison between Europe and China. Eur. J. Remote Sens. 2024, 57, 2414475. [Google Scholar] [CrossRef]
  13. Fu, B.; Gang, S.; Xue, B. New Insights and Prospects for the Urban-Rural Fringe in the Context of Urban Rural Integration. Chin. Geogr. Sci. 2026, 36, 191–206. [Google Scholar] [CrossRef]
  14. Cao, H.; Chen, C.; Chen, J.; Song, W.; He, J.; Liu, C. Differentiation of urban-rural interface and its driving mechanism: A case study of Nanjing, China. Land Use Policy 2024, 140, 107090. [Google Scholar] [CrossRef]
  15. Saini, J.; Kumar, U.; Gupta, A.K.; Mishra, P.; Dhairiyasamy, R.; Varshney, D.; Singh, S. Geospatial monitoring of peri-urban zones in Chandigarh through multi-year landsat imagery. Urban Ecosyst. 2025, 28, 189. [Google Scholar] [CrossRef]
  16. Xue, B.; Fu, B. Conceptual evolution and classification system reconstruction of urban fringe. Arid. Land Geogr. 2023, 46, 1903–1914. [Google Scholar]
  17. Ravetz, J.; Sahana, M. Where is the peri-urban? Mapping the areas ‘around, beyond and between’. Front. Sustain. Cities 2025, 7, 1436287. [Google Scholar] [CrossRef]
  18. Liang, W.; Liu, R.; Kou, P. Nighttime light dynamics reveal peri-urban brightening and population decoupling in the Chengdu Chongqing megaregion. Sci. Rep. 2026, 16, 4601. [Google Scholar] [CrossRef] [PubMed]
  19. Tiwari, P.; Vajpeyi, P. Knowledge mapping of research on peri urban areas: A bibliometric analysis. GeoJournal 2023, 88, 5353–5364. [Google Scholar] [CrossRef]
  20. He, X.; Zhou, Y.; Yuan, X.; Zhu, M. The coordination relationship between urban development and urban life satisfaction in Chinese cities—An empirical analysis based on multi-source data. Cities 2024, 150, 105016. [Google Scholar] [CrossRef]
  21. Chen, S.; Liu, Y.; Li, P.; Patrick, S.C.; Goodale, E.; Safran, R.J.; Zhao, X.; Zhuo, X.; Fu, J.; Herr, C.M.; et al. Citizen science enabled planning for species conservation in urban landscapes: The case of Barn Swallows Hirundo rustica in southern China. Landsc. Ecol. 2025, 40, 65. [Google Scholar] [CrossRef]
  22. Liang, A.; Tian, Z.; Xiang, C. Research and analysis of urban-rural residential carbon emissions in China. Sustain. Futur. 2024, 8, 100287. [Google Scholar] [CrossRef]
  23. Zamalloa, G.R.P.; Tan, Y.; He, L. Modelling human settlement growth and fringe patterns in the Andes through remote sensing and deep learning. Cities 2026, 170, 106660. [Google Scholar] [CrossRef]
  24. Yang, J.; Dong, J.; Sun, Y.; Zhu, J.; Huang, Y.; Yang, S. A constraint-based approach for identifying the urban–rural fringe of polycentric cities using multi-sourced data. Int. J. Geogr. Inf. Sci. 2021, 35, 114–136. [Google Scholar] [CrossRef]
  25. Duan, H.; Du, F.; Zhang, Y.; Jiang, X.; Chen, B. An urban-rural Fringe extraction method based on Combined Urban-rural Fringe Index (CUFI). Geocarto Int. 2024, 39, 2311211. [Google Scholar] [CrossRef]
  26. Hellenbrand, J.P.; Kelly-Voicu, P.; Bowers, J.T.; Reinmann, A.B. Edge and the city: Evaluating the role of edge effects on urban forest structure and tree species composition. Urban For. Urban Green. 2025, 107, 128745. [Google Scholar] [CrossRef]
  27. Wang, C.; Li, K.; Zhan, W.; Li, L.; Wang, C.; Wang, S.; Jiang, S.; Ge, S.; Liu, Z. Urban-rural gradients in cooling efficiency trends of tree covers across global cities. ISPRS J. Photogramm. Remote Sens. 2026, 232, 210–222. [Google Scholar] [CrossRef]
  28. Singh, R.K.; Shah, K.; Sharma, G.P. Evolving road networks and urban landscape transformation in the Himalayan foothills, India. Environ. Monit. Assess. 2024, 196, 1164. [Google Scholar] [CrossRef] [PubMed]
  29. Cai, Y.; Zhu, P.; Liu, X.; Zhou, Y. Forest fragmentation trends and modes in China: Implications for conservation and restoration. Int. J. Appl. Earth Obs. Geoinf. 2024, 132, 104068. [Google Scholar]
  30. Chen, J.; Cui, Z.; Tang, Z. Edge effects on forest dynamics in China from 2000 to 2020: Evidence from satellite remote sensing. Remote Sens. Environ. 2026, 334, 15187. [Google Scholar] [CrossRef]
  31. Ma, S.; Deng, G.; Wang, L.; Hu, H.; Fang, X.; Jiang, J. Telecoupling between urban expansion and forest ecosystem service loss through cultivated land displacement: A case study of Zhejiang Province, China. J. Environ. Manag. 2024, 357, 120695. [Google Scholar] [CrossRef]
  32. Tong, W.; Guo, J.; Lo, K.; Xu, W. Bridging the Gap to Common Prosperity: Rural Development and Urban-Rural Income Disparities in Zhejiang Province, China. Chin. Geogr. Sci. 2026, 36, 207–221. [Google Scholar] [CrossRef]
  33. Zhang, B.; Ren, Z.; Miao, Z.; Wang, L.; Wang, C.; Zhang, P.; Hong, S.; Wang, X.; Meng, F.; Huang, B. Strong increase in coverage but accelerated fragmentation in China’s urban forests under rapid urbanization. Appl. Geogr. 2025, 185, 103793. [Google Scholar] [CrossRef]
  34. He, M.; Yang, J.; Zhang, B.; Guo, M.; Zhou, L.; Yin, J. Effects of habitat fragmentation on multiple ecosystem functions in urban remnant forests. For. Ecosyst. 2026, 15, 100432. [Google Scholar] [CrossRef]
  35. Li, X.; Du, H.; Zhou, G.; Mao, F.; Zhu, D.; Zhang, M.; Xu, Y.; Zhou, L.; Huang, Z. Spatiotemporal patterns of remotely sensed phenology and their response to climate change and topography in subtropical bamboo forests during 2001-2017: A case study in Zhejiang Province, China. GISci. Remote Sens. 2023, 60, 2163575. [Google Scholar] [CrossRef]
  36. Chen, L.; Li, C.; Pan, C.; Yan, Y.; Jiao, J.; Zhou, Y.; Wang, X.; Zhou, G. Estimating the Effects of Natural and Anthropogenic Activities on Vegetation Cover: Analysis of Zhejiang Province, China, from 2000 to 2022. Remote Sens. 2025, 17, 1433. [Google Scholar] [CrossRef]
  37. Huang, Z.; Du, H.; Mao, D.; Li, X.; Zhou, G.; Sun, J.; Xu, Y.; Xuan, J.; Lu, Y.; Huang, L.; et al. Assessing the impact of land use and cover change on above-ground carbon storage in subtropical forests: A case study of Zhejiang Province, China. Geo-Spat. Inf. Sci. 2025, 28, 2781–2807. [Google Scholar] [CrossRef]
  38. Yuan, S.; Wu, M.; Yang, L.; Zhu, C.; Huang, J.; Zhang, Y. Spatiotemporal evolution, regional disparities, and driving mechanisms for the synergistic effects of production-living-ecological functions in urban-rural land spaces in Zhejiang Province of China. Trans. Chin. Soc. Agric. Eng. 2025, 41, 295–305. [Google Scholar]
  39. Shao, D.; Zoh, K.; Liu, H. Spatial Expansion and Driving Mechanisms of the Yangtze River Delta, Based on RF-RFECV Feature Selection and Night-Time Light Remote Sensing Data. Remote Sens. 2026, 18, 1033. [Google Scholar] [CrossRef]
  40. Yang, J.; Huang, X. The 30 m annual land cover dataset and its dynamics in China from 1990 to 2019. Earth Syst. Sci. Data 2021, 13, 3907–3925. [Google Scholar] [CrossRef]
  41. Lebakula, V.; Sims, K.; Reith, A.; McKee, J.; Coleman, P.; Kaufman, J.; Urban, M.; Jochem, C.; Whitlock, C.; Ogden, M.; et al. LandScan Global 30 Arcsecond Annual Global Gridded Population Datasets from 2000 to 2022. Sci. Data 2025, 12, 495. [Google Scholar] [CrossRef] [PubMed]
  42. Chen, Z.; Liao, L.; Wang, C.; Shi, K.; Yu, B. The 1992–2024 Global NPP-VIIRS-like Nighttime Light Annual Data from Deep Learning Super-Resolution Reconstruction. J. Remote Sens. 2026, 6, 0874. [Google Scholar] [CrossRef]
  43. Wan, W.; Li, H.; Xie, H.; Hong, Y.; Long, D.; Zhao, L.; Han, Z.; Cui, Y.; Liu, B.; Wang, C.; et al. A comprehensive data set of lake surface water temperature over the Tibetan Plateau derived from MODIS LST products 2001–2015. Sci. Data 2017, 4, 170095. [Google Scholar] [CrossRef] [PubMed]
  44. Xia, X.; Sun, S.; Liu, Q.; Guo, H.; Wang, Y. Spatio-temporal heterogeneity and driving mechanisms of RSEI in the north-south sections of the Beijing-Hangzhou grand canal: An empirical study using GEE and XGBoost-SHAP. Sci. Rep. 2026, 16, 16790. [Google Scholar] [CrossRef] [PubMed]
  45. Kim, Y.; Yoo, C.; Im, J. Nighttime satellite land surface temperature for urban applications: Achievements, challenges, and future prospects. GISci. Remote Sens. 2025, 62, 2527990. [Google Scholar] [CrossRef]
  46. Guo, M.; Shu, S.; Ma, S.; Wang, L. Using high-resolution remote sensing images to explore the spatial relationship between landscape patterns and ecosystem service values in regions of urbanization. Environ. Sci. Pollut. Res. 2021, 28, 56139–56151. [Google Scholar] [CrossRef]
  47. Rappaport, J.; Humann, M.K. A better delineation of U.S. metropolitan areas. J. Urban Econ. 2025, 149, 103781. [Google Scholar] [CrossRef]
  48. Xu, C.; Liu, M.; Yang, X.; Sheng, S.; Zhang, M.; Huang, Z. Detecting the spatial differentiation in settlement change rates during rapid urbanization in the Nanjing metropolitan region, China. Environ. Monit. Assess. 2010, 171, 457–470. [Google Scholar] [CrossRef] [PubMed]
  49. Wang, Z.; Kiloes, A.; Akber, M.A.; Wiwoho, B.S.; Aziz, A.A. A Multi-Dimensional Indicator Framework for Peri-Urban Area Delineation: Insights from Equal- and AHP-Weighted Models in Java, Indonesia. Remote Sens. 2026, 18, 1062. [Google Scholar] [CrossRef]
  50. Laghari, Y.; Niu, Z.; Leghari, S.J.; Ali, M.A.; Li, Q.; Shi, J. Wetland dynamics in the Indus River Delta: A Sentinel-2 and machine learning approach. J. Environ. Manag. 2025, 392, 126819. [Google Scholar] [CrossRef]
  51. Fan, Q.; Lu, Q.; Liu, B.; Li, J.; Ping, X.; Yang, X. Research on the centre of gravity after “Transfer-Conversion-Changes” in different land use types during 2010–2020. Sci. Rep. 2025, 15, 21722. [Google Scholar] [CrossRef] [PubMed]
  52. Cui, L.; Wang, J.; Sun, L.; Lv, C. Construction and optimization of green space ecological networks in urban fringe areas: A case study with the urban fringe area of Tongzhou district in Beijing. J. Clean. Prod. 2020, 276, 124266. [Google Scholar] [CrossRef]
  53. Shin, W.; Kim, J.; Kim, D.; Han, Y.; Thorne, J.H.; Song, Y. Seasonal Habitat Distribution and Connectivity Response of Water Deer and Wild Boar to Hotspot Fencing in a Fragmented Urban Forest Fringe. Ecol. Evol. 2026, 3, e73000. [Google Scholar]
  54. Macfadyen, S.; Kramer, E.A.; Parry, H.R.; Schellhorn, N.A. Temporal change in vegetation productivity in grain production landscapes: Linking landscape complexity with pest and natural enemy communities. Ecol. Entomol. 2015, 40, 56–69. [Google Scholar] [CrossRef]
  55. Zabihi, M.; Mostafazadeh, R.; Gonabadi, I.S. Analyzing the spatial patterns and changes in urban green spaces of an under rapid urbanization area through landscape metrics. Adv. Space Res. 2025, 76, 2779–2794. [Google Scholar] [CrossRef]
  56. China Academy of Urban Planning & Design. Commuting Monitoring Report for Major Chinese Cities. 2024. Available online: https://huiyan.baidu.com/boswebsite/cms/report/2024tongqin (accessed on 12 March 2026).
  57. Zhao, P.; Wang, H.; Liu, Q.; Yang, X.; Li, J. Unravelling the spatial directionality of urban mobility. Nat. Commun. 2024, 15, 4507. [Google Scholar] [CrossRef] [PubMed]
  58. Güller, C.; Varol, C. Evaluating the Morphological and Functional Centrality: An Integrated Approach to Spatial Structure. Appl. Spat. Anal. Policy 2026, 19, 15. [Google Scholar] [CrossRef]
  59. Wei, T.D.; Xiao, W.; Wu, Y. Polycentric Urban Development in China: Dimensions, Effects, and Policies. Chin. Geogr. Sci. 2025, 35, 1030–1044. [Google Scholar] [CrossRef]
  60. Wu, Y. The Spatial Co-construction Mechanism and Element-driven Pathways of the “Urban-Rural Equivalence” Concept: An Empirical Analysis of Hangzhou’s “Networked Metropolis”. Urban Insight 2025, 5, 114–127+163. [Google Scholar]
  61. Zheng, L.; Xue, Y.; Huang, D. Inter-city transport hubs and intra-city polycentric structure: Evidence from high-speed rail stations and airports in China. J. Transp. Geogr. 2025, 123, 104132. [Google Scholar] [CrossRef]
  62. Ain, J.I. Disentangling urbanization and vegetation signals on daytime/nighttime surface warming via satellite observations across Saudi Arabia. Adv. Space Res. 2026; in press.
  63. Guo, C.; Xie, G.; Yu, W.; Zhou, W.; Pickett, S.T.A. An integrative social-ecological approach for urban boundary mapping. Appl. Geogr. 2025, 180, 103665. [Google Scholar] [CrossRef]
  64. Láng-Ritter, J.; Keskinen, M.; Tenkanen, H. Global gridded population datasets systematically underrepresent rural population. Nat. Commun. 2025, 16, 2170. [Google Scholar] [CrossRef] [PubMed]
  65. Spinosa, A. Wider urban zones: Use of topology and nighttime satellite images for delimiting urban areas. Rev. Reg. Res. 2022, 42, 141–159. [Google Scholar] [CrossRef]
  66. Tong, C.; Xue, X.; Huang, C.; Chen, Y.; Bao, H.; Zhu, C. Is Nighttime Light Primarily from Human Settlements? Exploring the Spatial Relationship Between NTL and Impervious Surface in Zhejiang Province, China. IEEE J. Sel. Top. Appl. Earth Obs. Remote Sens. 2025, 18, 15900–15913. [Google Scholar] [CrossRef]
  67. Liu, X.; Zheng, L.; Wang, Y. Revealing the roles of climate, urban form, and vegetation greening in shaping the land surface temperature of urban agglomerations in the Yangtze River Economic Belt of China. J. Environ. Manag. 2025, 377, 124602. [Google Scholar] [CrossRef]
  68. Li, Y.; Zhao, Z.; Xin, Y.; Xu, A.; Xie, S.; Yan, Y.; Wang, L. How Are Land-Use/Land-Cover Indices and Daytime and Nighttime Land Surface Temperatures Related in Eleven Urban Centres in Different Global Climatic Zones? Land 2022, 11, 1312. [Google Scholar] [CrossRef]
  69. Dutt, S.; Remmel, T.K.; Rivas, C.A.; Mazziotta, A.; Kunz, M. Advancing forest fragmentation analysis: A systematic review of evolving spatial metrics, software platforms, and remote sensing innovations. Landsc. Ecol. 2026, 41, 92. [Google Scholar] [CrossRef]
  70. Xu, J.; Ma, Q.; Kong, J. Spatiotemporal evolution and coupling mechanisms of urbanization and ecosystem health in Zhejiang Province, China: Implications for ecological restoration and sustainable development. Sustain. Cities Soc. 2026, 139, 107224. [Google Scholar] [CrossRef]
  71. Tang, S.; Guo, Q. Delayed redevelopment in urban expansion: Opportunities for the preservation and revitalisation of collective memory in Shiqiao Town, Chengdu. Built Herit. 2025, 9, 22. [Google Scholar] [CrossRef]
  72. Hu, Y.; Hu, T.; Xue, F.; Peng, J. From dominant edge expansion to increasing infilling: The driving forces behind built-up area fragmentation in Chinese cities. npj Urban Sustain. 2026, 6, 39. [Google Scholar] [CrossRef]
  73. Pei, H.; Zhang, L.; Zhou, M.; Nie, W.; Zhou, S.; Shi, Y.; Pan, J. Landscape Stability Assessment and Simulation Analysis Under Urban Expansion: A Case Study of Hangzhou, China. Chin. Geogr. Sci. 2025, 35, 311–325. [Google Scholar] [CrossRef]
  74. Zhang, Y.; Hua, T.; Liu, S.; Zhang, S.; Zhao, W. Multiple trajectories of urban–rural ecosystem services disparities: Evidence from two decades of urbanization in China. Appl. Geogr. 2026, 186, 103861. [Google Scholar] [CrossRef]
  75. Fang, J.; Zhang, S.; Deng, W.; Zhang, H. A 1 km datasets for urban–suburban–rural–natural continuous gradient landscapes in Southwest China. Sci. Data 2025, 12, 2010. [Google Scholar] [CrossRef] [PubMed]
  76. Xue, B.; Xiao, X.; Li, J.; Zhao, B.; Fu, B. Multi-source Data-driven Identification of Urban Functional Areas: A Case of Shenyang, China. Chin. Geogr. Sci. 2023, 33, 21–35. [Google Scholar]
  77. Zhang, W.; Woods, D.; Olowe, I.D.; Schiavina, M.; Fang, W.; Hornby, G.; Bondarenko, M.; Maes, J.; Dijkstra, L.; Tatem, A.J.; et al. Assessing the impacts of gridded population model choice on degree of urbanisation metrics. Cities 2025, 166, 106293. [Google Scholar] [CrossRef]
  78. Ding, G.; Guo, J.; Yi, D.; Ou, M.; Yang, G. Evaluating habitat isolation driven by future urban growth: A landscape connectivity perspective. Environ. Impact Assess. Rev. 2025, 113, 107886. [Google Scholar] [CrossRef]
  79. Wang, J.; Jiang, X.; You, Y.; Chang, S.; Su, K. Habitat connectivity evolution and management strategies under the dual drivers of urban expansion and renewal: A case study of nanning, China. Environ. Sustain. Indic. 2026, 29, 101062. [Google Scholar] [CrossRef]
  80. Li, H.; Wu, M.; Huang, X.; Zhuang, Y.; Chen, H.; Zhan, F.; Liu, Z. Identification of green patches prioritized for urban expansion as a supplementary approach to mitigating landscape connectivity loss. J. Environ. Manag. 2025, 392, 126913. [Google Scholar] [CrossRef]
  81. Zhang, R.; Yao, X.; Zhang, H.; Wang, Y. Urban growth boundaries for ecologically fragile cities: A simulation-constraint approach for sustainable land use planning in mountainous regions. J. Mt. Sci. 2026, 23, 1724–1740. [Google Scholar] [CrossRef]
  82. Bracken, A.M.; Nelli, L.; Pinna, L.C.; Corbett, A.; McLeod, R.; Dominoni, D.M.; McCafferty, D.J. Designing nature networks for cities: Combining multi-species modelling approaches. Landsc. Ecol. 2026, 41, 56. [Google Scholar] [CrossRef] [PubMed]
Figure 1. The location (a) and land cover (b) of Zhejiang Province. The elevation is from the Copernicus Digital Elevation Model (http://www.geodata.cn). The land cover is from the China Land Cover Dataset (CLCD).
Remotesensing 18 02405 g001
Figure 2. The workflow of characteristic quantification of urban forest fragmentation based on multidimensional remote sensing data and spatiotemporal pattern analysis.
Remotesensing 18 02405 g002
Figure 3. An example of the identification of urban fringe areas, i.e., Shaoxing city in 2024.
Remotesensing 18 02405 g003
Figure 4. The city-specific summary of boundaries of the urban fringe area based on multidimensional remote sensing products between 2004 and 2024 in Zhejiang Province.
Remotesensing 18 02405 g004aRemotesensing 18 02405 g004b
Figure 5. The determined boundaries of city-level urban fringe areas between 2004 and 2024 in Zhejiang Province.
Remotesensing 18 02405 g005
Figure 6. The spatiotemporal distribution of urban fringe areas and the changes in area between 2004 and 2024 in Zhejiang Province.
Remotesensing 18 02405 g006
Figure 7. The spatiotemporal distribution of forests and the changes in forest cover within urban landscapes between 2004 and 2024 in Zhejiang Province.
Remotesensing 18 02405 g007
Figure 8. The spatiotemporal distribution of city-specifically area-weighted forest centroids within urban landscapes between 2004 and 2024 in Zhejiang Province.
Remotesensing 18 02405 g008
Figure 9. Variations in the landscape pattern indices of forests within urban landscapes of Zhejiang Province. The abbreviations of LPI (a), AREA_CV (b), PD (c), LSI (d), FRAC_AM (e), PLADJ (f), SPLIT (g), CONNECT (h), GYRATE_AM (i), GYRATE_CV (j), PRD (k) and SHDI (l) represent the Largest Patch Index, Patch Size Coefficient of Variation, Patch Density, Landscape Shape Index, Area-weighted Fractal Dimension Index, Percentage of Like Adjacencies, Splitting Index, Connectance Index, Area-weighted Mean Radius of Gyration, Coefficient of Variation of Radius of Gyration, Patch Richness Density, and Shannon’s Diversity Index, respectively.
Remotesensing 18 02405 g009
Figure 10. City-specific variations in the landscape pattern indices of forests within urban landscapes of Zhejiang Province.
Remotesensing 18 02405 g010
Figure 11. Schematic diagram of the utility in delineating urban core–fringe boundaries by gradient decay patterns in remote sensing-based dimensions, taking Shaoxing city as an example.
Remotesensing 18 02405 g011
Figure 12. Mechanisms of temporal divergence (a) and spatial heterogeneity (b) in urban fringe forest dynamics across Zhejiang Province.
Remotesensing 18 02405 g012
Table 1. The adopted remote sensing data between 2004 and 2024 for multidimensional identification of urban fringe areas.
DimensionData SourceIndicatorSpatial ResolutionTime
LandChina Land Cover Dataset (CLCD)Built-up density30 m2004/2009/2014/2019/2024
PopulationLandScan GlobalPopulation1 km
EconomyNPP-VIIRS-likeNighttime light intensity500 m
EnvironmentMOD11A2Land surface temperature1 km
Table 2. Descriptions of adopted landscape pattern indices.
TypeIndexesPrimary FunctionDescription
Class LevelLandscape Level
Area and edgeLargest Patch
Index (LPI)
DominanceHigh: class dominates as matrix; low: even patch distribution, no clear dominance.High: landscape dominated by one large patch (low heterogeneity); low: even distribution, high fragmentation.
Patch Size
Coefficient of
Variation (AREA_CV)
Size uniformityHigh: large patch size disparity (few large, many small); low: uniform patch sizes.High: highly uneven patch sizes across landscape; low: consistent patch sizes.
Density and richnessPatch Density (PD)Fragmentation degreeHigh: class fragmented (fine dissection); low: high continuity/integrity.High: severe overall fragmentation (fine-grained); low: good landscape integrity.
Patch Richness Density (PRD)Type richness High: rich patch types per unit area (high heterogeneity); low: few types (monotonous).
ShapeLandscape Shape Index (LSI)Boundary complexityHigh: complex/irregular boundaries (strong disturbance); low: regular shapes (e.g., circular).High: overall complex patch shapes (high disturbance); low: regular shapes (e.g., planned).
Area-Weighted Fractal Dimension Index (FRAC_AM)Shape regularityHigh (near 2): complex, irregular shapes; low (near 1): simple, regular (e.g., squares).High: overall complex shapes, diverse mosaic; low: simple, regular shapes.
Aggregation and
dispersion
Percentage of Like Adjacencies (PLADJs)AggregationHigh: class highly aggregated (contiguous); low: class scattered, mixed with others.High: high overall aggregation (patch types concentrated); low: high mixing
/interspersion.
Splitting Index (SPLIT)Fragmentation/continuityHigh: class more fragmented (low contiguity); low: high contiguity/continuity.High: good overall connectivity across landscape; low: mutual patch
isolation.
Proximity and
connectivity
Connectance Index (CONNECT)Functional connectivityHigh: good functional connectivity within threshold; low: isolated patches.High: presence of large patches with extensive core areas; low: lack of large core habitats.
Core areaArea-Weighted Mean Radius of
Gyration
(GYRATE_AM)
Core area extentHigh: large patches have broad core areas (large interior habitats); low: narrow cores or fine grains.High: presence of large patches with extensive core areas; low: lack of large core habitats.
Coefficient of
Variation of
Radius of Gyration (GYRATE_CV)
Core area uniformityHigh: large disparity in core area extents among patches; low: uniform core sizes.High: highly uneven core area sizes across landscape (strong spatial
heterogeneity); low: relatively
uniform core sizes.
DiversityShannon’s
Diversity Index (SHDI)
Compositional heterogeneity High: rich patch types and even area distribution (high heterogeneity); low: few types dominate (monotonous).
Table 3. The radii of different cities around the local governments based on the commuting monitoring report for major Chinese cities 2025, released by Baidu Map 1 compared with the multidimensional results in 2024.
CityDistance (km)
RadiusLandPopulationEconomyEnvironmentMulti-Dimension
Hangzhou8.1771098.25
Ningbo7.266887
Wenzhou6.654655
Shaoxing7.974665.75
1 The report can be downloaded from the following website: https://jiaotong.baidu.com/reports (accessed on 13 February 2026).
Disclaimer/Publisher’s Note: The statements, opinions and data contained in all publications are solely those of the individual author(s) and contributor(s) and not of MDPI and/or the editor(s). MDPI and/or the editor(s) disclaim responsibility for any injury to people or property resulting from any ideas, methods, instructions or products referred to in the content.