Article

Flash Drought Dynamics in China’s Major Agricultural Plains: Spatiotemporal Patterns and Crop Photosynthetic Recovery Across Cropping Systems
1
School of Resource and Environmental Engineering, Hefei University of Technology, Hefei 230009, China
2
College of Civil Engineering, Hefei University of Technology, Hefei 230009, China
3
International Institute of Earth System Science, Nanjing University, Nanjing 210023, China
*
Author to whom correspondence should be addressed.
These authors contributed equally to this work.
Remote Sens. 2026, 18(14), 2295; https://doi.org/10.3390/rs18142295
Submission received: 17 May 2026 / Revised: 22 June 2026 / Accepted: 2 July 2026 / Published: 9 July 2026

Highlights

What are the main findings?
  • During 2001–2024, flash droughts across China’s major agricultural plains showed contrasting patterns: a high-frequency, low-intensity regime in the southern Middle–Lower Yangtze Plain versus a low-frequency, high-intensity, long-duration regime in the central North China Plain. Consequently, rice systems faced high-frequency shock risks, whereas rainfed and rotation systems bore intensity-cumulative risks.
  • Across all cropping systems, SIF responded to flash droughts 6–9 days earlier than GPP, revealing a consistent “rapid physiological response–lagged carbon assimilation recovery” pattern. Random Forest–SHAP analysis further identified the month of occurrence, drought duration, and decline rate as the dominant drivers of photosynthetic recovery.
What are the implications of the main findings?
  • The systematic 6–9-day lead of SIF over GPP, confirmed across diverse cropping systems, establishes SIF as a reliable remote-sensing early-warning indicator. It can support proactive agricultural drought responses well before conventional declines in vegetation productivity become detectable.
  • The crop-specific risk differentiation, together with the dominant role of phenological timing over drought intensity, provides a scientific basis for designing targeted, system-specific mitigation strategies. These include optimizing rotation scheduling (e.g., shortening fallow intervals in WW–SSR systems) and strengthening regional food-security management under intensifying climate extremes.

Abstract

Flash drought, an abruptly intensifying meteorological anomaly, poses a growing threat to agricultural production, ecosystem stability, and regional carbon cycling, particularly in croplands of monsoon regions. Existing studies have largely focused on point-scale identification or conventional vegetation indices, whereas the regional spatiotemporal evolution of flash droughts and crop-specific differences in photosynthetic recovery remain poorly understood. Using multi-source remote sensing data for the North China Plain and the Middle–Lower Yangtze Plain during 2001–2024, this study integrated triple-collocation error assessment, root-zone soil-moisture percentile identification, connected-component tracking, and Random Forest–SHAP analysis to characterize flash drought trajectories and their vegetation impacts. The results showed that the southern Middle–Lower Yangtze Plain exhibited a high-frequency but low-intensity pattern, whereas the central North China Plain was characterized by lower frequency yet higher intensity and longer duration. Rice-based systems were more vulnerable to frequent flash drought shocks, whereas rainfed and rotation systems faced stronger cumulative risks. Solar-induced chlorophyll fluorescence (SIF) responded to flash droughts 6–9 days earlier than gross primary productivity (GPP), and all cropping systems displayed a “rapid physiological response–lagged carbon-assimilation recovery” pattern. The month of occurrence, drought duration, and decline rate were identified as the dominant factors governing photosynthetic recovery. These findings extend the flash drought monitoring framework to incorporate regional connectivity and crop recovery mechanisms, providing a remote-sensing basis for agricultural early warning, drought mitigation, and food-security management.

1. Introduction

As one of the most pervasive meteorological hazards, drought has long threatened agricultural production, ecosystem stability, and the regional carbon balance. Conventional droughts typically develop gradually, often requiring months or even years to progress from onset to peak intensity [1]. In recent years, rising evaporative demand and intensifying atmospheric desiccation [2] have increased both the frequency and the progression rate of droughts. As a result, a new drought paradigm—flash drought—has emerged as an increasingly important focus of drought research [3]. Compared with conventional droughts, flash droughts can trigger rapid soil-moisture depletion, evapotranspiration imbalance, and a concurrent surge in vapor pressure deficit (VPD) within a few weeks, imposing more severe impacts on agricultural production and ecosystem functioning [4,5]. In the summer of 2013, flash droughts struck 13 provinces of southern China within less than a month, damaging over 2 million hectares of cropland [6]. The North China Plain, one of the nation’s principal grain-producing regions, frequently experiences severe agricultural droughts in both spring and autumn, with spring droughts generally more intense than autumn ones. Therefore, accurately identifying flash drought events and elucidating their spatiotemporal evolution are of considerable theoretical and practical significance for regional drought risk assessment and food security.
A universally accepted definition of flash drought has yet to be established, and a diverse suite of indices has been developed for its identification. These include the Evaporative Stress Index (ESI) [7], the Evaporative Demand Drought Index (EDDI) [8], the combined Standardized Evaporative Stress Ratio (SESR) [9] and Rapid Change Index (RCI) [10], and soil moisture (SM) [11]. Previous studies have demonstrated that soil-moisture anomalies are reliable indicators during the early phase of drought and are particularly suitable for flash drought monitoring [2,12]. A rapid decline in soil moisture can serve as a critical precursory signal of flash drought onset. However, existing soil-moisture-based monitoring studies have predominantly addressed drought onset and termination at the point scale, emphasizing temporal persistence, with run theory being the most commonly applied approach [13,14]. Such studies generally overlook the spatial connectivity and regional synchronicity of drought, which may substantially underestimate its actual extent and severity, thereby weakening drought responses and risk management. To address this limitation, innovative methods such as hydrological models [15], machine learning [4], and complex networks [16] have been increasingly applied to study drought propagation and evolution. Among these, three-dimensional connectivity analysis can precisely characterize the spatiotemporal dynamics of short-duration regional flash droughts by identifying spatially contiguous drought clusters [17,18].
During flash drought episodes, high temperatures and scarce precipitation drive a rapid rise in VPD, forcing stomatal closure, suppressing CO2 uptake and photosynthetic carbon fixation, and ultimately causing a marked decline in terrestrial ecosystem productivity [19,20]. Compared with deep-rooted vegetation, shallow-rooted vegetation—particularly crops—is more sensitive to flash droughts. To assess vegetation responses, most studies have relied on conventional remote-sensing indices such as the Normalized Difference Vegetation Index (NDVI) and the Leaf Area Index (LAI) [21]. Osman et al. [22] compared key variables—precipitation (P), root-zone soil moisture (RZSM), temperature (T), and the actual-to-potential evapotranspiration ratio—for flash drought identification, and found that RZSM produced the most distinct response signal. Nevertheless, these indices respond to flash droughts with a notable lag, making it difficult to capture their impacts on vegetation physiological processes in a timely manner [23,24]. To overcome this limitation, recent research has increasingly turned to direct observation of vegetation functional indicators [24,25]. Among these, gross primary productivity (GPP) is a key indicator of ecosystem carbon sequestration and carbon cycling, and it is sensitive to drought stress [26]. Reliable crop-type mapping is a prerequisite for quantifying cropping-system-specific drought responses, and high-resolution annual crop datasets provide essential land-use baseline data for such analyses [27]. With advances in remote sensing, solar-induced chlorophyll fluorescence (SIF), a direct proxy for the light reactions of photosynthesis, has been widely used to monitor vegetation physiological status and rapid drought responses. Compared with conventional vegetation indices, SIF can detect the suppression of the photosynthetic system at an earlier stage under stomatal closure and rapidly rising VPD, typically preceding the GPP decline by several weeks. It is therefore regarded as an important early indicator of drought, particularly flash drought. Previous studies have shown that SIF and GPP are highly consistent at interannual and seasonal scales across many ecosystems; however, under drought stress, they differ markedly in response magnitude, timing, and sensitivity [23,28]. Nonetheless, research on SIF and GPP has largely concentrated on natural ecosystems or vegetation at the aggregate scale [29,30,31], paying relatively little attention to croplands. Moreover, most cropland studies have focused on yield impacts [32], and lack fine-scale comparisons of crop types. Meanwhile, vegetation responses to drought are modulated by intrinsic drought characteristics such as intensity, frequency, and duration [33,34,35]. However, most relevant findings are derived from conventional droughts; how multi-factor interactions affect vegetation photosynthesis under the rapid, intense stress typical of flash droughts remains unclear.
Therefore, this study uses multi-source remote sensing data (SIF, soil moisture, and GPP), combined with a root-zone soil-moisture percentile method and connected-component analysis, to systematically examine the spatiotemporal distribution of flash droughts and their effects on vegetation recovery across different cropping systems in the North China Plain and the Middle–Lower Yangtze Plain. A Random Forest model combined with SHAP (Shapley Additive Explanations) values is then used to quantify the drivers of photosynthetic recovery rate, aiming to bridge existing gaps in research on regional flash drought response mechanisms and crop recovery capacity. This study is expected to advance the theoretical understanding of drought response mechanisms while offering practical insights for regional agricultural disaster prevention and providing new evidence for drought prediction, food security management, and ecosystem stability assessment.

2. Materials and Methods

2.1. Study Area

Under global warming, the increasing frequency of extreme high-temperature events and intensified land–atmosphere interactions have driven a marked upward trend in flash drought occurrences across East Asia [36]. Within China’s East Asian monsoon region, the North China Plain and the Middle–Lower Yangtze Plain are the nation’s representative rainfed agricultural zone and major rice-producing area, respectively. As core regions for national food security, both are highly sensitive and vulnerable to climate change. Accordingly, this study selected the North China Plain (34–40°N, 110–120°E) and the Middle–Lower Yangtze Plain (28–33°N, 110–122°E) as representative study areas (Figure 1a) to examine the spatiotemporal characteristics and driving mechanisms of flash droughts under the East Asian monsoon climate.
The two plains are geographically extensive, span a wide latitudinal range, and support diverse cropping structures. Following the classification of Fu et al. (2026) [27], the land-use categories of the study area are shown in Figure 1c. Here, SSR denotes single-season rice, DSR denotes double-season rice, WW denotes winter wheat, WW–SSR denotes the winter wheat–single-season rice rotation, M denotes maize, and WW–M denotes the winter wheat–maize rotation.

2.2. Data Sources

The datasets used in this study are summarized in Table 1, with detailed descriptions and preprocessing procedures provided in Supplementary Material S1. All datasets were resampled to a common spatial resolution of 0.1°.
The annual China Crop Dataset (CCD), with a 30 m spatial resolution, was used to identify crop types. To ensure consistency with the 0.1° soil moisture, SIF, and GPP datasets, the CCD data were resampled to 0.1° using the nearest-neighbor method in ArcGIS (version 10.8). The nearest-neighbor approach was chosen because CCD is categorical, and this method preserves the original crop-class labels without introducing artificial category values. After resampling, each 0.1° grid cell was assigned the crop type of the nearest CCD category. The resulting crop map should therefore be interpreted as the dominant crop type at the 0.1° scale. Owing to the coarse resolution, mixed pixels containing multiple crop types are unavoidable.
The solar-induced chlorophyll fluorescence (SIF) data were obtained from the Global OCO-2 SIF (GOSIF) product. GOSIF is a machine-learning reconstruction that uses OCO-2 SIF observations as training targets and combines MODIS surface reflectance with meteorological reanalysis variables as predictors to generate spatially continuous SIF estimates. It provides global coverage at a spatial resolution of 0.05° and a temporal resolution of 8 days. GOSIF should therefore be regarded as a satellite-constrained reconstruction product rather than a direct satellite observation.
All datasets were harmonized to a spatial resolution of 0.1°. For categorical datasets, nearest-neighbor resampling was applied to preserve the original class information without introducing artificial categories. For continuous variables, spatial aggregation rather than interpolation was used. Specifically, the original 0.05° GOSIF and GOSIF-GPP pixels were aggregated to 0.1° grids by area-weighted averaging, in which each fine-resolution pixel contributed proportionally to its spatial coverage within the target cell. This procedure preserves the mean photosynthetic signal within each grid cell and avoids the artificial spatial patterns introduced by interpolation.

2.3. Methods

2.3.1. Multi-Source Soil Moisture Error Assessment (Extended Triple Collocation)

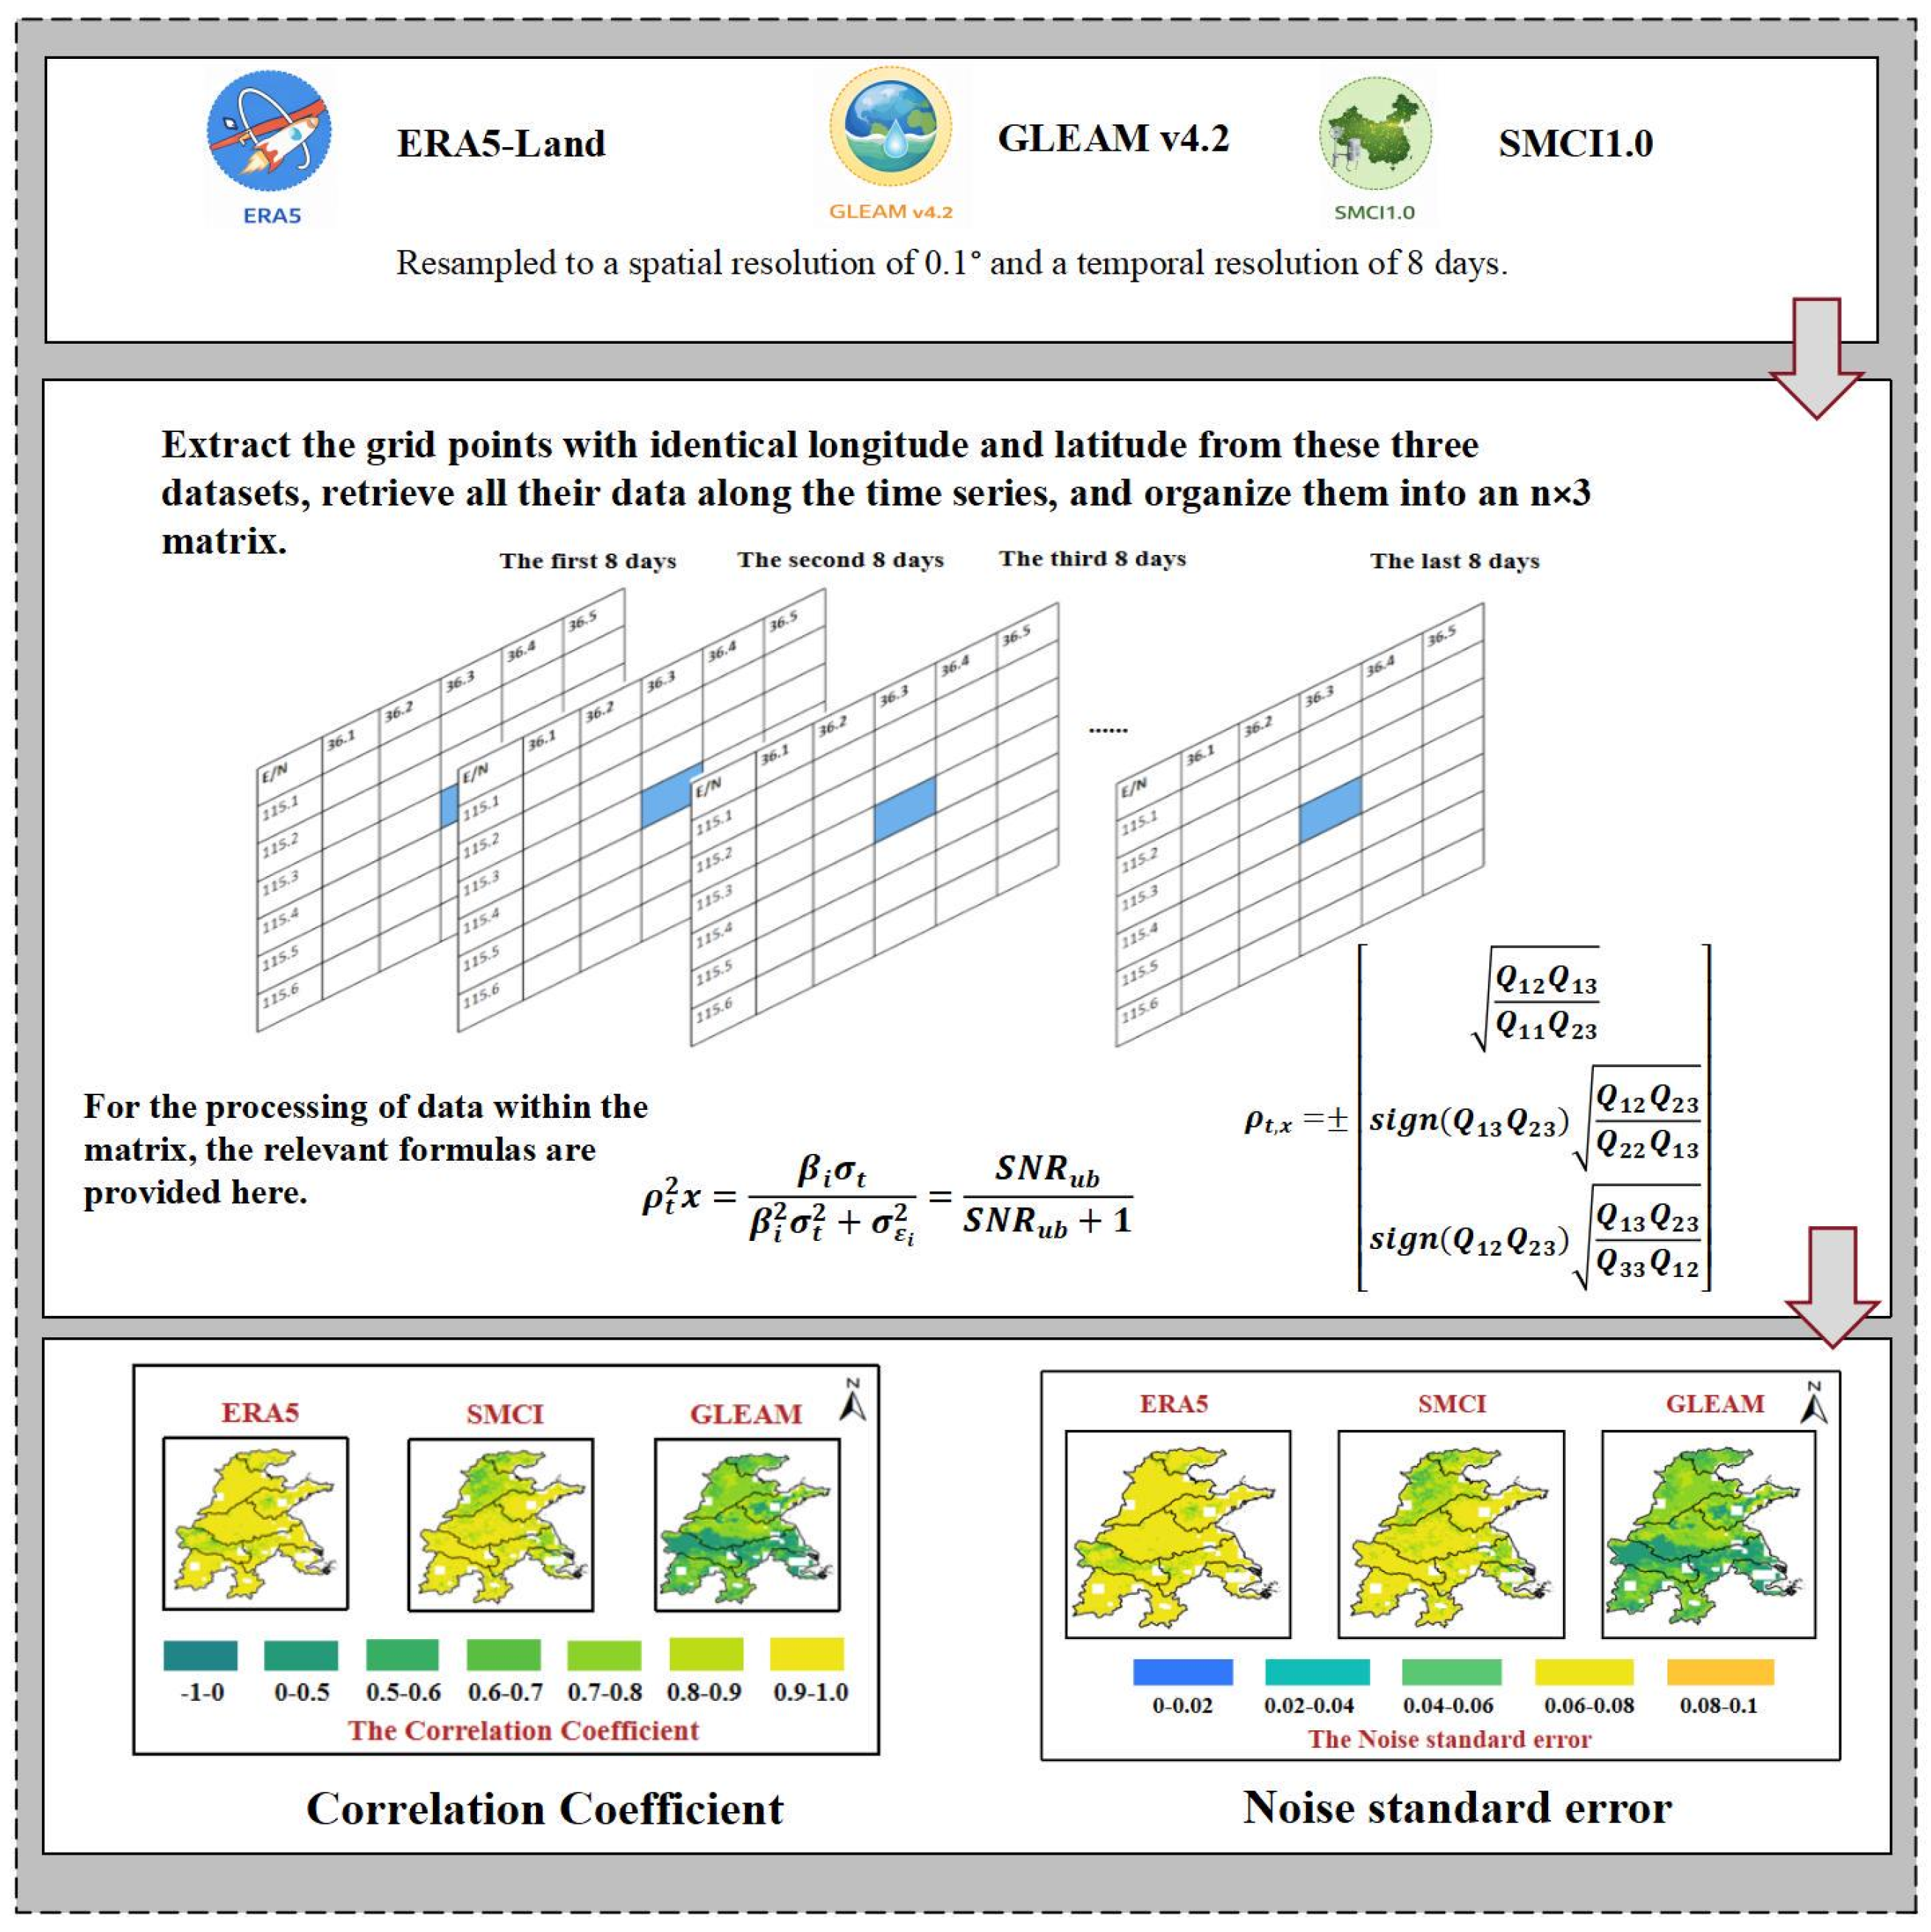
Because the regional performance of soil moisture products may be affected by vegetation, soil type, and surface conditions, the Extended Triple Collocation (ETC) method [37] was adopted to objectively assess data quality. By constructing a triplet from the ERA5, GLEAM, and SMCI1.0 datasets, ETC quantifies the random error, signal-to-noise ratio, and bias of each dataset independent of ground-truth observations (Figure 2). ETC has been widely used for the accuracy evaluation and intercomparison of multi-source soil moisture data at global and regional scales, and can effectively identify datasets with high accuracy and low uncertainty [10,38]. Detailed procedures and formulas are given in McColl et al. [39]. Table S1 in the Supplementary Material presents the correlation coefficients and standard noise errors of each dataset computed by ETC. Because the SMCI1.0 dataset extends only to 2022, the ETC analysis used the common overlapping period (2001–2022) of ERA5-Land, GLEAM, and SMCI1.0. All three datasets exhibited relatively low noise errors, and ERA5 achieved the highest correlation coefficient and the best overall performance. ERA5-Land was therefore selected as the data source for the subsequent flash drought identification.
Although ETC assumes mutually independent errors, complete independence cannot be strictly guaranteed for large-scale soil moisture products, as some datasets may share observational information or meteorological forcing data. In this study, both ERA5-Land and GLEAM use ERA5-based meteorological forcing, and both may be influenced by ASCAT observations during product generation. Nevertheless, the two datasets are based on different model structures and estimation frameworks, leading to different error propagation pathways and error characteristics. The ETC results should therefore be interpreted primarily as a relative assessment of product performance rather than an exact estimate of absolute uncertainty.

2.3.2. Flash Drought Identification

This study adopted the widely recognized flash drought identification framework of Yuan et al. [36,40], extracting flash drought events from RZSM percentiles. To remove climatological and seasonal discrepancies in soil moisture across regions, the Empirical Distribution Function (EDF) was used to compute RZSM percentiles [40,41]. For each grid cell, a multi-year RZSM time series was constructed using a 17-day window centered on the target date p (p − 8 to p + 8); EDF fitting was then applied to map RZSM values onto a 0–100 percentile scale.
The specific criteria for flash drought identification are as follows:
(a)
A flash drought begins when the RZSM percentile declines from ≥40% to ≤20%.
(b)
It terminates when the RZSM percentile recovers above 20%.
(c)
The mean decline rate over each 8-day interval is ≥8%.
(d)
The drought duration is ≥24 days (i.e., ≥3 eight-day periods).

2.3.3. Spatiotemporal Trajectories of Flash Droughts

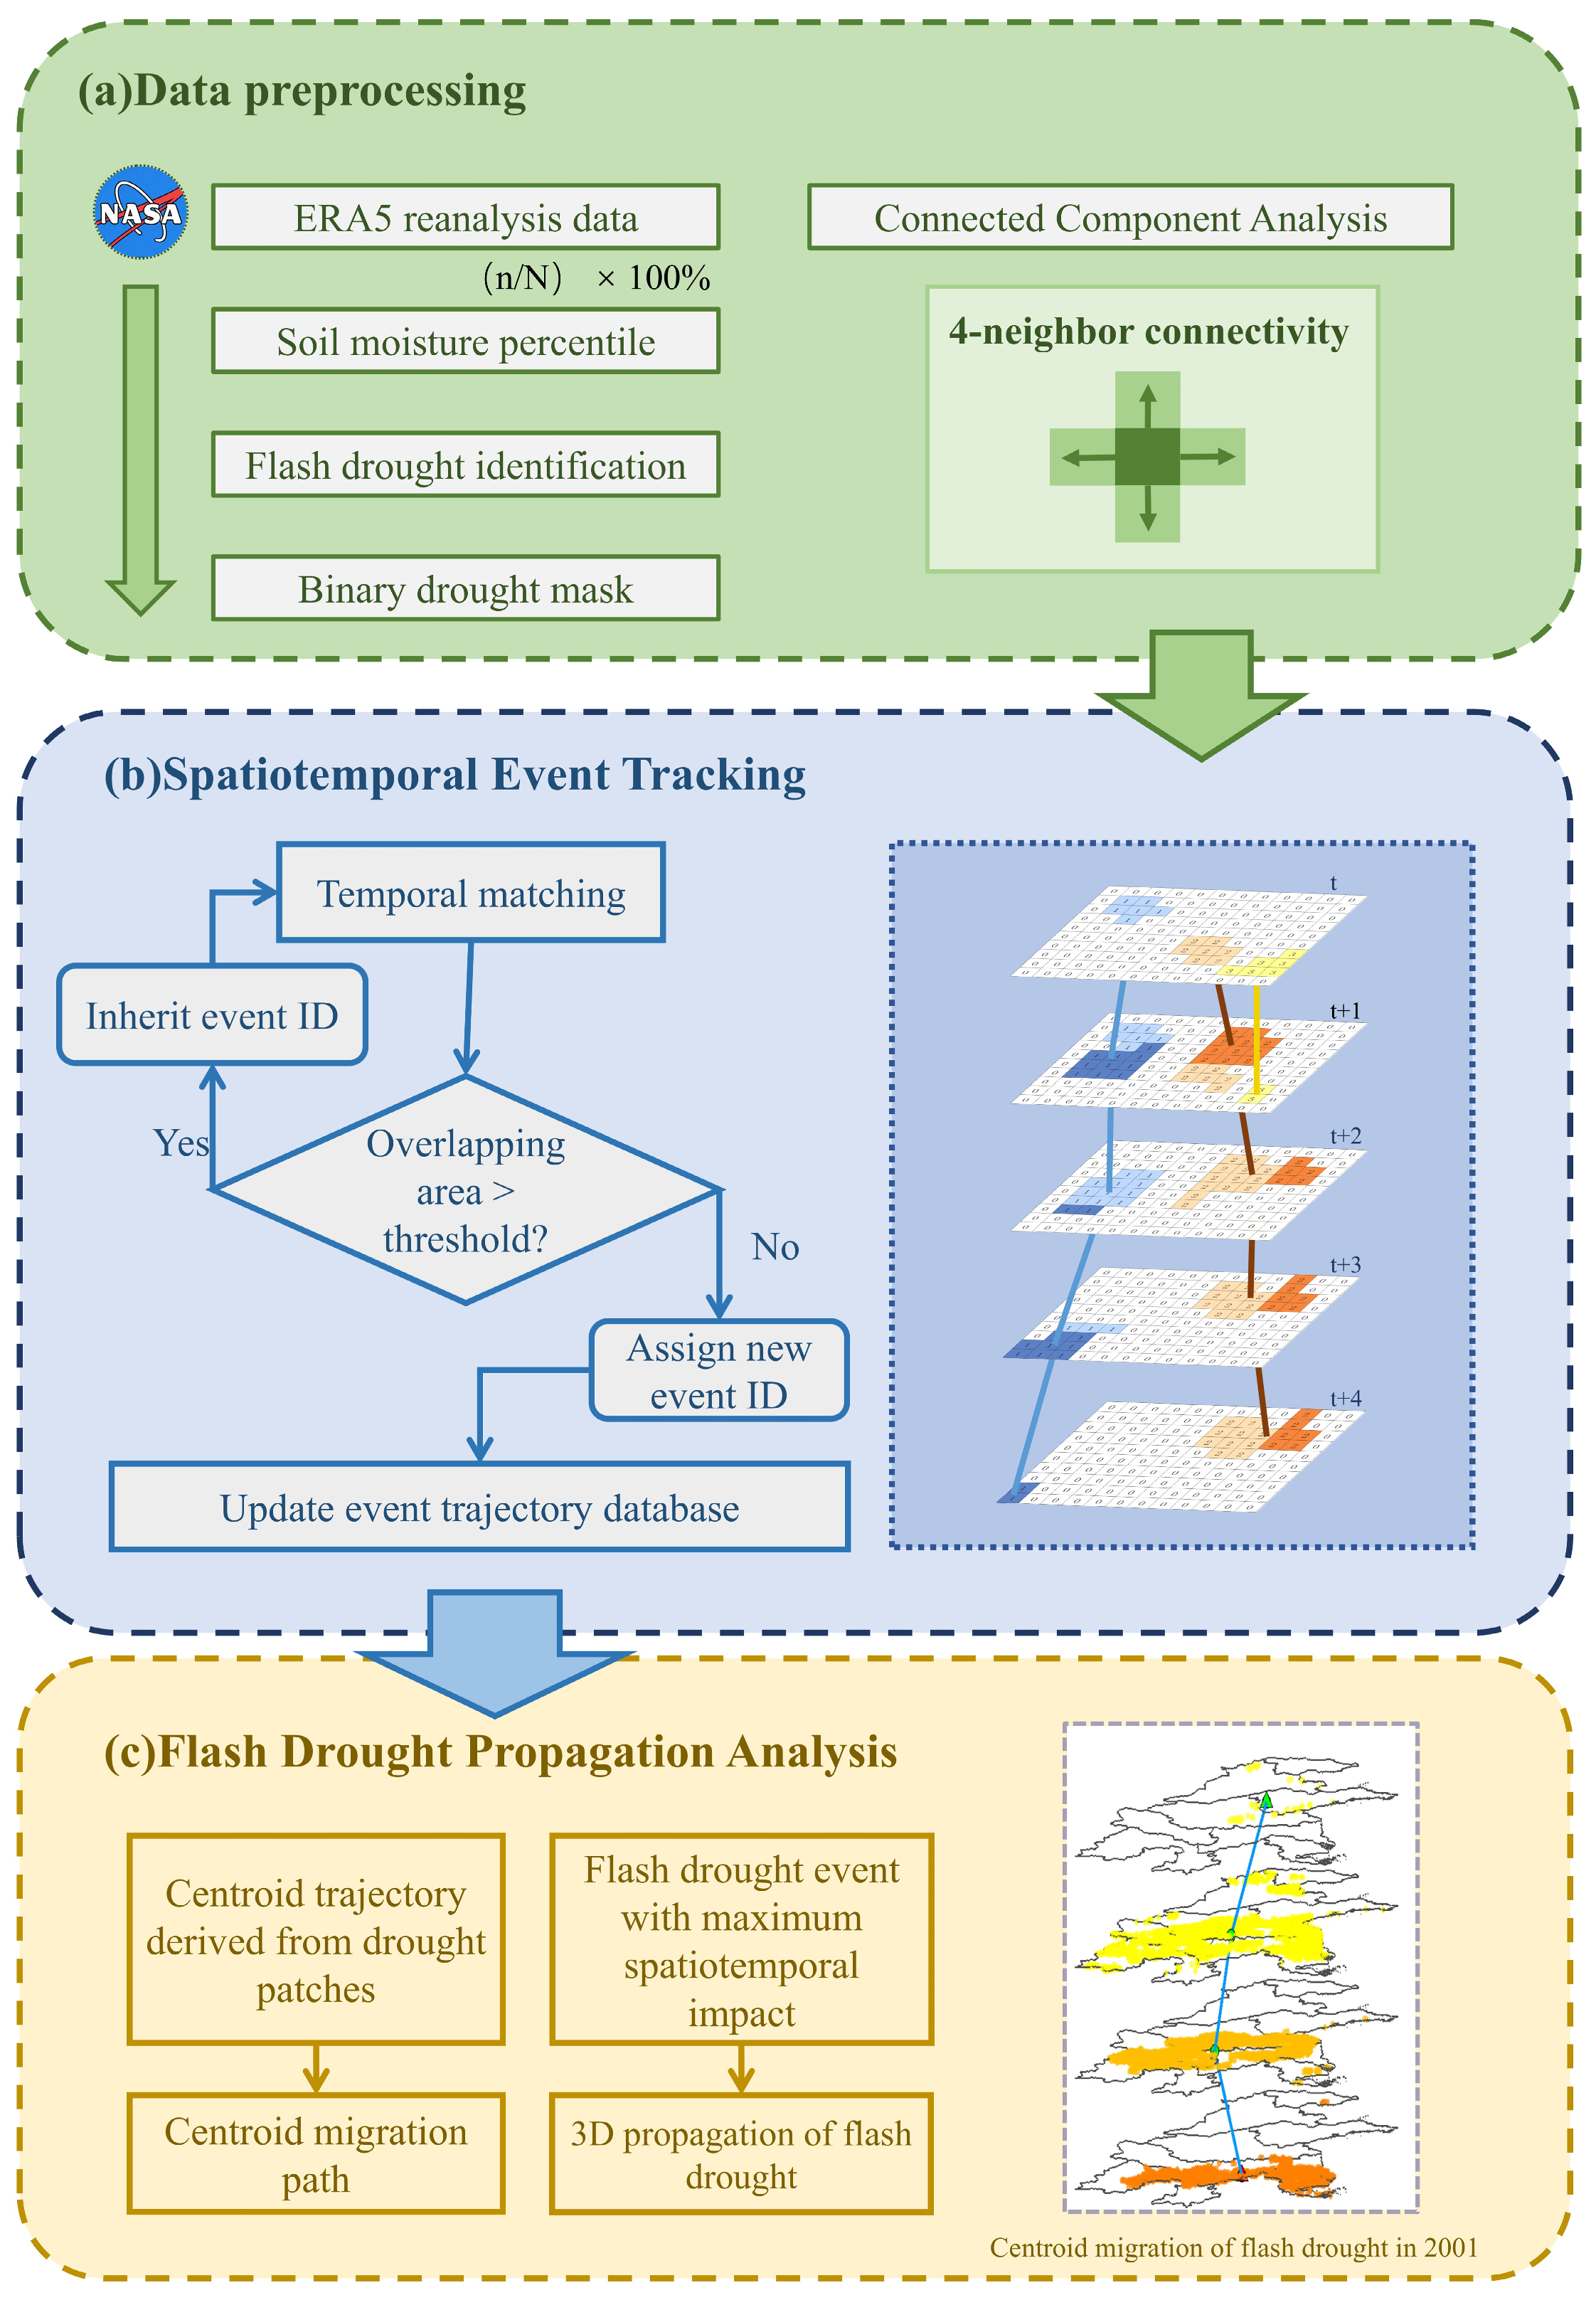
The analytical workflow for spatiotemporal trajectory analysis is illustrated in Figure 3. First, RZSM percentiles were computed from ERA5 reanalysis data to identify flash drought events at the grid scale. Spatially contiguous drought patches were then extracted by connected-component analysis, and a temporal matching algorithm linked discrete patches into continuous spatiotemporal events, building a flash drought trajectory database. On this basis, the centroid migration paths and three-dimensional propagation characteristics of flash droughts were analyzed [42]. The connected-component tracking identifies the spatiotemporal continuity of onset-phase drought patches—that is, grid cells actively undergoing rapid soil-moisture decline that meet the flash drought criteria. The resulting trajectory span represents the period over which flash drought activity migrates across the region, rather than the duration of any individual grid-cell event. Within a single trajectory, different grid cells may enter and exit flash drought status at different times—analogous to a storm track that persists for weeks while any given location experiences the storm for only part of that period. A composite flash drought intensity index was constructed by integrating drought frequency, duration, and intensity. Based on the composite intensity index, this study selected the two largest typical flash drought events across the two years, analyzed their spatial displacement distances and propagation characteristics, and derived the spatial pattern of drought propagation timing.

2.3.4. Analysis of Vegetation Photosynthetic Response and Recovery

This study used two remote-sensing vegetation productivity (VP) indicators, GPP and SIF, to characterize the dynamic response of ecosystems to flash droughts [23].
Although irrigation plays an important role in regulating crop water availability, vegetation stress, and recovery in intensively managed agricultural regions, it was not included as an independent predictor in this study. This was mainly due to the lack of consistent, long-term irrigation datasets with suitable spatial and temporal resolutions for large-scale, crop-specific analysis. Existing irrigation products are mainly derived from remote sensing observations, statistical records, or machine-learning approaches. However, substantial uncertainties remain in representing irrigation timing, intensity, and field-scale water management, particularly when aggregated to the 0.1° spatial and 8-day temporal resolutions used in this study.
Furthermore, this study aimed to characterize the integrated response of agricultural ecosystems to flash droughts using satellite-derived photosynthetic indicators (GOSIF and GOSIF-GPP), rather than to quantify drought impacts under specific irrigation scenarios or purely rainfed conditions. The estimated photosynthetic recovery characteristics therefore reflect the combined effects of climatic drought stress and contemporary agricultural management.
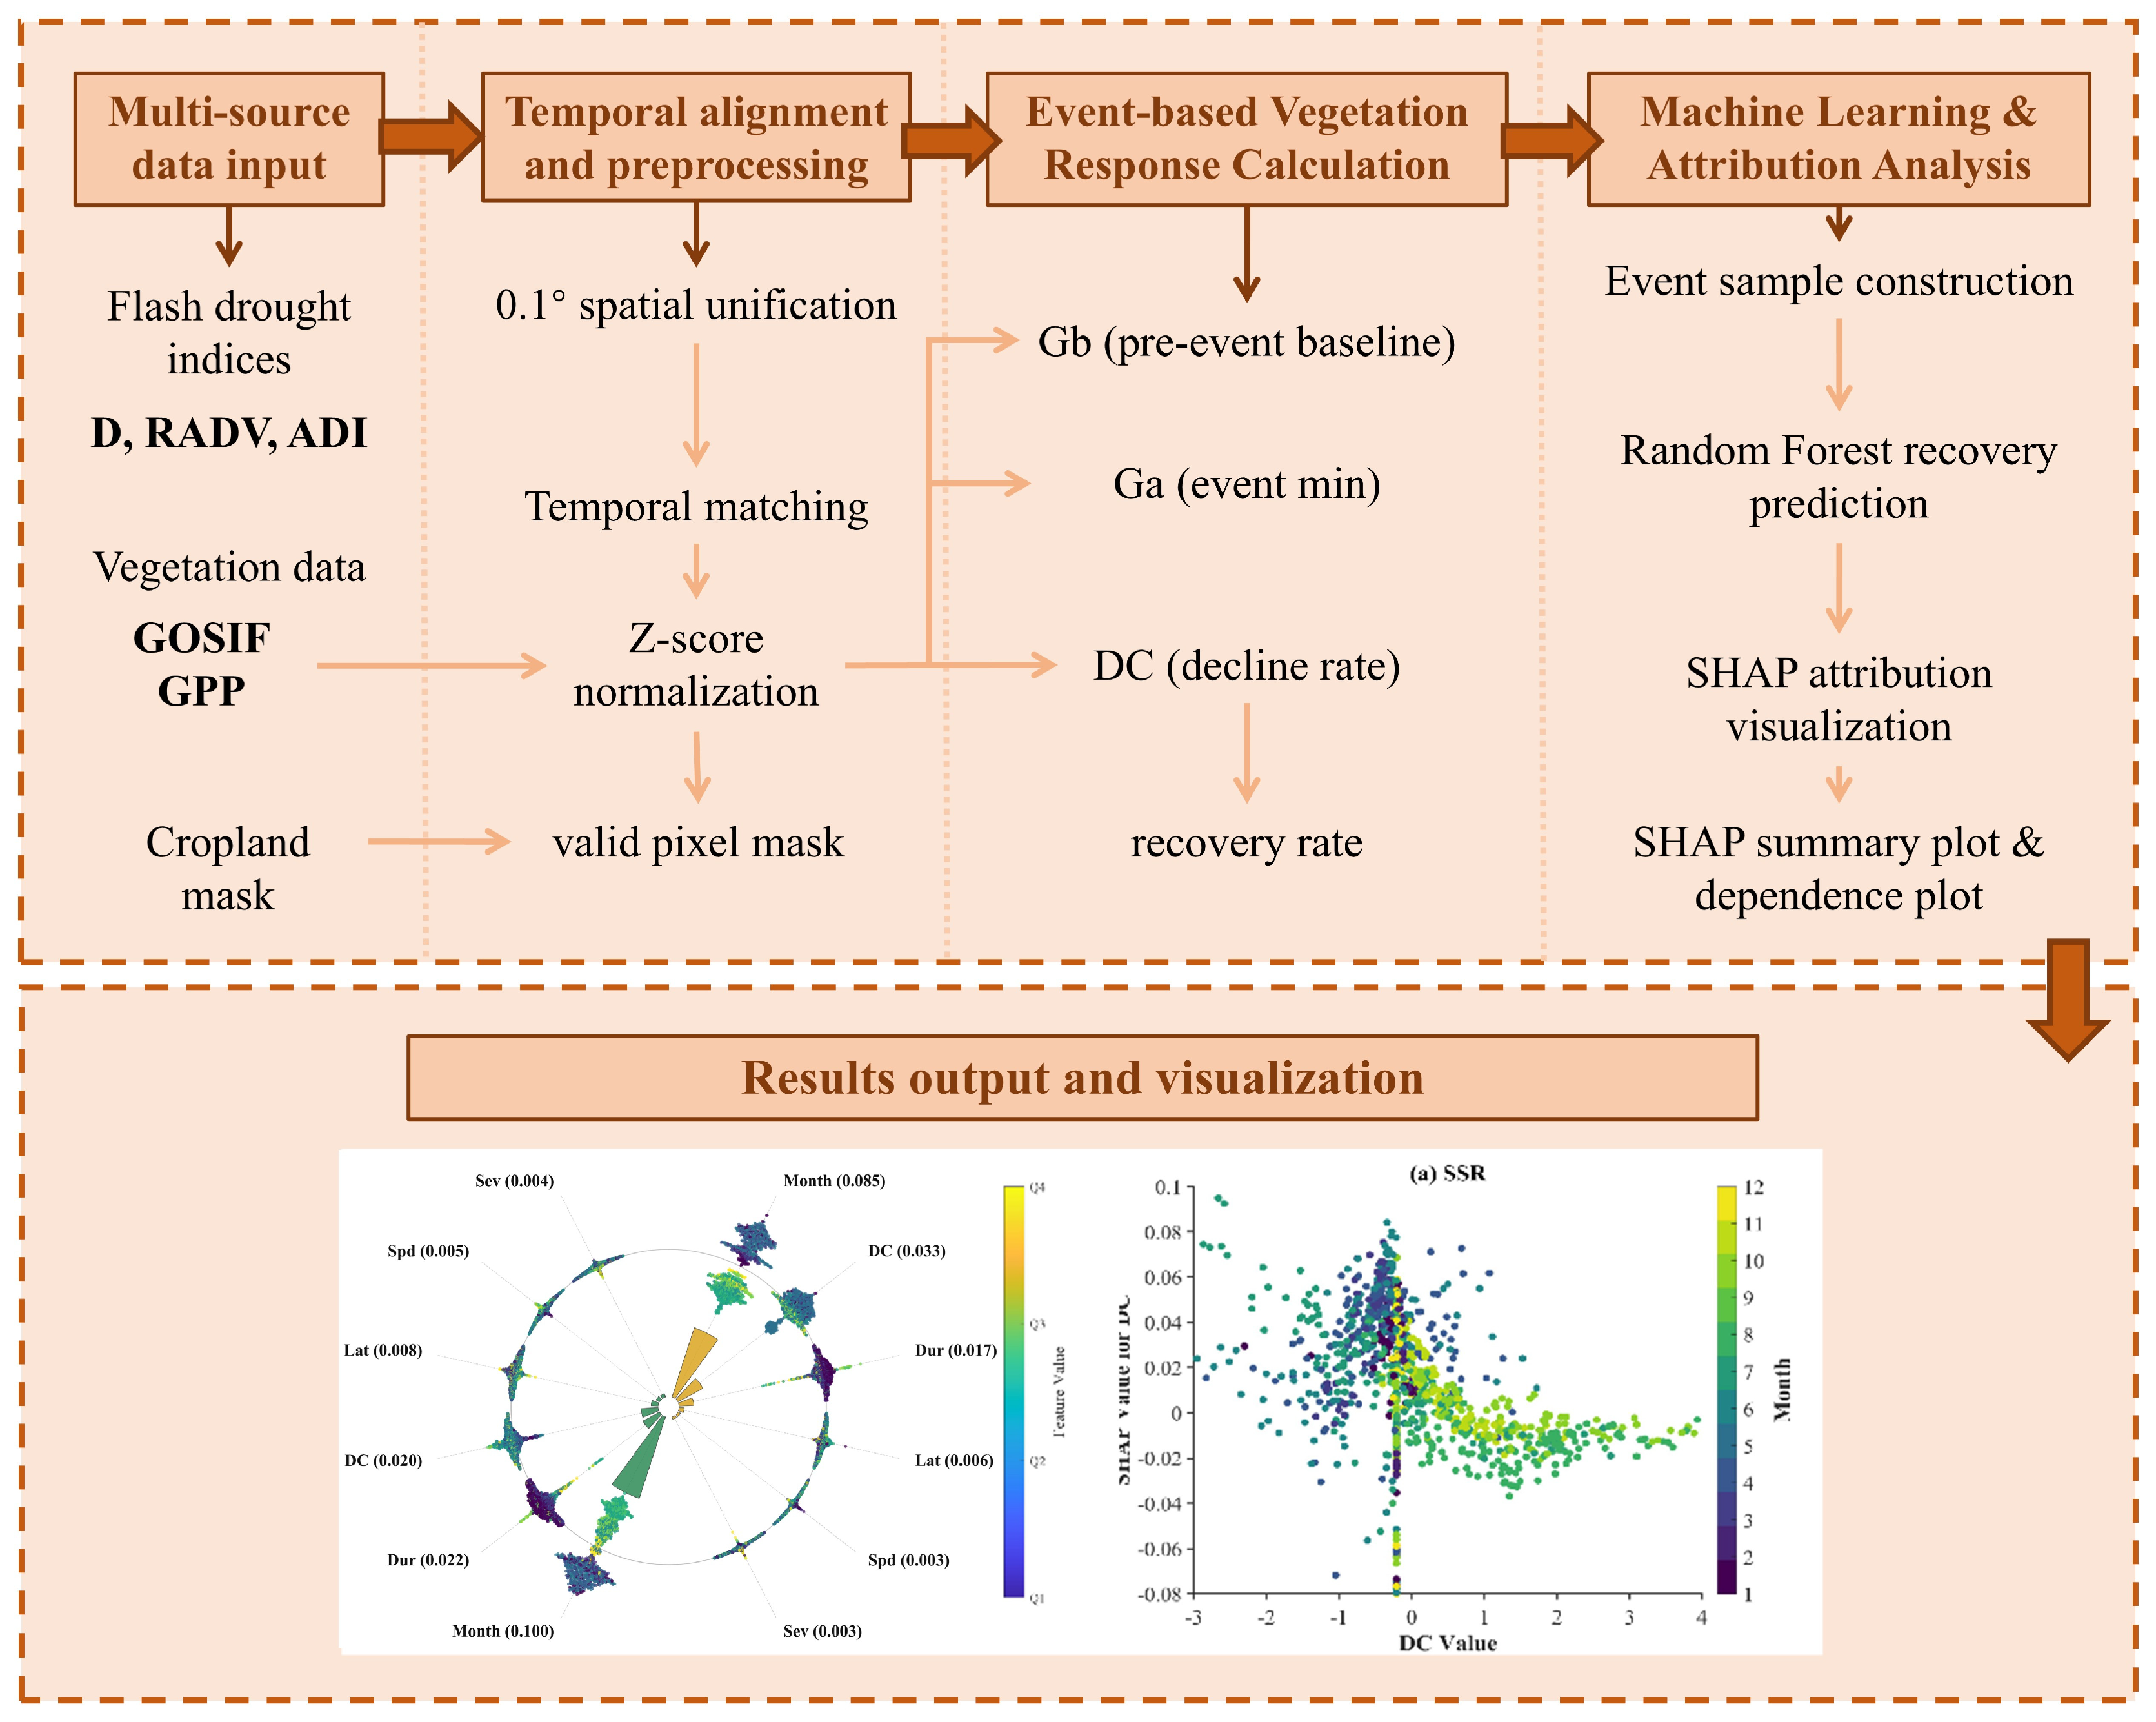
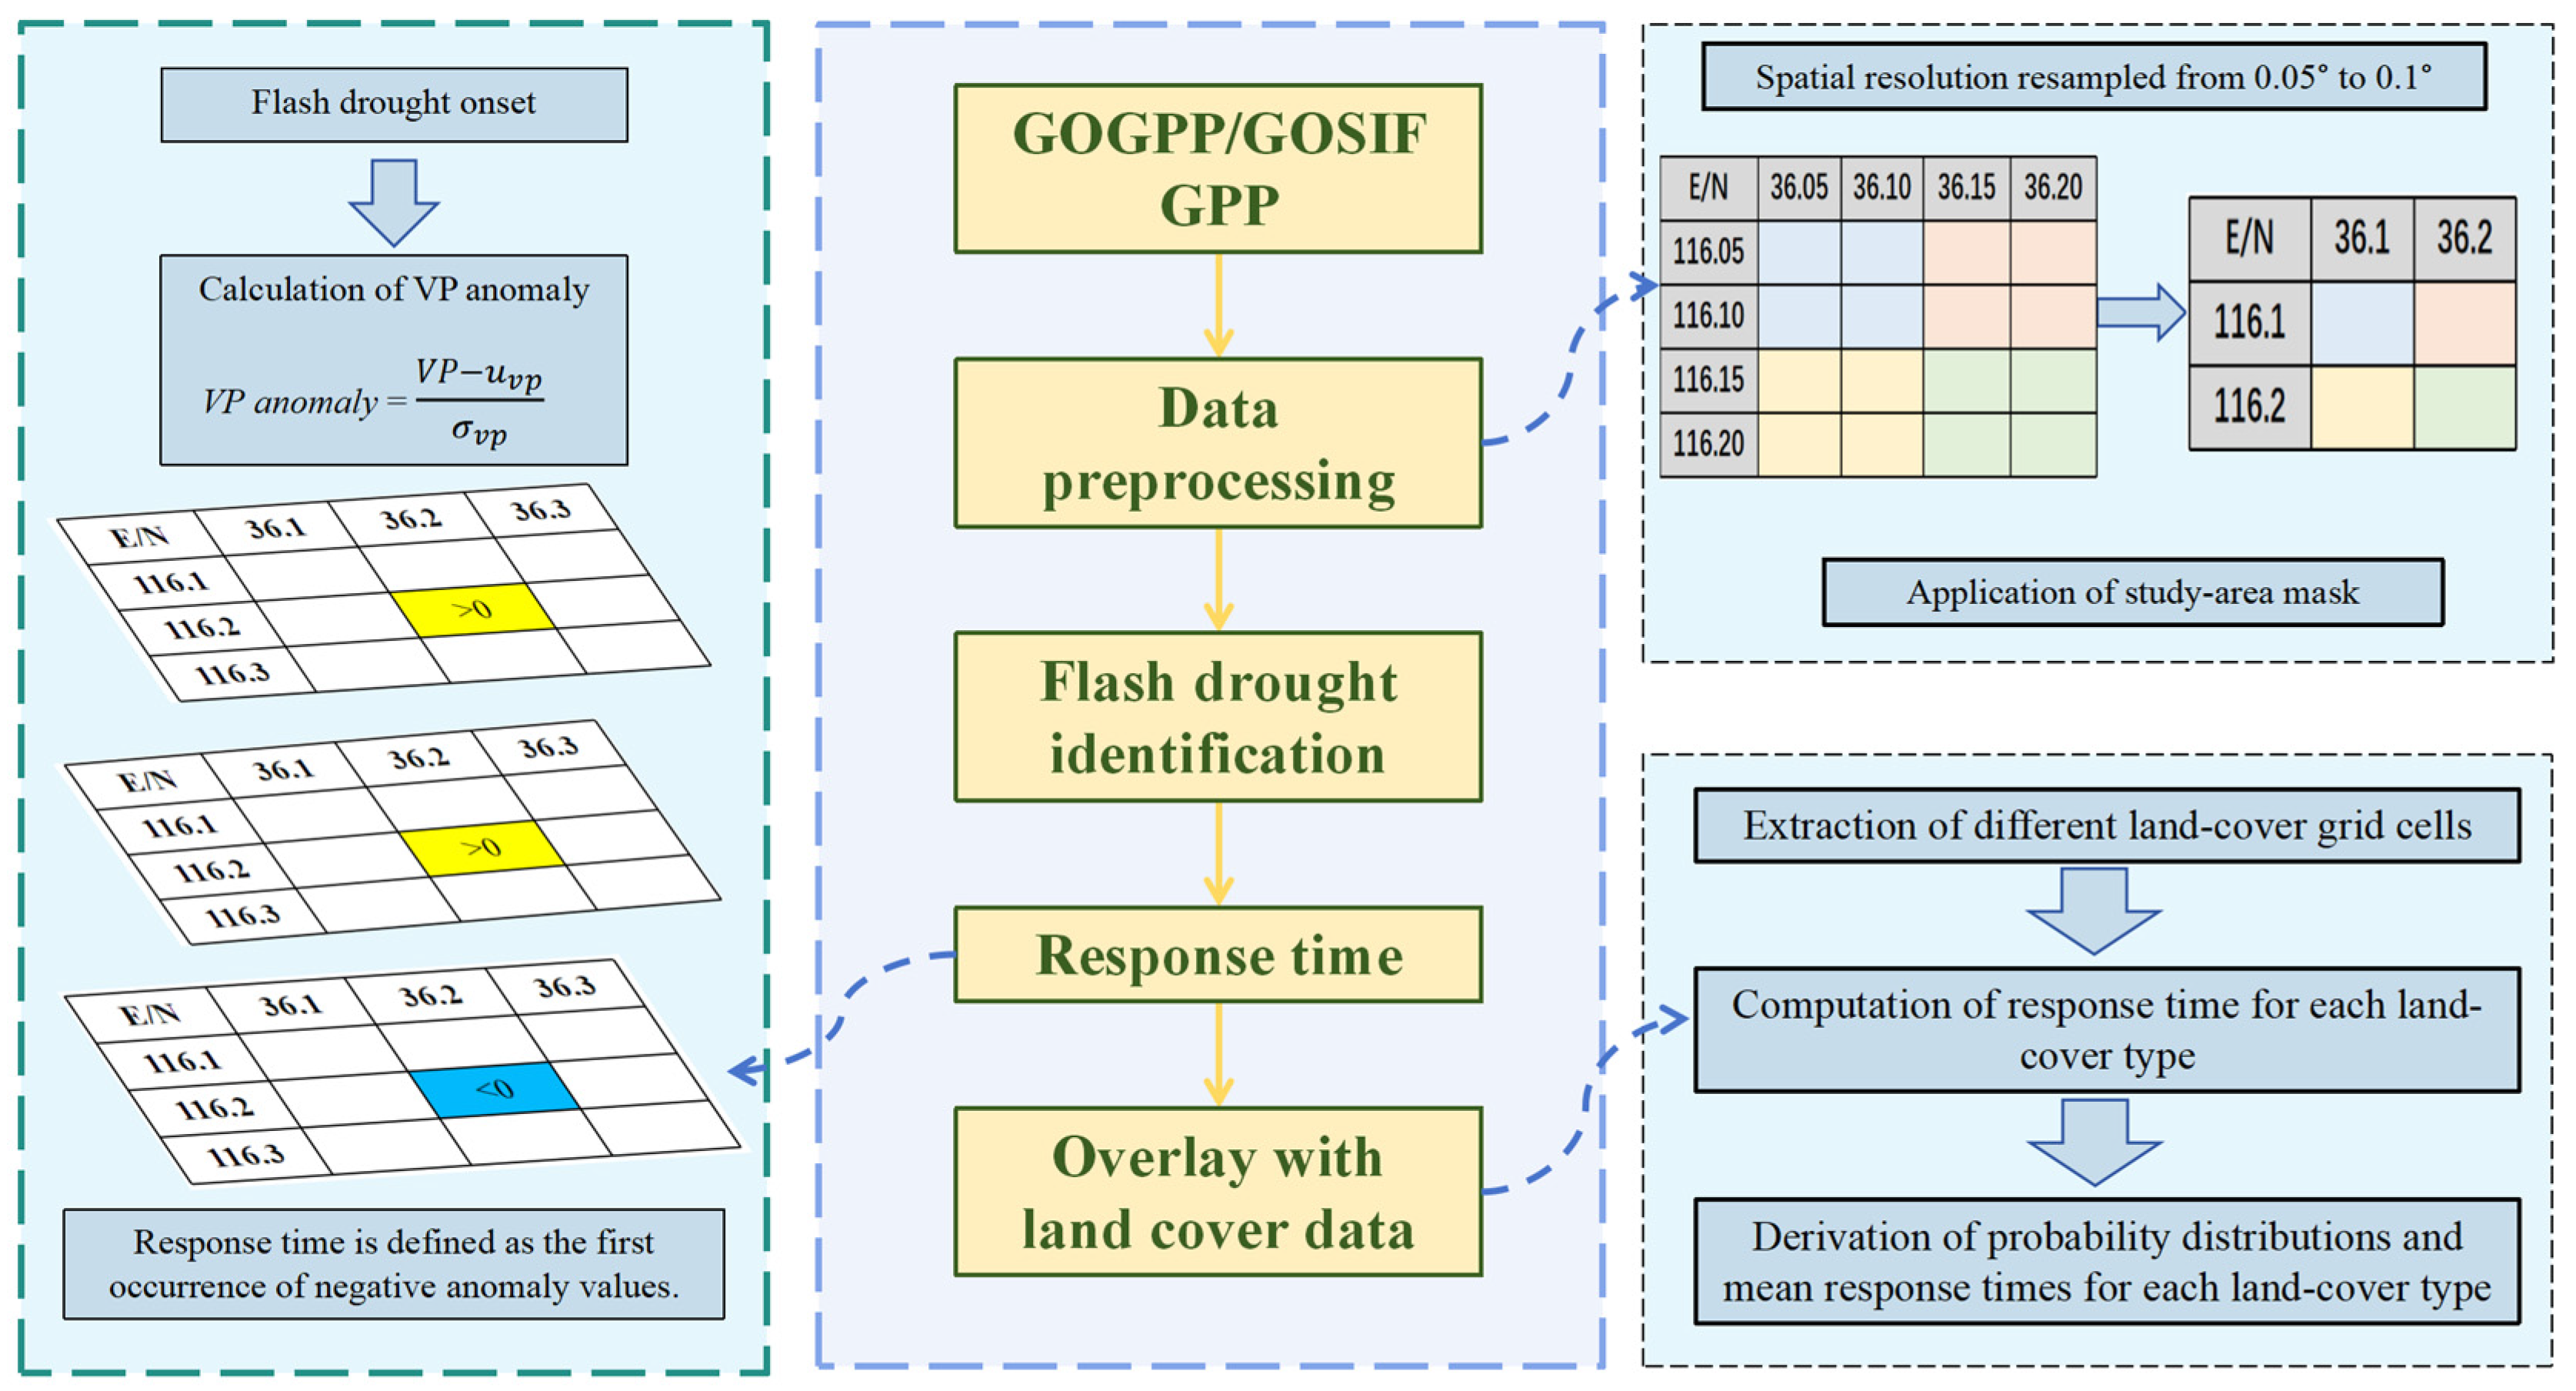
Detrended vegetation productivity indicators were used in the analysis (Figure 4). The response time is defined as the interval from flash drought onset to the first negative anomaly in vegetation productivity.
The recovery rate of vegetation productivity following a flash drought is defined as follows:
V P a n o m a l y = V P μ V P σ V P
where VP represents either GPP or SIF, and μ V P and σ V P denote the mean and standard deviation of the VP time series, respectively.
d e c r e a s e r a t e = G b ¯ G a t 1
where G a is the minimum negative V P a n o m a l y after a flash drought, G b ¯ is the average of positive values in the three pentads before a flash drought, and t 1 is the time length between G b ¯   and G a .
r e c o v e r y r a t e = G e G a t 2
where G e is the first positive V P a n o m a l y value occurring after G a , and t 2 is the time interval between G e and G a .

2.3.5. Random Forest and SHAP Interpretation Method

A Random Forest (RF) model was used to identify the key factors driving photosynthetic recovery rate (Figure 5). Six predictor variables were used: development rate (DC), duration (Dur), development speed (Spd), severity (Sev), latitude (Lat), and month of occurrence (Month). The Z-score-standardized photosynthetic recovery rate, computed separately from GPP and SIF, served as the target variable. All features were standardized by Z-score normalization before model training. The dataset was randomly partitioned into 80% training and 20% testing subsets (random_state = 42) to ensure reproducibility. The RF model was configured with n_estimators = 300, with all other hyperparameters set to scikit-learn defaults (max_depth = None, min_samples_split = 2, min_samples_leaf = 1, max_features = 1.0, bootstrap = True). To verify that this default configuration was appropriate, we further performed hyperparameter tuning with RandomizedSearchCV (5-fold cross-validation, 50 iterations), searching over different values of n_estimators [100, 200, 300, 500], max_depth [10, 20, 30, None], min_samples_split [2, 5, 10], min_samples_leaf [1, 2, 4], and max_features [‘sqrt’, ‘log2’, 1.0], using R2 as the scoring metric. The RF model offers robust nonlinear fitting and resistance to overfitting in ecological attribution analysis, and has been successfully applied to identify global flash drought trend drivers, effectively quantifying the contributions of complex multi-factor interactions [43].
SHAP (Shapley Additive Explanations) values were used to quantify the average marginal contribution of each variable to the recovery rate and to rank their global importance. SHAP provides consistency and local interpretability, effectively addressing the “black-box” limitations of conventional machine-learning models [44]. It has been successfully applied to disentangle the driving mechanisms of vegetation ecological processes and can reveal the dominant controls on ecosystem recovery capacity across regions. For instance, in China’s eastern monsoon region, SHAP analysis has confirmed that flash drought duration contributes 20–30% more to cropland photosynthetic recovery rate than temperature does [45].

3. Results

3.1. Overall Characteristics of Flash Droughts Across the North China Plain and the Middle-Lower Yangtze Plain

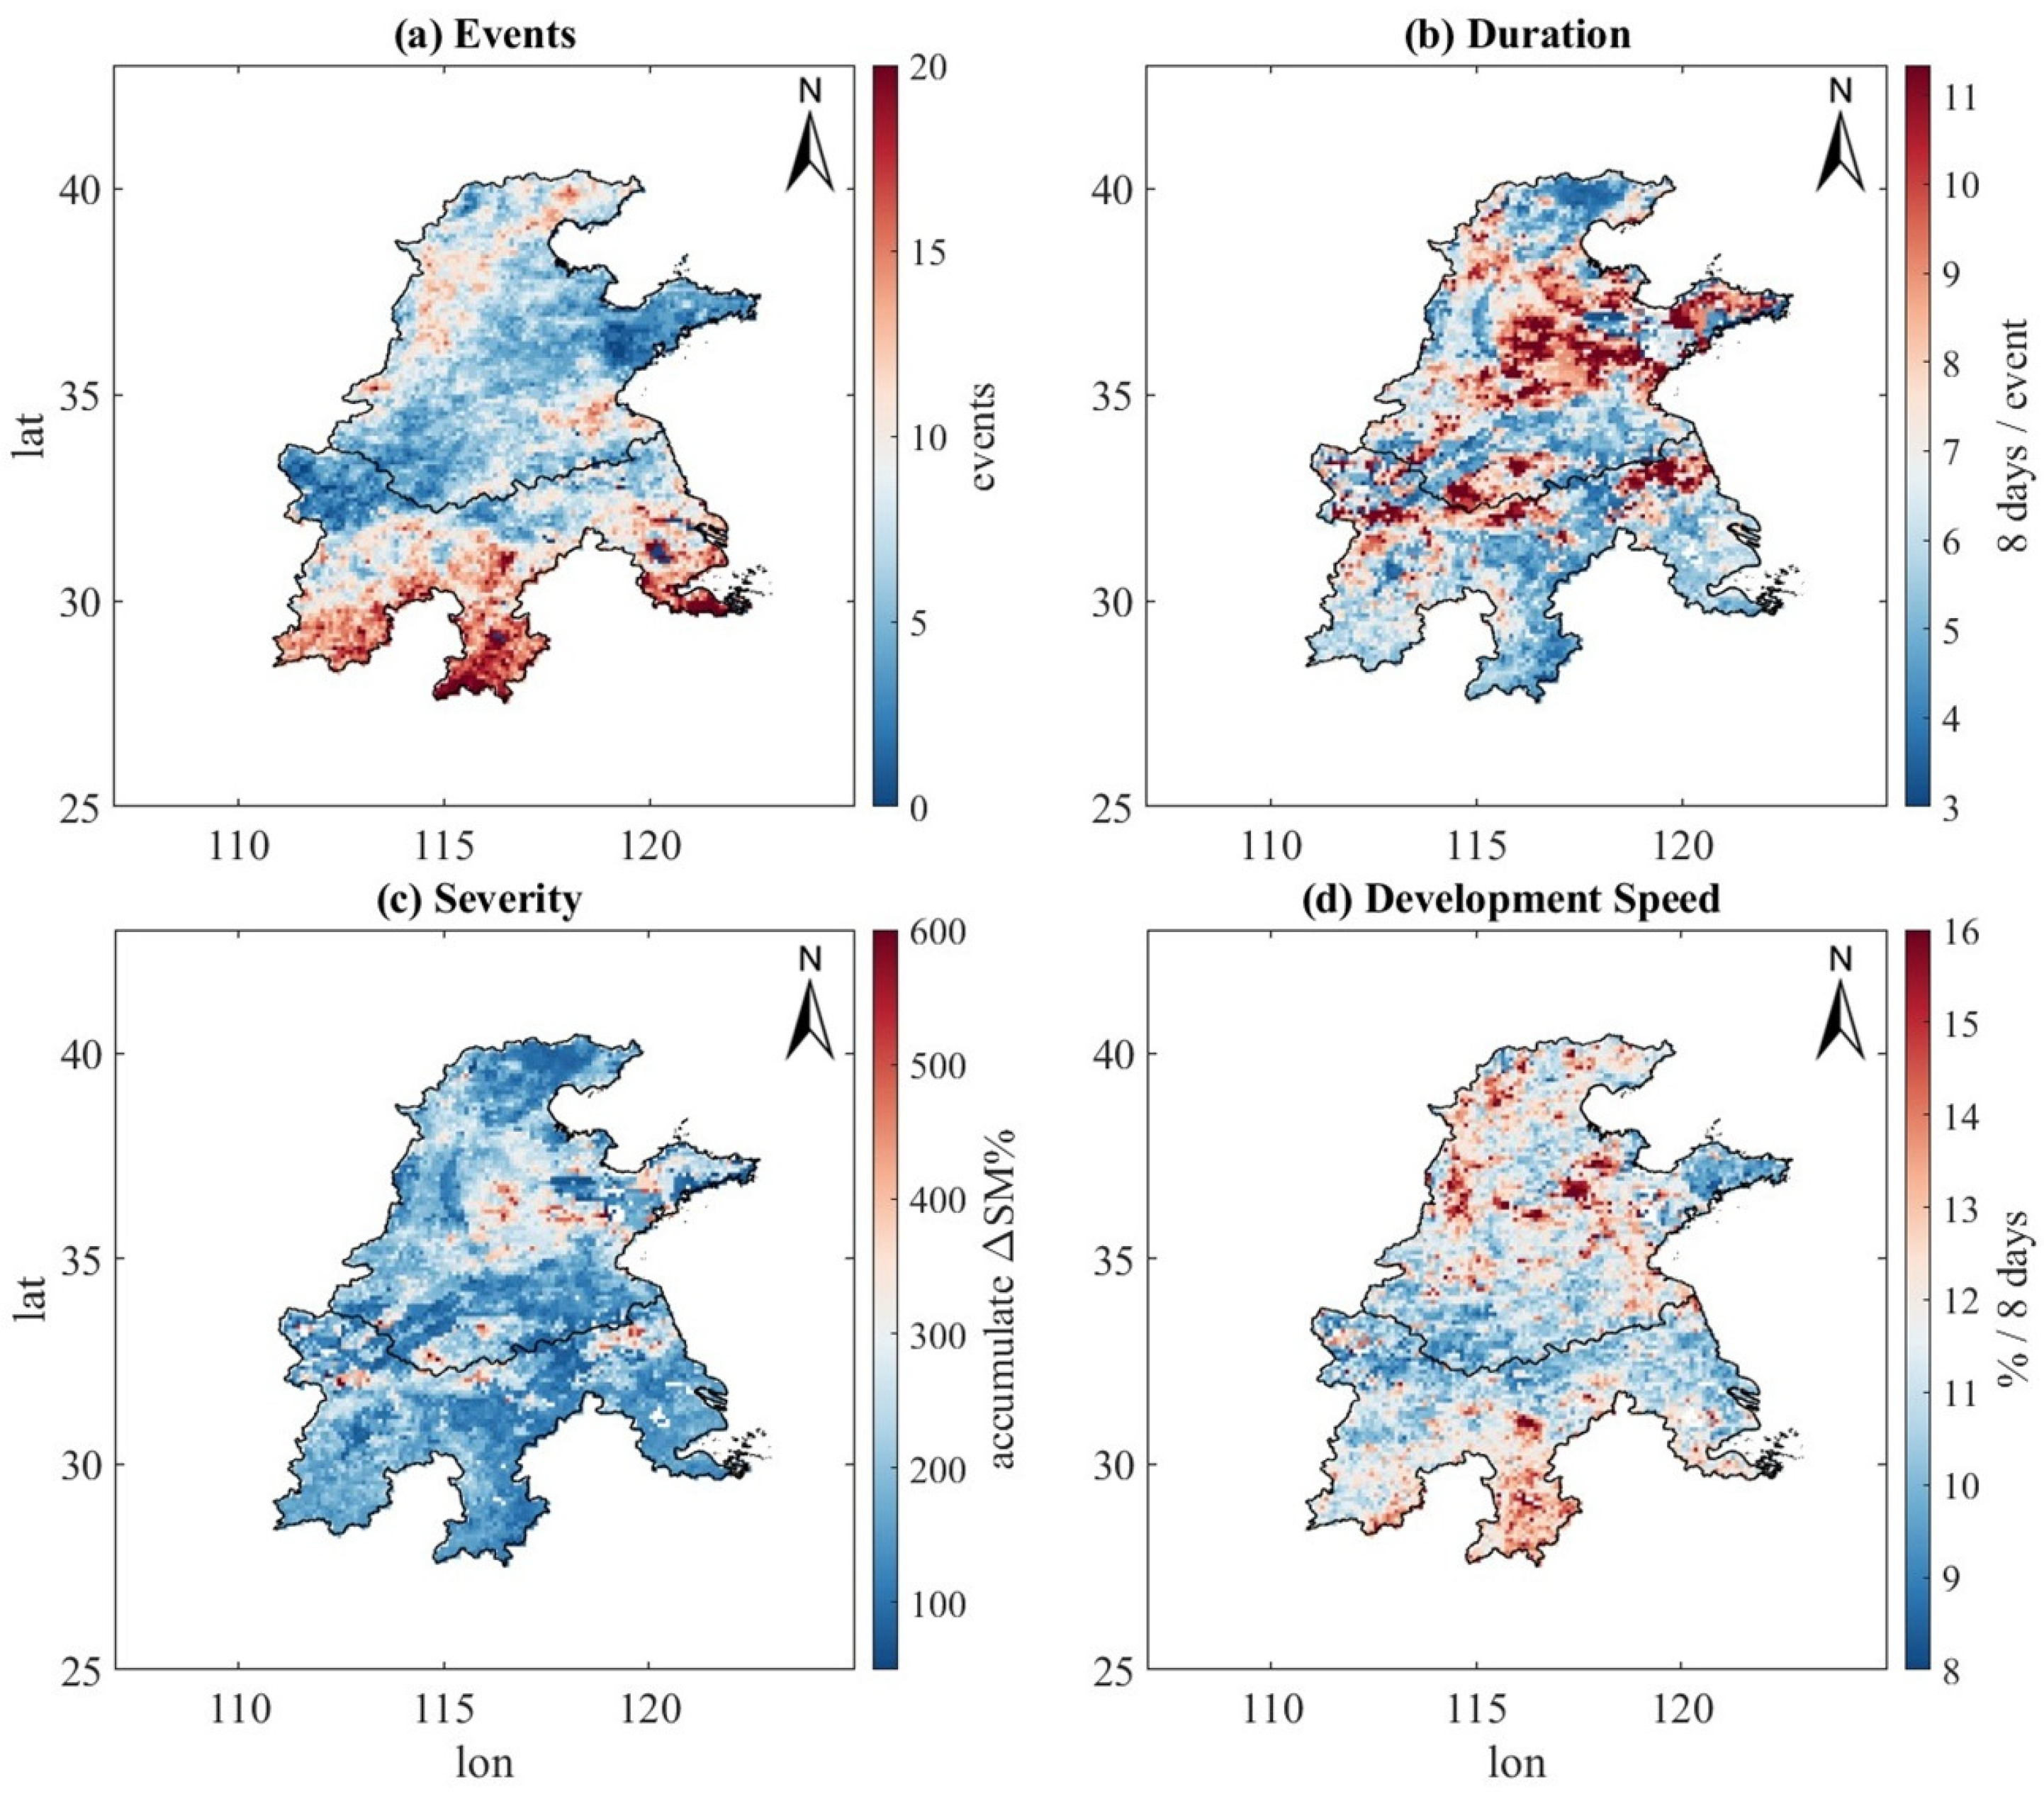
Figure 6 shows the spatial distribution of flash drought characteristics across the two plains. In terms of total event counts, high-incidence zones are concentrated in the southern Middle–Lower Yangtze Plain, where the cumulative number of flash drought events reached about 20 during 2001–2024 (Figure 6a). By contrast, the southern North China Plain and the northern Middle–Lower Yangtze Plain showed lower frequencies, with cumulative counts below 5. Figure 6b and Figure 6c present flash drought duration and intensity, respectively. The central North China Plain exhibited the longest mean duration, reaching ≥10 eight-day periods, together with the highest mean intensity (severity indices mostly around 300). In contrast, flash droughts in the southern Middle–Lower Yangtze Plain and the northern North China Plain were shorter (4–6 eight-day periods) and weaker (severity indices below 150). A pronounced north–south contrast was observed in flash drought development speed (Figure 6d). The fastest development rates occurred in the northern North China Plain and the southern Middle–Lower Yangtze Plain (14–16%/8 days), indicating that droughts there can escalate rapidly. Development rates in the southern North China Plain and the northern Middle–Lower Yangtze Plain were more moderate (8–10%/8 days).
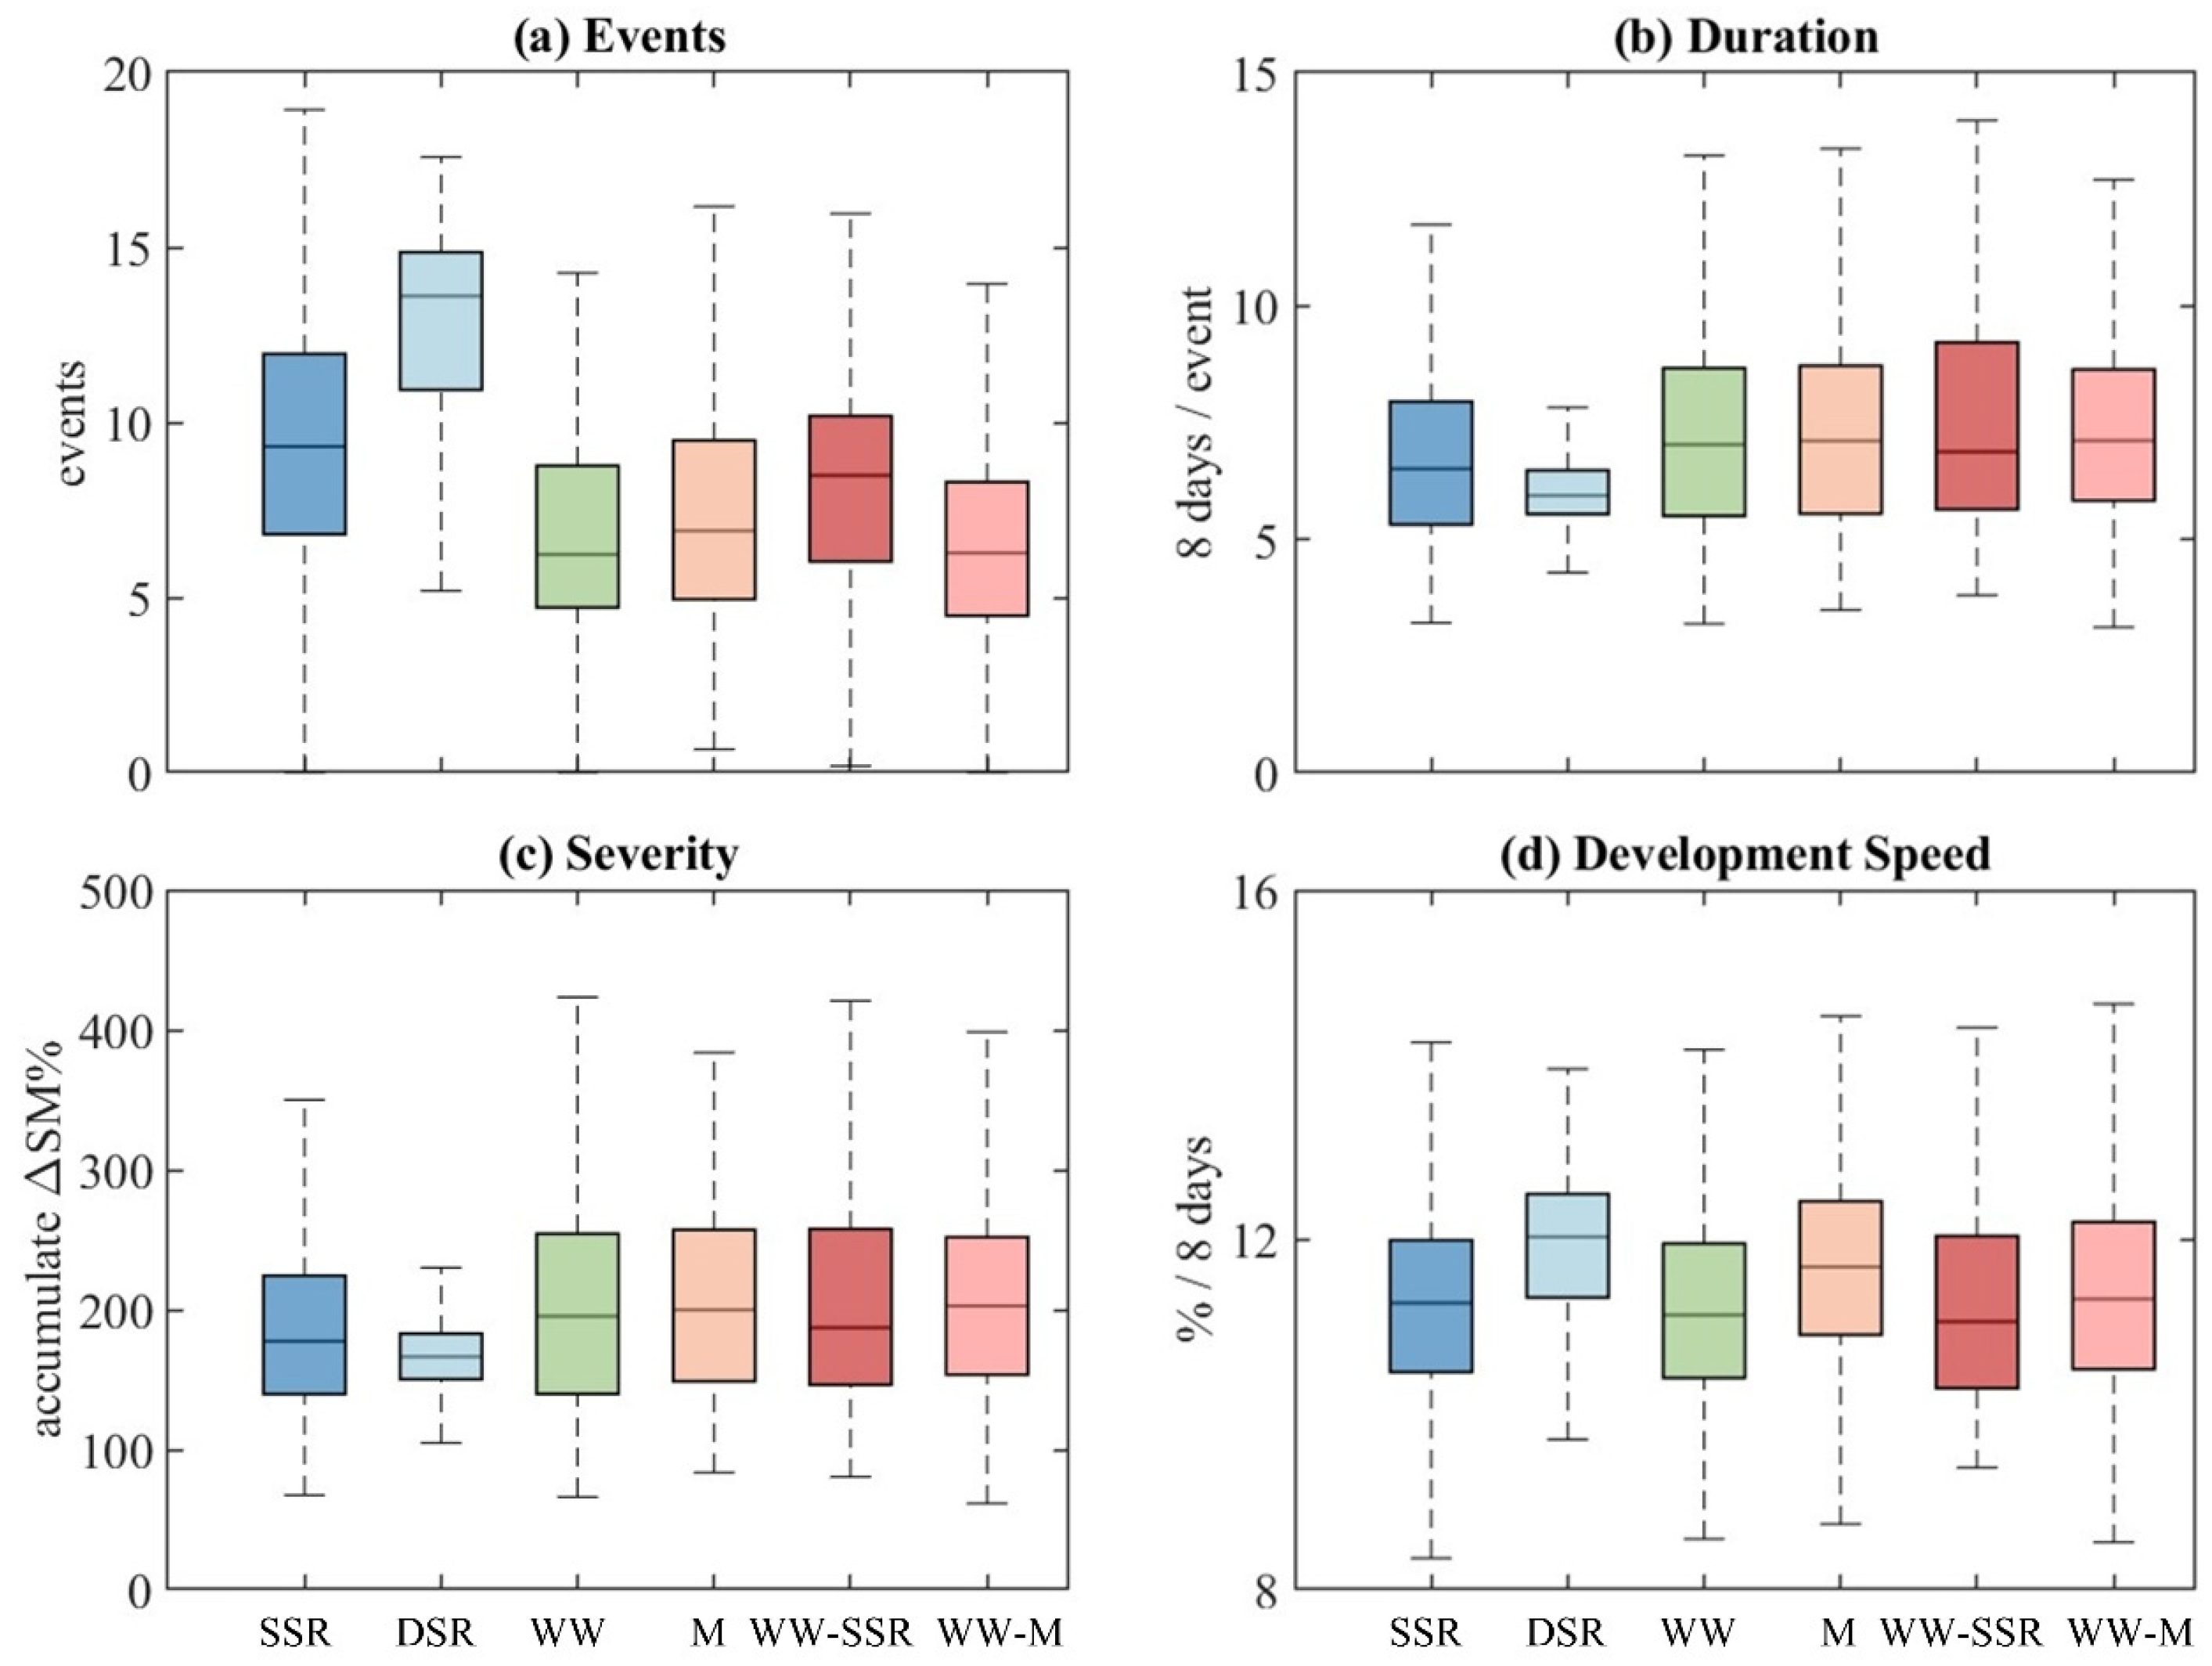
Marked differences were identified in the flash drought risk structure across cropping systems (Figure 7). For rice systems (SSR/DSR), the frequency of flash drought encounters was the highest, whereas duration and severity were relatively low. This indicates that rice systems experience flash droughts more frequently during their growing cycles, yet individual events and cumulative deficits remain relatively limited—constituting a “high-frequency shock” type of risk. By contrast, rainfed systems (WW/M) encountered flash droughts less frequently but with notably higher severity and duration. This suggests that, once a flash drought occurs, rainfed crops undergo more prolonged and intense soil-moisture depletion, with a more concentrated risk of yield loss—an “intensity-cumulative” type of risk. The risk profile of rotation systems (WW–SSR/WW–M) resembled that of rainfed systems—lower event counts but higher severity and duration—indicating that rotation systems are likewise sensitive to the cumulative effects of flash droughts. Notably, development rates across all cropping systems were uniformly high (generally 10–12%/8 days), indicating that “rapid intensification” is a shared core characteristic. However, differences in frequency and intensity determine the type and consequences of the risk each crop experiences. Overall, rice systems face high-frequency shock risks, whereas rainfed and rotation systems face intensity-cumulative risks. This differentiation in risk structure has important implications for agricultural disaster mitigation strategies.

3.2. Spatiotemporal Trajectory Characteristics of Flash Droughts

The interannual evolution of flash droughts in the study area during 2001–2024 was further analyzed. The results (Figure S4) show that the composite flash drought intensity indices for 2019 and 2022 were markedly higher than those of other years, identifying these as the two most severe years, with the strongest intensity and most extensive spatial coverage during 2001–2024.
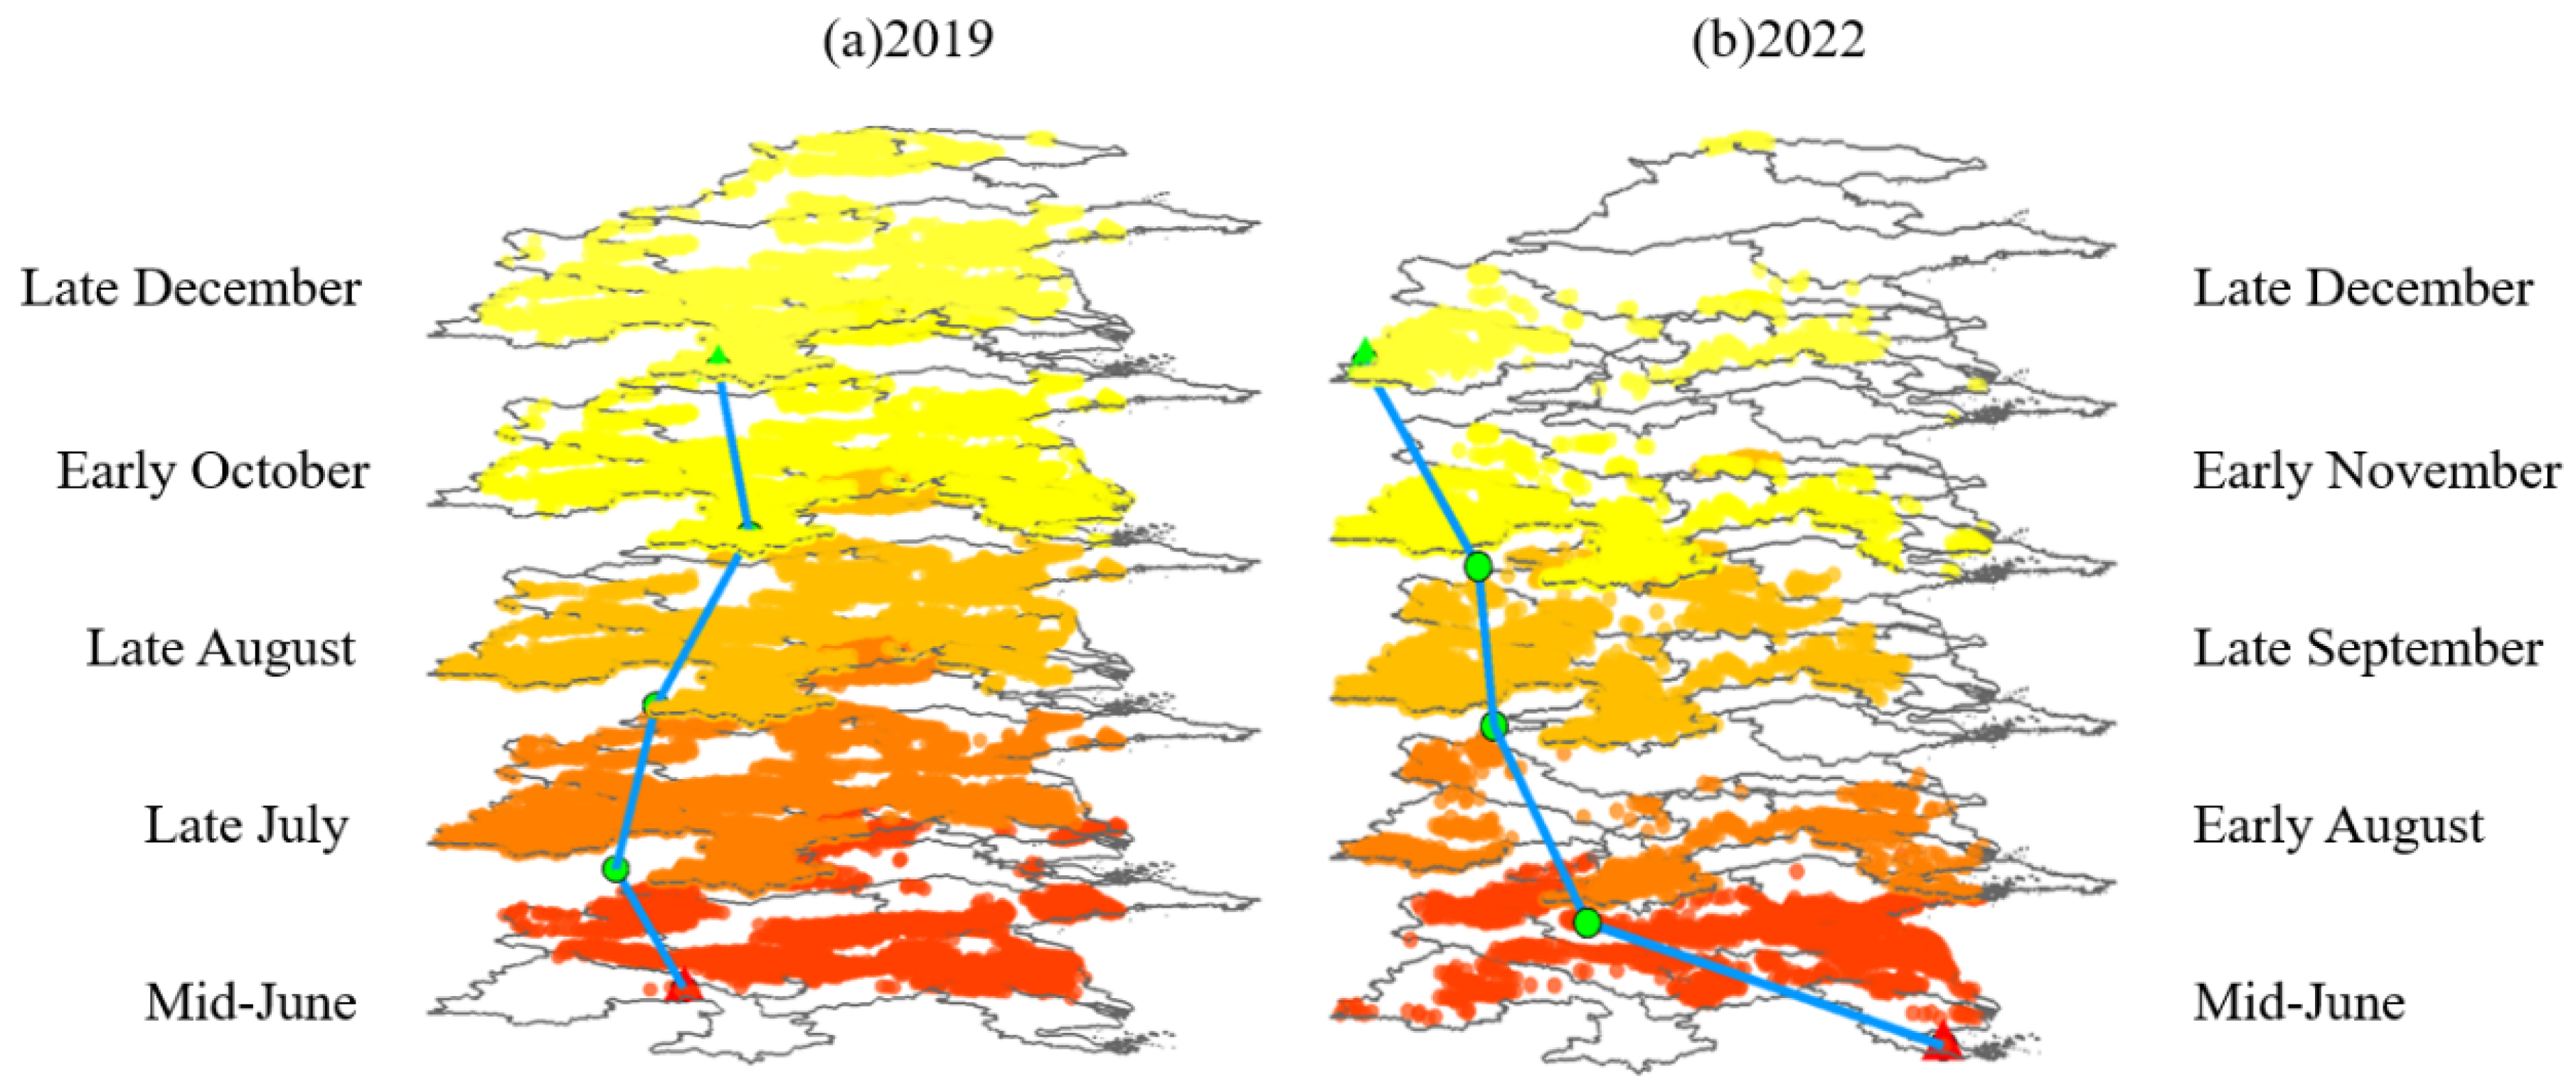
The flash drought centroids in 2019 (Figure 8a) and 2022 (Figure 8b) both exhibited pronounced migration, yet differed notably in the complexity of their paths and spatial evolution patterns. After initiating migration in mid-June 2019, the centroid followed a regular, coherent trajectory characterized by smooth transitions and low path sinuosity, reflecting strong spatial continuity and directional stability in that year’s flash drought development. The trajectory span from mid-June to late December reflects the period over which flash drought onset activity migrated sequentially across the North China Plain, rather than a single continuous event at any given location. Across all tracked trajectories, the median grid-level event duration was 24 days (3 eight-day periods), with 94.6% of trajectories lasting ≤40 days and a 95th percentile of 56 days. In sharp contrast, the 2022 centroid trajectory was considerably more complex, featuring multiple directional shifts and path reversals, large displacement amplitudes, and conspicuous episodic leaps. These features highlight the greater dynamism and instability of that year’s spatiotemporal evolution.

3.3. Response Patterns of Vegetation Photosynthetic Indicators (SIF/GPP) to Flash Droughts

3.3.1. Overall Differences in SIF and GPP Response Times to Flash Droughts

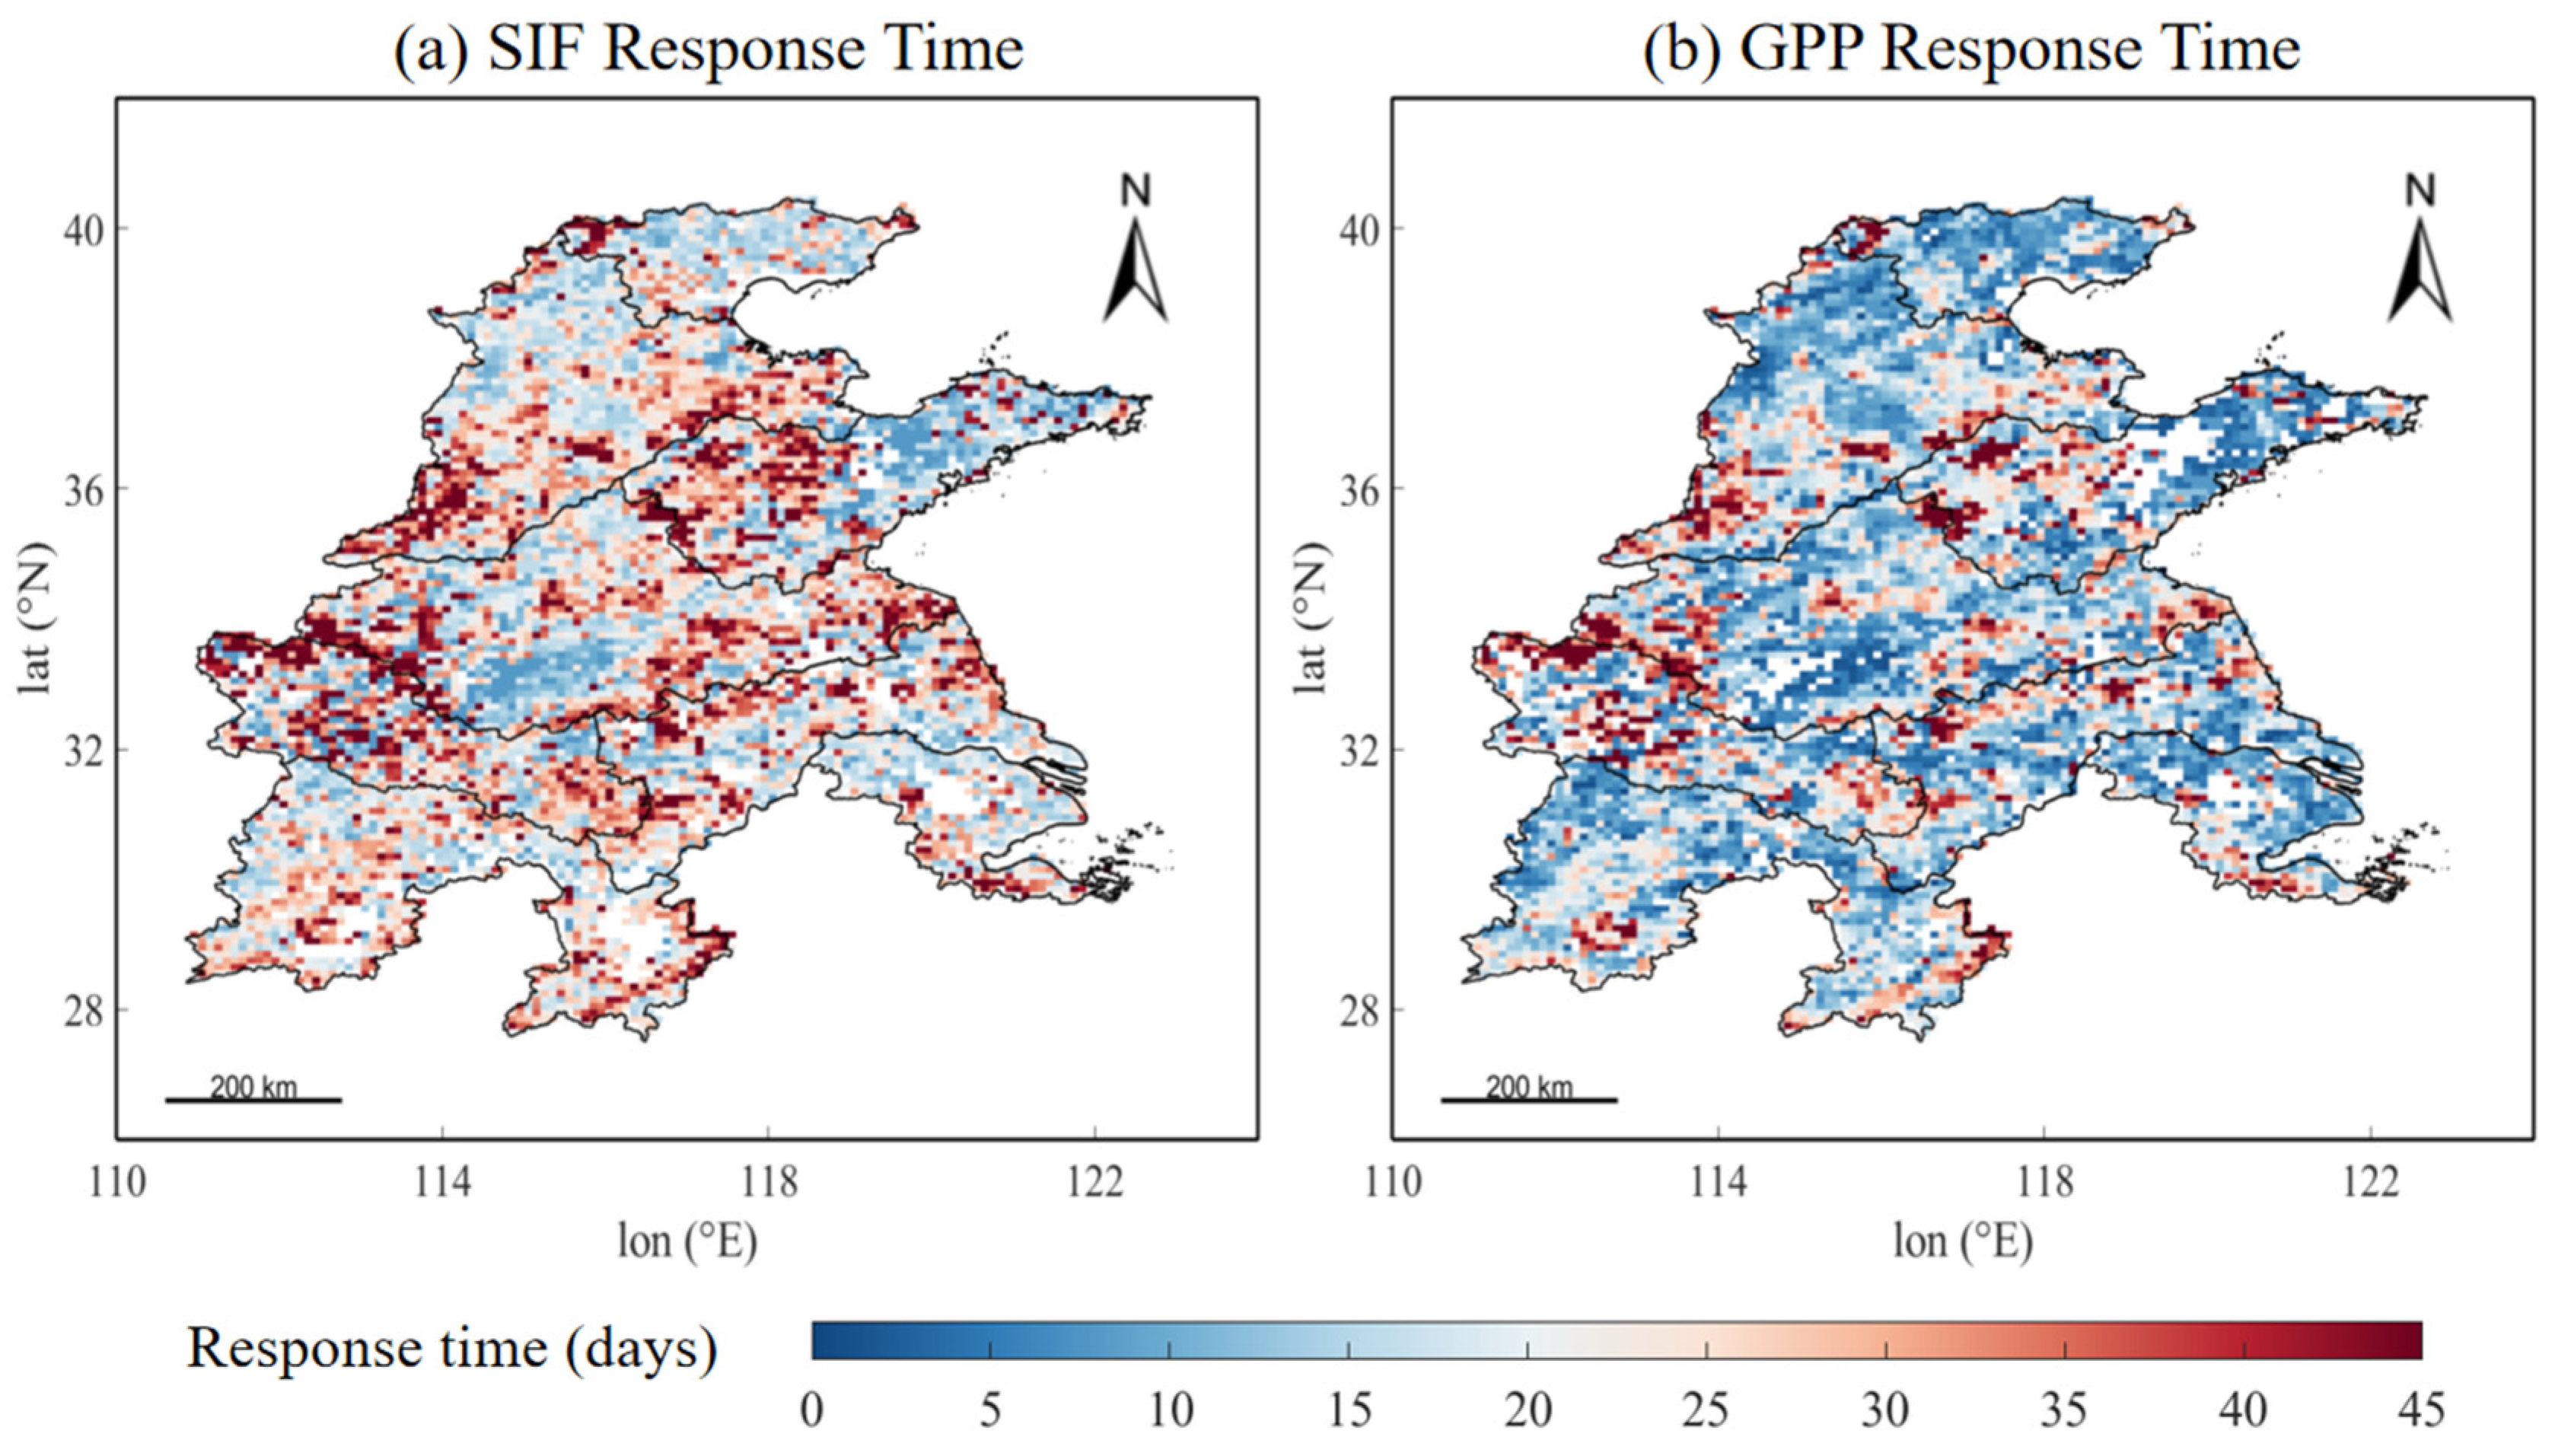
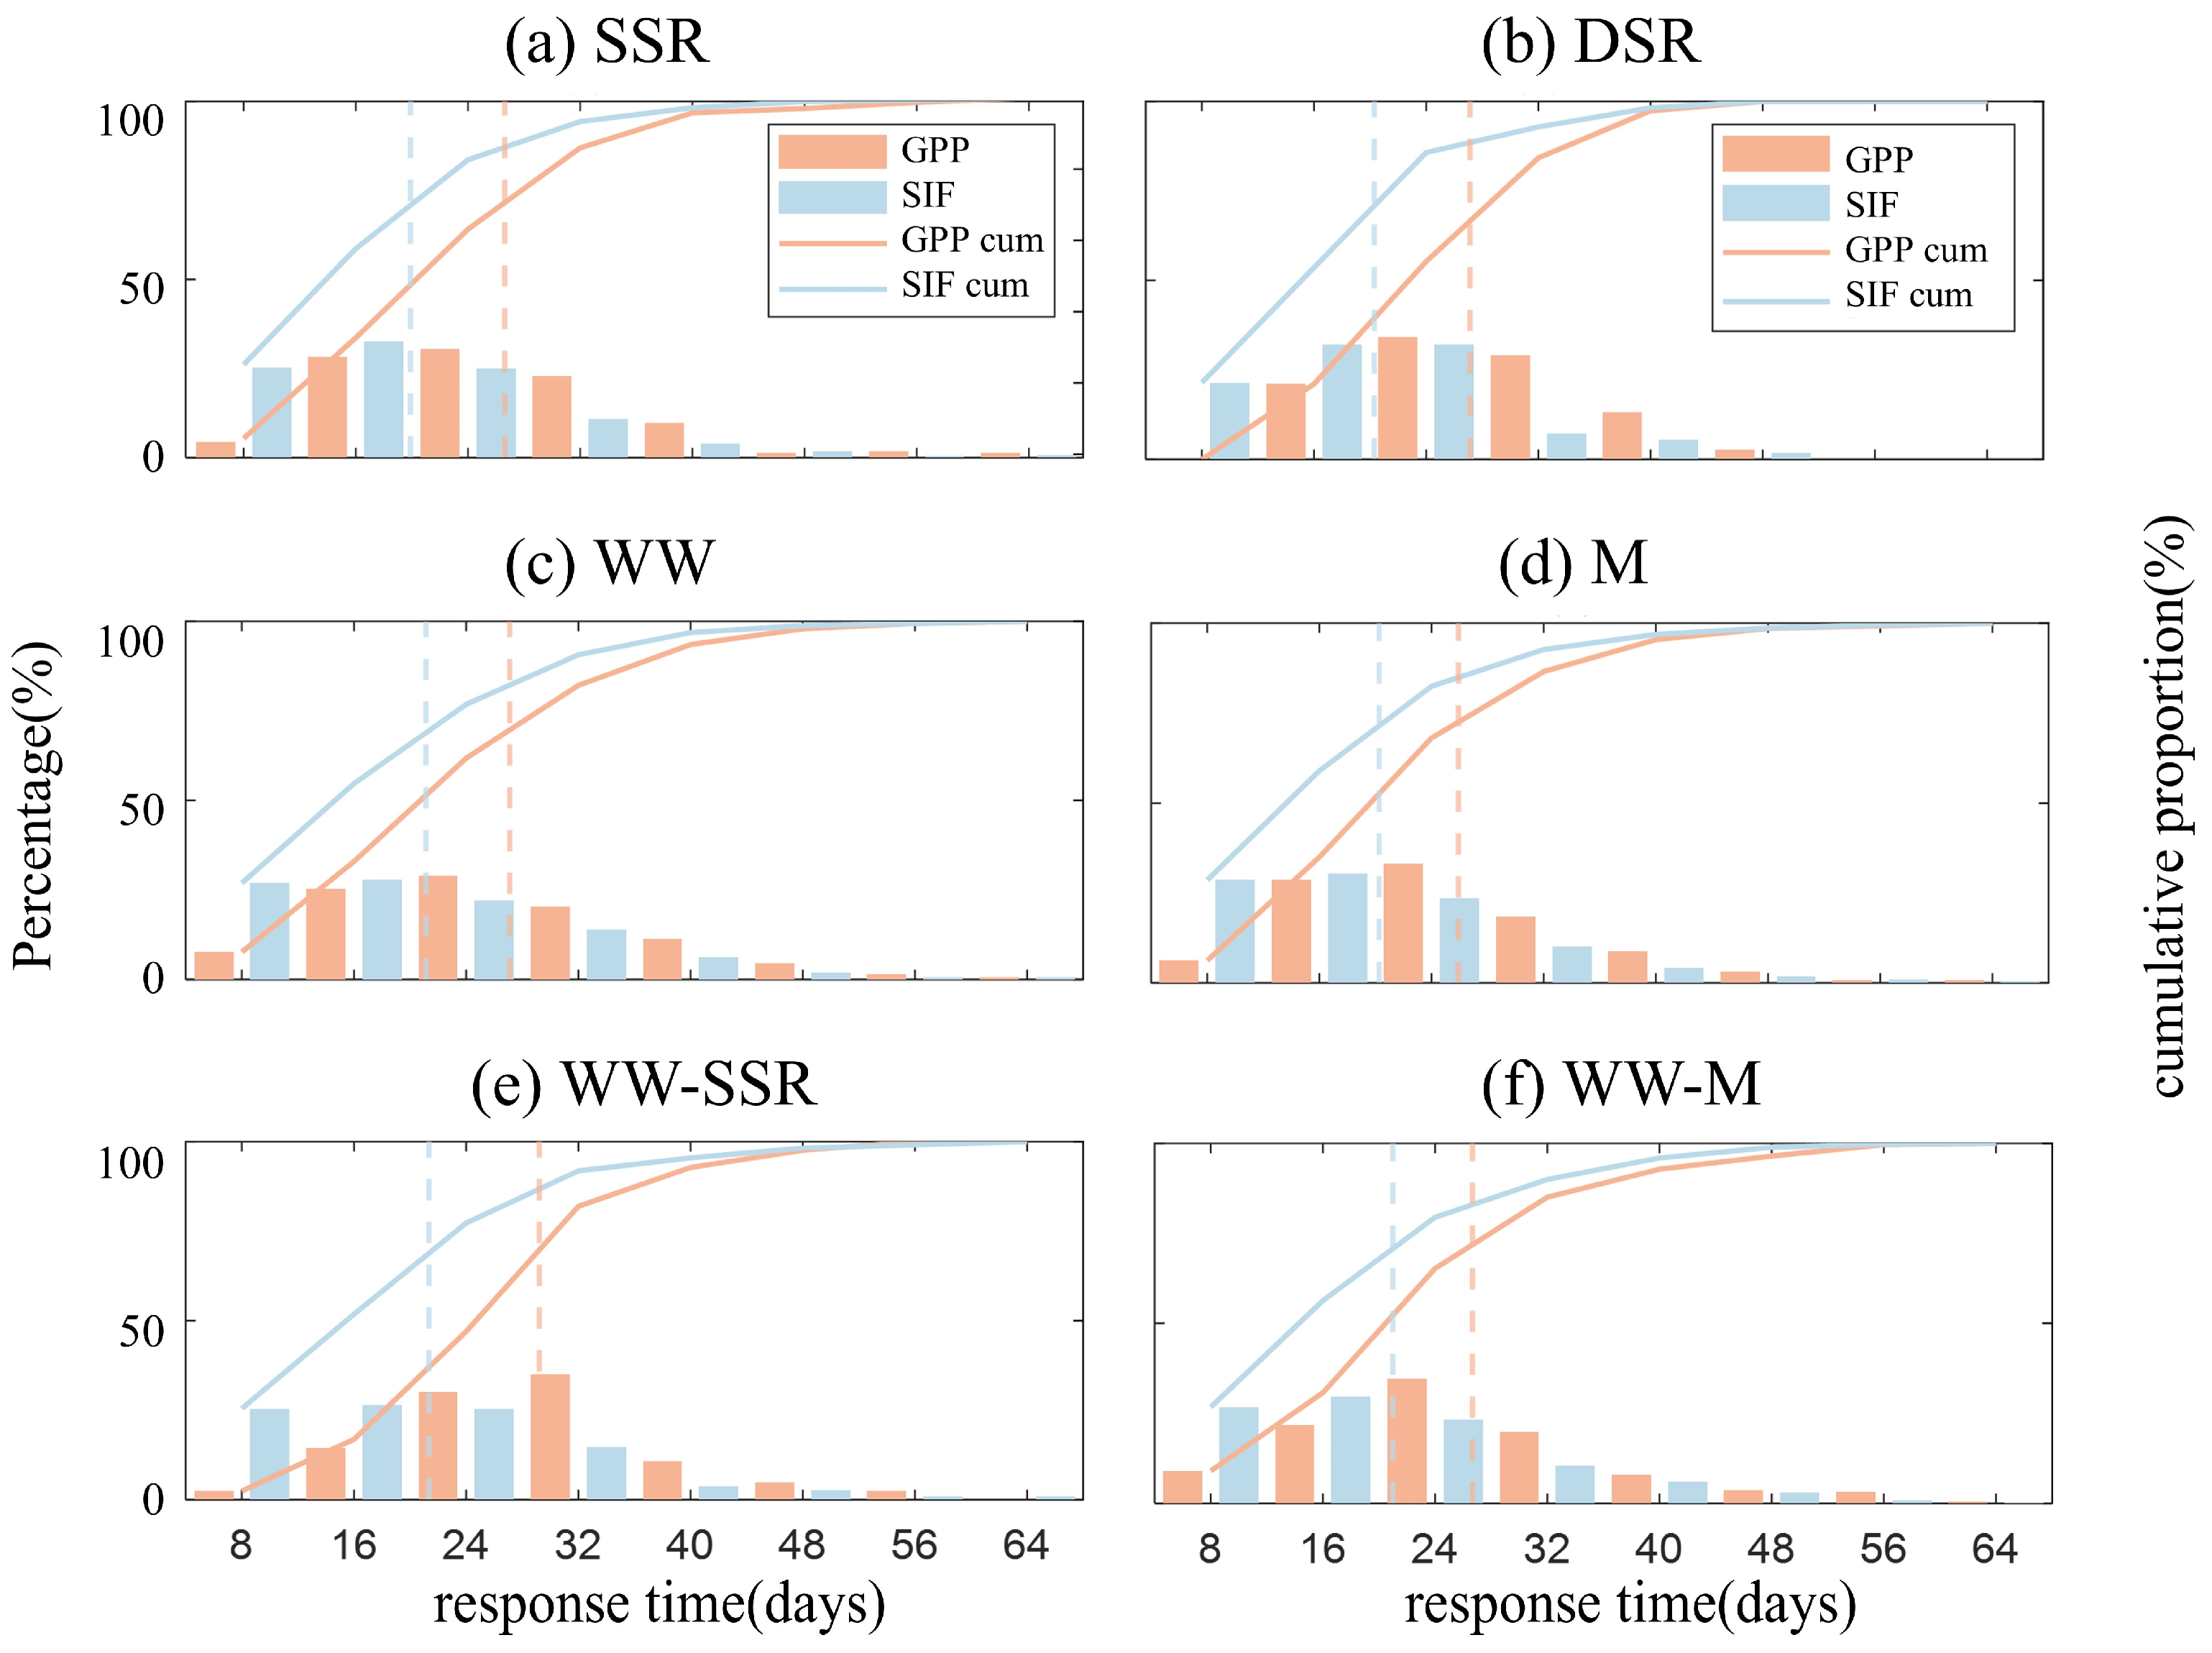
As shown in Figure 9, the mean SIF response time to flash droughts was consistently within 16.0–17.4 days, whereas that of GPP was 22.0–25.2 days, with a systematic lag of about 6–9 days between them. This difference was consistent across crop types, indicating that SIF has an earlier physiological response to flash droughts. The primary SIF response peak fell within the 8–18-day interval, with over 80% of events responding within 25 days. By comparison, the primary GPP peak fell within the 16–32-day interval, with 80% of events responding by about 30 days and some crop types showing delays beyond 35 days.
Spatially, SIF response time showed an overall latitudinal gradient, increasing from south to north. Response times were 5–15 days in most of the Middle–Lower Yangtze Plain, 10–20 days in the Huai River Basin, and 15–25 days in the central-northern North China Plain, locally exceeding 25 days. In contrast, the spatial heterogeneity of GPP response time was more pronounced: the Middle–Lower Yangtze Plain was dominated by 0–20-day responses, whereas the central-northern North China Plain generally showed 25–40-day responses, with some areas exceeding 40 days—a distinct lag-amplification pattern.

3.3.2. Differentiation in Photosynthetic Response Characteristics Among Crop Types

As shown in Figure 10, the mean SIF response time across all crop types ranged from 16.0 to 17.4 days. SSR and M responded fastest (about 16.0–16.3 days), DSR and WW were slightly slower (about 16.5–17.0 days), and WW–SSR was the slowest (about 17.4 days). The maximum inter-type difference was only about 1–1.2 days, with a highly concentrated distribution overall, suggesting that the early physiological response captured by SIF is highly universal.
GPP response times were likewise concentrated within 22.0–25.2 days, though inter-type variation was slightly greater than for SIF. Among these, WW–SSR showed the longest mean response time (about 25 days) and M the shortest (about 22 days), with the remaining types mostly between 23 and 24 days. Despite minor variations, all crop types showed a consistent “SIF responds first, GPP later” pattern.
In terms of regional cropping structure, the Middle–Lower Yangtze Plain is dominated by SSR and DSR, with flash drought responses of the “rapid SIF–relatively rapid GPP” type, whereas the North China Plain is dominated by WW–M and M, showing an overall “moderate SIF–delayed GPP” pattern. The GPP lag was most pronounced in WW–SSR regions.

3.4. SHAP Model-Based Analysis of Driving Factors for Crop Photosynthetic Recovery Rate

Before interpreting the SHAP-based feature attributions, we evaluated the predictive performance of the RF model for all six cropland types using both GPP- and SIF-based recovery rates (Table S2). The model achieved satisfactory to strong predictive performance for 11 of the 12 crop–indicator combinations, with test-set R2 ranging from 0.71 to 0.92. SIF-based models consistently outperformed GPP-based models (SIF R2: 0.87–0.92; GPP R2: 0.71–0.84 for non-DSR types), consistent with the closer mechanistic coupling between solar-induced fluorescence and instantaneous photosynthetic stress responses. The sole exception was the DSR–GPP combination (R2 = 0.13 under default settings, 0.35 after tuning), likely due to its limited sample size (N = 185) and the more complex recovery dynamics of double-cropping rice systems. SHAP attributions for this combination should therefore be interpreted with caution, although the DSR–SIF model performed well (R2 = 0.87). Hyperparameter tuning yielded only marginal improvements (ΔR2 < 0.02 for most types), confirming the robustness of the default configuration. These results confirm that the RF model captures a substantial fraction of the variance in photosynthetic recovery rates (median R2 = 0.86 across all combinations), providing a reliable basis for interpreting SHAP feature importance as indicators of physical driving factors.
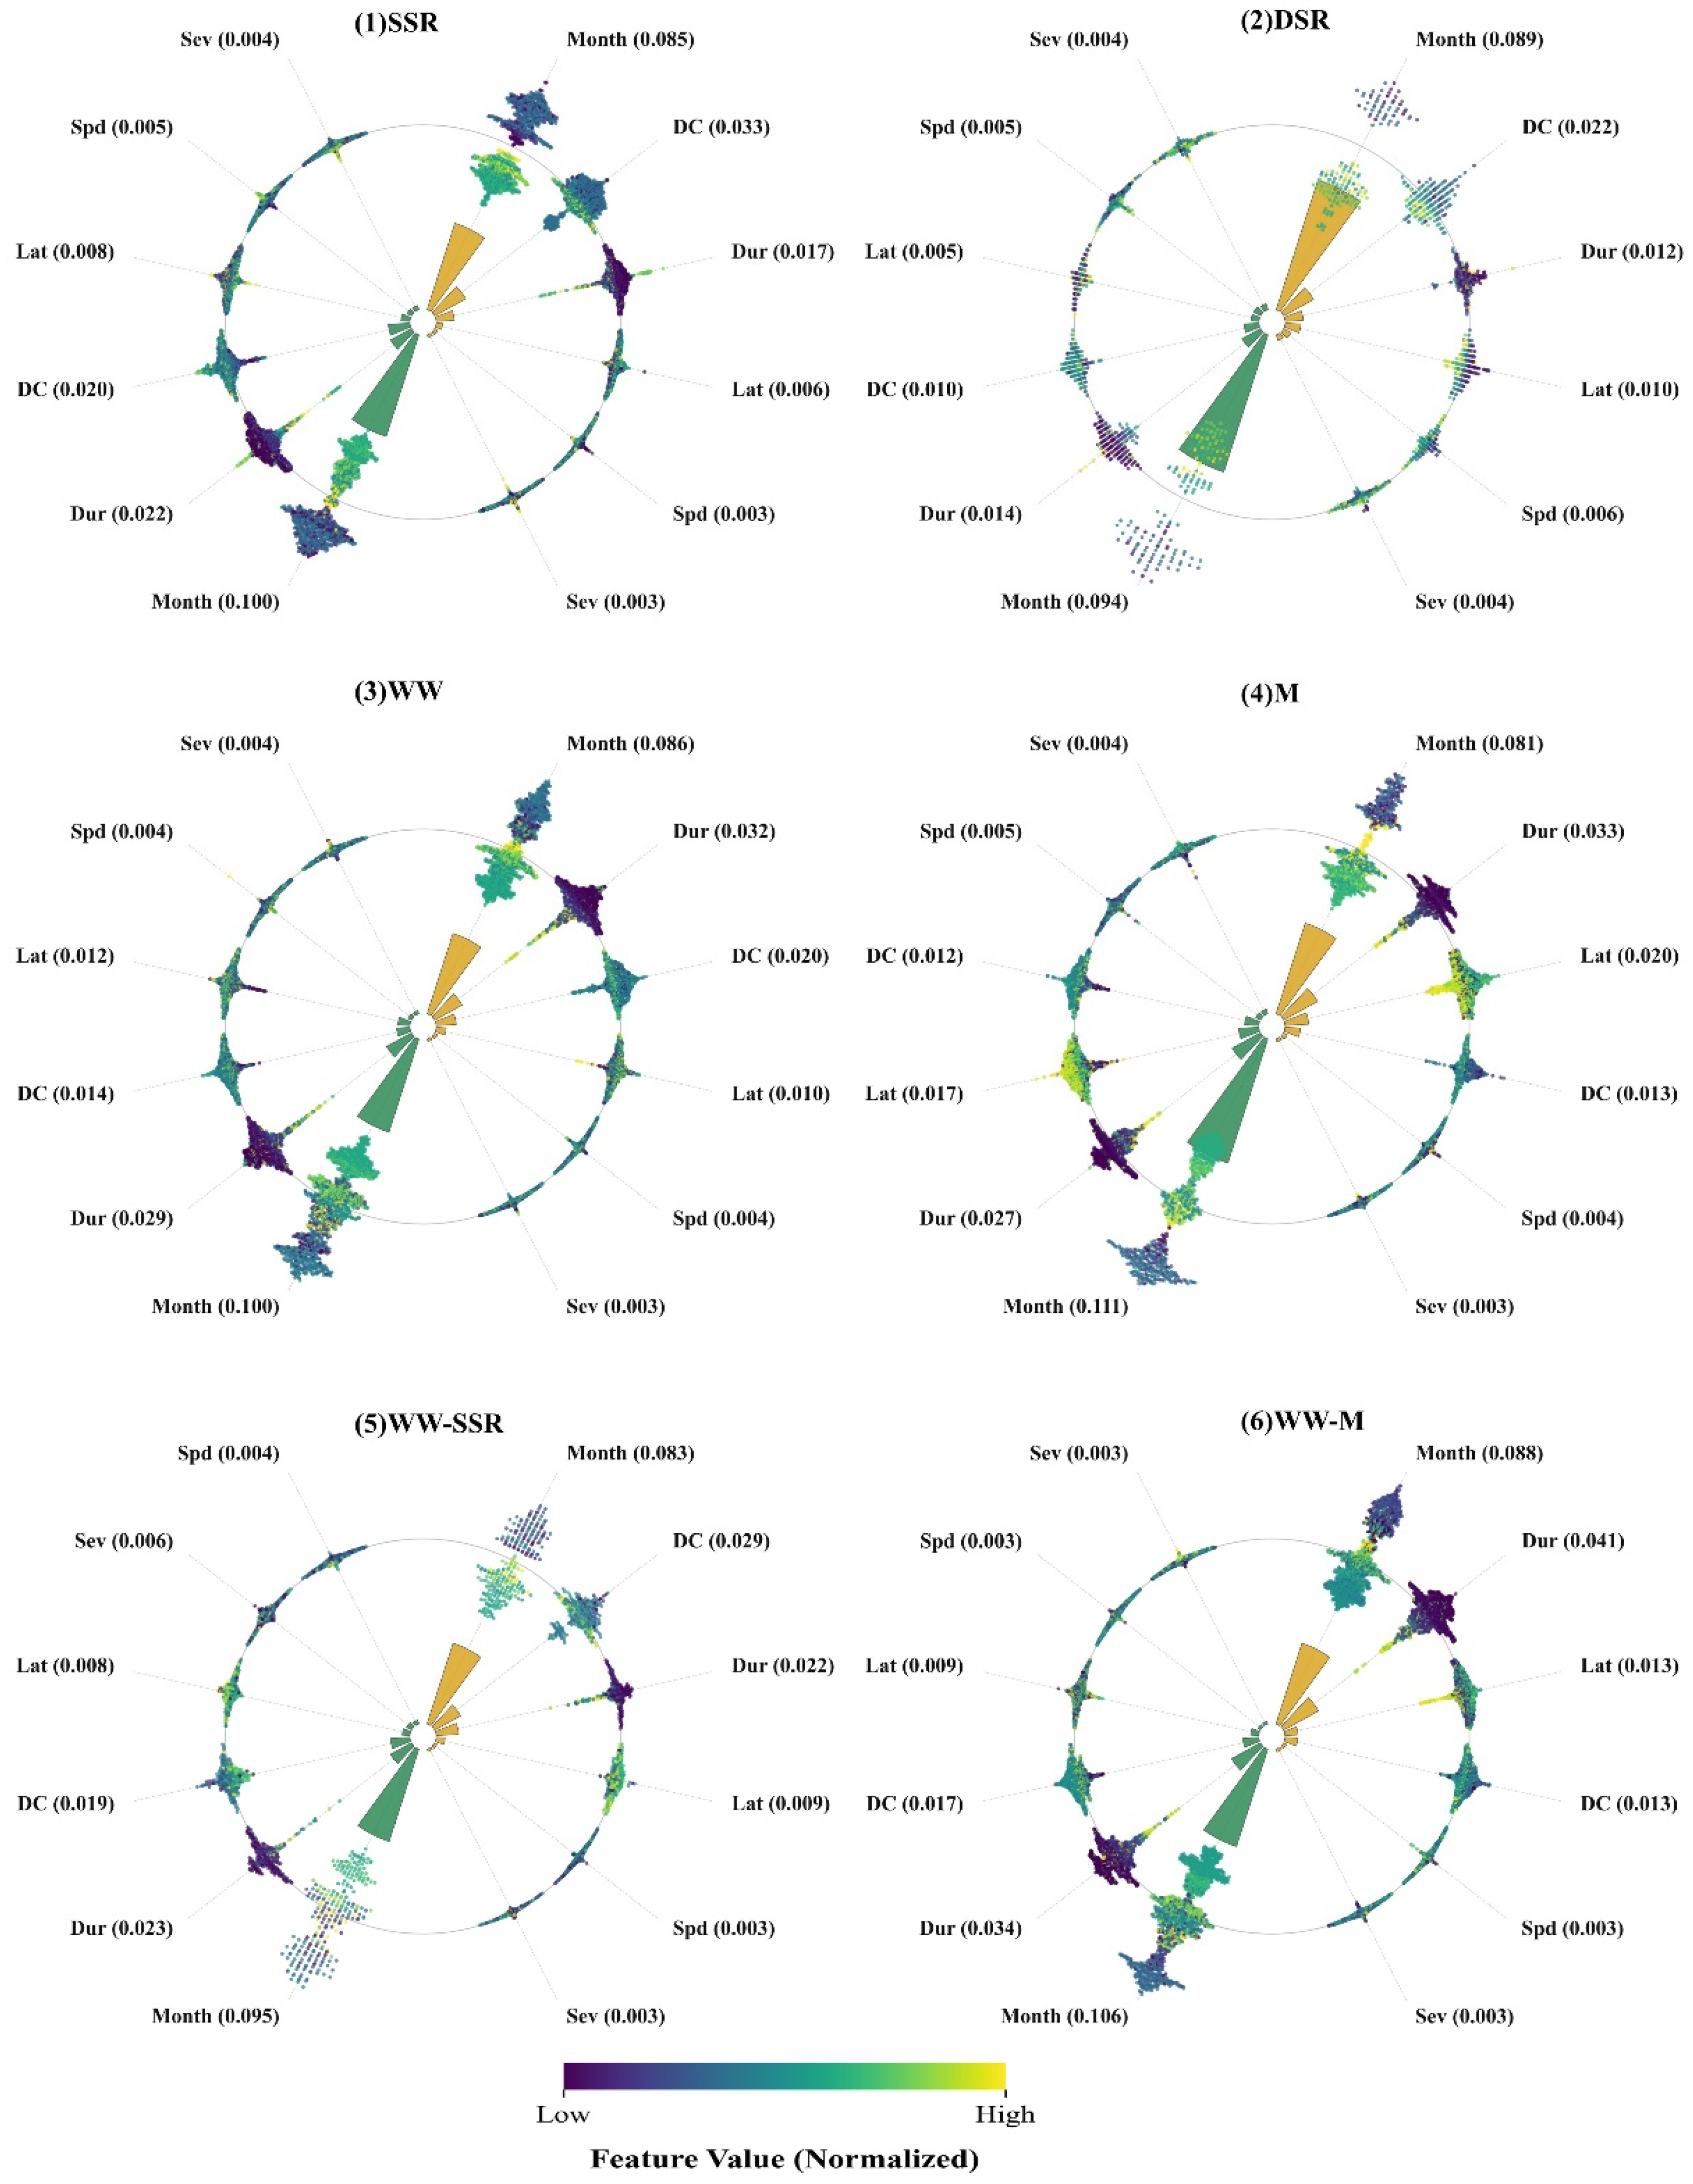
Building on the differentiated responses of crop photosynthetic indicators to flash droughts revealed in Section 3.3, SHAP values were computed for each factor. As shown in Figure 11, the photosynthetic recovery of rice systems was strongly regulated by multiple flash drought characteristics (Figure 11(1,2)). Beyond the dominant role of Month, Duration and DC ranked closely behind. SHAP analysis indicated that both longer Duration and faster DC were strongly associated with suppressed photosynthetic recovery, revealing an intrinsic physiological trait of rice: its low tolerance and adaptability to water-supply interruptions. Notably, the SHAP value distributions of DSR were generally broader than those of SSR across all features, indicating that its photosynthetic recovery was more sensitive to changes in driving factors and that the system was more vulnerable.
Within rainfed systems, the driving mechanisms of photosynthetic recovery differed markedly between WW and M (Figure 11(3,4)). For WW, the absolute importance of Month far exceeded that of all other factors and showed the broadest SHAP value distribution, firmly anchoring the high risk of recovery suppression to specific phenological windows (e.g., spring). In comparison, the driving structure for M was more diverse, with DC and Sev as the key limiting factors second only to Month, indicating that rapidly intensifying moisture deficit poses a severe threat to its photosynthetic system.
Rotation systems integrate the physiological requirements of both preceding and succeeding crops, exhibiting more complex regulatory patterns (Figure 11(5,6)). On one hand, Month remained the most important driving factor, though its influence merged the phenologically sensitive periods of both crops. On the other hand, the importance of Duration was consistently elevated in rotation systems, reflecting the cumulative effects of cross-seasonal moisture stress. Notably, compared with monoculture systems, the SHAP patterns of rotation systems showed more balanced contributions among process-related factors such as DC, Sev, and Spd, implying that their photosynthetic recovery is subject to multi-factor synergistic regulation and that the underlying mechanisms are more context-dependent.
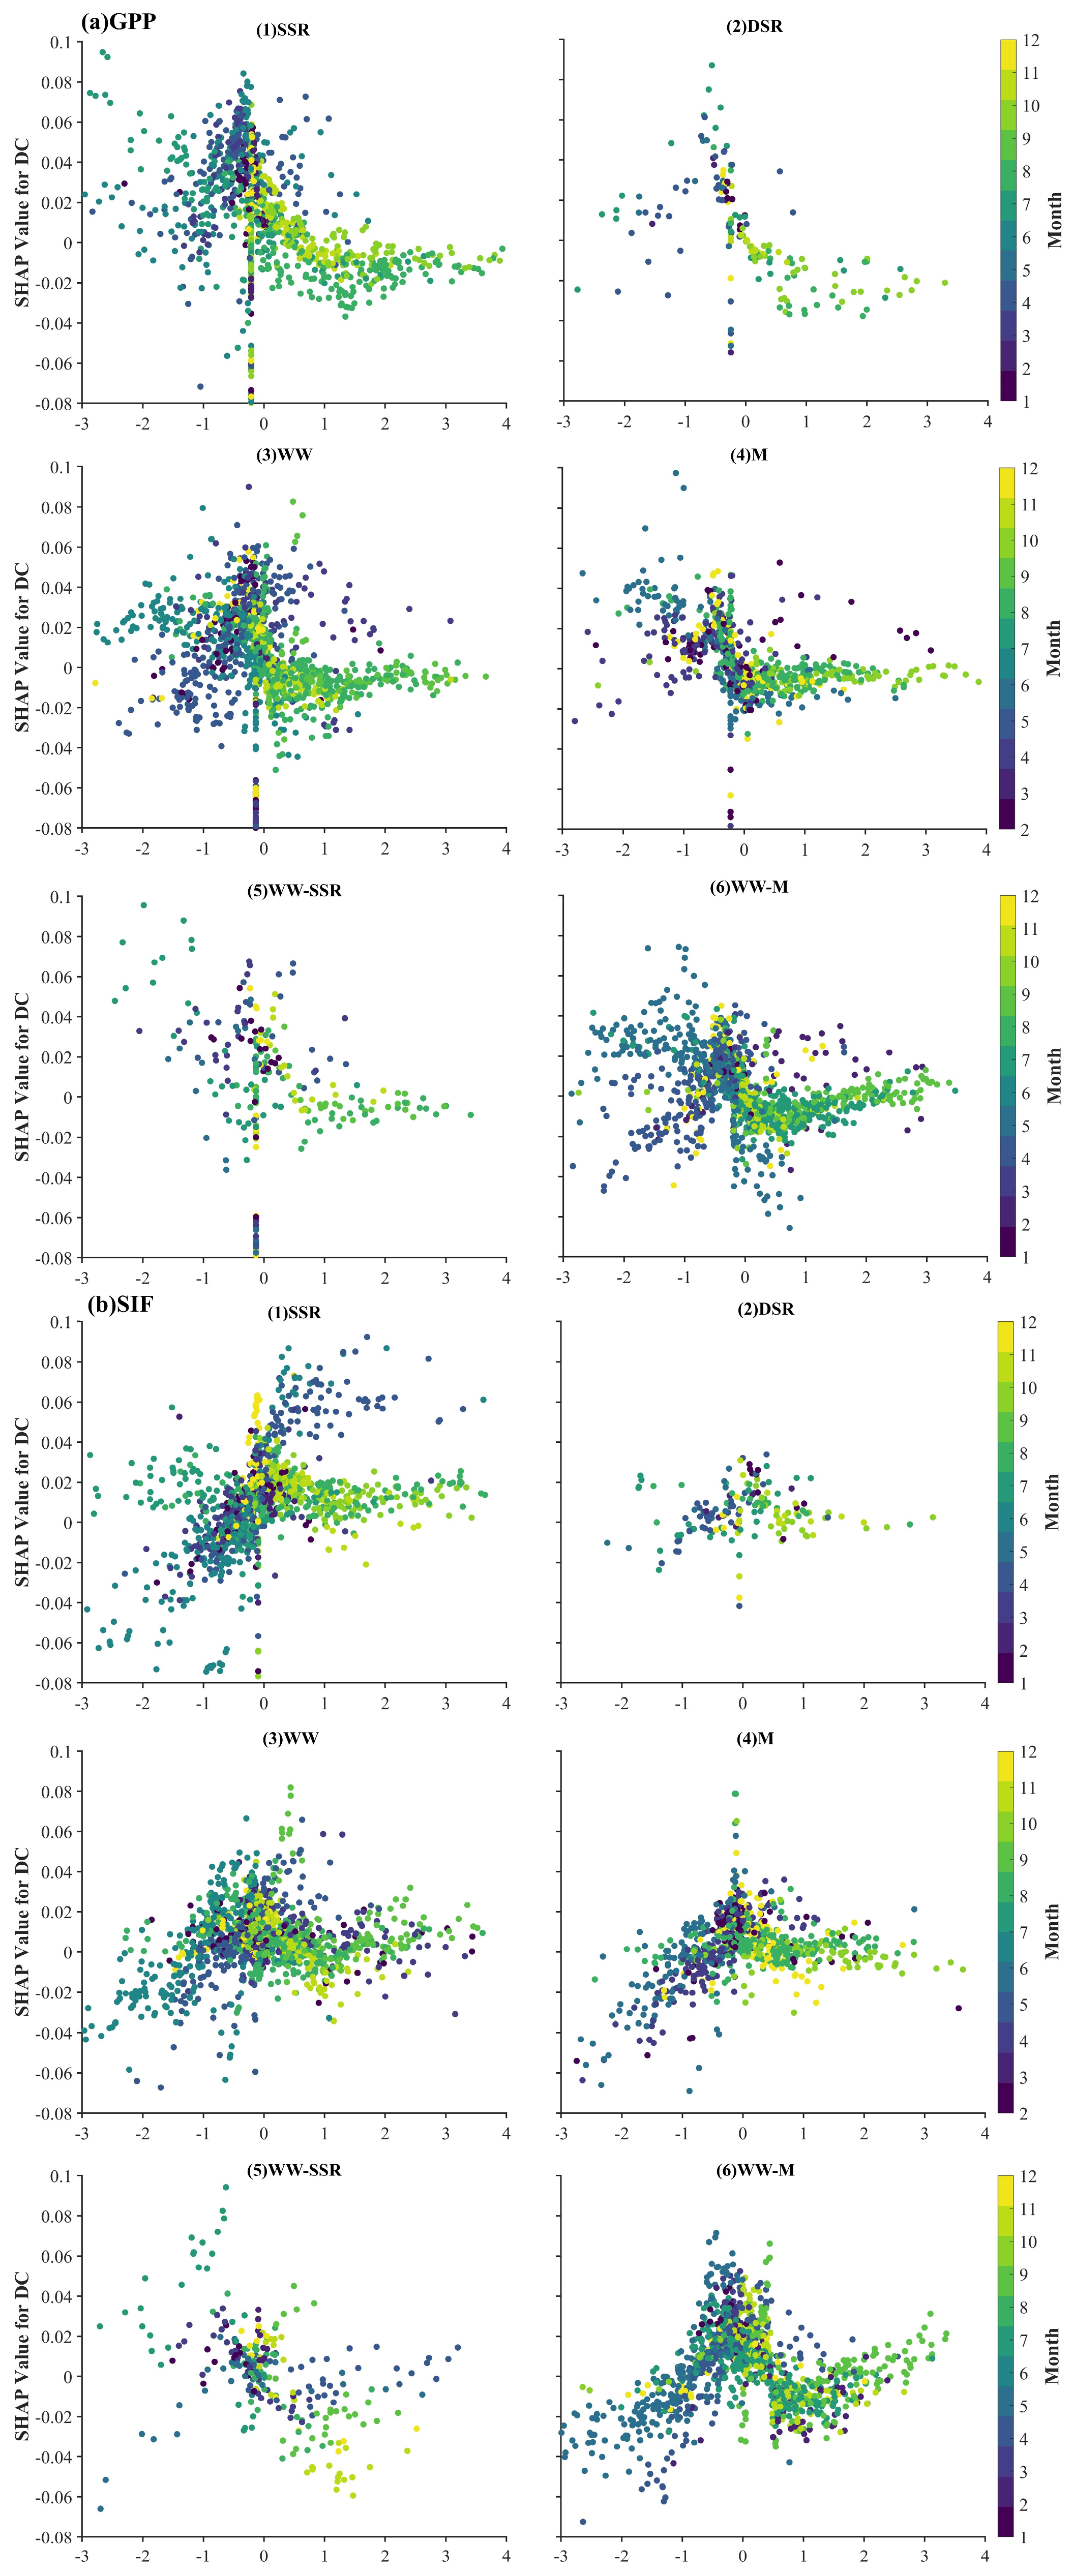
To further clarify the roles of key process-related factors, Figure 12 presents the SHAP dependence plots for DC. Recovery suppression intensified with increasing DC across all systems, though systematic differences in slope and dispersion were evident. Rice systems (particularly DSR) showed a larger negative shift in SHAP values at equivalent DC levels, with greater scatter, corroborating their high sensitivity to rapid drought and the associated response uncertainty. The negative trend line of M was the steepest, indicating that its photosynthetic recovery capacity declined sharply with increasing DC. The scatter of rotation systems was more dispersed than that of their monoculture counterparts, with intermingled coloring, further supporting the complex regulation of their recovery by multi-factor interactions such as the “DC–timing” interplay.

4. Discussion

Through integrated multi-dataset, multi-method analysis, this study revealed the distinguishing characteristics of flash droughts in the North China Plain and the Middle–Lower Yangtze Plain, and how they manifest across cropping systems. The principal findings are discussed below.

4.1. Spatiotemporal Characteristics of Flash Droughts

In terms of overall characteristics, the southern Middle–Lower Yangtze Plain exhibited a “high-frequency–low-intensity” pattern, whereas the central North China Plain displayed a “low-frequency–high-intensity–long-duration” pattern, consistent with the “rapid intensification” characteristics of flash droughts proposed by Otkin et al. (2018). [40] Development rates in most regions reached 8–16%/8 days, demonstrating that flash droughts in the East Asian monsoon region are likewise characterized by abruptness and rapid intensification [40]. This spatial heterogeneity may be attributed to regional differences in hydrothermal conditions and crop phenological sensitivity. On one hand, the North China Plain experiences high evapotranspiration demand and insufficient spring precipitation [46], readily producing persistent soil-moisture deficits. On the other hand, although the Middle–Lower Yangtze Plain is relatively moist, it can rapidly shift to a high-temperature, low-precipitation regime under the subtropical high, triggering short-duration flash droughts [47]. Furthermore, Yuan et al. noted that enhanced atmospheric evaporative demand under global warming is accelerating flash drought occurrence [3], echoing the increasing development rates observed here against a north–south gradient.
This study further revealed marked differences in the flash drought risks faced by different crops. Rice systems face “high-frequency shock” risks, with the highest event frequency but limited individual intensity and cumulative deficit, whereas rainfed and rotation systems face “intensity-cumulative” risks, with fewer events but markedly higher severity and duration. This finding deepens the understanding of flash drought impacts on agriculture. In a global-scale study of flash drought impacts on agricultural regions, Shi et al. (2025) [32] noted that rainfed maize and wheat are mainly affected by droughts of moderate duration, whereas rainfed rice is more sensitive to short-duration droughts. This aligns with the inter-crop differences in risk structure observed in the present study [32]. The physiological mechanisms underlying these differential crop responses may relate to root depth and phenological stage. Previous studies have shown that shallow-rooted vegetation is more sensitive to rapidly developing flash droughts [48]. Rice systems have relatively shallow roots and respond rapidly to short-term moisture deficits but also recover quickly, thus showing a high-frequency, low-intensity pattern. By contrast, the critical reproductive stages of rainfed and rotation systems (e.g., jointing to heading) are highly sensitive to moisture stress, so that once a flash drought occurs, prolonged cumulative damage readily ensues.

4.2. Differences in SIF–GPP Responses and Crop-Specific Divergence

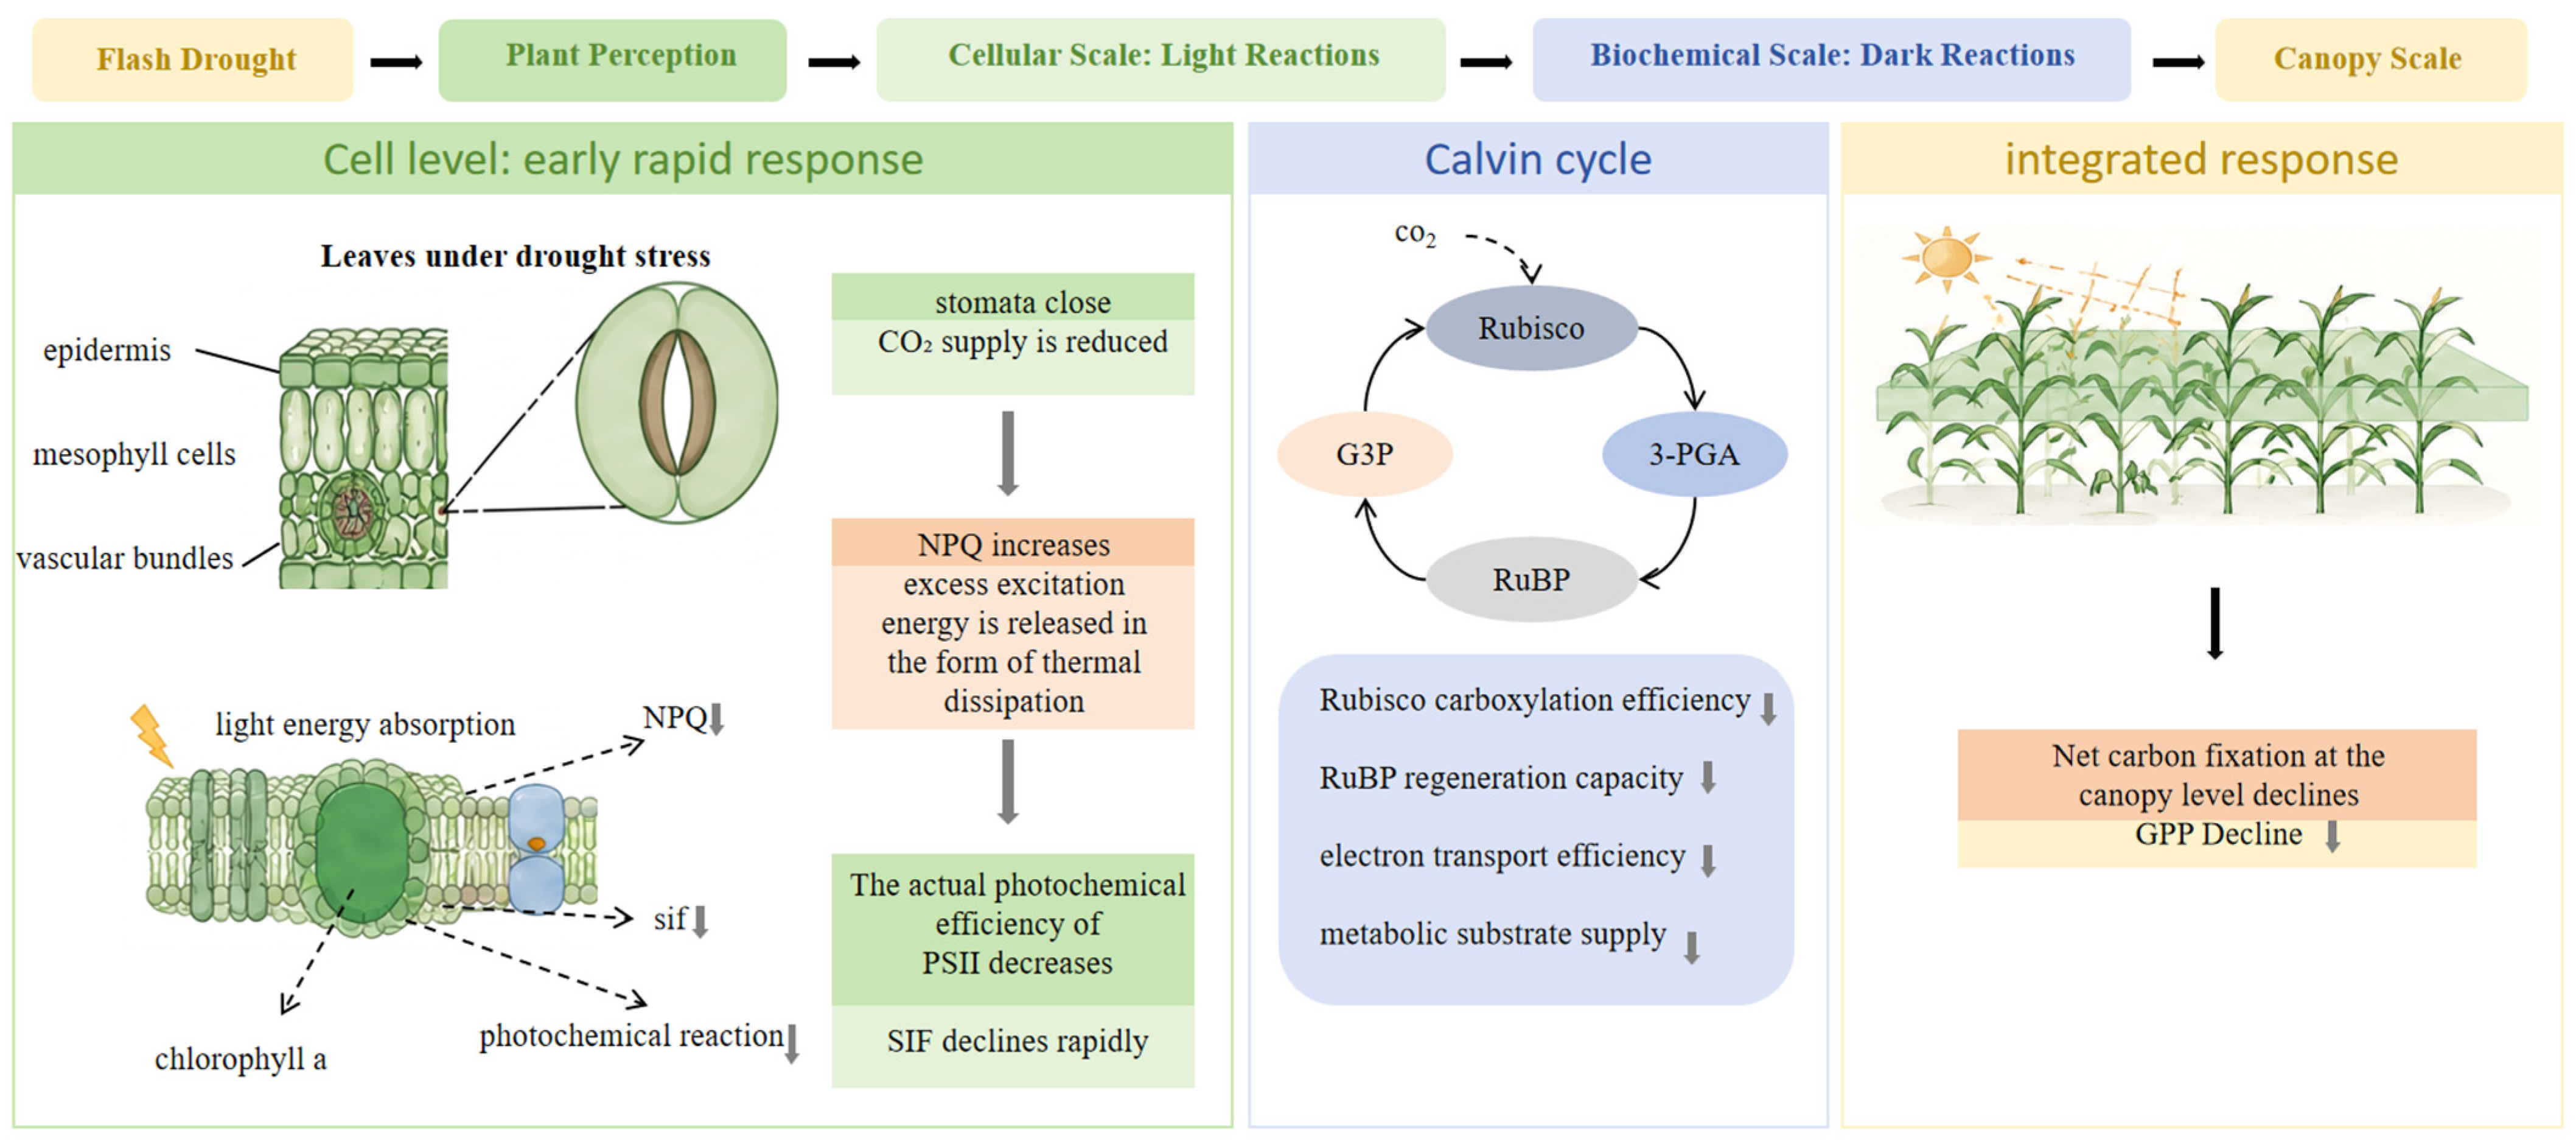
From a plant-physiological perspective, the earlier response of SIF than GPP to flash drought reflects the stepwise propagation of drought stress from the cellular to the canopy scale. As shown in Figure 13, SIF originates from fluorescence emission following light absorption by chlorophyll a in the Photosystem II (PSII) reaction center, and its intensity is closely related to the actual photochemical efficiency (ΦPSII) [49]. When a flash drought occurs, declining soil water first induces stomatal closure via the abscisic acid (ABA) signaling pathway, restricting CO2 diffusion into chloroplasts. As carbon assimilation demand decreases while light absorption continues, excess excitation energy gradually accumulates in the leaves. To avoid photodamage, plants enhance non-photochemical quenching (NPQ), dissipating excess energy as heat. This alters the partitioning of light energy among photochemistry, fluorescence emission, and thermal dissipation, reducing the actual photochemical efficiency of PSII. Consequently, SIF can rapidly sense inhibition of the light reactions and reflect the physiological stress status of plants before significant productivity loss occurs.
In contrast, GPP represents net carbon fixation at the canopy scale, essentially reflecting carbon assimilation dominated by the Calvin cycle. As a downstream component of photosynthesis, GPP is affected not only by CO2 limitation from stomatal closure but also by multiple biochemical processes, including Rubisco carboxylation efficiency, RuBP regeneration capacity, and electron transport efficiency. Therefore, a time lag exists between the perturbation of light reactions and the marked decline in carbon assimilation, so GPP generally responds later than SIF [50]. As drought stress intensifies, the dominant limiting mechanism gradually shifts from stomatal limitation (mainly stomatal closure) to non-stomatal limitation—including photoinhibition, mesophyll dehydration, and metabolic impairment—leading to a sustained decline in canopy photosynthesis. Collectively, the earlier SIF response relative to GPP observed here reflects the stepwise propagation of drought impacts from PSII photochemistry at the cellular scale to carbon assimilation at the canopy scale, demonstrating that SIF can capture the initial signals of plant water stress earlier than GPP.
This fundamental “rapid SIF–slow GPP” structure diverged across cropping systems, reflecting physiological differences in water-stress adaptation strategies. In rice systems, SIF responded fastest and the GPP lag was shortest, which is closely related to their shallow roots and high stomatal conductance: stomata close rapidly to prevent water loss but simultaneously reduce light-use efficiency and impair carbon assimilation [51]. By contrast, the pronounced GPP delay in rainfed systems may indicate the involvement of non-stomatal limitation [50]. Li et al. (2023) [43] noted that C4 crops such as maize can sustain carbon assimilation for a period under drought stress through osmotic adjustment and mobilization of carbon reserves, thereby delaying the substantive decline in GPP. Although this physiological buffering masks losses in the short term, it may also lead decision-makers to underestimate drought severity.
The response characteristics of rotation systems highlight the role of temporal configuration in cropping-system design. The winter wheat–single-season rice rotation (WW–SSR) showed the longest SIF response time and the most pronounced GPP lag, revealing how the crop transition period amplifies moisture stress. During the fallow interval between winter wheat harvest and rice transplanting (approximately 15–30 days), the land surface lacks vegetation cover and loses substantial soil moisture through evaporation, leaving the system in fragile equilibrium [52]. If a flash drought strikes at this juncture, the root system of the newly transplanted rice is not yet fully developed, its capacity to sense soil-moisture deficit is weak, and ABA signal transduction is inefficient, preventing the timely activation of physiological responses and thus producing a markedly delayed SIF response [53]. By the time the roots are established and able to perceive the stress, soil moisture is already severely depleted, and the crop has entered an irreversible phase of damage. In contrast, the winter wheat–maize rotation (WW–M) showed no significant response delay, owing to the high continuity of its crop transition: summer maize is relay-planted immediately after winter wheat harvest, with virtually no bare-soil period, establishing an effective relay in soil-moisture use that mitigates moisture stress. This comparison reveals that the vulnerability of cropping systems depends not only on the crops’ inherent physiological attributes but also, critically, on the temporal configuration of the system.

4.3. Recovery Driving Mechanisms Revealed by the SHAP Model

Using the interpretable SHAP model, this study quantitatively revealed the mechanisms through which flash droughts affect crop photosynthetic recovery, highlighting the dominant role of phenological stage in agricultural flash drought assessment and elucidating the hierarchy and system specificity of the driving factors. This conclusion is highly consistent with the global-scale study by Shi et al. (2025), which showed that the regulatory role of phenological stage on flash drought damage far exceeds that of traditional indices such as intensity and duration, and proposed a hierarchy of phenological stage > drought process characteristics > agricultural management [32]. Together, these findings corroborate the central role of phenological timing in agricultural flash drought impact assessment.
This study found that the contribution of the month of drought occurrence to photosynthetic recovery exceeded those of Sev and Duration (Figure 12), providing supplementary insights for conventional drought research [20]. Annual crops have strictly irreversible phenological progressions, and the coupling of stress periods with physiologically vulnerable windows serves as a key amplifier of impact. A moderate flash drought during the critical reproductive stage (heading to grain filling) impairs the photosynthetic system and yield far more than a high-intensity drought in the late vegetative stage. This result supports the high temporal heterogeneity of vegetation drought responses proposed by Li et al. (2023) [43] and provides a basis for quantifying and weighting “phenological windows” in regional cropping systems.
Under the dominance of phenological timing, flash drought development rate and duration jointly modulate the degree of damage. This study showed that DC is more important than Sev, consistent with Otkin et al. (2018), who proposed that rapid onset constitutes the core hazard-inducing property of flash droughts [40]. Rapid development compresses the windows for crop physiological adjustment and management intervention, triggering immediate responses such as stomatal closure and Photosystem II damage. Sustained stress depletes available soil water, leading to osmotic imbalance, carbon-reserve exhaustion, and diminished recovery potential. The exceptional 2022 flash drought in the Yangtze River Basin corroborated these cumulative effects and positive feedback mechanisms [54]. The high sensitivity of rice to both DC and Duration arises from the inherent conflict between its high root oxygen demand and high transpiration requirements—legacies of its aquatic adaptation.
The response differences among cropping systems originate from their distinct physiological characteristics and management practices. Owing to its well-developed aerenchyma, high root oxygen demand, and adaptation to prolonged waterlogging, rice suffers significant root and photosynthetic damage upon water withdrawal [55]. Double-season rice, with its compact growth cycle and insufficient recovery redundancy, is even more sensitive [38]. Winter wheat is highly sensitive to spring drought because of the irreversible physiological investment during the vernalization-to-reproductive transition, when stress readily causes floret degeneration and weak resilience. As a C4 crop, maize combines high photosynthetic efficiency with high transpiration, making it particularly vulnerable to rapidly developing droughts (high DC). Rotation systems have low tolerance to sustained drought: the preceding crop depletes deep soil water, raising the moisture-deficit baseline for the succeeding crop, while overlapping phenological windows extend the period of risk exposure [29].

4.4. Limitations and Future Perspectives

This study systematically analyzed flash drought characteristics and crop response mechanisms across the North China Plain and the Middle–Lower Yangtze Plain; however, four limitations remain. First, although the multi-source soil moisture datasets underwent uncertainty assessment using the Triple Collocation method, the SMCI1.0 time series currently only extends to 2022, and minor discrepancies remain between reanalysis-based datasets and in situ observations. These uncertainties may, to some extent, affect the refinement of flash drought identification. In addition, the 8-day temporal resolution adopted here may introduce uncertainty in determining the exact onset timing and development rate of flash droughts. Although daily soil moisture observations are available, all variables were harmonized to an 8-day interval to match the temporal resolution of the GOSIF and GOSIF-GPP products. This temporal aggregation may theoretically introduce an uncertainty of about ±4 days in identifying flash drought onset. However, this uncertainty is relatively small compared with the typical duration of flash drought events (24–80 days) and the observed vegetation response lag (about 6–9 days). Moreover, the 8-day scale reduces short-term meteorological noise and provides a more robust representation of sustained drought intensification. Second, although this study focused on climate-driven flash drought characteristics and crop physiological responses, anthropogenic management factors—including irrigation, fertilization, and cultivar improvement—were not explicitly considered. As the North China Plain and the Middle–Lower Yangtze Plain are major agricultural regions with intensive management, irrigation can partially offset soil moisture deficits and modify crop recovery. Therefore, separating climate-induced drought effects from human adaptation effects remains challenging. Future studies integrating high-resolution irrigation datasets, irrigation-timing information, and crop management records may further improve the attribution of crop resilience mechanisms. Third, only the historical characteristics and impacts of flash droughts during 2001–2024 were analyzed, without incorporating climate model projections for scenario-based prediction of future flash drought evolution; thus, a forward-looking analysis of flash drought risk under climate change is lacking. Fourth, crop-specific analyses were conducted using crop masks derived from a single-year China Crop Dataset (CCD). Although this approach effectively characterizes the representative spatial distribution of major cropping systems, it does not explicitly account for interannual changes in cropping patterns during 2001–2024. Given that both plains experienced adjustments in crop planting structure over the study period, uncertainties may arise in the crop-specific response analyses. Therefore, the crop-related results should be interpreted as comparisons among major cropping systems under a representative crop distribution, rather than precise representations of historical crop distributions throughout the study period. In addition, aggregating multi-source remote sensing products to a 0.1° resolution may reduce the representation of field-scale agricultural heterogeneity. Although the area-weighted aggregation preserves the regional mean signal, mixed pixels and sub-grid variations arising from fragmented cropland, crop mixtures and heterogeneous management may introduce additional uncertainty into crop-specific response assessments. Therefore, the results mainly reflect regional-scale crop physiological responses rather than field-scale variations. Future studies integrating annually updated crop distribution datasets, higher-resolution satellite observations (e.g., Sentinel- and Landsat-based products), and sub-pixel crop-fraction information may further improve the accuracy and representativeness of crop-specific flash drought response assessments.
Future research can proceed along four directions. First, integrating multi-station in situ soil moisture observations from the study area to optimize multi-source data fusion and enhance the accuracy and resolution of flash drought identification and spatiotemporal trajectory characterization. Second, establishing a coupled natural–anthropogenic framework that incorporates human-activity indicators such as irrigation intensity and cropping-system adjustments to quantify the synergistic contributions and interactions of natural and anthropogenic factors in flash drought formation and crop response. Third, combining CMIP6 and other climate model outputs to simulate the spatiotemporal evolution of flash droughts under different carbon-emission scenarios, reveal their potential impacts on the photosynthesis and yield of major crops, and propose targeted adaptation strategies. Fourth, employing annually updated crop distribution datasets to construct dynamic crop masks and matching flash drought events with the corresponding yearly crop distributions. Such an approach would explicitly incorporate temporal variations in cropping patterns and improve the accuracy and representativeness of crop-specific flash drought response assessments. In addition, integrating sub-pixel crop fractional coverage may further reduce uncertainties associated with mixed pixels and provide a more detailed characterization of vegetation responses to flash drought.

5. Conclusions

This study investigated the spatiotemporal characteristics of flash droughts in the North China Plain and the Middle–Lower Yangtze Plain of China and their impacts on crop photosynthetic recovery. The principal conclusions are as follows. Flash drought events exhibited pronounced regional differences in frequency, duration, and development rate, with the southern Middle–Lower Yangtze Plain characterized by high frequency and the central North China Plain by high intensity and prolonged duration. SIF and GPP data demonstrated that different cropping systems show temporal differences in their responses to flash droughts, presenting a “rapid SIF response–lagged GPP recovery” pattern that offers a new perspective for proactive early warning. The multi-source data fusion and Random Forest model provided a quantitative analysis of driving factors, preliminarily revealing the key variables in drought progression, although data limitations and regional representativeness require further refinement in future research. Moreover, this study deepens the understanding of rapid drought response mechanisms and provides a scientific reference for regional agricultural disaster prevention and food security management. In summary, this study provided a relatively systematic analysis of flash drought events using multi-source data and analytical methods and outlined clear directions for future research. Future in-depth investigations hold promise for further enhancing the sensitivity and accuracy of regional drought early-warning systems, thereby better serving agricultural production and ecological protection.

Supplementary Materials

The following supporting information can be downloaded at: https://www.mdpi.com/article/10.3390/rs18142295/s1, refs. [56,57,58,59,60,61,62] are cited in the Supplementary Materials.

Author Contributions

S.M.: Methodology, Writing—original draft. M.H.: Methodology, Writing—original draft, Validation. H.C.: Methodology, Writing—original draft. S.N.: Conceptualization, Supervision, Writing—review and editing. Z.Z.: Writing—review and editing, Validation. L.C.: Visualization, Software. Y.Z.: Resources, Funding acquisition. W.J.: Data curation, Formal analysis. All authors have read and agreed to the published version of the manuscript.

Funding

This work was supported by the Provincial Training Program of Innovation and Entrepreneurship for Undergraduates (grant number: S202510359408), the Anhui Provincial Natural Science Foundation (2308085US13, 2408055US007, 2408085QC078), the National Natural Science Foundation of China (Grant Nos. 52379006; 32501471), the National Key Research and Development Program of China (2023YFB3907402) and the Program for the Fundamental Research Funds of the Central Universities (JZ2025HGQA0126).

Data Availability Statement

All datasets used in this study are publicly available. Access URLs for each dataset are provided in Table 1. The custom analysis code for flash drought identification, connected-component tracking, trajectory matching, and SHAP attribution analysis is publicly available at https://github.com/cheyann4399/flash-drought-connectivity (accessed on 30 June 2026).

Acknowledgments

The authors thank the editor and anonymous reviewers for their constructive comments and suggestions for the revision of this paper.

Conflicts of Interest

The authors declare no conflict of interest.

Abbreviations

The following abbreviations are used in this manuscript:
FDFlash drought
RZSMRoot zone soil moisture
SSRSingle-season rice
DSRDouble-season rice
WWWinter wheat
MMaize
WW-MWinter wheat-maize
WW-SSRWinter wheat-single-season rice
ETCExtended Triple Collocation
EDFEmpirical Distribution Function
SHAPShapley Additive Explanations
GOSIFGlobal dataset of solar-induced chlorophyll fluorescence
GPPGross primary production
ECMWFEuropean Centre for Medium-Range Weather Forecasts
GLEAMGlobal Land Evaporation Amsterdam Model
SMCI1.0Soil Moisture of China by in situ data, version 1.0
CCDChina Crop Dataset
ΦPSIIEffective Quantum Yield of Photosystem II
PSIIPhotosystem II
ABAAbscisic Acid
NPQNon-Photochemical Quenching
RuBPRibulose-1,5-Bisphosphate

References

  1. Goswami, P.; Gallant, A.J. Understanding Drought Onset: What Makes Flash Droughts Different from Conventional Droughts? Weather Clim. Extrem. 2025, 49, 100782. [Google Scholar] [CrossRef]
  2. Qing, Y.; Wang, S.; Ancell, B.C.; Yang, Z.-L. Accelerating Flash Droughts Induced by the Joint Influence of Soil Moisture Depletion and Atmospheric Aridity. Nat. Commun. 2022, 13, 1139. [Google Scholar] [CrossRef] [PubMed]
  3. Yuan, X.; Wang, Y.; Ji, P.; Wu, P.; Sheffield, J.; Otkin, J.A. A Global Transition to Flash Droughts Under Climate Change. Science 2023, 380, 187–191. [Google Scholar] [CrossRef] [PubMed]
  4. Gu, L.; Schumacher, D.L.; Fischer, E.M.; Slater, L.J.; Yin, J.; Sippel, S.; Chen, J.; Liu, P.; Knutti, R. Flash Drought Impacts on Global Ecosystems Amplified by Extreme Heat. Nat. Geosci. 2025, 18, 709–715. [Google Scholar] [CrossRef]
  5. Lovino, M.A.; Pierrestegui, M.J.; Müller, O.V.; Müller, G.V.; Berbery, E.H. The Prevalent Life Cycle of Agricultural Flash Droughts. NPJ Clim. Atmos. Sci. 2024, 7, 73. [Google Scholar] [CrossRef]
  6. Wang, Y.; Yuan, X. Land-Atmosphere Coupling Speeds Up Flash Drought Onset. Sci. Total. Environ. 2022, 851, 158109. [Google Scholar] [CrossRef] [PubMed]
  7. Walker, C.; Ellenburg, W.L.; Mishra, V.; Mecikalski, J.R.; Hain, C.R.; Anderson, M.C. Evaporative Stress Index as a Flash Drought Tool in the Southeastern U.S. J. Hydrol. Reg. Stud. 2026, 64, 103245. [Google Scholar] [CrossRef]
  8. Zhu, Y.; Yang, P.; Xia, J.; Huang, H.; Chen, Y.; Li, L.; Sun, K.; Song, J.; Shi, X.; Lu, X. Differential Impact of Flash Droughts on Water use Efficiency in Terrestrial Ecosystems in Central Asia. Clim. Change 2025, 178, 53. [Google Scholar] [CrossRef]
  9. Nguyen, N.M.; Lee, S.-M.; Kim, J. Evaluating the Applicability of Exclusively Optical Sensors in Flash Drought Monitoring with MODIS Observations. ISPRS J. Photogramm. Remote Sens. 2025, 231, 376–393. [Google Scholar] [CrossRef]
  10. Qi, Z.; Ye, Y.; Sun, L.; Yuan, C.; Cai, Y.; Xie, Y.; Cheng, G.; Zhang, P. Development of an Indicator System for Solar-Induced Chlorophyll Fluorescence Monitoring to Enhance Early Warning of Flash Drought. Agric. Water Manag. 2025, 312, 109397. [Google Scholar] [CrossRef]
  11. Saharwardi, S.; Hassan, W.U.; Dasari, H.P.; Abualnaja, Y.; Hoteit, I. Enhanced Flash Droughts in Recent Decades Over the Arabian Peninsula. J. Hydrol. Reg. Stud. 2025, 61, 102696. [Google Scholar] [CrossRef]
  12. Harris, B.L.; Taylor, C.M.; Dorigo, W.; Zotta, R.-M.; Ghent, D.; Noguera, I. Global Observations of Land-Atmosphere Interactions During Flash Drought. Hydrol. Earth Syst. Sci. 2025, 29, 6917–6933. [Google Scholar] [CrossRef]
  13. Yin, G.; He, W.; Liu, W.; Liu, X.; Xia, Y.; Zhang, H. Drought Stress and Its Characteristics in China from 2001 to 2020 Considering Vegetation Response and Drought Creep Effect. J. Hydrol. Reg. Stud. 2024, 53, 101763. [Google Scholar] [CrossRef]
  14. Zhou, Z.; Wang, P.; Li, L.; Fu, Q.; Ding, Y.; Chen, P.; Xue, P.; Wang, T.; Shi, H. Recent Development on Drought Propagation: A Comprehensive Review. J. Hydrol. 2024, 645, 132196. [Google Scholar] [CrossRef]
  15. Shadmehri Toosi, A.; Batelaan, O.; Shanafield, M.; Guan, H. Land Use-Land Cover and Hydrological Modeling: A Review. WIREs Water 2025, 12, e70013. [Google Scholar] [CrossRef]
  16. Wang, W.; Zhou, L.; He, C.; Zhang, Y.; Gong, Z.; Ying, N.; Qiao, P.; Wu, J.; Sun, H.; Fan, J. Complex Network Approaches for Identifying Global Drought Teleconnection Patterns. Glob. Planet. Change 2025, 255, 105093. [Google Scholar] [CrossRef]
  17. Dai, S.; Zhang, Q.; Huang, S. Identification and Characteristics of Regional Rainstorm Events in China Based on a Dual-Threshold Method. Atmos. Res. 2025, 320, 108081. [Google Scholar] [CrossRef]
  18. Li, J.; Chen, L.; Zhang, G.; Liu, H.; Hu, H.; Xu, M.; Guo, X.; Meng, Z.; Dong, Z. Identification and Characterization of Long-Term Meteorological Drought Events in the Yellow River Basin. Ecol. Inform. 2025, 86, 102992. [Google Scholar] [CrossRef]
  19. Huang, C.; Huang, J.; Xiao, J.; Li, X.; He, H.S.; Liang, Y.; Chen, F.; Tian, H. Global Convergence in Terrestrial Gross Primary Production Response to Atmospheric Vapor Pressure Deficit. Sci. China Life Sci. 2024, 67, 2016–2025. [Google Scholar] [CrossRef] [PubMed]
  20. Zhao, Y.; Xiong, L.; Yin, J.; Zha, X.; Li, W.; Han, Y. Understanding the Effects of Flash Drought on Vegetation Photosynthesis and Potential Drivers over China. Sci. Total Environ. 2024, 931, 172926. [Google Scholar] [CrossRef] [PubMed]
  21. Meng, F.; Liu, D.; Wang, Y.; Wang, S.; Wang, T. Negative Relationship Between Photosynthesis and Late-Stage Canopy Development and Senescence over Tibetan Plateau. Glob. Change Biol. 2023, 29, 3147–3158. [Google Scholar] [CrossRef] [PubMed]
  22. Osman, M.; Zaitchik, B.F.; Badr, H.S.; Christian, J.I.; Tadesse, T.; Otkin, J.A.; Anderson, M.C. Flash drought onset over the contiguous United States: Sensitivity of inventories and trends to quantitative definitions. Hydrol. Earth Syst. Sci. Discuss. 2021, 25, 565–581. [Google Scholar] [CrossRef]
  23. Yang, L.; Wang, W.; Wei, J. Assessing the Response of Vegetation Photosynthesis to Flash Drought Events Based on a New Identification Framework. Agric. For. Meteorol. 2023, 339, 109545. [Google Scholar] [CrossRef]
  24. Wang, X.; Blanken, P.D.; Wood, J.D.; Nouvellon, Y.; Thaler, P.; Kasemsap, P.; Chidthaisong, A.; Petchprayoon, P.; Chayawat, C.; Xiao, J.; et al. Solar-induced Chlorophyll Fluorescence Detects Photosynthesis Variations and Drought Effects in Tropical Rubber Plantation and Natural Deciduous Forests. Agric. For. Meteorol. 2023, 339, 109591. [Google Scholar] [CrossRef]
  25. Wang, H.; Zhu, Q.; Wang, Y.; Zhang, H. Spatio-Temporal Characteristics and Driving Factors of Flash Drought Recovery: From the Perspective of Soil Moisture and Gpp Changes. Weather Clim. Extrem. 2023, 42, 100605. [Google Scholar] [CrossRef]
  26. Zeng, Z.; Wu, W.; Li, Y.; Huang, C.; Zhang, X.; Peñuelas, J.; Zhang, Y.; Gentine, P.; Li, Z.; Wang, X.; et al. Increasing Meteorological Drought Under Climate Change Reduces Terrestrial Ecosystem Productivity and Carbon Storage. One Earth 2023, 6, 1326–1339. [Google Scholar] [CrossRef]
  27. Fu, Y.; Dong, J.; Shen, R.; Peng, Q.; Li, X.; Zheng, Y.; Pan, B.; Dong, J.; Qiu, B.; Huang, J. A 30-m annual distribution dataset of major crops in China from 2001–2024. Sci. Data 2026. [Google Scholar] [CrossRef] [PubMed]
  28. Sun, J.; Zhang, Q.; Liu, X.; Sun, J.; Chen, L.; Wu, Y.; Hu, B.; Zhang, G. Flash Droughts in a Hotspot Region: Spatiotemporal Patterns, Possible Climatic Drivings and Ecological Impacts. Weather Clim. Extrem. 2024, 45, 100700. [Google Scholar] [CrossRef]
  29. Jiang, L.; Liu, W.; Liu, B.; Yuan, Y.; Bao, A. Monitoring Vegetation Sensitivity to Drought Events in China. Sci. Total Environ. 2023, 893, 164917. [Google Scholar] [CrossRef] [PubMed]
  30. Xiao, C.; Zaehle, S.; Yang, H.; Wigneron, J.; Schmullius, C.; Bastos, A. Land Cover and Management Effects on Ecosystem Resistance to Drought Stress. Earth Syst. Dyn. 2023, 14, 1211–1237. [Google Scholar] [CrossRef]
  31. Zhang, M.; Yuan, X.; Zeng, Z.; Pan, M.; Wu, P.; Xiao, J.; Keenan, T.F. A Pronounced Decline in Northern Vegetation Resistance to Flash Droughts from 2001 to 2022. Nat. Commun. 2025, 16, 2984. [Google Scholar] [CrossRef] [PubMed]
  32. Shi, R.; Liu, Y.; Zhu, Y.; Ren, L.; Liu, Y.; Zhang, X.; Zhang, L. Impact of Flash Droughts on Global Crop Yields Considering Crop Phenology and Irrigation Conditions. Agric. For. Meteorol. 2025, 373, 110763. [Google Scholar] [CrossRef]
  33. Orth, R.; Destouni, G.; Jung, M.; Reichstein, M. Large-Scale Biospheric Drought Response Intensifies Linearly with Drought Duration in Arid Regions. Biogeosciences 2020, 17, 2647–2656. [Google Scholar] [CrossRef]
  34. Wang, Y.; Fu, Z.; Hu, Z.; Niu, S. Tracking Global Patterns of Drought-Induced Productivity Loss Along Severity Gradient. J. Geophys. Res. Biogeosci. 2022, 127, e2021JG006753. [Google Scholar] [CrossRef]
  35. Yin, J.; Gentine, P.; Slater, L.; Gu, L.; Pokhrel, Y.; Hanasaki, N.; Guo, S.; Xiong, L.; Schlenker, W. Future Socio-Ecosystem Productivity Threatened by Compound Drought–Heatwave Events. Nat. Sustain. 2023, 6, 259–272. [Google Scholar] [CrossRef]
  36. Yuan, X.; Wang, L.; Wu, P.; Ji, P.; Sheffield, J.; Zhang, M. Anthropogenic Shift Towards Higher Risk of Flash Drought over China. Nat. Commun. 2019, 10, 4661. [Google Scholar] [CrossRef] [PubMed]
  37. Kim, H.; Crow, W.; Li, X.; Wagner, W.; Hahn, S.; Lakshmi, V. True Global Error Maps for Smap, Smos, and Ascat Soil Moisture Data Based on Machine Learning and Triple Collocation Analysis. Remote Sens. Environ. 2023, 298, 113776. [Google Scholar] [CrossRef]
  38. Chen, J.; Cao, F.; Yin, X.; Huang, M.; Zou, Y. Yield Performance of Early-season Rice Cultivars Grown in the Late Season of Double-Season Crop Production Under Machine-Transplanted Conditions. PLoS ONE 2019, 14, e0213075. [Google Scholar] [PubMed]
  39. Mccoll, K.A.; Vogelzang, J.; Konings, A.G.; Entekhabi, D.; Piles, M.; Stoffelen, A. Extended Triple Collocation: Estimating Errors and Correlation Coefficients with Respect to an Unknown Target. Geophys. Res. Lett. 2014, 41, 6229–6236. [Google Scholar] [CrossRef]
  40. Otkin, A.J.; Svoboda, M.; Hunt, D.E.; Ford, W.T.; Anderson, C.M.; Hain, C.; Basara, B.J. Flash Droughts: A Review and Assessment of the Challenges Imposed by Rapid-Onset Droughts in the United States. Bull. Am. Meteorol. Soc. 2018, 99, 911–919. [Google Scholar] [CrossRef]
  41. Leeper, D.R.; Petersen, B.; Palecki, A.M.; Diamond, H. Exploring the Use of Standardized Soil Moisture as a Drought Indicator. J. Appl. Meteorol. Climatol. 2021, 60, 1021–1033. [Google Scholar] [CrossRef]
  42. Wang, D.; Tan, X.; Wu, X.; Huang, Z.; Deng, S.; Liu, Y.; Fu, J.; Tan, X.; Cai, X.; Liu, B. Dynamic Development of Global Contiguous Flash Droughts: From an Event-Based Spatiotemporal Perspective. J. Hydrol. 2025, 60, 133934. [Google Scholar]
  43. Li, W.; Pacheco-Labrador, J.; Migliavacca, M.; Miralles, D.; Dijke, H.V.; Reichstein, A.; Forkel, M.; Zhang, M.; Frankenberg, W.; Panwar, C. Widespread and Complex Drought Effects on Vegetation Physiology Inferred from Space. Nat. Commun. 2023, 14, 4640. [Google Scholar] [CrossRef] [PubMed]
  44. Lundberg, M.S.; Lee, S.-I. A Unified Approach to Interpreting Model Predictions. In Advances in Neural Information Processing Systems; Curran Associates Inc.: Red Hook, NY, USA, 2017; p. 30. [Google Scholar]
  45. Rusjan, S.; Sapač, K.; Petrič, M.; Lojen, S.; Bezak, N. Identifying the Hydrological Behavior of a Complex Karst System Using Stable Isotopes. J. Hydrol. 2019, 577, 123956. [Google Scholar] [CrossRef]
  46. Cui, Y.; Zhang, B.; Huang, H.; Zeng, J.; Wang, X.; Jiao, W. Spatiotemporal Characteristics of Drought in the North China Plain over the Past 58 Years. Atmosphere 2021, 12, 844. [Google Scholar] [CrossRef]
  47. Jiang, L.; Gao, W.; Zhu, K.; Zheng, J.; Ren, B. Why Did the Extreme Drought in the Yangtze River Basin in 2022 Break the 2019 Record? Earth Space Sci. 2025, 12, e2024EA003972. [Google Scholar] [CrossRef]
  48. Jing, Y.; Wang, S.; Chan, P.W.; Yang, Z. Gross Primary Productivity Is More Sensitive to Accelerated Flash Droughts. Commun. Earth Environ. 2025, 6, 2649–2660. [Google Scholar] [CrossRef]
  49. Jia, Q.; Liu, Z.; Guo, C.; Wang, Y.; Yang, J.; Yu, Q.; Wang, J.; Zheng, F.; Lu, X. Relationship Between Photosynthetic CO2 Assimilation and Chlorophyll Fluorescence for Winter Wheat Under Water Stress. Plants 2023, 12, 3365. [Google Scholar] [CrossRef] [PubMed]
  50. Beauclaire, Q.; Heinesch, B.; Longdoz, B. Non-Stomatal Processes are Responsible for the Decrease in Gross Primary Production of a Potato Crop During Edaphic Drought. Agric. For. Meteorol. 2023, 343, 109782. [Google Scholar] [CrossRef]
  51. Hassan, A.M.; Dahu, N.; Hongning, T.; Qian, Z.; Yueming, Y.; Yiru, L.; Shimei, W. Drought Stress in Rice: Morpho-Physiological and Molecular Responses and Marker-Assisted Breeding. Front. Plant Sci. 2023, 14, 1215371. [Google Scholar] [PubMed]
  52. Adil, M.; Zhang, S.; Wang, J.; Shah, N.A.; Tanveer, M.; Fiaz, S. Effects of Fallow Management Practices on Soil Water, Crop Yield and Water Use Efficiency in Winter Wheat Monoculture System: A Meta-Analysis. Front. Plant Sci. 2022, 13, 825309. [Google Scholar] [CrossRef] [PubMed]
  53. Ma, Y.; Tang, M.; Wang, M.; Yu, Y.; Ruan, B. Advances in Understanding Drought Stress Responses in Rice: Molecular Mechanisms of Aba Signaling and Breeding Prospects. Genes 2024, 15, 1529. [Google Scholar] [CrossRef] [PubMed]
  54. Yuan, X.; Wang, Y.; Zhou, S.; Li, H.; Li, C. Multiscale Causes of the 2022 Yangtze Mega-Flash Drought Under Climate Change. Sci. China Earth Sci. 2024, 67, 2649–2660. [Google Scholar] [CrossRef]
  55. Gao, Y.; Hu, T.; Wang, Q.; Yuan, H.; Yang, J. Effect of Drought–Flood Abrupt Alternation on Rice Yield and Yield Components. Crop Sci. 2019, 59, 280–292. [Google Scholar] [CrossRef]
  56. Muñoz-Sabater, J.; Dutra, E.; Agustí-Panareda, A.; Albergel, C.; Arduini, G.; Balsamo, G.; Boussetta, S.; Choulga, M.; Harrigan, S.; Hersbach, H.; et al. Era5-land: A State-of-the-art Global Reanalysis Dataset for Land Applications. Earth Syst. Sci. Data 2021, 13, 4349–4383. [Google Scholar]
  57. Martens, B.; Miralles, D.G.; Lievens, H.; van der Schalie, R.; de Jeu, R.A.M.; Fernández-Prieto, D.; Beck, H.E.; Dorigo, W.A.; Verhoest, N.E.C. Gleam V3: Satellite-based Land Evaporation and Root-zone Soil Moisture. Geosci. Model Dev. 2017, 10, 1903–1925. [Google Scholar]
  58. Li, Q.; Shi, G.; Shangguan, W.; Nourani, V.; Li, J.; Li, L.; Huang, F.; Zhang, Y.; Wang, C.; Wang, D.; et al. A 1 Km Daily Soil Moisture Dataset Over China Using in Situ Measurement and Machine Learning. Earth Syst. Sci. Data 2022, 14, 5267–5286. [Google Scholar] [CrossRef]
  59. Hersbach, H.; Bell, B.; Berrisford, P.; Hirahara, S.; Horányi, A.; Muñoz-Sabater, J.; Nicolas, J.; Peubey, C.; Radu, R.; Schepers, D.; et al. The Era5 Global Reanalysis. Q. J. R. Meteorol. Soc. 2020, 146, 1999–2049. [Google Scholar] [CrossRef]
  60. Li, X.; Xiao, J. Mapping Photosynthesis Solely from Solar-Induced Chlorophyll Fluorescence: A Global, Fine-Resolution Dataset of Gross Primary Production Derived from OCO-2. Remote Sens. 2019, 11, 2563. [Google Scholar] [CrossRef]
  61. Yang, J.; Huang, X. The 30 M Annual Land Cover Dataset and Its Dynamics in China from 1990 to 2019. Earth Syst. Sci. Data 2021, 13, 3907–3925. [Google Scholar] [CrossRef]
  62. Li, X.; Xiao, J. A global, 0.05-degree product of solar-induced chlorophyll fluorescence derived from OCO-2, MODIS, and reanalysis data. Remote Sens. 2019, 11, 517. [Google Scholar] [CrossRef]
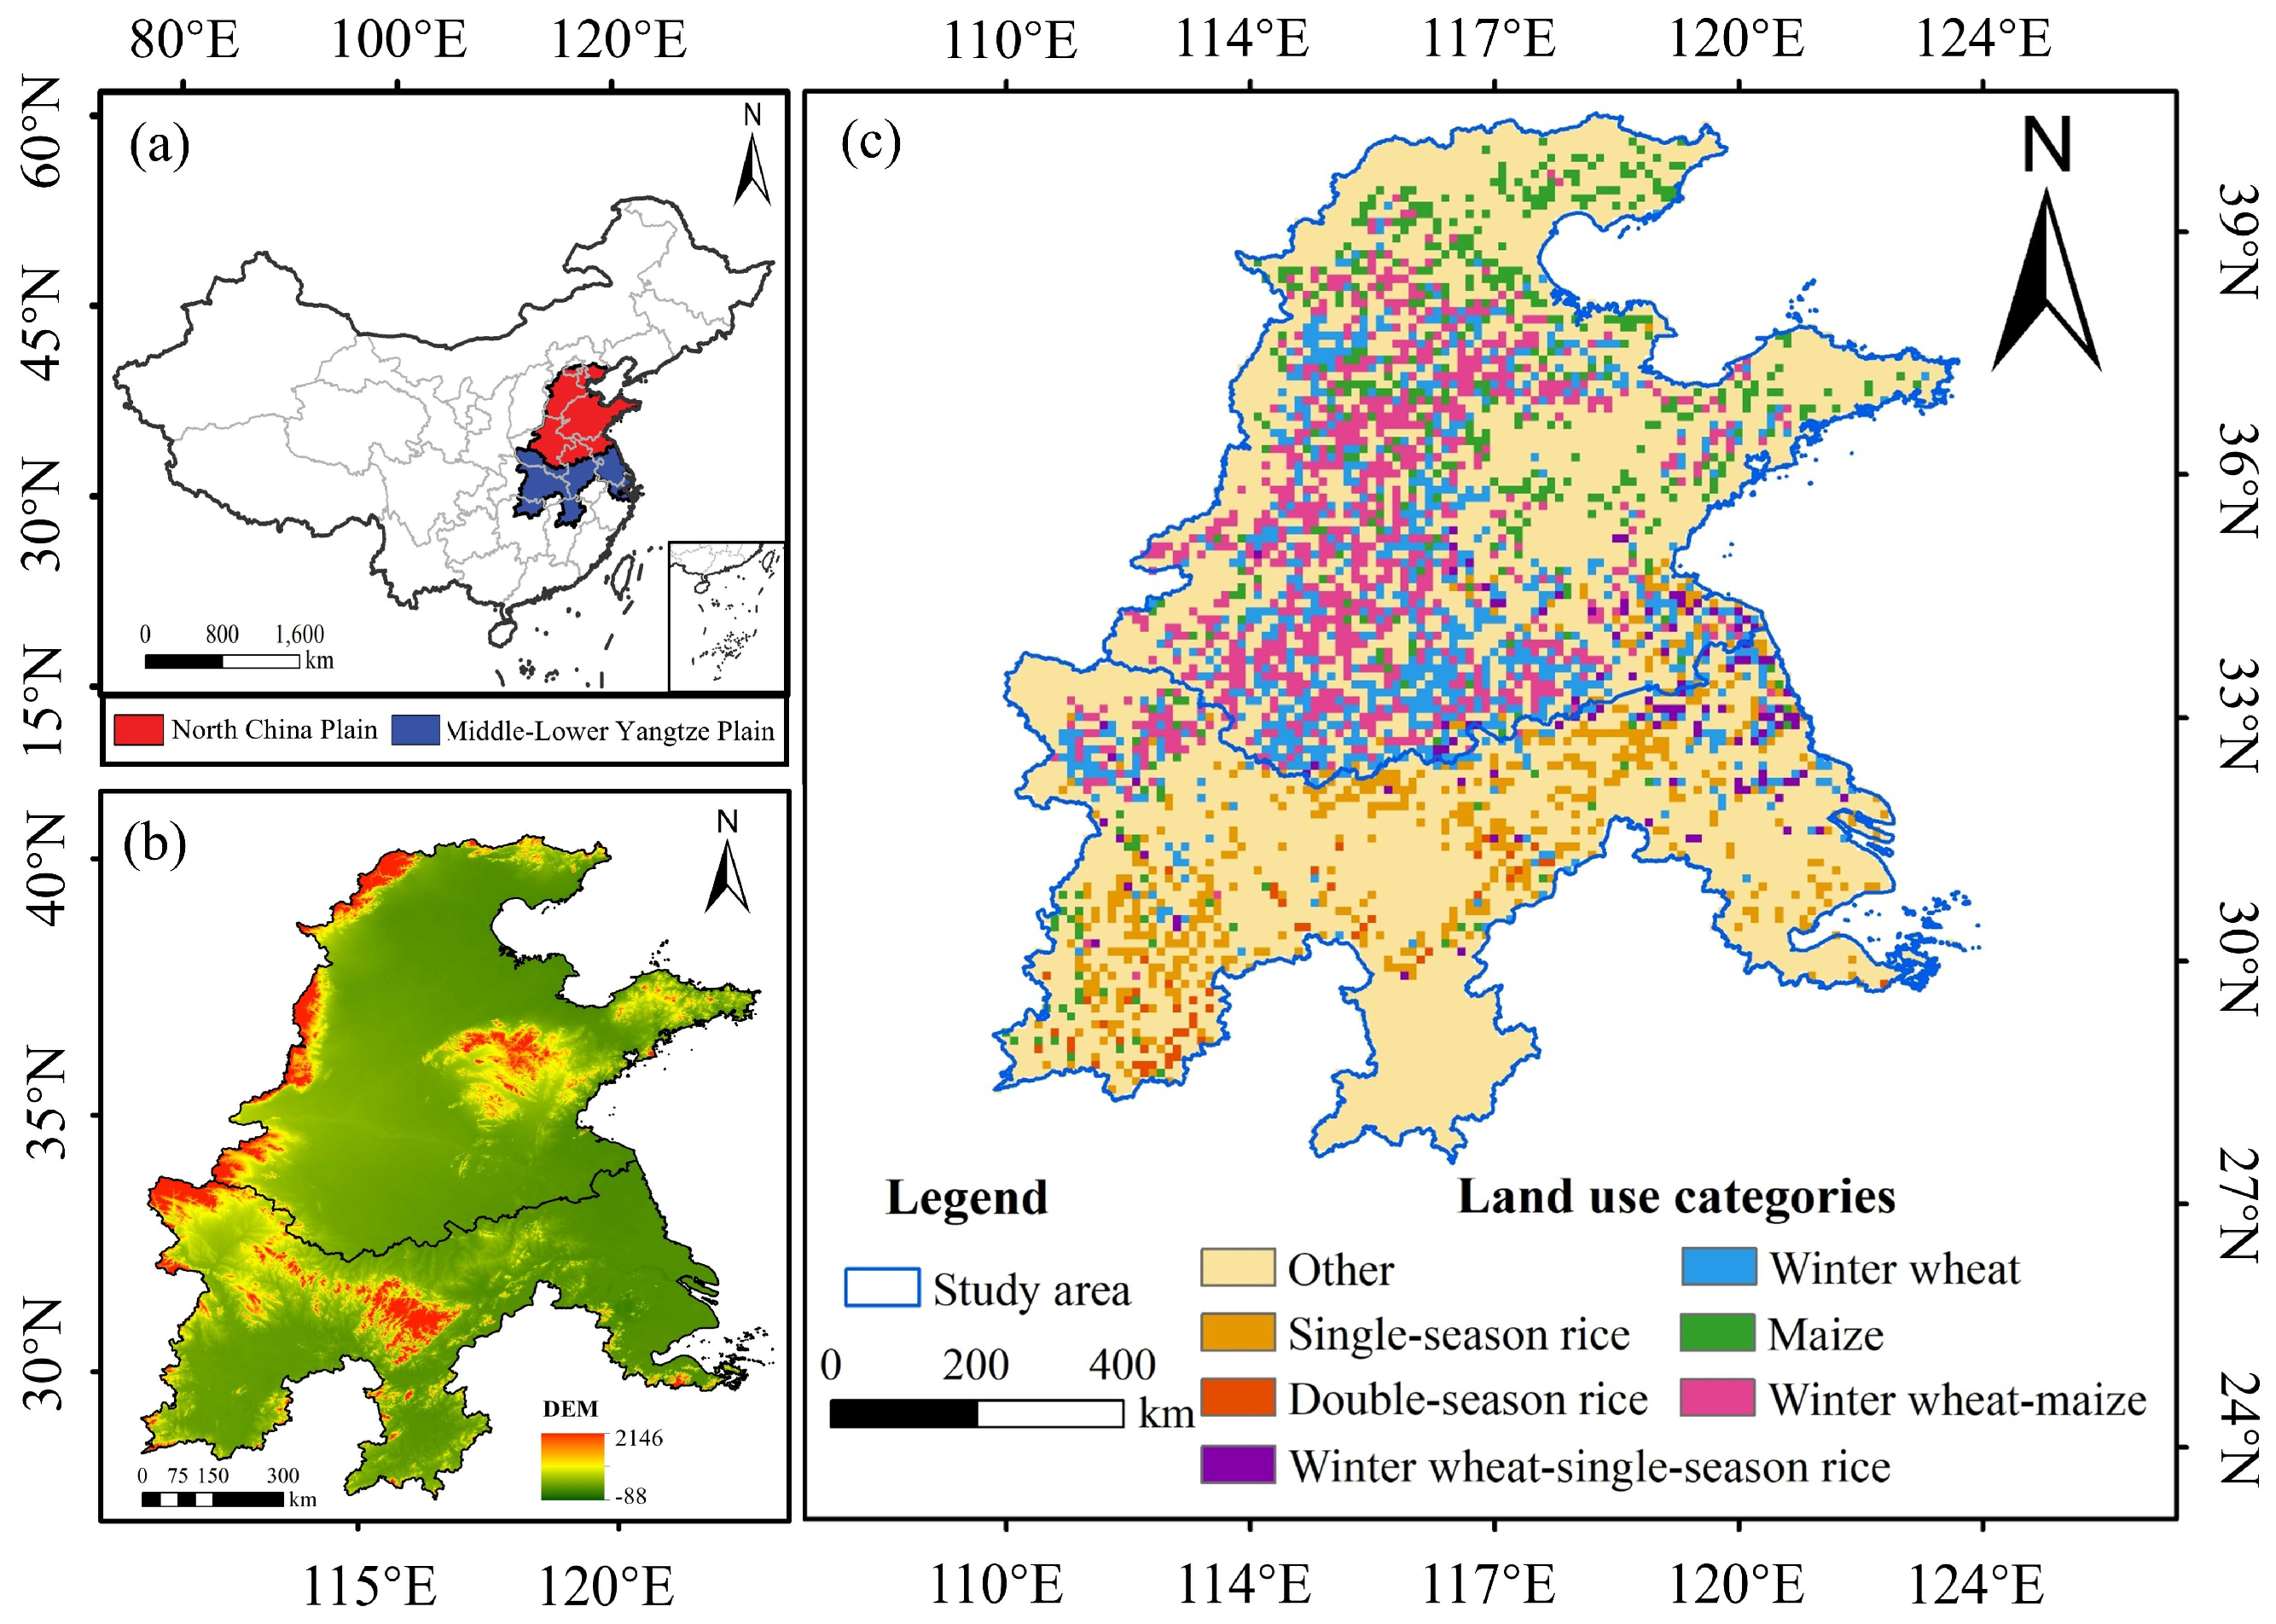
Figure 1. Geographical location of the study area (a), digital elevation model (b) and spatial distribution of land-use types (c).
Remotesensing 18 02295 g001
Figure 2. Workflow for multi-dataset integration and uncertainty assessment based on triple collocation analysis.
Remotesensing 18 02295 g002
Figure 3. Workflow for identifying and tracking flash drought events based on soil moisture percentiles and spatiotemporal connectivity.
Remotesensing 18 02295 g003
Figure 4. Workflow for SIF/GPP response analysis.
Remotesensing 18 02295 g004
Figure 5. Flowchart of the random forest versus the SHAP interpretation method.
Remotesensing 18 02295 g005
Figure 6. Spatial distribution of total number (a), average duration (b), average intensity (c) and average development rate (d) of sudden drought events in the study area from 2001 to 2024.
Remotesensing 18 02295 g006
Figure 7. Boxplots of spatial distribution characteristics of flash droughts for different crops. Total number of flash drought events (a), average duration (b), average intensity (c) and average development rate (d).
Remotesensing 18 02295 g007
Figure 8. Trajectories of the spatiotemporal centroid of flash droughts in two typical years (2019 and 2022). The left and right panels show the movement paths for 2019 (a) and 2022 (b), respectively. Lines represent trajectories for different months, with green dot/triangle and red triangle indicating the starting and ending points of each monthly centroid. The shaded areas highlight the trajectory regions.
Remotesensing 18 02295 g008
Figure 9. Average response time of SIF (a) and GPP (b) to flash droughts.
Remotesensing 18 02295 g009
Figure 10. Mean and probability distribution of response time to flash droughts for different vegetation types.
Remotesensing 18 02295 g010
Figure 11. Polar SHAP integrated interpretation of drought drivers for SIF and GPP recovery. Note: The plot compares the importance and impact of drought characteristics on SIF (left) and GPP (right) recovery. Petal Length: Represents the mean absolute SHAP value, indicating global feature importance. Beeswarm Scatters: Each dot represents a sample; radial position indicates the SHAP value (contribution), and color indicates the feature value (Low to High). Variables: DC (decline rate), Dur (duration), Spd (development speed), Sev (severity), Lat (latitude), and Month.
Remotesensing 18 02295 g011
Figure 12. SHAP Values for Crop Photosynthesis against DC, Colored by Month. Note: This scatter plot illustrates the relationship between DC and SHAP values, with points colored by month (1–12, see color bar). The left and right columns correspond to the GPP and SIF photosynthetic indicators, respectively. Each row represents a different cropping system (SSR, DSR, WW, M, WW-SSR, WW-M). The horizontal axis denotes the DC value (representing the decline rate of vegetation productivity), and the vertical axis denotes the SHAP value (reflecting the magnitude of influence on recovery capacity).
Remotesensing 18 02295 g012
Figure 13. Schematic diagram of the physiological mechanisms underlying the differential responses of SIF and GPP to flash drought.
Remotesensing 18 02295 g013
Table 1. Detailed Information of the Employed Data.
ProductSpatial
Coverage
Temporal CoverageResolutionData Source
ERA5-LandGlobal1950–present1 day/ 0.1 ° https://cds.climate.copernicus.eu/cdsapp#!/dataset/reanalysis-era5-land?tab=overview (accessed on 20 July 2025)
GLEAM v4.2Global1980–20241 day/ 0.1 ° https://www.gleam.eu/ (accessed on 20 July 2025)
SMCI1.0China2000–20221 day/ 0.09 ° https://data.tpdc.ac.cn/ (accessed on 20 July 2025)
GOSIFGlobal2000–20248 day/ 0.05 ° https://globalecology.unh.edu/data/GOSIF.html (accessed on 16 August 2025)
GOSIF GPPGlobal2000–20248 day/ 0.05 ° https://globalecology.unh.edu/data/GOSIF-GPP.html (accessed on 16 August 2025)
CCDChina2001–20241 year/30 mhttps://www.scidb.cn/en/detail?dataSetId=9df1ab40944b4ce58eec7265462b4247&version=V1&code=o00119 (accessed on 16 August 2025)
Disclaimer/Publisher’s Note: The statements, opinions and data contained in all publications are solely those of the individual author(s) and contributor(s) and not of MDPI and/or the editor(s). MDPI and/or the editor(s) disclaim responsibility for any injury to people or property resulting from any ideas, methods, instructions or products referred to in the content.