


Highlights
What are the main findings?
- We propose VODet, a novel vertex offset-based oriented object detection framework that integrates a coupled vertex offset representation, a lightweight direction classifier, a hierarchical special attention model (HSAM), and a task-specific matching rule with MPDIoU loss.
- Our method achieves competitive performance on three widely used remote sensing benchmarks (DOTA-v1.0, HRSC2016, and UCAS-AOD), with particular advantages for objects of large aspect ratios and dense arrangements.
What are the implications of the main findings?
- The proposed coupled vertex offset paradigm offers a new perspective for oriented object detection by fundamentally avoiding the boundary discontinuity problem inherent in angle-based representations.
- This framework provides a practical and generalizable solution for high-precision detection of arbitrarily oriented objects, supporting applications such as urban planning, maritime surveillance, and disaster monitoring.
Abstract
To tackle the challenges in oriented object detection, such as discontinuous angle regression, low precision in discrete classification, and high complexity in probabilistic modeling, this paper proposes VODet (Vertex Offset-based Detector), a novel oriented object detection method. VODet models the geometric structure of rotated objects through a coupled vertex offset mechanism, inherently avoiding boundary discontinuity. Specifically, it first regresses the horizontal enclosing rectangle of a target from horizontal anchors, then predicts only two offset ratios to reconstruct the four vertices of the rotated bounding box. For near-horizontal critical cases, a lightweight direction classifier adaptively distinguishes horizontal boxes from rotated ones, reducing regression complexity and improving robustness. To further enhance feature representation, we design a hierarchical special attention model (HSAM) based on Swin Transformer blocks, which effectively captures both local details and global contextual dependencies. Extensive experiments on DOTA, HRSC2016, and UCAS-AOD demonstrate that VODet achieves competitive detection accuracy (80.44% mAP on DOTA, 90.42% AP on HRSC2016, and 90.11% mAP on UCAS-AOD), with particular advantages for objects of large aspect ratios and dense arrangements. Moreover, VODet achieves the highest inference speed (26.7 FPS) and the lowest computational complexity (192.3 GFLOPs) among the compared methods, demonstrating a favorable accuracy-efficiency trade-off. These results confirm the effectiveness and practical value of the proposed method.
1. Introduction
Satellite and aerial remote sensing advances have promoted their widespread use in urban planning, resource exploration, environmental monitoring, and national defense security [1,2,3]. Efficient and accurate object extraction from remote sensing imagery remains a central challenge in this field. Traditional detectors are mostly designed for horizontal bounding boxes (HBBs) [4,5,6]. Targets in remote sensing imagery, however, are often characterized by arbitrary orientations, dense arrangements, and large aspect ratios [7,8]. In such cases, HBB-based methods are prone to incorrectly suppressing valid detection boxes during the NMS process due to excessively high IoU between neighboring boxes, which results in missed detections.
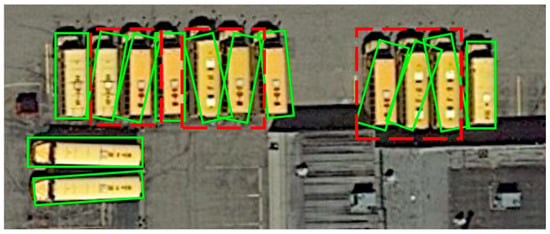
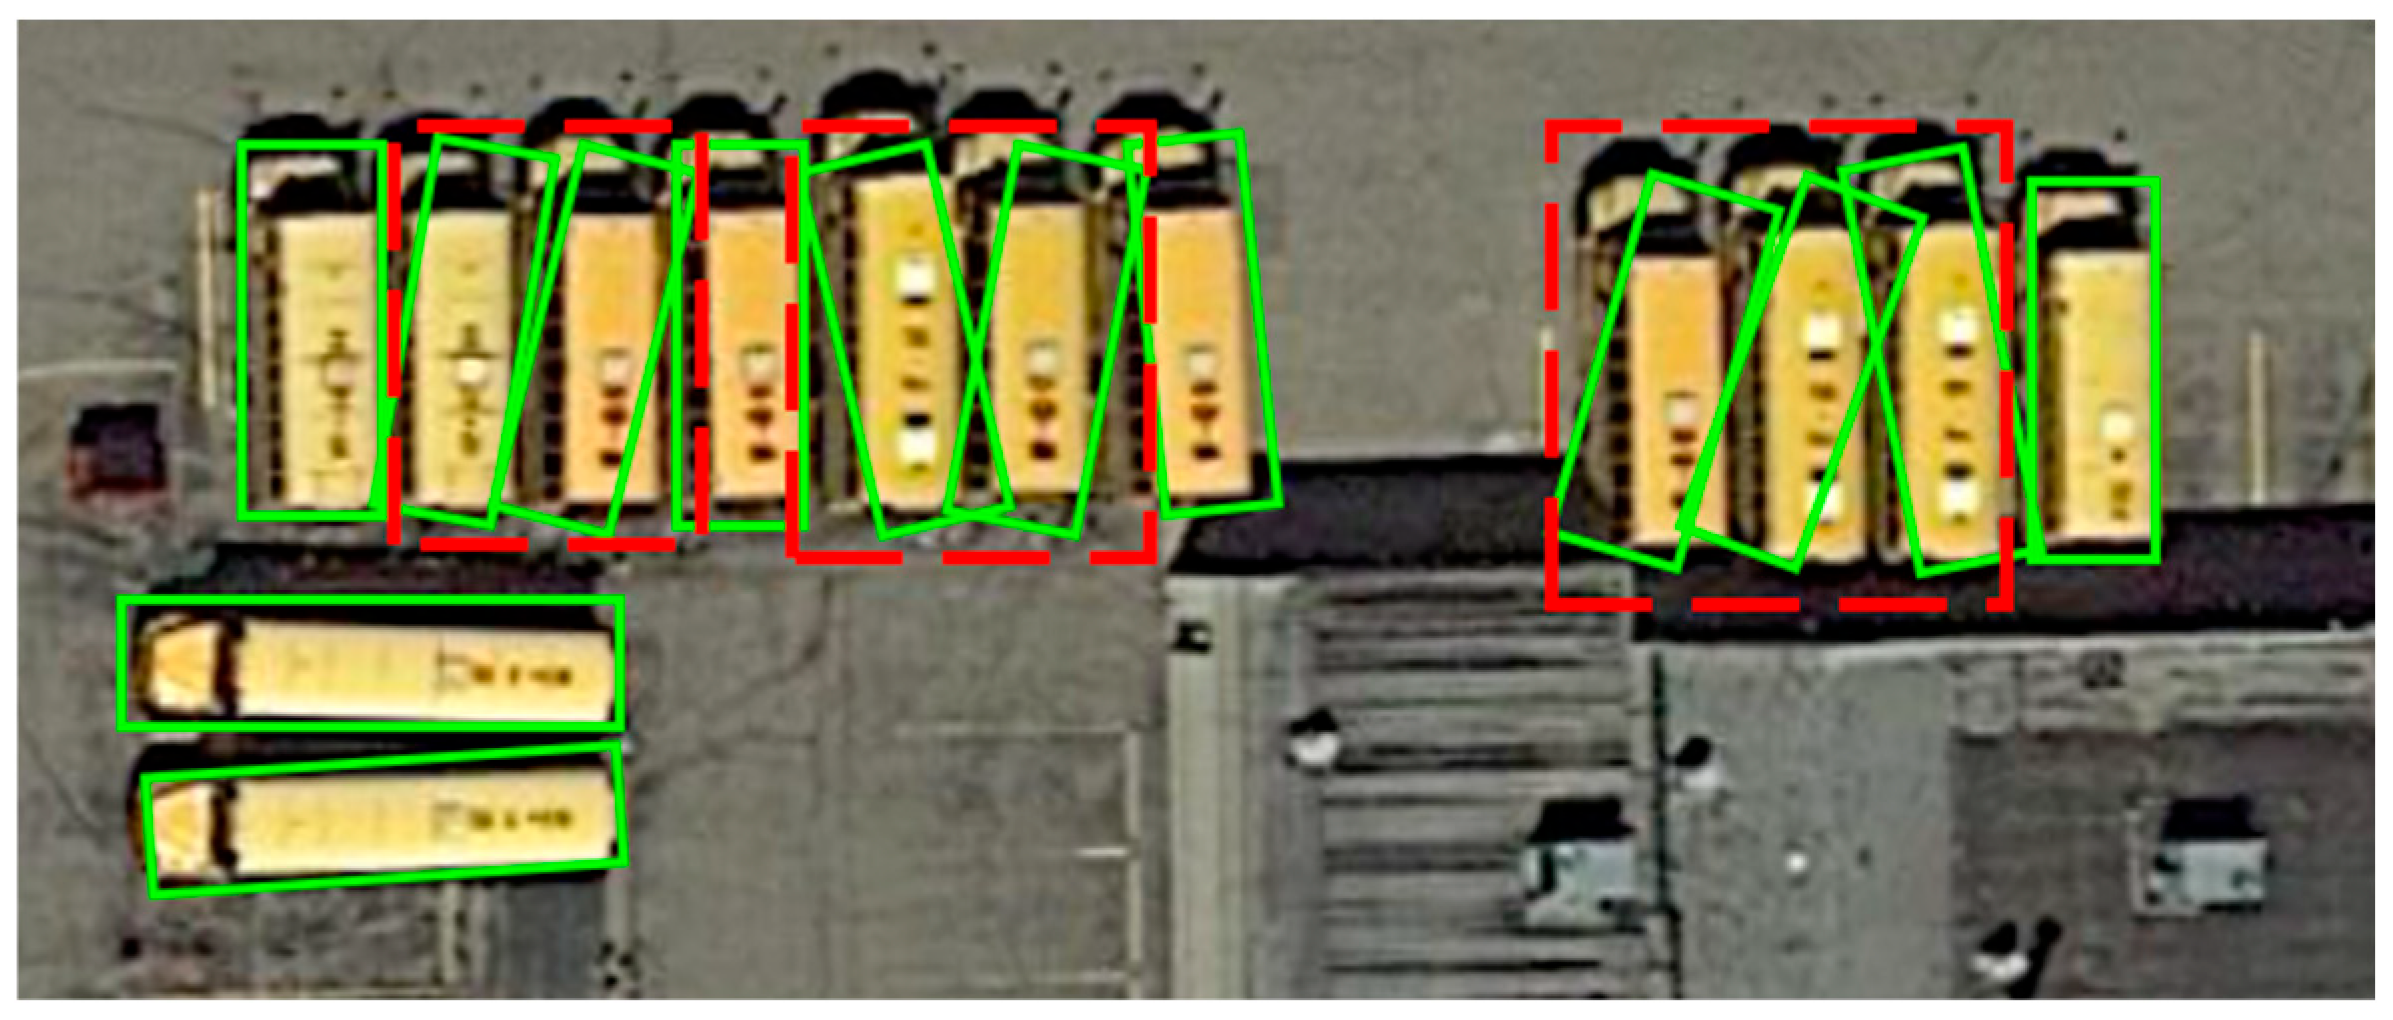
To address these limitations, numerous oriented object detection methods have been developed, which construct oriented bounding boxes (OBBs) by introducing a rotation angle [9,10,11]. The five-parameter representation (x, y, w, h, θ) is commonly adopted, where (x, y) is the center, w and h the dimensions, and θ the rotation. Although such approaches have achieved improvements in certain scenarios, the periodic nature of the rotation angle leads to an inherent contradiction in the regression process. Taking the widely used long-side definition method as an example [12], the angle θ belongs to [−π/2, π/2). When the target angle approaches the critical point of the definition domain, minor geometric differences can cause a sudden jump in the angle value [7,13], thereby hindering smooth regression losses from accurately capturing the geometric similarity between prediction and ground truth. This issue is particularly pronounced in the detection of targets with large aspect ratios, severely limiting detection accuracy. Figure 1 shows the detection results of a large truck under boundary conditions using the five-parameter method. It can be observed that among the 11 predicted boxes whose ground-truth angles are close to −π/2, 7 boxes exhibit significant deviations in angle prediction. This issue arises because the angular parameter θ is defined within the periodic interval [−π/2, π/2). When the ground-truth angle of a target approaches this domain boundary, directly applying Smooth L1 loss for regression can cause the angle value to undergo a periodic jump due to minor angular variations—for example, leaping from −π/2 to π/2. This results in a discontinuous and drastic change in the loss value. Such discontinuity in the loss function severely impedes the network’s ability to effectively learn targets with boundary angles, i.e., those where θ ≈ ±π/2.
Figure 1.
Detection failure of the five-parameter method near the angle boundary. The red dashed boxes indicate targets with ground-truth angles close to −π/2. While their centers, widths, and heights are predicted accurately, the angle predictions show significant deviations.
Existing approaches to address angle discontinuity can be grouped into three categories, each with distinct limitations. First, converting angle prediction into a classification task [13,14,15] mitigates boundary jumps but suffers from limited precision due to discretization, making it difficult to meet the stringent accuracy requirements for large aspect ratio targets. Moreover, introducing a classification head significantly increases model complexity. Second, methods based on probability distributions [16,17,18] represent the rotated box as a 2D Gaussian distribution, transforming the bounding box matching problem into a distribution similarity measure, thereby better circumventing angle discontinuity. However, computing distribution similarity has high complexity, and the loss function lacks intuitive geometric interpretability. Third, feature design-based methods [19,20,21,22] aim to achieve rotation invariance by enhancing feature representation and decoupling it from target orientation via spatial transformation and alignment. While these methods improve rotation modeling capability, they significantly increase network depth, parameter count, and computational cost, reducing efficiency. Recently, methods based on vertex sliding or vertex offset mechanisms [23,24,25], which define orientation by directly modeling the geometric vertices of the target, have shown considerable potential in oriented object detection by better avoiding the periodicity issues of angle regression. While existing vertex offset methods have alleviated angular periodicity, they typically suffer from three major limitations: (1) geometric constraint violations among multiple independently regressed vertices, (2) increased regression complexity for near-horizontal objects, and (3) insufficient multi-scale feature representation for small and densely arranged targets.
To overcome these limitations, this paper proposes VODet, a vertex offset-based framework that introduces a novel coupled vertex offset representation, a lightweight direction classifier specifically designed for near-horizontal critical cases, an enhanced backbone integrating the proposed hierarchical special attention model (HSAM) with FPN, and a task-specific matching rule with Minimum Points Distance Intersection over Union (MPDIoU) loss. This integrated design achieves both high precision and robust detection performance. In our experiments, VODet achieves the highest accuracy among single-stage methods and the best efficiency among all compared methods, offering a favorable accuracy-efficiency trade-off. The key contributions of this paper are:
- We propose a continuous coupled vertex offset representation, which regresses only two offset ratios relative to the horizontal enclosing box to reconstruct the rotated bounding box, thereby enforcing geometric consistency and avoiding boundary discontinuity.
- We introduce a lightweight direction classifier that dynamically distinguishes horizontal from rotated boxes in near-horizontal cases, thereby converting challenging regression into stable classification and improving robustness with minimal cost.
- We design an enhanced backbone with the proposed HSAM and FPN. Built on ResNet-101, it strengthens key region representation and multi-scale features, thereby leading to better detection of small and densely arranged objects.
- We develop a task-specific matching rule with size and position constraints for high-quality anchor assignment and adopt MPDIoU loss to minimize corner distances, thereby producing more accurate horizontal boxes and boosting overall localization accuracy.
In addition to the above detection methods, the quality of remote sensing images is often degraded by adverse imaging conditions such as haze, cloud cover, and nighttime low-light environments. Recent advances in image restoration techniques, including the Bayesian-based fractional-order variational model for nighttime dehazing [26], the NGSCD model for glow suppression [27], as well as IHDCP [28] and VNDHR [29] for single-image dehazing, have shown promise in recovering high-quality images from degraded inputs. In this work, we focus on the detection problem under standard imaging conditions, while considering that robustness to degraded conditions is an important direction for future investigation.
Early rotated object detectors were built upon horizontal detection frameworks by incorporating an additional rotation angle θ, yielding the five-parameter representation (x, y, w, h, θ). As an example, RRPN [10] designed rotated anchors with angular priors, treating the angular difference between anchors and target boxes as a regression target and optimizing the angle using smooth-L1 loss. SCRDet [7] also regressed angular offsets based on five parameters, employing a smooth L1 loss function that incorporates an IoU constant factor to alleviate the boundary discontinuity caused by angle periodicity. R3Det [8] further introduced an approximate SkewIoU loss to address the challenge of angle periodicity, combined with a feature refinement module for progressive optimization of angle parameters. Although these methods have alleviated the periodic jump phenomenon, they have not fundamentally resolved the discontinuity and instability inherent in angular representation.
Typical methods based on angle classification include CSL [13] and DCL [12]. CSL divides the angle into discrete categories and introduces a circular smooth label for each angle to mitigate semantic jumps between adjacent angle categories. DCL proposes a densely coded label, representing angles with shorter code lengths using binary or Gray codes to reduce model parameters. However, discrete angle prediction suffers from coarse discretization, hindering its ability to meet the precision required for large aspect ratio targets (e.g., ships and trucks). Furthermore, converting continuous rotation angle prediction into a discrete classification task significantly increases model parameters and computational complexity, leading to reduced training efficiency.
Methods based on probability distribution transform rotated boxes into 2D Gaussian distributions, optimizing bounding box parameters indirectly by measuring distribution differences. For instance, GWD Loss [16] employs the Wasserstein distance to quantify the discrepancy of two Gaussian distributions, while KLD Loss [17] adopts KL divergence as the regression loss and introduces a gradient coupling scheme that adaptively adjusts the optimization process according to the target’s aspect ratio, improving detection accuracy for angle-sensitive targets. However, the loss computation in these methods involves complex matrix operations. Additionally, approximating rectangular bounding boxes with Gaussian distributions introduces inherent geometric representation errors, limiting localization accuracy and efficiency.
In feature design-based methods, RoI Transformer [19] first converts horizontal region proposals into rotated regions, then performs rotation transformation and alignment on the feature map based on these rotated regions to extract rotation-invariant features independent of target orientation. ReDet [20] starts from the feature level, extracting rotation-equivariant features through equivariant convolution and enhancing orientation robustness with rotation-invariant RoI Align. While these methods improve rotation modeling, they significantly increase network depth and parameters, slowing inference and limiting real-time applicability.
The vertex offset mechanism has recently gained attention for directly modeling target vertex geometry, thereby circumventing the inherent drawbacks of angle parameterization. Oriented R-CNN [24] uses horizontal anchors as a reference, generating parallelogram candidate boxes by predicting the offsets (∆α, ∆β) of the center point and the enclosing box’s position and size (x, y, w, h), which are then decoded into rotated rectangles. However, numerical errors may be introduced during the decoding from parallelogram to rotated rectangle, causing box deformation. Moreover, it does not consider boundary issues in angle regression, leading to prediction ambiguity when the target orientation is near the angle boundary, affecting the detection stability of strongly directional targets like ships and vehicles.
Gliding Vertex [23] uses the horizontal enclosing rectangle as a reference box, regressing the sliding ratios of vertices on its four edges to reconstruct the rotated box through geometric constraints. However, this method requires independently predicting four offset coefficients, which can violate spatial coupling constraints and lead to distorted predicted boxes. Additionally, the nonlinear relationship between sliding ratios and pixel coordinates increases regression difficulty, especially for endpoints of long-edge targets like runways.
BBAVectors [25] adopts a vector-based vertex offset mechanism for rotated object detection. It detects the object’s center point and regresses boundary-aware vectors emanating from this center toward the four edges, with vertex coordinates ultimately synthesized from these vectors. However, this method heavily relies on the initial center point localization accuracy and requires regressing multiple vectors and external size parameters for each target, making the regression targets relatively complex. In dense or cluttered scenes, this increases the model’s learning and convergence difficulty.
Gliding Vertex [23] regresses four independent sliding ratios, which may violate geometric constraints. In contrast, VODet regresses only two coupled offsets, enforcing geometric consistency. BBAVectors [25] regresses multiple boundary-aware vectors from the center point, increasing regression complexity, while VODet directly regresses vertex offsets from the HBB corners. Oriented R-CNN [24] decodes parallelogram proposals into rotated boxes, which may introduce numerical errors and extra costs, whereas VODet directly reconstructs OBB vertices via a deterministic formulation. In addition, VODet introduces a Direction Classifier for near-horizontal cases and an HSAM for enhanced feature representation. These components, together with the coupled offset formulation, distinguish VODet from prior vertex-based methods.
Although existing research validates the effectiveness of the vertex offset mechanism, three major challenges remain:
- The geometric constraints between multiple independently regressed offsets are often neglected, resulting in distorted box predictions and boundary discontinuity.
- The regression complexity increases significantly for near-horizontal objects, where offset values become extremal and difficult to predict accurately.
- Most existing methods lack sufficient multi-scale feature representation, limiting their performance on small and densely arranged targets.
To address these limitations, we propose VODet, which introduces a coupled vertex offset representation, a lightweight direction classifier, an enhanced backbone with attention and FPN, and a task-specific matching rule with MPDIoU loss for precise and robust oriented object detection.
2. Materials and Methods
2.1. Oriented Object Detection Network
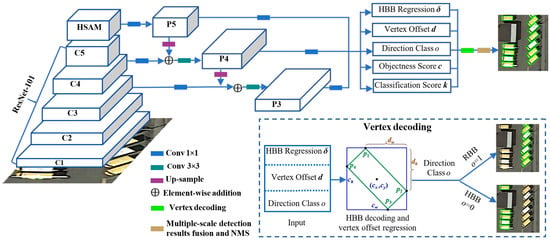
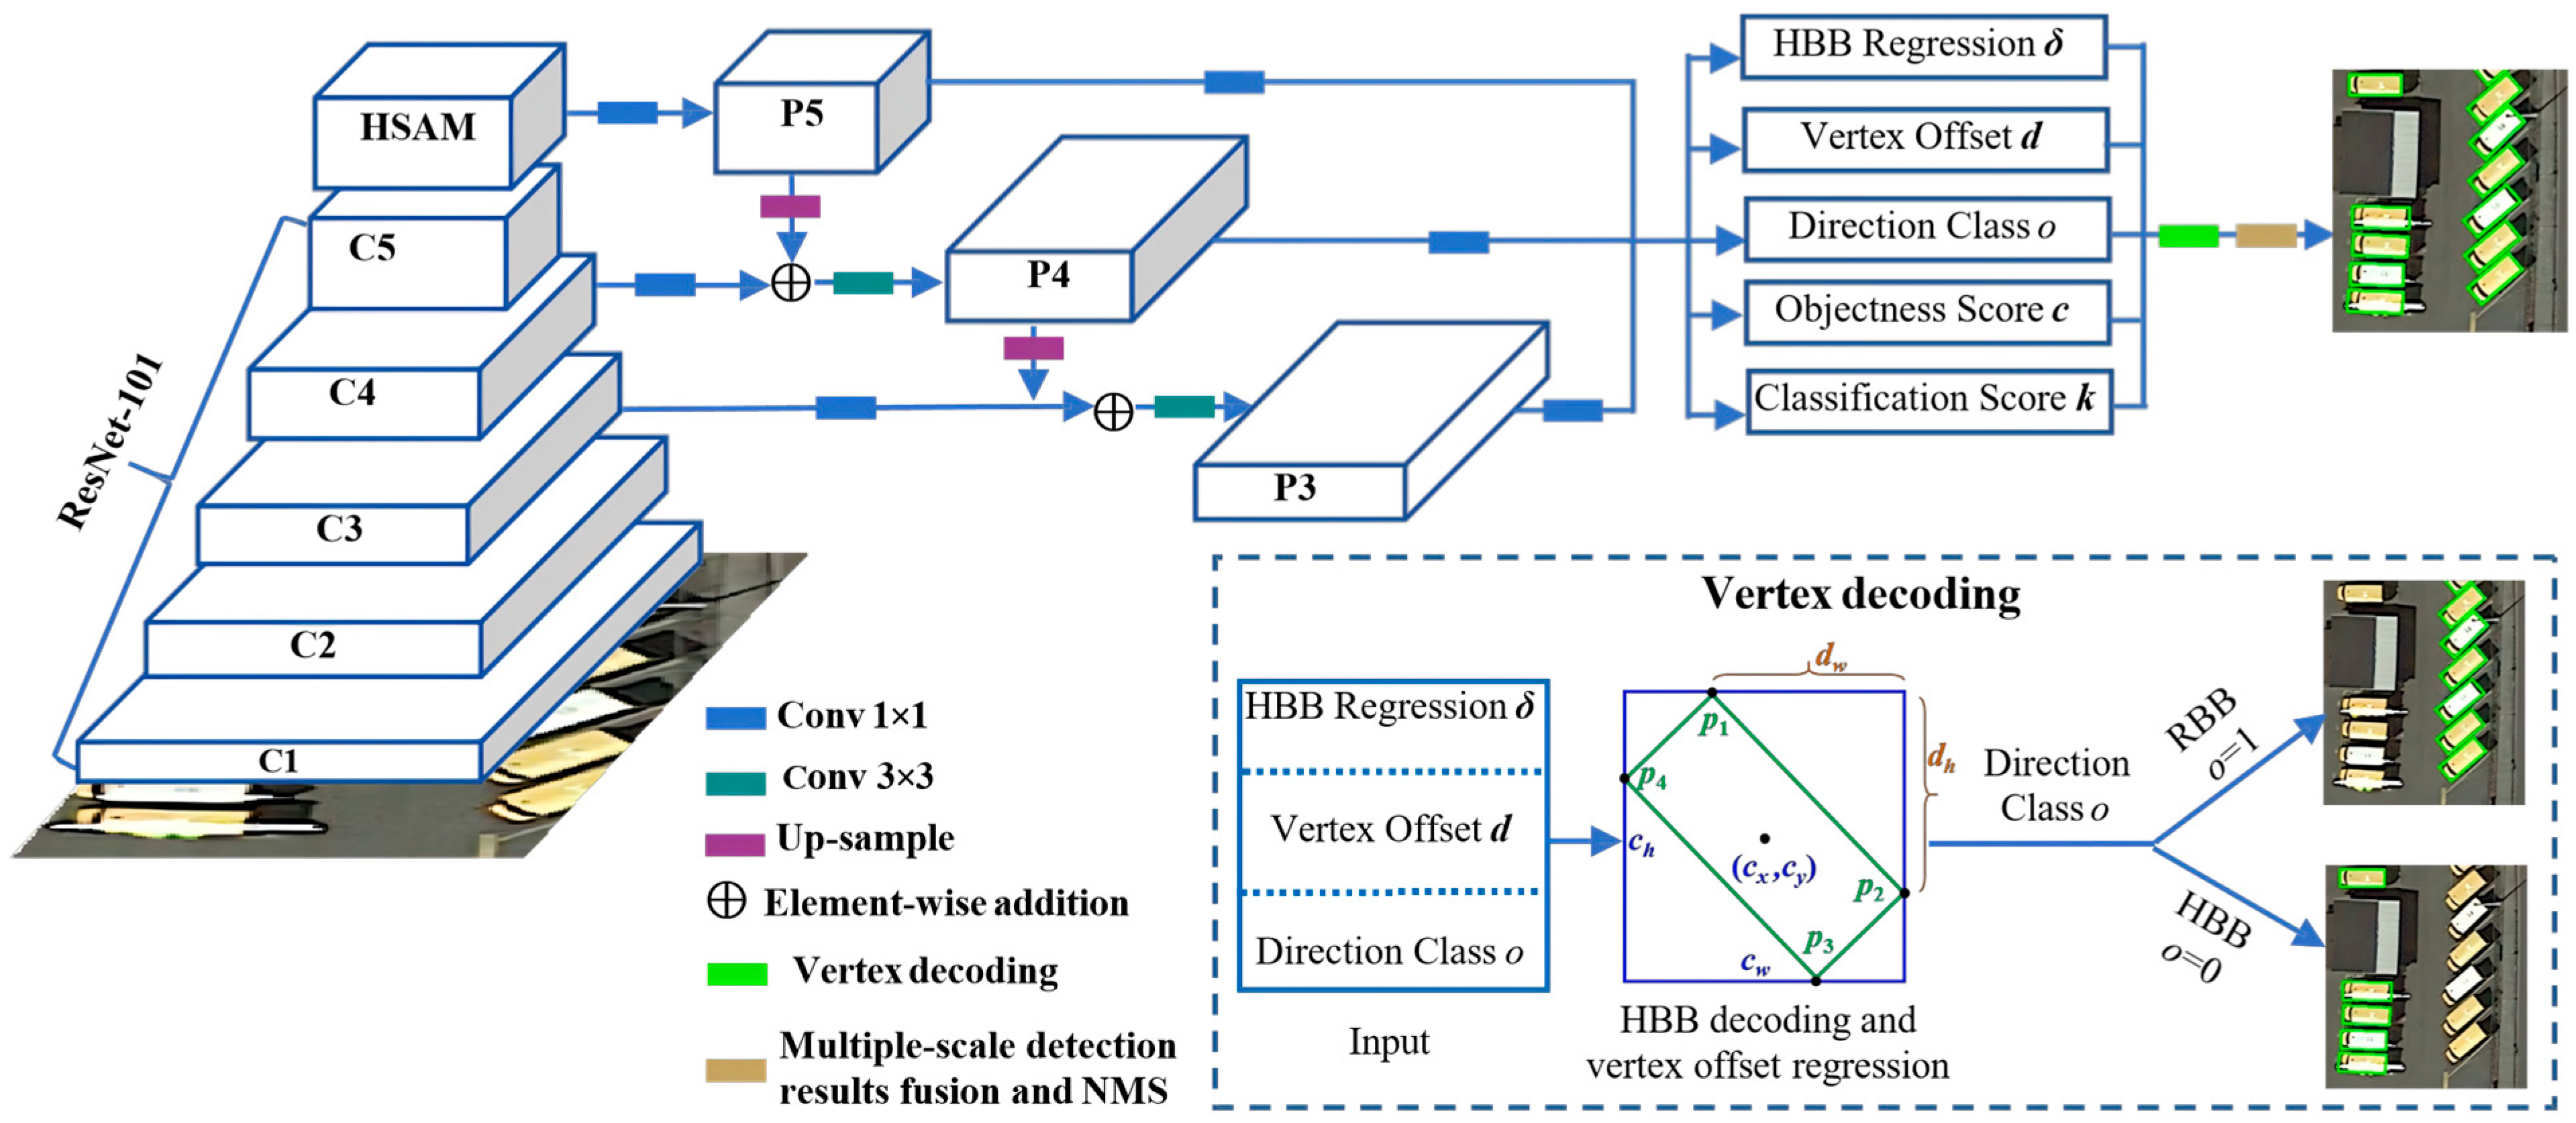
As illustrated in Figure 2, VODet adopts ResNet-101 as its backbone, with all weights from conv1 to conv5_x retained. To strengthen feature modeling, we integrate the proposed HSAM after the C5 (output of conv5_x). HSAM enhances the information representation of key regions and suppresses background noise in the feature map through a hierarchical window-based self-attention mechanism. A detailed description of HSAM is provided in Section 3.2.
Figure 2.
Overall architecture of VODet. The backbone with HSAM and FPN extracts multi-scale features (P3-P5). The detection head outputs five branches: HBB Regression (δ), Vertex Offset (d), Objectness Score (c), Classification Score (k), and Direction Class (o). The dashed box illustrates the Vertex Decoding process: δ is decoded into the HBB; the vertex offset d is regressed to compute the actual offset distances (dw, dh), and the direction class o determines whether to output the reconstructed RBB or directly output the HBB. Finally, NMS produces the final detection results.
Subsequently, a set of pyramidal features is constructed utilizing the FPN [30] architecture. First, a 1 × 1 convolution is applied to the output of HSAM to generate P5. Subsequently, P5 is upsampled and added to C4, which has been reduced in dimension via a 1 × 1 convolution, after which a 3 × 3 convolution is applied to produce P4. Similarly, P4 is upsampled again and added to the dimension-reduced C3, then smoothed to obtain P3.
The model performs detection on three feature pyramid levels: {P3, P4, P5}. The detection head at each level consists of 1 × 1 convolutional layers. We adopt a vertex offset regression strategy based on horizontal anchors. At each spatial position on each level’s feature map, three horizontally oriented anchors of aspect ratios {1:2, 1:1, 2:1} are assigned. The anchor sizes are 16, 32, and 64, respectively, when operating on 640 × 640 pixel input images. If other input sizes are used, the anchor sizes need to be scaled proportionally. A given anchor is encoded as a vector a = (ax, ay, aw, ah), consisting of its center coordinates (ax, ay) and its dimensions aw (width) and ah (height).
2.2. Hierarchical Special Attention Model
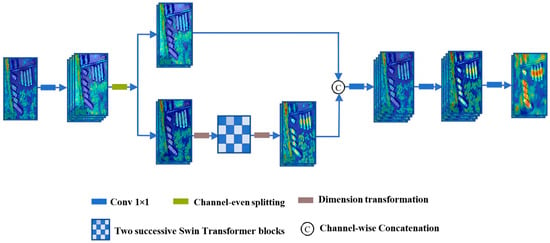
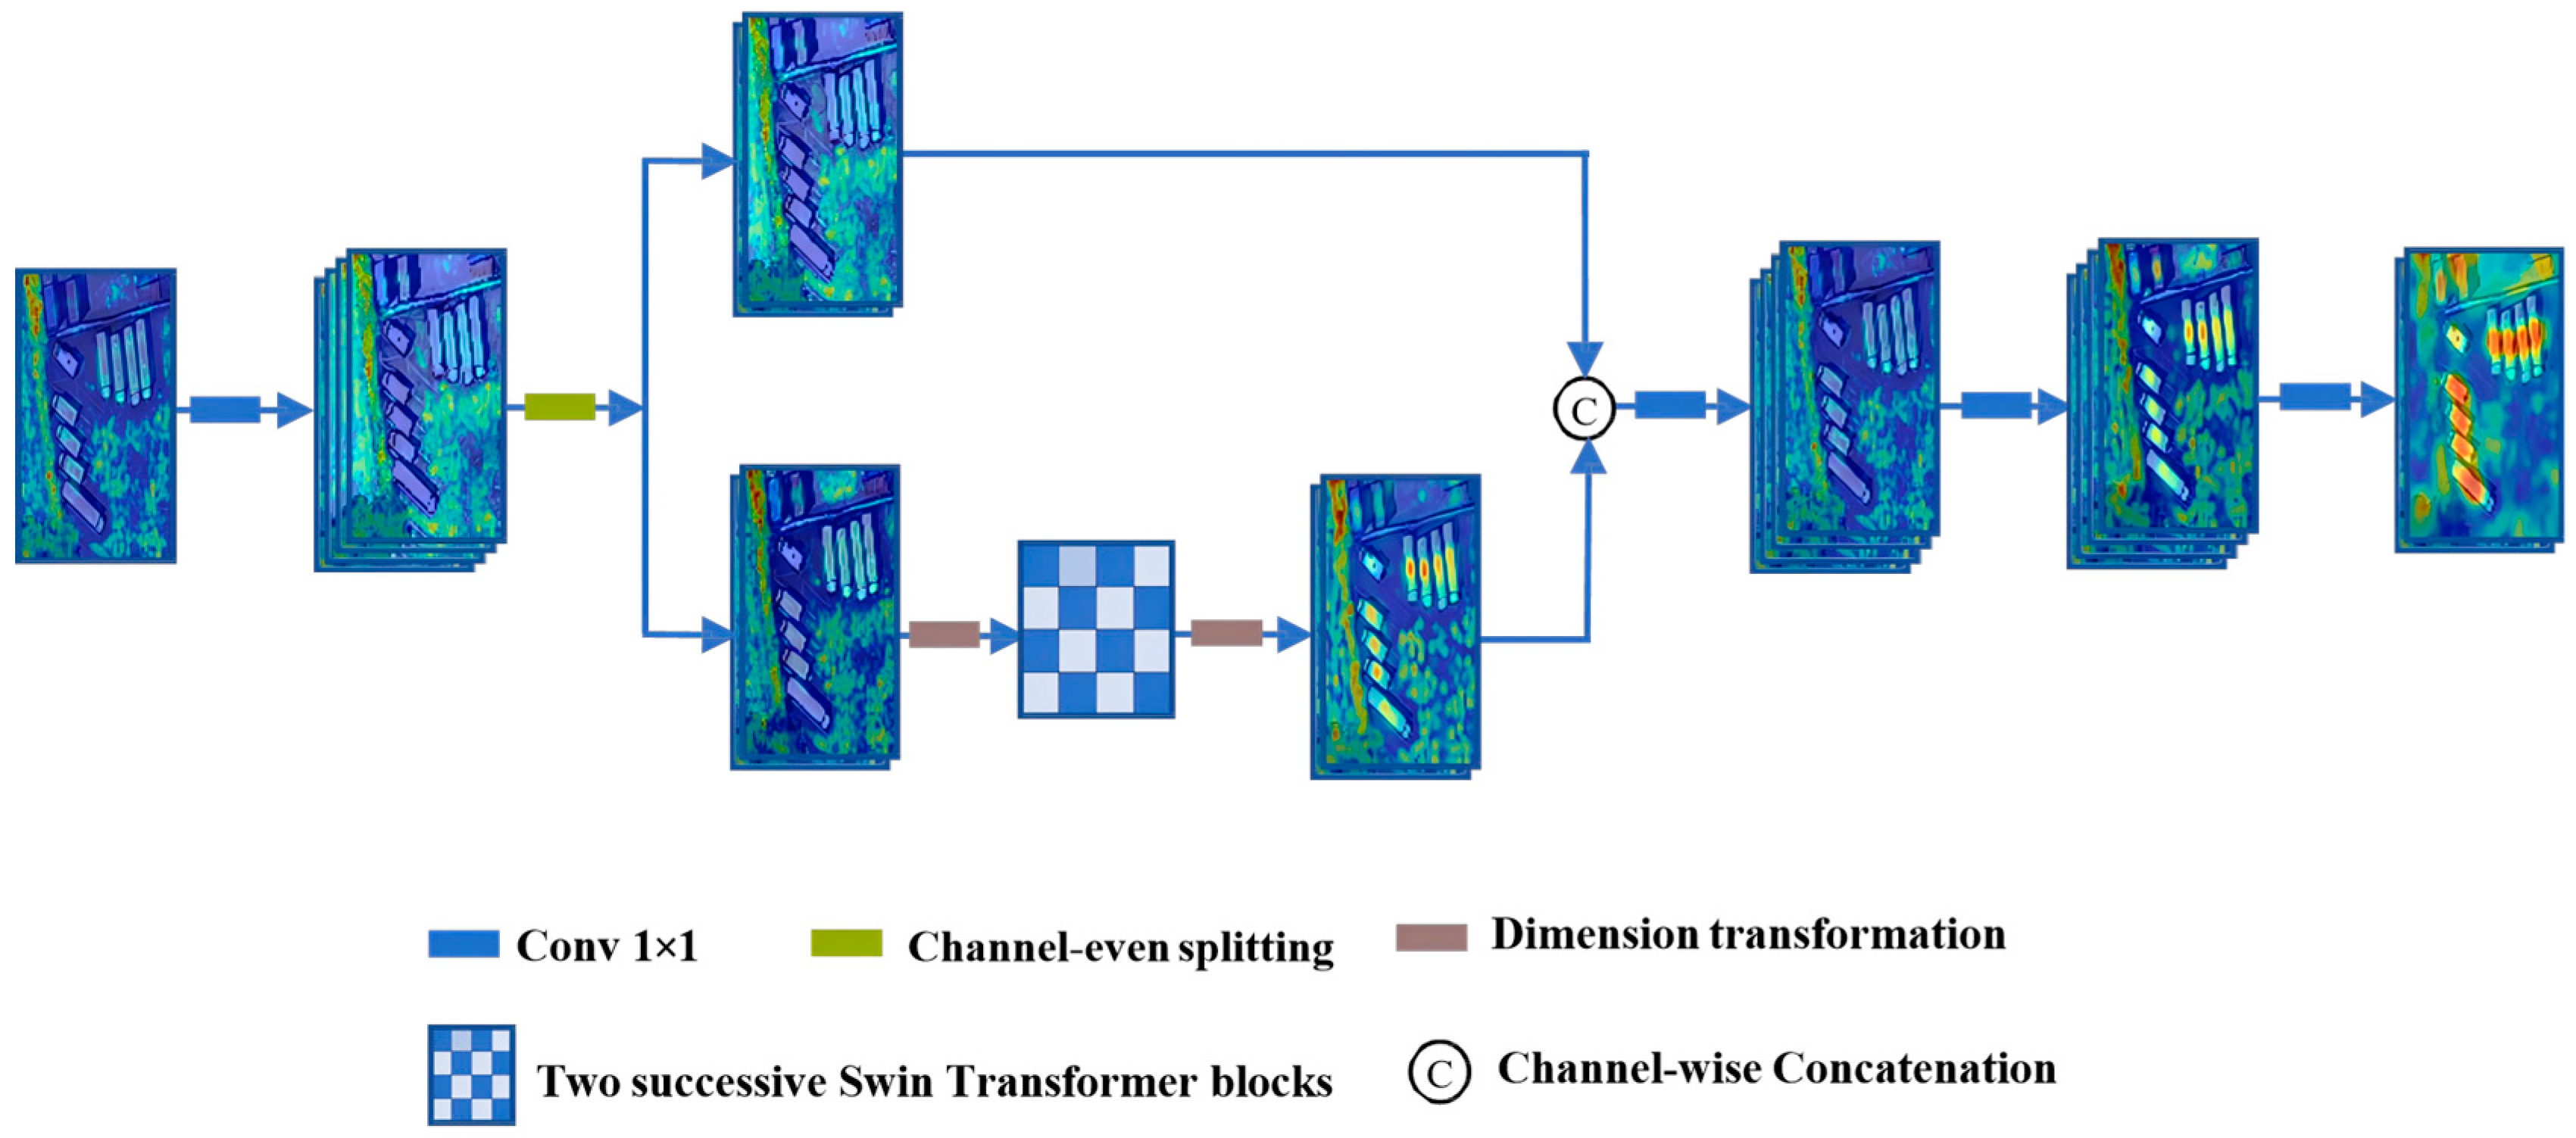
Figure 3 illustrates the overall architecture of the HSAM. The detailed implementation process of HSAM is described as follows.
Figure 3.
Architecture of the proposed HSAM.
The module receives an input feature map X ∈ RB×C×H×W. A 1 × 1 convolutional layer is first applied to expand the channel dimension from C to 2C. The expanded feature map is then split along the channel dimension into two parallel branches. One branch serves as an identity shortcut branch, which directly preserves the original feature information without any additional transformation. The other branch acts as an attention enhancement branch and is fed into two successive Swin Transformer blocks [31] for feature modeling.
Since the Swin Transformer Block expects the [B, H, W, C] format, whereas our module uses [B, C, H, W], a dimension transformation is applied before the attention branch enters the first block to convert [B, C, H, W] to [B, H, W, C]. After sequentially passing through the two stacked Swin Transformer Blocks, an inverse transformation restores the format back to [B, C, H, W] to maintain dimensional consistency with the identity shortcut branch.
Finally, the features processed by the attention enhancement branch and the features from the identity shortcut branch are concatenated along the channel dimension. A 1 × 1 convolutional layer is then applied to fuse the concatenated features, producing an output feature map Y ∈ RB×C×H×W with the same dimensions as the input. In this way, HSAM enhances and optimizes the feature representation, providing more discriminative features for subsequent detection tasks. The entire HSAM can be formulated as
where X1 and X2 denote the two split branches, Permute(.) represents the dimension transformation operations, STB(.) denotes the two stacked Swin Transformer Blocks, and || denotes channel-wise concatenation.
Y = Conv1×1 ([STB (Permute(X1))||X2])
2.3. Network Outputs
The network output consists of five parts. The first part comprises the regression parameters for the horizontal predicted box, outputting the offset and scaling factors with respect to the anchor, represented by the vector δ = (δx, δy, δw, δh), where (δx, δy) represents the center point offset, and (δw, δh) represents the scaling factors for width and height. The second part is the vertex offset parameters, outputting the offset ratios of the oriented target box’s topmost and rightmost vertices with respect to the horizontal target box’s top-right vertex, represented by the vector d = (dt, dr). The third part is the confidence score c of the predicted box, used to distinguish foreground from background objects. The fourth part is the direction category o of the predicted box, indicating whether it is a horizontal box or an oriented box (see Section 2.4). The final part is a set of classification probabilities k = (k1, k2, …, kn), with n representing the total number of target categories. All network outputs are processed by the sigmoid function to ensure values in the range (0, 1).
By decoding the outputs δ and d, the horizontal predicted box (cx, cy, cw, ch) and the vertex offset information (dw, dh) for the rotated predicted box with respect to the horizontal predicted box can be obtained. The decoding process is shown in Equation (2).
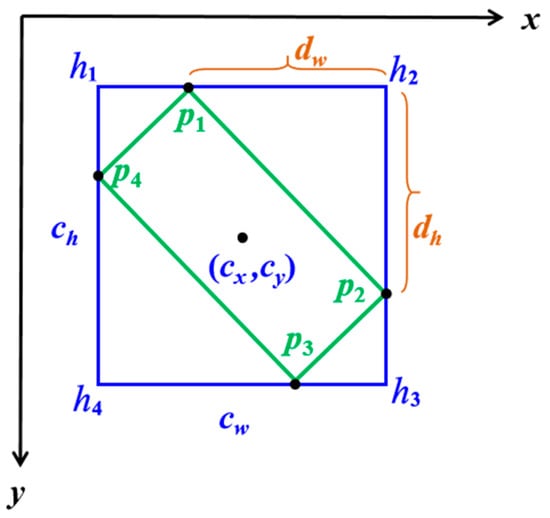
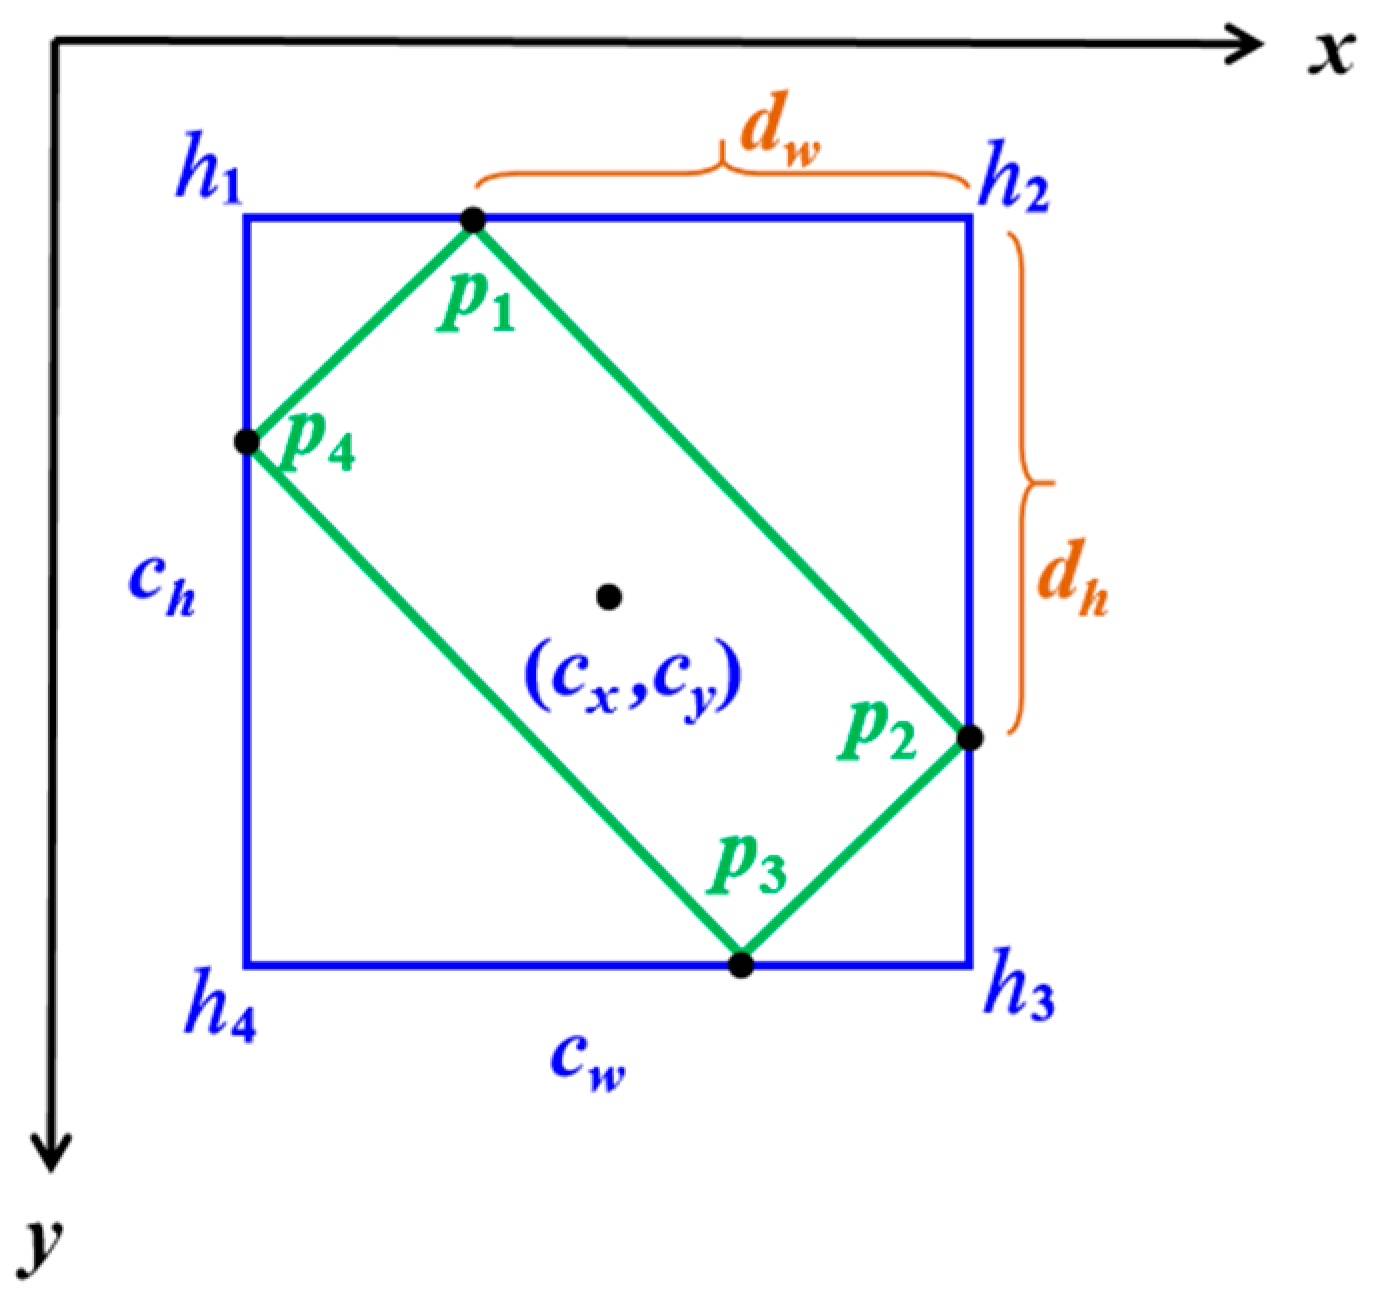
As shown in Figure 4, (cx, cy) and (cw, ch) denote the center and dimensions (width and height) of the horizontal predicted box, respectively. dw and dh represent the offsets of the oriented target box’s topmost and rightmost vertices with respect to the top-right corner of the horizontal predicted box.
Figure 4.
Illustration of the Oriented Target Box Representation using Vertex Offsets. The blue box denotes the horizontal predicted box, while the green box indicates the oriented target predicted box.
Based on the horizontal predicted box information and vertex offsets, the coordinates of the four vertices (p1, p2, p3, p4) of the oriented target box can be calculated using the vertex offset representation method, see Equation (3):
The proposed vertex offset representation exhibits several desirable theoretical properties. As illustrated in Figure 4, the blue rectangle h1h2h3h4 denotes the OBB’s corresponding HBB. In our method, the HBB and the vertex offset vectors are regressed through δ and d, respectively. Since the vertex offset vectors are fixed, the coordinates of points p1 and p2 are uniquely determined. Let the length of p1p2 be l, and the angle ∠h2p1p2 be α. It follows that ∠h4p3p4 = α. Consequently, the length of p4h4 is l×sinα, and the length of h4p3 is l*cosα. These two lengths uniquely determine the coordinates of p3 and p4. Therefore, the entire OBB p1p2p3p4 is uniquely determined. Furthermore, unlike angle-based representations that suffer from sudden jumps at domain boundaries, the vertex offsets dt and dr vary continuously with the target’s rotation, ensuring stable gradient propagation during training. The offsets also provide intuitive geometric interpretability, as they directly encode the spatial positions of the OBB’s topmost and rightmost vertices relative to the HBB’s top-right corner.
2.4. Directionality
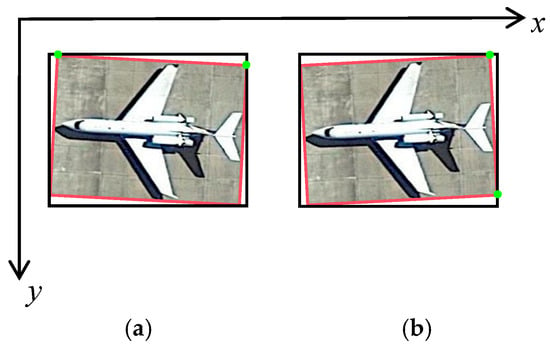
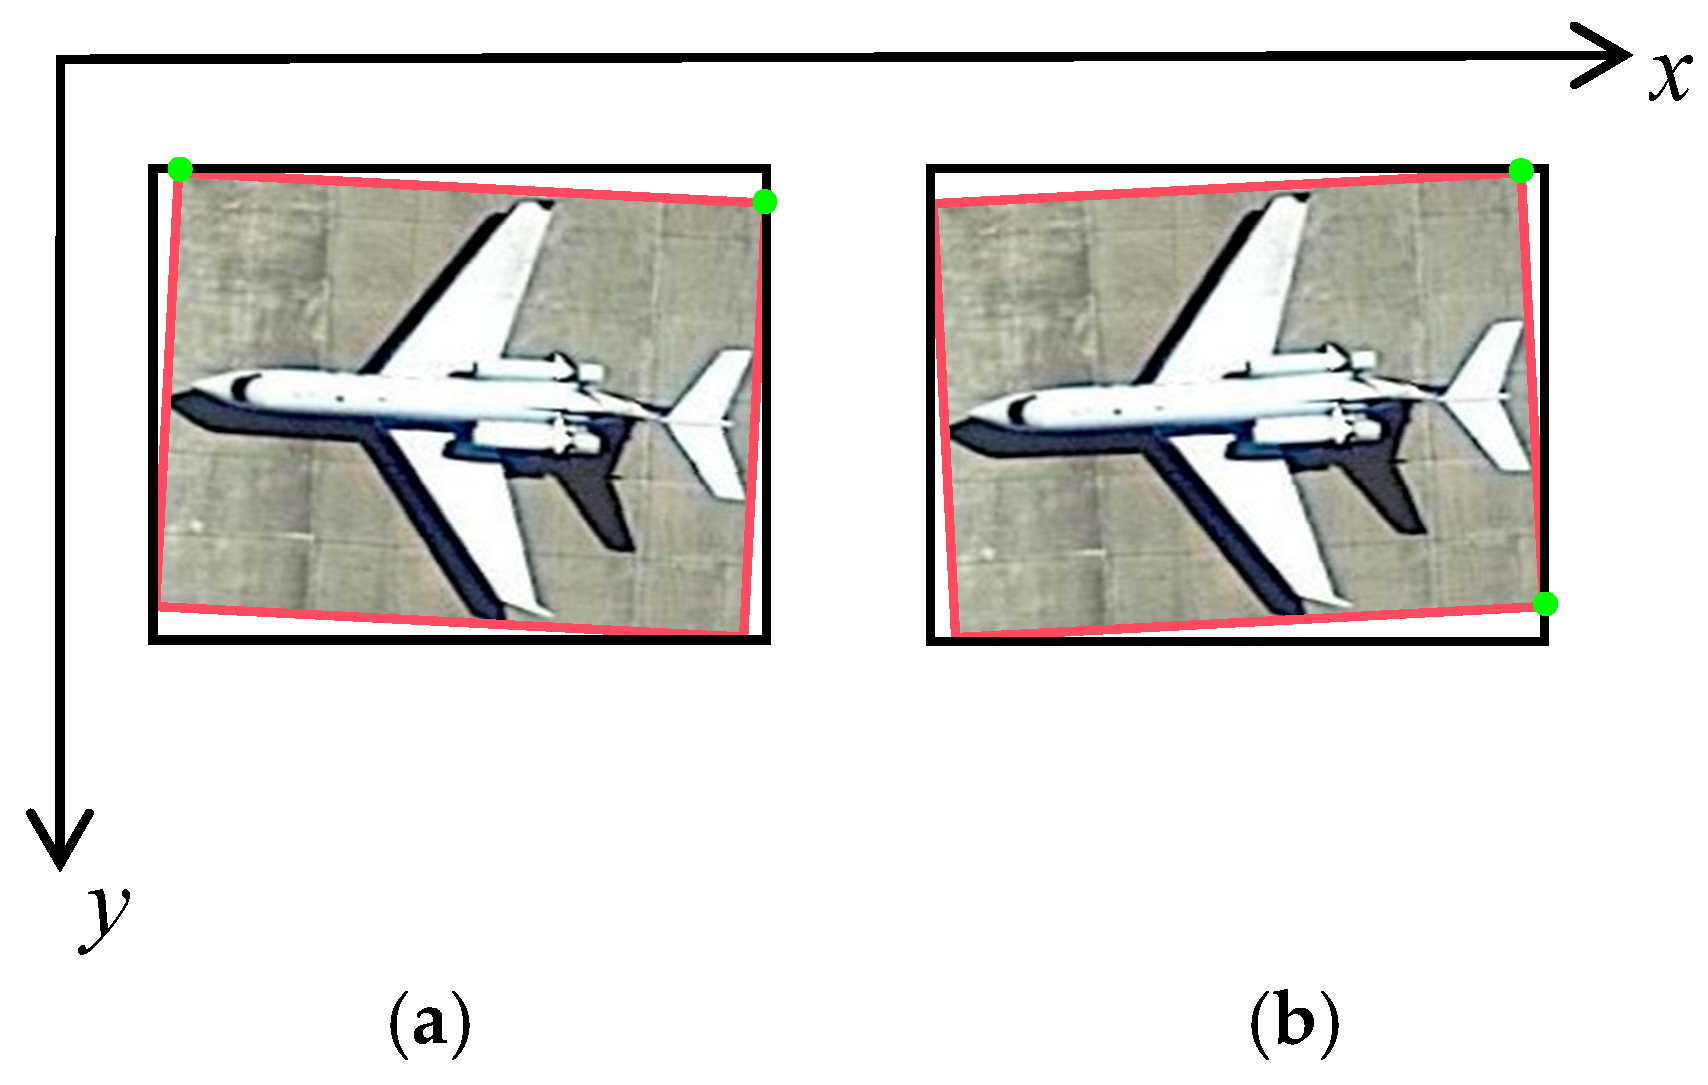
The network distinguishes the directionality of oriented targets using the vertex offset features d(dt, dr). Generally, targets with similar rotation angles have similar vertex offset features. However, when an oriented target is nearly horizontal, the offset feature d becomes ineffective in representing the actual differences between oriented targets. As shown in Figure 5, the two red-oriented targets have the same dimensions but different rotation angles. Figure 5a shows a target rotated 3.5° clockwise around its center from a horizontal box, while Figure 5b shows one rotated 3.5° counterclockwise. Although their rotation angles differ only slightly and they are visually very similar, their offset features differ significantly. For Figure 5a, the offset feature is d1 = (0.96, 0.08); for Figure 5b, d2 = (0.04, 0.93). This feature variation phenomenon presents a dual challenge for the network when handling oriented targets close to the horizontal state: first, the offset feature d becomes ineffective in representing the actual differences between targets; second, the elements in d tend towards 0 or 1, significantly increasing the regression difficulty. We define such oriented boxes close to the horizontal state as critical cases, a special scenario the model needs to handle.
Figure 5.
Illustration of critical cases for vertex offsets. (a) A critical case rotated 3.5° clockwise, with offset feature d1 = (0.96, 0.08). (b) A critical case rotated 3.5° counterclockwise, with offset feature d2 = (0.04, 0.93). The green dots indicate the intersection points of the oriented bounding box with its horizontal enclosing box.
To effectively handle critical cases, we process OBBs as one of two types: HBBs or RBBs (Rotated Bounding Boxes). Here, RBBs represent all standard rotated objects, while critical cases are specifically converted into HBBs. This conversion eliminates orientation ambiguity, providing the network with more stable regression targets and thus facilitating better convergence. When the network subsequently encounters such an HBB (originally a critical case), the direction category o and the regression vector δ enable the reconstruction of an accurate OBB. The ground truth label for o is determined by Equation (4):
where Rarea is the area ratio of the OBB to its HBB, and ot represents the Rarea threshold. The detailed decoding process, including the handling of such critical cases, is systematically illustrated in Algorithm 1.
| Algorithm 1: Vertex Offset Decoding and Direction- Aware Bounding Box Construction |
| Input: |
| Ground truth boxes G = {g1, g2, …, gm} for current batch; |
| Anchor boxes A = {A1, A2, …, AL} for each pyramid level; |
| Pyramid levels L = {P3, P4, P5}; |
| Hyperparameters: Rarea threshold ot, size constraint threshold rt; |
| Output: |
| Oriented bounding boxes B and total loss Ltotal; |
| Initialize positive sample set P ← ∅, bounding box set B ← ∅; |
| for each ground truth box g ∈ G do |
| Compute ground truth direction label ogt using Equation (4) with threshold ot; |
| Find anchors in A satisfying rmax < rt and position constraints (); |
| Add matching anchors to positive sample set P; |
| end |
| for each level l ∈ L do |
| for each anchor a ∈ Al do |
| Decode horizontal box (cx, cy, cw, ch) from δ using Equation (2); |
| Decode vertex offsets (dt, dr) ← σ(d); |
| Decode direction category oˆ ← ⌊σ(o) + 0.5⌋; |
| if oˆ = 1 then |
| Compute vertices V from (cx, cy, cw, ch) and (dt, dr) using Equation (3); |
| else |
| Set vertices V as corners of (cx, cy, cw, ch); |
| end |
| Add V to bounding box set B; |
| end |
| end |
| Compute total loss Ltotal using Equation (5); |
| return B, Ltotal; |
2.5. Discussion on Special Cases
The theoretical analysis in Section 2.3 assumes general cases. We further discuss several special cases to demonstrate the robustness of the proposed vertex offset representation:
- Arbitrary rotation angles. For targets rotated across the angle boundary (e.g., near ±π/2), the HBB remains well-defined, and the vertex offsets (dt, dr) remain continuous with respect to the target’s orientation. This avoids the sudden loss discontinuity that occurs in angle-based methods.
- Near-square targets. When a target is approximately square, the geometric derivation in Section 2.3 still holds, as sinα and cosα remain well-defined. The uniqueness of the OBB is preserved.
- Extreme aspect ratio targets. For highly elongated targets (e.g., ships, bridges), the geometric derivation still holds regardless of the aspect ratio. The coupled vertex offset representation naturally accommodates such targets, as the HBB adapts to the target’s extent, and the offsets encode the relative positions of the intersection points.
- Vertex ordering. The coupled offset representation enforces a fixed vertex ordering: p1 is the intersection on the top edge, p2 on the right edge, p3 on the bottom edge, and p4 on the left edge of the HBB. This avoids the vertex sorting ambiguity that may arise in methods that regress independent vertices, as the geometric constraints are inherently encoded in the coupled formulation.
2.6. Loss Function
The loss function of VODet is presented in Equation (5), which consists of five terms: Lcls, Lobj, Lloc, Loff and Lort for classification, confidence, bounding box regression, vertex offset, and directionality, respectively.
Loss = λ1Lcls + λ2Lobj + λ3Lloc + λ4Loff + λ5Lort
Here, Lcls and Lort are binary cross-entropy losses, calculated only for positive samples. Lobj is also a binary cross-entropy loss, calculated for all samples. Loff uses the smooth L1 loss, calculated for positive samples.
Lloc represents the discrepancy between the predicted horizontal box and its ground truth counterpart. This paper uses MPDIoU [32] for its calculation. It works for box regression scenarios with or without overlap between boxes, addresses the failure of traditional IoU variants like GIoU/CIoU when aspect ratios are identical but sizes differ, simplifies the computation process, improves object detection accuracy and training convergence speed, and shows enhanced stability in challenging scenes. The formula for MPDIoU is:
where A corresponds to the ground truth box and B to the predicted box, while w and h represent the image’s width and height, and l1 and l2 are given by Equation (7).
In Equation (7), the top-left and bottom-right corners of A are (x1A, y1A) and (x2A, y2A), and those of B are (x1B, y1B) and (x2B, y2B), respectively. The complete loss computation follows the procedure outlined in Algorithm 1.
2.7. Positive Sample Matching Rule
The model regresses oriented objects from a set of predefined anchors. The two criteria listed below must be met for an anchor to be labeled positive:
- Size Constraint. Given a ground truth box and an anchor, let rw and rh be the ratios of their widths and heights, respectively. We compute rmax = max(rw, 1/rw, rh, 1/rh). The size constraint is satisfied if rmax < rt, where rt is a threshold (set to 2 in this work). This guarantees that they have comparable aspect ratios and scales.
- Position Constraint. The ground truth box is projected onto the corresponding prediction feature layer. The assignment of positive samples is based on the spatial relationship between the center points of the ground truth box and the anchor. If the distance between an anchor’s center point (ax, ay) and a ground truth box’s center point (cx*, cy*) satisfies Equation (8), then they satisfy the positional relationship.
cx* − ax ∈ (−0.5, 1.5), cy* − ay ∈ (−0.5, 1.5)
The overall pipeline, including positive sample assignment, vertex offset decoding, direction-aware box construction, and multi-task loss computation, is summarized in Algorithm 1.
2.8. Datasets
The DOTA-v1.0 is a widely used benchmark for oriented object detection in remote sensing. It provides 2806 large-scale images (800 × 800 to 4000 × 4000 pixels) with 188,282 instances spanning 15 categories. These include plane (PL), baseball diamond (BD), bridge (BR), ground field track (GTF), small vehicle (SV), large vehicle (LV), ship (SH), tennis court (TC), basketball court (BC), storage tank (ST), soccer-ball field (SBF), roundabout (RA), harbor (HA), swimming pool (SP), and helicopter (HC). The training, validation, and test sets in DOTA-v1.0 are split in a 1/2, 1/6, 1/3 ratio, respectively. For our experiments, all training and validation images were split into 1024 × 1024-pixel patches with a 200-pixel overlap before training. Images with a width or height less than 1024 pixels were padded to 1024 pixels.
The HRSC2016 dataset contains imagery collected from six well-known harbors, containing both nearshore and offshore scenes, with a total of 1061 ship images. The target category is ships only. The images are divided into 436 for training, 181 for validation, and 444 for testing. Image dimensions range from 300 × 300 pixels to 1500 × 900 pixels. For our experiments, all training and validation data were uniformly cropped to 512 × 512 pixels with a 150-pixel overlap.
UCAS-AOD comprises 1510 images, containing 14,596 annotated instances across two categories: airplanes and cars. The image size is 659 × 1280 pixels. For the experiments, we performed a random split of the dataset into 1110 training and 400 test images.
3. Results
To validate the performance of our approach, we evaluated it on three public benchmarks for oriented object detection: DOTA-v1.0 [33], HRSC2016 [34], and UCAS-AOD [35]. The following sections detail these datasets, experimental settings, and results.
3.1. Experimental Details
Experiments were conducted on hardware equipped with an NVIDIA GeForce RTX 3090 GPU and a PyTorch-1.8.1 software environment. The model uses the Adam optimizer [36] with initial learning rate, momentum, and weight decay set to 1 × 10⁻³, 0.9, and 1 × 10⁻⁴, respectively. The batch size is 8. The training epochs for each dataset are: DOTA-v1.0, 80; HRSC2016, 100; UCAS-AOD, 100. The learning rate is reduced to 1 × 10⁻⁵ after 50 epochs for each dataset. Data augmentation includes random rotation, horizontal flip, vertical flip, and Mosaic. The Rarea threshold ot in Equation (4) is set to 0.90 by default. The loss weight parameters in Equation (5) are: = 1, = 1, = 2, = 1.5, = 0.5.
3.2. Ablation Studies
3.2.1. Validation of Module Effectiveness
We perform ablation studies using DOTA-v1.0 to validate the efficacy of VODet. The baseline model, denoted as 5PDet, employs the (x, y, w, h, θ) representation for angle prediction and uses ResNet-101 with FPN as the backbone. In 5PDet, the vertex offset channel in the detection head is replaced by an angle regression channel. The angle θ follows the long-side representation, where θ ∈ [−π/2, π/2). To increase prediction accuracy, the angle channel does not directly regress θ but encodes it. Assuming the output of the angle prediction branch is pθ, the predicted angle is calculated using the following formula:
where σ is the sigmoid function. The purpose of encoding θ is to leverage the sigmoid function’s output range of (0, 1), preventing the network’s predicted angle from exceeding the definition range of the long-side representation and reducing regression difficulty.
The baseline model employs CIoU loss [37] for the bounding box loss Lloc. During ablation experiments, we evaluate each module both independently and in combination to validate their individual contributions and interaction effects. As shown in Table 1, adding HSAM alone improves mAP from 70.23% to 72.17% (+1.94%), demonstrating its effectiveness in feature enhancement. Direction classification alone raises mAP to 72.69% (+2.46%), confirming its ability to handle critical cases. MPDIoU alone yields a modest improvement to 71.14% (+0.91%), indicating that its benefit is more pronounced when combined with other modules. Vertex offset alone achieves 73.58% (+3.35%), proving the effectiveness of the vertex offset mechanism even without HSAM.
Table 1.
Ablation experiment results of different VODet module combinations on the DOTA-v1.0 dataset.
When HSAM and Vertex Offset are used together, mAP jumps to 76.56%, a substantial improvement over either module alone. This synergy suggests that HSAM-enhanced features provide a more reliable basis for vertex regression. Adding direction classification further improves mAP to 78.92% (+2.36%), indicating that it addresses a distinct challenge—critical cases—that is complementary to vertex offset regression. Finally, incorporating MPDIoU loss brings the performance to 80.44% (+1.52%), demonstrating that refining horizontal box localization directly benefits the vertex reconstruction process.
Overall, the cumulative improvement from 70.23% to 80.44% (+10.21%) confirms that all modules contribute positively with minimal negative interactions, validating the compatibility of our design choices.
3.2.2. Effectiveness of the HSAM
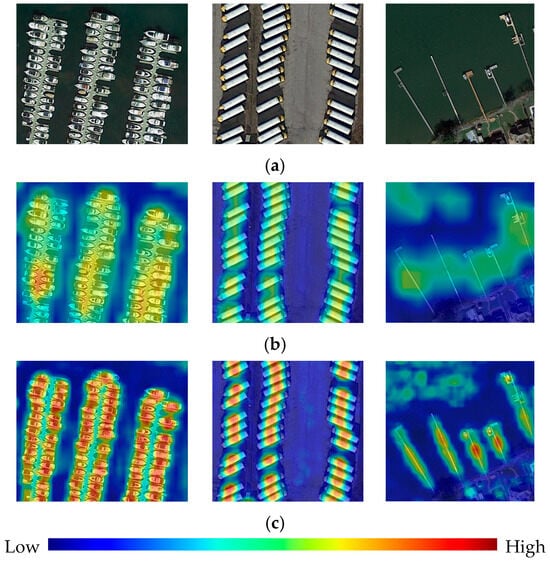
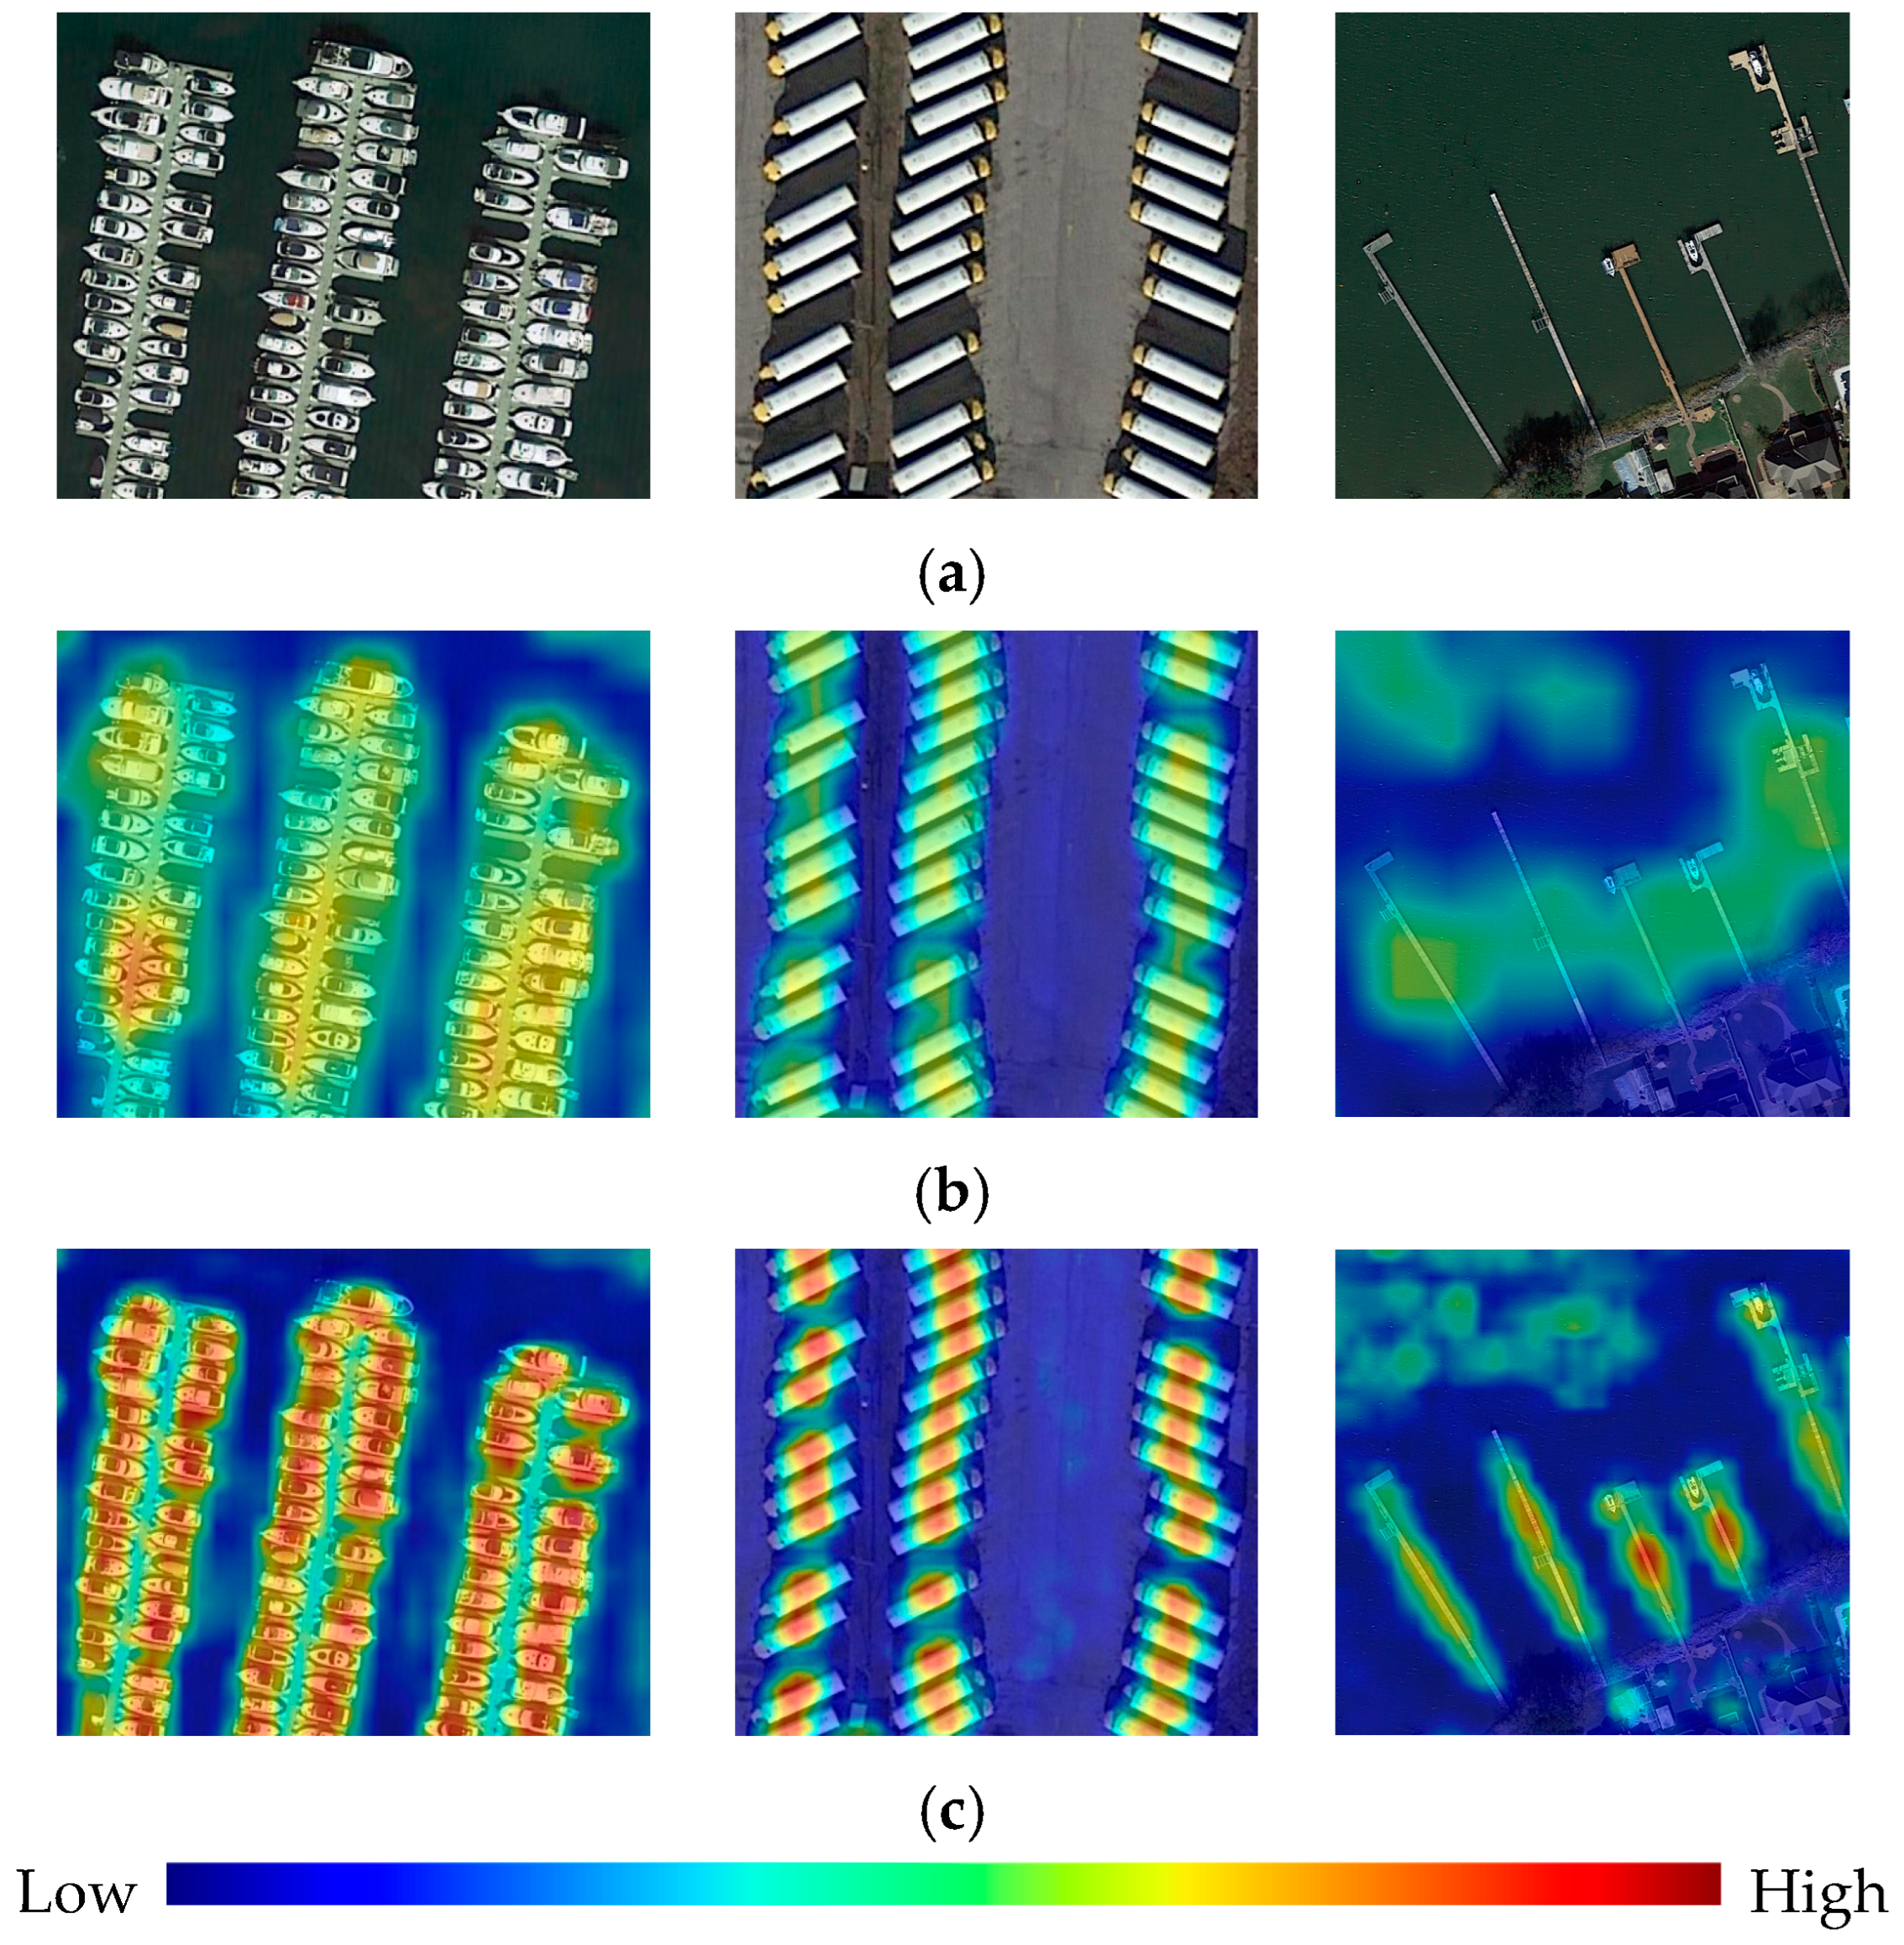
Figure 6 visualizes the feature heatmaps of the baseline model without and with the proposed HSAM. Before HSAM is applied, the model exhibits scattered and relatively weak activations, making it difficult to fully capture the target regions, especially for small and densely arranged objects. After HSAM is integrated, the activated regions become more concentrated on the targets, and the response intensity is enhanced. As shown in the figure, for challenging categories such as ships (SH), HSAM enables the model to better distinguish foreground objects from complex backgrounds. Furthermore, for large-aspect-ratio objects like large vehicles (LV) and harbors (HA), HSAM produces more complete and continuous activations along the elongated target structures. These qualitative results demonstrate that HSAM effectively captures both local details and global contextual dependencies, leading to more discriminative feature representations and improved detection performance.
Figure 6.
Feature heatmap comparison of the baseline model without and with HSAM on the DOTA-v1.0 dataset. The three rows correspond to (a) the input images, (b) feature heatmaps without any attention module, and (c) feature heatmaps with HSAM, respectively. The three columns show ships (SH), large vehicles (LV), and harbors (HA), respectively.
We further compare HSAM with several popular attention modules, including Squeeze-and-Excitation (SE) [38], Convolutional Block Attention Module (CBAM) [39], and Coordinate Attention (CA) [40], under the same baseline configuration. As presented in Table 2, HSAM achieves the highest ΔmAP of 1.94%. This superior performance can be attributed to HSAM’s channel-split parallel architecture combined with Swin Transformer blocks, which capture both local details and global dependencies more effectively than other attention mechanisms.
Table 2.
Comparison of different attention modules on the DOTA-v1.0 dataset.
3.2.3. Effectiveness of the Vertex Offset Mechanism
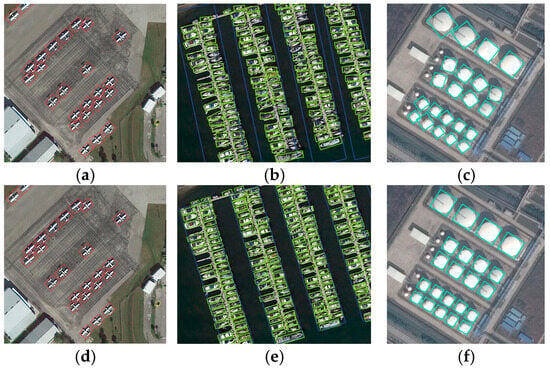
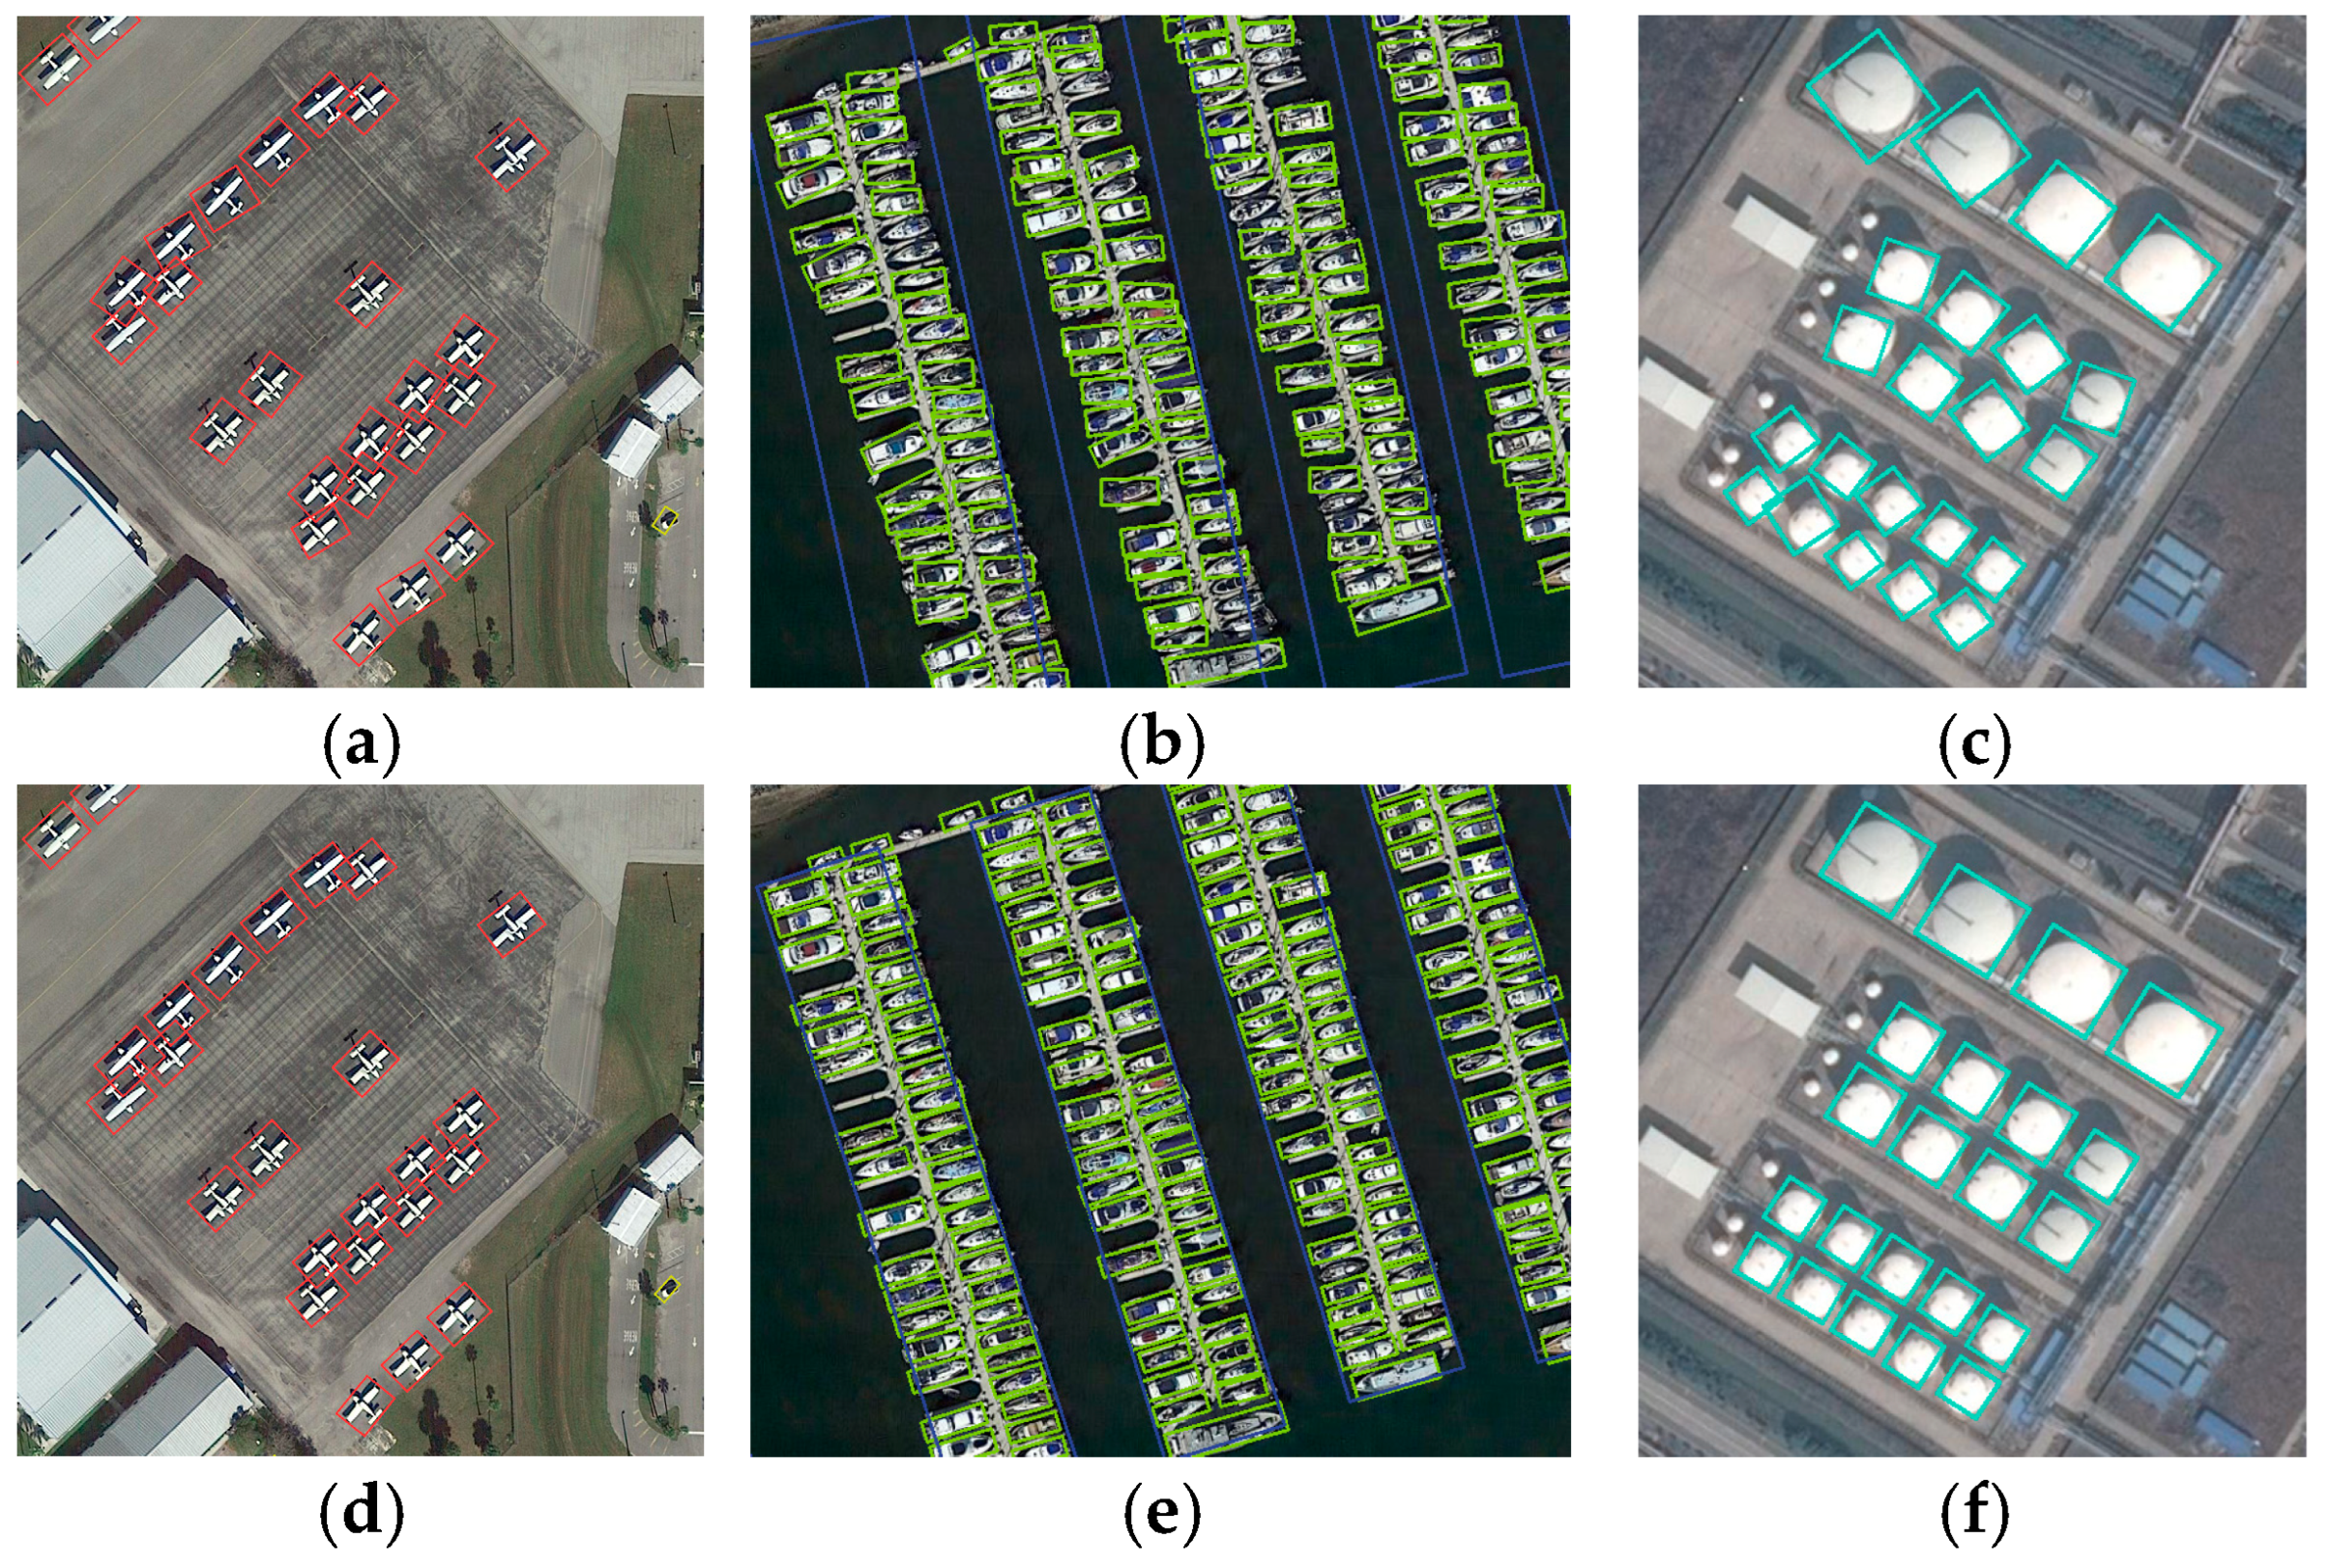
Figure 7 illustrates the visual comparison between 5PDet and VODet (using only vertex offset). Due to the discontinuity issue in rotation angles, 5PDet faces increased regression difficulty, leading to less accurate angle predictions. In Figure 7a–c, 5PDet can locate targets like planes, ships, and storage tanks, but the target orientations have significant deviations, especially for targets with larger aspect ratios, such as the harbors in Figure 7b. In contrast, VODet, using the vertex offset mechanism, overcomes the discontinuity problem of angle regression, enabling more accurate prediction of bounding box size and rotation angle, thus more tightly localizing oriented targets and improving detection accuracy in remote sensing images. The advantages of VODet are especially evident for slender objects like the harbors and dense scenes like the ships in Figure 7e.
Figure 7.
Visual comparison of detection results between the 5PDet Model and the Basic VODet Model. (a–c) 5PDet model detection results. (d–f) Basic VODet model detection results for the corresponding scenes. Zoom in for a clearer view.
3.2.4. Effectiveness of the Direction Classification Mechanism
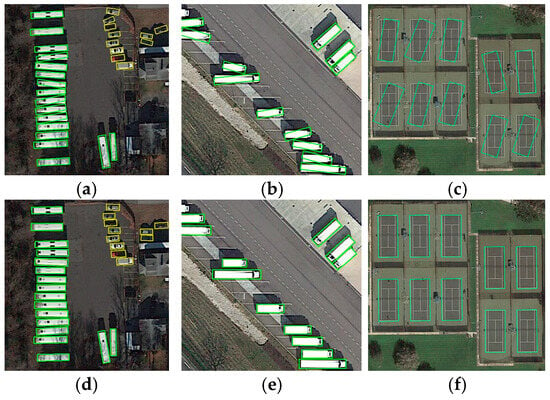
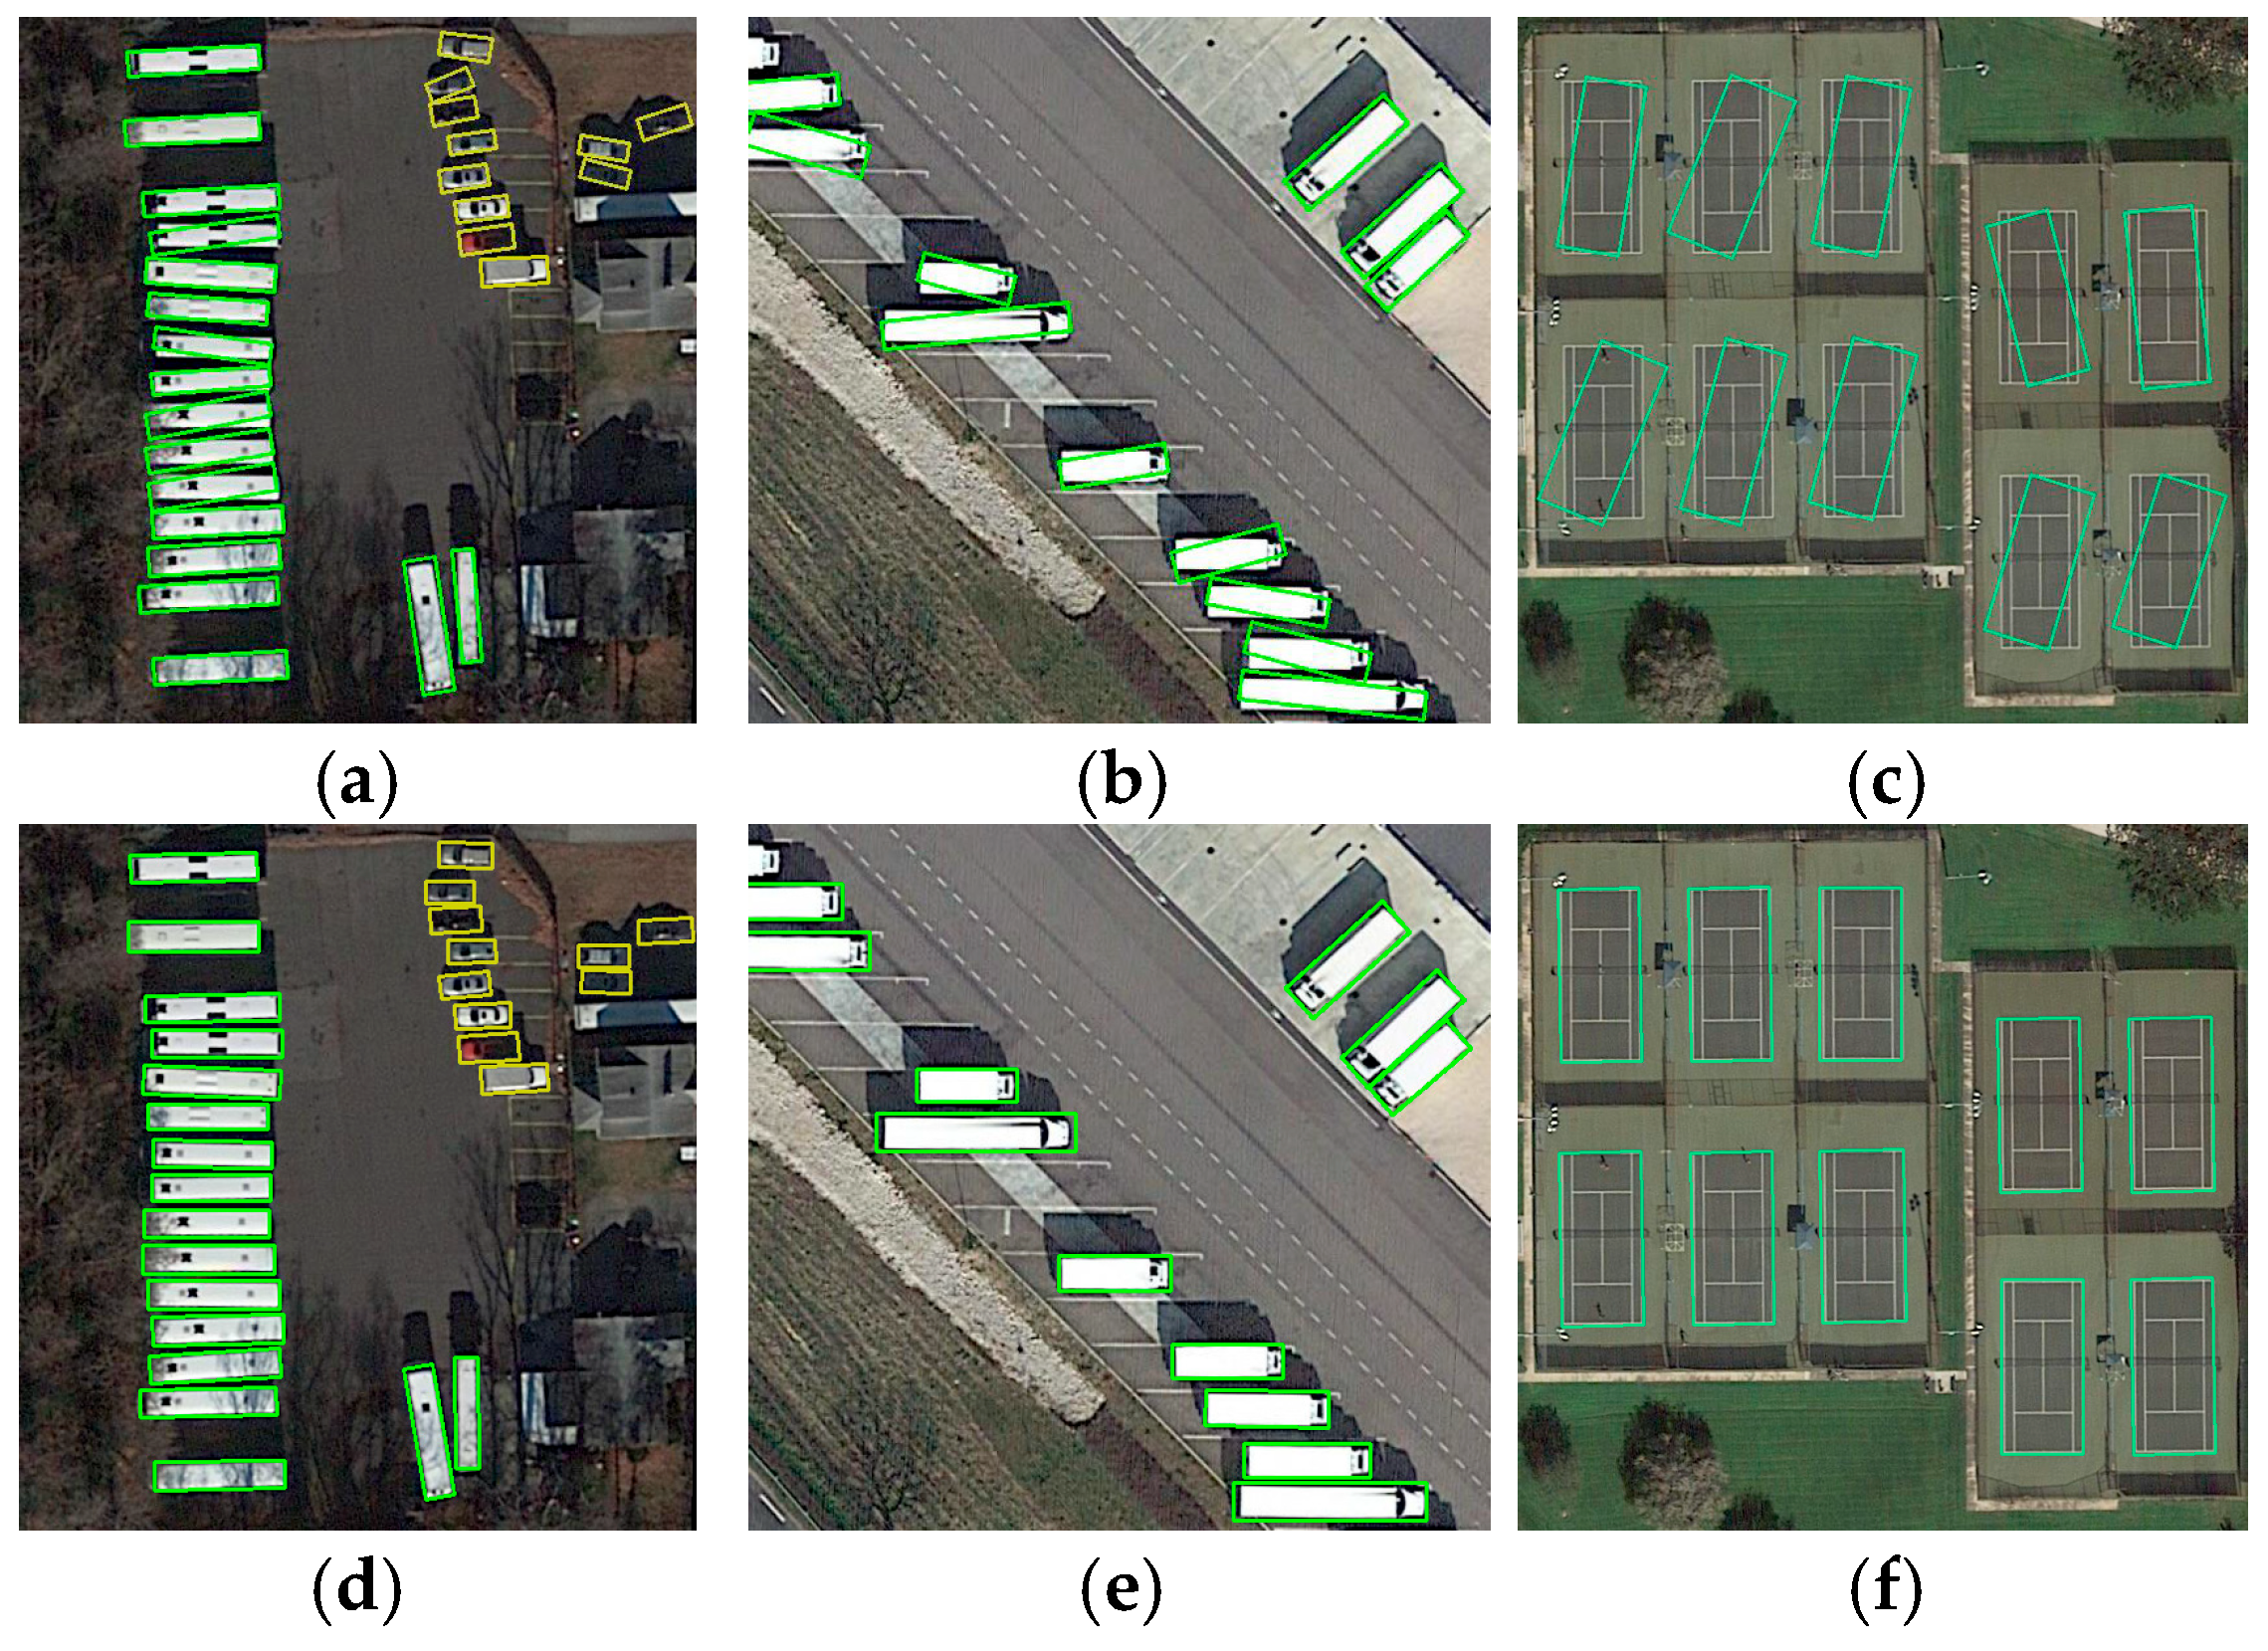
Figure 8 compares the detection performance of the basic VODet and the VODet with the direction classification mechanism added. When the basic VODet model processes nearly horizontally distributed targets, such as the large vehicles in Figure 8a,b or the tennis court in Figure 8c, it often fails to accurately detect the nearly horizontal bounding boxes—these are the “critical cases” mentioned earlier. The reason for detection failure is that when a rotated target approaches a horizontal or vertical orientation, the elements of the vertex offset component d = (dt, dr), dr tend towards 0 or 1, which lies at the boundary of the sigmoid function, increasing regression difficulty. To address this, we classify rotated bounding boxes into RBBs and HBBs, achieving accurate prediction for critical cases by predicting the direction category o. As shown in Figure 8, after adding the direction category, the model performs excellently in critical cases, accurately capturing rotated bounding boxes. Table 1 shows that adding direction classification improves VODet’s mAP by 2.36%.
Figure 8.
Visual comparison of how the direction classification mechanism improves detection of “Critical Cases”. (a–c) Basic VODet. (d–f) VODet with direction classification mechanism. Zoom in for a clearer view.
The direction classifier relies on threshold ot to distinguish critical near-horizontal cases (converted to HBBs) from standard rotated objects (remaining as RBBs). To investigate the sensitivity of this hyperparameter, we conduct ablation experiments by varying ot from 0.75 to 0.95 with a step of 0.05, while keeping all other settings identical. As shown in Table 3, the detection performance remains relatively stable across different ot values, with mAP ranging from 77.46% to 78.92%. The best performance is achieved at ot = 0.90 (78.92%), which is therefore chosen as the default threshold in our experiments. When ot is too low (e.g., 0.75), more cases are misclassified as critical, leading to loss of orientation information, resulting in a lower mAP of 77.46%. When ot is too high (e.g., 0.95), fewer cases receive the directional classification benefit, causing a slight performance drop to 78.35%. Overall, VODet exhibits low sensitivity to the choice of ot within a reasonable range, demonstrating its robustness.
Table 3.
Sensitivity analysis of ot.
3.2.5. Effectiveness of the MPDIoU Loss Function
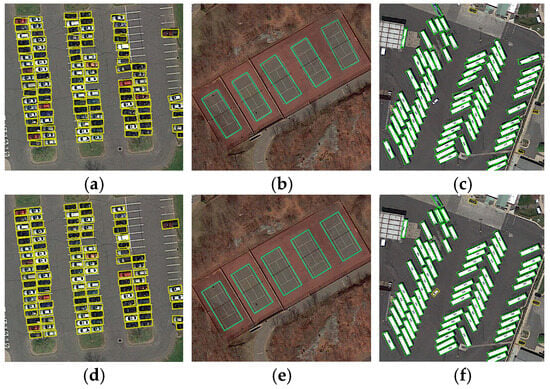
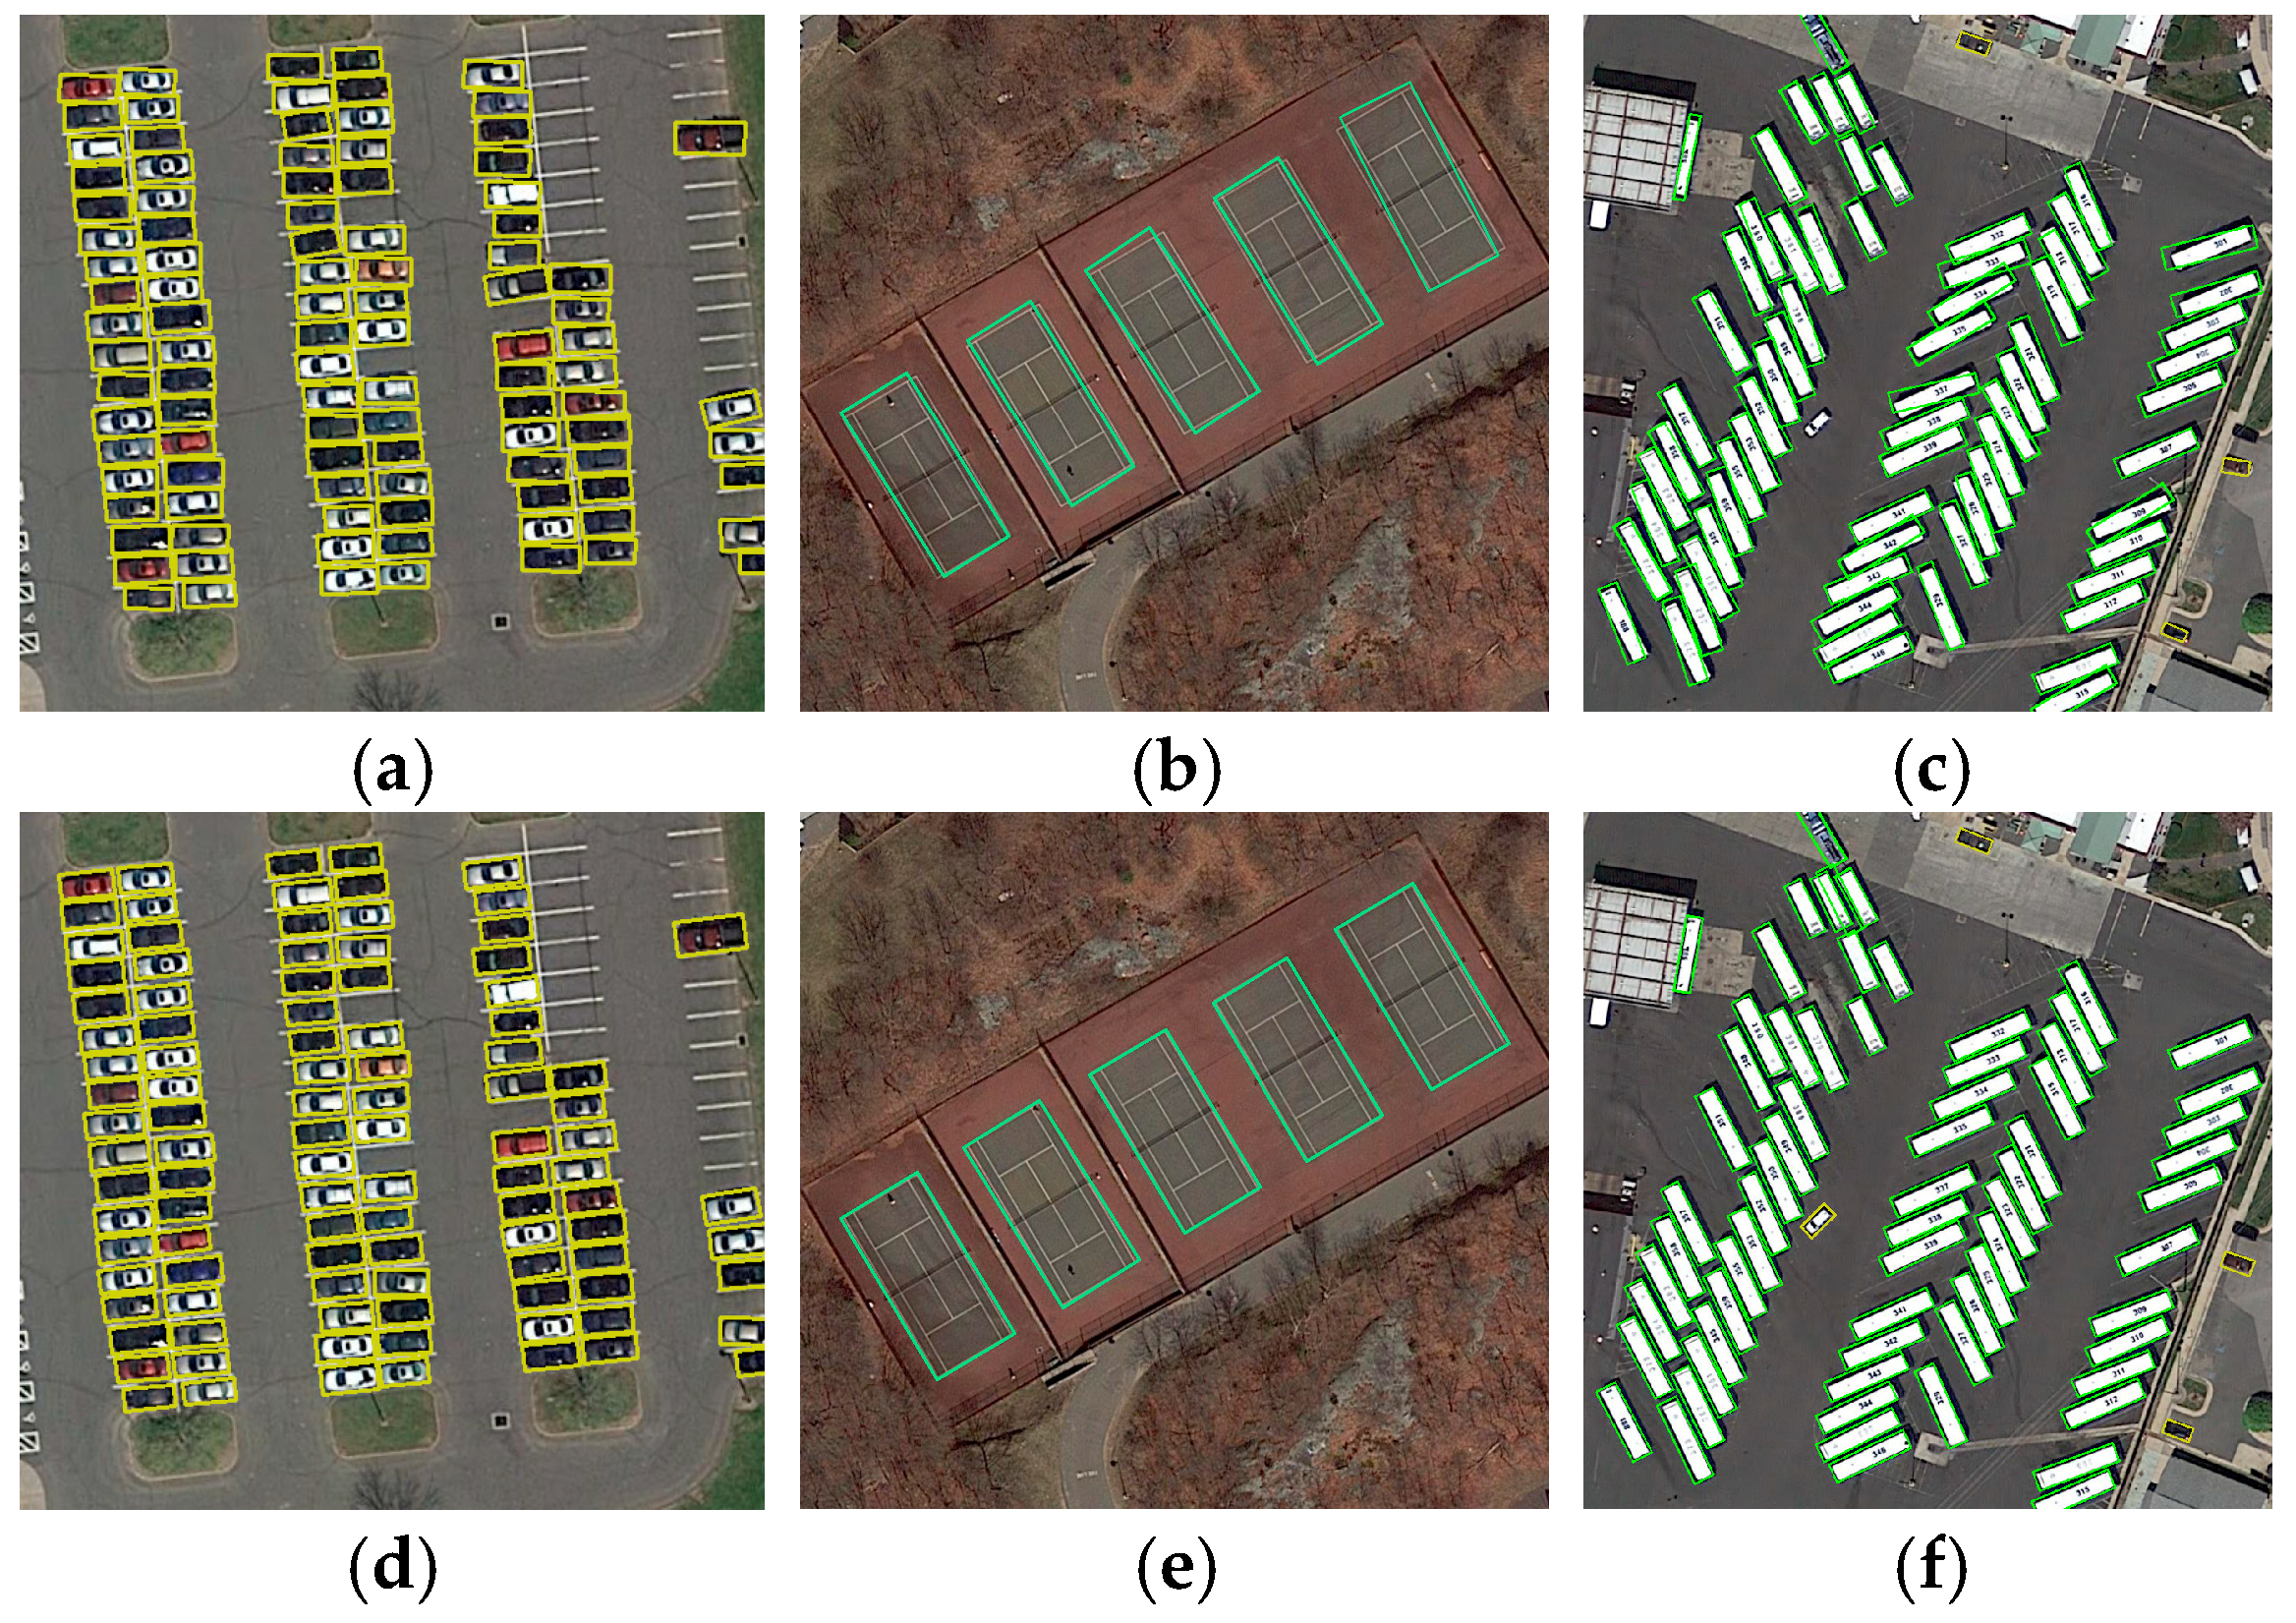
Figure 9 shows detection comparison results for VODet with and without the MPDIoU loss. Figure 9a–c show the oriented object detection results of VODet using CIoU. Figure 9d–f show the results of VODet using MPDIoU. It can be observed that VODet, guided by MPDIoU, achieves more accurate localization of targets. The bounding boxes predicted by VODet without MPDIoU have slight deviations from the ground truth. This improvement stems from MPDIoU’s ability to enhance the accuracy of horizontal box estimation for oriented targets through minimizing the corner point distances between predictions and their corresponding ground truths, which in turn boosts the localization precision of the final rotated boxes.
Figure 9.
Comparison of VODet Detection Results Using Different Loss Functions. (a–c) Using CIoU Loss. (d–f) Using MPDIoU Loss. Zoom in for a clearer view.
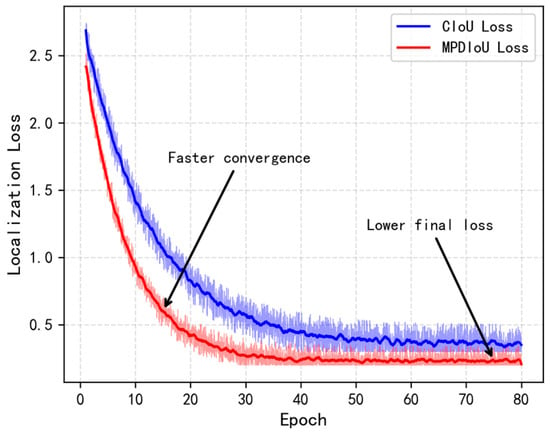
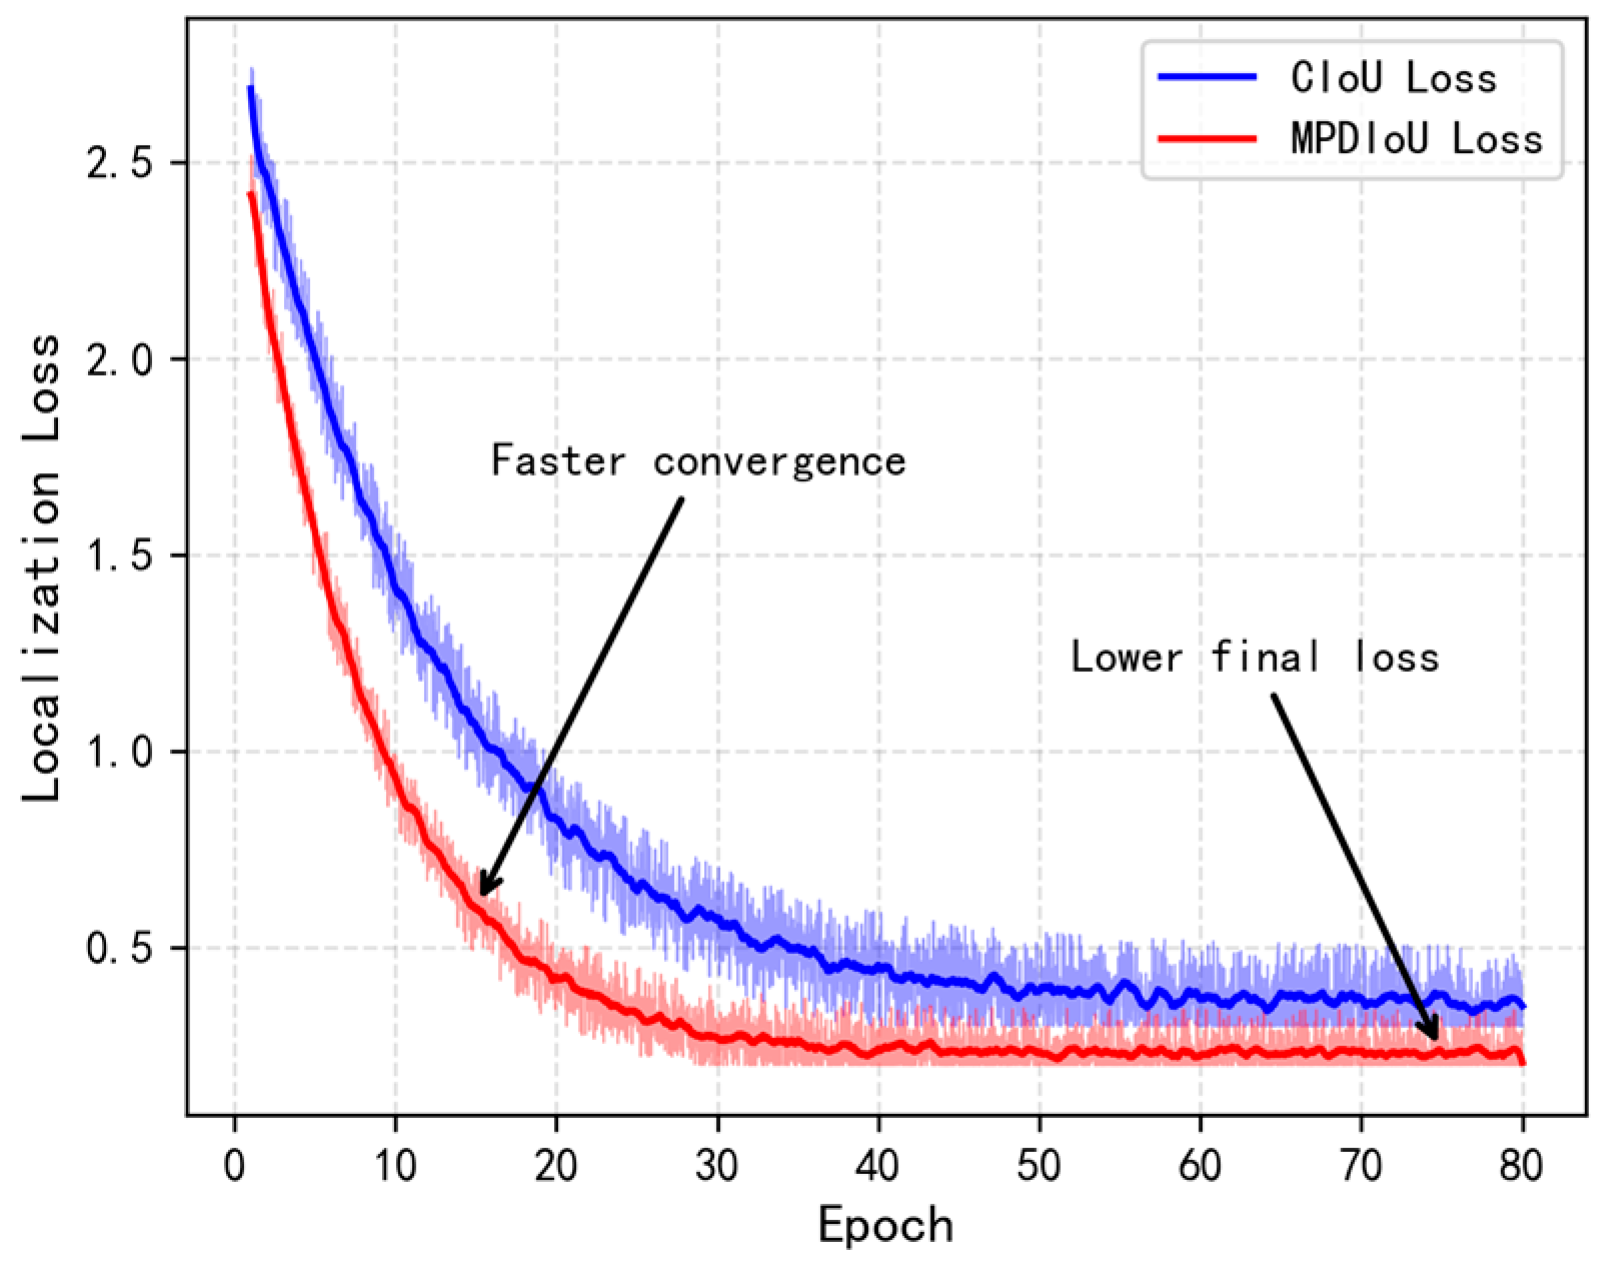
To further demonstrate the advantage of MPDIoU over CIoU for bounding box regression, we plot the training loss curves of the localization branch using CIoU and MPDIoU, respectively, in Figure 10. It can be seen that the model with MPDIoU converges faster and achieves a lower final loss compared to CIoU. This demonstrates that MPDIoU provides more effective gradient guidance during training, leading to more accurate bounding box regression.
Figure 10.
Comparison of localization loss curves using CIoU and MPDIoU. The model with MPDIoU achieves faster convergence and lower final loss, demonstrating its advantage for bounding box regression.
3.2.6. Feature Map Visualization Interpretation
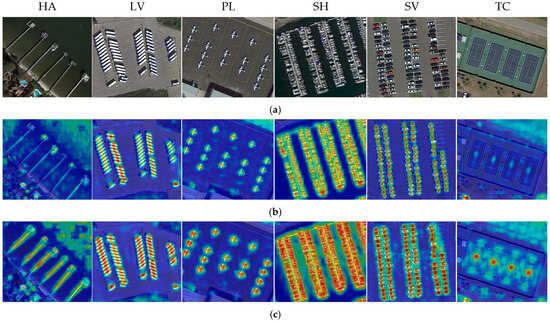
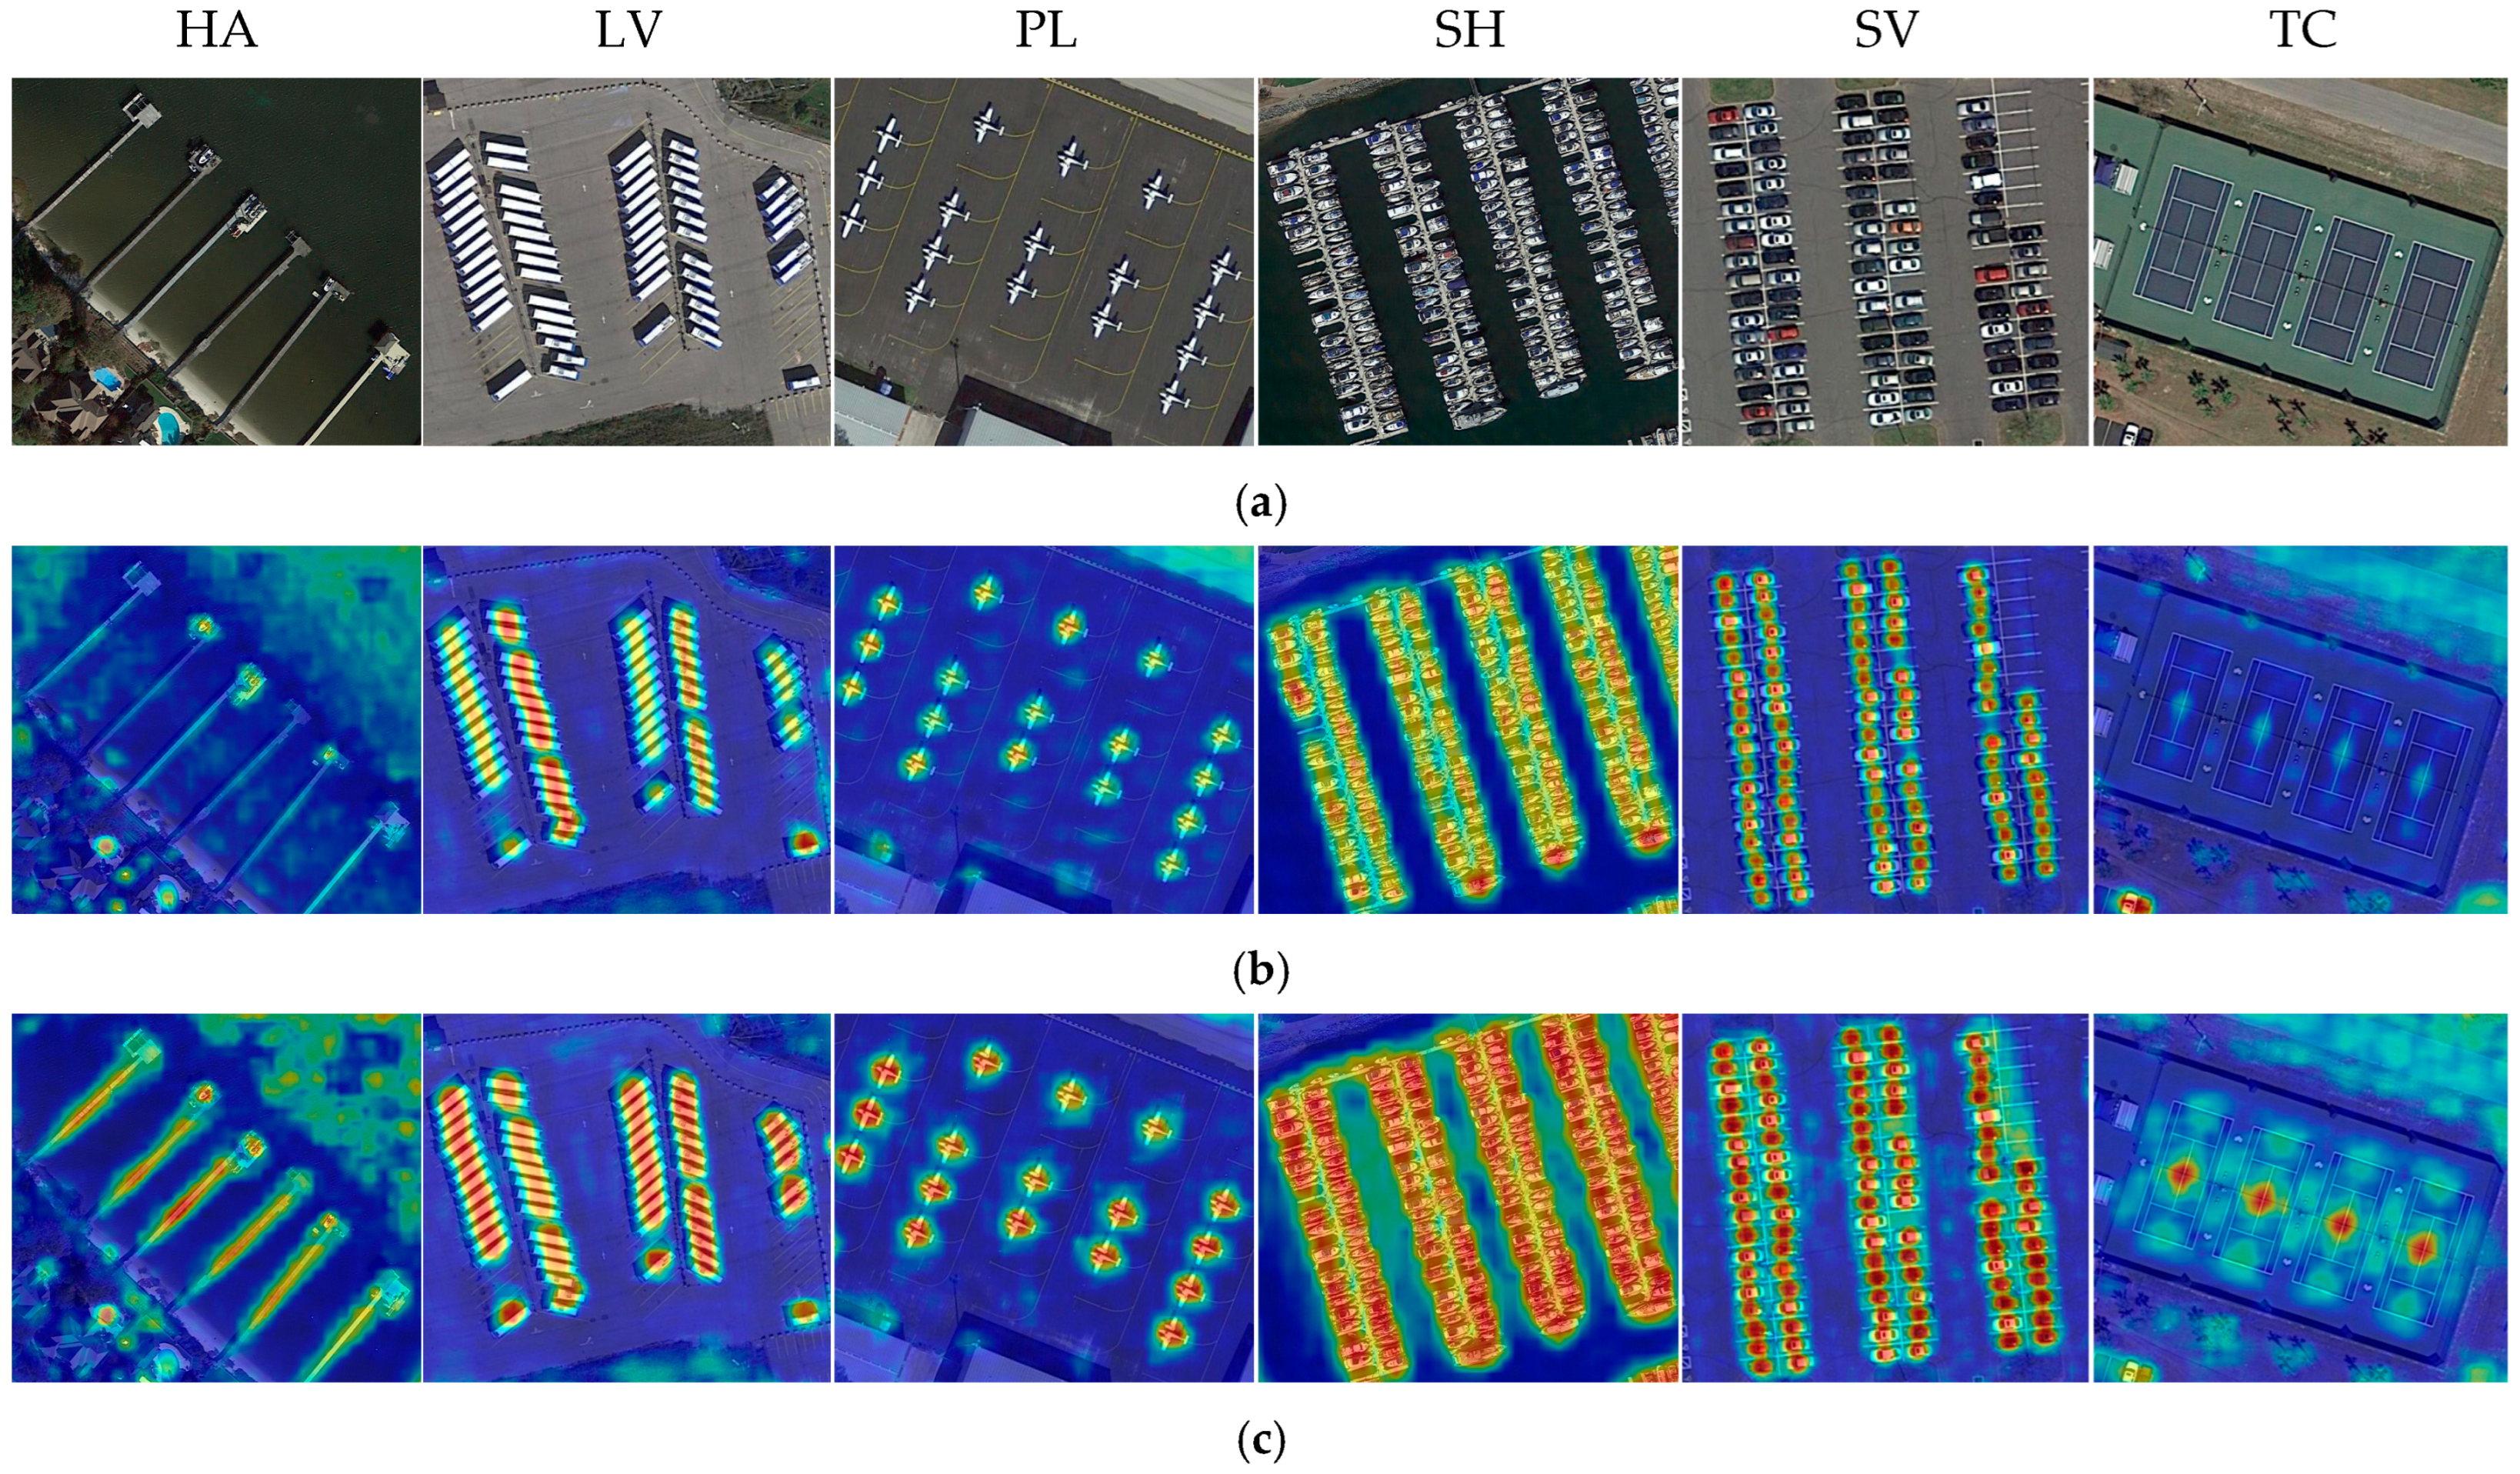
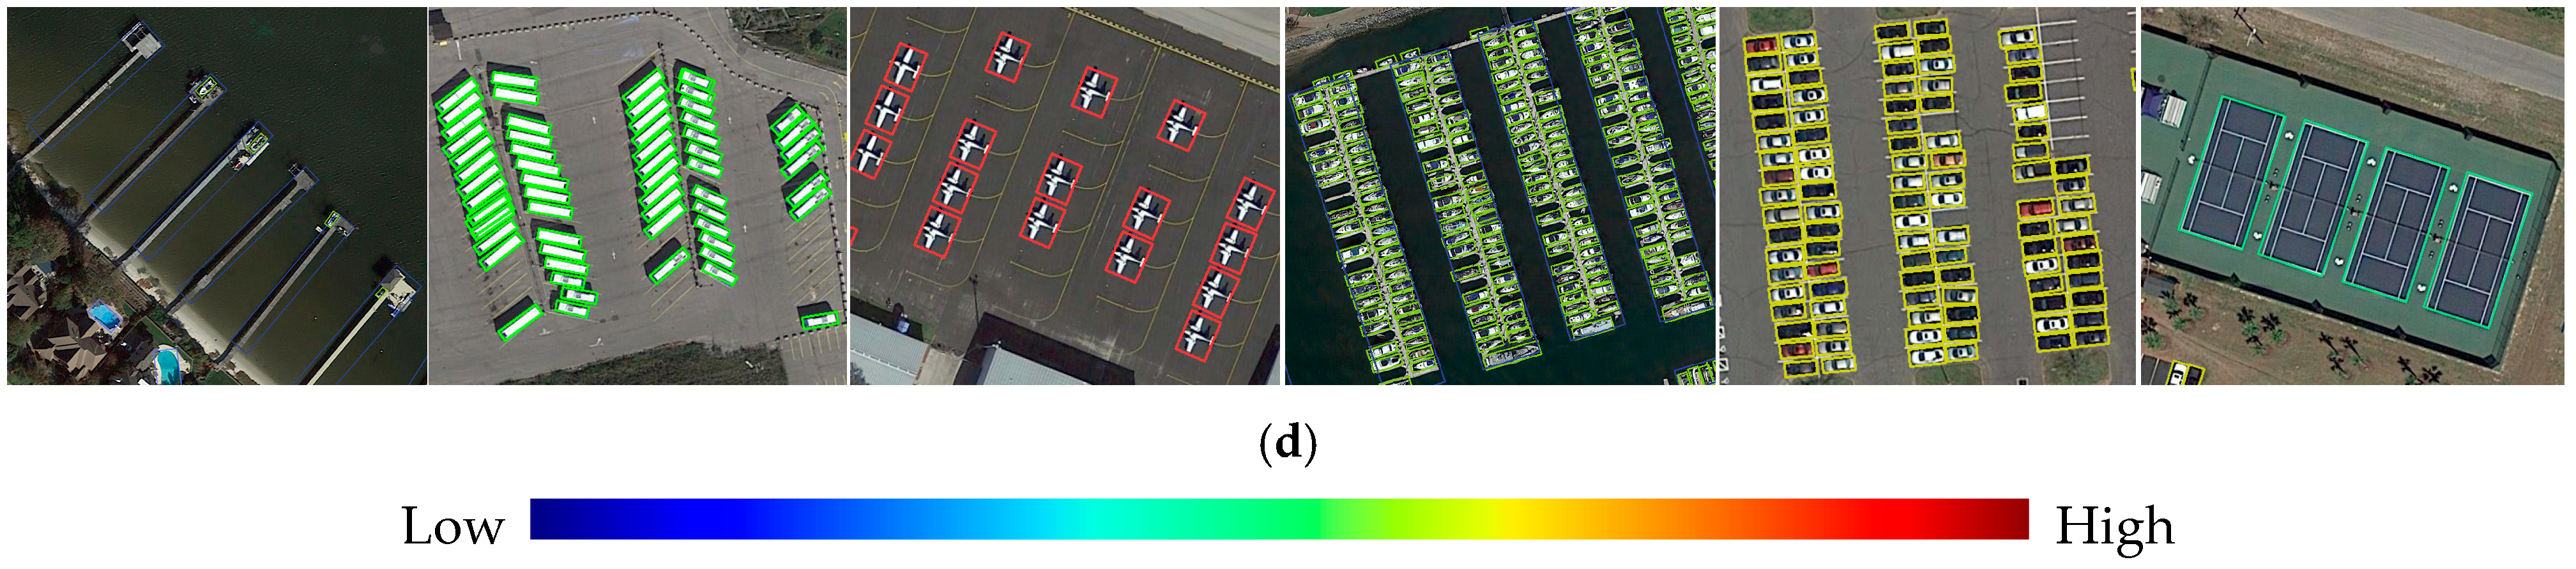
To highlight the advantages of VODet, we visualize the feature heatmaps of the baseline and our method in Figure 11. We select six instances of categories: PL, SV, LV, SH, TC, and HA, among which LV and HA represent large-aspect-ratio objects, while SV, LV, and SH are densely arranged objects. The figure shows that the baseline method fails to focus well on the objects due to angle regression discontinuity. In contrast, our method, which employs the vertex offset mechanism, orientation classification strategy, and MPDIoU loss, directs more attention to the objects themselves and enables precise localization. It not only effectively distinguishes between background and foreground but also excels in extracting features from large-aspect-ratio and densely arranged objects.
Figure 11.
Visualization of feature maps for 5PDet and VODet on DOTA. The red areas highlight the differences between the two outcomes. As shown, VODet demonstrates superior feature representation relative to 5PDet, especially for large-aspect-ratio and densely packed objects. (a) Input image. (b) Baseline. (c) VODet. (d) Detection result of VODet.
4. Discussion
4.1. Comparison with State-of-the-Art Methods
The reported results of the compared methods are collected from their original publications, where experimental settings (e.g., input sizes, training strategies, data augmentation, and post-processing) may vary. To ensure a fair comparison, we select methods that use the same backbone (ResNet-101) and input resolution (1024 × 1024 pixels) whenever possible, particularly for the efficiency evaluation. For accuracy comparison, we report the original results as published, which represent each method’s best performance under their respective optimal settings.
4.1.1. DOTA-V1.0
Table 4 compares VODet with current mainstream methods on DOTA-v1.0. For the comparison, oriented object detection algorithms are grouped into single-stage methods and two-stage methods. Single-stage detectors immediately output bounding box locations and categories, while two-stage detectors generate region proposals in the first stage, followed by classification and regression in the second.
Table 4.
Detection accuracy comparison between VODet and mainstream detectors on DOTA-v1.0.
As shown in the table, VODet obtains the highest accuracy for ships (SH) and the second-highest for planes (PL), small vehicles (SV), and large vehicles (LV). Notably, small vehicles and ships are typically densely arranged targets, while large vehicles belong to the category of large-aspect-ratio targets. This further demonstrates that VODet exhibits excellent detection capabilities for both dense targets and large-aspect-ratio targets. Among all single-stage detectors, VODet achieves the best mAP, surpassed only by the two-stage method DGRL. These results prove that the vertex offset mechanism, through continuous orientation modeling, effectively mitigates the loss of discontinuity caused by angular periodicity and can precisely capture geometric differences in predictions relative to ground truths, highlighting the advantage of our approach for oriented object detection.
The detection performance varies across different categories. For example, SH and TC achieve higher accuracy, 89.90% and 90.78%, respectively, while lower accuracy is observed on BR (57.63%) and SP (78.34%). This disparity is primarily due to class imbalance and inherent visual complexity, a phenomenon also observed in other state-of-the-art methods (e.g., DGRL: 59.70% on BR).
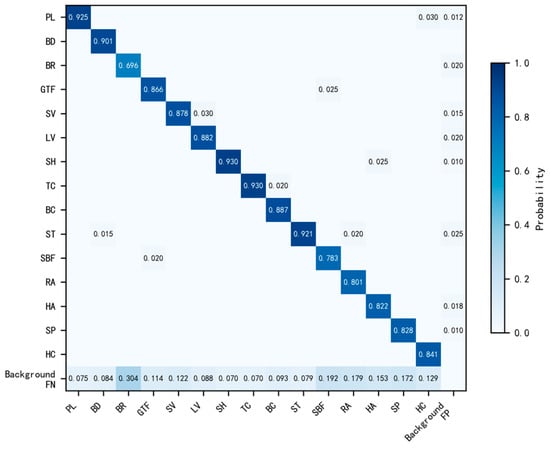
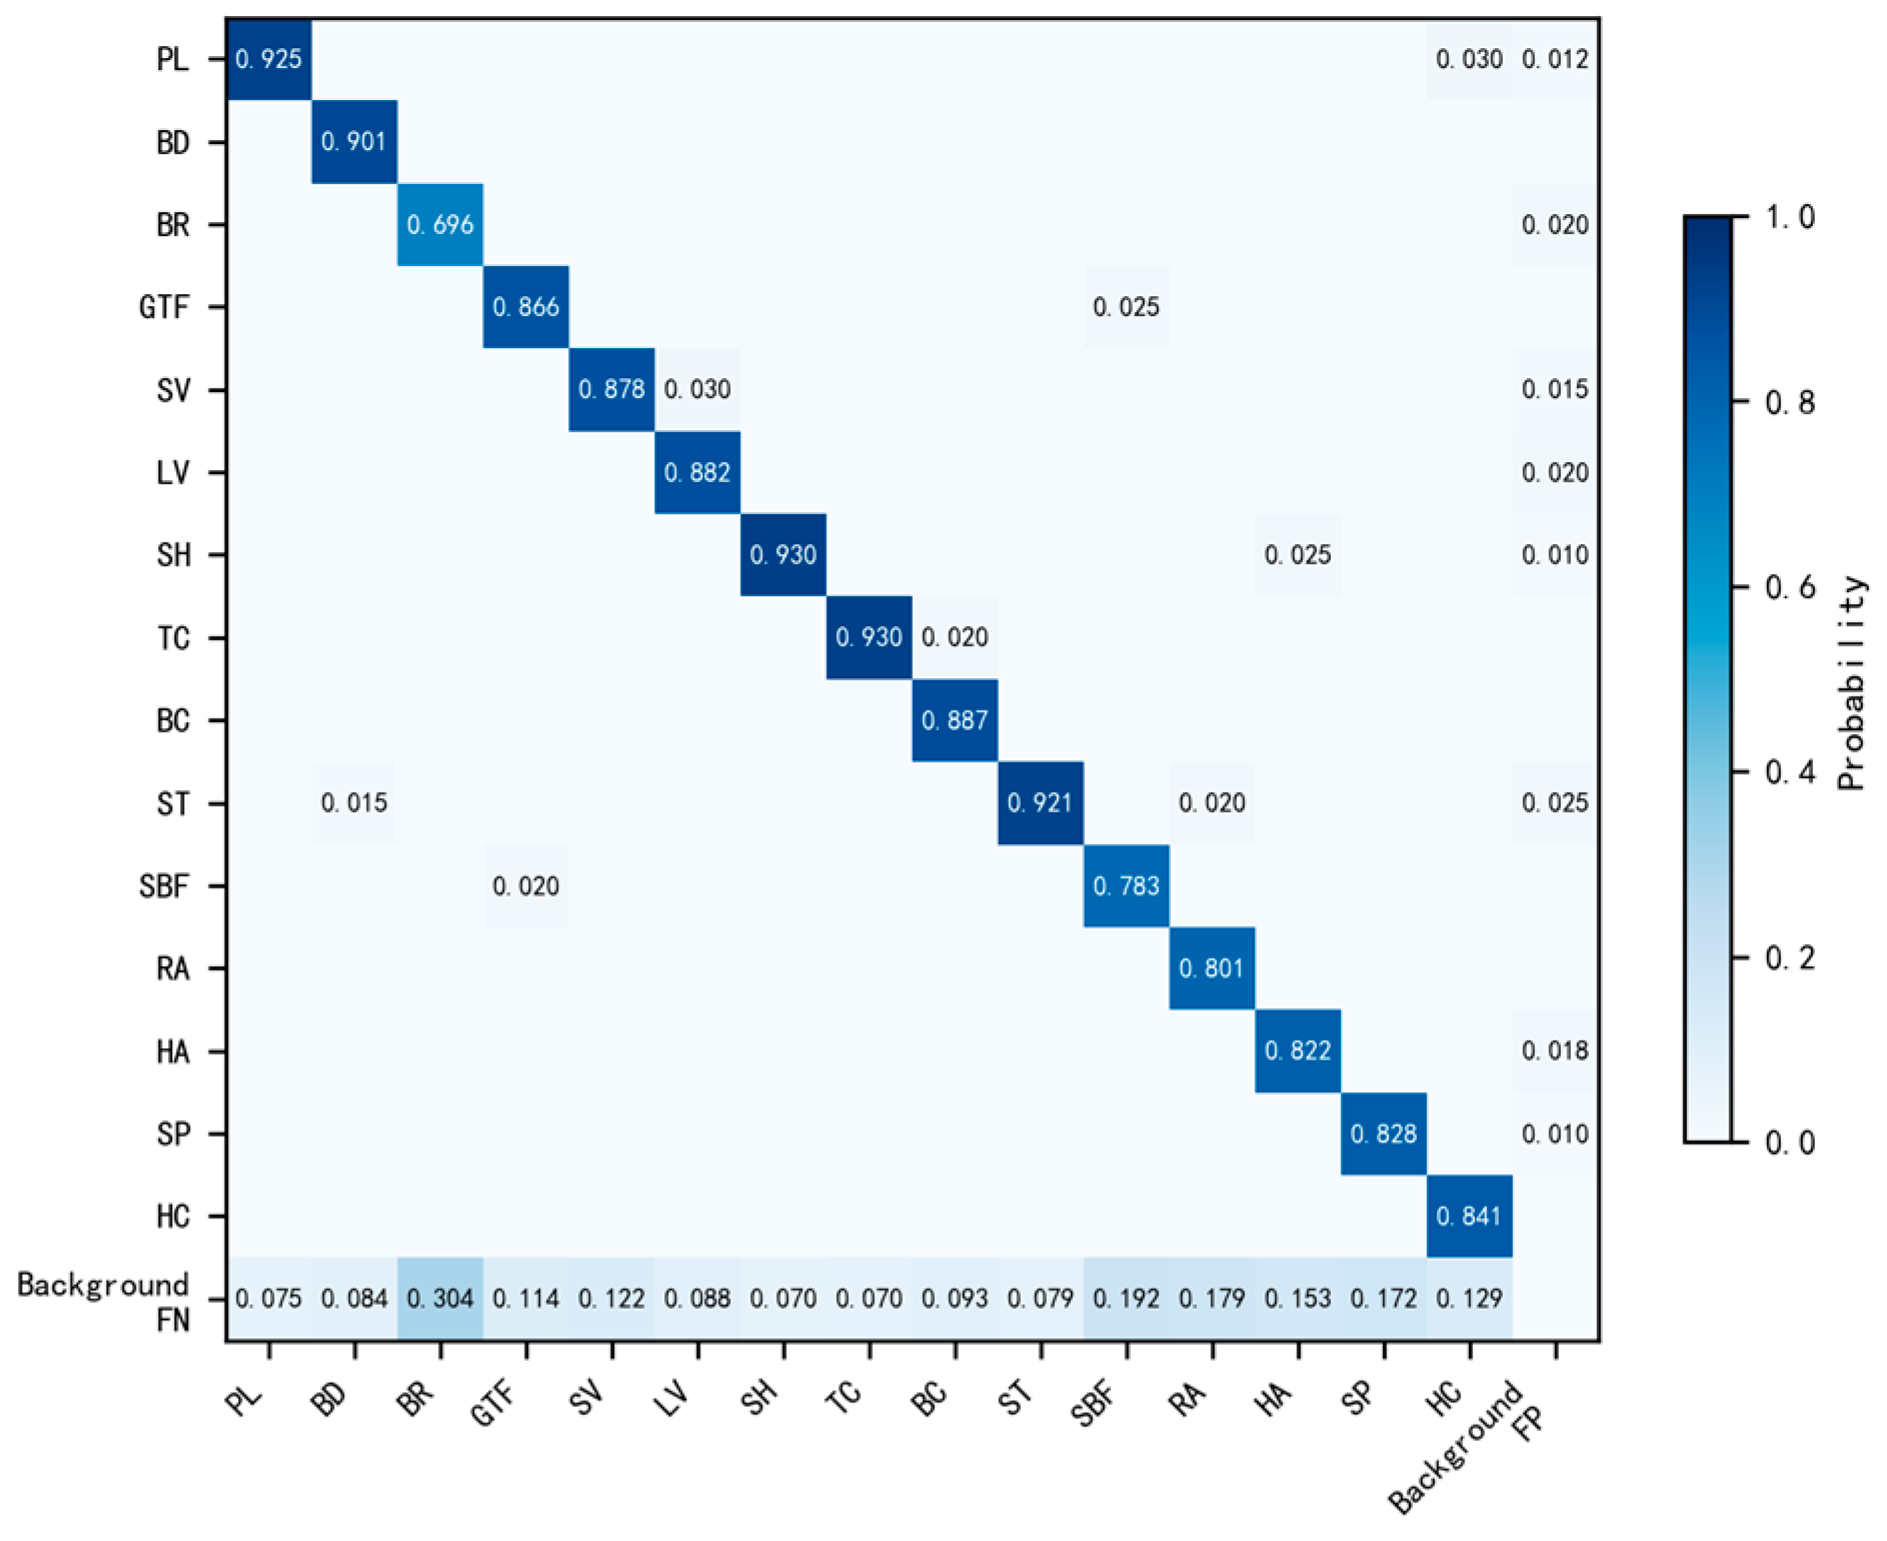
To gain deeper insights, we present the confusion matrix in Figure 12. As can be seen, several confusion patterns emerge between visually similar category pairs. For example, PL and HC are confused due to their similar aircraft shapes. GTF and SBF are confused because both are large field-type objects. SV and LV are confused as they share similar appearances except for scale. SH and HA are confused, possibly due to their spatial proximity in port scenes. In addition, background false positives occur for PL, BR, SV, LV, SH, ST, HA, and SP, indicating that the model sometimes mistakes complex background structures for these categories. False negatives are present across all categories, reflecting the detection difficulty of each class. These results confirm that VODet performs well on most categories, with remaining errors mainly caused by class imbalance, visual similarity, and background interference.
Figure 12.
Confusion matrix of VODet on the DOTA-v1.0. Rows represent predicted categories; columns represent ground truth. The last row corresponds to false negatives, and the last column corresponds to false positives. Brighter cells indicate higher normalized counts.
4.1.2. HRSC2016
Table 5 presents VODet’s detection accuracy relative to other state-of-the-art detectors on HRSC2016. HRSC2016 contains only the ‘ship’ category, in which the objects often exhibit extreme aspect ratios and arbitrary orientations. The results demonstrate that VODet’s detection performance is among the best, achieving an AP of 90.42%, second only to SDDLA’s 90.46%.
Table 5.
Detection accuracy of various detectors on HRSC2016.
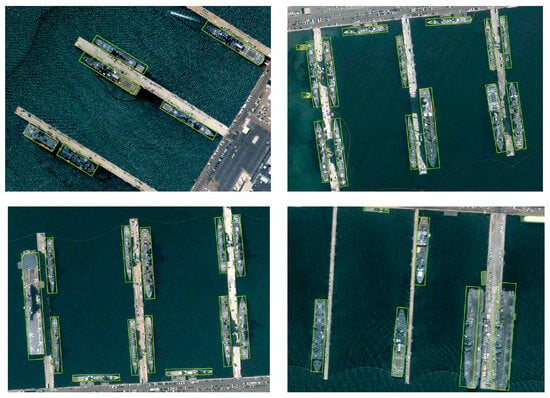
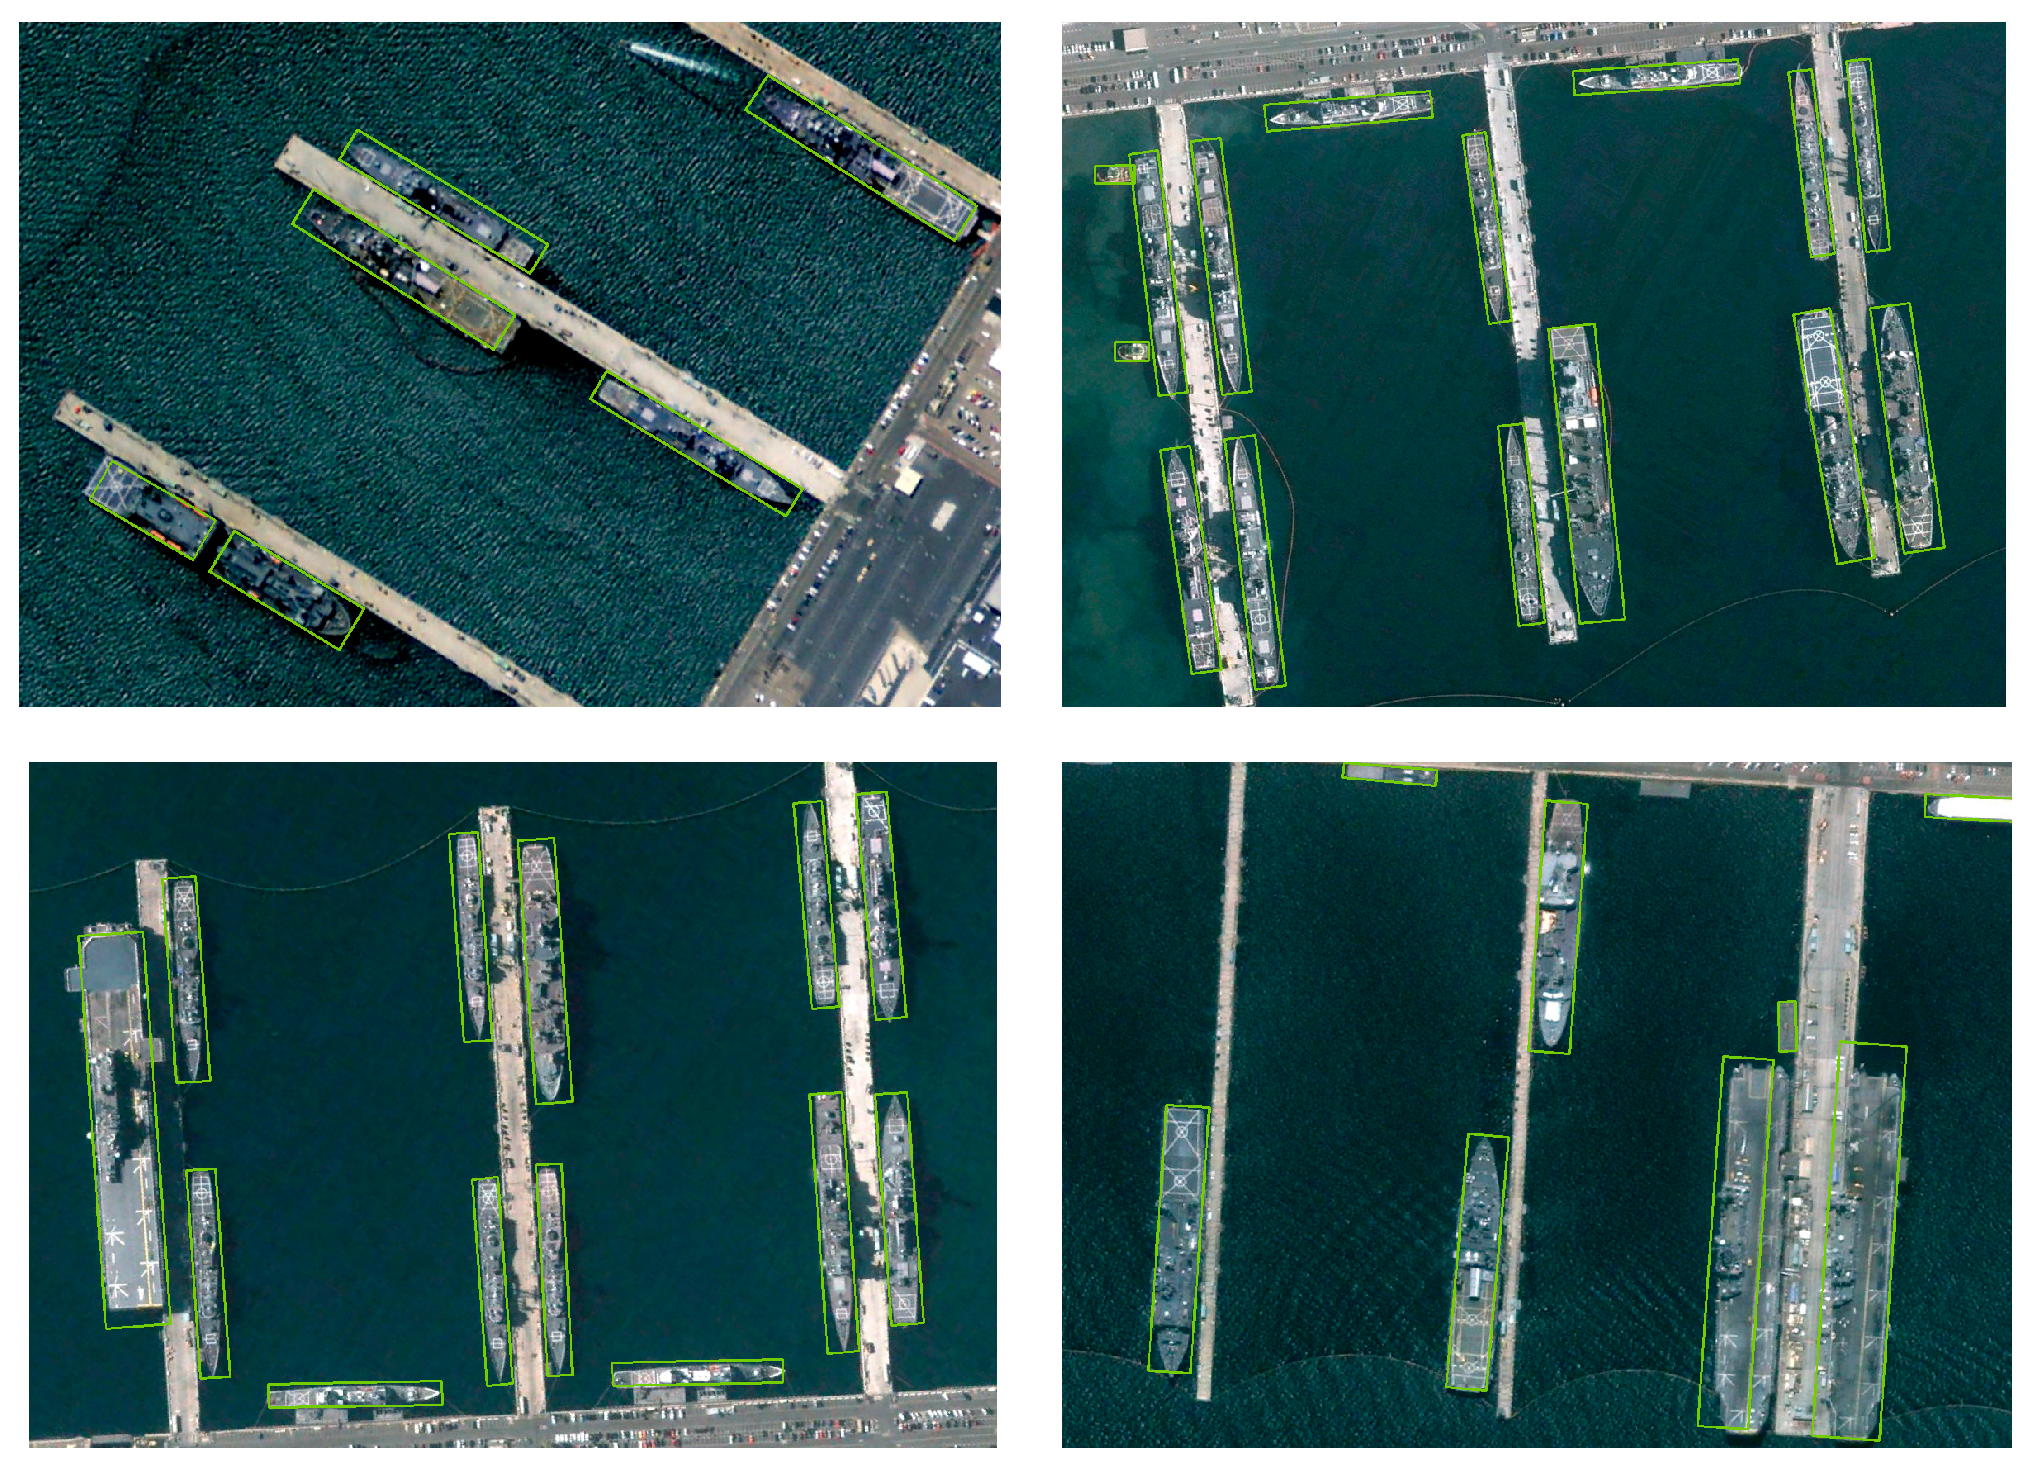
Figure 13 illustrates some detection examples of VODet on HRSC2016. Since ships are slender with large aspect ratios, detection effectiveness is easily affected. The proposed VODet can effectively address this challenge, achieving accurate detection.
Figure 13.
Example detections of VODet on HRSC2016.
4.1.3. UCAS-AOD
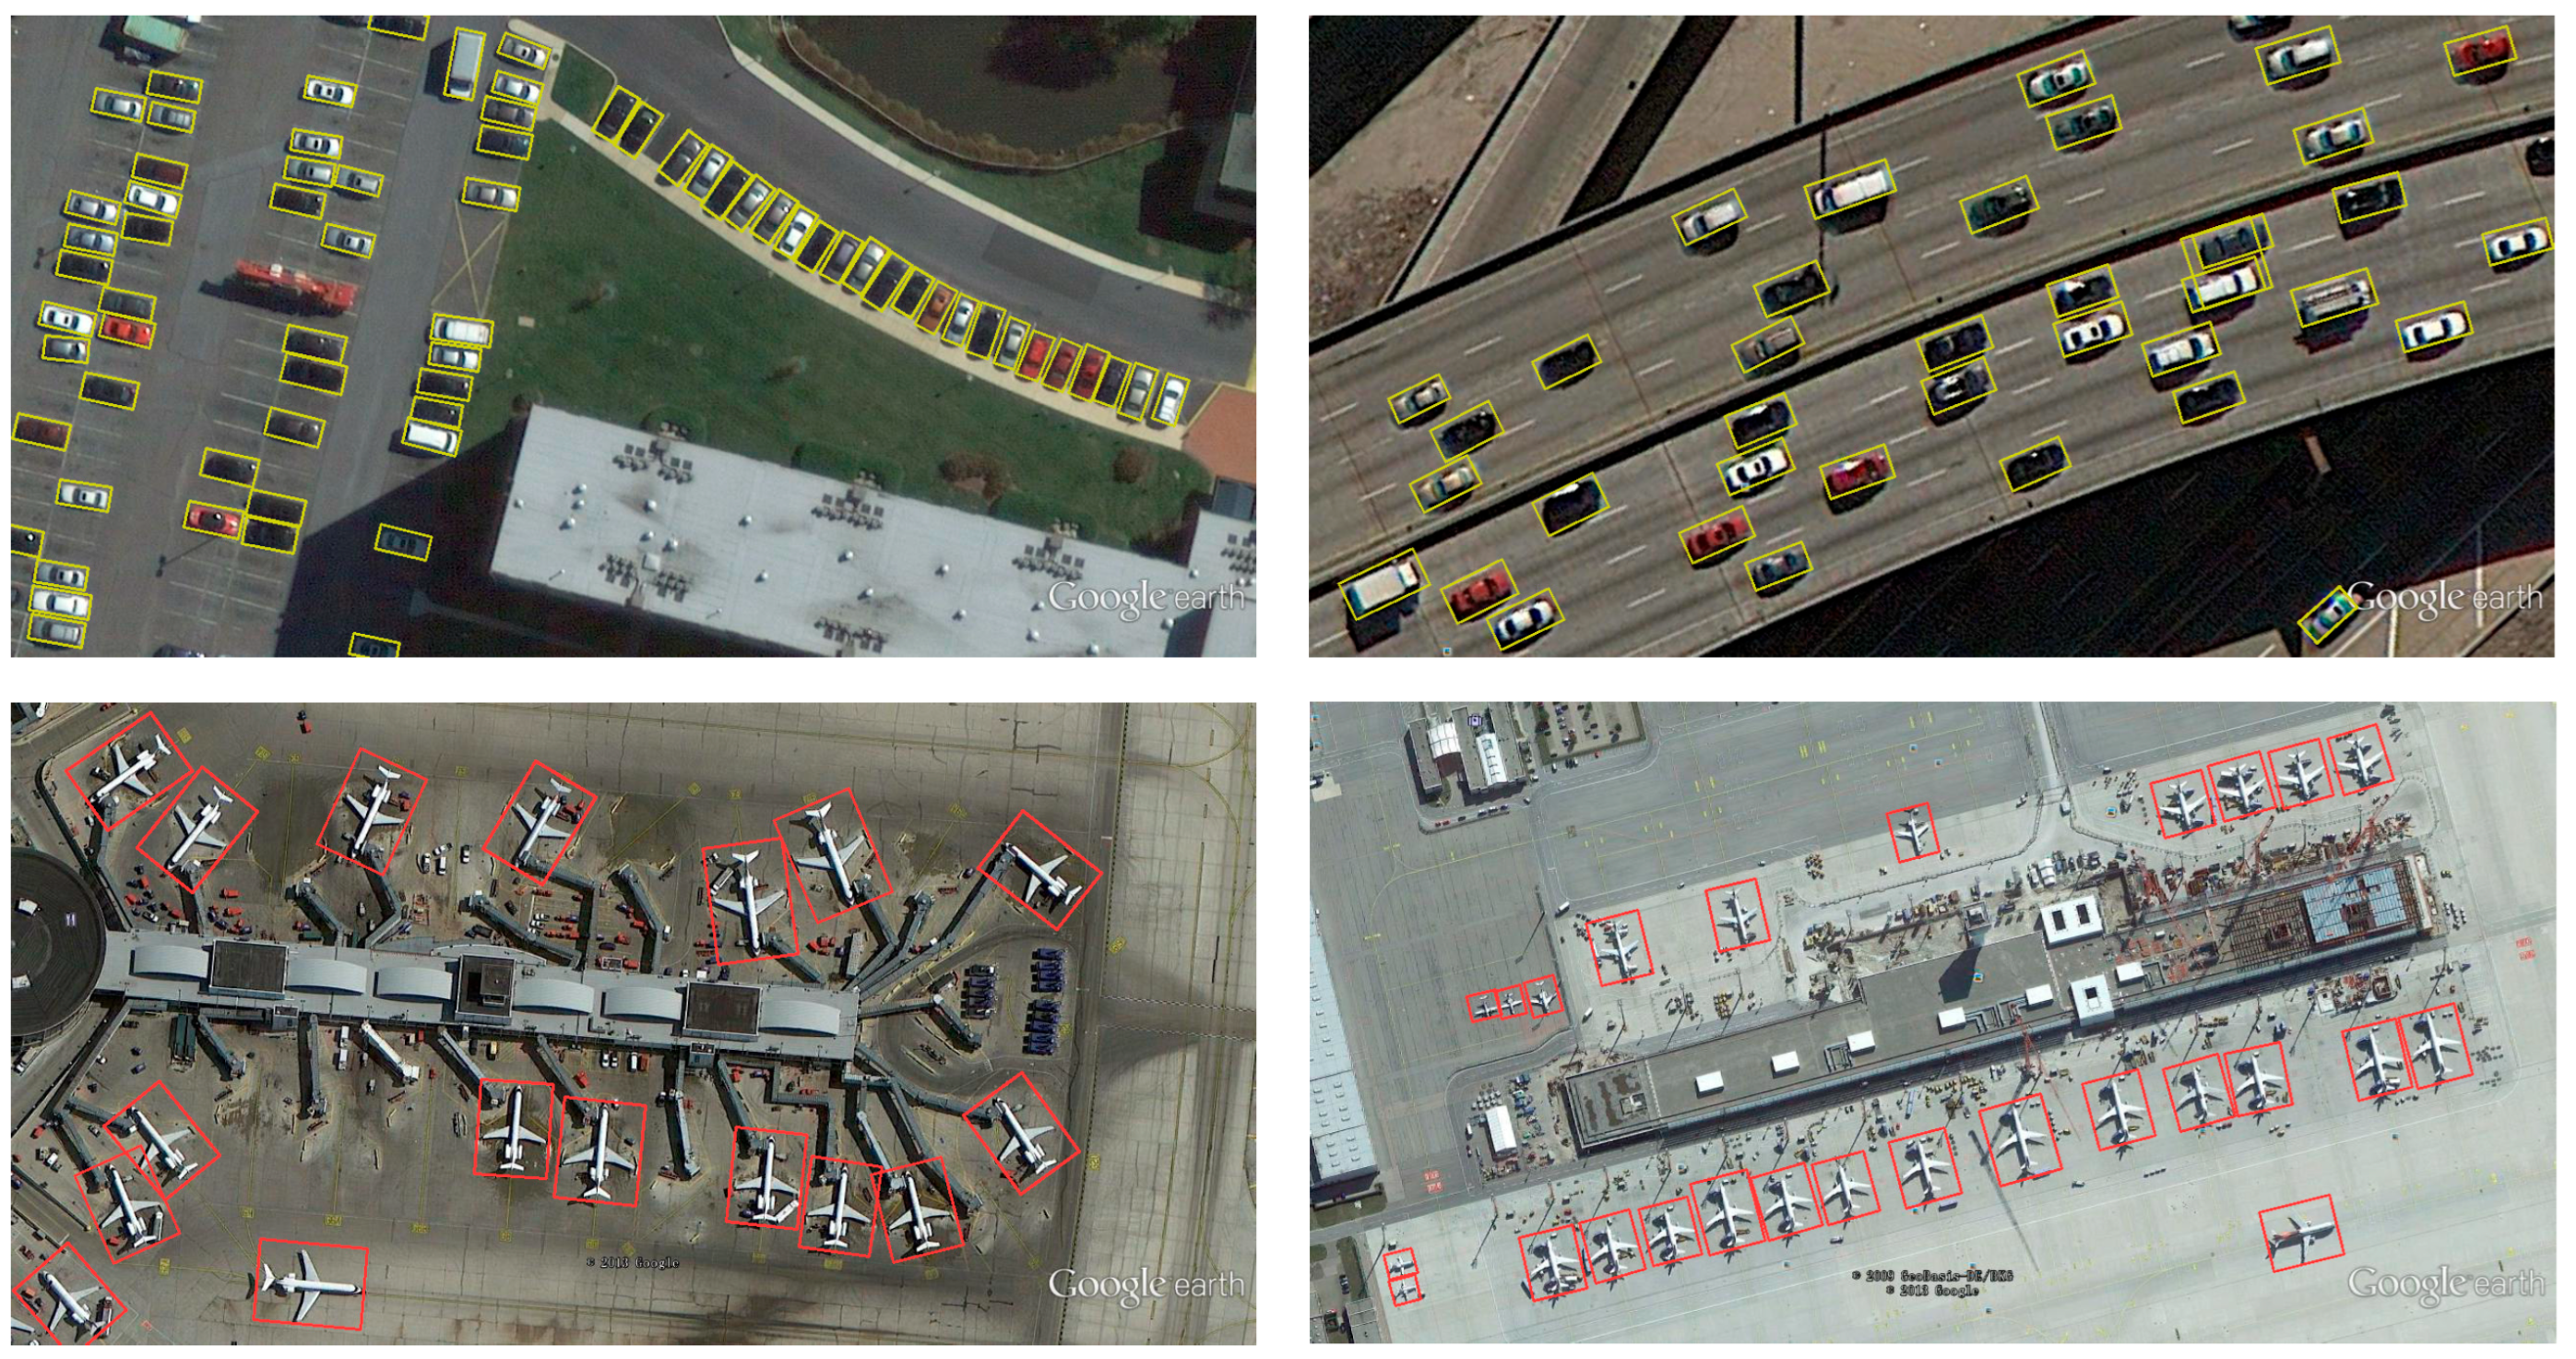
To further assess VODet’s performance, we performed experiments on the UCAS-AOD dataset, with outcomes summarized in Table 6. Table 6 shows that VODet ranks first for cars and second for airplanes, with values of 89.67% and 90.54%, respectively, and achieves the best mAP, demonstrating the effectiveness of the proposed method. Figure 14 presents sample detection results.
Table 6.
Detection accuracy of various detectors on UCAS-AOD.
Figure 14.
Example detections of VODet on UCAS-AOD.
4.1.4. Efficiency Comparison
To comprehensively evaluate the trade-off between detection accuracy and computational efficiency, we compare VODet with several state-of-the-art methods on the DOTA-v1.0 dataset in terms of mAP (%), FPS (img/s), FLOPs (G), and parameters (M), as shown in Table 7. Since it is difficult to obtain the inference speed of all detectors under identical configurations, we select representative one-stage and two-stage detectors that use ResNet-101 as the backbone for a fair comparison. The input image resolution is uniformly set to 1024 × 1024 pixels.
Table 7.
Accuracy and efficiency comparison with other methods on DOTA-v1.0.
As shown in Table 7, VODet achieves 80.44% mAP at 26.7 FPS, surpassing all compared single-stage methods in both accuracy and speed. It consumes the lowest FLOPs (192.3 G) among all compared methods. Notably, while DGRL achieves slightly higher accuracy, VODet runs substantially faster with 73.5 G fewer FLOPs. All these results indicate that VODet achieves a favorable balance between detection accuracy and computational efficiency.
4.2. Failure Case Analysis
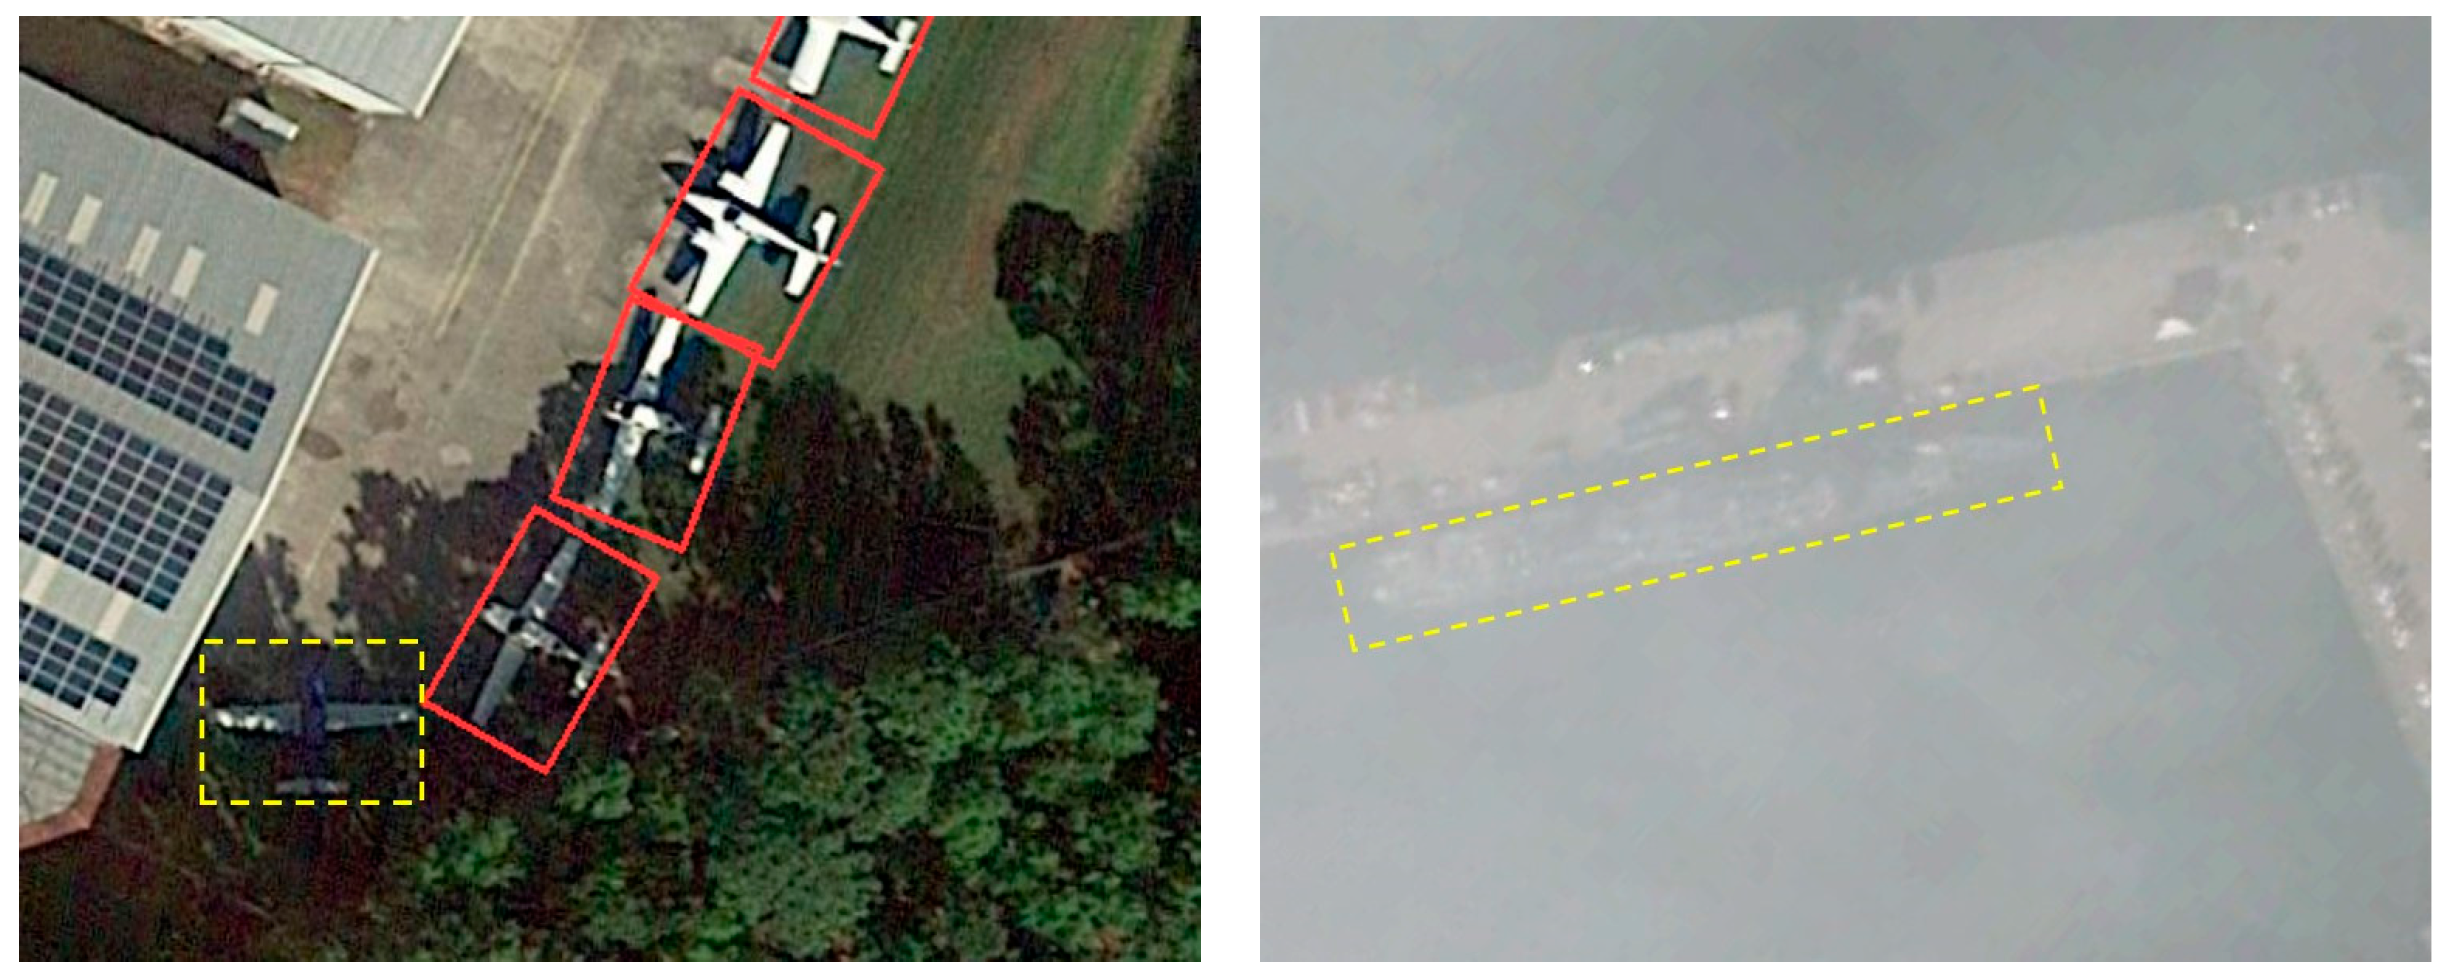
To further understand the limitations of VODet, we present representative failure cases in Figure 15. In the left image, the detection of planes is affected by severe shadow interference, which obscures part of the target region and leads to a missed detection of one plane. In the right image, the presence of heavy haze significantly reduces image quality, resulting in blurred boundaries of a ship target and causing the detector to fail in localizing it. These failures are primarily caused by weakened feature representations under degraded imaging conditions, which hinder the vertex offset regression and direction classification modules. This observation suggests that integrating image restoration techniques [26,27] as a preprocessing step could potentially enhance feature quality and improve detection robustness in such challenging scenarios. We consider this a promising direction for future work.
Figure 15.
Representative failure cases of VODet under degraded image conditions. The missed detections are highlighted by yellow dashed rectangles.
5. Conclusions
This paper proposes VODet, an oriented object detection framework specifically designed to address the boundary discontinuity and geometric inconsistency challenges in remote sensing images. Unlike traditional angle-based or multi-vertex regression methods, VODet introduces a continuous coupled vertex offset representation that regresses only two offset ratios relative to the horizontal enclosing box, directly reconstructing the four vertices of the rotated bounding box while enforcing geometric consistency. A lightweight direction classifier is further incorporated to handle near-horizontal critical cases. In addition, we design an enhanced backbone with the proposed HSAM and FPN to enrich multi-scale feature representation and adopt a task-specific matching rule with MPDIoU loss to improve localization accuracy. Extensive experiments validate that VODet attains competitive detection performance, with particular strengths in handling large aspect ratios and densely packed objects. Moreover, VODet achieves the highest inference speed and the lowest computational complexity among all compared methods, demonstrating a favorable accuracy-efficiency trade-off. The results confirm that our vertex offset paradigm effectively overcomes the limitations of angular parameterization. Furthermore, while VODet performs well on standard benchmarks, its robustness under degraded conditions such as cloud cover and haze remains to be explored. Integrating image enhancement and restoration techniques to improve detection reliability in such scenarios is a promising direction for future work. In addition, although VODet has been validated on aerial remote sensing datasets, its generalization to other domains (e.g., natural images or street-view scenes) has not been investigated. Exploring cross-domain adaptation for oriented object detection is another important direction for future research.
Author Contributions
D.L. and X.Y. conceived and designed the experiments; Z.L. and Y.P. performed the experiments; S.G. and F.G. analyzed the data; X.Y. and D.L. wrote the paper. Z.L. supervised the research. All authors have read and agreed to the published version of the manuscript.
Funding
This work was supported by the National Natural Science Foundation of China under Grant 42502302.
Data Availability Statement
DOTA v1.0: https://captain-whu.github.io/DOTA/ (accessed on 1 June 2024); HRSC2016: http://www.escience.cn/people/liuzikun/DataSet.html (accessed on 1 June 2024); UCAS-AOD: https://hyper.ai/cn/datasets/5419 (accessed on 1 June 2024).
Conflicts of Interest
The authors declare no conflict of interest.
References
- Zhao, J.; Ding, Z.; Zhou, Y.; Zhu, H.; Du, W.L.; Yao, R.; Saddik, A.E. OrientedFormer: An End-to-End Transformer-Based Oriented Object Detector in Remote Sensing Images. IEEE Trans. Geosci. Remote Sens. 2024, 62, 5640816. [Google Scholar] [CrossRef] [Scilit]
- Zhang, J.; Liu, H.; Zhang, Y.; Li, M.; Zhan, Z. Faster Transformer-DS: Multiscale Vehicle Detection of Remote-Sensing Images Based on Transformer and Distance-Scale Loss. IEEE J. Sel. Top. Appl. Earth Obs. Remote Sens. 2024, 17, 1961–1975. [Google Scholar] [CrossRef] [Scilit]
- Hu, Z.; Gao, K.; Zhang, X.; Wang, J.; Wang, H.; Yang, Z.; Li, C.; Li, W. EMO2-DETR: Efficient-Matching Oriented Object Detection with Transformers. IEEE Trans. Geosci. Remote Sens. 2023, 61, 5616814. [Google Scholar] [CrossRef] [Scilit]
- Ren, S.; He, K.; Girshick, R.; Sun, J. Faster R-CNN: Towards Real-Time Object Detection with Region Proposal Networks. IEEE Trans. Pattern Anal. Mach. Intell. 2017, 39, 1137–1149. [Google Scholar] [CrossRef] [Scilit] [PubMed]
- Liu, W.; Anguelov, D.; Erhan, D.; Szegedy, C.; Reed, S.; Fu, C.-Y.; Berg, A.C. SSD: Single Shot MultiBox Detector. In Proceedings of the Computer Vision—ECCV 2016; PT I; Springer International Publishing: Cham, Switzerland, 2016; pp. 21–37. [Google Scholar]
- Dai, J.; Li, Y.; He, K.; Sun, J. R-FCN: Object Detection via Region-based Fully Convolutional Networks. In Proceedings of the Advances in Neural Information Processing Systems 29 (NIPS 2016), Barcelona, Spain, 5–10 December 2016. [Google Scholar]
- Yang, X.; Yang, J.; Yan, J.; Zhang, Y.; Zhang, T.; Guo, Z.; Sun, X.; Fu, K. SCRDet: Towards More Robust Detection for Small, Cluttered and Rotated Objects. In Proceedings of the 2019 IEEE/CVF International Conference on Computer Vision, Seoul, Republic of Korea, 27 October–2 November 2019; pp. 8231–8240. [Google Scholar]
- Yang, X.; Yan, J.; Feng, Z.; He, T. R3Det: Refined Single-Stage Detector with Feature Refinement for Rotating Object. In Proceedings of the Thirty-Fifth AAAI Conference on Artificial Intelligence, Virtual, 2–9 February 2021; pp. 3163–3171. [Google Scholar]
- Azimi, S.M.; Vig, E.; Bahmanyar, R.; Koerner, M.; Reinartz, P. Towards Multi-class Object Detection in Unconstrained Remote Sensing Imagery. In Proceedings of the Computer Vision—ACCV 2018; Springer International Publishing: Cham, Switzerland, 2019; pp. 150–165. [Google Scholar]
- Ma, J.; Shao, W.; Ye, H.; Wang, L.; Wang, H.; Zheng, Y.; Xue, X. Arbitrary-Oriented Scene Text Detection via Rotation Proposals. IEEE Trans. Multimed. 2018, 20, 3111–3122. [Google Scholar] [CrossRef] [Scilit]
- Ding, J.; Xue, N.; Long, Y.; Xia, G.-S.; Lu, Q.; Soc, I.C. Learning RoI Transformer for Oriented Object Detection in Aerial Images. In Proceedings of the 2019 IEEE/CVF Conference on Computer Vision and Pattern Recognition (CVPR 2019), Long Beach, CA, USA, 15–20 June 2019; pp. 2844–2853. [Google Scholar]
- Han, J.; Ding, J.; Li, J.; Xia, G.-S. Align Deep Features for Oriented Object Detection. IEEE Trans. Geosci. Remote Sens. 2022, 60, 5602511. [Google Scholar] [CrossRef] [Scilit]
- Yang, X.; Yan, J. Arbitrary-Oriented Object Detection with Circular Smooth Label. In Proceedings of the Computer Vision—ECCV 2020; Springer International Publishing: Cham, Switzerland, 2020; pp. 677–694. [Google Scholar]
- Yang, X.; Hou, L.; Zhou, Y.; Wang, W.; Yan, J. Dense Label Encoding for Boundary Discontinuity Free Rotation Detection. In Proceedings of the 2021 IEEE/CVF Conference on Computer Vision and Pattern Recognition (CVPR 2021), Nashville, TN, USA, 20–25 June 2021; pp. 15814–15824. [Google Scholar]
- Shi, X.; Shan, S.; Kan, M.; Wu, S.; Chen, X. Real-Time Rotation-Invariant Face Detection with Progressive Calibration Networks. In Proceedings of the 2018 IEEE/CVF Conference on Computer Vision and Pattern Recognition (CVPR), Salt Lake City, UT, USA, 18–23 June 2018; pp. 2295–2303. [Google Scholar]
- Yang, X.; Yan, J.; Ming, Q.; Wang, W.; Zhang, X.; Tian, Q. Rethinking Rotated Object Detection with Gaussian Wasserstein Distance Loss. In Proceedings of the International Conference on Machine Learning, Virtual, 18–24 July 2021; Volume 139. [Google Scholar]
- Yang, X.; Yang, X.; Yang, J.; Ming, Q.; Wang, W.; Tian, Q.; Yan, J. Learning High-Precision Bounding Box for Rotated Object Detection via Kullback-Leibler Divergence. In Proceedings of the Advances in Neural Information Processing Systems (NeurIPS), Virtual, 6–14 December 2021. [Google Scholar]
- Doloriel, C.T.C.; Cajote, R.D. Improving the Detection of Small Oriented Objects in Aerial Images. In Proceedings of the 2023 IEEE/CVF Winter Conference on Applications of Computer Vision Workshops (WACVW), Waikoloa, HI, USA, 2–7 January 2023; pp. 176–185. [Google Scholar]
- Dong, Y.; Wei, M.; Gao, G.; Li, C.; Liu, Z. SARFA-Net: Shape-Aware Label Assignment and Refined Feature Alignment for Arbitrary-Oriented Object Detection in Remote Sensing Images. IEEE J. Sel. Top. Appl. Earth Obs. Remote Sens. 2025, 18, 8865–8881. [Google Scholar] [CrossRef] [Scilit]
- Han, J.; Ding, J.; Xue, N.; Xia, G.-S. ReDet: A Rotation-equivariant Detector for Aerial Object Detection. In Proceedings of the 2021 IEEE/CVF Conference on Computer Vision and Pattern Recognition (CVPR 2021), Nashville, TN, USA, 20–25 June 2021; pp. 2785–2794. [Google Scholar]
- Sun, P.; Zheng, Y.; Xu, W.; Yang, J. Dual-Stream Global Relationship Learning for Oriented Object Detection in Remote Sensing Images. IEEE J. Sel. Top. Appl. Earth Obs. Remote Sens. 2025, 18, 13652–13665. [Google Scholar] [CrossRef] [Scilit]
- Wang, X.; Jiang, Y.; Zhang, Z. ORENet: Oriented Rotation Equivariant Network for Remote Sensing Object Detection. IEEE Geosci. Remote Sens. Lett. 2025, 22, 6010905. [Google Scholar] [CrossRef] [Scilit]
- Xu, Y.; Fu, M.; Wang, Q.; Wang, Y.; Chen, K.; Xia, G.-S.; Bai, X. Gliding Vertex on the Horizontal Bounding Box for Multi-Oriented Object Detection. IEEE Trans. Pattern Anal. Mach. Intell. 2021, 43, 1452–1459. [Google Scholar] [CrossRef] [Scilit] [PubMed]
- Xie, X.; Cheng, G.; Wang, J.; Yao, X.; Han, J. Oriented R-CNN for Object Detection. In Proceedings of the 2021 IEEE/CVF International Conference on Computer Vision, Montreal, QC, Canada, 10–17 October 2021; pp. 3500–3509. [Google Scholar]
- Yi, J.; Wu, P.; Liu, B.; Huang, Q.; Qu, H.; Metaxas, D. Oriented Object Detection in Aerial Images with Box Boundary-Aware Vectors. In Proceedings of the 2021 IEEE Winter Conference on Applications of Computer Vision, Waikoloa, HI, USA, 3–8 January 2021; pp. 2149–2158. [Google Scholar]
- Liu, Y.; Li, T.; Zhou, Z.; Ren, W.; Lin, W. Real-World Nighttime Image Dehazing via Bayesian-Based Fractional-Order Variational Model. IEEE Trans. Image Process. 2026, 35, 4673–4685. [Google Scholar] [CrossRef] [Scilit] [PubMed]
- Gao, Y.; Yan, C.; Guo, J.; Zeng, H.; Li, J. NGSCD: Nighttime Glow Suppression for Visibility Enhancement via Structural Cascade Decomposition Model. Pattern Recognit. 2026, 176, 113073. [Google Scholar] [CrossRef] [Scilit]
- Liu, Y.; Li, T.; Tan, C.; Ren, W.; Ancuti, C.; Lin, W. IHDCP: Single Image Dehazing Using Inverted Haze Density Correction Prior. IEEE Trans. Image Process. 2026, 35, 1448–1461. [Google Scholar] [CrossRef] [Scilit] [PubMed]
- Liu, Y.; Wang, X.; Hu, E.; Wang, A.; Shiri, B.; Lin, W. VNDHR: Variational Single Nighttime Image Dehazing for Enhancing Visibility in Intelligent Transportation Systems via Hybrid Regularization. IEEE Trans. Intell. Transp. Syst. 2025, 26, 10189–10203. [Google Scholar] [CrossRef] [Scilit]
- Lin, T.-Y.; Dollár, P.; Girshick, R.; He, K.; Hariharan, B.; Belongie, S. Feature Pyramid Networks for Object Detection. In Proceedings of the 30th IEEE Conference on Computer Vision and Pattern Recognition, Honolulu, HI, USA, 21–26 July 2017; pp. 936–944. [Google Scholar]
- Liu, Z.; Lin, Y.; Cao, Y.; Hu, H.; Wei, Y.; Zhang, Z.; Lin, S.; Guo, B. Swin Transformer: Hierarchical Vision Transformer Using Shifted Windows. In Proceedings of the IEEE/CVF International Conference on Computer Vision, Montreal, QC, Canada, 10–17 October 2021; pp. 10012–10022. [Google Scholar]
- Ma, S.; Xu, Y. MPDIoU: A Loss for Efficient and Accurate Bounding Box Regression. arXiv 2023, arXiv:2307.07662. [Google Scholar]
- Xia, G.-S.; Bai, X.; Ding, J.; Zhu, Z.; Belongie, S.; Luo, J.; Datcu, M.; Pelillo, M.; Zhang, L. DOTA: A Large-Scale Dataset for Object Detection in Aerial Images. In Proceedings of the 2018 IEEE/CVF Conference on Computer Vision and Pattern Recognition, Salt Lake City, UT, USA, 18–22 June 2018; pp. 3974–3983. [Google Scholar]
- Liu, Z.; Yuan, L.; Weng, L.; Yang, Y. A High Resolution Optical Satellite Image Dataset for Ship Recognition and Some New Baselines. In Proceedings of the ICPRAM: Proceedings of the 6th International Conference on Pattern Recognition Applications and Methods, Porto, Portugal, 24–26 February 2017; pp. 324–331. [Google Scholar]
- Zhu, H.; Chen, X.; Dai, W.; Fu, K.; Ye, Q.; Jiao, J. Orientation Robust Object Detection in Aerial Images Using Deep Convolutional Neural Network. In Proceedings of the 2015 IEEE International Conference on Image Processing (ICIP), Quebec City, QC, Canada, 27–30 September 2015; pp. 3735–3739. [Google Scholar]
- Kingma, D.P.; Ba, J. Adam: A Method for Stochastic Optimization. In Proceedings of the 3rd International Conference on Learning Representations, San Diego, CA, USA, 7–9 May 2015. [Google Scholar]
- Zheng, Z.; Wang, P.; Ren, D.; Liu, W.; Ye, R.; Hu, Q.; Zuo, W. Enhancing Geometric Factors in Model Learning and Inference for Object Detection and Instance Segmentation. IEEE Trans. Cybern. 2022, 52, 8574–8586. [Google Scholar] [CrossRef] [Scilit] [PubMed]
- Hu, J.; Shen, L.; Sun, G. Squeeze-and-Excitation Networks. In Proceedings of the IEEE Conference on Computer Vision and Pattern Recognition, Salt Lake City, UT, USA, 18–22 June 2018; pp. 7132–7141. [Google Scholar]
- Woo, S.; Park, J.; Lee, J.Y.; Kweon, I.S. CBAM: Convolutional Block Attention Module. In Proceedings of the European Conference on Computer Vision (ECCV), Munich, Germany, 8–14 September 2018; pp. 3–19. [Google Scholar]
- Hou, Q.; Zhou, D.; Feng, J. Coordinate Attention for Efficient Mobile Network Design. In Proceedings of the IEEE/CVF Conference on Computer Vision and Pattern Recognition, Virtual, 19–25 June 2021; pp. 13713–13722. [Google Scholar]
- Zhao, P.; Qu, Z.; Bu, Y.; Tan, W.; Guan, Q. PolarDet: A fast, more precise detector for rotated target in aerial images. Int. J. Remote Sens. 2021, 42, 5821–5851. [Google Scholar] [CrossRef] [Scilit]
- Dai, L.; Liu, H.; Tang, H.; Wu, Z.; Song, P. AO2-DETR: Arbitrary-Oriented Object Detection Transformer. IEEE Trans. Circuits Syst. Video Technol. 2023, 33, 2342–2356. [Google Scholar] [CrossRef] [Scilit]
- Zhang, X.; Wu, Y.; Zhang, G.; Yuan, Y.; Cheng, G.; Wu, Y. Shape-Dependent Dynamic Label Assignment for Oriented Remote Sensing Object Detection. IEEE J. Sel. Top. Appl. Earth Obs. Remote Sens. 2025, 18, 132–146. [Google Scholar] [CrossRef] [Scilit]
- Xie, X.; Cheng, G.; Rao, C.; Lang, C.; Han, J. Oriented Object Detection via Contextual Dependence Mining and Penalty-Incentive Allocation. IEEE Trans. Geosci. Remote Sens. 2024, 62, 5618010. [Google Scholar] [CrossRef] [Scilit]
- Ming, Q.; Zhou, Z.; Miao, L.; Zhang, H.; Li, L. Dynamic Anchor Learning for Arbitrary-Oriented Object Detection. In Proceedings of the Thirty-Fifth AAAI Conference on Artificial Intelligence, 2–9 February 2021; pp. 2355–2363. [Google Scholar]
- Hou, L.; Lu, K.; Xue, J.; Li, Y.; Assoc Advancement Artificial, I. Shape-Adaptive Selection and Measurement for Oriented Object Detection. In Proceedings of the Thirty-Sixth AAAI Conference on Artificial Intelligence, Virtual, 22 February–1 March 2022; pp. 923–932. [Google Scholar]
- Ming, Q.; Miao, L.; Zhou, Z.; Yang, X.; Dong, Y. Optimization for Arbitrary-Oriented Object Detection via Representation Invariance Loss. IEEE Geosci. Remote Sens. Lett. 2022, 19, 8021505. [Google Scholar] [CrossRef] [Scilit]

Disclaimer/Publisher’s Note: The statements, opinions and data contained in all publications are solely those of the individual author(s) and contributor(s) and not of MDPI and/or the editor(s). MDPI and/or the editor(s) disclaim responsibility for any injury to people or property resulting from any ideas, methods, instructions or products referred to in the content. |
© 2026 by the authors. Licensee MDPI, Basel, Switzerland. This article is an open access article distributed under the terms and conditions of the Creative Commons Attribution (CC BY) license.