Article

Large-Scale Interseismic Crustal Deformation, Fault Slip Rate, Coupling and Earthquake Potential in the Upper Yellow River Basin


1
School of Geology Engineering and Geomatics, Chang’an University, Xi’an 710054, China
2
State Key Laboratory of Loess Science, Chang’an University, Xi’an 710054, China
3
Shaanxi Earthquake Agency, Xi’an 710068, China
4
China DK Comprehensive Engineering Investigation and Design Research Institute Co., Ltd., Xi’an 710016, China
*
Author to whom correspondence should be addressed.
Remote Sens. 2026, 18(14), 2297; https://doi.org/10.3390/rs18142297
Submission received: 6 June 2026 / Revised: 29 June 2026 / Accepted: 30 June 2026 / Published: 9 July 2026

Highlights

What are the main findings?
  • We derive a new high-resolution present-day deformation map around the Upper Yellow River Basin.
  • The inverted slip rates, interseismic coupling, and potential seismic moment on the active faults provide a basis for understanding kinematic processes and assessing seismic hazards in the study area.
What are the implications of the main findings?
  • We find ~2.3–3.5 mm/yr of right-lateral strike-slip motion along the Riyueshan Fault, and ~2.0–3.5 mm/yr of thrust rate on the Lajishan Fault, both of which have been less investigated previously.
  • The accumulated moment deficit could produce earthquakes of MW ≥ 6.0 along most active faults, and up to MW ≥ 7.0 along the Dongdatan-Xidatan and Maqin-Maqu segments of the East Kunlun Fault and the Jinqianghe segment of the Haiyuan Fault.

Abstract

The Upper Yellow River Basin (UYRB) is one of the most tectonically complex and seismically active regions in China, but the detailed crustal deformation and interseismic fault couplings, providing the essential parameters for geodynamics and seismic hazard analysis, are still unclear in this region. We thus adopt Sentinel-1 Synthetic Aperture Radar images to form frame-based line-of-sight velocity maps, and then derive a high-resolution surface deformation map around the UYRB. Slip rates and coupling states are further inverted for some active yet less-investigated faults. For instance, we estimate a right-lateral strike-slip motion of ~2.3–3.5 mm/yr along the Riyueshan Fault, and a thrust rate of ~2.0–3.5 mm/yr across the Lajishan Fault. Finally, the seismic moment budgets and the potential magnitudes are calculated based on the fault slip deficits and historical earthquakes. The accumulated moment deficit could produce earthquakes of MW ≥ 6.0 in most active faults, and up to MW ≥ 7.0 along the Dongdatan-Xidatan and Maqin-Maqu segments of the East Kunlun Fault and the Jinqianghe segment of the Haiyuan Fault. Our inverted slip rates, interseismic coupling states, and potential seismic moment on the active faults provide a basis for understanding kinematic processes and assessing seismic hazards within the UYRB.

1. Introduction

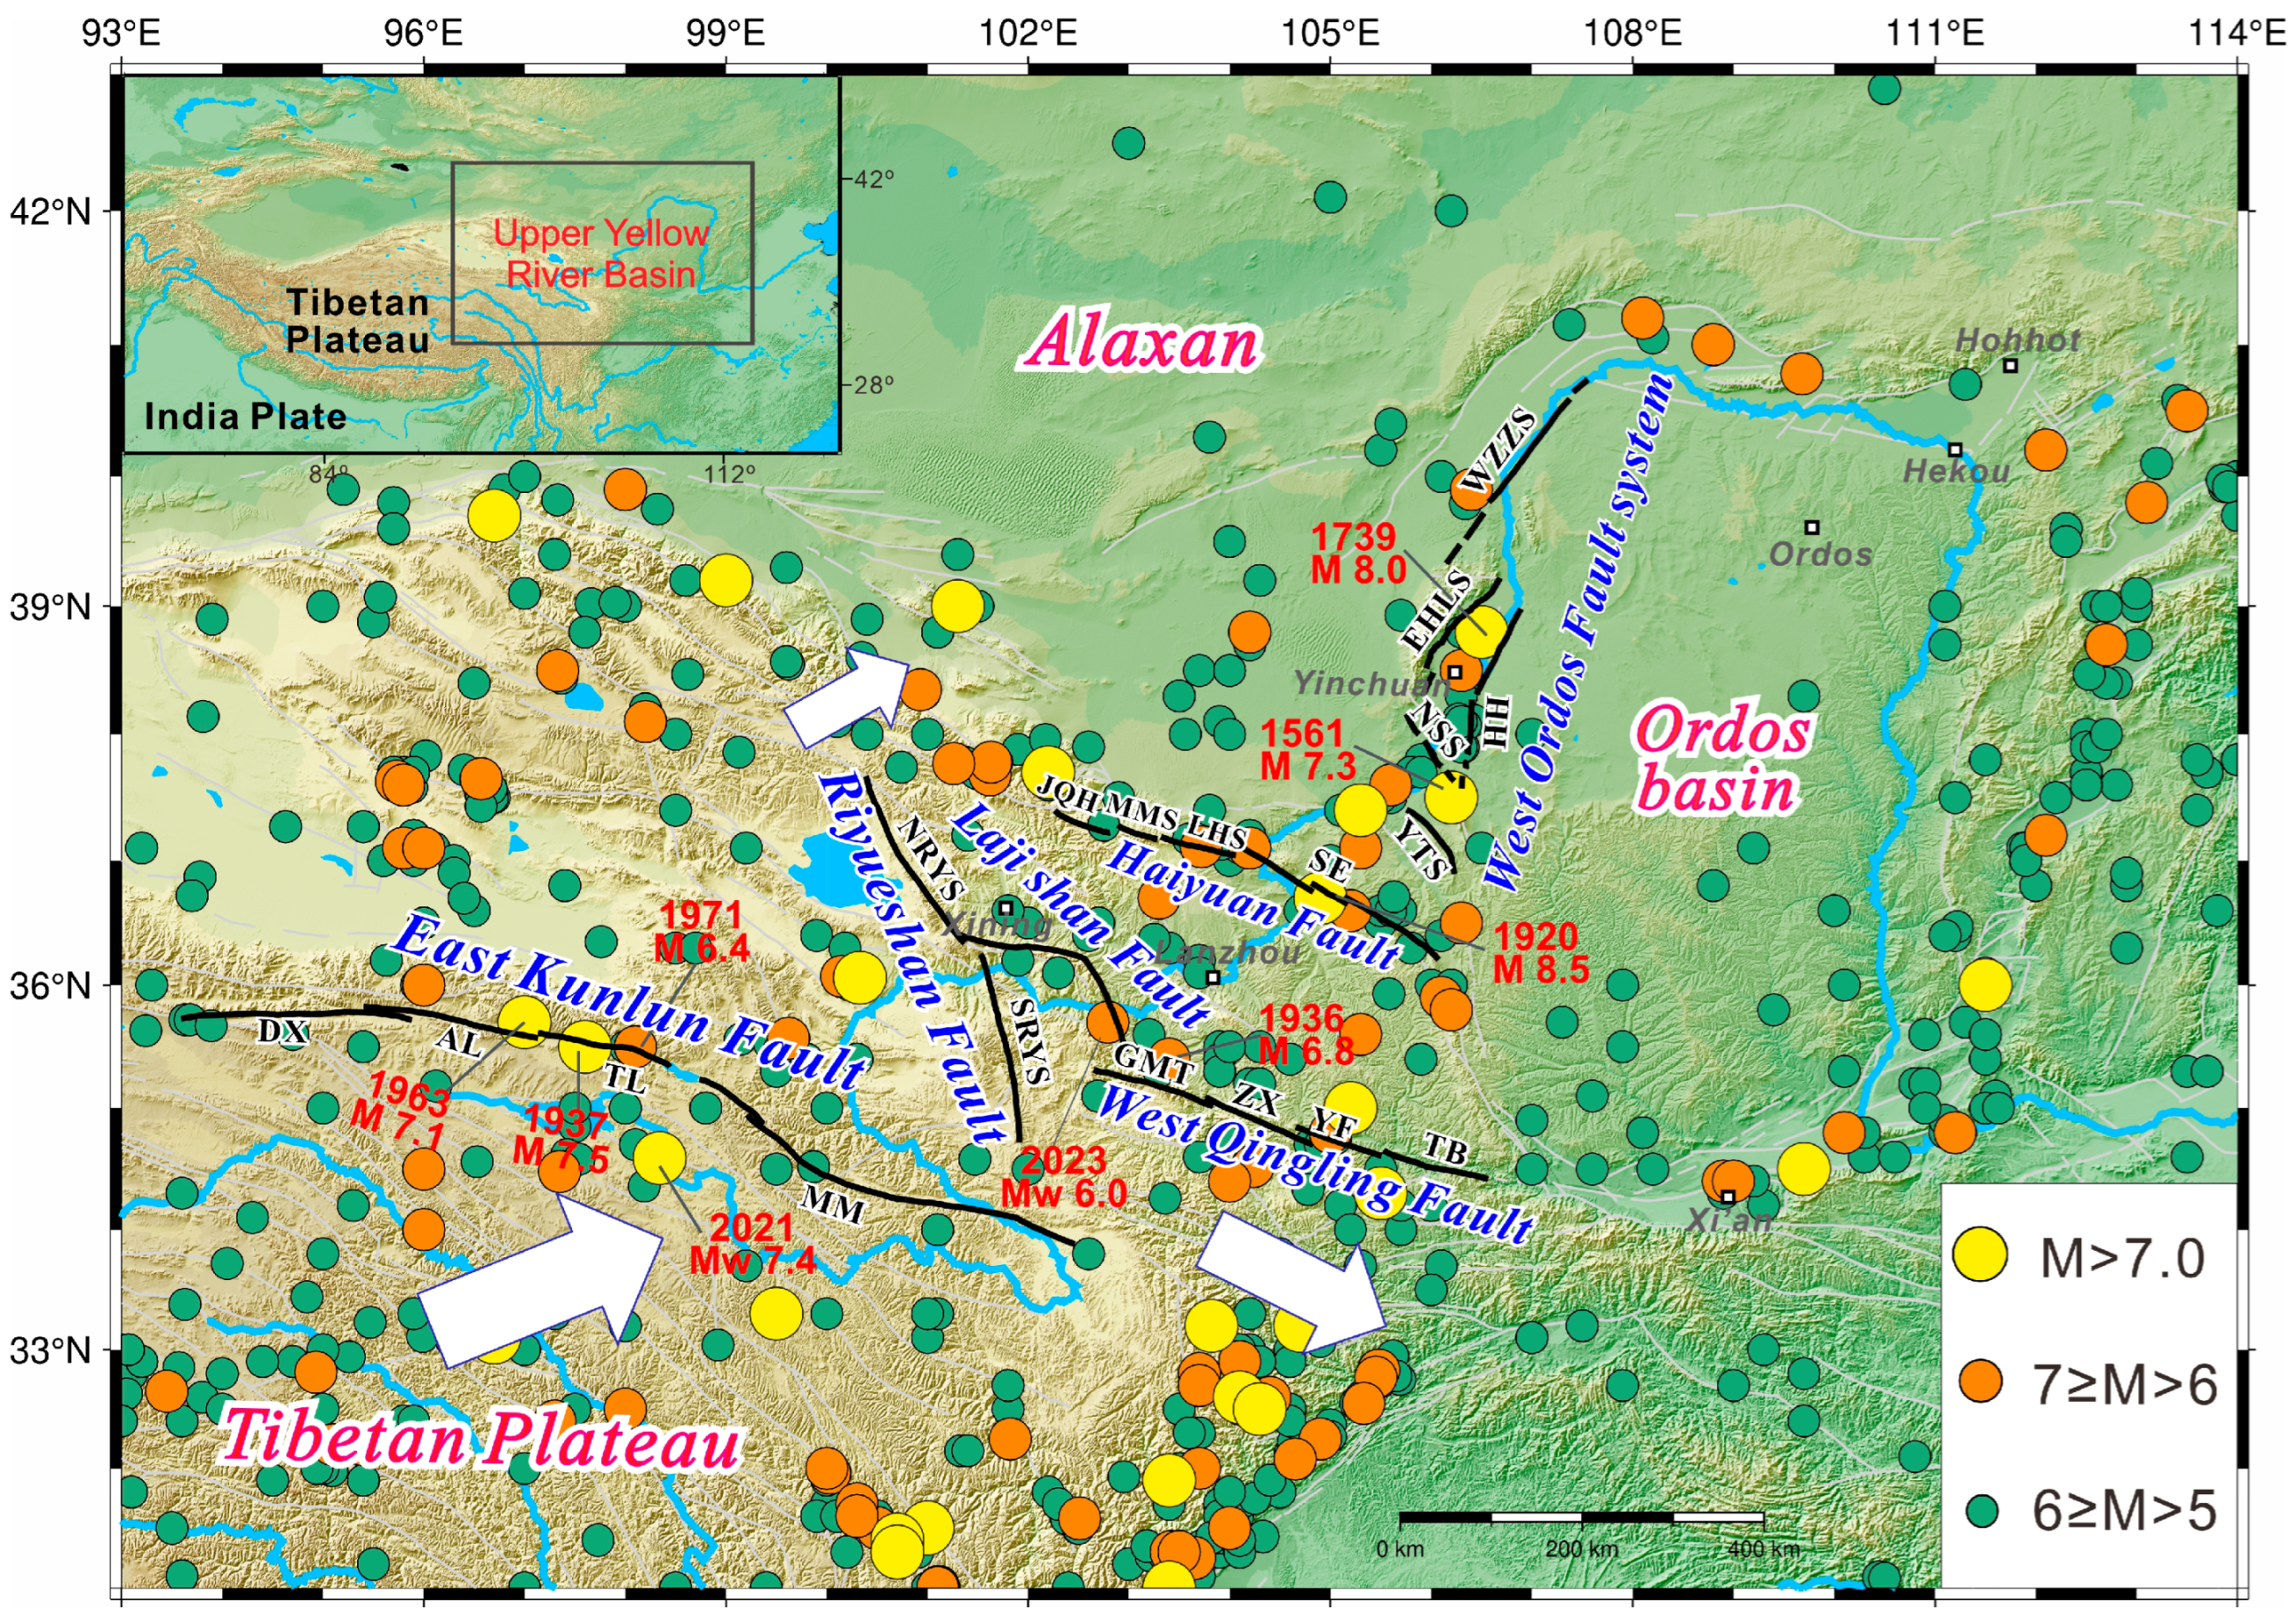
The Yellow River is “China’s Mother River”, flowing through nine provinces with a length of more than 5400 km. It also acts as an essential population and economic belt, as well as an important ecological barrier in China [1]. But the Upper Yellow River Basin (UYRB) is characterized by active tectonics and complex geological dynamics, and has suffered destructive earthquakes on a series of active faults such as the East Kunlun Fault, Riyueshan Fault, Lajishan Fault, West Qinling Fault, Haiyuan Fault, and West Ordos Fault System (Figure 1) [2,3]. Therefore, the UYRB is one of the most vulnerable geological environment belts and most dangerous seismicity zones in China [1].
The UYRB is primarily located in the northeastern Tibetan Plateau, north of the Songpan–Ganzi terrane and east of the Qaidam block, representing the northeastern leading front of the India–Eurasia collision [4,5]. In this area, northeastward and eastward migration of lithospheric material induces differential movements between crustal blocks along active faults, and such block kinematics give rise to frequent and destructive earthquakes [2]. As a large strike-slip fault accommodating the lateral extrusion of the Tibetan Plateau, the East Kunlun Fault (EKF) has experienced several large earthquakes during the past 100 years, especially along the Alake Lake (AL) and Tuosuo Lake (TL) segments around the UYRB [6,7], e.g., the 1937 M 7.5, 1963 M 7.1, and 1971 M 6.4 events (Figure 1). Although there was no strong earthquake in the past century along the Riyueshan Fault (RYSF), located in the Qaidam-Qilian block and divided into two parts by the Yellow River (Figure 1), the fault stress is continuously accumulated owing to the complex tectonic background around the northeastern Tibetan Plateau [8]. Some previous studies infer that the Lajishan Fault (LJSF), developed between the Laji Shan and Linxia Basin, is likely connected to the West Qinling Fault (WQLF) [3,9]. The connected area is traversed by the Yellow River from east to west, and experienced the 2023 MW 6.0 Jishishan earthquake [10,11]. The ~400 km long WQLF is located between the Qinling Orogen and northern Tibetan Plateau, mainly including four fault segments—Guomatan (GMT), Zhangxian (ZX), Yuanfeng (YF) and Tianshui-Boji (TB) Faults—and hosted the 734 M 7.0 and 1936 M 6.8 events [12,13]. The Haiyuan Fault (HF), a left-lateral system bounding the northeastern Plateau with more than 350 km length, can be basically divided into four segments in the study area: Jingqianghe (JQH), Maomaoshan (MMS), Laohushan (LHS) and southeast segments (SE, which hosted the 1920 M8 Haiyuan event) [14,15,16]. As the boundary between the Ordos and Alaxan Blocks, the West Ordos Fault System (WOFS), developed in the northern N-S Seismic Belt of China, consists of a series of faults, such as the West Zhuozishan (WZZS), East Helanshan (EHLS), Huanghe (HH), Niushoushan (NSS) and Yantongshan (YTS) Faults [17], and hosted the 1561 M 7¼ and 1739 M 8.0 events (Figure 1).
Until now, geodetic measurements such as Global Navigation Satellite System (GNSS) and Interferometric Synthetic Aperture Radar (InSAR) were applied to investigate fault activities and seismic hazards in the Tibetan Plateau [18,19,20,21,22]. The slip rates on some major faults were also widely studied, e.g., the East Kunlun Fault and Haiyuan Fault. For the EKF, the strike-slip rate was found to be quite fast between 92°E and 100°E (8–12 mm/yr, [23,24]), and decreasing toward the west to the Taiyang Lake Fault [7], resulting in one of the most seismically active belts in the north-central Tibetan Plateau. Based on InSAR observations, the overall strike-slip rate along the HF is estimated to increase from the westernmost part to Lenglongling and then decreased to the easternmost segment [3,14,15,25]. Hao et al. [13] approximately estimated that the WQLF experiences right-lateral strike slip with ~1–2 mm/yr based on GNSS and leveling observations. Some studies found that the RYSF shows a strike-slip motion (1–4 mm/yr) based on geological observations [8,26,27]. However, the activities on the other faults, such as the Riyueshan Fault and Lajishan Fault, have not been systematically studied, and knowledge of the West Qinling Fault and West Ordos Fault System is still limited, compared to what we know about the EKF and HY.
On the other hand, elastic deformation near the fault is caused by interseismic fault locking, and the accumulated energy is released through coseismic rupture, which indicates that the coupling state (also called the locking ratio) offers significant implications for the assessment of seismic potential. However, a high-resolution surface deformation rate map covering the entire UYRB is still lacking, as are systematic investigations into the slip rates and coupling states of some active faults (e.g., the Riyueshan and Lajishan Faults). Filling these research gaps can provide better constraints on regional tectonics and potential earthquake assessments, although interseismic crustal velocities around the northeastern Tibetan Plateau have been obtained in previous studies [3,14]. In addition, present-day crustal deformation is also key to evaluating the kinematics and coupling state of faults, which can further provide essential parameters for estimating strain accumulation and analyzing seismic hazard [21,22,28,29]. Therefore, in this study, we first use GNSS and InSAR observations to obtain high-resolution surface deformation rates around the UYRB, and then estimate the interseismic slip rate, locking ratio and slip deficits along the active faults based on the micro-block model. Furthermore, to improve our understanding of the future seismic risk in the Upper Yellow River Basin, we calculate the seismic moment budget of the active faults in combination with historical earthquake records.
Figure 1. Seismotectonic setting around the Upper Yellow River Basin. Blue and black lines indicate the mainstream river and the active faults of the Upper Yellow River [2,30], and white vectors represent GNSS-inferred tectonic motion. Different-colored circles represent the historical earthquakes with magnitudes > 5.0 since 1500 AD from the Division of Earthquake Risk Prediction, China Earthquake Administration (1995) and the China Earthquake Networks Center (https://www.ceic.ac.cn/). Fault segments are labeled in black: DX (Dongdatan-Xidatan), AL (Alake Lake), TL (Tuosuo Lake) MM (Maqin-Maqu) for the East Kunlun Fault; NRYS and SRYS for the northern and southern segments of the Riyueshan Fault; GMT (Guomatan), ZX (Zhangxian), YF (Yuanfeng), and TB (Tianshui–Baoji) for the West Qinling Fault; JQH (Jinqianghe), MMS (Maomaoshan), LHS (Laohushan), and SE (Southeastern part) for the Haiyuan Fault; WZZS (West Zhuozishan Fault), EHLS (East Helanshan Fault), NSS (Niushoushan Fault), HH (Huanghe Fault), and YTS (Yantongshan Fault) for the West Ordos Fault System.
Remotesensing 18 02297 g001

2. Surface Deformation Rate

2.1. Time-Series InSAR Data Processing

Time-series InSAR has proven to be a powerful tool for monitoring large-scale ground deformation over recent decades [14,31], because it can effectively reduce the observation errors (e.g., atmospheric delays, decorrelation and orbit noise) based on statistical or adjustment methods [32]. Therefore, in this study, we use Sentinel-1 SAR images spanning October 2017 to April 2023 for 9 ascending and 5 descending tracks to construct an InSAR time series from a stack of interferograms and subsequently estimate the surface deformation rate across the entire UYRB (Figure 2). This observation period has been demonstrated to be sufficient for capturing stable interseismic deformation signals [15,28,33]. Note that some SAR images likely related to coseismic rupture are deliberately excluded from this study (e.g., those acquired during the 2021 Maduo and 2022 Menyuan events) to ensure the quality of the interseismic signals.
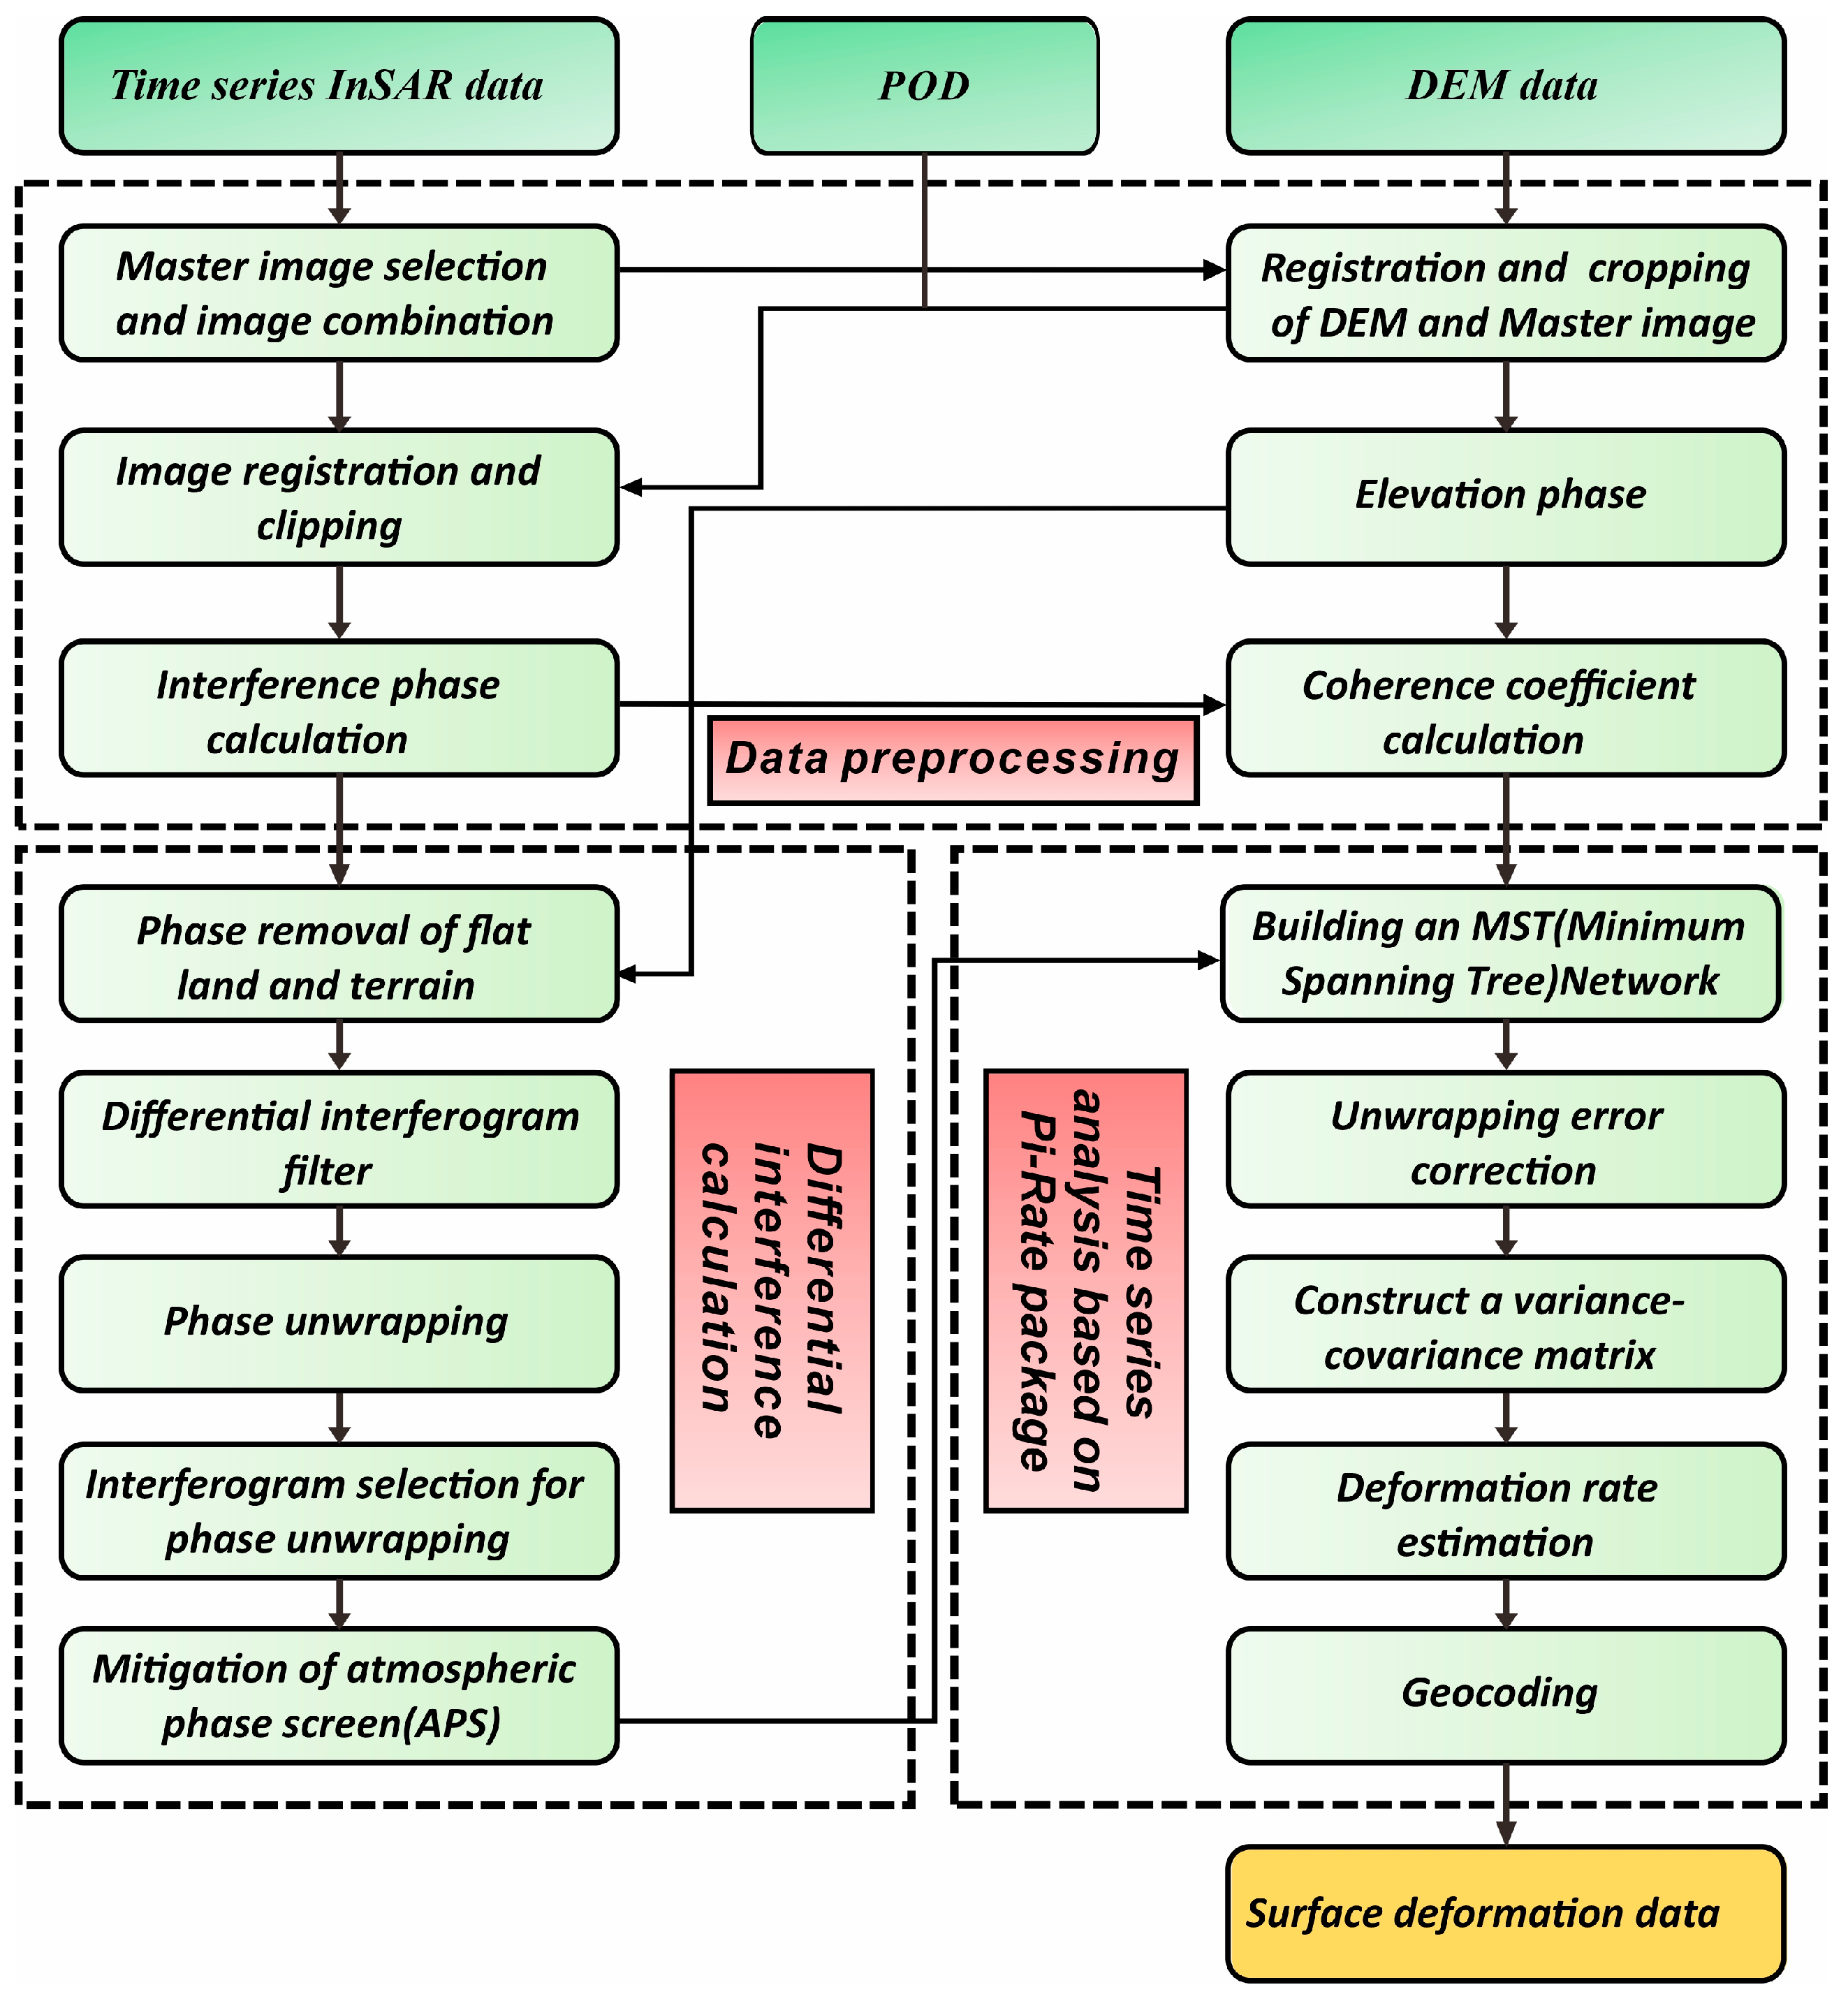
The selected raw SAR data was processed by three integrated modules to obtain the surface deformation rate: preprocessing, differential interference and time-series analysis (Figure 3). The co-registration of the master and slave images was performed using the Enhanced Spectral Diversity (ESD) method and further augmented with topographic corrections based on the 30 m-resolution SRTM DEM and Precise Orbit Ephemerides (POE) to meet the accuracy requirement (<0.001 pixels) [34]. The interferometric pairs were then generated using the Small Baseline Subset (SBAS) method, with spatial baselines of <80 m and temporal baselines ranging from 370 to 750 days, to better detect the interseismic deformation [35,36]. We also visually screened all interferometric images and discarded those potentially contaminated by postseismic signals prior to the time-series analysis.
Secondly, we adopted a streamlined workflow to enhance the phase processing quality (Figure 3). The flat-earth and topographic phases were first removed using DEM-simulated elevation corrections [37], and then a multi-looking operation of 30 × 6 (range × azimuth) was applied to improve the phase stability. Spatial decorrelation within low-coherence zones was dynamically suppressed using an adaptive Goldstein filter. Subsequently, a Minimum Spanning Tree (MST) network was constructed to impose constraints on spatiotemporal baselines and curb the propagation of associated errors [38].
Thirdly, the surface deformation signals were obtained via phase unwrapping and atmospheric mitigation based on the Pi-Rate (3.1) software package, a MATLAB tool for the time-series analysis [39,40]. In this module, phase unwrapping is performed using the Delaunay triangulation-guided Minimum Cost Flow (MCF) [41], and the atmospheric phase screens (APS) are mitigated using the spatiotemporal filtering of phase residuals based on a linear atmospheric model [42]. We further visually checked the interferograms to confirm that there was no obvious residual orbital, unwrapping or atmospheric errors, and then constructed a variance–covariance matrix to assign weights of the high-coherence interferograms for deformation estimation. Finally, the line-of-sight (LOS) displacement time series were inverted using the weighted least-squares method [43], yielding cumulative deformation with quantified uncertainties. As a result, no prominent coseismic and postseismic anomalies were identified in the deformation rate map, indicating that their impacts on our inversion results were quite limited.

2.2. Deformation Rate Derived from Geodetic Observations

The LOS velocity map after the time-series analysis usually shows discernible boundaries between frames and tracks, which are mainly caused by differences in local referencing among the frames and by changes in the incidence angles [3,14]. Therefore, a joint inversion of InSAR, GNSS and leveling data, which minimizes the LOS velocity differences between frames and tracks and the velocity differences between the InSAR LOS and GNSS LOS [44], is adopted to obtain the high-resolution deformation rate within the same reference frame [14]. In this study, there are 144 horizontal GNSS velocities located within the observation range of the Sentinel-1 tracks mentioned above, taken from Wang and Shen [19], and 25 vertical GNSS velocities published in the study of Liang et al. [45], as shown in Figure 2. Because the vertical GNSS velocities are quite limited compared with the horizontal components, we also incorporate leveling data [46] and then interpolate the vertical GNSS and leveling velocities to the locations of the horizontal GNSS sites using the universal kriging algorithm, which has been proved to be a reasonable approach because the contribution of the vertical velocities to the LOS is less than 1 mm/yr in the study area [14].
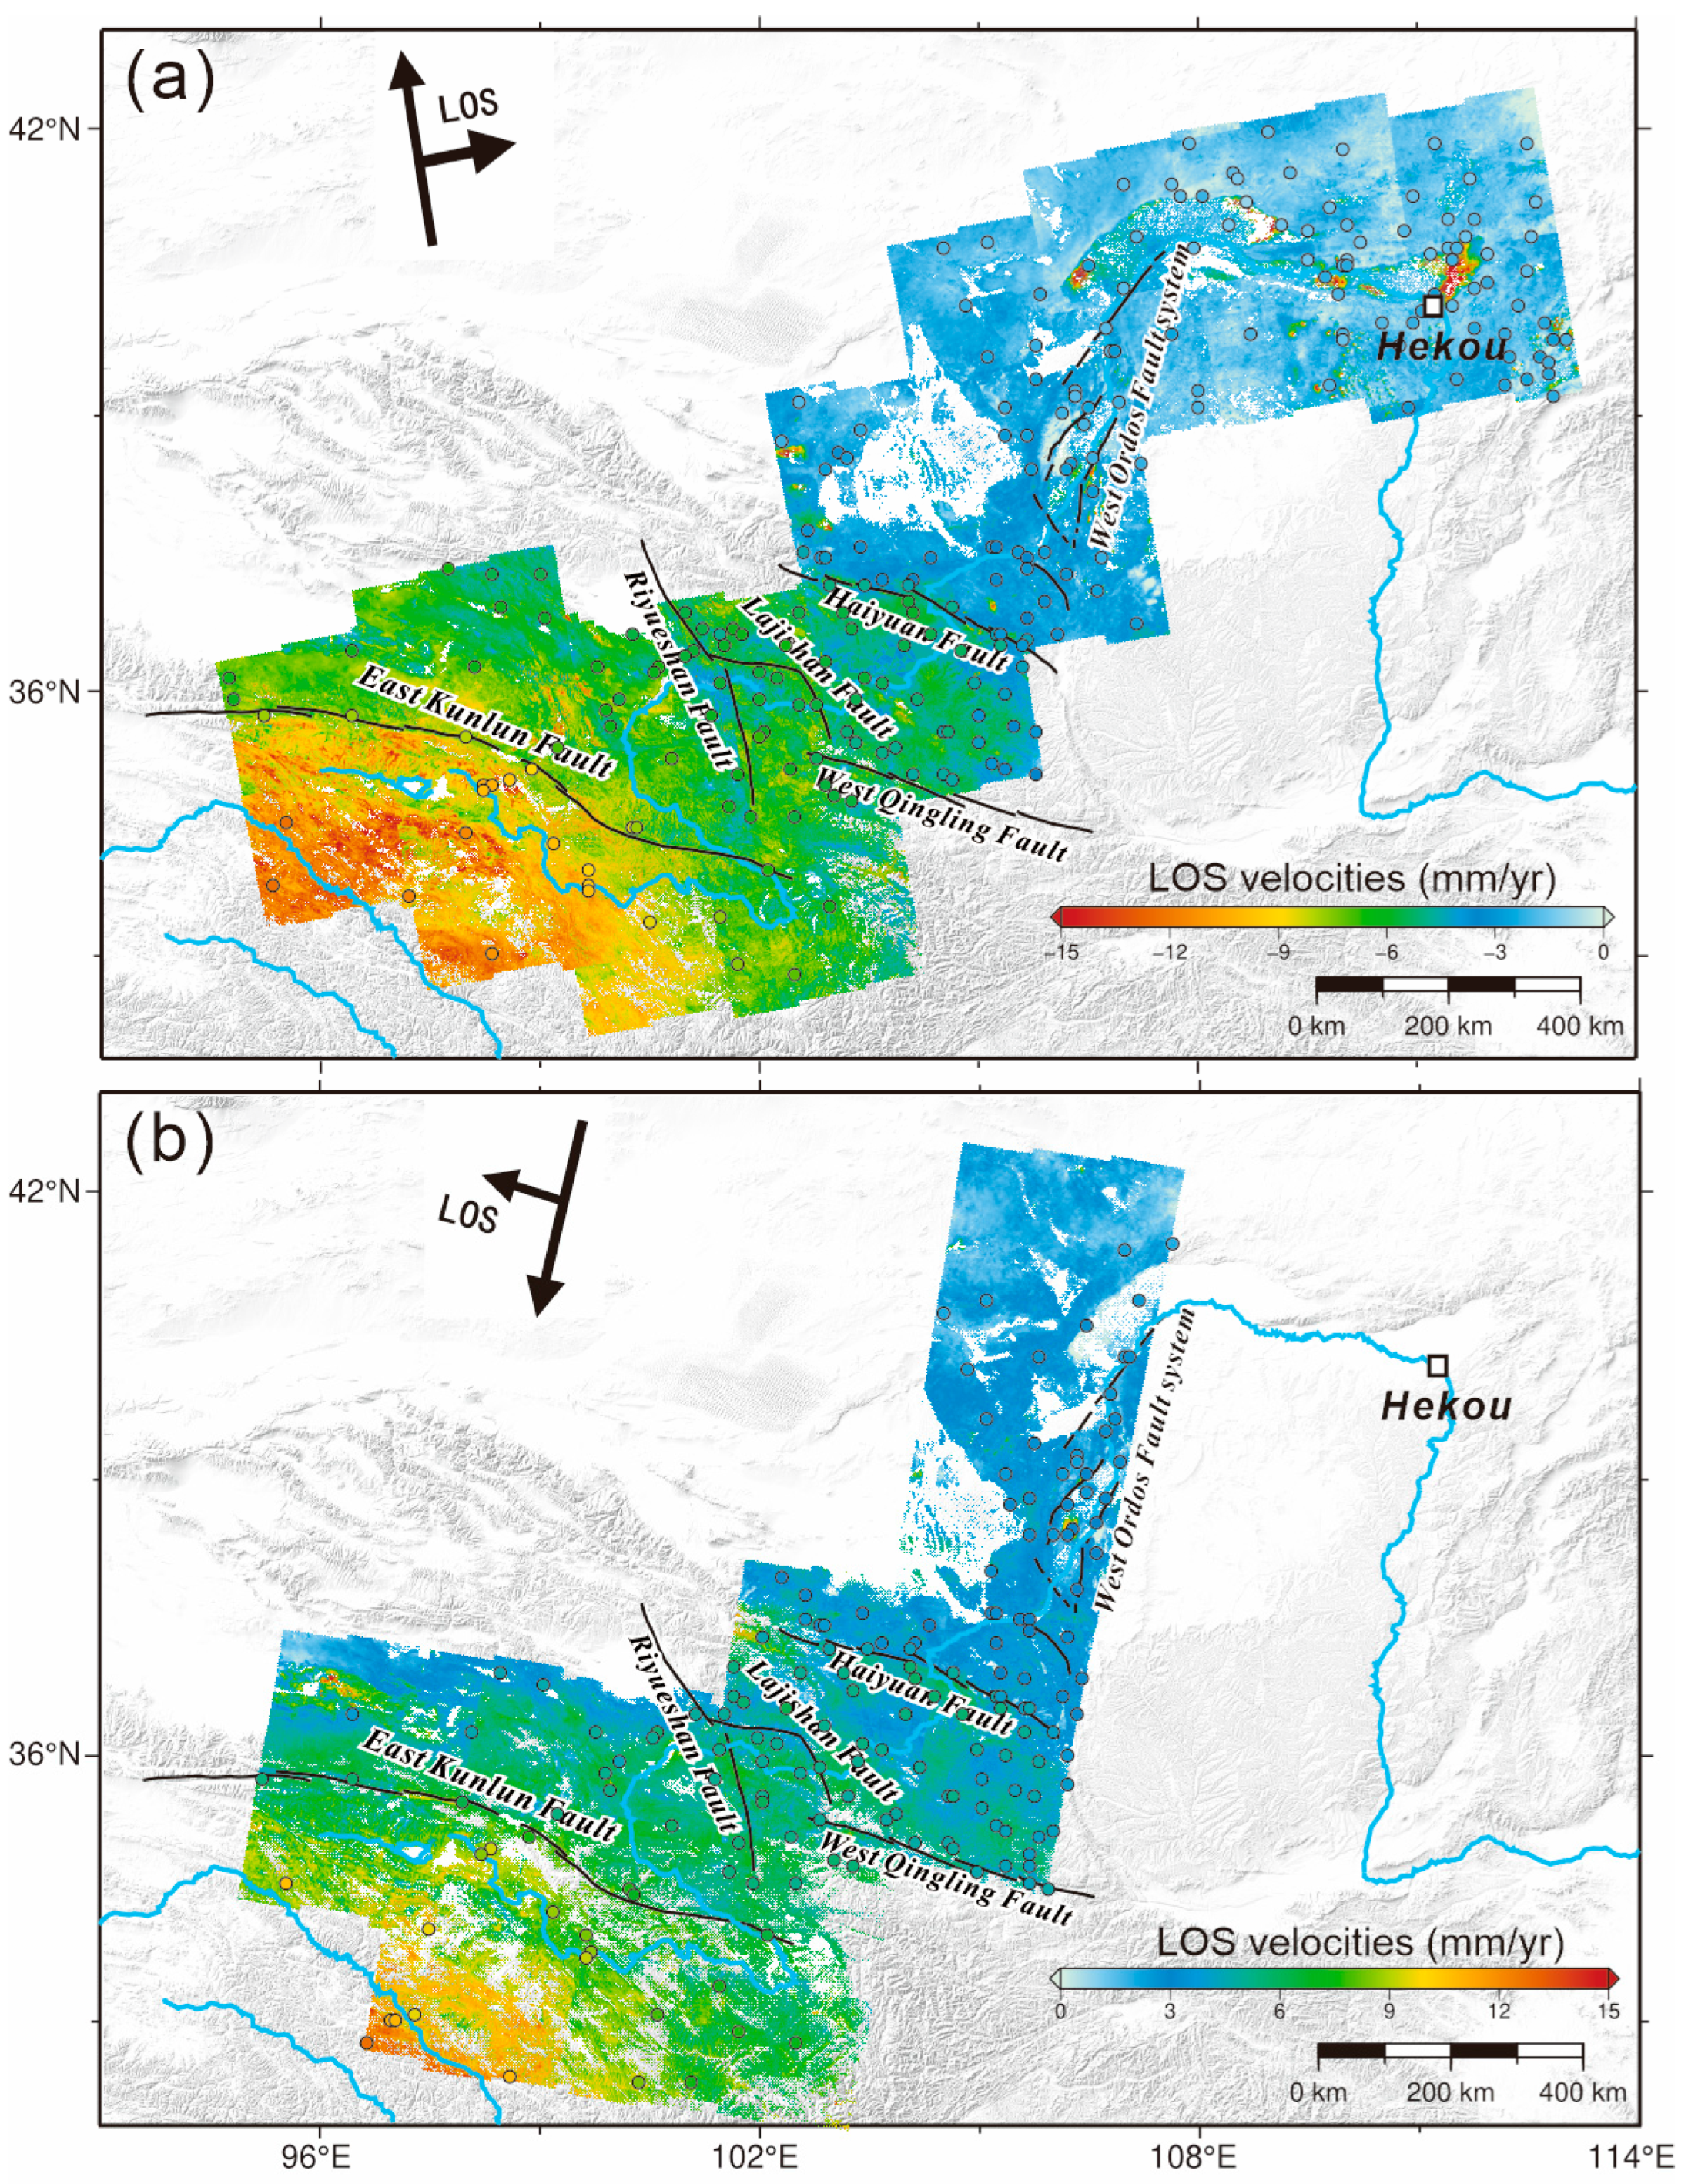
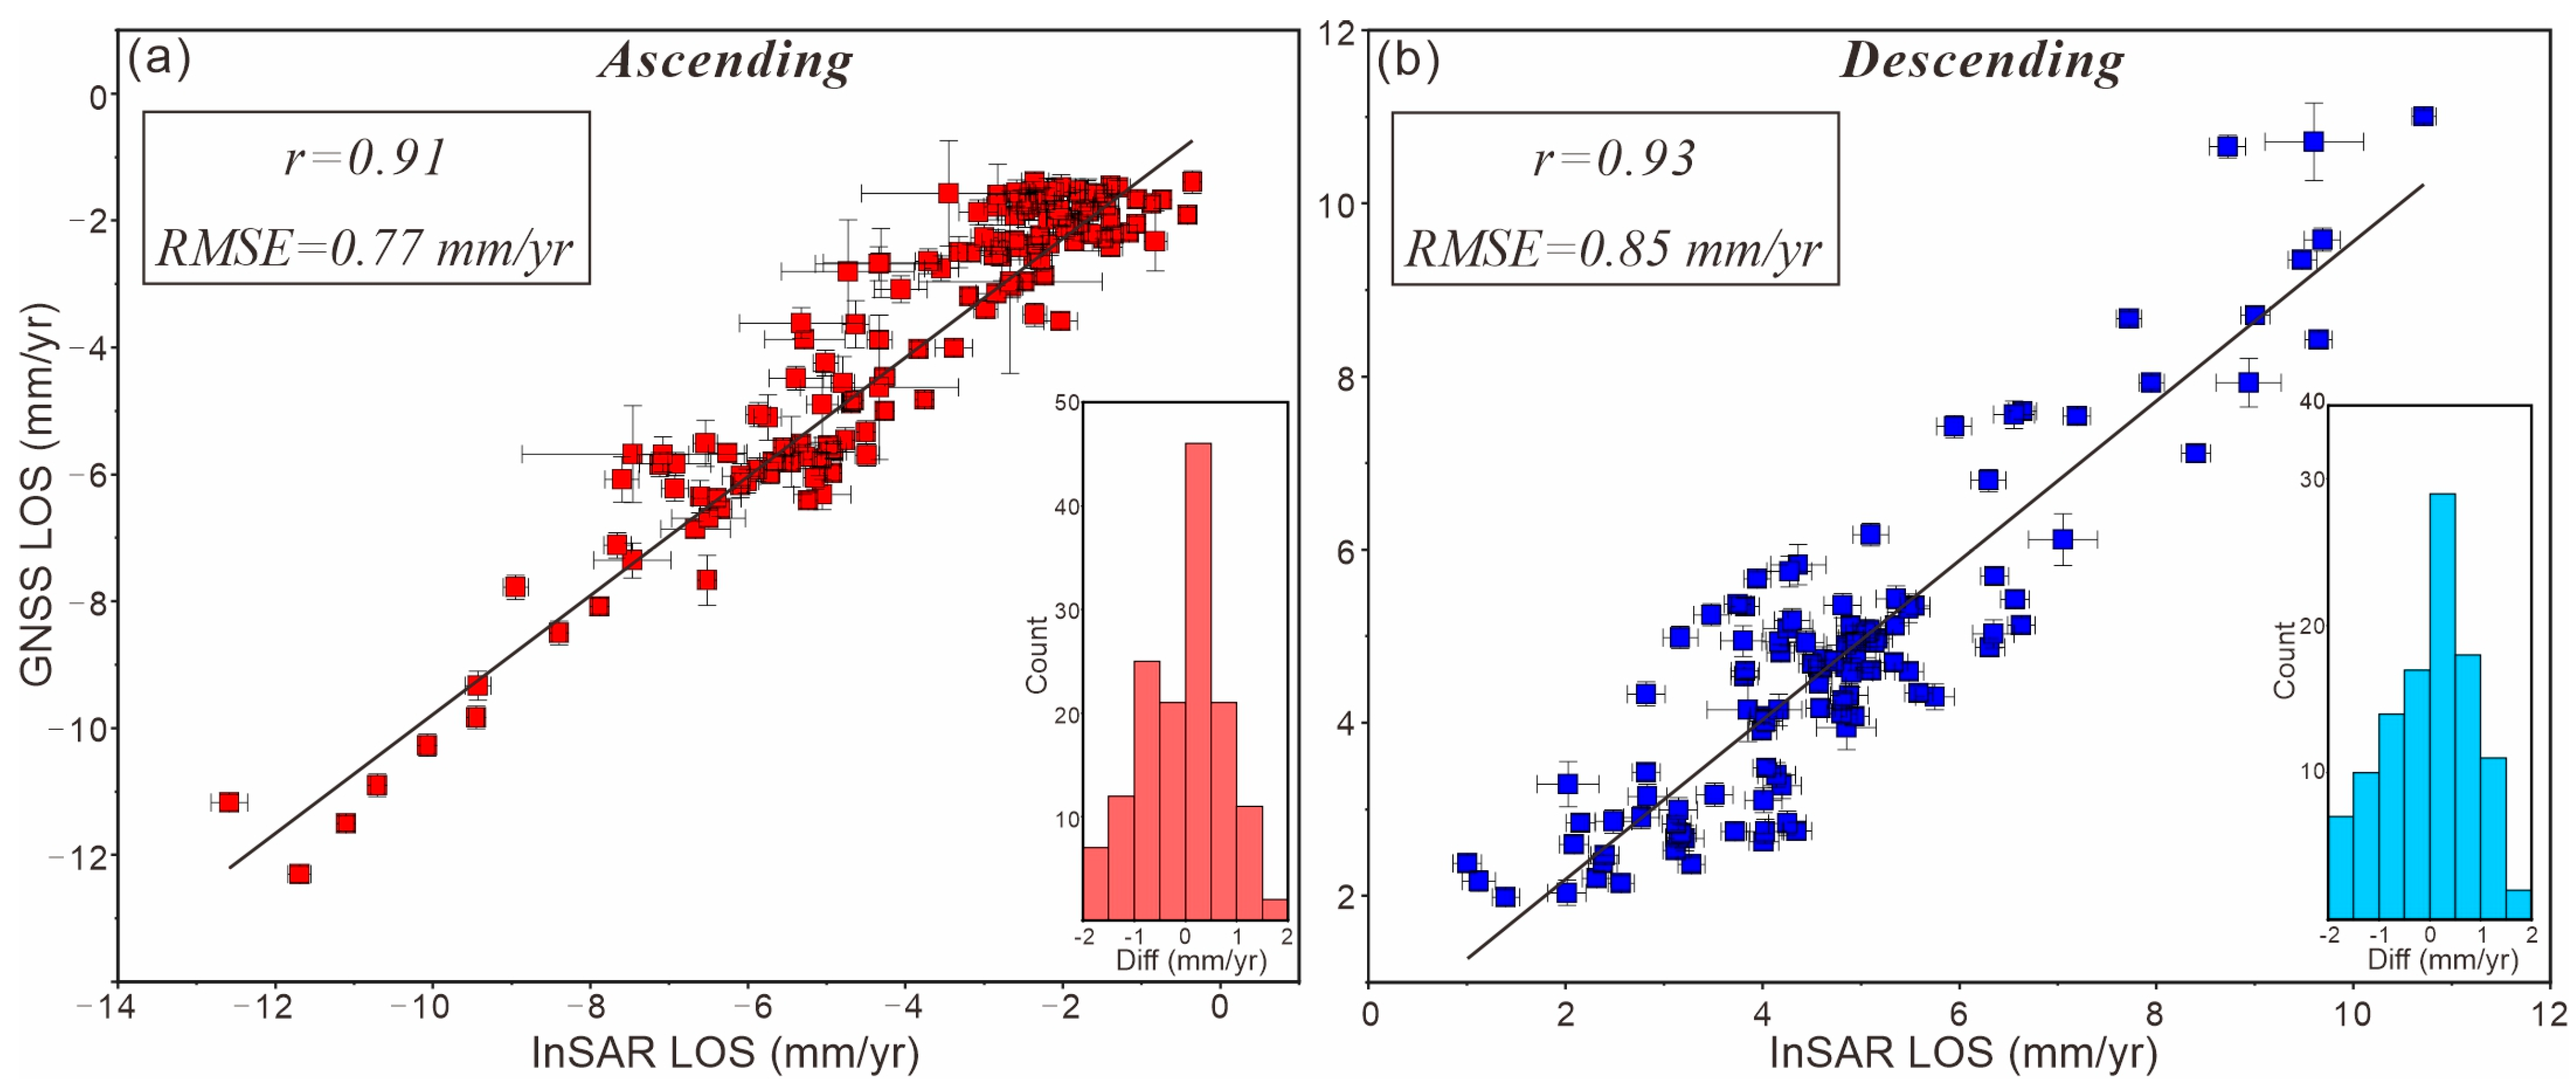
First, the GNSS velocities are projected into the LOS direction based on the Sentinel-1 satellite parameters. Then, the weighted average of the InSAR velocities within 5 km of each GNSS site is estimated, and the GNSS LOS velocities are subtracted to get the differences between InSAR and GNSS (DIG) [47]. Similarly, the differences between overlapping InSAR frames (DII) can be obtained. The ramp parameters for each frame are then inverted by minimizing the DIG and DII following the method of Ou et al. [14]. Finally, the inverted ramp parameters are added to the ascending and descending InSAR LOS velocities to obtain a deformation rate map in a uniform reference frame provided by GNSS data (Eurasian-fixed) (Figure 4). To check the reliability of the joint inversion, we re-estimate the weighted average of the new InSAR velocities within 5 km of each GNSS site and compare them with the GNSS LOS velocities. The results show that the correlation coefficients (r) between the mosaicked InSAR LOS and GNSS LOS are larger than 0.9, and the root mean square error (RMSE) is less than 0.85 mm/yr for the ascending and descending tracks (Figure 5), indicating that this method is effective at reducing the local short-wavelength noise and preserving the long-wavelength trends of large-scale surface deformation [3,7].
Due to the weak contribution of vertical motions to LOS velocities in this region [14] and the insensitivity of InSAR observations to N-S motion, the new LOS velocities after mosaicking the InSAR frames mainly reflect the E-W crustal deformation rate. Therefore, the negative (positive) rates in the ascending (descending) tracks show significant eastward motion around the UYRB. The absolute values of the deformation rates gradually decrease from the source of the Yellow River to Hekou Town, indicating E-W compressional tectonics in this region [48]. The velocity gradients are also well-aligned with the East Kunlun Fault and Haiyuan Fault, which indicates significant E-W strike-slip motions along these faults. In addition, we can also see some outlier signals distributed locally; their possible causes will be discussed in detail in Section 4.1. Although there are null rates in some areas (e.g., around the WQLF and WOFS) as a result of interferogram decoherence (e.g., over glaciers, deserts and areas of dense vegetation), our estimates of fault slip rates and coupling states are consistent with previous studies (see Section 4.2 and Section 4.3). Overall, this large-scale deformation rate map constructed from joint InSAR and GNSS observations provides more powerful constraints on interseismic crustal motion and fault kinematics compared with GNSS-only investigations (Figure 4).

3. Inversion of Fault Slip Rate and Locking Ratio

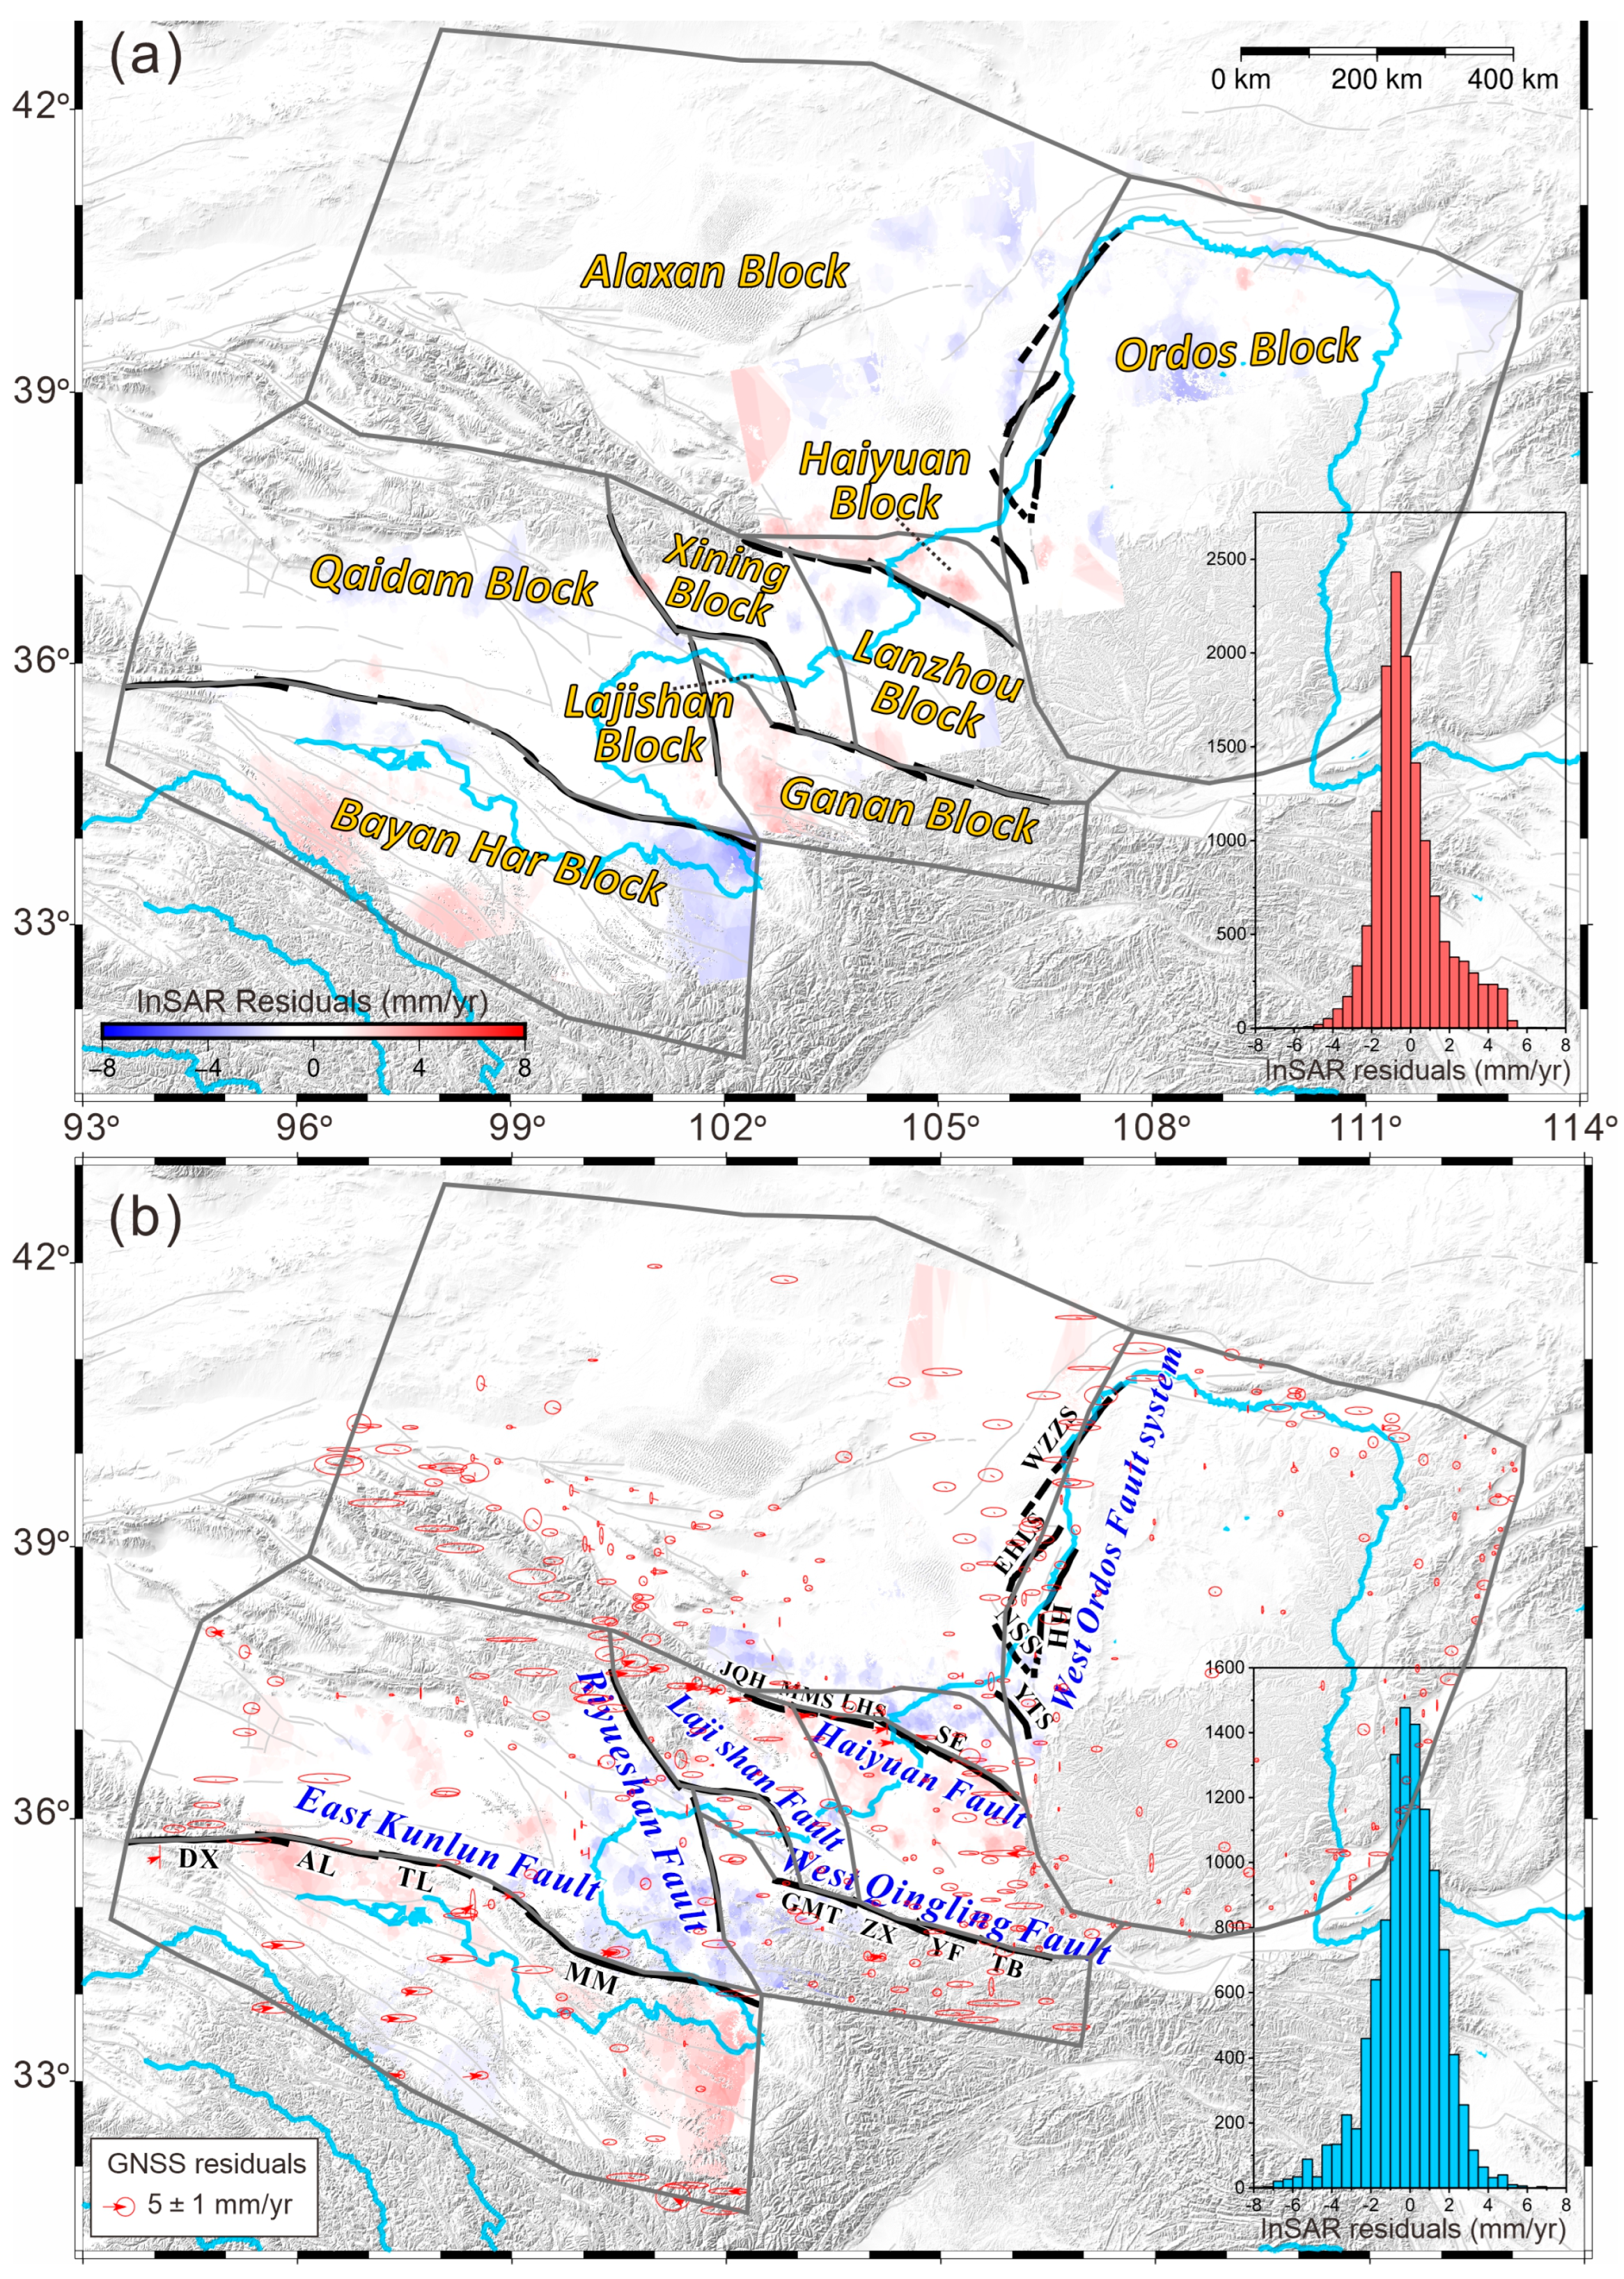
The interseismic crustal velocities obtained by spatial geodetic observations are usually assumed to be a combination of rigid rotations and internal strain rates of a finite number of blocks, and strain accumulation due to fault creep or locking [49,50]. But the intrablock strain rates can be plausibly negligible when the block size is relatively small [51], such as the micro-blocks with an average area of 35 thousand km2 in this study (e.g., the Haiyuan, Xining, Lanzhou, Lajishan, and Gannan Blocks in Figure 6), whose boundaries are defined by the major faults around the UYRB mentioned above. Although the Ordos, Qaidam and Alaxan Blocks cover large areas in the following inversion, all of them have been proved to be stable geological blocks and exhibit little internal strain and seismic activity today. Therefore, the remaining two components—rigid rotations of the micro-blocks and strain accumulation parameters of the faults (locking ratio)—can be inverted together based on the InSAR deformation rate (Figure 4) and GNSS velocities (Figure 2) described above, and the fault slip rates can then be estimated from the differences in rotation between the two blocks on both sides of the fault.
For the block motions, they are specified by angular velocities on the spherical Earth (Euler rotation poles) and can be estimated by linear inversion [52]. The fault strain accumulation parameter (locking ratio) is defined as 1 − Vc/V, where V is the long-term fault slip rate estimated from the relative block motions, and Vc represents the short-term creep rate [49]. That is, a locking ratio of 0 means that the fault is fully creeping, and whereas a locking ratio of 1 means that it is completely locked (stuck). Hence, the strain accumulation parameter, locking ratio (or coupling state), provides significant implications for the assessment of earthquake potential. Locking ratios are usually estimated by non-linear methods (e.g., simulated annealing or grid search) [49]. The inversion is implemented using the TDEFNODE code [53], which applies the ‘backslip’ theory to each small fault patch in an elastic half-space dislocation model [54,55].
In this study, the fault plane is discretized into numerous sub-fault patches measuring 10 km × 5 km along the strike and downdip directions, respectively. In the original inversion, the faults are assumed to be locked above a depth of 20 km and to slip freely below 20 km, but the optimal locking ratio and depth are adjusted to fit the observations in the following inversions. The dip angles of the East Kunlun Fault and Haiyuan Fault are allowed to vary between 60° and 90° [3,7], whereas the other faults are assumed to be steeply dipping in the block model because there is no obvious evidence on the dip or dip angles of those faults so far. To improve computation efficiency, the InSAR LOS velocities are downsampled using a nested uniform downsampling approach [29], and regions showing localized subsidence, likely related to coal mining and other anthropogenic activities, are further masked out. Finally, the fault slip rates (see details in Section 4.2) and locking ratios (Section 4.3) around the UYRB are estimated, and the corresponding fitting results are shown in Figure 6.
The micro-block model basically reproduces a pattern similar to the observations because the GNSS and InSAR residuals are mostly within ±2 mm/yr (Figure 6). But we can still find some obvious misfits around the south of the EKF and HF, which may be due to the fact that our inversions do not model some secondary faults within the Bayan Har Block and Lanzhou Block, such as the Kunlun Pass–Jiangcuo Fault (which hosted the 2021 MW 7.4 Maduo earthquake) and the Maxianshan Fault [3,56,57].

4. Discussion

4.1. Local Deformation Rate Related to Nontectonic Processes

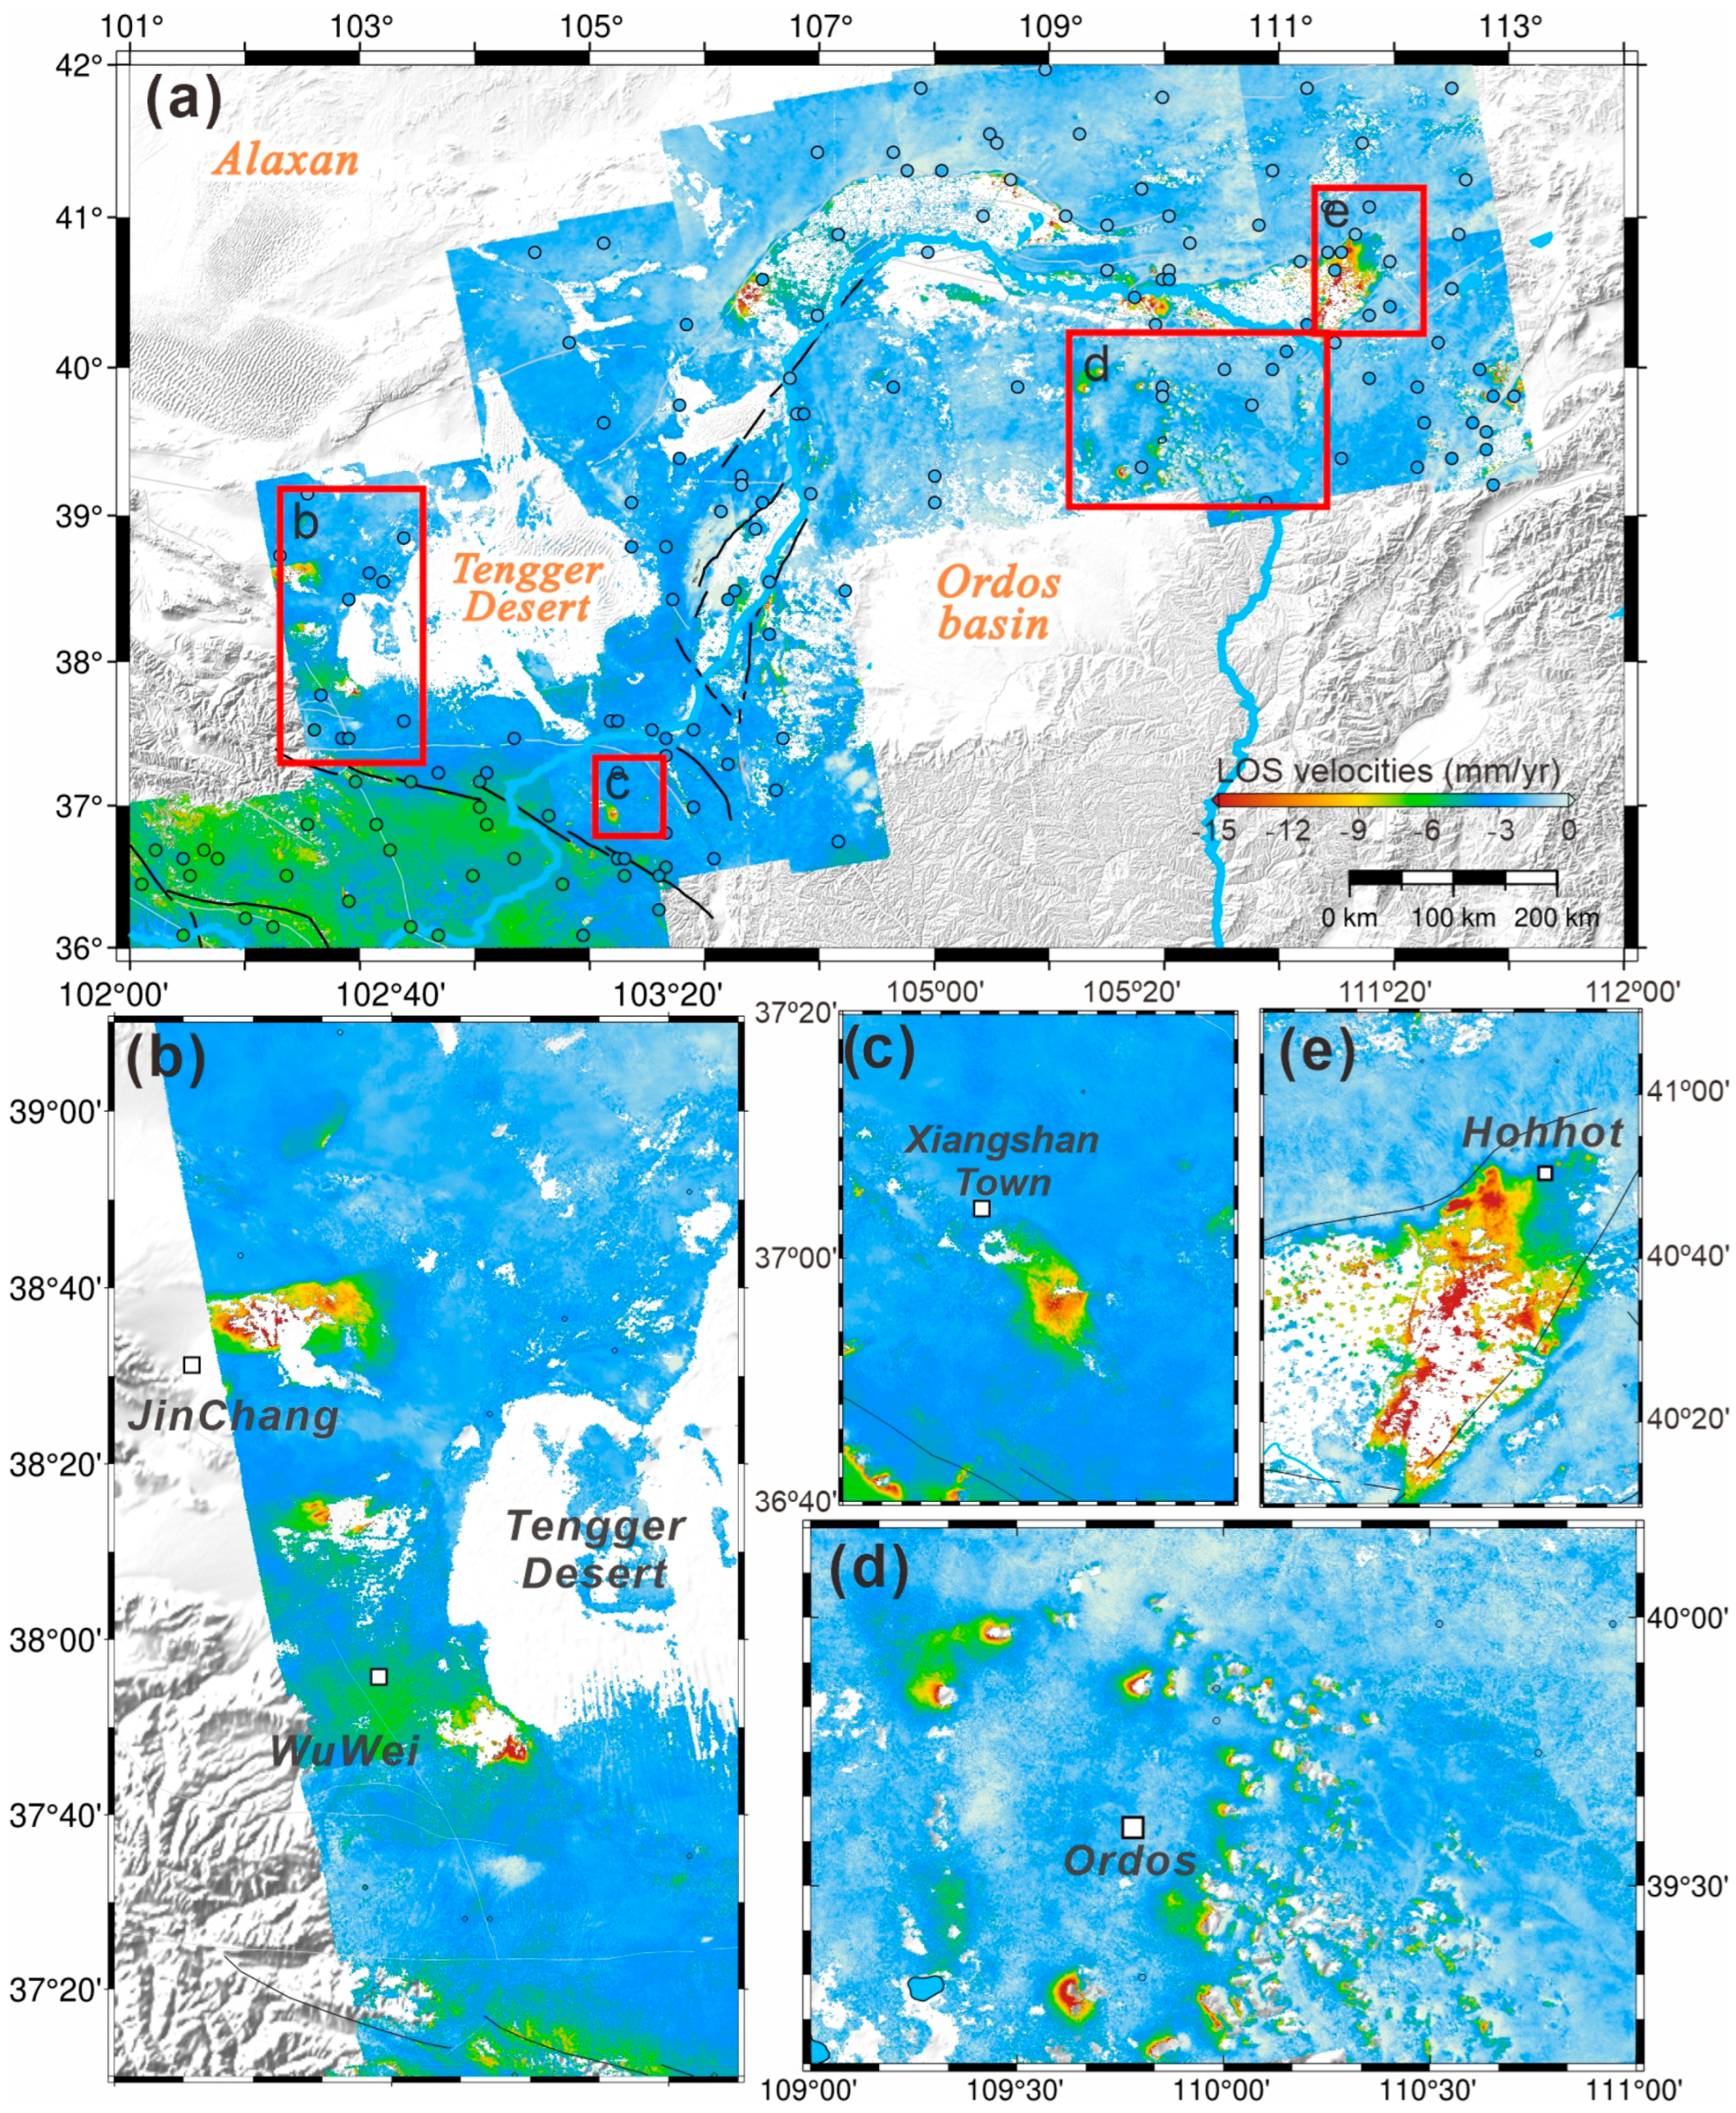
Based on the high-resolution InSAR deformation map, we can not only observe the large-scale crustal movement caused by tectonics around the UYRB, but also find some local areas with deformation gradients greater than 10 mm/yr, which are usually related to human activities (Figure 7a). For example, to the west of the Ordos Basin, there are two obvious subsidence areas near the Tengger Desert—one close to Jinchang and Wuwei (Figure 7b) and the other in the northern Haiyuan Fault, close to Xiangshan Town (Figure 7c). These two areas are characterized by arid environments, with mean precipitation of less than 200 mm/yr, but lots of agricultural lands are found in this region based on optical satellite images. Hence, the surface subsidence is likely induced by groundwater pumping for irrigation activities [3].
In the northeastern Ordos Basin, two obvious subsidence areas can also be found near Ordos and Hohhot (Figure 7d,e). The local deformation near Ordos, the largest coal-producing city in China, primarily shows elliptical or circular shapes (Figure 7d), which are undoubtedly caused by coal mining. This indicates that InSAR observations are good at detecting subsidence signals caused by mining activities, but de-coherence can still be found in some areas, because the deformation rate due to coal mining often exceeds the limit of InSAR deformation monitoring [58]. Another wedge-shaped subsidence area with an average rate of 12 mm/yr can be observed near Hohhot (Figure 7e), which is probably related to human activities. This subsidence area is quite consistent with the population distribution in Hohhot, and the water demand resulting from the urban expansion of Hohhot has been proven to be much greater than the capacity of the water supply system [59]. Hence, this deficit is partly met by groundwater pumping.

4.2. Slip Rates Along the Active Faults
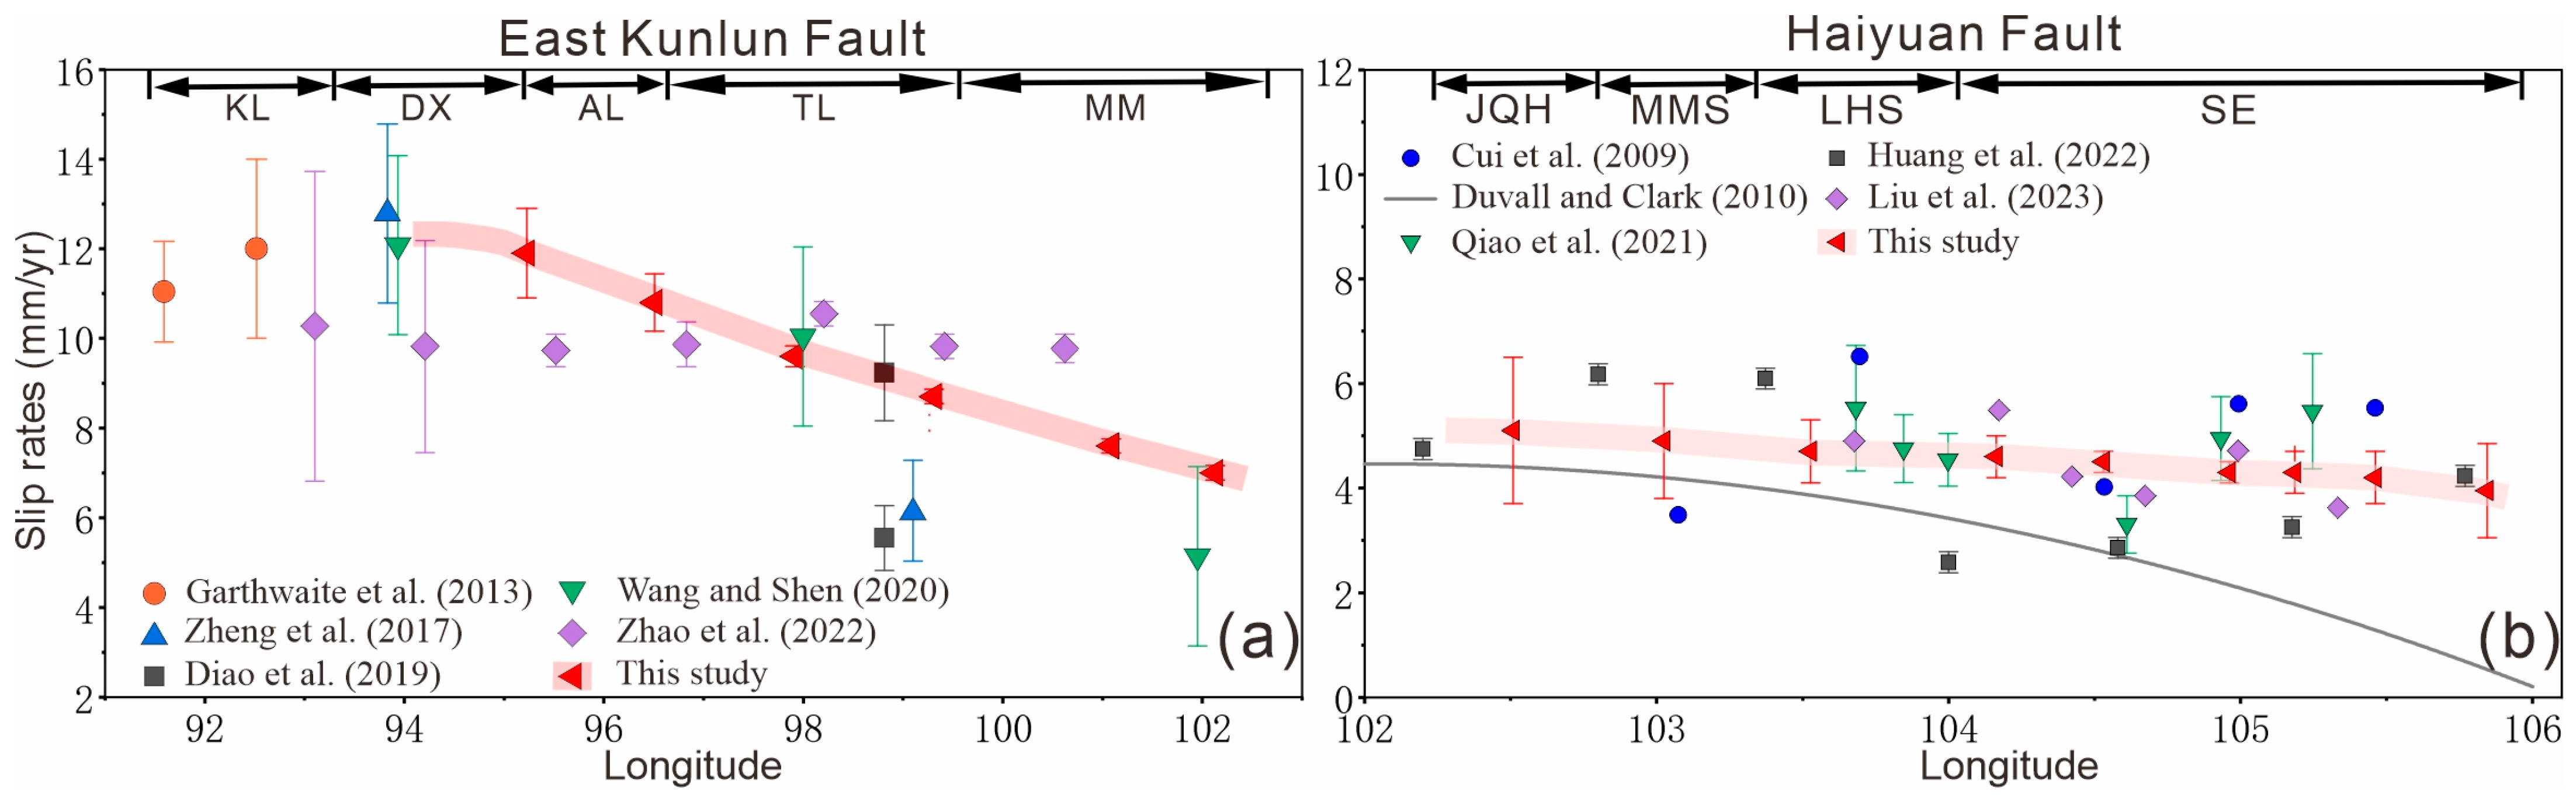
In previous studies, the movement characteristics of the East Kunlun Fault (EKF), particularly the strike-slip rate along the eastern part, have remained controversial. Some investigations inferred that the fault slip rate gradually decreases from the Dongdatan-Xidatan segment (DX) to the easternmost part based on the GNSS observations [19,60], but Zhao et al. [7] estimated that the slip rate in this part was close to 8–11 mm/yr from InSAR observations, without an obvious eastward decrease toward the Maqin-Maqu segment (MM). In this study, we found that the slip rate decreases nearly linearly from 11.8 ± 1.9 mm/yr at the DX to 6.5 ± 0.5 mm/yr at the MM (Figure 8a), which is different from the result of Zhao et al. [7]. This discrepancy may be due to the fact that the fault slip rate in the study of Zhao et al. [7] was inverted from deformation profiles across the fault using a simple elastic screw dislocation model, rather than the kinematic block model employed in this study. Additionally, their simulated displacements do not agree well with the observations along the eastern segment of the EKF. On the other hand, the LOS velocities in the ascending and descending tracks show broad residuals around the eastern East Kunlun Fault (Figure 6). Given their broad spatial distribution, these residuals likely arise from intra-block strain rather than from merely one or two secondary faults. Some studies have inferred that the Bayan Har Block hosts a low-viscosity lower crust compared with the surrounding blocks [56], indicating that a purely elastic block assumption may not adequately describe its tectonic deformation.
The Haiyuan Fault (HF) is dominated by left-lateral strike-slip, with a slip rate of 4.0 ± 0.9 mm/yr to −5.3 ± 2.5 mm/yr, showing a slight decrease from the central to the eastern segment based on our block model (Figure 8b), which is basically consistent with previous studies [61,62]. However, Duvall and Clark [63] inferred that the slip rate along the eastern part of the HF decreases to 0–2 mm/yr, which may be due to their limited GNSS observations in this region (with a site spacing of >50 km). In addition, the slip rates derived by Huang et al. [15] were relatively lower than our estimates for the Laohuashan and southeast segments, which is probably because the movement on secondary faults (e.g., Gulang Fault and the Xiangshan–Tianjingshan Fault) was modeled together with the Haiyuan Fault in their study. But in this study, the regional tectonics are assumed to be entirely driven by the major faults for simplification—an approach that has been proved to be feasible for estimating slip rates on major faults and evaluating the large-scale seismic risk around the Tibetan Plateau [18,51]. The Riyueshan Fault (RYSF) is an important tectonic belt across the Upper Yellow River, possibly controlled by the East Kunlun and Haiyuan Faults. Li et al. [64] estimated a right-lateral slip rate of 2.1 mm/yr for the northern segment and 3.9 mm/yr for the southern part based on the GNSS observations. By quantifying geomorphic offsets and applying Optically Stimulated Luminescence dating along the southern RYSF, Liu et al. [8] inferred a strike-slip rate of ~1.7–3.6 mm/yr, which is quite close to the results from Li et al. [48] based on the interpretation of landforms and excavated trenches. And previous geologic investigations on the northern RYSF reveal slip rates that vary from ~1.1 to 2.4 mm/yr [2,65]. In our inversion, the RYSF is also dominated by the right-lateral strike-slip motion, with a slip rate of ~2.3–3.5 mm/yr from north to south, which is consistent with those previous studies.
The Lajishan Fault (LJSF) is mainly characterized by compressional motion, with a dip-slip rate of ~2.0–3.5 mm/yr, gradually increasing from west to east based on the above inversion, which is basically consistent with the study of Wu et al. [3] (~4 mm/yr). But it is obviously different from some results estimated by GNSS observations [66], which may be due to the insufficient density or patchy distribution of GNSS sites around the LJSF. For the West Qinling Fault (WQLF), we also estimate a left-lateral slip rate of 2.0–3.0 mm/yr with slight compression motion, which is close to previous geodetic results (2.1–2.8 mm/yr, [67]) and geologic investigations (2.3 mm/yr, [68]).
As the boundary between the Tibetan Plateau, the Ordos Block and the Alaxan Block, the West Ordos Fault System (WOFS) is located in the northern N-S Seismic Belt of China and strikes NNE, similar to the Yellow River’s course. Several geological studies have found that some secondary faults (e.g., the Niushoushan Fault (NSS)) are dominated by the strike-slip motion [69], and that the East Helanshan Fault (EHLS) shows extensional motion with a slip rate of <0.7 ± 0.1 mm/yr since the Quaternary [70,71]. The GNSS observations indicate ~2 mm/yr of right-lateral and 1.5 mm/yr of extensional motion on the WOFS across the Yinchuan Basin bounded by the Huanghe Fault and East Helanshan Fault [72]. In this study, the WOFS is simplified as a single fault, which indicates that the slip motions derived from the GNSS and InSAR observations represent the overall tectonic activity in this region. While this simplification inevitably biases the estimates for individual secondary faults, the available geodetic data do not allow us to quantify their subtle kinematics and the associated uncertainties introduced by this approximation. We estimate that a right-lateral slip rate of 3.2–3.6 mm/yr for the WOFS, and an extension rate of 1 ± 0.7 mm/yr from 41°N to 37°N, which has no significant difference with the previous studies [72].
Figure 8. Comparison of the slip rate inverted in this study with the estimates from previous studies on the East Kunlun (a) and Haiyuan Faults (b). The pink lines outline the slip patterns along each fault. References are listed as follows: Garthwaite et al. (2013) [73], Zheng et al. (2017) [74], Diao et al. (2019) [60], Wang and Shen (2020) [19], Zhao et al. (2022) [7], Cui et al. (2009) [75], Duvall and Clark (2010) [63], Qiao et al. (2021) [62], Huang et al. (2022) [20], Liu et al. (2023) [61].
Remotesensing 18 02297 g008

4.3. Locking Ratios on the Fault Planes

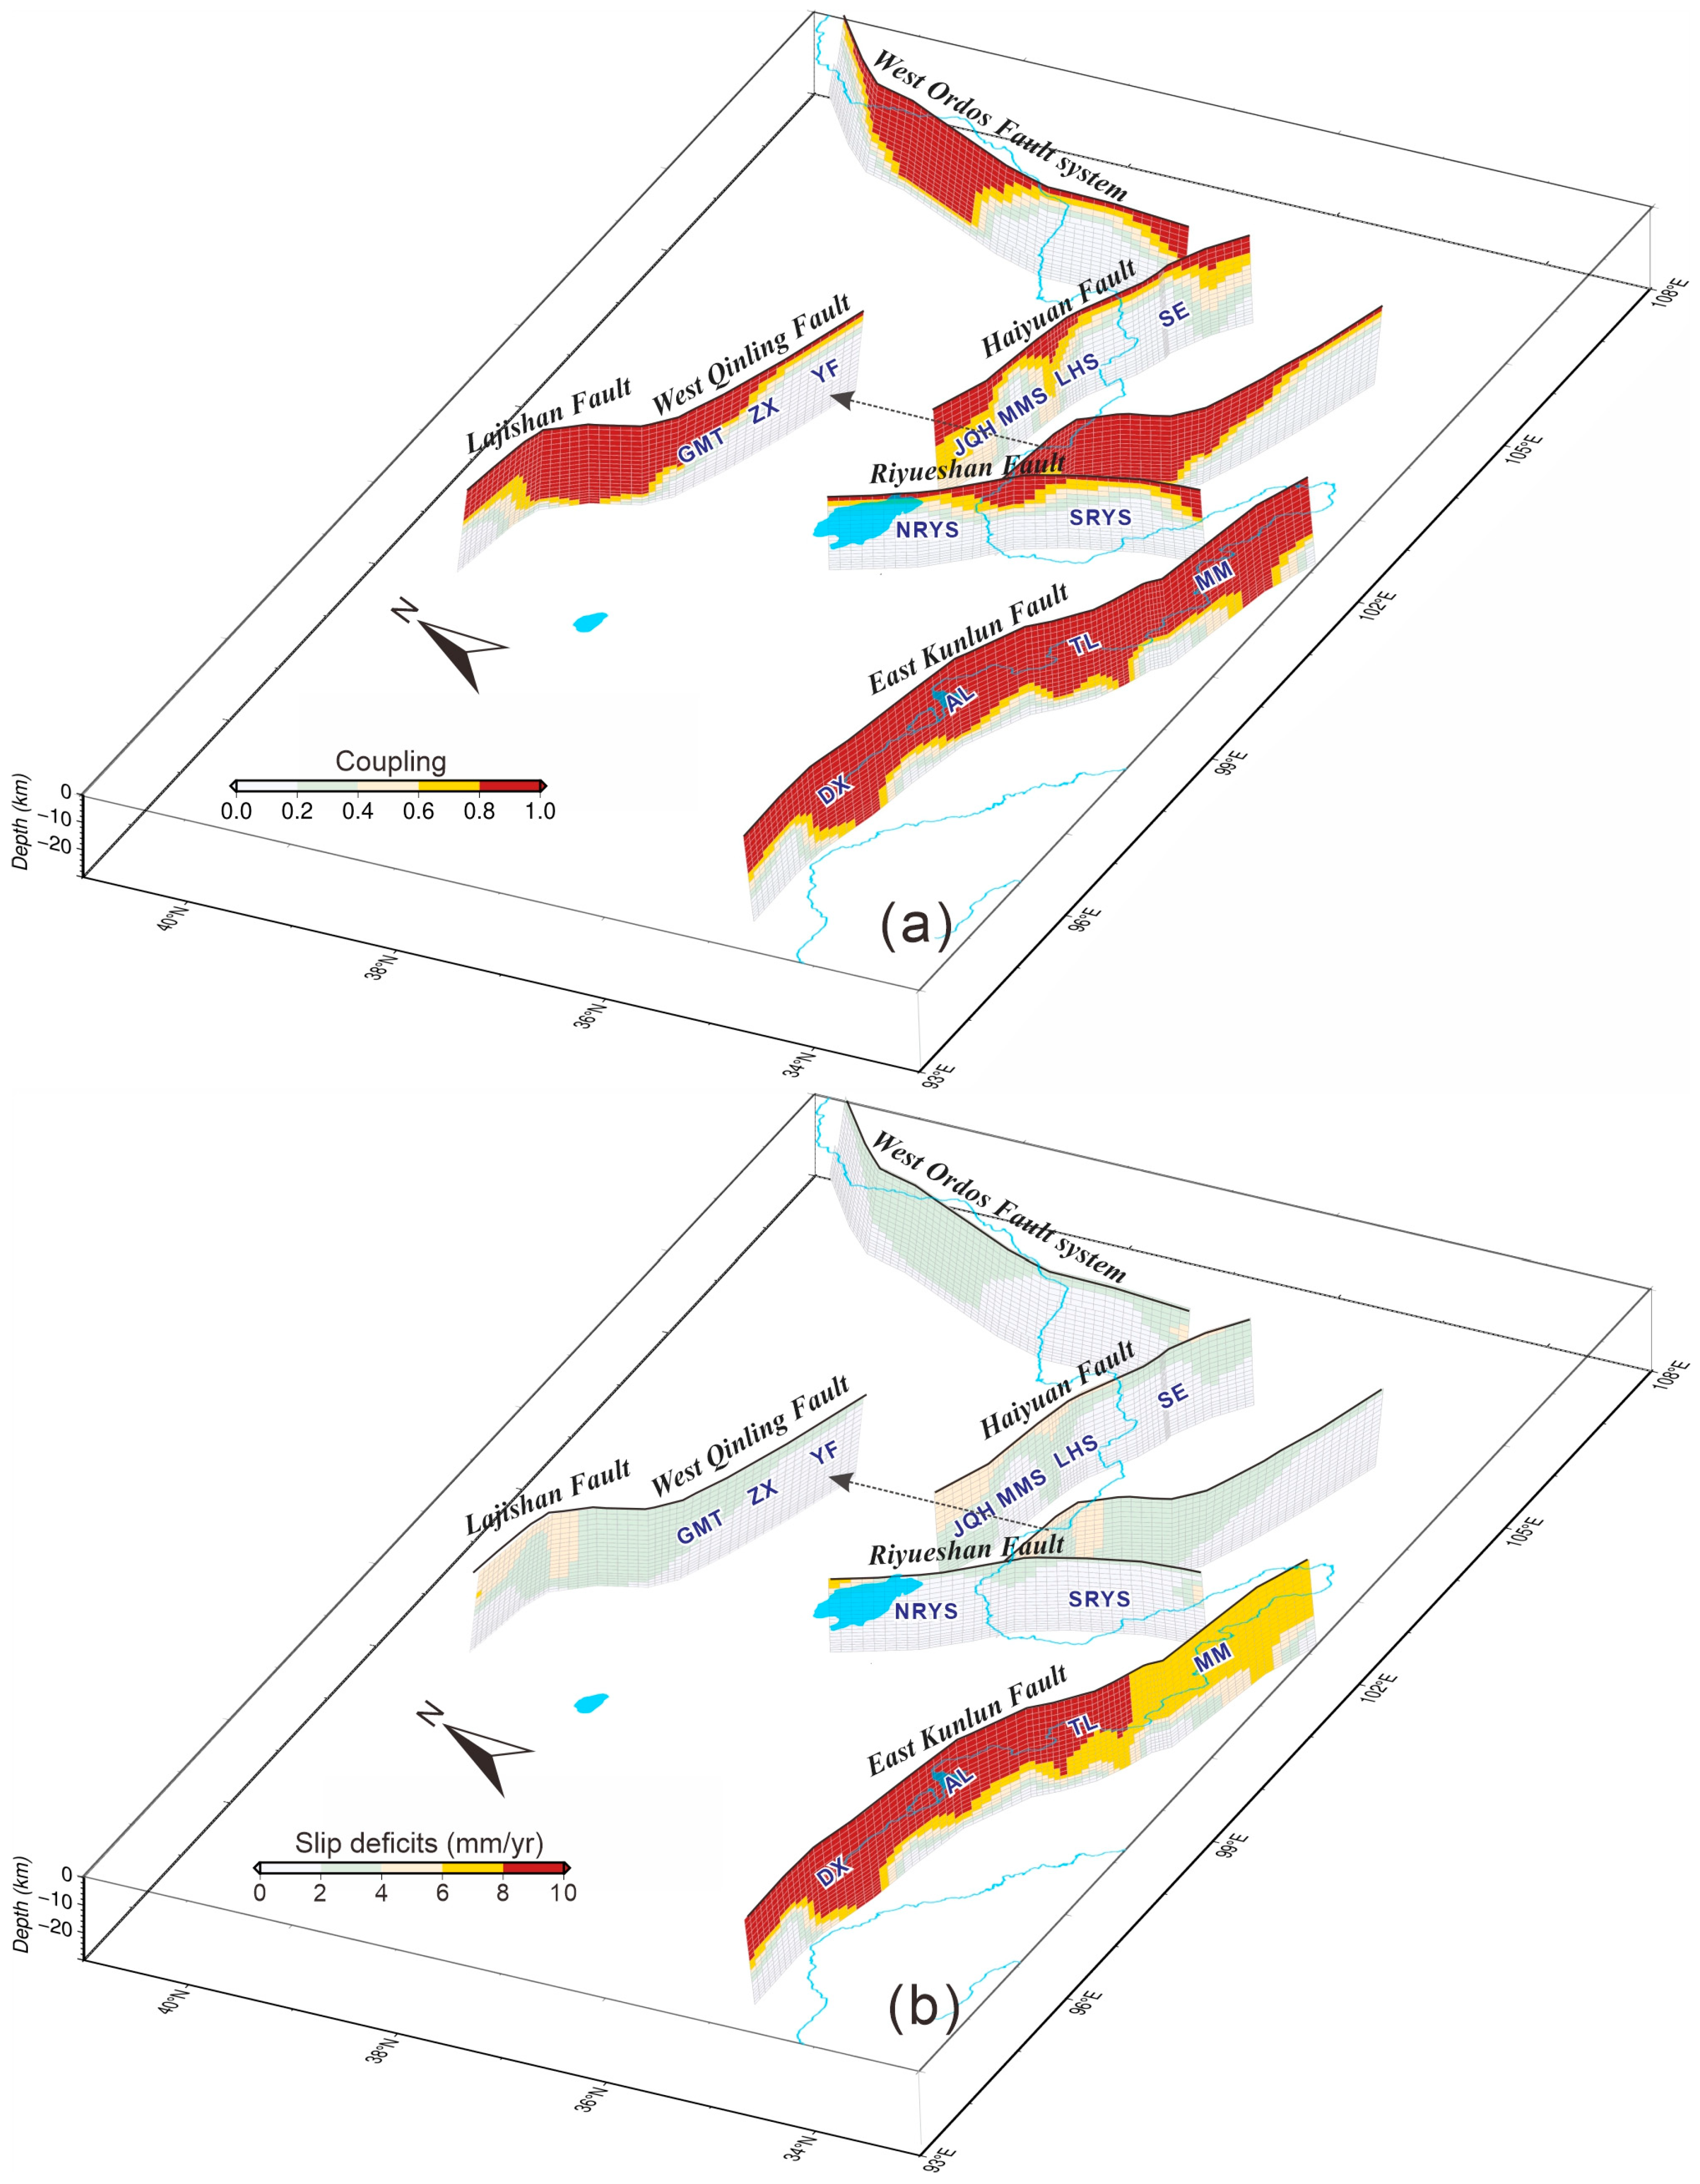
The locking ratios on the faults reflect the regional strain accumulation, which is important for further seismic assessment. Based on the GNSS and InSAR observations, we assess the interseismic coupling on the active faults around the UYRB (Figure 9a). The East Kunlun Fault (EKF) is identified as a strongly coupled tectonic belt, because high locking ratios (>0.6) are widely distributed across the fault plane. Especially in the Dongdatan-Xidatan (~95.5–96.5°E) and eastern Maqin-Maqu segments (~101–102°E), the locking zones extend approximately through the whole seismogenic layer with depth, implying geometrical asperities that possibly sustain interseismic stress. Some investigations in previous studies also infer that a highly locked zone exists in the easternmost EKF, Maqin-Maqu segment, possibly indicating a higher earthquake risk in the future [7,24,76,77]. In general, little shallow creeping was found on the EKF in our inversion, but Jian et al. [78] estimated some partially creeping zones with locking ratios lower than 0.4 at ~97.9°E and ~99.4°E. Actually, the presence of shallow creeping in the above regions is questionable given the great historical earthquakes there.
In this study, we refer to the depth from the surface to the fully locked zone as the fault locking depth, which partially represents the general geometrical asperity. The locking depth of the Haiyuan Fault is quite lower than that of the East Kunlun Fault, at ~3 km for most parts, except for some scattered segments with a locking depth of 6–10 km (the Jinqianghe segment and easternmost part). Note that there has been ongoing debate on the coupling distributions at the Laohushan segment: some studies infer shallow creeping in this segment [15,16,25,79], whereas others argue for partial locking [62,64,75]. Our inversion reveals ~6 km of locking depth in the Laohushan segment, which basically agrees with those studies that infer slight coupling.
Our inversions also indicate that the locking depth on the western Lajishan Fault is close to 9 km, but the eastern part, where the 2023 MW 6.0 Jishishan earthquake occurred [11], is almost completely locked, similar to the results of Wu et al. [3]. For the West Qinling Fault, the locking depth gradually becomes shallower, from ~16 km in the Guomatan (GMT) segment to ~2 km in the Yuanfeng (YF) segment, indicating that there may be creeping along the eastern part of the WQLF. Based on GNSS and leveling observations, some previous studies have also inferred a deep locking depth in the GMT segment (~30 km), indicating a highly coupled asperity [67], and shallower creeping behavior in the ZX and YF segments [80]. The estimated locking depth along the Riyueshan Fault is overall shallow: ~9 km in the central and southernmost segments, but ≤4 km along the rest of the fault (Figure 9a). For the West Ordos Fault System (WOFS), our results indicate a totally locked state in the central segment, while the two ends might show creeping (Figure 9a). Although there is no published study on the interseismic coupling of the WOFS, some investigations on the 1739 Pingluo M 8.0 earthquake found that this event ruptured at a depth of ~20 km [17], which indicates that the locking depth along the central part should be greater than 20 km, partly implying that our estimate should be reasonable.

4.4. Fault Deficit Rate and Earthquake Potential Around the UYRB

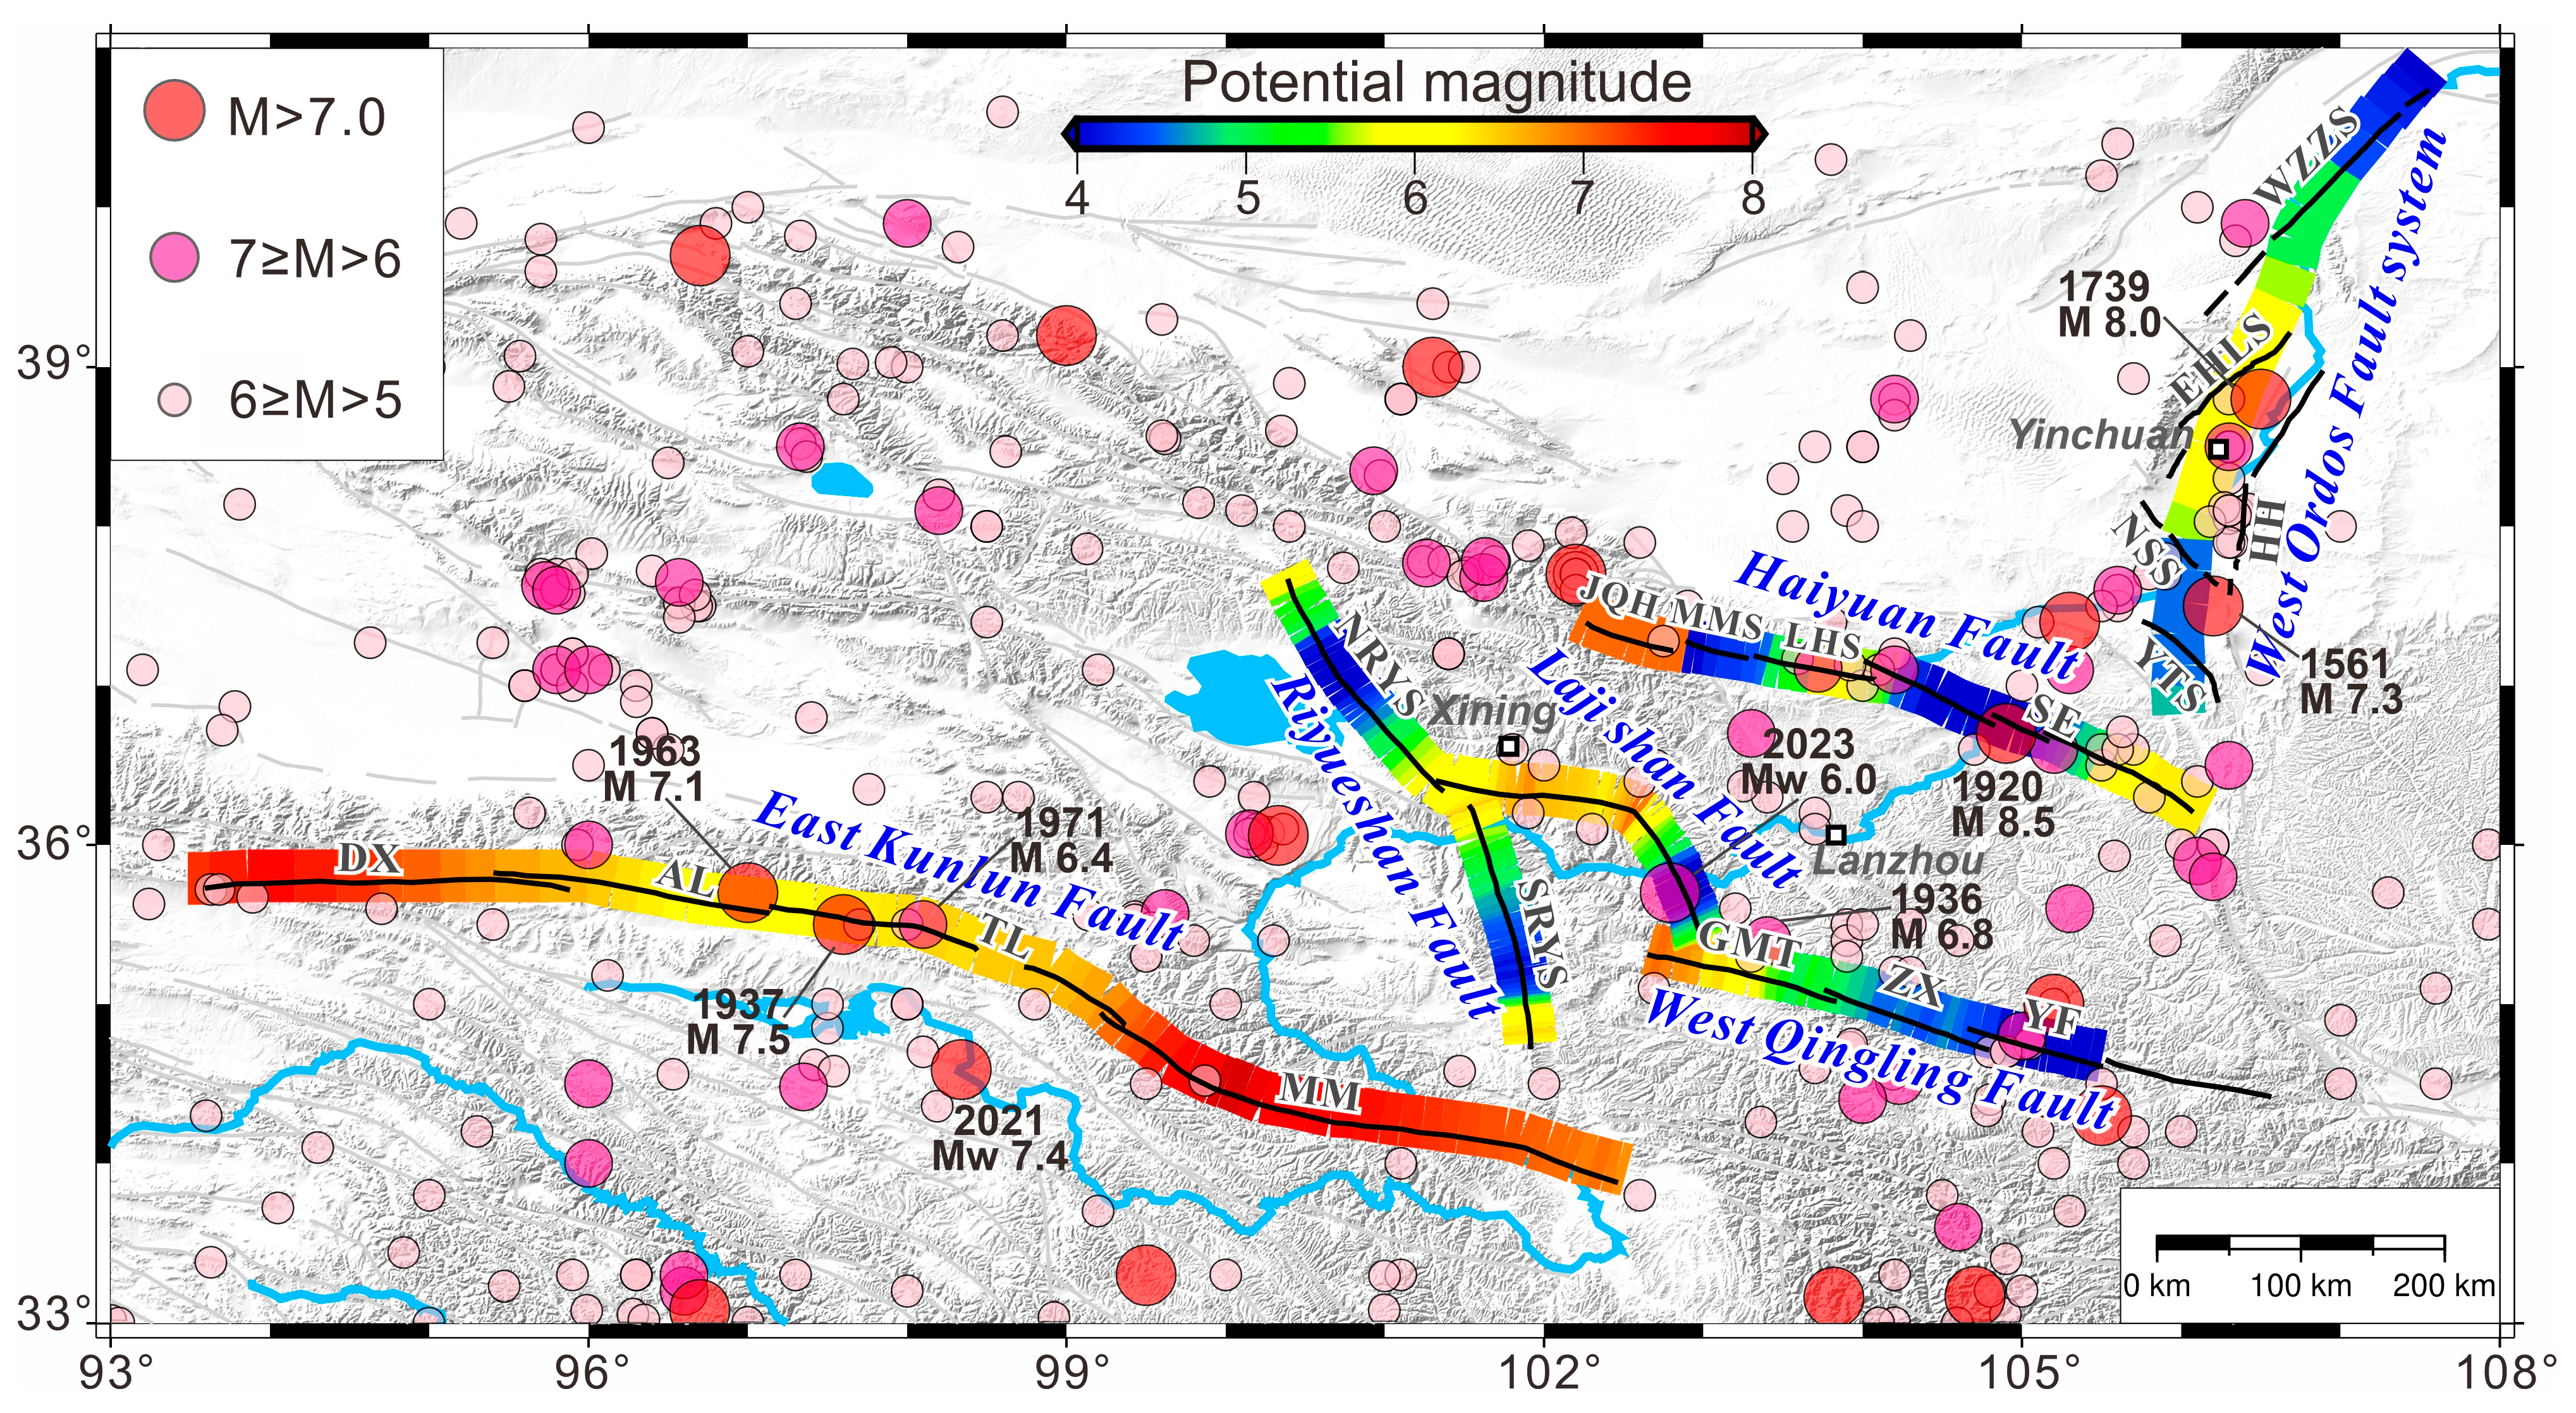
Interseismic fault slip deficit, which is the product of the locking ratio and long-term tectonic loading (slip rate), usually provides a direct measure of the elastic strain accumulation on faults [21,22,81,82]. Thus, we further estimate the slip deficits on the active faults around the UYRB (Figure 9b). In addition, when combined with the regional historical earthquakes, the slip deficits can contribute to estimating the seismic moment budget on the seismogenic fault plane. Therefore, in this study, we first calculate the rate of moment accumulation on the UYRB faults using the relationship between slip deficit and scalar moment, assuming that the shear modulus is 30 GPa. Then, we try to evaluate the seismic moment released on each active fault in the most recent period based on the historic earthquake moment magnitude [28,81]. Because complete seismic cycles are usually hard to know and earthquake records are also incomplete, especially in western China, we simply adopt the year 1500 as the starting date for the moment release calculation [22], which basically aligns with the start date of most earthquake records in China. Finally, the seismic moment budgets can be obtained from the differences between moment accumulation and moment release, from which we estimate the potential magnitudes on the active faults around the UYRB (Figure 10).
In the UYRB, the EKF shows the highest interseismic slip deficit (Figure 9b), but the accumulated stress on the Tuosuo Lake (TL) and Alake Lake (AL) segments has been partly released by the great historical earthquakes (e.g., 1937 M7.5 and 1963 M7.1 events), resulting in a relative lower seismic risk on these two segments compared to the Dongdatan-Xidatan (DX) and Maqin-Maqu (MM) segments (Figure 10). Although the 2001 MW 7.8 Kokoxili earthquake occurred east of the DX segment of the EKF, there is no clear evidence to indicate that the interseismic stress on the DX segment was largely released, and the afterslip caused by the 2001 MW 7.8 events did not significantly occur in the DX segment either [83,84]. Hence, its seismic risk cannot be ignored in the future. For the MM segment, showing an MW ~7.5 potential earthquake (Figure 10), the earthquake recurrence interval has been estimated to be 500–1000 years based on geological investigations [85], and the latest great events occurred ~500 years ago, indicating a higher seismic risk. In addition, the coseismic rupture and postseismic afterslip caused by the 2021 MW 7.4 Maduo earthquake may further enhance the shear stress on the eastern EKF [56], which also supports the inference of a high-risk zone along the MM segment.
The overall interseismic slip deficit on the RYSF is lower than that on the EKF (Figure 9b), but there is still the possibility of an MW ~6.0 earthquake in the southernmost part and the central segment intersecting with the LJSF. The western segment of the LJSF may also have the potential to host an MW ~6.5 earthquake in the future, but the interseismic stress could have been largely released in the southeastern part by the 2023 Jishishan event [86]. However, the fault stress on the Guomatan segment of the WQLF may have increased due to the 2023 Jishishan coseismic rupture [11], and there is still the possibility of an MW 6.0–7.0 earthquake in the next 100 years, although the latest strong earthquake occurred ~100 years ago (1936 M 6¾ event) (Figure 10).
For the Haiyuan Fault, the Jinqianghe segment (JQH) shows the largest interseismic slip deficit (~4.0–6.0 mm/yr, Figure 9b), and falls within the Tianzhu seismic gap [87], a feature that points to higher seismic hazard in this area. The interseismic coupling along the Laohushan segment (LHS) is still controversial, and if a partially locking state is assumed during the interseismic period, there will be a potential MW ~6.0 earthquake in the future. But if this segment is completely creeping, fault stress is unlikely to be accumulated, and the corresponding seismic risk will be low. For the West Ordos Fault System (WOFS), the slip deficit along the central part is significant (Figure 9b), but the 1739 M 8.0 event partly released the accumulated seismic moment, resulting in a potential MW ~6.0 earthquake in this segment. Similarly, the southern segment hosted the 1561 M 7.3 earthquake, which has reduced the future seismic risk.

5. Conclusions

In this study, we use Sentinel-1 SAR images to construct InSAR time series from a stack of interferograms, and then mosaic the frame-based LOS velocity maps by combining them with GNSS and leveling observations to generate surface deformation rates covering the entire Upper Yellow River Basin. We further employ a kinematic micro-block model to invert the slip rates and interseismic coupling on the major faults around the UYRB, especially on some less studied but active faults. For example, we find that the Riyueshan Fault shows a right-lateral strike-slip motion with a slip rate of 2.3–3.5 mm/yr, and the Lajishan Fault is dominated by thrusting movement (dip-slip rate: 2.0–3.5 mm/yr). In addition, the East Kunlun Fault, the southeastern Lajishan Fault, the western West Qinling Fault and central West Ordos Fault System exhibit highly coupled behavior, implying geometrical asperities. Finally, based on the predicted slip deficits and the historical earthquake records, we estimate the seismic moment budgets of those active faults and the corresponding potential magnitudes for the future. Our results indicate that the Dongdatan-Xidatan and Maqin-Maqu segments of the East Kunlun Fault and the Jinqianghe segment of the Haiyuan Fault show the highest seismic hazard around the UYRB. In addition, the central Riyueshan Fault, which connects with the western Lajishan Fault, the western West Qinling Fault and the central Ordos Fault System, also possesses the potential to generate MW 6.0–7.0 earthquakes in the future.

Author Contributions

Conceptualization, Z.T.; methodology, J.L. and Z.Z.; validation, Z.T., J.L. and Z.Z.; investigation, J.L. and Z.Z.; data curation, J.L. and Z.Z.; writing—original draft preparation, J.L.; writing—review and editing, Z.T.; visualization, Z.T., J.L. and S.W.; supervision, Z.T.; funding acquisition, Z.T., W.H. and K.L. All authors have read and agreed to the published version of the manuscript.

Funding

This research was funded by the National Natural Science Foundation of China (42041006, 42574013); the Generic Technical Development Platform of Shaanxi Province for Imaging Geodesy (2024ZG-GXPT-07); the State Key Laboratory of Earthquake Dynamics, China (LED2022B02); and the China Postdoctoral Science Foundation (2022M710012, 2023T160557).

Data Availability Statement

We used the software TDEFNODE (2023.07.18), shared by Robert McCaffrey (https://robmccaffrey.github.io/TDEFNODE/TDEFNODE.html). The Sentinel-1 data used in this study were provided by the European Space Agency (ESA), and their raw data were retrieved from the Alaska Satellite Facility (ASF).

Conflicts of Interest

Author Kui Liu was employed by China DK Comprehensive Engineering Investigation and Design Research Institute Co., Ltd. The remaining authors declare that the research was conducted in the absence of any commercial or financial relationships that could be construed as a potential conflict of interest.

References

  1. Lan, H.; Peng, J.; Zhu, Y.; Li, L.; Pan, B.; Huang, Q.; Li, J.; Zhang, Q. Research on Geological and Surfacial Processes and Major Disaster Effects in the Yellow River Basin. Sci. China Earth Sci. 2022, 65, 234–256. [Google Scholar] [CrossRef]
  2. Yuan, D.; Ge, W.; Chen, Z.; Li, C.; Wang, Z.; Zhang, H.; Zhang, P.; Zheng, D.; Zheng, W.; Craddock, W.H.; et al. The Growth of Northeastern Tibet and Its Relevance to Large-scale Continental Geodynamics: A Review of Recent Studies. Tectonics 2013, 32, 1358–1370. [Google Scholar] [CrossRef]
  3. Wu, D.L.; Ge, W.P.; Liu, S.Z.; Yuan, D.Y.; Zhang, B.; Wei, C.M. Present-Day 3D Crustal Deformation of the Northeastern Tibetan Plateau From Space Geodesy. Geophys. Res. Lett. 2024, 51, e2023GL106143. [Google Scholar] [CrossRef]
  4. Avouac, J.; Tapponnier, P. Kinematic Model of Active Deformation in Central Asia. Geophys. Res. Lett. 1993, 20, 895–898. [Google Scholar] [CrossRef]
  5. Molnar, P.; Tapponnier, P. Cenozoic Tectonics of Asia: Effects of a Continental Collision: Features of Recent Continental Tectonics in Asia Can Be Interpreted as Results of the India-Eurasia Collision. Science 1975, 189, 419–426. [Google Scholar] [CrossRef] [PubMed]
  6. Xiong, X.; Shan, B.; Zheng, Y.; Wang, R. Stress Transfer and Its Implication for Earthquake Hazard on the Kunlun Fault, Tibet. Tectonophysics 2010, 482, 216–225. [Google Scholar] [CrossRef]
  7. Zhao, D.; Qu, C.; Bürgmann, R.; Gong, W. Large-Scale Crustal Deformation, Slip-Rate Variation, and Strain Distribution Along the Kunlun Fault (Tibet) From Sentinel-1 InSAR Observations (2015–2020). J. Geophys. Res. Solid Earth 2022, 127, e2021JB022892. [Google Scholar] [CrossRef]
  8. Liu, J.; Ren, Z.; Nissen, E.; Zhang, C.; Li, Z.; Zhang, Z.; Wu, D. Spatially Variable, Multi-Mm/Yr Late Pleistocene-Holocene Slip Rates Along the South Riyueshan Fault Highlight Limitations to Block-like Behavior in the NE Tibetan Plateau, China. Tectonics 2025, 44, e2024TC008562. [Google Scholar] [CrossRef]
  9. Liu, H.; Gan, W.; Li, Y.; Li, Z.; Liu, L.; Zhang, L.; Liang, S.; Zhang, K.; Li, Y.; Dai, C. Mechanism of Crustal Deformation around the Lajishan-Jishishan Tectonic Belt, NE Tibet, and Implications for Occurrence of the 2023 Jishishan MS 6.2 Earthquake. J. Asian Earth Sci. 2025, 279, 106449. [Google Scholar] [CrossRef]
  10. Yang, Z.; Liu, J.; Zhang, Y.; Yang, W.; Zhang, X. Rapid Report of Source Parameters of 2023 M6.2 Jishishan, Gansu Earthquake Sequence. Earth Planet. Phys. 2024, 8, 436–443. [Google Scholar] [CrossRef]
  11. Guo, P.; Han, Z.; Zhou, C.; Gai, H.; Niu, P.; Zhang, X. Multi-Segment Ruptures of the 2023 Mw 6.0 Jishishan Earthquake, Tibetan Plateau: Implications for Seismogenic Mechanisms of Moderate Earthquakes. J. Geophys. Res. Solid Earth 2025, 130, e2024JB029368. [Google Scholar] [CrossRef]
  12. Chen, P.; Lin, A. Tectonic Topography and Late Pleistocene Activity of the West Qinling Fault, Northeastern Tibetan Plateau. J. Asian Earth Sci. 2019, 176, 68–78. [Google Scholar] [CrossRef]
  13. Hao, M.; Li, Y.; Wang, Q.; Zhuang, W.; Qu, W. Present-Day Crustal Deformation Within the Western Qinling Mountains and Its Kinematic Implications. Surv. Geophys. 2020, 42, 1–19. [Google Scholar] [CrossRef]
  14. Ou, Q.; Daout, S.; Weiss, J.R.; Shen, L.; Lazecký, M.; Wright, T.J.; Parsons, B.E. Large-Scale Interseismic Strain Mapping of the NE Tibetan Plateau From Sentinel-1 Interferometry. J. Geophys. Res. Solid Earth 2022, 127, e2022JB024176. [Google Scholar] [CrossRef]
  15. Huang, Z.; Zhou, Y.; Qiao, X.; Zhang, P.; Cheng, X. Kinematics of the ∼1000 Km Haiyuan Fault System in Northeastern Tibet from High-Resolution Sentinel-1 InSAR Velocities: Fault Architecture, Slip Rates, and Partitioning. Earth Planet. Sci. Lett. 2022, 583, 117450. [Google Scholar] [CrossRef]
  16. Guo, N.; Wu, Y.; Su, G. Analysis of the Fault Slip, Creep, and Coupling Characteristics of the Maomaoshan-Laohushan-Haiyuan Fault Using InSAR and GNSS Measurements. Tectonophysics 2023, 863, 229988. [Google Scholar] [CrossRef]
  17. Zheng, W.; Sun, X.; Lei, Q.; Ggong, Z.; Wang, Y.; Liu, X.; Li, C.; Feng, Z. Late Quaternary Tectonic Activity and Strong Earthquake Generation Mechanism around the Boundary Zone of the Ordos Active-tectonic Block, Central China. J. Geomech. 2024, 30, 206–224. [Google Scholar]
  18. Tian, Z.; Yang, Z.; Bendick, R.; Zhao, J.; Wang, S.; Wu, X.; Shi, Y. Present-Day Distribution of Deformation around the Southern Tibetan Plateau Revealed by Geodetic and Seismic Observations. J. Asian Earth Sci. 2019, 171, 321–333. [Google Scholar] [CrossRef]
  19. Wang, M.; Shen, Z. Present-Day Crustal Deformation of Continental China Derived From GPS and Its Tectonic Implications. J. Geophys. Res. Solid Earth 2020, 125, e2019JB018774. [Google Scholar] [CrossRef]
  20. Huang, Z.; Zhou, Y. A Complete Map of Fine-Scale Slip Rate Distribution and Earthquake Potential Along the Haiyuan Fault System. Geophys. Res. Lett. 2022, 49, e2022GL101805. [Google Scholar] [CrossRef]
  21. Li, Y.; Shan, X.; Gao, Z.; Huang, X. Interseismic Coupling, Asperity Distribution, and Earthquake Potential on Major Faults in Southeastern Tibet. Geophys. Res. Lett. 2023, 50, e2022GL101209. [Google Scholar] [CrossRef]
  22. Li, Y.; Shan, X.; Qu, C.; Zhang, G.; Wang, X.; Xiong, H. Slip Deficit Rate and Seismic Potential on Crustal Faults in Tibet. Geophys. Res. Lett. 2025, 52, e2024GL112122. [Google Scholar] [CrossRef]
  23. Li, Y.; Shan, X.; Qu, C. Geodetic Constraints on the Crustal Deformation along the Kunlun Fault and Its Tectonic Implications. Remote Sens. 2019, 11, 1775. [Google Scholar] [CrossRef]
  24. Zhu, L.; Ji, L.; Liu, C. Interseismic Slip Rate and Locking along the Maqin–Maqu Segment of the East Kunlun Fault, Northern Tibetan Plateau, Based on Sentinel-1 Images. J. Asian Earth Sci. 2021, 211, 104703. [Google Scholar] [CrossRef]
  25. Jolivet, R.; Lasserre, C.; Doin, M.-P.; Peltzer, G.; Avouac, J.-P.; Sun, J.; Dailu, R. Spatio-Temporal Evolution of Aseismic Slip along the Haiyuan Fault, China: Implications for Fault Frictional Properties. Earth Planet. Sci. Lett. 2013, 377–378, 23–33. [Google Scholar] [CrossRef]
  26. Li, Z.; Su, P.; Huang, S.; Tian, Q.; Yin, X. Slip Rates of the Riyue MT. Fault at Dezhou Segment since Late Pleistocene. Seismol. Geol. 2018, 40, 656–671. [Google Scholar]
  27. Zhang, C.; Li, Z.; Ren, Z.; Liu, J.; Zhang, Z.; Wu, D. Characteristics of Late Quaternary Activity of the Southern Riyueshan Fault. Seismol. Geol. 2022, 44, 1–19. [Google Scholar] [CrossRef]
  28. Liu, C.; Ji, L.; Zhu, L.; Xu, C.; Qiu, J. Interseismic Strain Rate Distribution Model of the Altyn Tagh Fault Constrained by InSAR and GPS. Earth Planet. Sci. Lett. 2024, 642, 118884. [Google Scholar] [CrossRef]
  29. Fang, J.; Wright, T.J.; Johnson, K.M.; Ou, Q.; Styron, R.; Craig, T.J.; Elliott, J.R.; Hooper, A.; Zheng, G. Strain Partitioning in the Southeastern Tibetan Plateau From Kinematic Modeling of High-Resolution Sentinel-1 InSAR and GNSS. Geophys. Res. Lett. 2024, 51, e2024GL111199. [Google Scholar] [CrossRef]
  30. Zheng, W.; Daoyang, Y.; Zhang, P.; Yu, J.; Lei, Q.; Wang, W.; Zheng, D.; Zhang, H.; Li, X.; Li, C.; et al. Tectonic Geometry and Kinematic Dissipation of the Active Faults in the Northeastern Tibetan Plateau and Their Implications for Understanding Northeastward Growth of the Plateau. Quat. Sci. 2016, 34, 775–788. [Google Scholar] [CrossRef]
  31. Elliott, J.R.; Jolivet, R.; González, P.J.; Avouac, J.-P.; Hollingsworth, J.; Searle, M.P.; Stevens, V.L. Himalayan Megathrust Geometry and Relation to Topography Revealed by the Gorkha Earthquake. Nat. Geosci. 2016, 9, 174–180. [Google Scholar] [CrossRef]
  32. Li, Z.; Cao, Y.; Wei, J.; Duan, M.; Wu, L.; Hou, J.; Zhu, J. Time-Series InSAR Ground Deformation Monitoring: Atmospheric Delay Modeling and Estimating. Earth-Sci. Rev. 2019, 192, 258–284. [Google Scholar] [CrossRef]
  33. Qiao, X.; Zhou, Y. Geodetic Imaging of Shallow Creep along the Xianshuihe Fault and Its Frictional Properties. Earth Planet. Sci. Lett. 2021, 567, 117001. [Google Scholar] [CrossRef]
  34. Yague-Martinez, N.; Prats-Iraola, P.; Rodriguez Gonzalez, F.; Brcic, R.; Shau, R.; Geudtner, D.; Eineder, M.; Bamler, R. Interferometric Processing of Sentinel-1 TOPS Data. IEEE Trans. Geosci. Remote Sens. 2016, 54, 2220–2234. [Google Scholar] [CrossRef]
  35. Li, Y.; Tian, Y.; Yu, C.; Zhe, S.; Jiang, W.; Li, Z.; Zhang, J.; Luo, Y.; Li, B. Present-Day Interseismic Deformation Characteristics of the Beng Co-Dongqiao Conjugate Fault System in Central Tibet: Implications from InSAR Observations. Geophys. J. Int. 2020, 221, 492–503. [Google Scholar] [CrossRef]
  36. Liu, C.; Ji, L.; Zhu, L.; Zhao, C. InSAR-Constrained Interseismic Deformation and Potential Seismogenic Asperities on the Altyn Tagh Fault at 91.5–95°E, Northern Tibetan Plateau. Remote Sens. 2018, 10, 943. [Google Scholar] [CrossRef]
  37. Xu, B.; Li, Z.; Zhu, Y.; Shi, J.; Feng, G. SAR Interferometric Baseline Refinement Based on Flat-Earth Phase without a Ground Control Point. Remote Sens. 2020, 12, 233. [Google Scholar] [CrossRef]
  38. Su, Y.; Peng, J.; Shi, M.; Guo, C.; Ma, X.; Li, X.; Wang, J.; Wang, W. An M-Estimation Method for InSAR Nonlinear Deformation Modeling and Inversion. IEEE Trans. Geosci. Remote Sens. 2024, 62, 1–12. [Google Scholar] [CrossRef]
  39. Biggs, J.; Wright, T.; Lu, Z.; Parsons, B. Multi-Interferogram Method for Measuring Interseismic Deformation: Denali Fault, Alaska. Geophys. J. Int. 2007, 170, 1165–1179. [Google Scholar] [CrossRef]
  40. Wang, H.; Wright, T.J. Satellite Geodetic Imaging Reveals Internal Deformation of Western Tibet. Geophys. Res. Lett. 2012, 39, L07303. [Google Scholar] [CrossRef]
  41. Werner, C.L.; Wegmüller, U.; Strozzi, T. Processing Strategies for Phase Unwrapping for InSAR Applications. In Proceedings of the EUSAR 2002—European Conference on Synthetic Aperture Radar, Cologne, Germany, 4–6 June 2002. [Google Scholar]
  42. Gong, W.; Zhao, D.; Zhu, C.; Zhang, Y.; Li, C.; Zhang, G.; Shan, X. A New Method for InSAR Stratified Tropospheric Delay Correction Facilitating Refinement of Coseismic Displacement Fields of Small-to-Moderate Earthquakes. Remote Sens. 2022, 14, 1425. [Google Scholar] [CrossRef]
  43. Qu, F.; Zhang, Q.; Lu, Z.; Zhao, C.; Yang, C.; Zhang, J. Land Subsidence and Ground Fissures in Xi’an, China 2005–2012 Revealed by Multi-Band InSAR Time-Series Analysis. Remote Sens. Environ. 2014, 155, 366–376. [Google Scholar] [CrossRef]
  44. Hussain, E.; Wright, T.J.; Walters, R.J.; Bekaert, D.P.S.; Lloyd, R.; Hooper, A. Constant Strain Accumulation Rate between Major Earthquakes on the North Anatolian Fault. Nat. Commun. 2018, 9, 1392. [Google Scholar] [CrossRef] [PubMed]
  45. Liang, S.; Gan, W.; Shen, C.; Xiao, G.; Liu, J.; Chen, W.; Ding, X.; Zhou, D. Three-Dimensional Velocity Field of Present-Day Crustal Motion of the Tibetan Plateau Derived from GPS Measurements. J. Geophys. Res. Solid Earth 2013, 118, 5722–5732. [Google Scholar] [CrossRef]
  46. Wu, Y.; Zheng, Z.; Nie, J.; Chang, L.; Su, G.; Yin, H.; Liang, H.; Pang, Y.; Chen, C.; Jiang, Z.; et al. High-Precision Vertical Movement and Three-Dimensional Deformation Pattern of the Tibetan Plateau. J. Geophys. Res. Solid Earth 2022, 127, e2021JB023202. [Google Scholar] [CrossRef]
  47. Hua, J.; Gong, W.; Shan, X.; Wang, Z.; Ji, L.; Liu, C.; Li, Y. Research on Integrating Interseismic Deformation Rate Fields of Multi-Track InSAR. Seismol. Geol. 2022, 44, 1172–1189. [Google Scholar]
  48. Li, Y.; Liu, M.; Wang, Q.; Cui, D. Present-Day Crustal Deformation and Strain Transfer in Northeastern Tibetan Plateau. Earth Planet. Sci. Lett. 2018, 487, 179–189. [Google Scholar] [CrossRef]
  49. McCaffrey, R.; Qamar, A.I.; King, R.W.; Wells, R.; Khazaradze, G.; Williams, C.A.; Stevens, C.W.; Vollick, J.J.; Zwick, P.C. Fault Locking, Block Rotation and Crustal Deformation in the Pacific Northwest. Geophys. J. Int. 2007, 169, 1315–1340. [Google Scholar] [CrossRef]
  50. Zhang, Z.; McCaffrey, R.; Zhang, P. Relative Motion across the Eastern Tibetan Plateau: Contributions from Faulting, Internal Strain and Rotation Rates. Tectonophysics 2013, 584, 240–256. [Google Scholar] [CrossRef]
  51. Loveless, J.P.; Meade, B.J. Partitioning of Localized and Diffuse Deformation in the Tibetan Plateau from Joint Inversions of Geologic and Geodetic Observations. Earth Planet. Sci. Lett. 2011, 303, 11–24. [Google Scholar] [CrossRef]
  52. Drewes, H. (Ed.) Geodetic Reference Frames; International Association of Geodesy Symposia; Springer: Berlin/Heidelberg, Germany, 2009; Volume 134, ISBN 978-3-642-00859-7. [Google Scholar]
  53. McCaffrey, R. Time-Dependent Inversion of Three-Component Continuous GPS for Steady and Transient Sources in Northern Cascadia. Geophys. Res. Lett. 2009, 36, L07304. [Google Scholar] [CrossRef]
  54. Savage, J.C. A Dislocation Model of Strain Accumulation and Release at a Subduction Zone. J. Geophys. Res. 1983, 88, 4984–4996. [Google Scholar] [CrossRef]
  55. Okada, Y. Surface Deformation Due to Shear and Tensile Faults in a Half-Space. Bull. Seismol. Soc. Am. 1985, 75, 1135–1154. [Google Scholar] [CrossRef]
  56. Tian, Z.; Freymueller, J.T.; He, Y.; Ji, G.; Wang, S.; Li, Z. Postseismic Deformation Due to the 2021 MW 7.4 Maduo (China) Earthquake and Implications for Regional Rheology and Seismic Hazards around the Bayan Har Block. Earth Planet. Sci. Lett. 2024, 647, 119059. [Google Scholar] [CrossRef]
  57. He, Y.; Tian, Z.; Su, L.; Feng, H.; Yan, W.; Zhang, Y. Coseismic Slip and Downdip Afterslip Associated with the 2021 Maduo Earthquake Revealed by Sentinel-1 A/B Data. Appl. Sci. 2024, 14, 6771. [Google Scholar] [CrossRef]
  58. Liu, C.; Ji, L.; Zhu, L.; Xu, C.; Zhang, W.; Qiu, J.; Xiong, G. Present-Day Three-Dimensional Deformation across the Ordos Block, China, Derived from InSAR, GPS, and Leveling Observations. Remote Sens. 2023, 15, 2890. [Google Scholar] [CrossRef]
  59. Yin, C.; Liu, Q.; Wang, F. Surface Deformation Analysis of Hohhot Urban Area Based on SAR Data from Sentinel-1A. Chin. J. Geol. Hazard Control 2023, 34, 73–81. [Google Scholar] [CrossRef]
  60. Diao, F.; Xiong, X.; Wang, R.; Walter, T.R.; Wang, Y.; Wang, K. Slip Rate Variation Along the Kunlun Fault (Tibet): Results From New GPS Observations and a Viscoelastic Earthquake-Cycle Deformation Model. Geophys. Res. Lett. 2019, 46, 2524–2533. [Google Scholar] [CrossRef]
  61. Liu, Y.; Han, S.; Xiong, L.; Wen, Y.; Li, H.; Xu, C. Three-Dimensional Deformation Velocity Field and Kinematic Characteristic of the Middle and East Parts of Haiyuan Fault Zone from InSAR and GPS Observations. Adv. Space Res. 2023, 71, 3175–3185. [Google Scholar] [CrossRef]
  62. Qiao, X.; Qu, C.; Shan, X.; Zhao, D.; Liu, L. Interseismic Slip and Coupling along the Haiyuan Fault Zone Constrained by InSAR and GPS Measurements. Remote Sens. 2021, 13, 3333. [Google Scholar] [CrossRef]
  63. Duvall, A.R.; Clark, M.K. Dissipation of Fast Strike-Slip Faulting within and beyond Northeastern Tibet. Geology 2010, 38, 223–226. [Google Scholar] [CrossRef]
  64. Li, Y.; Cui, D.; Hao, M. GPS-Constrained Inversion of Slip Rate on Major Active Faults in the Northeastern Margin of Tibet Plateau. Earth Sci. China Univ. Geosci. 2015, 40, 1767. [Google Scholar] [CrossRef]
  65. Cheng, F.; Zuza, A.V.; Haproff, P.J.; Wu, C.; Neudorf, C.; Chang, H.; Li, X.; Li, B. Accommodation of India–Asia Convergence via Strike-Slip Faulting and Block Rotation in the Qilian Shan Fold–Thrust Belt, Northern Margin of the Tibetan Plateau. J. Geol. Soc. 2021, 178, jgs2020-207. [Google Scholar] [CrossRef]
  66. Zhuang, W.; Cui, D.; Hao, M.; Song, S.; Li, Z. Geodetic Constraints on Contemporary Three-Dimensional Crustal Deformation in the Laji Shan–Jishi Shan Tectonic Belt. Geod. Geodyn. 2023, 14, 589–596. [Google Scholar] [CrossRef]
  67. Qu, W.; Cui, Y.; Hao, M.; Li, J. The Current Activity Characteristics of Northern Margin Fault of West Qinling Mountains Based on GNSS. J. Geod. Geodyn. 2024, 44, 221–227. [Google Scholar]
  68. Li, C.; Zhang, P.; Zhang, J.; Yuan, D.; Wang, Z. Late-Quaternary Activity and Slip Rate of the Western Qinling Fault Zone at Huang Xiang Gou. Quat. Sci. 2007, 27, 54–63. [Google Scholar]
  69. Wang, W.; Zhang, P.; Lei, Q. Deformational Characteristics of the Niushoushan-Luoshan Fault Zone and Its Tectonic Implications. Seismol. Geol. 2013, 35, 195–207. [Google Scholar]
  70. Middleton, T.A.; Walker, R.T.; Rood, D.H.; Rhodes, E.J.; Parsons, B.; Lei, Q.; Elliott, J.R.; Ren, Z.; Zhou, Y. The Tectonics of the Western Ordos Plateau, Ningxia, China: Slip Rates on the Luoshan and East Helanshan Faults. Tectonics 2016, 35, 2754–2777. [Google Scholar] [CrossRef]
  71. Bi, H.; Zheng, W.; Lei, Q.; Zeng, J.; Zhang, P.; Chen, G. Surface Slip Distribution Along the West Helanshan Fault, Northern China, and Its Implications for Fault Behavior. J. Geophys. Res. Solid Earth 2020, 125, e2020JB019983. [Google Scholar] [CrossRef]
  72. Cui, D.; Hao, M.; Li, Y.; Wang, W.; Qin, S.; Li, Z. Present-Day Crustal Movement and Strain of the Surrounding Area of Ordos Block Derived from Repeated GPS Observations. Chin. J. Geophys. 2016, 59, 3646–3661. [Google Scholar] [CrossRef]
  73. Garthwaite, M.C.; Wang, H.; Wright, T.J. Broadscale Interseismic Deformation and Fault Slip Rates in the Central Tibetan Plateau Observed Using InSAR. J. Geophys. Res. Solid Earth 2013, 118, 5071–5083. [Google Scholar] [CrossRef]
  74. Zheng, G.; Wang, H.; Wright, T.J.; Lou, Y.; Zhang, R.; Zhang, W.; Shi, C.; Huang, J.; Wei, N. Crustal Deformation in the India-Eurasia Collision Zone From 25 Years of GPS Measurements. J. Geophys. Res. Solid Earth 2017, 122, 9290–9312. [Google Scholar] [CrossRef]
  75. Cui, D.; Wang, Q.; Hu, Y.; Wang, W.; Zhu, G. Inversion of GPS Data for Slip Rates and Locking Depths of the Haiyuan Fault. ACT A Seismol. Sin. 2009, 31, 516–525. [Google Scholar]
  76. Zhu, L.; Ji, L.; Jiang, F. Variations in Locking Along the East Kunlun Fault, Tibetan Plateau, China, Using GPS and Leveling Data. Pure Appl. Geophys. 2020, 177, 215–231. [Google Scholar] [CrossRef]
  77. Wen, Y.; Fang, Z.; He, K.; Yang, J.; Xiong, L.; Xu, C. Present-Day Crustal Deformation of the Maqên-Maqu Segmen in the East Kunlun Fault Zone Revealed by Sentinel-1 Images. Chin. J. Geophys. 2023, 66, 4517–4532. [Google Scholar] [CrossRef]
  78. Jian, H.; Gong, W.; Li, Y.; Wang, L. Bayesian Inference of Fault Slip and Coupling Along the Tuosuo Lake Segment of the Kunlun Fault, China. Geophys. Res. Lett. 2022, 49, e2021GL096882. [Google Scholar] [CrossRef]
  79. Cavalié, O.; Lasserre, C.; Doin, M.P.; Peltzer, G.; Sun, J.; Xu, X.; Shen, Z.K. Measurement of Interseismic Strain across the Haiyuan Fault (Gansu, China), by InSAR. Earth Planet. Sci. Lett. 2008, 275, 246–257. [Google Scholar] [CrossRef]
  80. Liu, L.; Sang, J.; Zhang, X.; Wang, S. Analysis of the North Margin of West Qinling Fault Locking Based on GPS and Leveling Data. J. Geod. Geodyn. 2019, 39, 562–568. [Google Scholar]
  81. Wang, H.; Liu, M.; Cao, J.; Shen, X.; Zhang, G. Slip Rates and Seismic Moment Deficits on Major Active Faults in Mainland China. J. Geophys. Res. Solid Earth 2011, 116, B02405. [Google Scholar] [CrossRef]
  82. Jolivet, R.; Simons, M.; Agram, P.S.; Duputel, Z.; Shen, Z.K. Aseismic Slip and Seismogenic Coupling along the Central San Andreas Fault. Geophys. Res. Lett. 2015, 42, 297–306. [Google Scholar] [CrossRef]
  83. Liu, S.; Xu, X.; Klinger, Y.; Nocquet, J.M.; Chen, G.; Yu, G.; Jónsson, S. Lower Crustal Heterogeneity Beneath the Northern Tibetan Plateau Constrained by GPS Measurements Following the 2001 Mw7.8 Kokoxili Earthquake. J. Geophys. Res. Solid Earth 2019, 124, 11992–12022. [Google Scholar] [CrossRef]
  84. Zhao, D.; Qu, C.; Shan, X. Enhanced Interseismic Coupling Due to Stress Interactions May Contribute to the Cascading Rupture Across the Branching Kunlun Pass Fault During the 2001 Mw 7.8 Kokoxili Earthquake. Seismol. Res. Lett. 2025, 96, 2856–2866. [Google Scholar] [CrossRef]
  85. Li, C.X.; Xu, X.W.; Wen, X.Z.; Zheng, R.Z.; Chen, G.H.; Yang, H.; An, Y.F.; Gao, X. Rupture Segmentation and Slip Partitioning of the Mid-Eastern Part of the Kunlun Fault, North Tibetan Plateau. Sci. China Earth Sci. 2011, 54, 1730–1745. [Google Scholar] [CrossRef]
  86. Huang, X.; Li, Y.; Shan, X.; Zhong, M.; Wang, X.; Gao, Z. Fault Kinematics of the 2023 Mw 6.0 Jishishan Earthquake, China, Characterized by Interferometric Synthetic Aperture Radar Observations. Remote Sens. 2024, 16, 1746. [Google Scholar] [CrossRef]
  87. Gaudemer, Y.; Tapponnier, P.; Meyer, B.; Peltzer, G.; Shunmin, G.; Zhitai, C.; Huagung, D.; Cifuentes, I. Partitioning of Crustal Slip between Linked, Active Faults in the Eastern Qilian Shan, and Evidence for a Major Seismic Gap, the ‘Tianzhu Gap’, on the Western Haiyuan Fault, Gansu (China). Geophys. J. Int. 1995, 120, 599–645. [Google Scholar] [CrossRef]
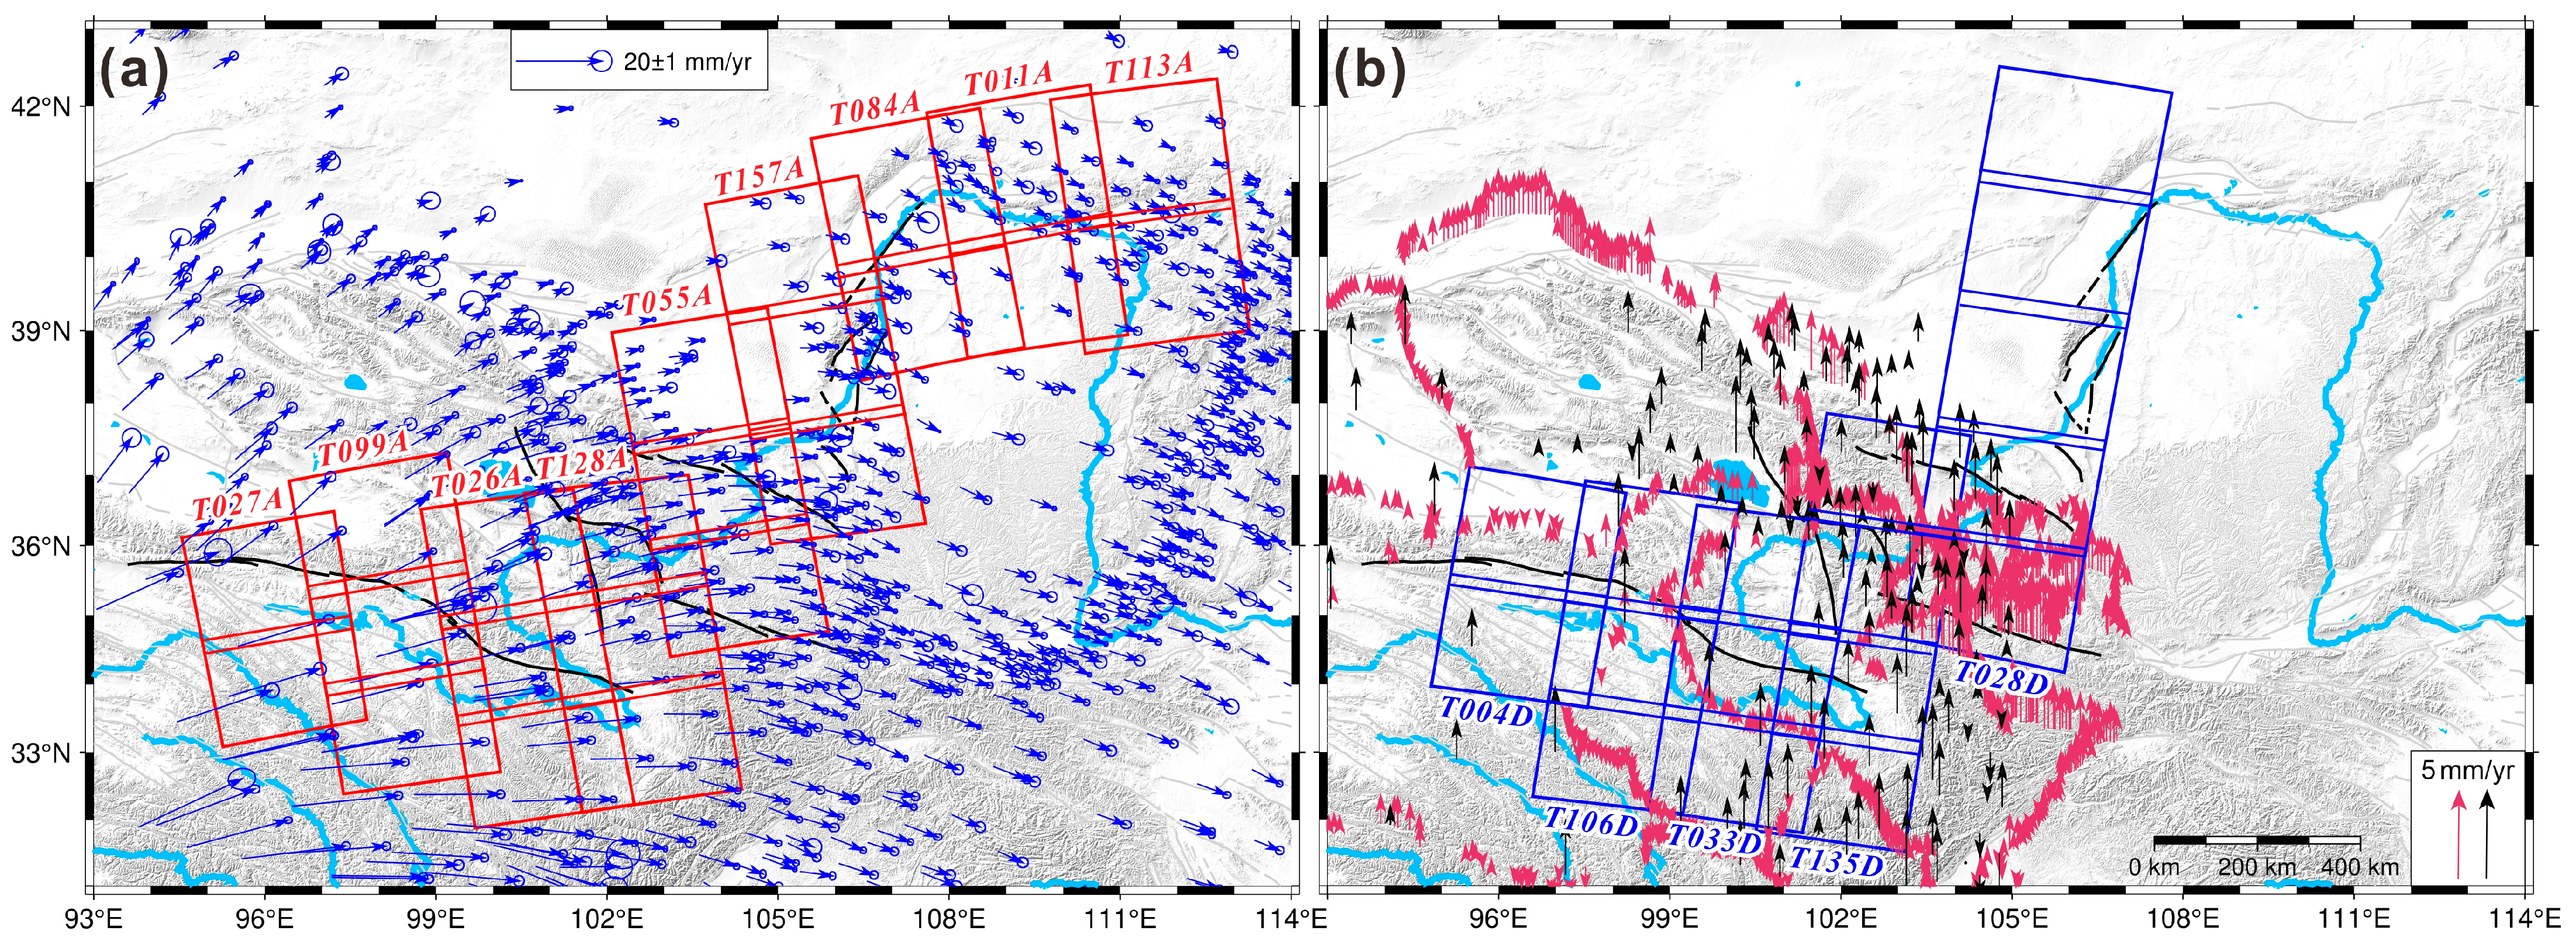
Figure 2. Swaths of InSAR data and 3D interseismic velocities derived from GNSS and leveling observations. Red rectangles ((a), ascending orbit) and blue rectangles ((b), descending orbit) show the coverage of the Sentinel-1 data. Blue vectors (a) denote GNSS horizontal velocities, and black and red vectors (b) are GNSS and leveling vertical velocities, respectively.
Remotesensing 18 02297 g002
Figure 3. Schematic representation of time-series InSAR processing.
Remotesensing 18 02297 g003
Figure 4. LOS deformation rates in the ascending (a) and descending (b) tracks within the reference frame provided by GNSS velocities. Colored dots indicate GNSS LOS velocities, and black lines represent the active faults around the UYRB.
Remotesensing 18 02297 g004
Figure 5. Comparisons between GNSS LOS and mosaicked InSAR LOS velocities (mini-rectangles with error bars) in the ascending (a) and descending (b) tracks. The detailed differences are also presented as histograms for each track.
Remotesensing 18 02297 g005
Figure 6. Block model and the corresponding residuals between observations and model predictions. Ascending and descending InSAR residuals are shown by the colored maps in (a,b), and detailed residuals are also presented by histograms for each track. Red vectors in (b) exhibit GNSS residuals.
Remotesensing 18 02297 g006
Figure 7. Local deformation rates related to human activities in the ascending track. Panels (be) are the zoomed-in view of the regions labeled with the red box in (a).
Remotesensing 18 02297 g007
Figure 9. Interseismic coupling (a) and slip deficits (b) on the active faults around the URYB. Abbreviations for fault segmentation are the same as in Figure 1.
Remotesensing 18 02297 g009
Figure 10. Potential magnitude of earthquakes along the active faults around the UYRB, estimated from the seismic moment budgets of the seismogenic fault asperities. Historical earthquakes (colored circles) and the abbreviations of fault segmentation are the same as in Figure 1.
Remotesensing 18 02297 g010
Disclaimer/Publisher’s Note: The statements, opinions and data contained in all publications are solely those of the individual author(s) and contributor(s) and not of MDPI and/or the editor(s). MDPI and/or the editor(s) disclaim responsibility for any injury to people or property resulting from any ideas, methods, instructions or products referred to in the content.