Article

Synergistic SAR and Wide-Swath Interferometric Altimetry Observations for Estimating Flood Dynamics and Water Storage Variations in East Dongting Lake


1
CAS Key Laboratory of Microwave Remote Sensing, National Space Science Center, Chinese Academy of Sciences, Beijing 100190, China
2
School of Electronic, Electrical, and Communication Engineering, University of Chinese Academy of Sciences, Beijing 100049, China
*
Author to whom correspondence should be addressed.
Remote Sens. 2026, 18(14), 2283; https://doi.org/10.3390/rs18142283
Submission received: 8 June 2026 / Revised: 28 June 2026 / Accepted: 3 July 2026 / Published: 8 July 2026

Highlights

What are the main findings?
  • The proposed AS-FCM method improves Sentinel-1 SAR-based flood inundation mapping in heterogeneous floodplain environments, achieving an Overall Accuracy of 93.6%, an IoU of 0.89, and a Kappa coefficient of 0.87.
  • By integrating SAR-derived inundation extent with bias-adjusted SWOT and in situ water-level observations, a WSE–area relationship is established to reconstruct flood dynamics and estimate flood-induced storage variations in East Dongting Lake.
What are the implications of the main findings?
  • The SAR–SWOT integration framework enables flood evolution to be characterized not only by inundation extent, but also by water surface elevation and storage change.
  • The framework provides a practical way to bridge temporally sparse SWOT observations and high-resolution SAR inundation maps for event-scale flood monitoring and hydrological storage assessment in large river–lake systems.

Abstract

Accurate characterization of flood dynamics in large river–lake systems remains challenging due to the difficulty of simultaneously capturing inundation extent and water surface elevation (WSE) variations under rapidly changing hydrological conditions. This study develops an integrated Synthetic Aperture Radar (SAR) and wide-swath interferometric altimetry framework to reconstruct the spatiotemporal evolution and storage dynamics of the 2024 flood event in the East Dongting Lake system, China. Sentinel-1 SAR imagery is utilized to derive high-resolution inundation extent, while the Surface Water and Ocean Topography (SWOT) mission, equipped with the Ka-band Radar Interferometer (KaRIn), provides two-dimensional WSE observations. To improve SAR-based flood extraction in heterogeneous floodplain environments, an Adaptive Spatially-Constrained Fuzzy C-Means (AS-FCM) algorithm is proposed by incorporating adaptive spatial regularization and structure-aware neighborhood weighting. Quantitative evaluation demonstrates that the proposed method achieves the highest performance among the evaluated conventional approaches, with an Overall Accuracy of 93.6%, an Intersection over Union of 0.89, and a Kappa coefficient of 0.87. The multi-temporal inundation sequence reveals a distinct flood evolution pattern characterized by rapid expansion during the rising stage and gradual recession during the post-peak period. SWOT-derived WSE observations exhibit strong agreement with synchronous in situ measurements after bias adjustment, with a correlation coefficient of 0.988. By integrating SAR-derived inundation extent with temporally matched water-level observations constrained by bias-adjusted SWOT and in situ gauge data, an empirical WSE–area relationship ( R 2 = 0.937 ) is established to reconstruct daily flood dynamics and estimate cumulative water storage variation. The results indicate that the East Dongting Lake floodplain played an important buffering role during the 2024 flood event, with cumulative storage variation reaching approximately 10.7 km 3 during the peak stage. Overall, the proposed framework demonstrates strong potential for flood monitoring and hydrological storage assessment in complex river–lake systems.

1. Introduction

Floods are among the most destructive natural hazards worldwide, posing serious threats to human life, infrastructure, and ecosystem stability [1,2]. Understanding how floods evolve in space and time, especially in terms of both inundation extent and water storage, is essential for hydrological analysis and risk management [3].
Remote sensing has greatly improved the ability to monitor floods. In practice, however, most approaches still focus on mapping inundation in two dimensions. Information on water surface elevation (WSE), which directly controls water depth and storage, is typically missing [4]. This limitation becomes particularly critical in low-relief floodplains, where even small changes in water level can lead to large variations in inundated area. As a result, relying on 2D maps alone makes it difficult to constrain flood volume and storage capacity in a physically meaningful way [5].
Synthetic Aperture Radar (SAR) has long been a primary data source for flood mapping because of its ability to operate under all-weather and day–night conditions [6,7]. Water bodies can often be identified by their low backscatter signatures, and this principle underpins a wide range of methods, from early thresholding and change-detection-based techniques [8,9,10] to more recent machine learning classifiers [11]. Deep learning models, such as CNNs and U-Net, have further improved mapping accuracy by learning complex spatial patterns from large datasets [12,13,14].
Despite these advances, SAR-based flood mapping remains challenging in river–lake transition zones. Floodwater turbidity, wind-driven surface roughness, and emergent vegetation can significantly alter backscatter signals, making water–land separation less reliable [15]. Deep learning approaches can partially mitigate these effects, but they depend heavily on large, well-labeled training datasets, which are often unavailable during rapidly evolving flood events [16]. In addition, their performance does not always transfer well across different regions or hydrological conditions, especially in heterogeneous floodplains where scattering mechanisms vary considerably [17].
Fuzzy clustering methods, particularly Fuzzy C-Means (FCM), offer an alternative by explicitly modeling uncertainty at water–land boundaries [18,19]. This soft-membership representation is well suited to remote-sensing water extraction and flood-related inundation mapping, where mixed pixels, gradual shoreline transitions, and ambiguous spectral or backscatter responses commonly occur [20]. Therefore, FCM-based and fuzzy clustering methods have been used as effective tools for water-related image segmentation and classification tasks.
However, the standard FCM formulation treats each pixel independently and is therefore sensitive to speckle noise, often resulting in fragmented classifications in SAR imagery [21,22]. Spatially constrained variants improve this by incorporating neighborhood information [23,24], but most implementations rely on fixed spatial weighting. In practice, this makes them less effective in highly dynamic floodplain environments, where local heterogeneity, mixed land–water pixels, and structural discontinuities play an important role.
More fundamentally, SAR observations primarily capture the spatial extent of inundation. While time-series SAR can effectively characterize flood expansion and recession patterns, it cannot directly resolve WSE variability and the associated storage dynamics.
Satellite altimetry offers a complementary perspective by directly measuring WSE. Traditional nadir altimeters (e.g., TOPEX/Poseidon, Jason series, ENVISAT, Sentinel-3) have provided valuable long-term water level records for lakes and rivers [25,26,27]. However, their narrow ground tracks lead to sparse spatial sampling, which limits their ability to resolve spatial variability in floodplains and river–lake systems [28,29]. In a system like Dongting Lake, a single overpass typically captures only a small portion of the water surface, leaving much of the spatial structure unresolved.
The Surface Water and Ocean Topography (SWOT) mission represents a major step forward in this regard [30]. Using the Ka-band Radar Interferometer (KaRIn), SWOT provides wide-swath observations of WSE with a swath width of about 120 km, enabling two-dimensional mapping of water levels at high spatial resolution [31,32]. This opens up new possibilities for observing hydrodynamic processes in lakes, rivers, and floodplains [33]. Early results have already shown its ability to resolve spatial gradients that were previously unobservable with conventional altimetry [34,35].
At the same time, SWOT alone cannot fully capture flood dynamics. Its revisit cycle (approximately 21 days) is too coarse to resolve rapidly evolving flood processes. In addition, WSE retrieval can be affected by mixed land–water pixels and heterogeneous surface conditions, particularly in transition zones [36].
Taken together, these limitations point to a fundamental issue: SAR provides frequent observations of flood extent but lacks elevation information, whereas wide-swath interferometric altimetry provides elevation but with sparse temporal coverage. The observations are therefore complementary but also inherently asynchronous.
This raises a practical question: how can continuous flood dynamics be reconstructed from such fragmented observations? Existing studies have explored different ways of combining multi-source data. A common approach integrates SAR-derived inundation maps with digital elevation models (DEMs) to estimate water depth [37,38]. However, this relies on the assumption that the terrain is static and accurately represented, which is often not the case in dynamic floodplains. Widely used DEMs such as SRTM may contain significant errors due to vegetation bias, limited resolution, and outdated topography [39,40]. In addition, small-scale hydraulic structures and time-varying bathymetry are generally not captured [41].
Another approach links SAR-derived inundation extent with altimetry-derived water levels through empirical WSE–area relationships [42]. This avoids the need for DEMs, but its applicability was previously limited by the sparse sampling of conventional altimeters. SWOT’s wide-swath observations now make it possible to establish more robust relationships at the basin scale [43]. However, the temporal mismatch between SAR and SWOT observations remains a key challenge, especially during periods of rapid change.
In this study, we develop a SAR–SWOT integration framework to reconstruct the spatiotemporal evolution of flood dynamics and associated water storage. Using the 2024 flood event in the Dongting Lake system as a case study, our contributions are threefold:
(1)
Adaptive spatial–fuzzy flood mapping. An Adaptive Spatial FCM (AS-FCM) framework is developed to improve SAR-based inundation mapping under heterogeneous floodplain conditions. By incorporating adaptive spatial constraints and structure-aware neighborhood weighting, the proposed approach enhances spatial consistency and reduces classification ambiguity caused by speckle noise and complex land–water transitions.
(2)
Multi-source WSE–inundation integration. Bias-adjusted SWOT WSE observations are integrated with SAR-derived inundation extents through an empirical WSE–area relationship constrained by in situ observations. This integration enables reconstruction of flood dynamics at a daily temporal resolution, thereby bridging the temporal gaps between individual satellite observations.
(3)
First-order uncertainty assessment for flood storage estimation. A first-order uncertainty assessment framework is introduced for flood storage estimation by jointly considering inundation mapping uncertainty, SWOT WSE uncertainty, and numerical integration effects. This framework provides a practical evaluation of the dominant uncertainty sources affecting reconstructed flood storage dynamics.
This framework bridges SAR-based flood extent mapping and KaRIn-based WSE profiling, allowing flood dynamics to be characterized in both areal expansion and volumetric storage terms.
The remainder of this paper is organized as follows. Section 2 describes the study area and multi-source datasets. Section 3 details the AS-FCM-based water extraction, spatiotemporal decomposition, and SAR–SWOT integration methodology. Section 4 presents the reconstructed flood dynamics and volumetric results. Section 5 discusses the implications and limitations of the proposed framework. Section 6 concludes the study.

2. Study Area and Data

2.1. Study Area

This study focuses on the East Dongting Lake region ( 28 59 29 38 N , 112 43 113 15 E ), located within the Dongting Lake basin in the middle reaches of the Yangtze River, China (Figure 1). As a representative river–lake interaction zone, East Dongting Lake exhibits pronounced seasonal variations in inundation extent and hydraulic connectivity. These hydrological dynamics are jointly influenced by upstream discharge from the Yangtze River and inflows from major tributaries, including the Xiangjiang, Zijiang, Yuanjiang, and Lishui Rivers.
According to official hydrological reports, the Yangtze River’s number one 2024 flood formed in the middle and lower reaches of the Yangtze River in late June 2024. In the Dongting Lake region, the Chenglingji hydrological station reached the warning water level of 33 m at 09:00 on 30 June 2024, marking the formation of Dongting Lake’s number one 2024 flood. The main high-water stage occurred from late June to July, during which the lake level rose rapidly and floodplain inundation expanded extensively. Based on the gauge record and the reconstructed WSE series used in this study, the flood peak occurred in early July, followed by a gradual recession from August to October. The severity of the event was also reflected by the dike breach in Dongting Lake region in early July 2024. This event was characterized by rapid water-level rise, extensive floodplain inundation, and pronounced spatiotemporal variability in surface water distribution, providing a representative case for investigating river–lake flood dynamics using multi-source remote sensing observations.
The analysis focuses on the integrated river–lake system, including the main lake body, adjacent floodplains, and the Chenglingji hydrometric region near the lake–river outlet. This region serves as a key control section for water-level validation and for linking satellite-derived observations with in situ measurements.
The study period spans from May to October 2024, encompassing the rising stage, peak flood period, and recession phase of the flood event, thereby capturing its complete hydrological evolution.

2.2. Data Description

2.2.1. Sentinel-1 SAR Data

Sentinel-1 C-band SAR imagery was employed to characterize flood inundation dynamics during the 2024 flood event. A total of 12 Sentinel-1A Level-1 Ground Range Detected (GRD) scenes were acquired between 5 May and 8 October 2024, covering the critical flood period in the East Dongting Lake region.
Operating at a frequency of 5.405 GHz, Sentinel-1 provides all-weather, day-and-night imaging capability, making it particularly suitable for flood monitoring in the frequently cloud-covered Dongting Lake basin. All images are acquired in Interferometric Wide (IW) swath mode with dual-polarization observations (VV and VH). Because only Sentinel-1A data are available during the study period, the effective revisit interval is approximately 12 days. The main specifications of the SAR dataset are summarized in Table 1.
All SAR scenes are preprocessed following a standard workflow, including (1) precise orbit correction, (2) radiometric calibration to the backscatter coefficient ( σ 0 ), (3) speckle suppression using the Refined Lee filter, and (4) terrain correction based on the SRTM 1-arcsecond DEM. The processed imagery is subsequently resampled to a 10 m grid and co-registered to ensure sub-pixel geometric consistency for time-series analysis.
At moderate to high incidence angles typical of Sentinel-1 IW mode, open water surfaces generally exhibit low backscatter due to dominant specular reflection, whereas vegetated and non-water land surfaces produce stronger returns associated with surface roughness and volume scattering. This distinct backscatter contrast provides the physical basis for the AS-FCM water extraction method described in Section 3.2.

2.2.2. SWOT Data

This study utilizes observations acquired by the SWOT mission, which is equipped with the KaRIn. Unlike conventional nadir-looking radar altimeters, SWOT employs wide-swath interferometric measurements to retrieve WSE at high spatial resolution over inland water bodies.
The principal system and observation parameters of the KaRIn instrument are summarized in Table 2.
The SWOT_L2_HR_LakeSP product is employed, which provides vector-based WSE and water extent estimates at the lake scale. Standard quality control procedures are applied using the product-provided quality flags, and observations flagged as low confidence are excluded prior to analysis to ensure data reliability.
The LakeSP product is then used to derive lake-averaged WSE for individual SWOT overpasses and to validate temporal water-level variations against in situ gauge observations.
All elevation measurements are referenced to the EGM2008 geoid, while horizontal coordinates are provided in the WGS84 geographic reference system.

2.2.3. In Situ Hydrological Data

Daily WSE observations from the Chenglingji hydrometric station are used for validation and bias adjustment of SWOT-derived WSE. Located at the outlet of Dongting Lake to the Yangtze River, this station represents a key control point for the regional hydrological regime.
The in situ dataset covers the entire year of 2024, providing continuous reference for both SAR acquisitions and SWOT overpasses. The original measurements are referenced to the Huanghai Sea level datum. To ensure consistency with SWOT elevations referenced to EGM2008, a systematic bias adjustment is applied.

2.3. Multi-Source Data Integration and Spatiotemporal Alignment

The datasets used in this study provide complementary constraints on flood dynamics. Sentinel-1 SAR observations capture high-resolution inundation extent, whereas SWOT LakeSP products provide spatially distributed WSE observations at the lake scale. In situ water-level observations from the Chenglingji hydrological station are additionally used as an independent reference for SWOT WSE validation and bias adjustment. Optical images from Sentinel-2 and Landsat 8/9 are used only as auxiliary reference data for validating SAR-derived inundation maps.
Due to differences in spatial resolution, revisit frequency, and acquisition time among Sentinel-1, optical sensors, SWOT, and in situ observations, a spatiotemporal integration strategy is required. Because same-day observations from all satellite sensors were not always available, the temporal differences among the datasets were explicitly recorded. Table 3 summarizes the temporal differences between each Sentinel-1 SAR acquisition and the nearest available optical reference image, as well as the nearest SWOT overpass.
Optical images are used only for cloud-screened reference annotation and accuracy assessment of SAR-derived inundation maps, rather than for reconstructing daily flood dynamics. Cloud-contaminated, cloud-shadowed, visually ambiguous, or hydrologically inconsistent regions are excluded from the pixel-wise accuracy assessment, and only valid reference pixels with reliable water/non-water interpretation are retained. The Sentinel-1 acquisition on 22 June 2024 is retained for flood dynamics analysis but excluded from optical-based validation because no suitable cloud-free optical reference image is available. Therefore, the optical–SAR temporal differences mainly affect the availability of validation reference pixels rather than the reconstruction of flood dynamics.
For SAR–SWOT integration, direct same-day pairing between each Sentinel-1 acquisition and SWOT overpass is not assumed. The direct temporal differences between Sentinel-1 acquisitions and the nearest SWOT overpasses range from 0 to 9 days. To reduce the impact of sparse SWOT temporal sampling, SWOT WSE observations are first bias-adjusted using synchronous in situ gauge records. The daily gauge-based WSE series is then used to provide temporally continuous water-level support at Sentinel-1 acquisition dates. In this way, each SAR-derived inundation area ( A t ) is paired with the corresponding daily WSE value from the SWOT-adjusted gauge water-level series, rather than being directly paired with the nearest SWOT overpass.
A two-step framework is adopted:
(1)
Spatiotemporal matching: SAR-derived inundation maps are temporally linked with daily WSE values from the SWOT-adjusted gauge water-level series. Specifically, SWOT WSE observations are first used to identify and correct the systematic vertical offset relative to synchronous in situ gauge measurements. The continuous daily gauge record then provides WSE values corresponding to the Sentinel-1 acquisition dates. This procedure produces temporally aligned WSE–area pairs for subsequent relationship fitting while explicitly accounting for the limited temporal sampling of SWOT.
(2)
Cross-consistency evaluation: Consistency between SAR-derived inundation extent and WSE variations is evaluated by examining the correspondence between flood extent changes and the SWOT-adjusted gauge water-level series. Near-coincident SWOT overpasses are additionally used as independent observational support where available. This step provides qualitative and quantitative evaluation of whether the AS-FCM-derived inundation maps are consistent with observed water-level dynamics.
Residual uncertainty associated with temporal mismatch, cloud-screened optical validation, sparse SWOT sampling, and rapidly varying flood conditions is further considered in the subsequent uncertainty analysis.

3. Materials and Methods

3.1. Methodological Framework

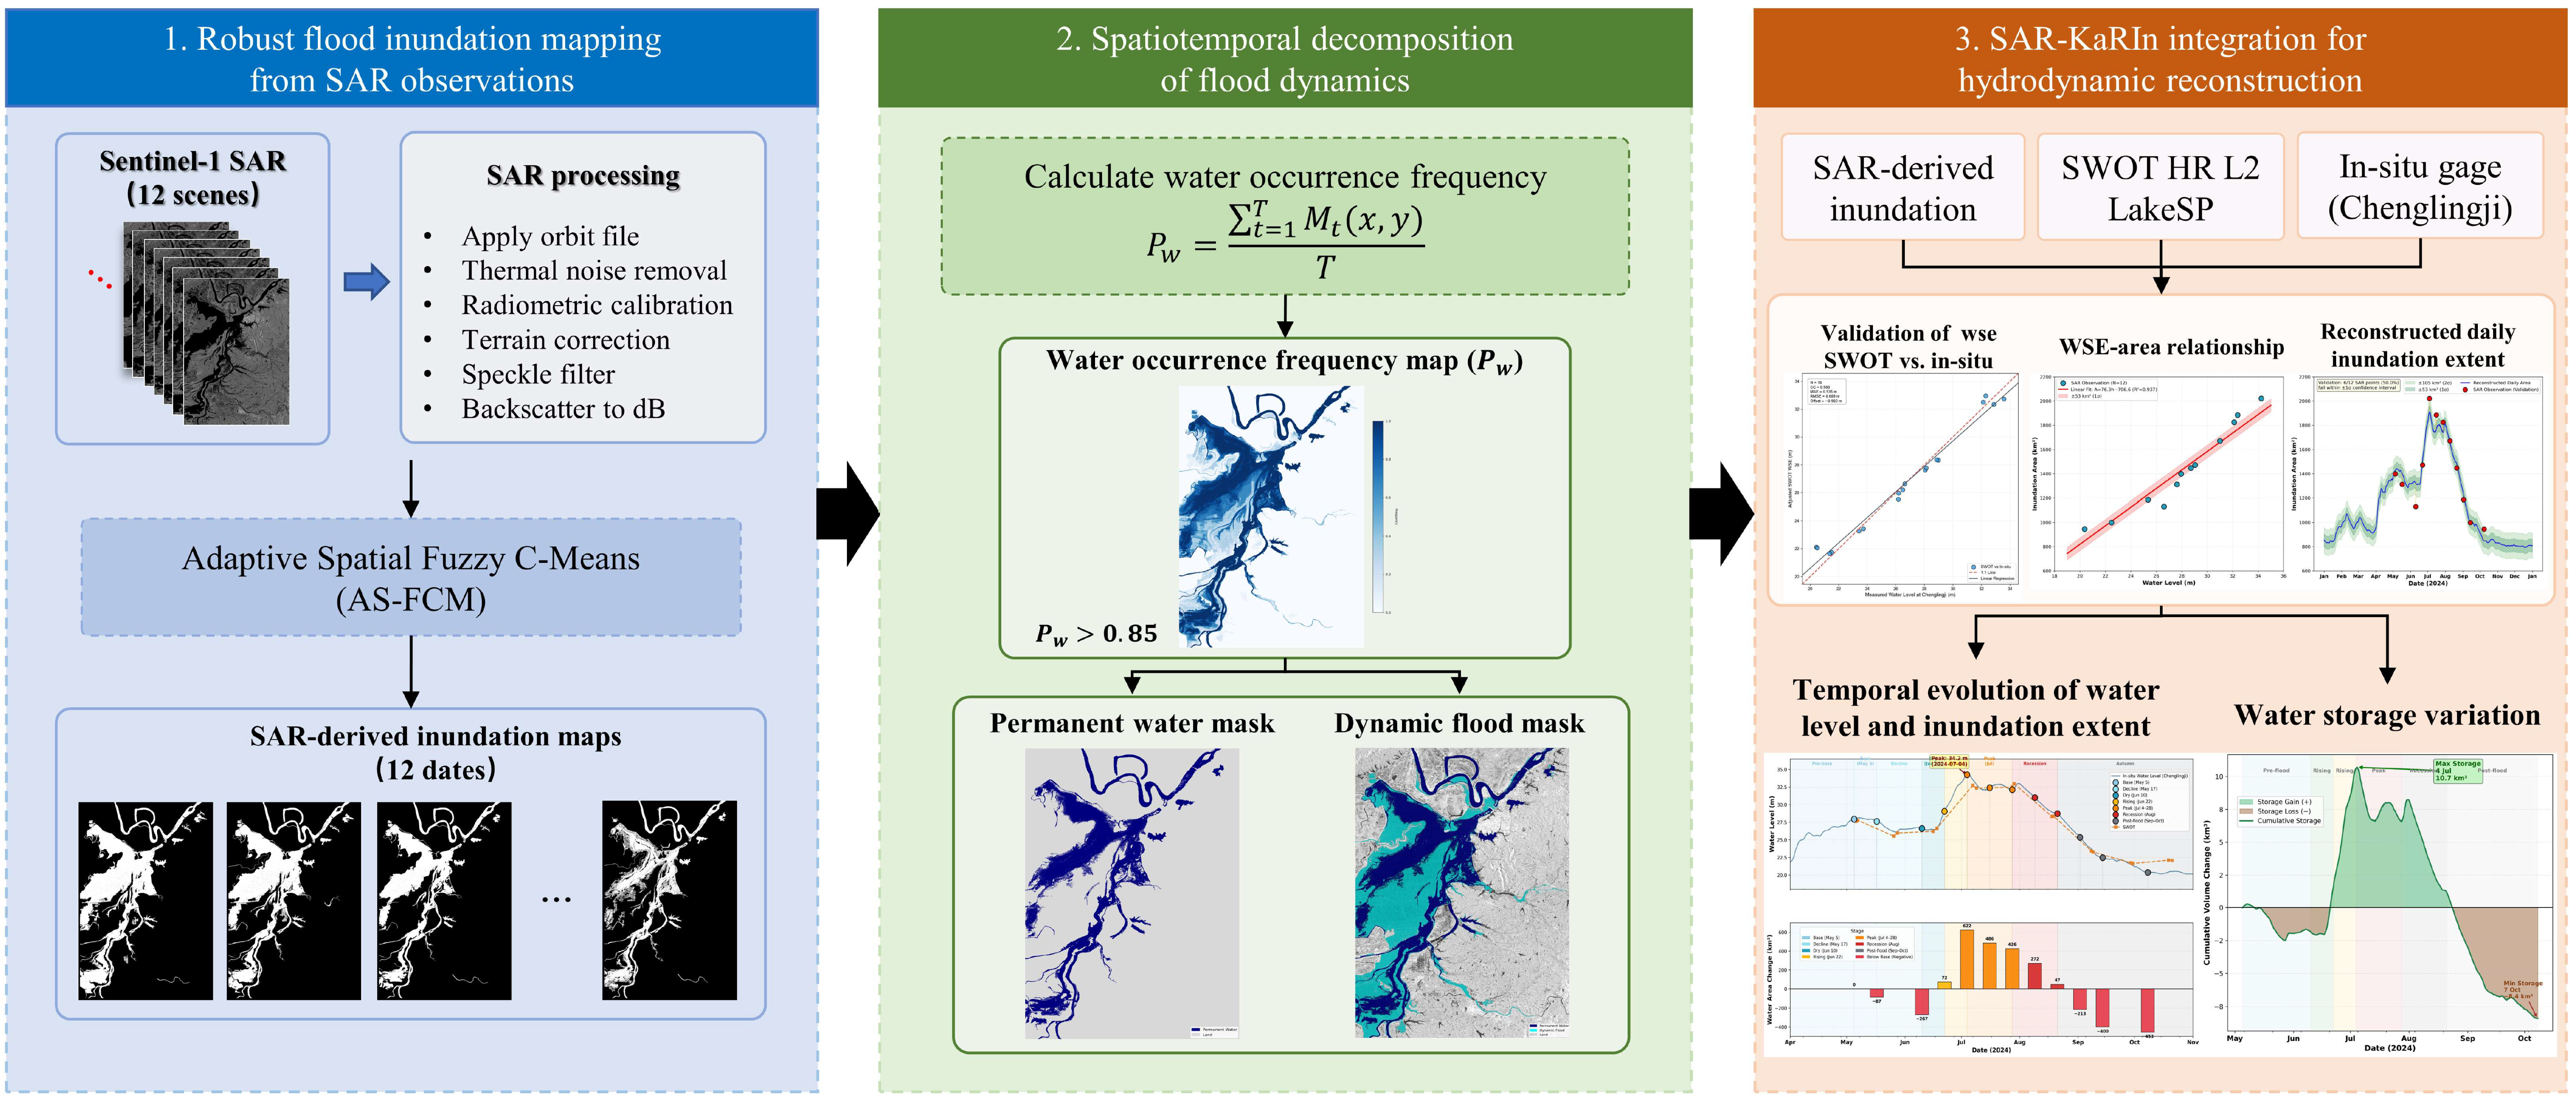
This study proposes a multi-source integration framework to characterize flood dynamics by jointly exploiting the complementary strengths of Sentinel-1 SAR imagery and SWOT wide-swath interferometric altimetry observations. The workflow is shown in Figure 2 and integrates high-resolution inundation mapping with WSE measurements, enabling a consistent characterization of flood evolution across inundation extent and WSE dynamics.
The framework consists of three main components:
(1)
SAR-based inundation mapping with adaptive spatial constraints. Sentinel-1 SAR imagery is processed using the proposed AS-FCM algorithm to derive high-resolution inundation maps. The method incorporates adaptive parameterization and spatial neighborhood information to suppress speckle noise and reduce backscatter ambiguity in heterogeneous floodplain environments, producing spatially consistent binary water masks.
(2)
Temporal analysis of flood occurrence. A water occurrence frequency ( P w ) is derived from multi-temporal SAR-based inundation maps to distinguish persistent water bodies from event-driven flooding signals. This step enables the characterization of flood expansion and recession patterns during the study period.
(3)
SAR and wide-swath interferometric altimetry integration for WSE analysis. SAR-derived inundation extents are integrated with KaRIn-derived WSE observations and in situ gauge measurements through a temporally synchronized framework. This integration enables the analysis of the correspondence between inundation extent and water surface elevation.
Overall, the proposed framework establishes a consistent linkage between inundation extent and WSE dynamics, enabling flood evolution to be characterized in terms of areal expansion, WSE variability, and storage change.

3.2. Adaptive Spatially-Constrained Fuzzy C-Means (AS-FCM) for SAR Flood Mapping

3.2.1. Method Formulation

Standard FCM clustering treats each pixel independently in the feature space, making it highly sensitive to speckle noise and prone to spatially fragmented classification results in SAR imagery. This limitation becomes particularly severe in floodplain environments, where radar backscatter is strongly influenced by surface roughness, vegetation structure, and heterogeneous scattering conditions.
To address these issues, the proposed AS-FCM algorithm introduces a locally adaptive spatial regularization mechanism into the conventional FCM framework. The method incorporates spatial contextual constraints to balance speckle suppression in homogeneous regions and boundary preservation in heterogeneous floodplain areas.
In this study, the SAR feature vector x i is constructed using the calibrated VV and VH backscatter coefficients of Sentinel-1, i.e., x i = [ σ V V , i 0 , σ V H , i 0 ] T . Both polarization channels are used to exploit their complementary responses to open water, inundated vegetation, and heterogeneous floodplain surfaces.
The modified objective function is formulated as
J = i = 1 N k = 1 C u i k m x i v k 2 + α i j Ω i w i j x j v k 2
The adaptive spatial regularization parameter is formulated as an exponentially decaying function of local variance:
α i = α 0 exp ( β σ i 2 )
where σ i 2 represents the local variance within neighborhood Ω i , and β controls the decay rate of spatial regularization with increasing local heterogeneity. This formulation reduces excessive spatial smoothing near heterogeneous flood boundaries while enhancing speckle suppression in homogeneous open-water regions.
The neighborhood weighting coefficient is defined as
w i j = exp x i x j 2 γ 2
where γ controls the sensitivity of spectral similarity. The weighting coefficients are normalized within each local neighborhood such that
j Ω i w i j = 1
The weighting strategy suppresses the influence of spectrally dissimilar neighbors and preserves sharp transitions between water and non-water surfaces under complex SAR scattering conditions.
In (1), u i k denotes the membership degree of pixel i belonging to cluster k, v k represents the centroid of cluster k, and m is the fuzziness coefficient. The vector x i represents the dual-polarization SAR feature vector at pixel i, while Ω i denotes the local neighborhood centered at pixel i with size | Ω i | . The parameter α i controls the strength of spatial regularization, and w i j represents the structure-aware spectral similarity between neighboring pixels.
Compared with existing spatially constrained FCM variants, the proposed AS-FCM differs in three important aspects. First, the spatial regularization parameter is adaptively adjusted according to local variance rather than remaining globally fixed. This design enables effective speckle suppression in homogeneous open-water regions while avoiding excessive smoothing near heterogeneous flood boundaries. Second, the proposed weighting strategy explicitly incorporates structure-aware spectral contrast through a Gaussian similarity kernel, thereby improving discrimination between open water, flooded vegetation, and non-water surfaces. Third, the adaptive spatial constraint is directly integrated into the centroid update process, enabling cluster centers to better represent locally consistent spatial structures rather than globally averaged spectral characteristics.
In this study, the number of clusters is fixed at C = 3 , corresponding to open water, inundated mixed features, and non-water land-cover types.

3.2.2. Optimization and Parameter Updating

The optimization procedure follows the standard iterative framework of FCM and is derived using the Lagrange multiplier method. Based on the objective function in (1), the membership degree is iteratively updated as
u i k = x i v k 2 + α i j Ω i w i j x j v k 2 1 / ( m 1 ) l = 1 C x i v l 2 + α i j Ω i w i j x j v l 2 1 / ( m 1 )
The cluster centroids are updated using the following spatially weighted formulation:
v k = i = 1 N u i k m x i + α i j Ω i w i j x j i = 1 N u i k m ( 1 + α i )
The iterative optimization terminates when the variation of cluster centroids between two successive iterations falls below a predefined convergence threshold.
The proposed optimization incorporates locally adaptive spatial constraints into the conventional FCM framework, improving spatial consistency and robustness in heterogeneous floodplain environments.
Before clustering, the calibrated VV and VH backscatter coefficients are standardized to reduce scale differences between the two polarization channels. The key parameters of AS-FCM are fixed across all Sentinel-1 scenes to ensure methodological consistency. In this study, the parameters are set as α 0 = 0.8 , β = 1.0 , γ = 1.0 , the fuzziness coefficient is set to m = 2 , and the local neighborhood size is set to 5 × 5 . These values are selected based on preliminary tests considering classification accuracy, speckle suppression, and flood-boundary preservation.

3.2.3. Mixed-Pixel Handling and Water Mask Generation

The water class is identified as the cluster with the lowest mean backscatter centroid, and the corresponding membership map U w ( x , y ) is interpreted as a soft water-likelihood representation.
A preliminary binary inundation mask is generated using a water-membership threshold:
M t ( x , y ) = 1 , U w ( x , y ) τ w 0 , U w ( x , y ) < τ w
where τ w denotes the water-membership threshold used to convert the fuzzy water-membership map into a binary inundation mask. In this study, τ w is set to 0.5, corresponding to the fuzzy decision boundary at which the water-class membership becomes dominant. This threshold provides a balanced criterion for separating water and non-water pixels in the membership space.
To further address mixed-pixel effects in inundated vegetation and transitional boundary zones, an additional neighborhood consistency refinement is applied to pixels with intermediate membership values ( 0.4 < U w ( x , y ) < 0.6 ) . This interval is centered around the decision boundary of τ w = 0.5 and represents low-confidence transitional pixels near water–land boundaries. Therefore, the final inundation mask is not determined solely by a single hard threshold but is further constrained by local spatial consistency.
The local spatial consistency is evaluated as
C ( x , y ) = 1 | Ω x y | j Ω x y M t ( j )
where Ω x y represents the local neighborhood centered at pixel ( x , y ) , and M t ( j ) { 0 , 1 } denotes the binary water classification defined in (7).
Pixels within the intermediate membership range are reclassified as water when the local consistency satisfies C ( x , y ) 0.5 .
This majority-consistency refinement improves spatial coherence and suppresses isolated classification noise while preserving inundation boundaries in partially submerged vegetation and mixed land-cover regions.

3.3. Spatiotemporal Decomposition of Flood Dynamics

3.3.1. Water Occurrence Frequency ( P w )

To distinguish transient flood signals from persistent water bodies, the water occurrence frequency ( P w ) is computed from the multi-temporal SAR-derived inundation masks:
P w ( x , y ) = 1 T t = 1 T M t ( x , y )
where M t ( x , y ) { 0 , 1 } denotes the binary inundation mask at acquisition time t, and T = 12 is the total number of SAR observations. The water occurrence frequency is calculated exclusively from the 12 SAR-derived inundation masks to characterize the temporal persistence of surface inundation.
Higher P w values indicate temporally persistent water surfaces, whereas values close to zero correspond to largely non-inundated land areas. Intermediate values represent intermittently inundated floodplain regions.

3.3.2. Decomposition into Permanent Water and Dynamic Flood

Following the definition of surface water persistence [44], permanent water bodies are identified using a high occurrence threshold τ p , where τ p denotes the permanence threshold:
M perm ( x , y ) = 1 , P w ( x , y ) > τ p 0 , otherwise
In this study, a permanence threshold of τ p = 0.85 is adopted. Given that 12 Sentinel-1 SAR observations are used, this threshold indicates that a pixel must be classified as water in more than 85% of the observations, corresponding to at least 11 out of 12 SAR scenes. Therefore, τ p = 0.85 provides a conservative criterion for separating permanent or highly persistent water bodies from temporarily inundated floodplain areas. This formulation helps reduce the possibility of misclassifying short-duration flood inundation as permanent water under heterogeneous SAR backscatter conditions.
The dynamic flood extent at time t is then derived as
M flood , t ( x , y ) = M t ( x , y ) 1 M perm ( x , y )
This decomposition isolates transient inundation signals associated with floodplain activation while excluding temporally stable water bodies. The framework provides a physically consistent basis for distinguishing baseline hydrological structures from event-driven flood dynamics, thereby supporting the subsequent WSE–area reconstruction and flood storage estimation.

3.4. Synergistic Integration of SWOT Altimetry and SAR-Derived Area

3.4.1. Bias Adjustment of SWOT WSE

To reduce the systematic vertical offset between SWOT-derived WSE and in situ observations at the Chenglingji station, the mean bias is first estimated from all overlapping observations [33]:
δ = 1 n i = 1 n H SWOT , i H gauge , i
where H SWOT , i and H gauge , i denote the SWOT-derived WSE and the corresponding in situ WSE at the i-th overlapping observation, respectively, and n is the number of matched observations.
The estimated bias mainly reflects the combined effects of vertical datum differences and local hydrodynamic deviations. The SWOT-derived WSE is then adjusted as
H t adj = H SWOT , t δ
where H t adj denotes the bias-adjusted SWOT WSE at time t. Under this definition, a negative bias indicates that the raw SWOT WSE is lower than the gauge-referenced WSE.
The effectiveness of the bias adjustment is quantitatively evaluated against synchronous in situ observations, and the corresponding statistical results are presented in Section 4.4.

3.4.2. WSE–Area Relationship and Volume Estimation

A linear WSE–area relationship is established by pairing SAR-derived inundation areas A t with temporally matched water-level observations from the bias-adjusted SWOT–gauge water-level series [45]:
A ( H t adj ) = a H t adj + b
where a and b are empirical coefficients estimated using the least-squares method, and H t adj denotes the temporally matched water level after SWOT-based bias adjustment and gauge-based temporal support.
Given the limited sample size and observed WSE range, a linear model is adopted as a parsimonious first-order approximation to avoid overfitting. The fitted relationship is interpreted as an empirical description of the observed flood-season response, while potential nonlinear or hysteretic behavior cannot be fully resolved under the current data constraints.
Based on the fitted relationship, cumulative flood storage variation is estimated using a trapezoidal numerical integration approach:
Δ V t = i = 1 t A ( H i adj ) + A ( H i 1 adj ) 2 H i adj H i 1 adj
where Δ V t denotes the cumulative storage variation relative to the initial reference level, and A ( H i adj ) denotes the inundation area predicted by the WSE–area model at the adjusted WSE H i adj . In the numerical calculation, area units are converted consistently before integration to obtain storage variation in volumetric units.
This formulation provides a consistent estimation of storage dynamics under the linear WSE–area assumption.

3.5. Accuracy Assessment and Uncertainty Analysis

3.5.1. SAR Water Extraction Validation

The performance of the proposed AS-FCM algorithm is evaluated using Sentinel-2 and Landsat 8/9 optical imagery as auxiliary data for reference water mask generation. Considering frequent cloud contamination during flood periods in the Dongting Lake region, the optical-derived masks are used as cloud-screened validation references rather than absolute ground-truth observations. For each Sentinel-1 acquisition, the nearest available optical image is examined, and only cloud-free or low-cloud portions of the image are retained for reference annotation. Pixels affected by clouds, cloud shadows, severe haze, or visually ambiguous atmospheric conditions are masked out and excluded from the accuracy assessment.
Reference water masks are generated through a combined interpretation of spectral water information, false-color composites, SAR backscatter characteristics, and manual delineation. Manual refinement is mainly applied to uncertain shoreline areas, mixed land–water pixels, and vegetated floodplain zones where automatic optical water extraction may be unreliable. To reduce subjectivity, the same interpretation criteria are applied to all validation scenes, and ambiguous pixels are excluded rather than forced into either water or non-water classes. Consequently, the accuracy metrics are calculated only over valid reference pixels with reliable water/non-water interpretation.
The classification performance is evaluated using Overall Accuracy (OA), Recall, F1-score, Intersection over Union (IoU), and Kappa coefficient (KC).
OA is defined as
O A = T P + T N T P + T N + F P + F N
Recall is defined as
R e c a l l = T P T P + F N
F1-score is defined as
F 1 = 2 T P 2 T P + F P + F N
IoU is defined as
I o U = T P T P + F P + F N
KC is defined as
K C = P o P e 1 P e
where
P o = T P + T N N , P e = ( T P + F P ) ( T P + F N ) + ( F N + T N ) ( F P + T N ) N 2
where T P , T N , F P , and F N denote true positives, true negatives, false positives, and false negatives, respectively, and N is the total number of pixels.

3.5.2. Uncertainty Assessment

The uncertainty in flood storage estimation primarily arises from SAR-based inundation area extraction, WSE retrieval and bias adjustment, and numerical approximation introduced during the WSE–area integration process.
It should be noted that the physical relationship between inundation area (A) and WSE (H) does not necessarily imply statistical dependence between their observational errors. In this study, the area-related uncertainty mainly originates from Sentinel-1 SAR-based inundation classification, which is affected by factors such as speckle noise, mixed pixels, vegetation effects, and water–land boundary ambiguity. In contrast, the WSE-related uncertainty mainly originates from SWOT Ka-band interferometric altimetry retrieval, gauge-based bias adjustment, and vertical reference harmonization. These uncertainty sources arise from different sensors, retrieval mechanisms, and processing procedures. Therefore, their random observational error components are treated as uncorrelated in the first-order error propagation framework adopted here.
Based on this assumption, the total storage uncertainty is estimated using a root-sum-square (RSS) formulation [46]:
σ Δ V σ V , A 2 + σ V , H 2 + σ V , I 2
where σ V , A , σ V , H , and σ V , I denote the volumetric uncertainty contributions associated with SAR-derived inundation area extraction, WSE retrieval and bias adjustment, and numerical integration, respectively. The RSS formulation is used here to propagate the dominant random observational uncertainty components, while the empirical WSE–area relationship itself is treated as part of the storage reconstruction model.
The numerical integration uncertainty mainly reflects discretization effects introduced by the trapezoidal approximation under temporally varying flood conditions. Given the limited temporal sampling of satellite observations and the empirical nature of the WSE–area model, the present analysis focuses on first-order uncertainty estimation rather than a fully rigorous stochastic treatment of all possible model-structure and covariance terms.
This uncertainty framework provides a practical assessment of the dominant error sources affecting flood storage estimation under complex floodplain conditions.

4. Results

4.1. SAR-Based Inundation Mapping Performance

The performance of the proposed AS-FCM algorithm is evaluated against several representative benchmark methods, including Otsu thresholding [9], standard FCM [18], Spatial FCM (SFCM) [47], and FLICM [19]. These methods represent classical threshold-based and spatial fuzzy clustering approaches widely used in SAR image segmentation and flood mapping applications. Deep learning methods are not considered in this study due to the limited availability of temporally consistent labeled flood samples.
For the fuzzy clustering-based methods, including standard FCM, SFCM, FLICM, and the proposed AS-FCM, the dual-polarization feature vector composed of calibrated VV and VH backscatter coefficients is used as input. For Otsu thresholding, a single threshold is derived from the calibrated VV backscatter image, because Otsu thresholding is a single-variable segmentation method and VV polarization provides a stable low-backscatter response over open water surfaces.
The quantitative results calculated over the cloud-screened valid reference pixels are summarized in Table 4.
The proposed AS-FCM achieves the highest performance among the evaluated methods across all quantitative metrics. Compared with standard FCM and SFCM, the adaptive spatial regularization effectively suppresses SAR speckle while preserving inundation boundaries in heterogeneous floodplain environments.
Specifically, AS-FCM achieves an OA of 0.936 and a KC of 0.871. Compared with standard FCM, this represents improvements of 0.078 in OA and 0.108 in KC. Compared with FLICM, the proposed approach further improves the F1-score from 0.917 to 0.940 and the IoU from 0.846 to 0.887, indicating enhanced discrimination capability in spectrally heterogeneous floodplain regions.
The Recall value of 0.931 suggests improved capability in identifying inundated and transitional floodplain regions, which are commonly challenging for SAR-based flood extraction under complex scattering conditions. In contrast, Otsu thresholding exhibits substantially lower Recall and IoU values, indicating limited robustness in heterogeneous floodplain environments.
Overall, the improved performance is mainly attributed to the incorporation of adaptive spatial constraints and structure-aware weighting, which jointly enhance spatial consistency and boundary preservation in SAR-derived inundation mapping. This improvement supports the subsequent integration of SAR-derived inundation extent with SWOT WSE observations.
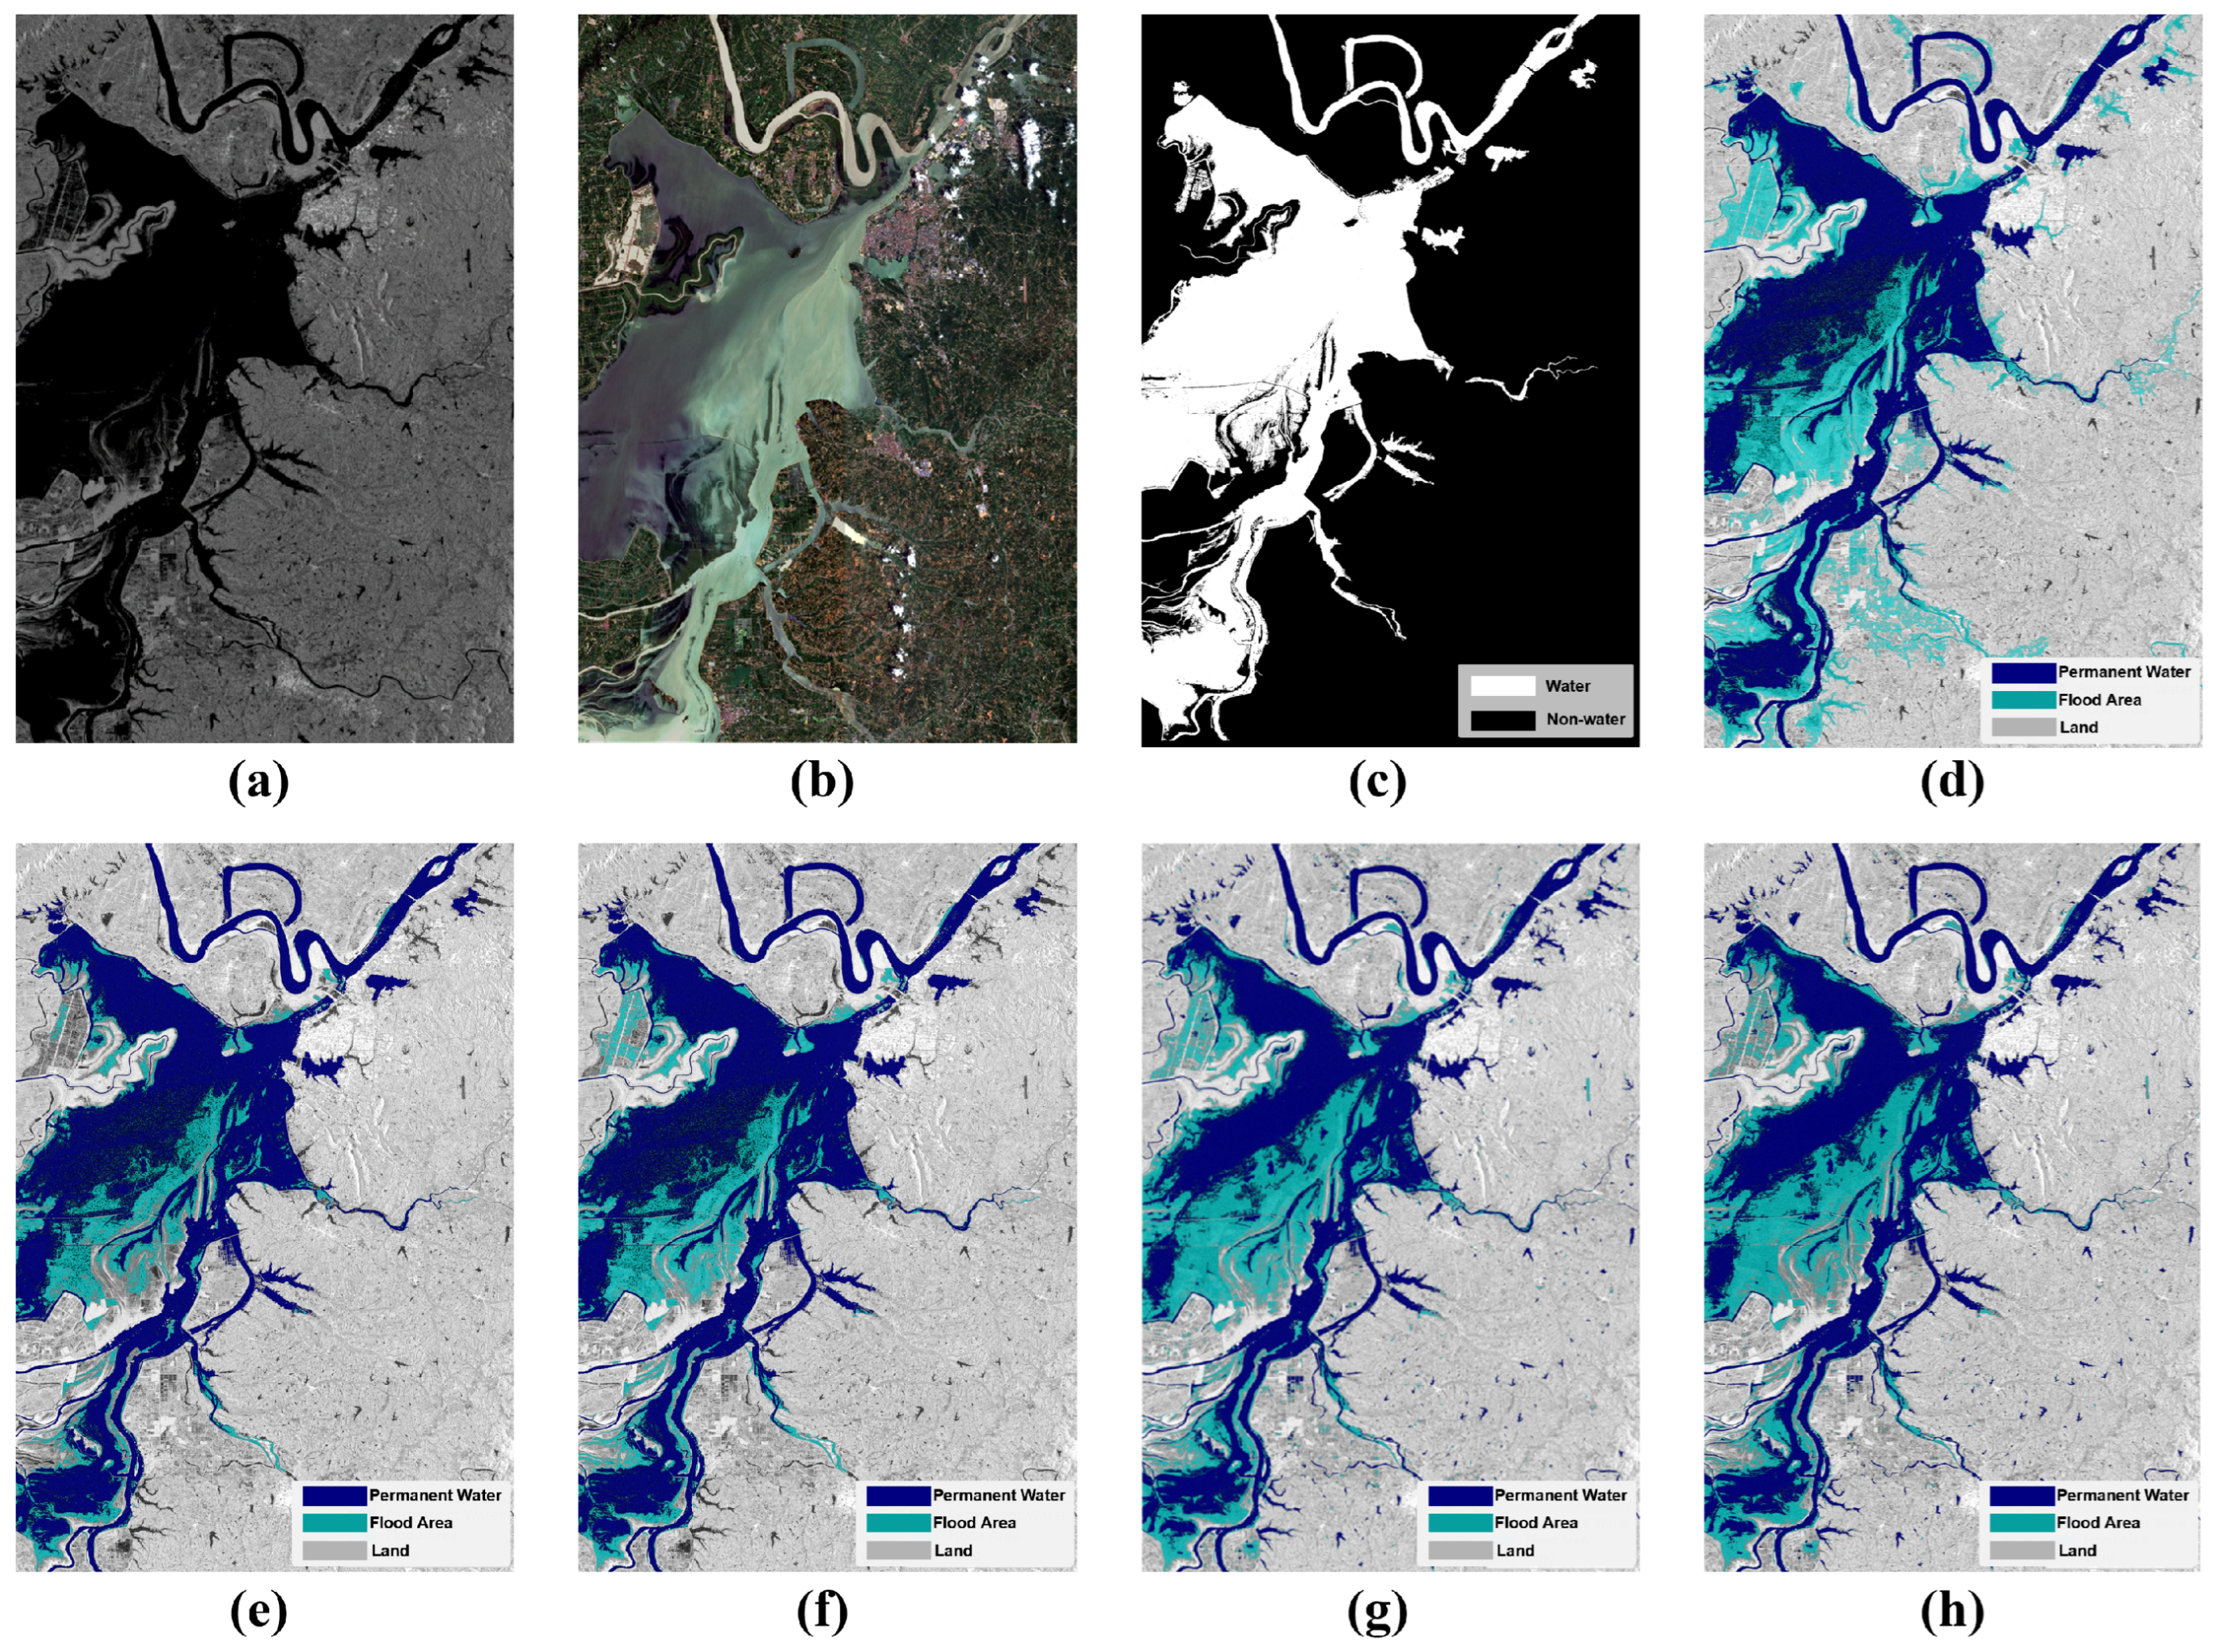
To further provide a visual assessment of the classification performance, a representative Sentinel-1/Sentinel-2 matched case on 9 August 2024 is selected, for which a cloud-screened Sentinel-2 image is available on the same date as the Sentinel-1 acquisition. Figure 3 shows the SAR backscatter image, Sentinel-2 optical reference image, reference annotation mask, and classification results generated by different methods. Compared with Otsu thresholding and standard FCM, the spatially constrained methods produce more coherent inundation patterns. Among them, the proposed AS-FCM shows improved suppression of isolated noisy pixels while preserving the main flood boundaries and narrow hydrological connections. This visual comparison is consistent with the quantitative accuracy assessment in Table 4.
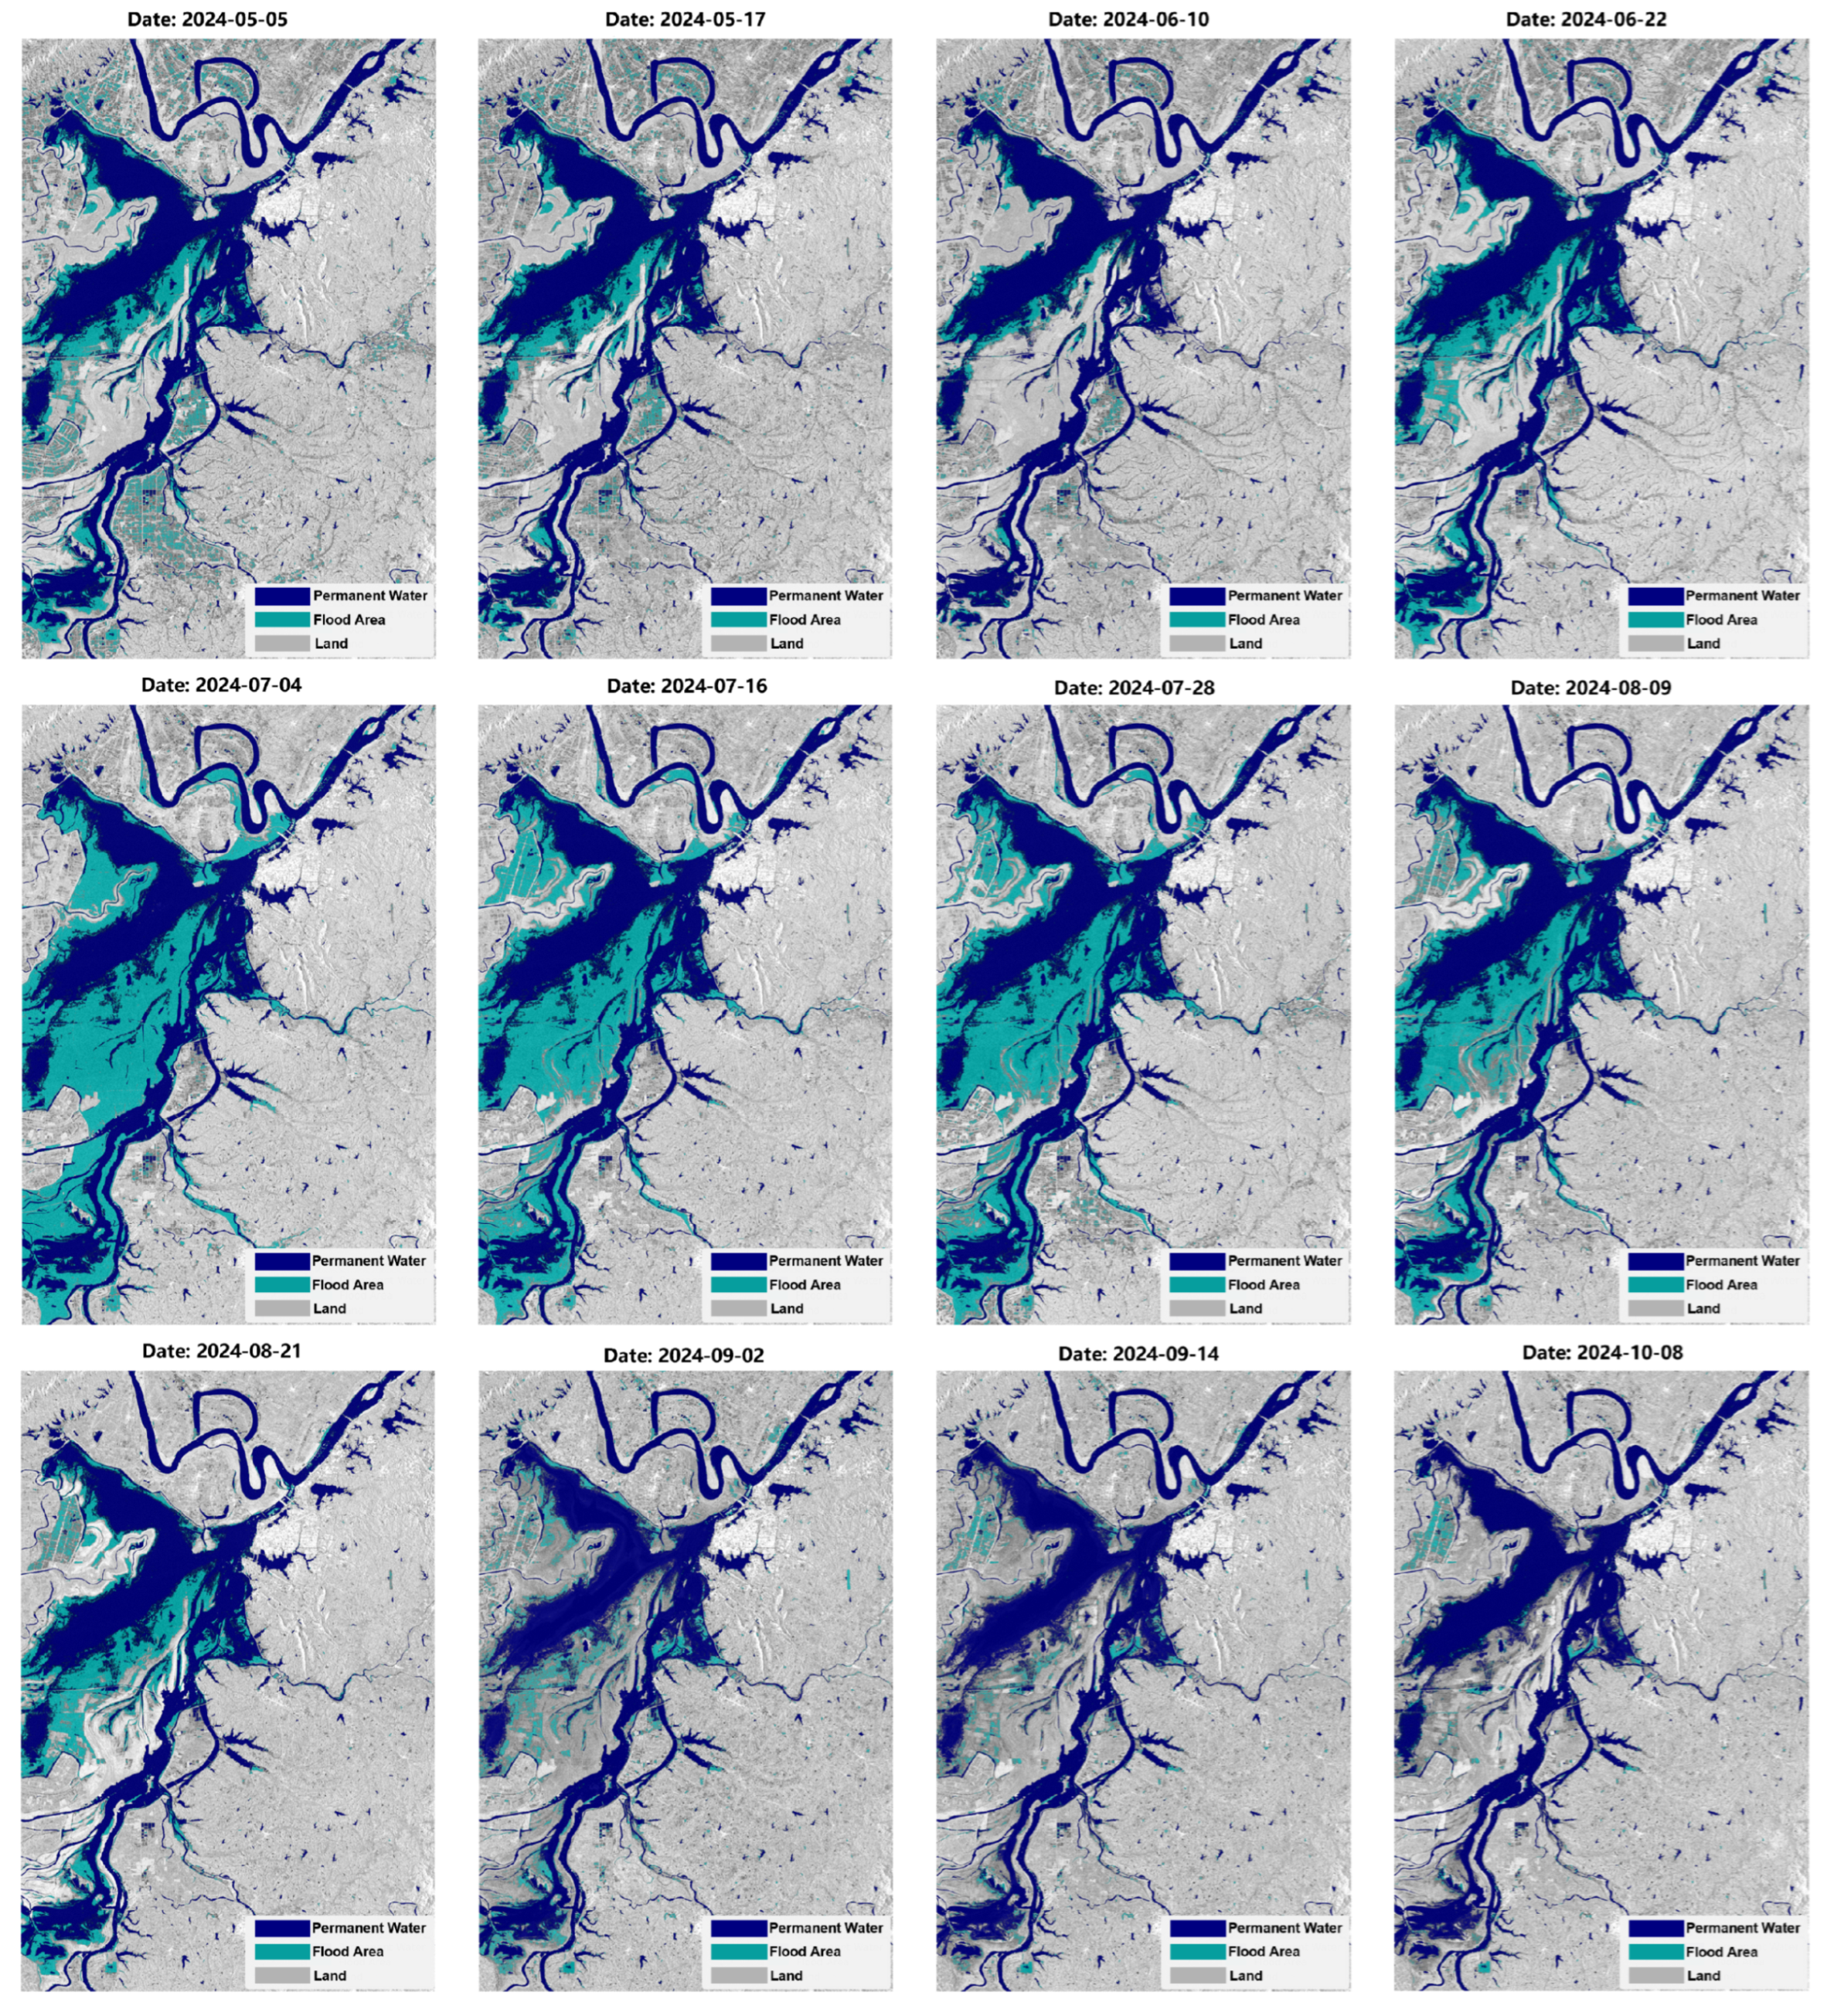
The spatiotemporal evolution of the 2024 flood event derived from AS-FCM is illustrated in Figure 4. The 12-scene time series captures the progressive flood expansion from May to July, followed by gradual recession during the later stage of the flood season. The decomposition results clearly distinguish temporally persistent water bodies from dynamically activated floodplain inundation areas.
Strong spatial continuity is observed across all acquisition dates, particularly along major floodplain corridors and tributary-connected lowlands, indicating stable temporal consistency in the SAR-derived inundation mapping results. The extensive lateral expansion during the flood peak further reflects the high hydrological connectivity between the main lake body and adjacent floodplain zones.

4.2. Parameter Sensitivity and Ablation Analysis

To further evaluate the robustness and generalizability of the proposed AS-FCM algorithm, a parameter sensitivity and ablation analysis is conducted. For each test, only one component or parameter is changed while the others are kept unchanged. The analysis focused on the adaptive spatial regularization term; the structure-aware neighborhood weighting; the key coefficients α 0 , β , and γ ; the fuzziness coefficient m; and the local neighborhood window size.
As shown in Table 5, the baseline AS-FCM configuration achieves the best overall performance. Removing the spatial regularization term or the structure-aware neighborhood weighting leads to evident accuracy reduction, indicating that both components are critical for speckle suppression and spatial coherence. The sensitivity analysis of α 0 , β , and γ shows that the adopted values of α 0 = 0.8 , β = 1.0 , and γ = 1.0 provide the best overall performance, while moderate deviations from these values cause measurable drops in classification accuracy. The results are also stable when m varies around 2.0, with m = 2.0 providing the best overall balance among OA, Recall, F1-score, IoU, and KC. For the neighborhood size, the 5 × 5 window achieves the best performance in this study, whereas the 3 × 3 window provides weaker speckle suppression and the 7 × 7 window tends to over-smooth narrow inundation boundaries and small floodplain features. These results indicate that the proposed AS-FCM is reasonably robust within a moderate parameter range, while the adopted configuration provides the best balance between speckle suppression, flood-boundary preservation, and classification accuracy.

4.3. Spatiotemporal Evolution of Flood Extent

The multi-temporal SAR-derived inundation maps enable a detailed characterization of flood dynamics in the Dongting Lake system during the 2024 event. By integrating the time series of binary water masks ( M t ), both temporal evolution and spatial propagation patterns of inundation are quantified.

4.3.1. Temporal Evolution of Inundation Extent

The total inundation area exhibits a clear three-stage evolution pattern:
  • Pre-flood stage (mid-June): Inundation is primarily restricted to permanent water bodies, with limited activation of surrounding floodplains, indicating relatively weak hydrological connectivity.
  • Rising and peak flood stage (July): A rapid expansion of inundation extent is observed, driven by enhanced upstream inflow and lateral floodplain overflow. The floodplain becomes extensively activated, and the inundation extent reaches its seasonal maximum, reflecting intensified hydraulic exchange between the main lake body and adjacent lowlands.
  • Recession stage (late August to September): A gradual contraction of inundated areas occurs as discharge decreases, with floodwaters progressively retreating from temporary floodplain storage zones toward the main channel network.
This temporal evolution is consistent with in situ water-level variations and reflects the flood pulse behavior typical of large river-connected lake systems.

4.3.2. Spatial Propagation Patterns

To further characterize spatial heterogeneity, the water occurrence frequency ( P w ) is derived from the full time series. The spatial distribution of P w reveals a strong contrast between stable and dynamic hydrological zones.
According to the surface water persistence criterion defined in Section 3.3.2, pixels with P w > τ p are identified as persistent water, while the remaining water pixels are interpreted as seasonally or temporarily inundated areas. This classification separates stable hydrological features from transient inundation under heterogeneous SAR backscatter conditions.
Based on this classification, the instantaneous flood extent ( M flood , t ) is extracted by removing the permanent water component. This decomposition highlights newly inundated floodplain areas and provides a basis for analyzing event-driven flood propagation.
Spatially, flood expansion predominantly follows lake margin zones and downstream floodplain corridors, indicating strong lateral connectivity and overflow-controlled propagation. During the peak stage, these regions merge into large contiguous inundation patches, reflecting maximum hydraulic connectivity within the system.

4.4. SWOT Altimetry Validation and Bias Adjustment

The adjusted SWOT-derived WSE observations are evaluated against synchronous in situ water-level measurements from the Chenglingji hydrological station. A total of 18 SWOT–gauge observation pairs are available during the study period for validation and bias adjustment analysis.

4.4.1. Statistical Performance and Bias Identification

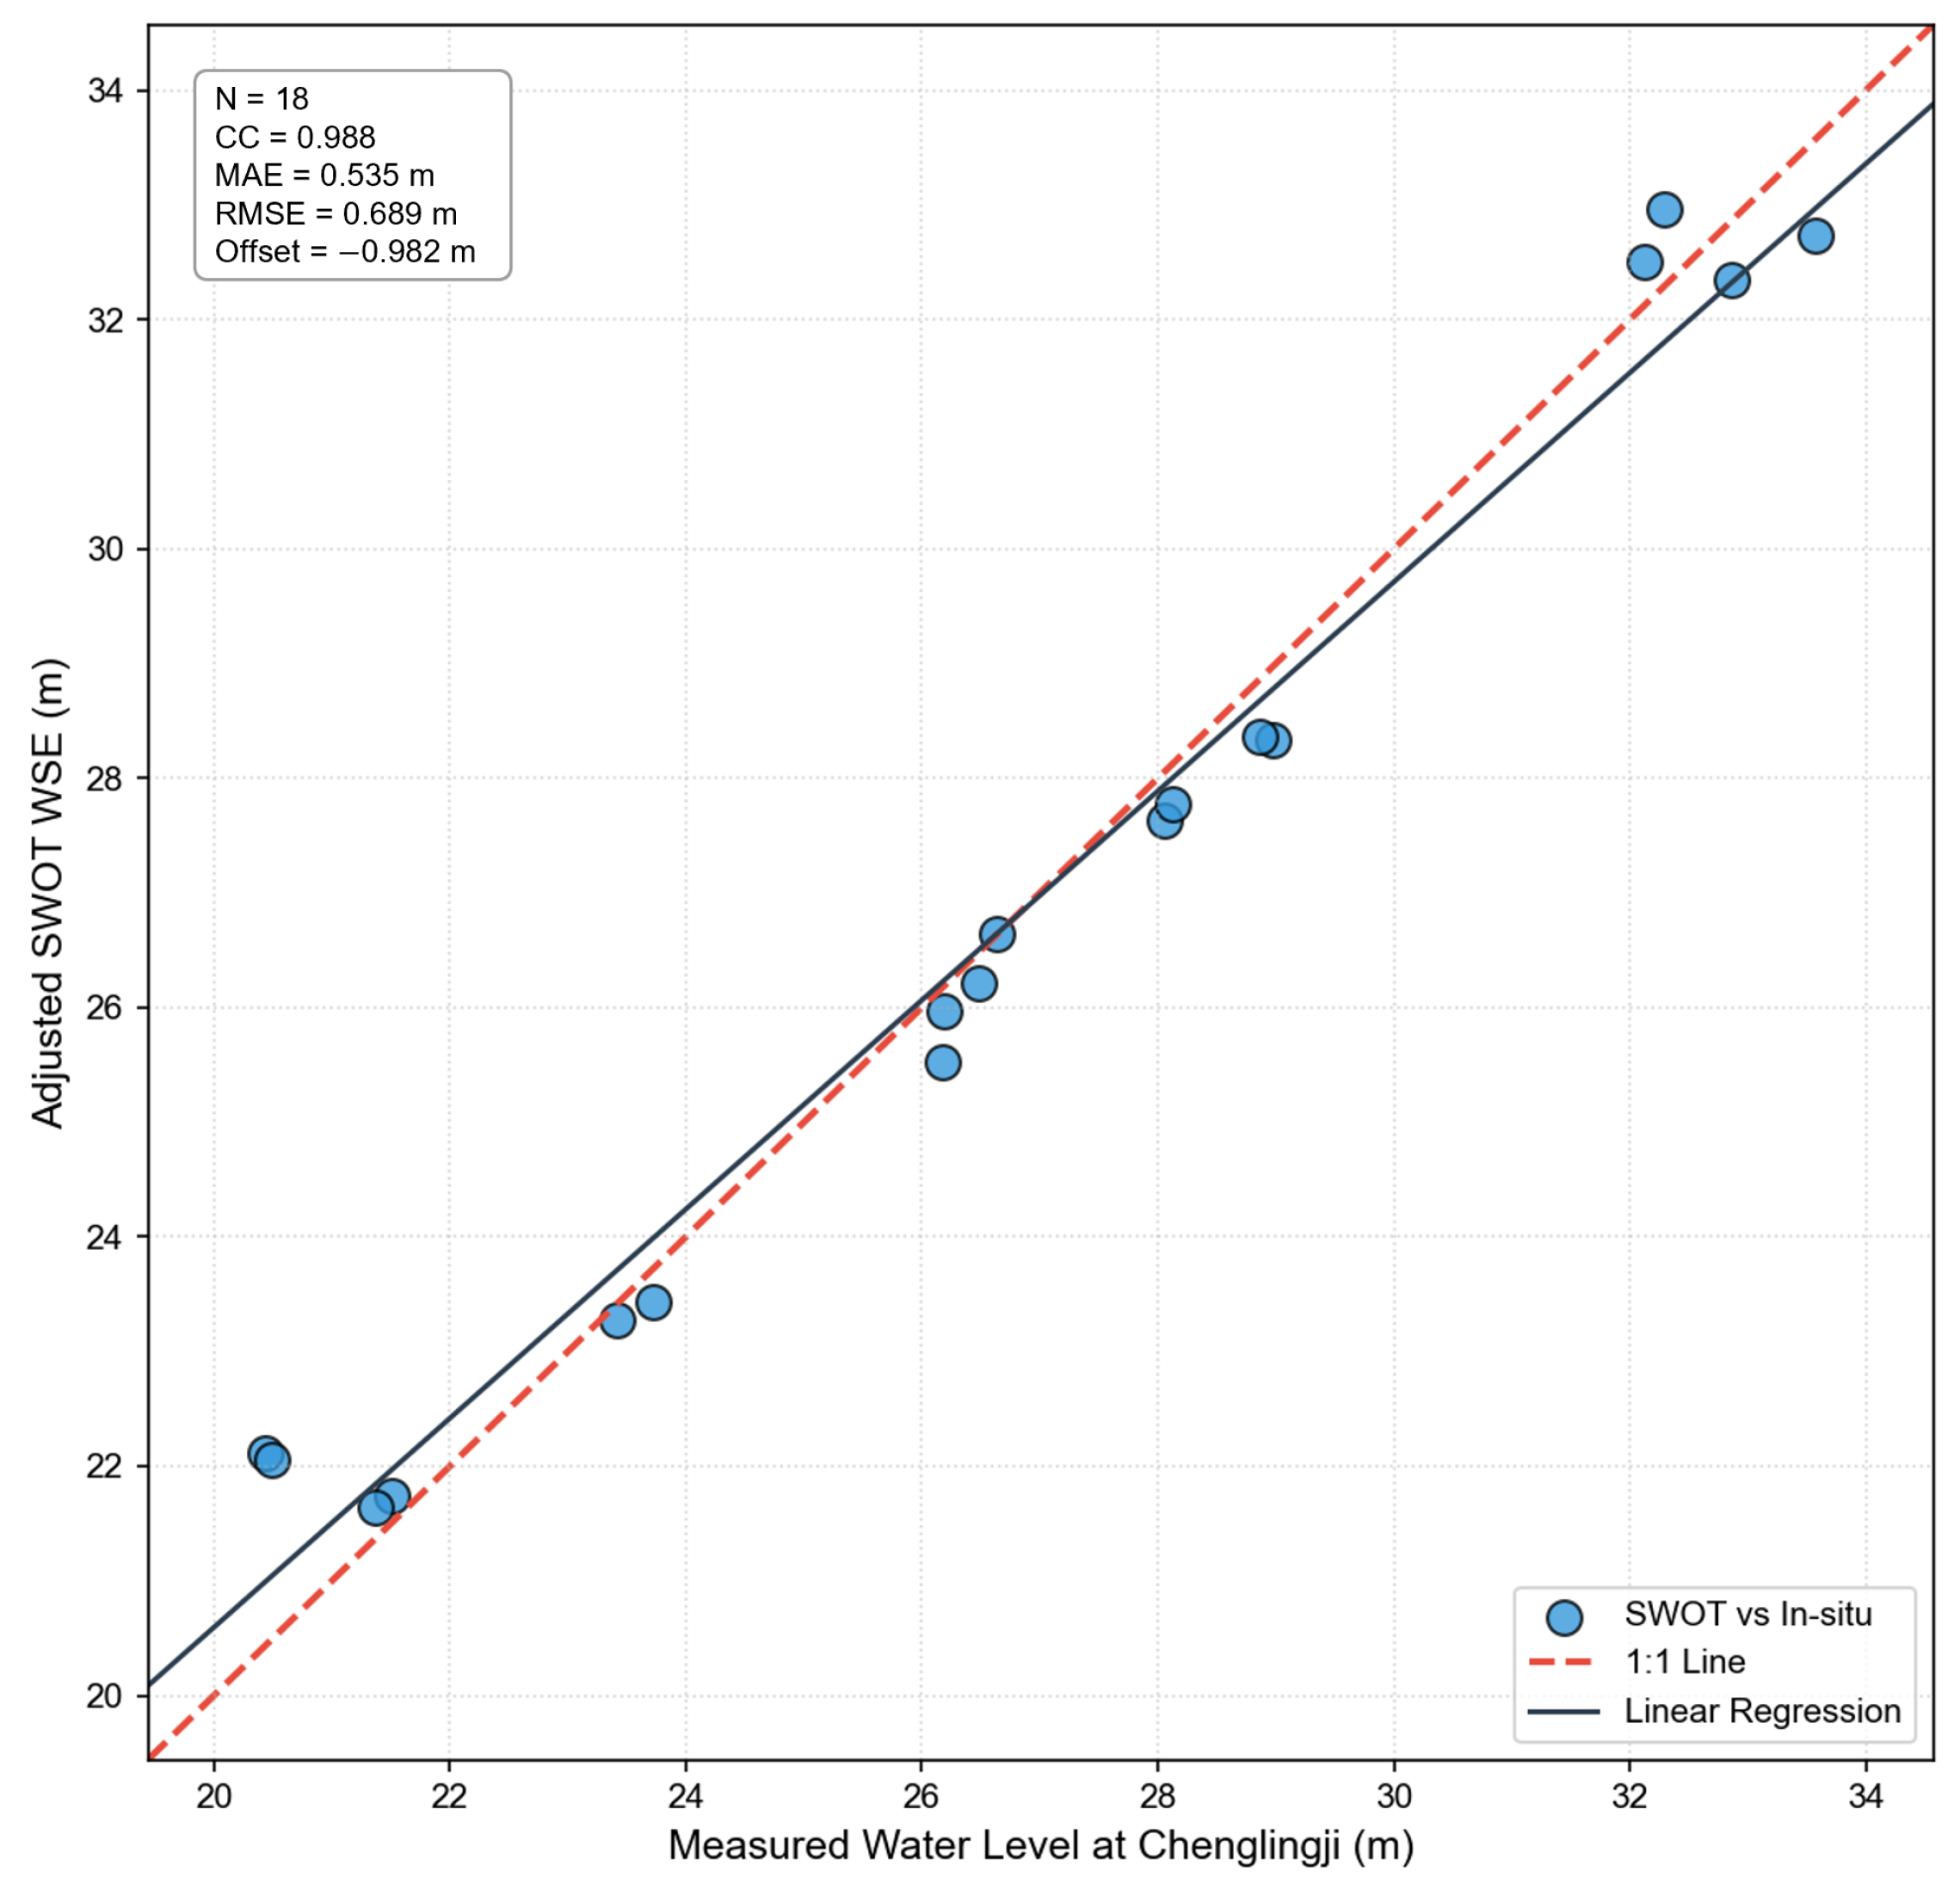
As shown in Figure 5, the SWOT-derived WSE exhibits a strong linear agreement with in situ observations, with a correlation coefficient ( C C ) of 0.988. A systematic vertical offset of approximately 0.982 m is identified between the raw SWOT L2 products and the local gauge reference. This discrepancy is likely associated with differences between the EGM2008 geoid model used in SWOT processing and the local vertical reference system, while additional deviations may arise from complex hydraulic conditions near the Dongting Lake–Yangtze River confluence.

4.4.2. Post-Adjustment Accuracy

To harmonize multi-source elevation observations, a linear bias adjustment is applied following Equation (13). Because the estimated bias is negative ( δ = 0.982 m), this correction effectively shifts the raw SWOT WSE upward by approximately 0.982 m. After adjustment, the SWOT-derived elevations show strong consistency with in situ observations, yielding a mean absolute error (MAE) of 0.535 m and a root mean square error (RMSE) of 0.689 m.
The resulting statistics indicate that the adjusted SWOT WSE can reasonably track gauge-based water-level variations under extreme flood conditions characterized by rapid WSE fluctuations, complex hydraulic conditions, and enhanced surface roughness. Combined with the wide-swath spatial coverage of SWOT, these adjusted observations provide a consistent elevation reference for subsequent WSE–area analysis and flood storage estimation.
Because the same synchronous gauge observations are used to estimate the vertical offset, the post-adjustment statistics should be interpreted primarily as indicators of temporal consistency rather than a fully independent validation of absolute accuracy.

4.5. Reconstruction of Daily Flood Dynamics and Storage Estimation

4.5.1. WSE–Area Relationship

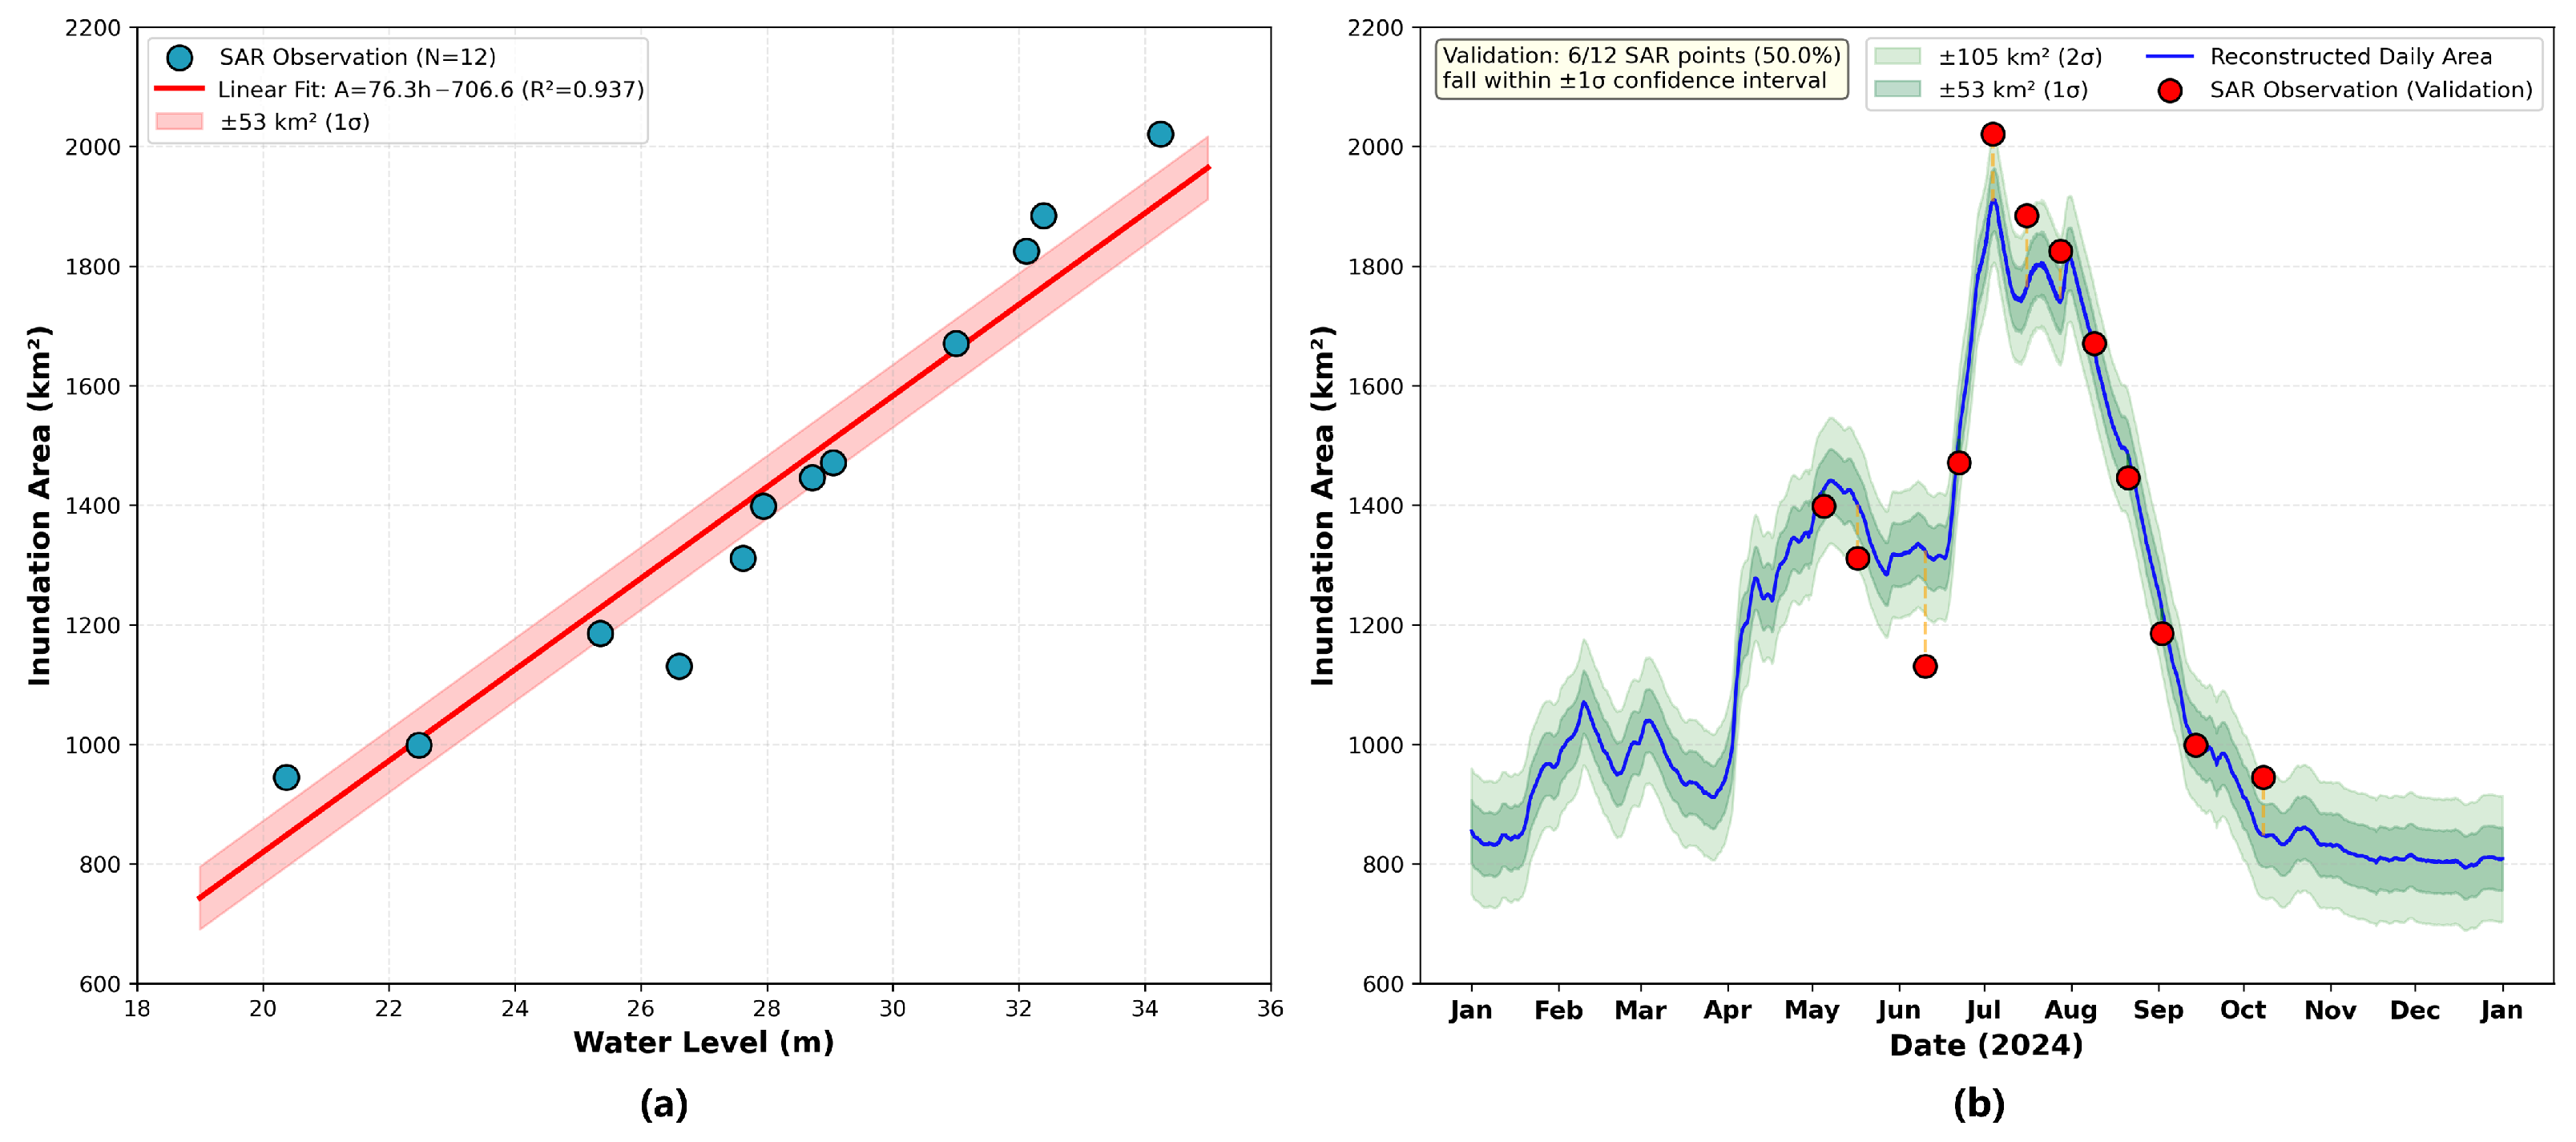
By integrating SAR-derived inundation areas ( A t ) with temporally matched water-level observations from the bias-adjusted SWOT–gauge series ( H t adj ), an empirical WSE–area relationship is established (Figure 6a):
A t = 76.3 H t adj 706.6
The model is only applicable within the observed WSE range and exhibits a strong linear relationship ( R 2 = 0.937 ), suggesting a relatively stable area–elevation response of the Dongting Lake floodplain during the study period. The linear form is consistent with the limited WSE range observed during the flood season, within which the lake–floodplain system exhibits approximately monotonic inundation expansion behavior.
The relatively narrow uncertainty range ( ± 53 km 2 , approximately 1 σ ) further suggests that floodplain activation follows a relatively consistent hypsometric response despite dynamically varying hydrological conditions. This relationship provides a functional linkage between WSE and inundation extent, forming the basis for reconstructing flood dynamics at temporal resolutions beyond the native satellite revisit cycles.

4.5.2. Daily Inundation Reconstruction

Using the derived WSE–area relationship, the daily inundation extent for 2024 is reconstructed from continuous water-level observations (Figure 6b) using a daily temporal resolution. The reconstructed time series captures the full flood evolution, including the rising phase, flood peak, and subsequent recession period.
Validation against SAR-derived inundation observations demonstrates general consistency between the reconstructed and observed inundation extents. Six out of twelve SAR-derived observations fall within the ± 1 σ uncertainty range, while most remaining observations are contained within the ± 2 σ envelope. These results suggest that the WSE–area model captures the main seasonal evolution of inundation extent, although residual deviations remain during rapidly varying flood conditions.
The moderate agreement within the ± 1 σ range may reflect non-Gaussian uncertainty characteristics as well as residual temporal mismatch between SAR and SWOT observations during periods of rapidly varying flood conditions.

4.5.3. Flood-Induced Storage Dynamics

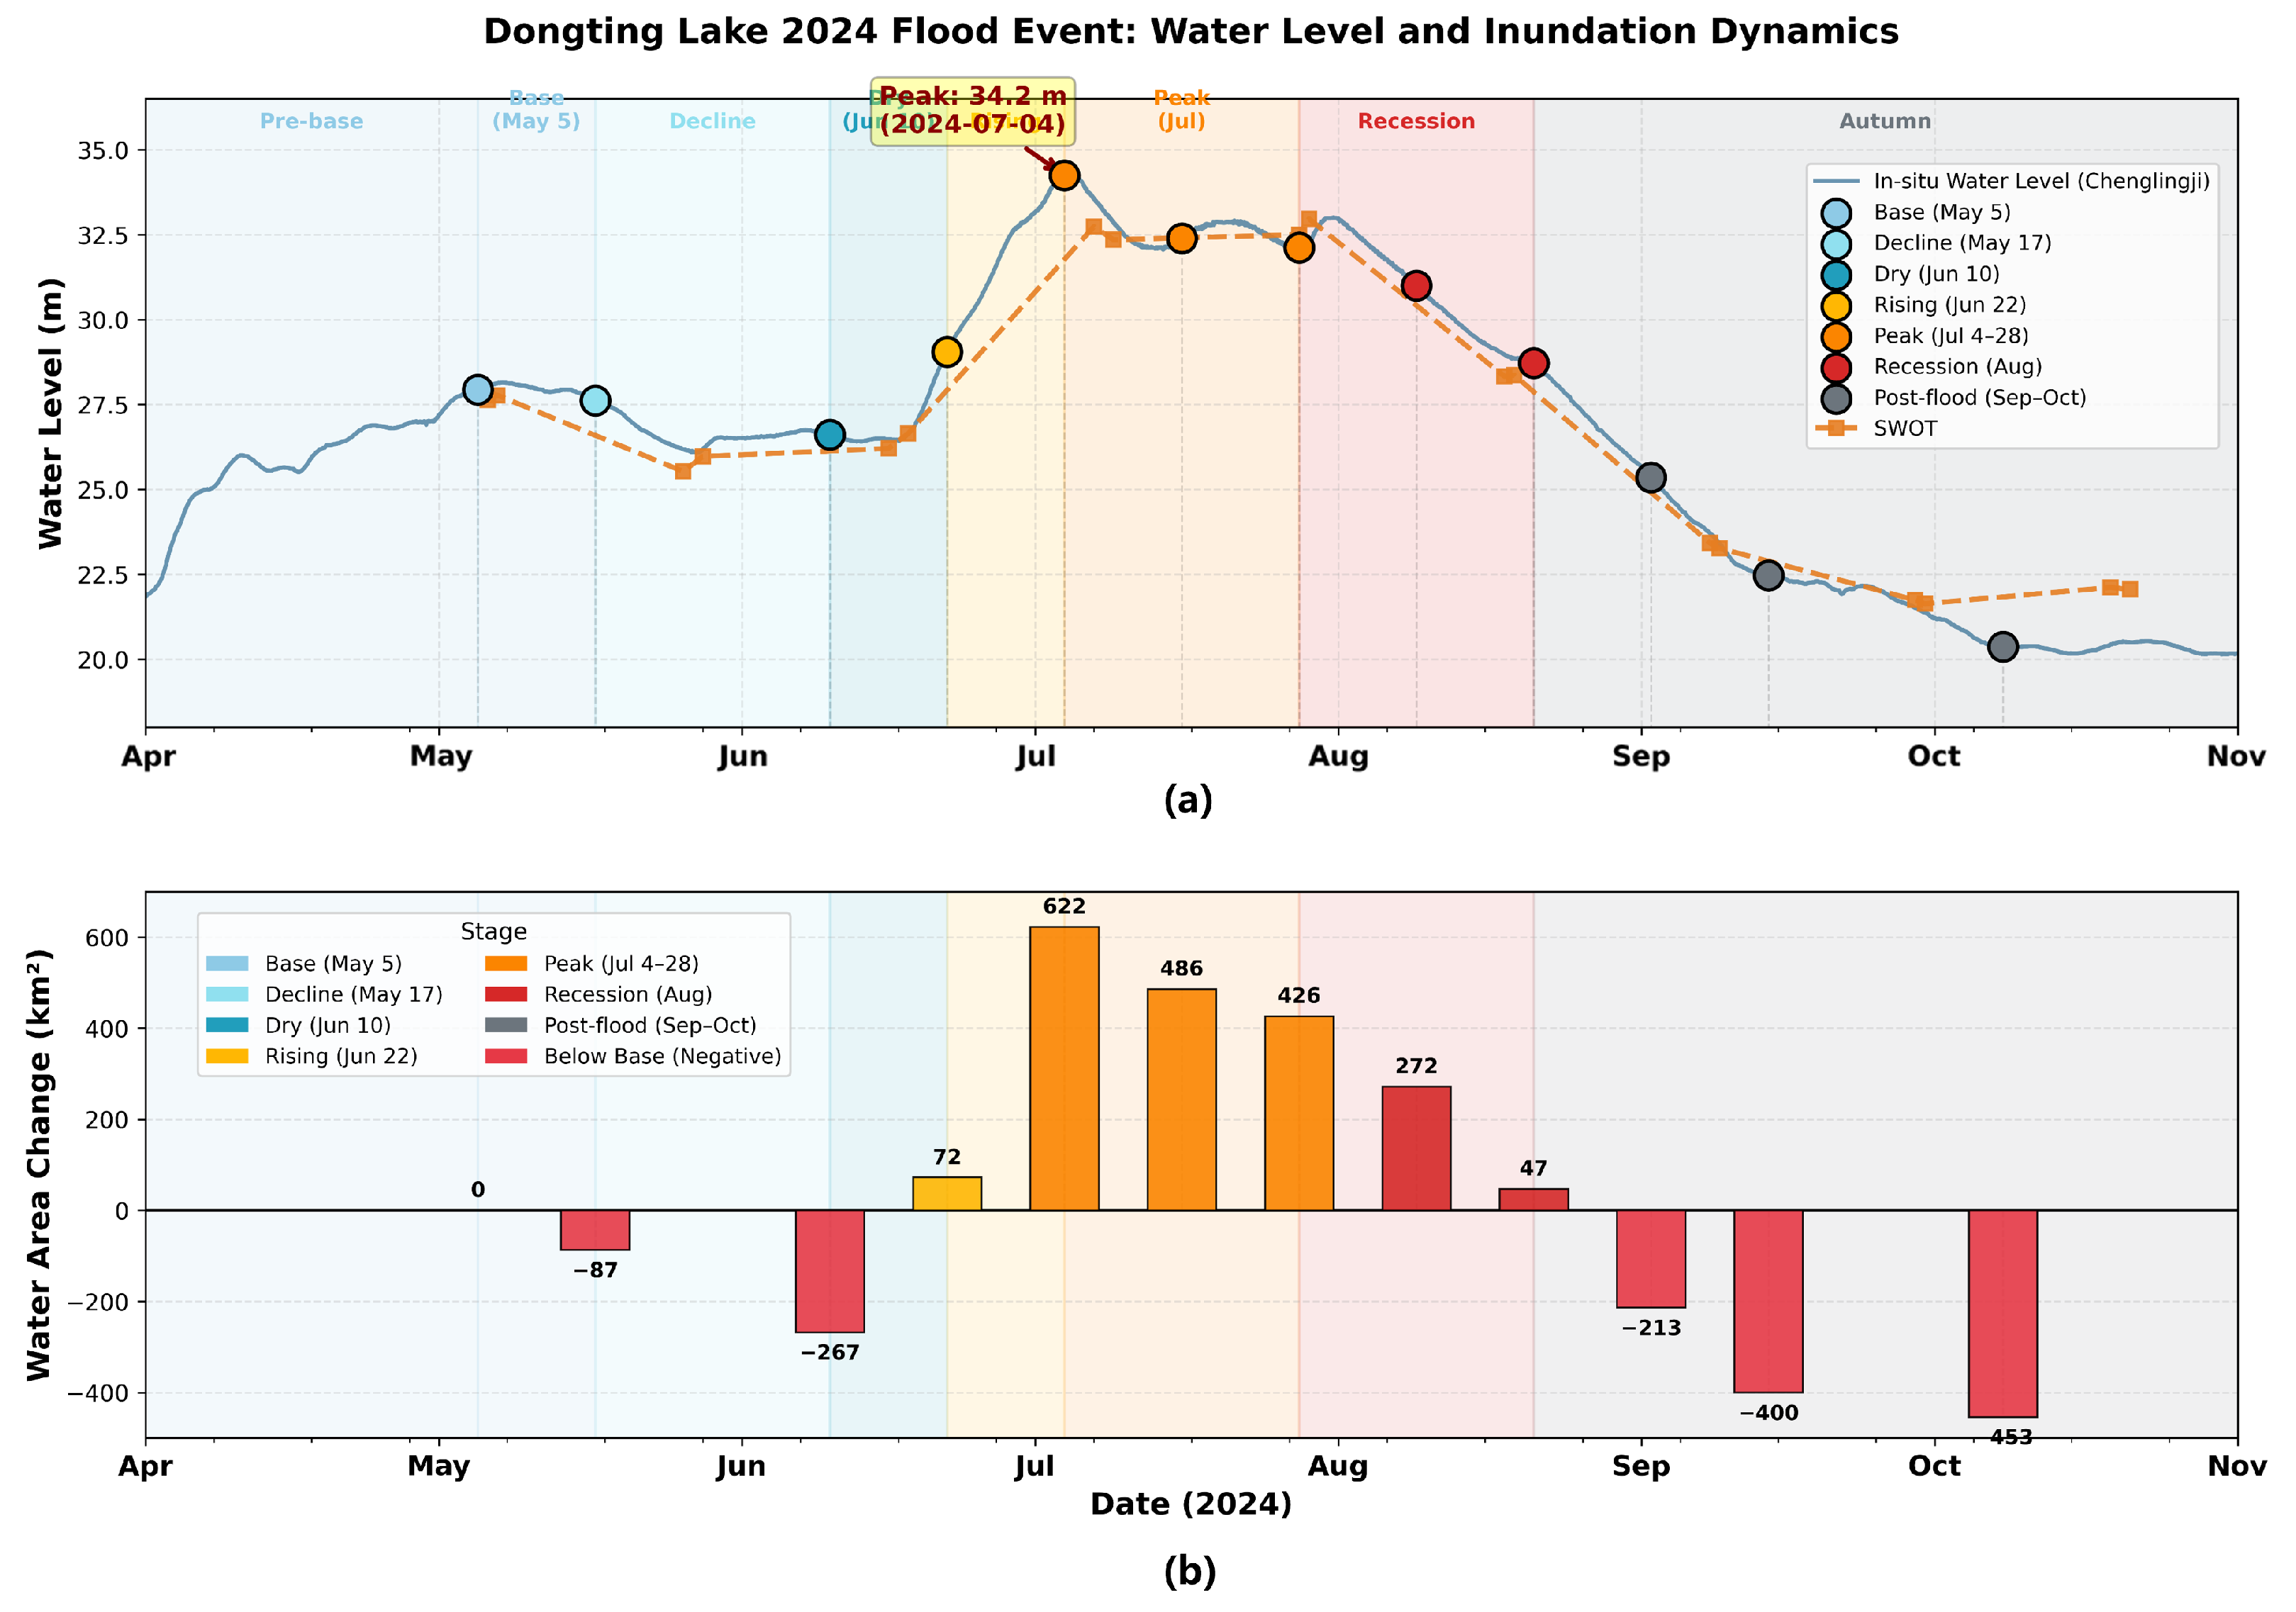
The combined analysis of WSE and inundation extent reveals the magnitude and temporal evolution of the 2024 flood event (Figure 7). The peak WSE reached approximately 34.2 m in early July, coinciding with the maximum inundation extent.
Relative to the pre-flood baseline, the inundated area increased by up to 622 km 2 , indicating substantial activation of floodplain storage zones during the peak flood period. Following the flood peak, the inundation extent gradually decreased, with negative anomalies (up to 453 km 2 ) observed during the late recession period. These negative anomalies indicate reduced inundation extent relative to the pre-flood reference condition rather than absolute water loss.
The reconstructed flood evolution exhibits a pronounced asymmetry between rapid flood expansion and comparatively gradual recession, which is characteristic of large river-connected lake systems. The observed spatiotemporal variations indicate substantial changes in floodplain storage conditions and highlight the importance of jointly capturing inundation extent and WSE dynamics for flood characterization and storage assessment.

4.5.4. Cumulative Water Storage Variation

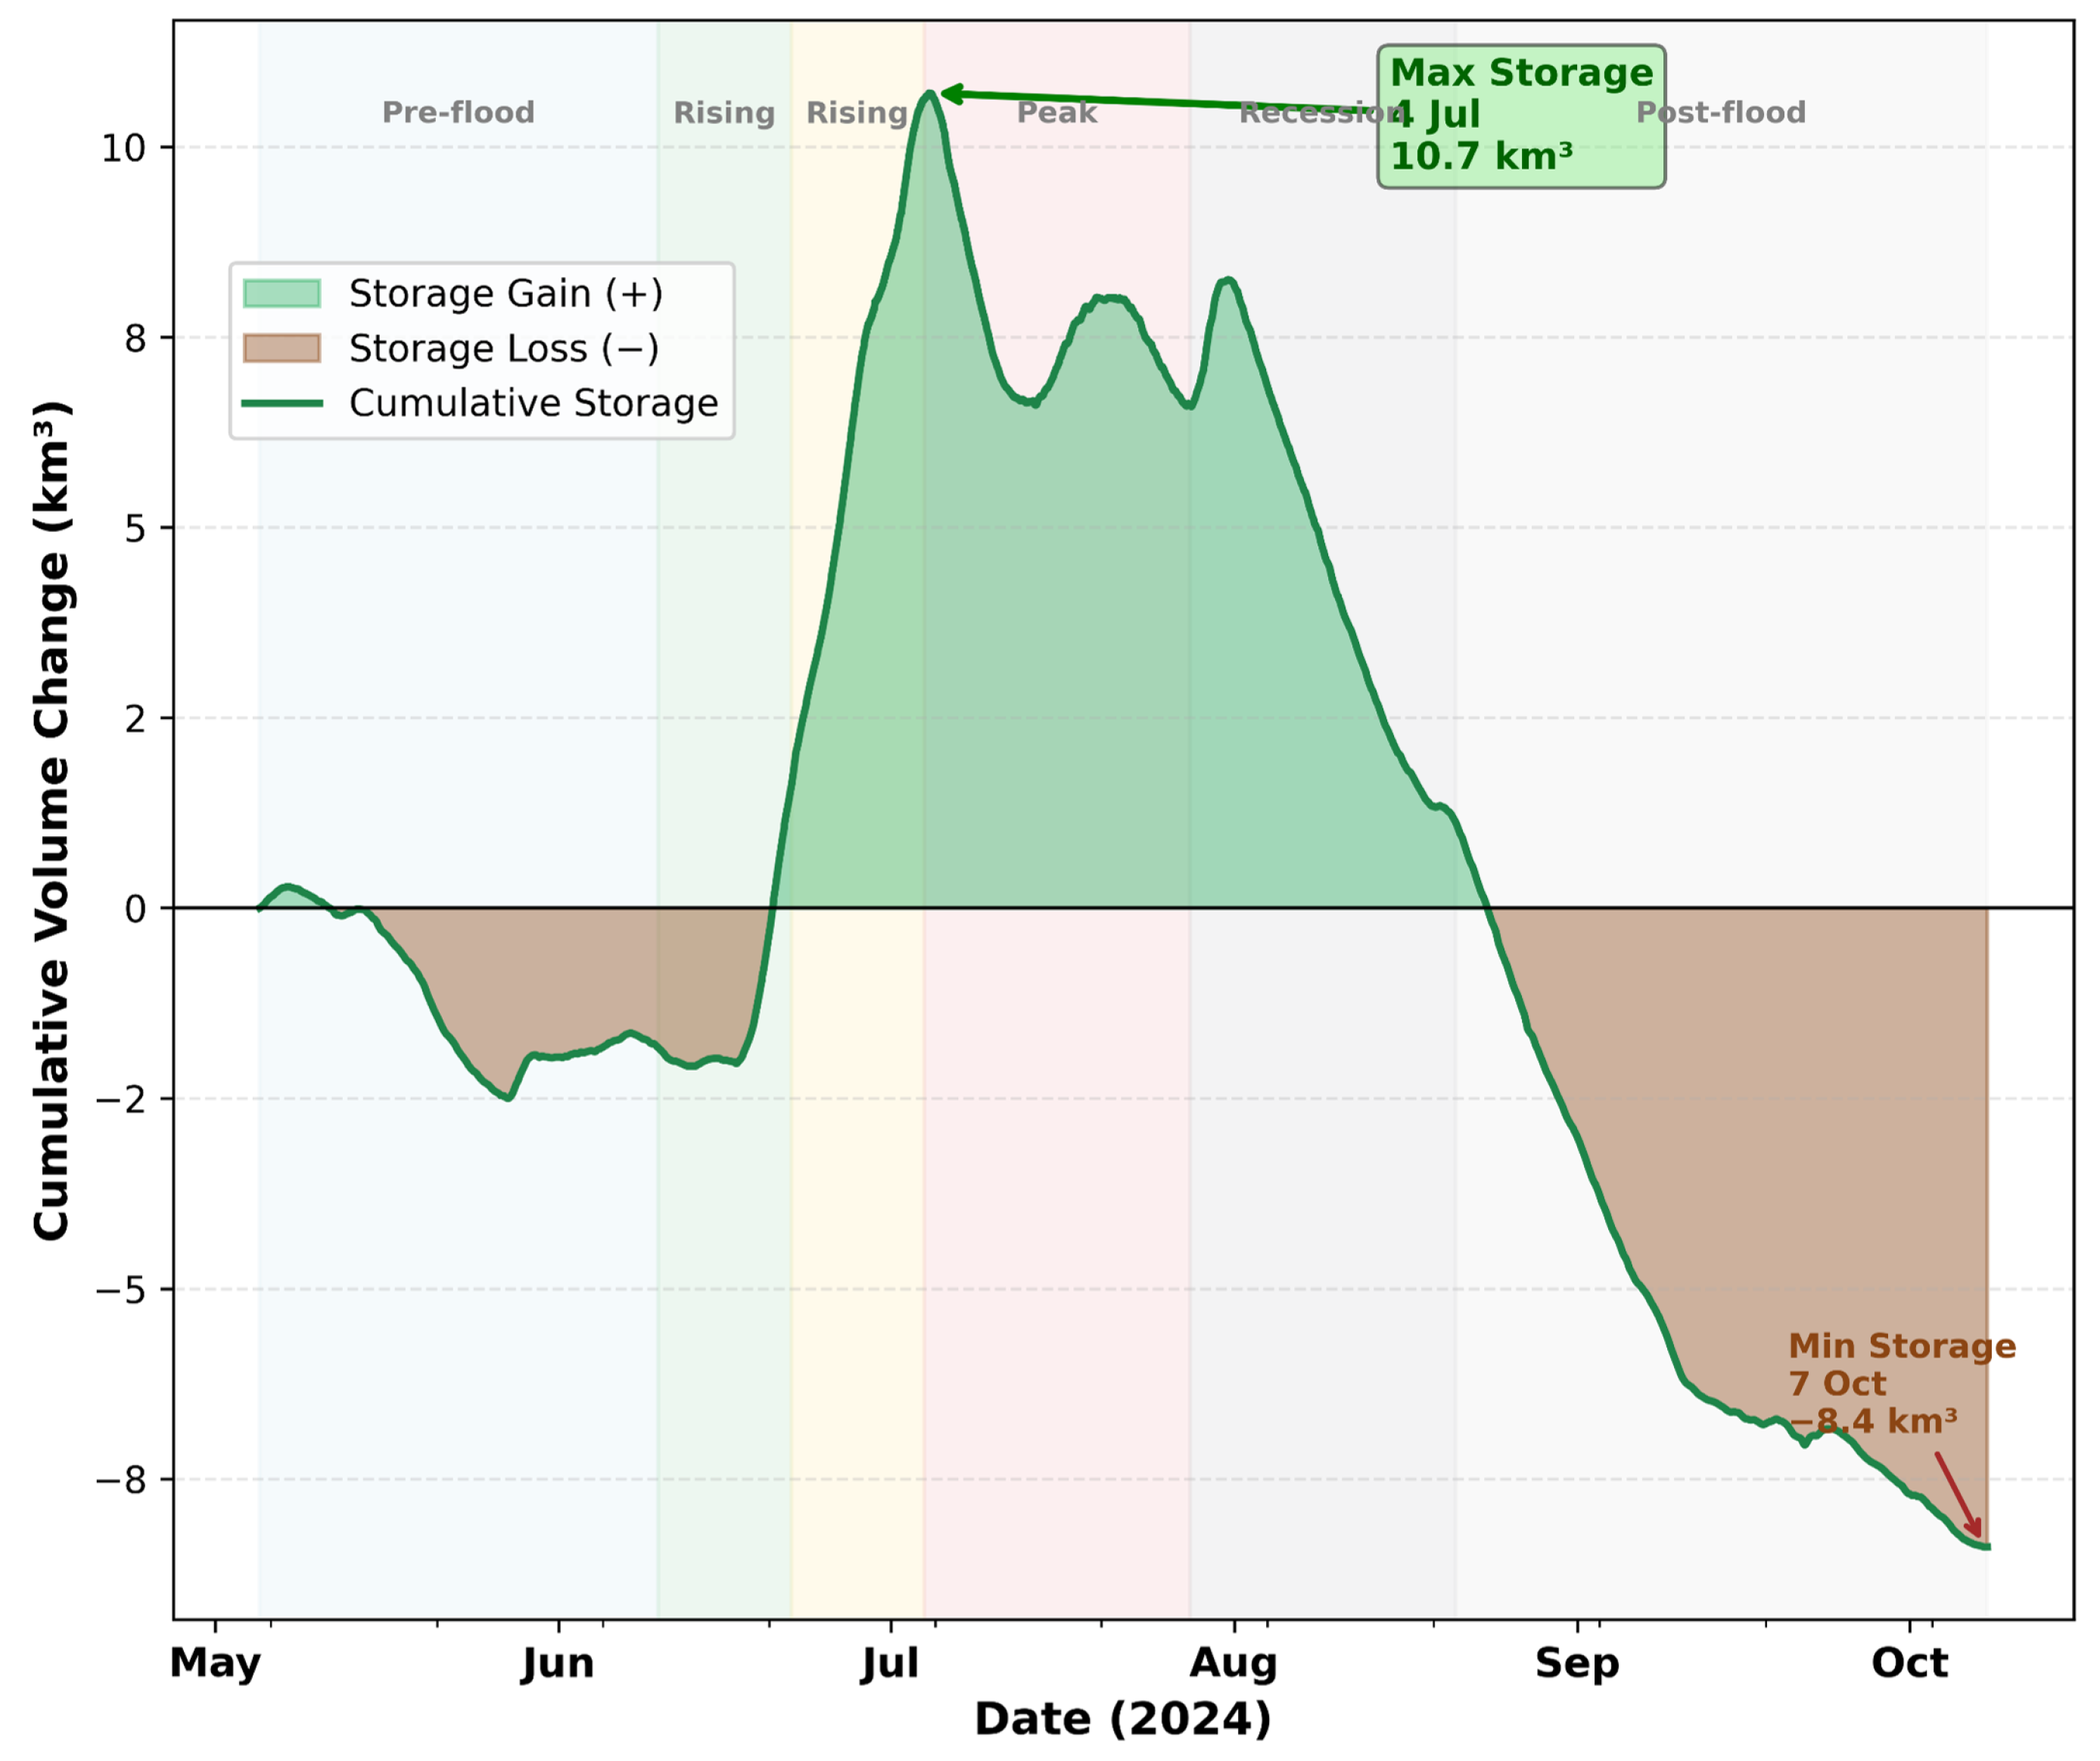
To extend the analysis from inundation extent mapping to flood storage estimation, the cumulative water storage variation is estimated relative to the pre-flood baseline (5 May 2024). Using the reconstructed daily water-level series, storage variation is estimated by integrating inundation area over successive WSE changes rather than directly over time.
As shown in Figure 8, the Dongting Lake system exhibits a distinct transition from flood-driven storage accumulation to gradual recession and depletion during the 2024 flood cycle. The cumulative storage begins to increase in late June, reaching a maximum of approximately 10.7 km 3 in early July, coinciding with the peak WSE and maximum inundation extent.
Following the flood peak, the system transitions into a recession phase characterized by continuous storage decline. A minimum anomaly of approximately 8.4 km 3 is observed in early October, indicating lower storage conditions relative to the pre-flood baseline rather than negative absolute water storage.
This asymmetric storage behavior reflects the combined effects of floodplain activation during the rising stage and progressive drainage during the recession period. The results suggest the important buffering function of the Dongting Lake system in regulating floodwater storage and release.
The integration of SWOT-derived WSE observations with SAR-derived inundation extents enables an internally consistent reconstruction of flood dynamics that would be difficult to achieve using either dataset independently.

5. Discussion

5.1. Reliability of the WSE–Area Relationship

The observed linear WSE–area relationship ( R 2 = 0.937 ) suggests a consistent and approximately linear response between inundation extent and WSE within the range of the 2024 flood event. This behavior indicates that, at the scale of the available observations, the Dongting Lake floodplain exhibits relatively stable hypsometric characteristics during the study period.
Given the limited number of paired observations ( N = 12 ), more complex representations such as nonlinear hypsometric functions or hysteresis effects between rising and recession stages cannot be robustly constrained. Introducing additional model complexity under the current data availability may lead to parameter instability without providing commensurate improvements in explanatory power. Therefore, a linear formulation is adopted as a parsimonious and statistically stable approximation for reconstructing flood dynamics and estimating storage variations.
It should be noted that in larger hydrological ranges or more geomorphologically complex systems, WSE–area relationships may deviate from linearity due to multi-basin connectivity, spatial heterogeneity, and nonlinear floodplain activation processes. However, within the context of the present study, the linear approximation provides a reasonable and internally consistent description of the observed floodplain response.

5.2. Uncertainty and Error Propagation

The uncertainty analysis indicates that SAR-derived inundation mapping represents the dominant contributor to volumetric uncertainty, with a relative uncertainty of approximately ± 8.5 % . This is primarily associated with classification ambiguity in vegetated floodplains, where partially inundated vegetation and heterogeneous backscatter conditions may reduce the separability between inundated and non-inundated surfaces.
In contrast, SWOT-derived WSE exhibits comparatively lower uncertainty (RMSE = 0.689 m after bias adjustment), although its contribution to the total uncertainty is not entirely independent of spatial classification uncertainty due to their coupled role in the WSE–area relationship. The numerical integration uncertainty associated with the trapezoidal approximation remains relatively limited under the current temporal sampling configuration but may become more significant under coarser revisit intervals or more rapidly varying hydrodynamic conditions.
Although the root-sum-square framework provides a practical first-order uncertainty estimate, it assumes approximate independence among different uncertainty sources. In reality, spatial and temporal correlations between SAR classification uncertainty and WSE variability may introduce additional uncertainty not fully captured by the present first-order approximation.

5.3. Advantages of Multi-Source Data Integration

The integration of SAR and SWOT observations provides complementary constraints on flood dynamics by linking high-resolution inundation patterns with basin-scale hydraulic variability. Beyond simple data complementarity, this framework establishes a physically constrained relationship between WSE and inundation extent, enabling consistent reconstruction of flood evolution across both spatial and temporal scales.
Compared with single-source approaches, the proposed integration framework enables volumetric characterization of flood storage dynamics, thereby bridging the gap between two-dimensional inundation mapping and hydrological storage assessment. A major advantage of the framework lies in its ability to propagate information across observational domains rather than relying exclusively on either spatial inundation observations or vertically resolved WSE measurements alone.
The present results further demonstrate that synergistic integration between SWOT altimetry and SAR observations can effectively compensate for the limitations of individual sensors, particularly in large floodplain systems characterized by strong seasonal hydrodynamic variability and heterogeneous inundation patterns.

5.4. Limitations and Future Work

Despite the encouraging results, several limitations remain. One important limitation arises from the temporal asynchrony between Sentinel-1 SAR observations and SWOT altimetry overpasses, which introduces uncertainty during periods of rapid hydrological transition, particularly near flood peaks. In this study, direct same-day pairing between each Sentinel-1 acquisition and SWOT overpass is not assumed. Instead, SWOT observations are used to bias-adjust and constrain the daily gauge-based WSE series, which provided temporally continuous water-level support for Sentinel-1 acquisition dates. Nevertheless, the current framework may still be insufficient for resolving sub-daily hydrodynamic fluctuations.
SWOT return intensity and related pixel-level information may provide useful constraints for land–water discrimination during SWOT overpasses. However, this study primarily used the SWOT LakeSP product to provide lake-scale WSE observations, while the multi-temporal inundation sequence is derived from Sentinel-1 SAR imagery. Although SWOT intensity has potential for improving water classification at SWOT acquisition times, it cannot fully replace the Sentinel-1 SAR time series because of the relatively sparse temporal sampling of SWOT. Future work could further integrate SWOT PIXC intensity information with Sentinel-1 SAR observations to improve near-coincident water classification and reduce multi-sensor temporal uncertainty.
Secondly, the linear WSE–area formulation does not explicitly account for hysteresis behavior or nonlinear floodplain activation processes, which may become increasingly important in more geomorphologically complex or multi-branch river–lake systems.
Finally, although the AS-FCM algorithm improves robustness in heterogeneous floodplain environments, residual omission uncertainty remains in densely vegetated areas due to the inherent limitations of C-band SAR backscatter sensitivity to partially inundated vegetation.
Future work should explore the incorporation of higher-temporal-resolution observations, such as geostationary optical imagery, multi-sensor data assimilation, or hydrodynamic model coupling. In addition, physically constrained or nonlinear WSE–area representations may further improve the characterization of floodplain storage dynamics under extreme hydrological conditions.

6. Conclusions

This study presents an integrated SAR–SWOT framework for reconstructing the spatiotemporal evolution and storage dynamics of the 2024 flood event in the East Dongting Lake system. By combining Sentinel-1 SAR-derived inundation extent with SWOT-constrained WSE observations, the framework enables a more comprehensive characterization of flood dynamics in terms of inundation extent, WSE variability, and storage change.
The proposed AS-FCM framework provides reliable inundation mapping performance under heterogeneous floodplain conditions, achieving an OA of 93.6%, an IoU of 0.89, and a KC of 0.87. The results further suggest that adaptive spatial constraints improve spatial consistency while maintaining reasonable delineation of inundation boundaries in complex floodplain environments.
The multi-temporal analysis reveals a clear flood evolution pattern characterized by rapid expansion during the rising stage and comparatively gradual recession following the flood peak. After bias adjustment, SWOT-derived WSE observations show strong agreement with synchronous in situ measurements ( C C = 0.988 ), supporting the derivation of a consistent WSE–area relationship ( R 2 = 0.937 ) for reconstructing flood dynamics and estimating storage variation.
The reconstructed results indicate that the East Dongting Lake floodplain functioned as an important temporary floodwater storage zone during the 2024 flood event, with cumulative storage variation reaching approximately 10.7 km 3 during the peak stage. Overall, the present study demonstrates the strong potential of synergistic SAR and SWOT observations for reconstructing floodplain storage dynamics in large river–lake systems under extreme hydrological conditions.

Author Contributions

Conceptualization, Y.L. and Y.Z.; methodology, Y.L., Y.Z. and D.L.; formal analysis, Y.L. and J.S.; validation, Y.L., Y.Z., D.L. and J.S.; resources, Y.Z. and D.L.; data curation, Y.L. and D.L.; writing—original draft preparation, Y.L.; writing—review and editing, Y.L., Y.Z., D.L. and J.S.; visualization, Y.L. and J.S.; supervision, Y.Z. and D.L.; project administration, Y.Z. and D.L.; funding acquisition, Y.Z. and D.L. All authors have read and agreed to the published version of the manuscript.

Funding

This work was supported in part by the National Natural Science Foundation of China under Grant 61971402 and Grant 41871274 and in part by the Strategic High-Tech Innovation Fund of Chinese Academy of Sciences under Grant CXJJ19B10.

Data Availability Statement

The data used in this study are available from the author upon reasonable request (via email: lyx19980131@163.com).

Acknowledgments

The authors would like to acknowledge the National Aeronautics and Space Administration (NASA) and the Centre National d’Études Spatiales (CNES) for providing the SWOT mission data used in this study. The authors also thank the European Space Agency (ESA) for freely providing Sentinel-1 SAR data through the Copernicus Open Access Hub. In addition, we acknowledge the hydrological data support from the Chenglingji hydrological station, which was essential for the validation of SWOT-derived WSE.

Conflicts of Interest

The authors declare no conflicts of interest.

References

  1. Merz, B.; Blöschl, G.; Vorogushyn, S.; Dottori, F.; Aerts, J.C.J.H.; Bates, P.; Bertola, M.; Kemter, M.; Kreibich, H.; Lall, U.; et al. Causes, impacts and patterns of disastrous river floods. Nat. Rev. Earth Environ. 2021, 2, 592–609. [Google Scholar] [CrossRef]
  2. Rentschler, J.; Salhab, M.; Jafino, B.A. Flood exposure and poverty in 188 countries. Nat. Commun. 2022, 13, 3527. [Google Scholar] [CrossRef] [PubMed]
  3. Zhou, Y.; Liu, Y.; Wu, W. Strengthen China’s flood control. Nature 2016, 536, 396. [Google Scholar] [PubMed]
  4. Alsdorf, D.E.; Rodríguez, E.; Lettenmaier, D.P. Measuring surface water from space. Rev. Geophys. 2007, 45, RG2002. [Google Scholar] [CrossRef]
  5. Xiao, Y.; Shao, D.; Wu, S.; Cai, Y.; Li, H.; Zhuang, L.; Xu, Y.; Fan, Y.; Ke, C.-Q. Monitoring the 2024 abrupt flood event in East Dongting Lake via deep learning and multisource remote sensing data. IEEE J. Sel. Top. Appl. Earth Obs. Remote Sens. 2026, 19, 5602–5617. [Google Scholar] [CrossRef]
  6. Chini, M.; Pulvirenti, L.; Pelich, R.; Pierdicca, N.; Hostache, R.; Matgen, P. Monitoring urban floods using SAR interferometric observations. In Proceedings of the IEEE International Geoscience and Remote Sensing Symposium; IEEE: New York, NY, USA, 2018; pp. 8785–8788. [Google Scholar]
  7. Dong, Z.; Liang, Z.; Wang, G.; Amankwah, S.O.Y.; Feng, D.; Wei, X.; Duan, Z. Mapping inundation extents in Poyang Lake area using Sentinel-1 data and transformer-based change detection method. J. Hydrol. 2023, 620, 129455. [Google Scholar] [CrossRef]
  8. Otsu, N. A threshold selection method from gray-level histograms. IEEE Trans. Syst. Man Cybern. 1979, SMC-9, 62–66. [Google Scholar] [CrossRef]
  9. Liang, J.; Liu, D. A local thresholding approach to flood water delineation using Sentinel-1 SAR imagery. ISPRS J. Photogramm. Remote Sens. 2020, 159, 53–62. [Google Scholar] [CrossRef]
  10. Lu, J.; Giustarini, L.; Xiong, B.; Zhao, L.; Jiang, Y.; Kuang, G. Automated flood detection with improved robustness and efficiency using multi-temporal SAR data. Remote Sens. Lett. 2014, 5, 240–248. [Google Scholar] [CrossRef]
  11. Wu, M.; Guo, F.; Zhang, J.; Zhao, L.; Liu, W.; Zhou, C. Surface water extraction by multidimensional feature fusion of Sentinel-1/2 and random forest: A five-year analysis in Jiangsu, China. IEEE J. Sel. Top. Appl. Earth Obs. Remote Sens. 2026, 19, 8302–8318. [Google Scholar] [CrossRef]
  12. Ye, F.; Zhang, R.; Xu, X.; Wu, K.; Zheng, P.; Li, D. Water body segmentation of SAR images based on SAR image reconstruction and an improved UNet. IEEE Geosci. Remote Sens. Lett. 2024, 21, 4010005. [Google Scholar]
  13. He, J.; Zhang, L.; Xiao, T.; Wang, H.; Luo, H. Deep learning enables super-resolution hydrodynamic flooding process modeling under spatiotemporally varying rainstorms. Water Res. 2023, 239, 120057. [Google Scholar] [CrossRef] [PubMed]
  14. Zeng, Y.F.; Chang, M.J.; Lin, G.F. A novel AI-based model for real-time flooding image recognition using super-resolution generative adversarial network. J. Hydrol. 2024, 638, 131475. [Google Scholar]
  15. Xie, C.; Zhang, X.; Zhang, X.; Shen, S.; Zhuang, L.; Chen, K. Delineation of surface water bodies from SAR imagery based on improved MRF and CNN model. In Proceedings of the 2023 8th International Conference on Image, Vision and Computing (ICIVC); IEEE: New York, NY, USA, 2023; pp. 478–482. [Google Scholar]
  16. Li, Y.; Zhang, Y.; Li, D.; Song, J. A novel fusion method of optical and wide-swath interferometric radar altimeter images for enhanced water detection. IEEE Trans. Geosci. Remote Sens. 2026, 64, 4700117. [Google Scholar]
  17. Destefanis, T.; Guliyeva, S.; Boccardo, P.; Fissore, V. Advancing flood detection and mapping: A review of Earth observation services, 3D data integration, and AI-based techniques. Remote Sens. 2025, 17, 2943. [Google Scholar] [CrossRef]
  18. Bezdek, J.C.; Ehrlich, R.; Full, W. FCM: The fuzzy c-means clustering algorithm. Comput. Geosci. 1984, 10, 191–203. [Google Scholar] [CrossRef]
  19. Krinidis, S.; Chatzis, V. A robust fuzzy local information C-means clustering algorithm. IEEE Trans. Image Process. 2010, 19, 1328–1337. [Google Scholar] [CrossRef] [PubMed]
  20. Guo, Z.; Wu, L.; Huang, Y.; Guo, Z.; Zhao, J.; Li, N. Water-Body Segmentation for SAR Images: Past, Current, and Future. Remote Sens. 2022, 14, 1752. [Google Scholar] [CrossRef]
  21. Zhang, P.; Chen, Y.; Chen, Y. A non-local fuzzy C-means clustering segmentation algorithm based on comentropy and between-cluster scatter matrix to overcome the inherent coherence speckles of SAR images. In Proceedings of the IGARSS 2022—2022 IEEE International Geoscience and Remote Sensing Symposium, Kuala Lumpur, Malaysia, 17–22 July 2022; pp. 2967–2970. [Google Scholar]
  22. Zhu, J.; Wang, F.; You, H. SAR image segmentation by efficient fuzzy C-means framework with adaptive generalized likelihood ratio nonlocal spatial information embedded. Remote Sens. 2022, 14, 1621. [Google Scholar] [CrossRef]
  23. Zhang, H.; Bruzzone, L.; Shi, W.; Hao, M.; Wang, Y. Enhanced spatially constrained remotely sensed imagery classification using a fuzzy local double neighborhood information C-means clustering algorithm. IEEE J. Sel. Top. Appl. Earth Obs. Remote Sens. 2018, 11, 2896–2910. [Google Scholar] [CrossRef]
  24. Wu, J.; Wang, X.; Liu, Y.; Fang, C. Adaptive sparse regularized fuzzy clustering noise image segmentation algorithm based on complementary spatial information. Expert Syst. Appl. 2024, 256, 124943. [Google Scholar] [CrossRef]
  25. Birkett, C.M. Contribution of the TOPEX NASA radar altimeter to the global monitoring of large rivers and wetlands. Water Resour. Res. 1998, 34, 1223–1239. [Google Scholar] [CrossRef]
  26. Koblinsky, C.J. Measurement of river level variations with satellite altimetry. Water Resour. Res. 1993, 29, 1839–1848. [Google Scholar] [CrossRef]
  27. Santos da Silva, J.; Calmant, S.; Seyler, F.; Rotunno Filho, O.C.; Cochonneau, G.; Mansur, W.J. Water levels in the Amazon basin derived from the ERS 2 and ENVISAT radar altimetry missions. Remote Sens. Environ. 2010, 114, 2160–2181. [Google Scholar] [CrossRef]
  28. Sulistioadi, Y.B.; Tseng, K.H.; Shum, C.K.; Hidayat, H.; Sumaryono, M.; Suhardiman, A.; Setiawan, F.; Sunarso, S. Satellite radar altimetry for monitoring small rivers and lakes in Indonesia. Hydrol. Earth Syst. Sci. 2015, 19, 341–359. [Google Scholar] [CrossRef]
  29. Wu, G.; Liu, Y.; Liu, R. Assessing the performance of the Tiangong-2 wide-swath imaging altimeter observations for water level monitoring over complex and shallow lakes. J. Hydrol. 2022, 612, 128164. [Google Scholar] [CrossRef]
  30. Vaze, P.; Kaki, S.; Limonadi, D.; Esteban-Fernandez, D.; Zohar, G. The surface water and ocean topography mission. In Proceedings of the IEEE Aerospace Conference, Big Sky, MT, USA, 3–10 March 2018; pp. 1–9. [Google Scholar]
  31. Fjørtoft, R.; Gaudin, J.M.; Pourthié, N.; Lalaurie, J.C.; Mallet, A.; Nouvel, J.F.; Martinot-Lagarde, J.; Oriot, H.; Borderies, P.; Ruiz, C.; et al. KaRIn on SWOT: Characteristics of near-nadir Ka-band interferometric SAR imagery. IEEE Trans. Geosci. Remote Sens. 2014, 52, 2172–2185. [Google Scholar]
  32. Durand, M.; Fu, L.L.; Lettenmaier, D.P.; Alsdorf, D.E.; Rodriguez, E.; Esteban-Fernandez, D. The surface water and ocean topography mission: Observing terrestrial surface water and oceanic submesoscale eddies. Proc. IEEE 2010, 98, 766–779. [Google Scholar] [CrossRef]
  33. Fayne, J.V.; Smith, L.C.; Liao, T.; Pitcher, L.H.; Denbina, M.; Chen, A.C.; Simard, M.; Chen, C.W.; Williams, B.A. Characterizing near-nadir and low incidence Ka-band SAR backscatter from wet surfaces and diverse land covers. IEEE J. Sel. Top. Appl. Earth Obs. Remote Sens. 2024, 17, 985–1006. [Google Scholar]
  34. Zhao, Y.; Fu, J.; Pang, Z.; Jiang, W.; Zhang, P.; Qi, Z. Validation of inland water surface elevation from SWOT satellite products: A case study in the middle and lower reaches of the Yangtze River. Remote Sens. 2025, 17, 1330. [Google Scholar] [CrossRef]
  35. Yu, L.; Zhang, H.; Gong, W.; Ma, X. Validation of mainland water level elevation products from SWOT satellite. IEEE J. Sel. Top. Appl. Earth Obs. Remote Sens. 2024, 17, 13494–13505. [Google Scholar] [CrossRef]
  36. Bonassies, Q.; Fatras, C.; Peña-Luque, S.; Dubois, P.; Piacentini, A.; Cassan, L.; Ricci, S.; Nguyen, T.H. A comprehensive study of Surface Water and Ocean Topography (SWOT) pixel cloud data for flood extent extraction. Remote Sens. Environ. 2026, 333, 115101. [Google Scholar] [CrossRef]
  37. Liou, Y.A.; Hoang, D.V. Improved flood depth estimation with SAR image, digital elevation model, and machine learning schemes. J. Hydrol. Reg. Stud. 2024, 53, 101775. [Google Scholar] [CrossRef]
  38. Chimata, L.A.; Anuvala Setty Venkata, S.B.; Patlolla, S.V.R.; Korada Hari Venkata, D.R.; Kandrika, S.; Chauhan, P. Automated rapid estimation of flood depth using a digital elevation model and Earth Observation Satellite (EOS-04)-derived flood inundation. Nat. Hazards Earth Syst. Sci. 2025, 25, 2455–2472. [Google Scholar] [CrossRef]
  39. Chen, H.; Liang, Q.; Liu, Y.; Xie, S. Hydraulic correction method (HCM) to enhance the efficiency of SRTM DEM in flood modeling. J. Hydrol. 2018, 559, 56–70. [Google Scholar] [CrossRef]
  40. Archer, L.; Neal, J.C.; Bates, P.D.; House, J.I. Comparing TanDEM-X data with frequently used DEMs for flood inundation modeling. Water Resour. Res. 2018, 54, 10205–10222. [Google Scholar]
  41. Neal, J.; Hawker, L.; Savage, J.; Durand, M.; Bates, P.; Sampson, C. Estimating river channel bathymetry in large scale flood inundation models. Water Resour. Res. 2021, 57, e2020WR028301. [Google Scholar] [CrossRef]
  42. Frappart, F.; Seyler, F.; Martinez, J.M.; León, J.G.; Cazenave, A. Floodplain water storage in the Negro River basin estimated from microwave remote sensing of inundation area and water levels. Remote Sens. Environ. 2005, 99, 387–399. [Google Scholar] [CrossRef]
  43. Nguyen, T.H.; Ricci, S.; Piacentini, A.; Emery, C.; Suquet, R.R.; Luque, S.P. Assimilation of SWOT altimetry and Sentinel-1 flood extent observations for flood reanalysis: A proof-of-concept. In Proceedings of the IGARSS 2024—2024 IEEE International Geoscience and Remote Sensing Symposium, Athens, Greece, 7–12 July 2024; pp. 3163–3167. [Google Scholar]
  44. Pekel, J.F.; Cottam, A.; Gorelick, N.; Belward, A.S. High-resolution mapping of global surface water and its long-term changes. Nature 2016, 540, 418–422. [Google Scholar] [CrossRef] [PubMed]
  45. Zhang, C.; Lv, A.; Zhu, W.; Yao, G.; Qi, S. Using Multisource Satellite Data to Investigate Lake Area, Water Level, and Water Storage Changes of Terminal Lakes in Ungauged Regions. Remote Sens. 2021, 13, 3221. [Google Scholar] [CrossRef]
  46. Taylor, B.N.; Kuyatt, C.E. Guidelines for Evaluating and Expressing the Uncertainty of NIST Measurement Results; NIST Technical Note 1297; National Institute of Standards and Technology: Gaithersburg, MD, USA, 1994.
  47. Chuang, K.-S.; Tzeng, H.-L.; Chen, S.; Wu, J.; Chen, T.-J. Fuzzy c-means clustering with spatial information for image segmentation. Comput. Med. Imaging Graph. 2006, 30, 9–15. [Google Scholar] [CrossRef] [PubMed]
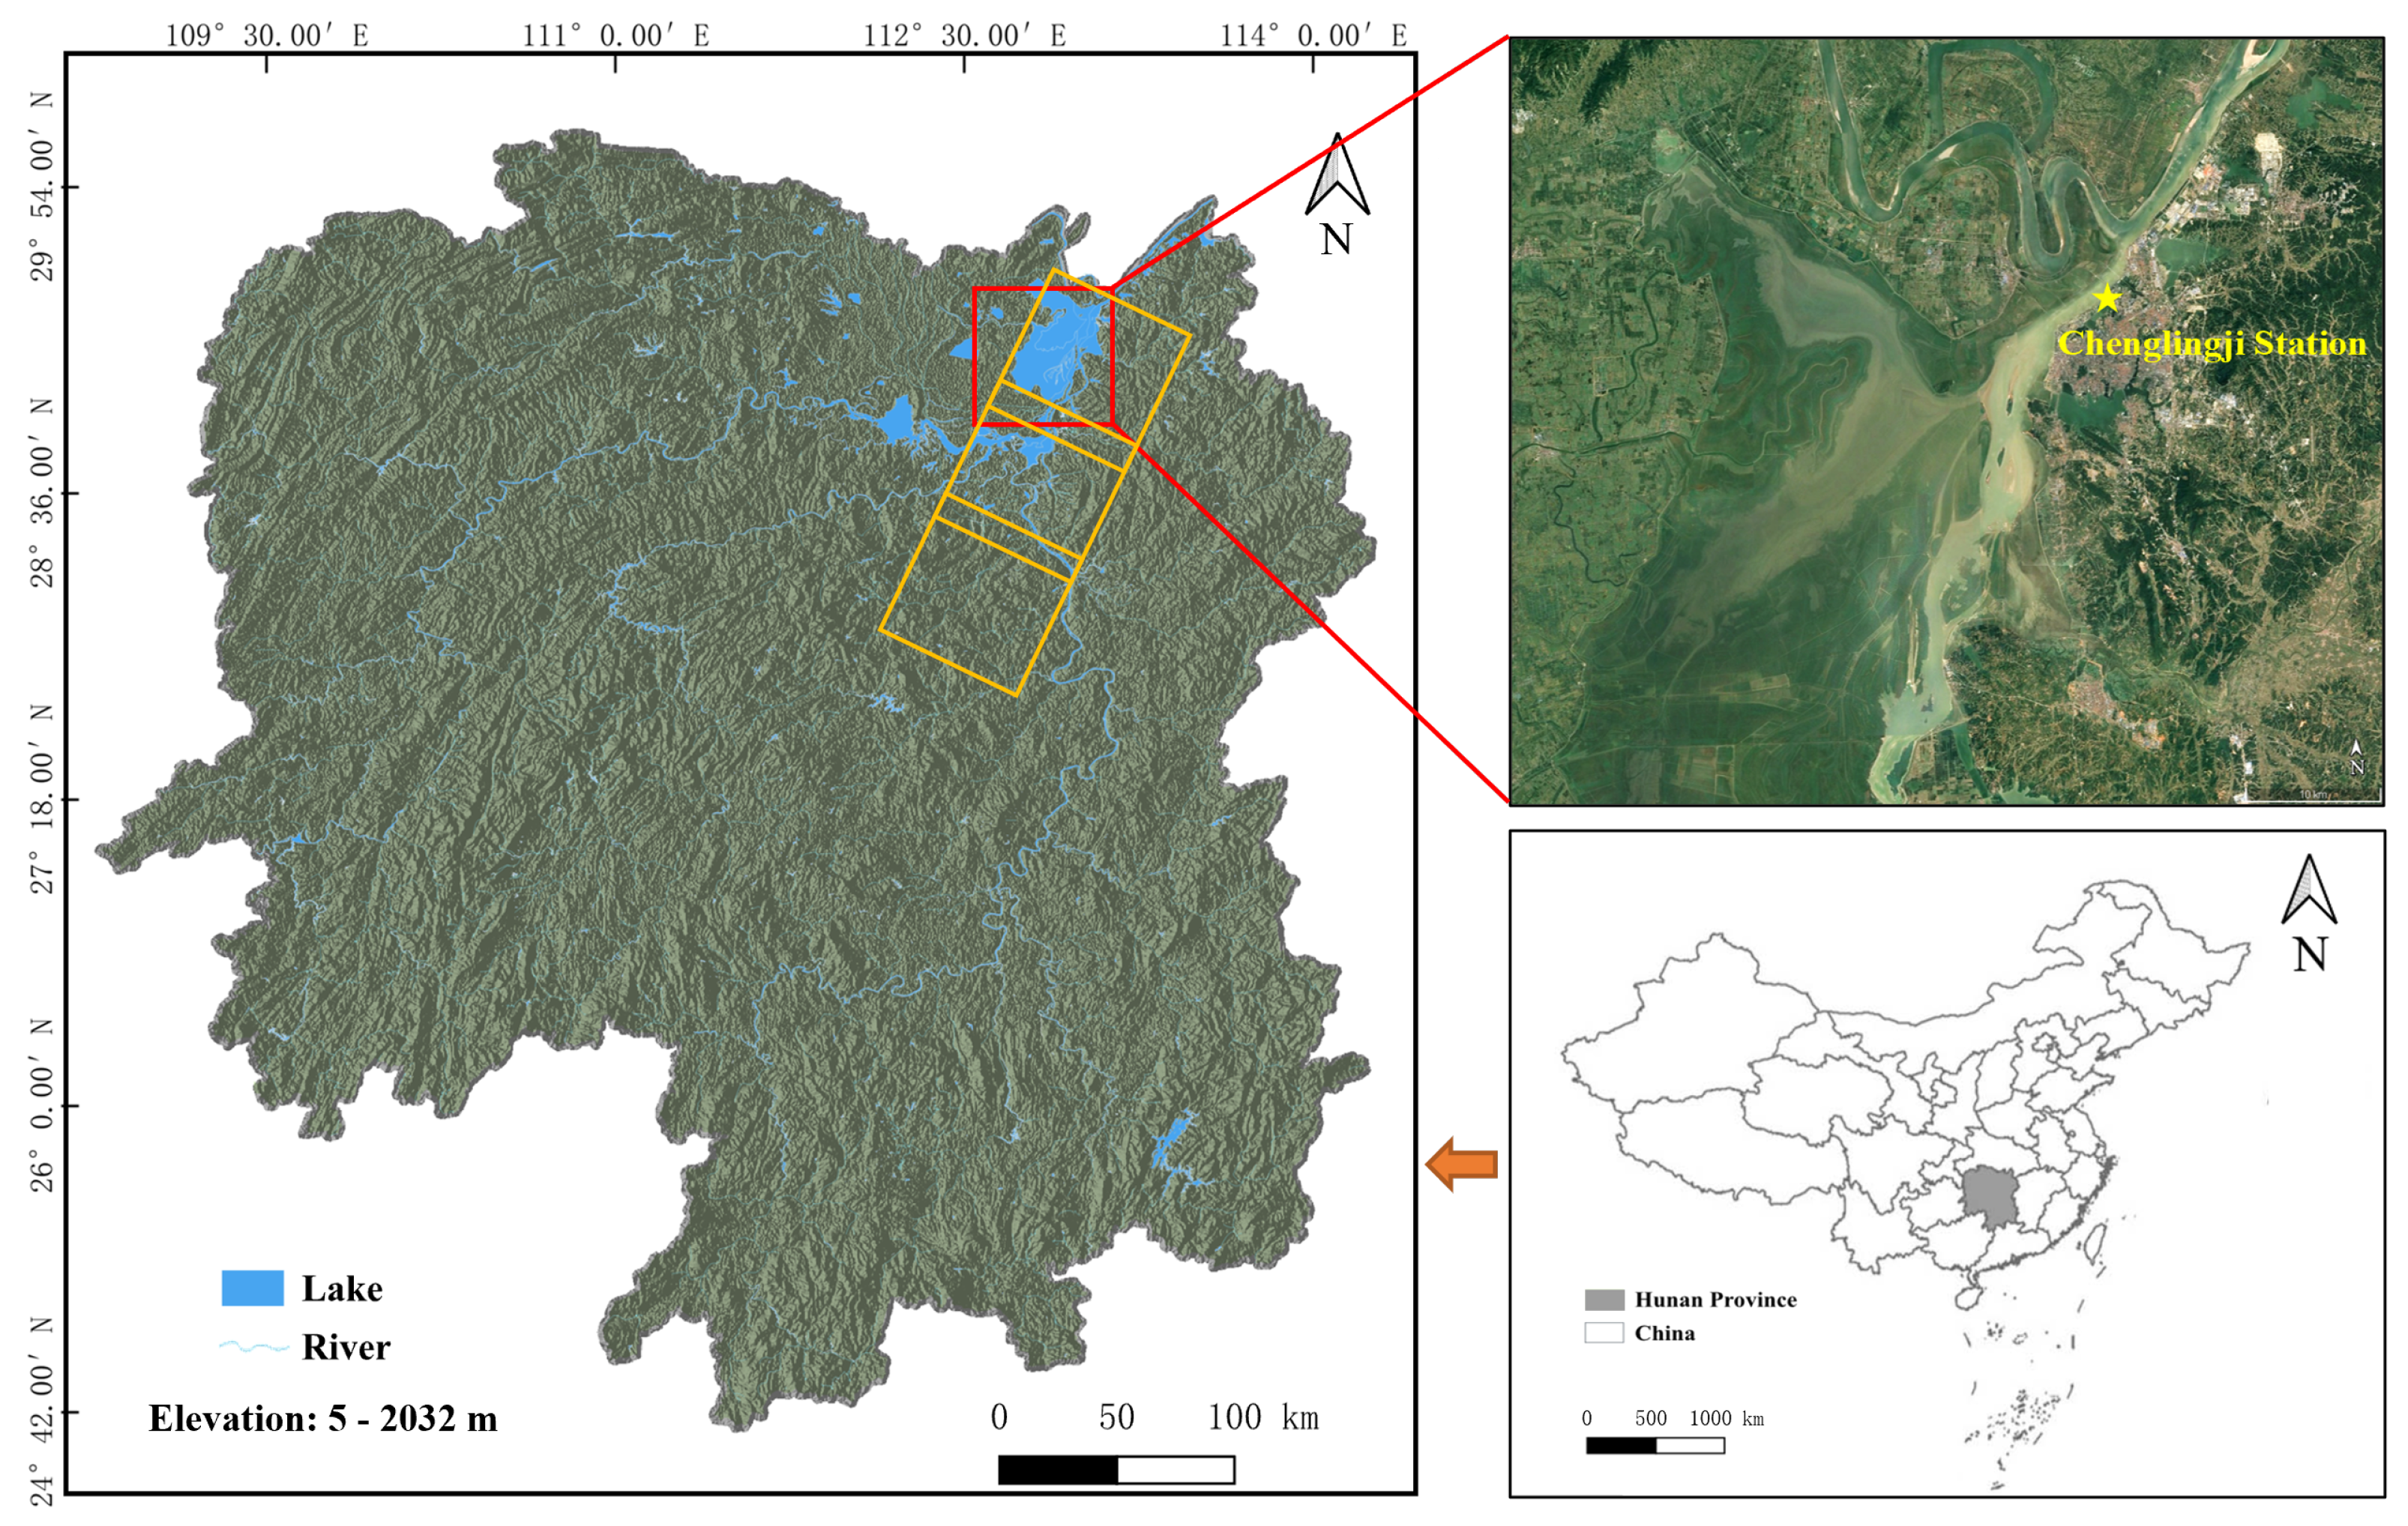
Figure 1. Study area and SWOT spatial coverage. The main map shows the shaded-relief topographic background of Hunan Province and the Dongting Lake system, with major lakes and rivers indicated. The upper-right inset highlights the confluence of the Yangtze River and East Dongting Lake, with the Chenglingji hydrological station marked. Yellow polygons represent the SWOT HR single-side swaths. The lower-right inset shows the location of Hunan Province within China.
Remotesensing 18 02283 g001
Figure 2. Methodological framework of the study for monitoring the 2024 flood dynamics in Dongting Lake.
Remotesensing 18 02283 g002
Figure 3. Representative visual comparison of SAR-derived inundation classification results on 9 August 2024. The panels show (a) Sentinel-1 SAR backscatter image, (b) Sentinel-2 optical reference image, (c) reference annotation mask, (d) Otsu thresholding, (e) standard FCM, (f) SFCM, (g) FLICM, and (h) the proposed AS-FCM. Permanent water, flood area, and land are shown using consistent colors across the classification maps.
Remotesensing 18 02283 g003
Figure 4. Spatiotemporal evolution of the 2024 flood event in Dongting Lake derived from the proposed AS-FCM algorithm. The 12-scene sequence (5 May–8 October 2024) illustrates the dynamic transition between permanent water bodies (dark blue) and flood-induced inundation areas (cyan).
Remotesensing 18 02283 g004
Figure 5. Validation of bias-adjusted SWOT-derived WSE against in situ observations at the Chenglingji station.
Remotesensing 18 02283 g005
Figure 6. (a) Empirical WSE–area relationship derived from SAR inundation areas ( N = 12 ) and temporally matched water-level observations constrained by bias-adjusted SWOT and in situ gauge data. (b) Reconstructed daily inundation extent for 2024 with uncertainty bounds ( ± 1 σ and ± 2 σ ).
Remotesensing 18 02283 g006
Figure 7. Temporal evolution of WSE and inundation extent during the 2024 flood event. (a) Daily WSE and SWOT overpasses. (b) Reconstructed inundation area anomalies relative to the pre-flood baseline.
Remotesensing 18 02283 g007
Figure 8. Cumulative water storage variation of Dongting Lake in 2024 relative to the pre-flood baseline. Positive values indicate storage increase relative to the baseline condition, whereas negative values represent lower storage conditions relative to the selected reference state during the recession period.
Remotesensing 18 02283 g008
Table 1. Key system and observation parameters of the Sentinel-1 SAR instrument.
ParameterDescription/Value
SatelliteSentinel-1A
Sensor typeC-band SAR, 5.405 GHz
Acquisition modeIW (Interferometric Wide swath)
Bandwidth∼56 MHz (IW mode range bandwidth)
PolarizationVV and VH (dual polarization)
Incidence angle range 29.1 46.0 (IW mode)
Observation swath width∼250 km (IW mode, 3 sub-swaths)
Spatial resolution∼20 m × 22 m (range × azimuth, GRDH multi-look product)
Pixel spacing10 m × 10 m (GRDH grid pixel spacing)
Revisit interval12 days (single satellite)
Temporal coverage5 May–8 October 2024
Number of scenes12
Table 2. Key system and observation parameters of the SWOT KaRIn instrument.
ParameterDescription/Value
SatelliteSWOT
Sensor typeKaRIn, 35.75 GHz
Bandwidth200 MHz
Baseline length10 m
Incidence angle range 0.6 3.9 (near-nadir)
Observation swath width∼120 km (two-sided)
Azimuth spatial resolution∼5 m
Range spatial resolution∼10–60 m
Revisit interval∼21 days
Temporal coverageMay–October 2024
Number of valid SWOT LakeSP observations18
Table 3. Temporal differences among Sentinel-1 SAR acquisitions, optical reference images, and SWOT overpasses used in this study. Positive values indicate that the optical or SWOT observation was acquired after the Sentinel-1 acquisition, whereas negative values indicate acquisition before the Sentinel-1 date.
Sentinel-1 DateOptical DateOptical SensorOptical–SARSWOT DateSWOT–SAR
5 May 20241 May 2024Landsat 8/9 4 d6 May 2024 + 1 d
17 May 202416 May 2024Sentinel-2 1 d26 May 2024 + 9 d
10 June 202415 June 2024Sentinel-2 + 5 d16 June 2024 + 6 d
22 June 202418 June 2024 4 d
4 July 20245 July 2024Sentinel-2 + 1 d7 July 2024 + 3 d
16 July 202421 July 2024Landsat 8/9 + 5 d9 July 2024 7 d
28 July 202430 July 2024Sentinel-2 + 2 d28 July 20240 d
9 August 20249 August 2024Sentinel-20 d18 August 2024 + 9 d
21 August 202424 August 2024Sentinel-2 + 3 d19 August 2024 2 d
2 September 20248 September 2024Sentinel-2 + 6 d8 September 2024 + 6 d
14 September 202418 September 2024Sentinel-2 + 4 d9 September 2024 5 d
8 October 20249 October 2024Landsat 8/9 + 1 d30 September 2024 8 d
Table 4. Quantitative accuracy assessment of AS-FCM compared with benchmark methods.
MethodOARecallF1-ScoreIoUKC
Otsu Thresholding0.8120.7730.8040.6680.692
Standard FCM0.8580.8240.8420.7240.763
SFCM0.8970.8790.9030.8180.812
FLICM0.9130.9020.9170.8460.838
Proposed AS-FCM0.9360.9310.9400.8870.871
Table 5. Parameter sensitivity and ablation analysis of the proposed AS-FCM algorithm.
ConfigurationOARecallF1-ScoreIoUKC
AS-FCM baseline (final setting)0.9360.9310.9400.8870.871
Without spatial regularization0.9120.9000.9140.8420.818
Without structure-aware w i j 0.9190.9080.9210.8540.832
Fixed spatial regularization ( α i = α 0 )0.9160.9040.9180.8490.826
α 0 = 0.4 0.9220.9110.9250.8600.840
α 0 = 0.8 0.9360.9310.9400.8870.871
α 0 = 1.2 0.9240.9140.9270.8640.845
β = 0.5 0.9250.9150.9280.8660.847
β = 1.0 0.9360.9310.9400.8870.871
β = 2.0 0.9260.9160.9290.8680.849
γ = 0.5 0.9210.9100.9230.8580.837
γ = 1.0 0.9360.9310.9400.8870.871
γ = 2.0 0.9230.9130.9260.8620.842
m = 1.8 0.9270.9170.9300.8690.850
m = 2.0 0.9360.9310.9400.8870.871
m = 2.2 0.9280.9190.9310.8710.853
Window size 3 × 3 0.9240.9140.9270.8640.844
Window size 5 × 5 0.9360.9310.9400.8870.871
Window size 7 × 7 0.9200.9090.9220.8560.834
Disclaimer/Publisher’s Note: The statements, opinions and data contained in all publications are solely those of the individual author(s) and contributor(s) and not of MDPI and/or the editor(s). MDPI and/or the editor(s) disclaim responsibility for any injury to people or property resulting from any ideas, methods, instructions or products referred to in the content.