Article

Using Contemporary Global Land Cover Products to Improve Forest Mapping at the National Scale: Case Study of Poland


1
Doctoral School of Exact and Natural Sciences, Jagiellonian University, Łojasiewicza 11, 30-348 Krakow, Poland
2
Institute of Geography and Spatial Management, Faculty of Geography and Geology, Jagiellonian University, Gronostajowa 7, 30-387 Krakow, Poland
*
Author to whom correspondence should be addressed.
Remote Sens. 2026, 18(13), 2215; https://doi.org/10.3390/rs18132215
Submission received: 27 May 2026 / Revised: 27 June 2026 / Accepted: 2 July 2026 / Published: 6 July 2026
(This article belongs to the Section Earth Observation Data)

Highlights

  • Forest mapping accuracy of three global land cover products with 10 m spatial resolution: ESA World Cover (ESA WC), Esri Land Cover (ELC), Google Dynamic World (GDW), and their consistency, is variable in Poland, with high values in the western part and low values in the central and eastern part, reflecting land use and forest management patterns.
  • Merging binary forest maps from various global land cover products improves forest mapping accuracy, yet the accuracy gains are not substantial.
What are the main findings?
  • Accuracy of forest mapping by three global products tested against LUCAS data (F1 score) was equal to 68.8% for GDW, 76.9% for ESA WC and 72.2% for ELC, while Intersection over Union (IoU) indicator values measured against a binary forest map extracted from the land cover map of Poland for 2021 (S2GLC PL) were 75.2%, 82.3% and 82.6%, respectively.
  • The best accuracy of forest mapping in Poland is ensured by the delineation of forest in areas where all three global products mapped forest, and where forest was mapped only by GDW and ESA WC. Such a combination of binary forest maps has F1 against LUCAS data equal to 80.4% and IoU against S2GLC PL equal to 87.1%.
What are the implications of the main findings?
  • The tested global land cover products have adequate spatial resolution to be used in various applications at the country or regional level; however, relying on only one of them creates a risk of over- or underestimation of the forest area, as all global land cover products show spatially varied consistency and accuracy of forest mapping.
  • Merging binary forest maps from various global products is a recommended strategy to cope with locally significant uncertainties of single global products.

Abstract

Using accurate land cover data is essential to monitor land use and cover changes and assess the effectiveness of various environmental policies. This study evaluates the accuracy of contemporary global land cover products with 10 m spatial resolution, including Google’s Dynamic World (GDW), European Space Agency’s World Cover (ESA WC) and Esri Land Cover (ELC) in mapping forested areas in Poland, aiming to test an assumption if the combination of these products may improve forest mapping accuracy compared to any individual product. Three global datasets and their combinations were assessed with the 2022 EU Land Use/Cover Area Frame Survey (LUCAS). A land cover map of Poland (S2GLC PL) for 2021 served as an auxiliary reference data set. Forest cover classification accuracy was evaluated using precision, recall, and F1-score metrics, and spatial agreement of binary forest maps in the thematic global products was measured with the Intersection over Union (IoU) at two various scale levels (country and province). Our results showed that forest mapping accuracy of three global products varies for Poland, with F1-score equal to 72.2% for ELC, 76.9% for ESA WC, and 68.8% for GDW. IoU against S2GLC PL was equal to 82.6%, 82.3% and 75.2%, for ELC, ESA WC and GDW, respectively, and slightly exceeded 70.5% for three global products. A specific combination of binary forest maps from global products, where the output forest area consisted of forests mapped at the same time by all three products and forests mapped at the same time only by GDW and ESA WC yielded better accuracy indicators than any single product and other tested combinations (F1-score equal to 80.4%, and IoU against S2GLC PL equal to 87.1%).

1. Introduction

Land use and land cover changes have brought about serious global environmental issues, for instance biodiversity loss, land degradation, altered land-atmospheric interaction patterns, and the strengthening of climate change effects at various spatial scales [1]. The importance of investigating land use and land cover changes and their impacts stems, therefore, from their role in sustainable management of natural resources, as the dynamics of land use systems and resulting land cover changes influence socio-economic and environmental systems with a variety of trade-offs for socio-economic vulnerability [2,3,4,5].
During the last twenty years, the spatial resolution of land cover maps has progressed in alignment with the advancements in satellite sensor resolution [6]. Global land cover products with a high spatial resolution have been developed to allow global and regional land cover research [7]. The first generation of high resolution global land cover products utilized 30 m Landsat data and included several land cover products, for instance GlobeLand30 [8] and Global Land Analysis and Discovery (GLAD), global Land Cover and Land Use 2019 dataset [9] and a global land cover classification with a fine classification system for the year 2015 (GLC_FCS30) [10,11,12].
Since 2015, the European Space Agency (ESA) and the Copernicus Programme have provided globally uniform land cover data from the Sentinel-2 satellites, with a spatial resolution of 10 m. These new Earth observation data have been complemented by advancements in cloud computing platforms for Earth observation and machine learning algorithms [6], allowing the production of global land cover maps with 10 m spatial resolution, with the first global land cover product of 10 m generation being FROM-GLC [13]. Later on, ESA introduced the World Cover project with free access to the world land cover map (ESA WC) [14]. ESA WC 2021 is a global land cover map, with 11 thematic classes, prepared using a random forest classification algorithm [6,15]. Two other global land cover products with the spatial resolution of 10 m have been made available since the launch of Sentinel-2. The Google Dynamic World (GDW) land cover product offers global land cover maps and layers with a spatial resolution of 10 m in 9 land cover classes and is computed based on Google Earth Engine capability, accessible for the complete Sentinel-2 L1C collection since 27 June 2015 [16]. Esri published a high-resolution global land cover map with 10 m resolution (Esri Land Cover; ELC) [6,14] based on Sentinel-2 surface reflectance data in six bands, utilizing deep learning methods. Currently, ELC is available as annual layers between 2017 and 2025, with 9 thematic land cover classes [17].
As each global land cover dataset is prepared by a specific classification algorithm, there are differences between these products, and their quality differs for various land cover classes, countries and continents [6,18]. ELC and GDW have less spatial detail compared to ESA WC [18]. While 10 m spatial resolution is sufficient to analyze land cover details at an approximate spatial scale level of 1:100,000 or less, thematic detail and accuracy adjusted to the requirements of global mapping may not respond to the requirements of the local or regional analysis level. For instance, using ESA WC, ELC and FROM-GLC at a sub-national level in China contributed to problems in the heterogeneity of the classification, especially in vegetated areas [19]. Recently, Castle et al. [20] showed significant consequences of inconsistencies in global forest mapping, e.g., for assessing biomass, recommending decision trees allowing to select the best possible dataset for a specific application.
Land cover products are extremely valuable, accelerating the uptake of Earth observation (EO) data among various scientific or stakeholder groups and facilitating land cover change analysis at global and regional spatial scales, removing for their users the tedious tasks of processing and interpretation of raw satellite data. However, it is not clear whether such products can be used at a national or sub-national scale, and which product is the best in a specific region and for a specific context. Therefore, the choice of a global land cover dataset for a specific goal is not trivial due to the rapid increase in the supply of thematic products based on EO data and the plenitude of methods used in processing [20,21].
In this study, therefore, we wish to assess three contemporary global 10 m land cover products (ESA WC, GDW, ELC) to find out if combining them may increase the accuracy of forest cover delimitation at the national level in Poland, as compared to the accuracies of single products. First, we assess the accuracy of each product individually and then test the accuracy of their various combinations in forest cover mapping.
The rationale for our research aim is that the growing supply of thematic data products created using various modelling methods allows us to combine them to increase the reliability, and decrease errors and gaps in the outputs, thus improving the accuracy [22]. Such an approach shows some similarity to image fusion, frequently used to create images with higher spatial resolution, improving the information content of remote sensing products [23], yet an important difference is that thematic products are used instead of raw image data. Previous studies proved that the fusion of thematic products can create an integrated LC product where the mapping accuracy is significantly improved by combining the best of the potential maps. For instance, Li et al. [24] used various thematic products with 30 m spatial resolution and Dempster-Shafer theory of evidence to improve global land cover mapping, receiving significantly higher overall accuracy and reduced uncertainty of final output. Opravil et al. [25] assessed six land cover products for mountainous areas to improve delineation of the grassland land cover category, while Bourgoin et al. [26] proposed a method of merging a variety of land cover products to compute a global map of forests (GFC 2020), including a variety of existing forest definitions and land use contexts [26]. Fusion techniques have also been used also to improve the quality of global elevation products [27].

2. Materials and Methods

2.1. Study Area

Our study was carried out in Poland, located in Central Europe, with a range of landscapes such as uplands, mountainous areas and lowlands, and very heterogeneous mixture of different land cover types, including agricultural areas, with relatively small farms, forests, urban areas and semi-natural vegetation. Due to historical legacies and dynamic land use transitions after 1990, the complexity of land use and land cover (LULC) and its spatial pattern in Poland have increased. In particular, farmland abandonment, secondary succession and related forest expansion [28,29,30,31] contribute to difficulties in estimates of forest cover in Poland [32], thus creating an excellent case study to test the accuracy and coherence of forest mapping by global land cover products [33].

2.2. Preparation of Land Cover Products

Three contemporary datasets were chosen to study land cover change: GDW, ELC and ESA WC. For analysis, we chose the year 2021, as all three products are available for this year. As for ESA WC and ELC, we downloaded the annual layer for 2021. To obtain the 2021 GDW land cover map, in the Google Earth Engine application (https://earthengine.google.com/), we defined the time period for data processing between 1st of May 2021 and the 30th September 2021, which corresponds to the growing season in Poland [34]. We used a mode composite approach, which checks the most frequently occurring land cover class in near real-time images which have less than 35% cloudy pixels, and assigns a land cover class label accordingly [35]. Land cover classification schemes in all three products are fairly similar, yet with some differences in naming or thematic content for classes, mostly those including tree-sparse vegetation (Table 1).
Forested areas in all three products refer to one land cover category in all three products (“trees” or “tree cover”). ESA WC “tree cover” is produced by time series of cloudless mosaics using spring leaf-out, summer peak vegetation, autumn senescence and winter condition [16,36]. “Tree cover” in ESA WC includes any geographic area dominated by trees with a cover of 10% or more and/or planted with trees for afforestation purposes and plantations [37]. The ELC “trees” category includes any significant clustering of approximately 15 m or higher dense vegetation, typically with a closed or dense canopy [38]. ELC land cover is generated throughout the entire year rather than in a specific season using artificial intelligence (AI) land classification models applied to the entire Sentinel-2 scene collection of each year [39]. In GDW, the “trees” category includes primary and secondary forests, as well as large-scale plantations [35].
To have a uniform classification for a preliminary accuracy assessment, we first aggregated original land cover classes in each product into 6 classes to be thematically comparable among products (Table 2). Such a unified classification system may also decrease the confusion and overlap among classes and potential misclassification errors. Four classes (“Forest”, “Crops”, “Built-up”, “Water”) represented specific individual classes present in three analyzed products (“Trees” or “Tree cover”, “Crops” or “Cropland”, “Built”, “Built-up” or “Built area”, and “Water” or “Permanent water bodies”, respectively), while “Semi-natural vegetation” and “Other” represented various combinations of classes from the individual products. “Semi-natural vegetation” contained “Flooded vegetation”, “Rangeland”, “Shrubland”, “Shrub and scrub”, “Grassland”, “Grass”, “Herbaceous wetland” and “Moss and lichen”, while “Other” included “Snow and ice”, “Snow/Ice”, “Clouds”, “Bare”, “Bare/sparse vegetation” and “Bare Ground”. One class of ESA WC, that is “Mangrove”, is not occurring in Poland and was not included in the analysis.

2.3. Reference and Ancillary Data

For reference we used two types of data. The European Union’s Land Use/Cover Area Frame Survey (LUCAS) ground truth data for 2022 served as the primary reference data, while a land cover map of Poland (S2GLC PL) for 2021 was used as an auxiliary reference data set, allowing the comparison of areal extent of forests among various thematic products.
LUCAS offers a valuable resource for gaining detailed insights into land use and land cover for Earth Observation (EO) applications [40,41], providing necessary ground truth data. LUCAS assessments are carried out every 3 years; therefore, we used 2022 LUCAS data as this assessment is the closest to the production year of land cover products [40]. LUCAS collects detailed land cover and land use information for small and uniform polygons forming a pan-European grid with 2 km spacing. Land cover classification used in LUCAS includes 9 major land cover classes: Artificial Land, Cropland, Woodland, Grassland, Shrubland, Bare Land, Water, Wetlands, Unclassifiable [42]. There are 10,571 LUCAS polygons within the boundaries of the study area (Poland), with an area up to 0.82 ha. We converted the polygons into points using a centroid method, as centroids are less affected by geo-registration errors and decrease uncertainty at the boundaries of the polygons.
S2GLC PL is a land cover map of Poland, developed annually since 2019 by the Space Research Centre, Polish Academy of Sciences (Centrum Badań Kosmicznych PAN, CBK PAN). S2GLC PL provides information related to land cover classes in Poland based on Sentinel-2 data and utilizes methodology applied previously when developing the global land cover dataset and building the Sentinel Land Cover Map of Europe for 2017. The Sentinel Land Cover Map of Europe included 13 land cover classes with 10 m spatial resolution and an overall accuracy at the level of 86% [43]. For Poland, a similar land cover classification scheme was used except for vineyards, sclerophyllous vegetation and permanent snow-covered surfaces.
Both LUCAS land cover information and S2GLC PL data were reclassified according to the simplified 6-class scheme applied previously to three global land cover products (Table 2).
In addition, we used the official vector layer with administrative division for Poland as ancillary data (downloaded from the Polish Geoportal https://www.geoportal.gov.pl/ (accessed on 29 October 2025)).

2.4. Assessing Accuracy of Land Cover Products and Variants of Their Fusions

Firstly, using LUCAS data as a reference, we computed a confusion matrix and accuracy indicators (overall accuracy, precision, recall, F1-score) to assess the accuracy of three global products and S2GLC PL, for the simplified land cover classification scheme consisting of 6 land cover categories. S2GLC PL was assessed to check if it may serve as an auxiliary reference to further test the reliability of forest mapping in the three global products. Here, we assumed that—given the tuning of classification methods to specific Polish conditions, including also local training data reflecting land cover complexity and expert knowledge—the S2GLC PL—though based on the same source data of Sentinel-2 as the global products—should perform better than the three global products in Poland and may be used as an auxiliary reference dataset. In the next step, we recoded three global land cover maps and S2GLC PL into binary forest–non-forest maps (1 showing forest and 0 for non-forest) to focus solely on the accuracy of forest delimitation. For each binary forest–non forest map we calculated the accuracy of forest class delimitation with standard accuracy indicators using LUCAS data as a reference.
Next, we employed the Intersection over Union (IoU) metric that is used for comparison between two or more arbitrary shapes [44]. IoU is showing an area of intersection (overlap) of a specific class/shape divided by the union of area of this class/shape in tested products. By calculating the IoU against S2GLC PL, we defined first how the binary forest map derived from each global product overlaps with the forest map in S2GLC PL. Next, to assess the coherence of forest cover mapping among three global products, we computed IoU for forest maps derived from ESA WC, GDW and ELC. IoU values were computed at the country and province level. This step allowed us to check how consistent three global products are in mapping forests in Poland at two various scale levels.
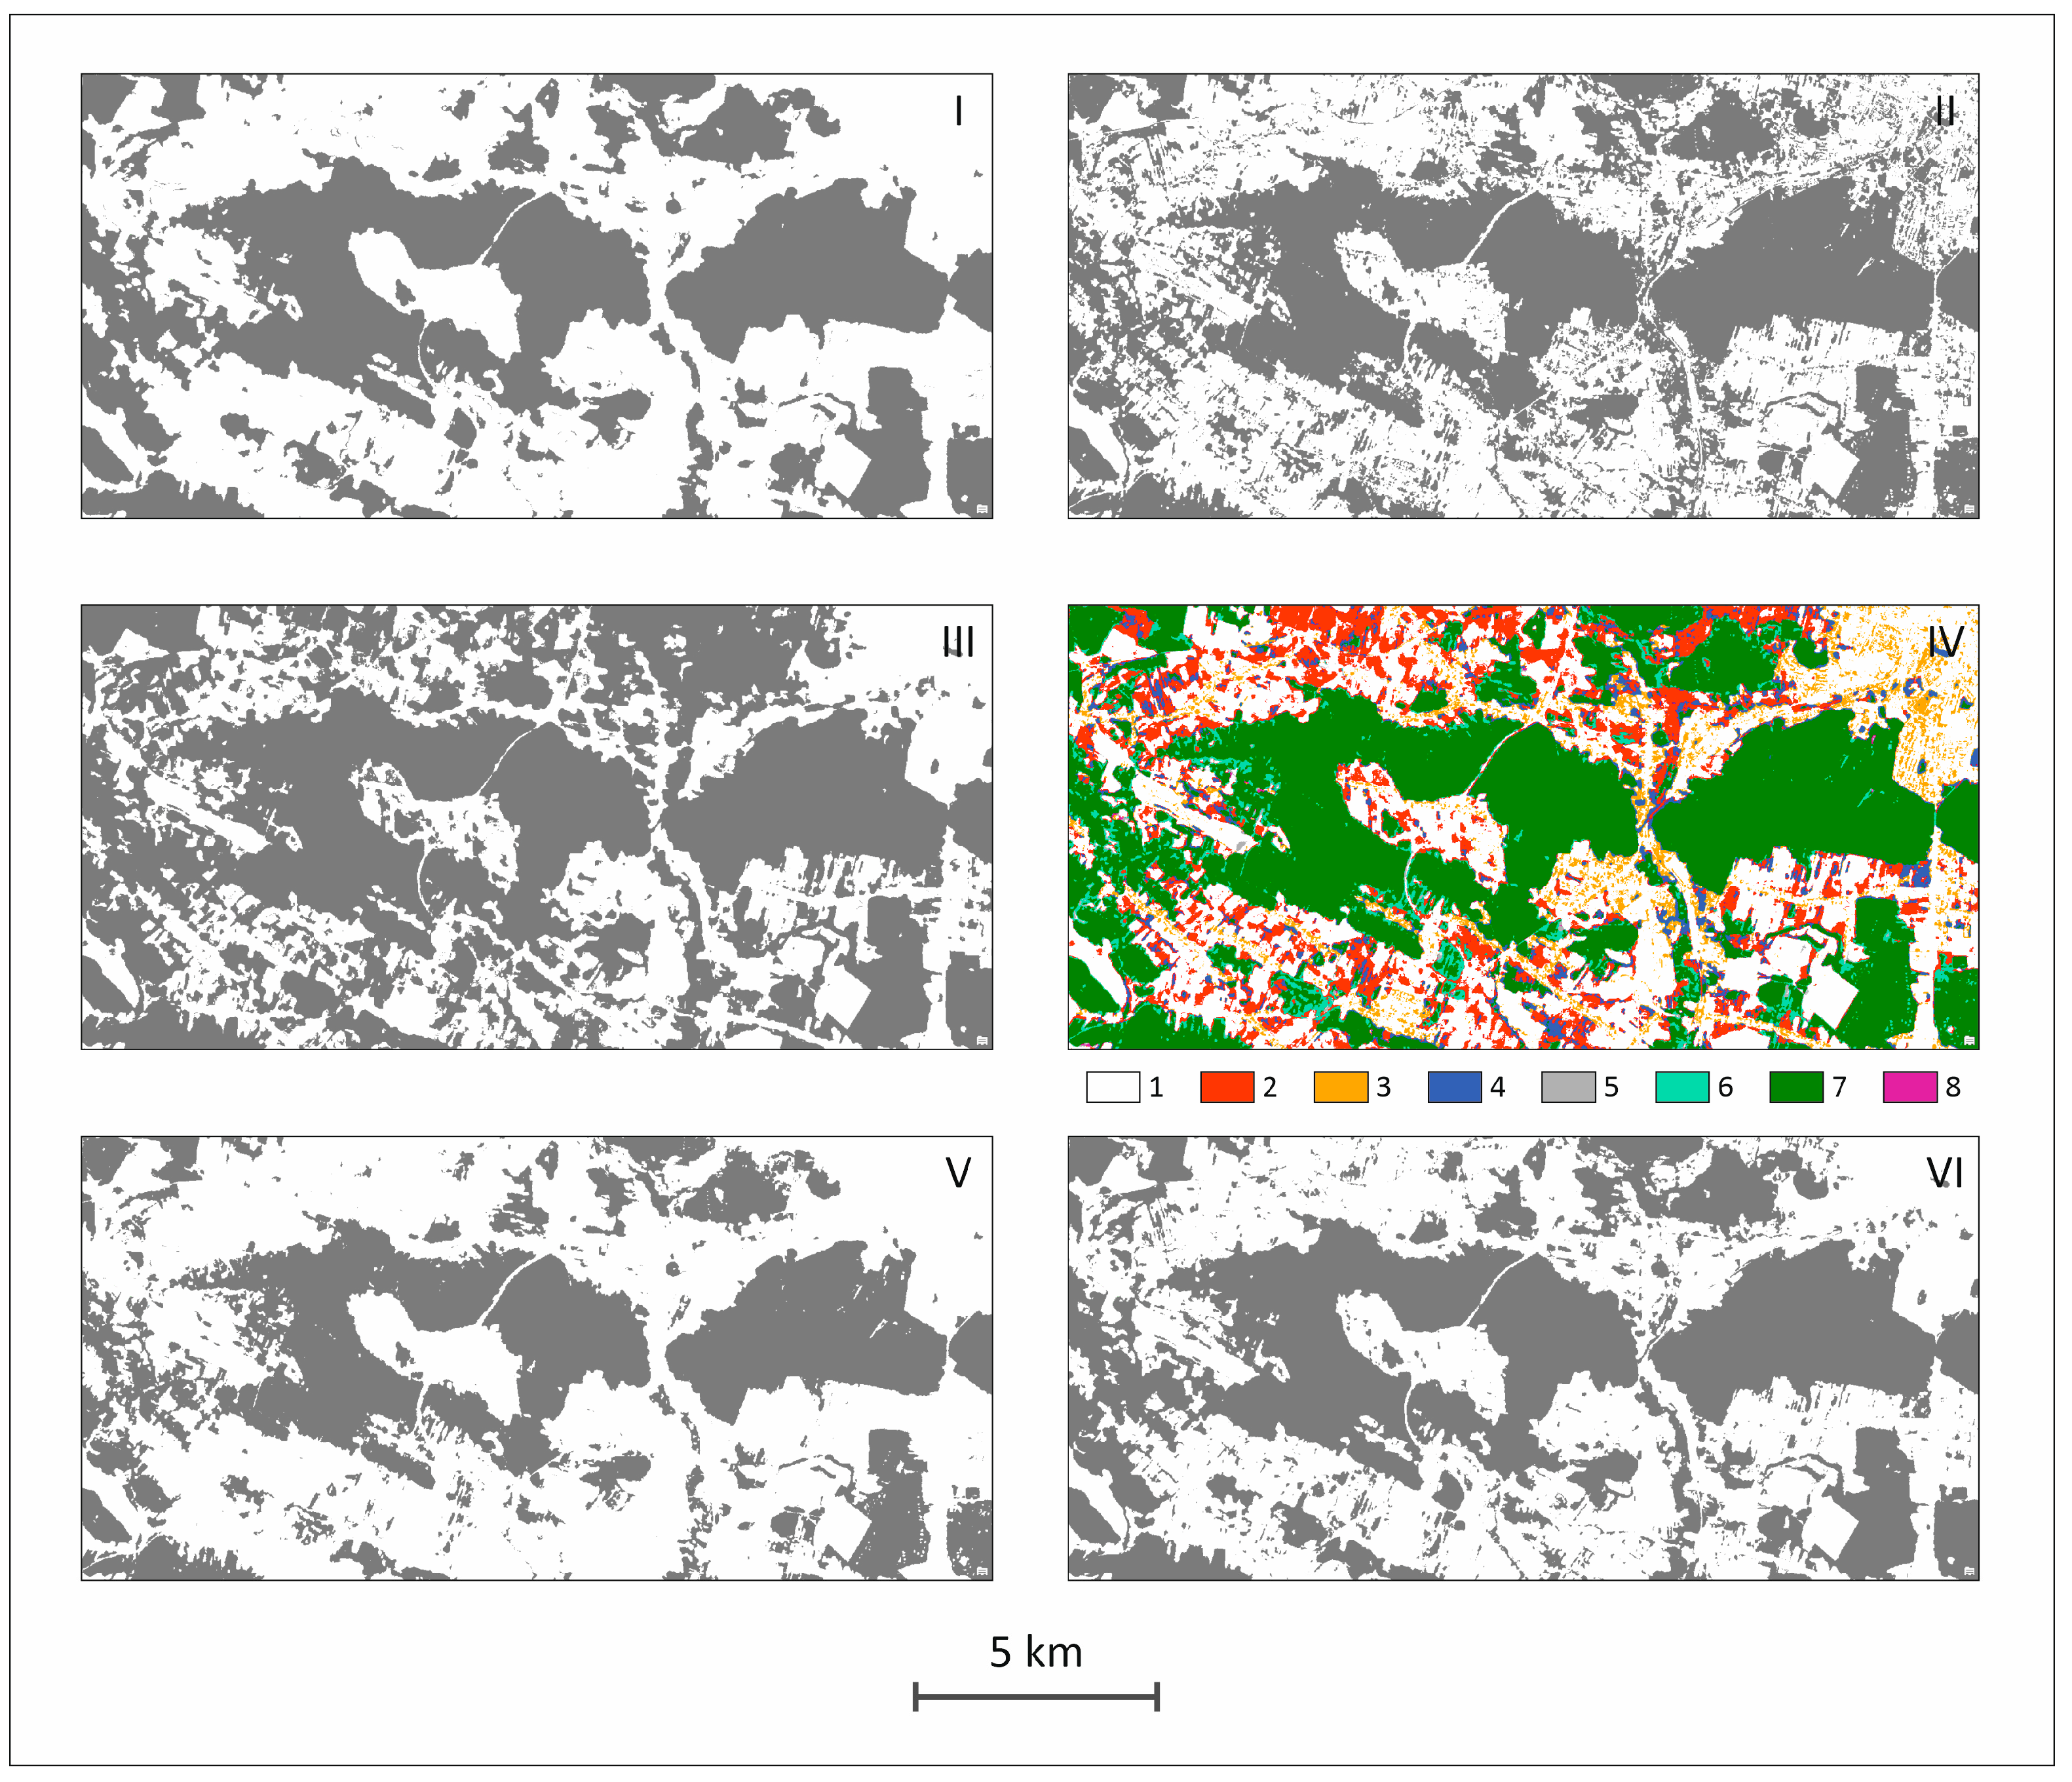
Finally, we tested how well various combinations of binary forest maps from three global products represent forests, using LUCAS data as the main reference, computing standard accuracy indicators (overall accuracy, F1-score, precision and recall), and S2GLC PL forest mask as an auxiliary reference to compute IoU for map-to-map comparisons. Based on results received in other studies [24,25], our hypothesis was that some combinations of binary forest maps derived from three global products may yield better accuracy in forest mapping than any single product. First, we computed a map overlay of binary forest maps of all three global land cover products (ESA WC, ELC, GDW), receiving the thematic layer with 8 classes depending on forest and non-forest occurrences in three products. For instance, class 4 means forest in the ESA WC and GDW product, and non-forest in ELC (Table 3, Figure 1).
We focused further analysis on combinations of classes where forest is mapped by at least two (out of three) products, as these variants may indicate a higher probability of forest occurrence. We tested the following variants resulting from the map overlay of binary forest maps (class numbers refer to Table 3, Figure 1 illustrates selected examples):
A.
forest is only where all three products show ‘forest’–class 7
B.
forest is only where all three products show ‘forest’ or ESA WC and GDW show ‘forest’–class 7 OR class 4
C.
forest is only where all three products show ‘forest’ or ELC and GDW show ‘forest’–class 7 OR class 6
D.
forest is only where all three products show ‘forest’ or ELC and ESA WC show ‘forest’–class 7 OR class 8
E.
forest is only where all three products show ‘forest’, or ESA WC and GDW show ‘forest’, or ELC and GDW show ‘forest’–class 7 OR class 4 OR class 6
F.
forest is only where all three products show ‘forest’ or ESA WC and GDW show ‘forest’ or ELC and ESA WC show ‘forest’–class 7 OR class 4 OR class 8
G.
forest is only where all three products show ‘forest’ or ELC and GDW show ‘forest’ or ELC and ESA WC show ‘forest’–class 7 OR class 6 OR class 8
H.
forest is only where all three products show ‘forest’ and any pair of three products shows ‘forest’–class 7 OR class 4 OR class 6 OR class 8

3. Results

The accuracy assessment based on LUCAS showed that overall accuracy for three global products, ESA WC, GDW and ELC is 78.6%, 67.9%, and 65.2%, respectively, and is lower than the overall accuracy of the S2GLC PL (80.1%). For the forest class, GDW has the lowest F1-score and a lower precision value compared to the other two global products, showing some underestimation of the forest area. On the other hand, S2GLC PL showed the best F1-score for the forest class, similarly to semi-natural vegetation and crops (Table 4). For defining the uncertainty of assessment metric, confidence intervals (CI) were calculated (Tables S1 and S2).
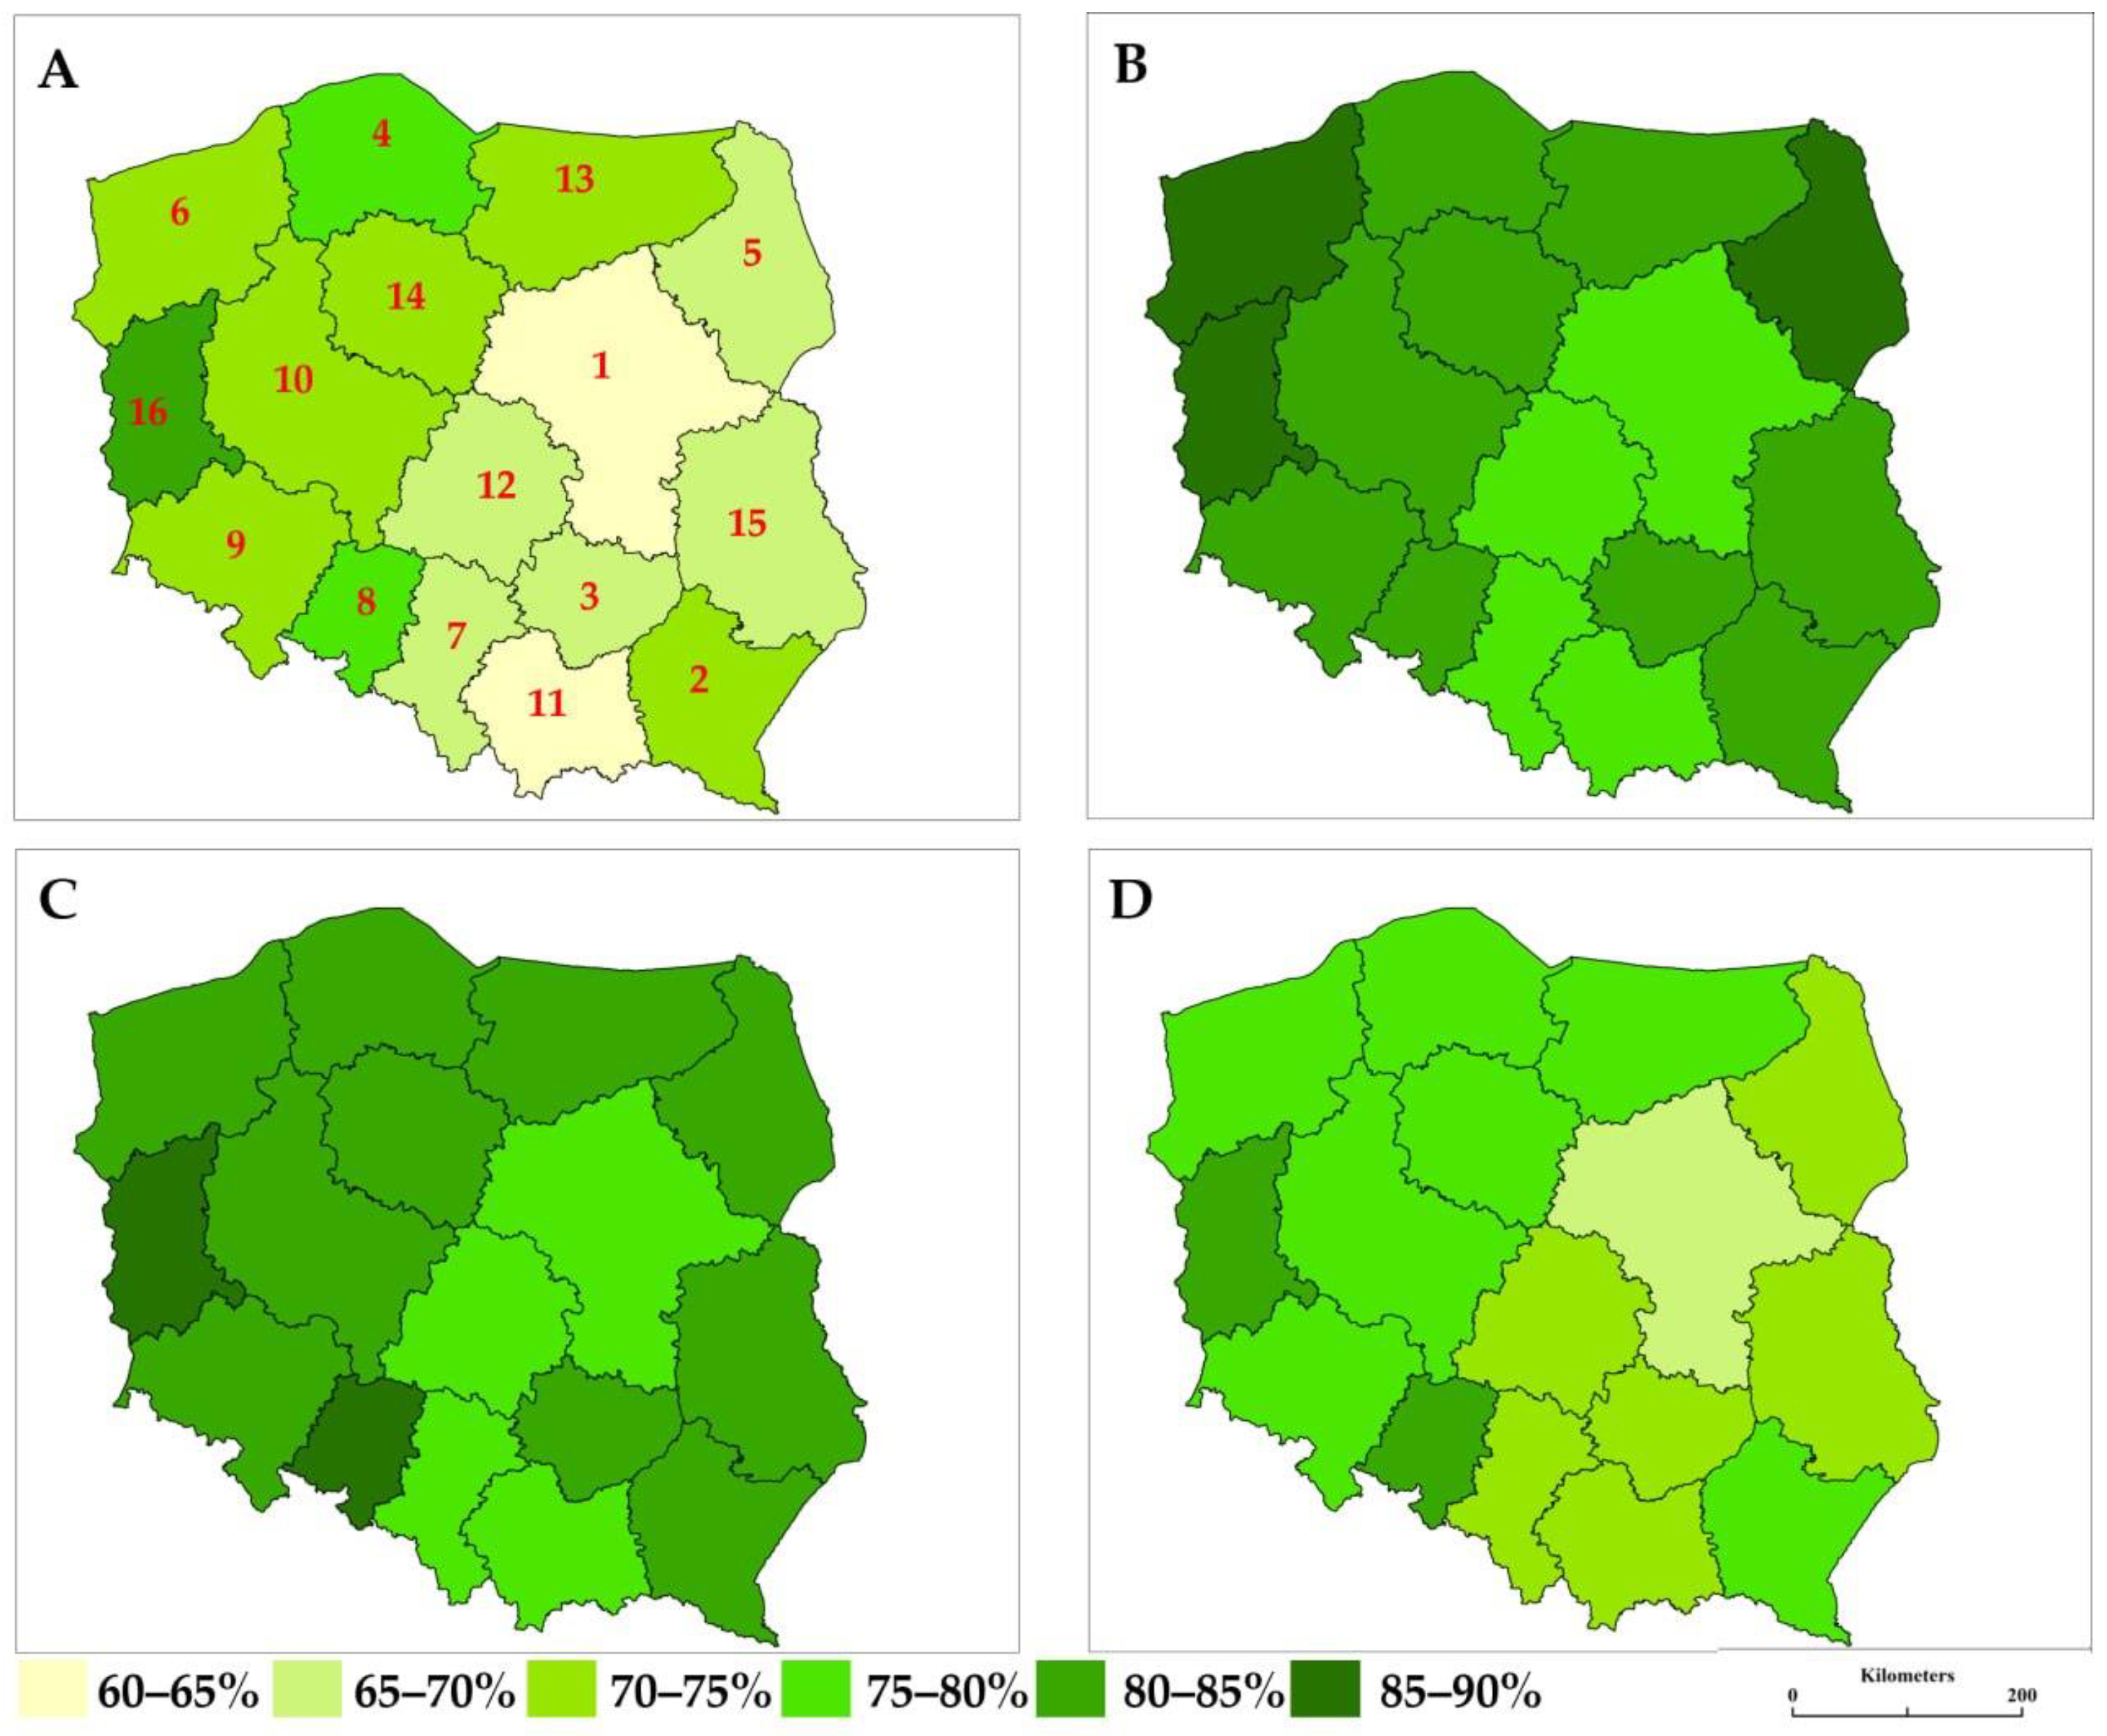
The IoU of three global products for the forest class in the entire country is 70.5%, yet it shows significant differences in Poland at the province level (Figure 2). All three products are more consistent in the western part of Poland and in the Podkarpackie province in the south-east. The highest IoU was recorded in the Lubuskie province with 81.5%, which means high overlap and good performance of forest mapping in all products in this area (Table 5). The lowest IoU was shown in the Mazowieckie province (62.7%), showing relatively low consistency of forest mapping by three global products in this province.
IoU values for one-to-one comparison of global products and S2GLC PL showed relatively high consistency of forest mapping in S2GLC PL and two global products, ESA WC and ELC, with country-level values equal to 82.3% and 82.6%, respectively, and a significantly lower value for GDW (75.2%). IoU values for provinces were varied, with the range 76.1–89.0% for ESA WC, 69.8–83.1% for GDW and 78.1–88.0% for ELC (Table 5 and Figure 2). The highest values for all three products were recorded in the Lubuskie province, while the lowest values were recorded in the provinces located in the eastern Poland.
The tested combinations of binary forest maps from three global products against LUCAS data show values of F1-score ranging from 72.5% to 80.4% (Table 6). The analysis of IoU for tested combinations of global products against S2GLC PL produced IoU values within the range from 83.1% to 87.1%. Both validation methods indicated that variant B (class 7 + class 4, that is, forest in all three products or forest in GDW and ESA WC) showed the best performance with respect to the F1-score (80.4%) and IoU (87.1%, Table 6).

4. Discussion and Conclusions

Having high quality and precise classification for different land cover products and choosing the best remote sensing datasets which suit a specific research purpose is difficult. In this study, we evaluated 3 global land cover products and tested their various combinations to find the most accurate approach to study forest cover in Poland.
First, we found out that, based on ground truth LUCAS data, S2GLC PL was the most accurate land cover product for Poland, with an overall accuracy similar to the values received in the Sentinel Land Cover Map for Europe [43] and significantly higher than for any single global land cover product. Therefore, we assume that our results justified the subsequent use of S2GLC PL as an auxiliary reference in the assessment of three global products.
For three global land cover products, our analysis, in general, confirmed findings of other studies assessing and comparing the accuracy of the global land cover products. The overall accuracy of ESA WC was 78.6%, the highest among all tested products (Table 4). Similarly, ESA WC performed best in forest mapping, with an F1-score equal to 76.9%. ELC, however, showed the best IoU for forest cover mapping against S2GLC PL (82.6%). Our results based on LUCAS data and IoU analysis also confirmed that GDW had lower accuracy and mapped forests less accurately than other tested global land cover products. Low accuracies of mapping of semi-natural vegetation stated in our work were suggested in earlier studies for various tested products [6,15,16,45].
Three global land cover products showed varied consistency of forest mapping across Poland. In our study, all global land cover products showed good agreement in the western part of Poland, especially in the Lubuskie province (81.5%), and much lower agreement (below 70%) in most of southern and eastern Poland. This is a similar finding as in Castle et al. [20], who studied global differences in forest mapping of several global land cover products and showed that the congruence of global binary forest maps decreases with the number of products, receiving an average global congruence of 73% for three forest products. The forest mapping agreement of three global products with the binary forest map derived from S2GLC PL showed a similar pattern, with the highest values in the western, and the lowest in the eastern Poland. This is due to the forest cover distribution and forest management in Poland, with higher forest cover in the western than in the eastern part of Poland. Moreover, forests located in the western part are predominantly owned by the Polish State Forests and managed for timber in relatively large and compact forest cover patches [46]. On the other hand, agricultural land abandonment and secondary forest succession, leading to problems in accurate forest classification and possibly decreasing the consistency of the three global products, are most common in the central and eastern Poland, especially since the 1980s [47]. Though recent research suggests that the rate of agricultural land abandonment in Poland decreased since EU accession in 2004 [31], various regions, especially in the central, eastern and southern Poland, still show high shares of secondary forests on former agricultural land [30,48] contributing to the uncertainties in forest cover assessments [32]. In general, our findings on IoU and its spatial pattern show significant variations in how transitional, secondary forests and other tree-covered areas are mapped by various global products, with most incongruence among the datasets noted in areas with high land abandonment rates.
Our results proved that combinations of binary forest maps from three global land cover products offer some improvements in forest mapping as compared to a single product. Variant B, with forest represented by areas where all three products show ‘forest’ or areas where only ESA WC and GDW show ‘forest’, performed the best, with F1-scores equal to 80.4%, and IoU against S2GLC PL equal to 87.1% (Table 6). Variant F, with forest represented by areas where all three products show ‘forest’ or areas where ESA WC and GDW show ‘forest’ or areas were ELC and ESA WC show forest showed only slightly lower accuracy, with F1 confidence interval significantly overlapping the interval for the variant B. While tested combinations of binary forest maps from three global products showed only a slight improvement in accuracy indicators as compared to the accuracy indicators for forest maps extracted from the best single product (ESA WC, F1-score 76.9%, ELC IoU–82.6%), they offer a relatively simple way to improve forest mapping based on existing thematic land cover products, proving the reliability of the multi-source thematic data fusion. With an increase in the number of datasets and products, further analysis by considering additional criteria or integrating more land cover products [25] is recommended to provide a deeper insight into the optimal combination of datasets. In addition, global land cover products enable incorporating additional criteria to merge binary forest maps, related, e.g., to co-occurrence and neighbourhood of other land cover categories.

Limitations of the Study

There is a potential source of disagreement between global land cover products and the reference data used in this study. While three global products use 2021 satellite data, LUCAS ground truth data were collected in 2022. This temporal mismatch could affect the accuracy metrics, yet this effect is likely very small. For instance, area of final fellings in the state-owned forests in Poland, encompassing more than ¾ of forests in Poland, was 637 km2 in 2021 [49], that is less than 1% of the area of the state-owned forests. On the other hand, changes in forest extent related to secondary succession are relatively slow, with one year gaps having very little significance. S2GLC PL, used as an auxiliary reference data set, has some limitations for this study due to the same source data used as in the case of three global land cover products. However, our study confirmed it has a relatively high accuracy, comparable according to [50] to national topographic data. It is noteworthy that in many studies, reference data were not perfect because of ambiguous land cover definitions, temporal mismatch and interpreter mistakes, yet relying on only one reference data increases the limitations and source base bias [51].

Supplementary Materials

The following supporting information can be downloaded at: https://www.mdpi.com/article/10.3390/rs18132215/s1, Table S1: LUCAS-based assessment of land cover mapping accuracy of three global products and S2GLC PL (95% CI intervals in brackets); Table S2: LUCAS-based assessment of tested variants (95% CI intervals in brackets).

Author Contributions

Conceptualization, all authors; methodology, data processing and analysis, all authors; writing—original draft preparation, M.S.; writing—review and editing, all authors; visualization and graphics, M.S.; supervision, J.K. and D.K. All authors have read and agreed to the published version of the manuscript.

Funding

This research was funded by the National Science Centre, Poland (UMO-2024/53/N/ST10/02518). For the purpose of Open Access, the author has applied a CC-BY public copyright licence to any Author Accepted Manuscript (AAM) version arising from this submission.

Data Availability Statement

Data used in the paper are available at https://doi.org/10.5281/zenodo.20816283. LUCAS data used as a reference are available at https://ec.europa.eu/eurostat/web/lucas/database/2022 (accessed on 2 September 2025) and land cover map of Poland, S2GLC PL, is available at https://nsisplatforma.polsa.gov.pl/portal (accessed on 2 September 2025).

Acknowledgments

Sincere thanks to the anonymous reviewers and members of the editorial team for their comments and contributions. We kindly acknowledge the support of Stanisław Lewiński, Space Research Centre, Polish Academy of Sciences, and Polish Space Agency in granting access to the land cover map of Poland (S2GLC PL) for 2021.

Conflicts of Interest

The authors declare no conflicts of interest.

Abbreviations

The following abbreviations are used in this manuscript:
GDWThe Google Dynamic World
ESA WCThe European Space Agency WorldCover Map
ELCEsri Land Cover
EOEarth Observation
LULCLand Use and Land Cover
LUCASEuropean Union’s Land use/Cover Area frame Survey
S2GLC PLland cover map of Poland
CIConfidence Intervals

References

  1. Auch, R.F.; Wellington, D.F.; Taylor, J.L.; Stehman, S.V.; Tollerud, H.J.; Brown, J.F.; Loveland, T.R.; Pengra, B.W.; Horton, J.A.; Zhu, Z.; et al. Conterminous United States Land-Cover Change (1985–2016): New Insights from Annual Time Series. Land 2022, 11, 298. [Google Scholar] [CrossRef]
  2. Castillo, C.; Kavalov, B.; Diogo, V.; Jacobs-Crisioni, C. Agricultural Land Abandonment in the EU Within 2015–2030; European Commission: Brussels, Belgium, 2018. [Google Scholar]
  3. Lasanta, T.; Arnáez, J.; Pascual, N.; Ruiz-Flaño, P.; Errea, M.P.; Lana-Renault, N. Space–Time Process and Drivers of Land Abandonment in Europe. CATENA 2017, 149, 810–823. [Google Scholar] [CrossRef]
  4. Ustaoglu, E.; Collier, M.J. Farmland Abandonment in Europe: An Overview of Drivers, Consequences, and Assessment of the Sustainability Implications. Environ. Rev. 2018, 26, 396–416. [Google Scholar] [CrossRef]
  5. Huang, Y.; Li, F.; Xie, H. A Scientometrics Review on Farmland Abandonment Research. Land 2020, 9, 263. [Google Scholar] [CrossRef]
  6. Venter, Z.S.; Barton, D.N.; Chakraborty, T.; Simensen, T.; Singh, G. Global 10 m Land Use Land Cover Datasets: A Comparison of Dynamic World, World Cover and Esri Land Cover. Remote Sens. 2022, 14, 4101. [Google Scholar] [CrossRef]
  7. Friedl, M.A.; Woodcock, C.E.; Olofsson, P.; Zhu, Z.; Loveland, T.; Stanimirova, R.; Arevalo, P.; Bullock, E.; Hu, K.T.; Zhang, Y.; et al. Medium Spatial Resolution Mapping of Global Land Cover and Land Cover Change Across Multiple Decades From Landsat. Front. Remote Sens. 2022, 3, 894571. [Google Scholar] [CrossRef]
  8. Chen, J.; Cao, X.; Peng, S.; Ren, H.; Chen, J.; Cao, X.; Peng, S.; Ren, H. Analysis and Applications of GlobeLand30: A Review. ISPRS Int. J. Geo-Inf. 2017, 6, 230. [Google Scholar] [CrossRef]
  9. Hansen, M.C.; Potapov, P.V.; Moore, R.; Hancher, M.; Turubanova, S.A.; Tyukavina, A.; Thau, D.; Stehman, S.V.; Goetz, S.J.; Loveland, T.R.; et al. High-Resolution Global Maps of 21st-Century Forest Cover Change. Science 2013, 342, 850–853. [Google Scholar] [CrossRef] [PubMed]
  10. Zhang, X.; Zhao, T.; Xu, H.; Liu, W.; Wang, J.; Chen, X.; Liu, L. GLC_FCS30D: The First Global 30m Land-Cover Dynamics Monitoring Product with a Fine Classification System for the Period from 1985 to 2022 Generated Using Dense-Time-Series Landsat Imagery and the Continuous Change-Detection Method. Earth Syst. Sci. Data 2024, 16, 1353–1381. [Google Scholar] [CrossRef]
  11. Zhang, X.; Liu, L.; Chen, X.; Gao, Y.; Xie, S.; Mi, J. GLC_FCS30: Global Land-Cover Product with Fine Classification System at 30 m Using Time-Series Landsat Imagery. Earth Syst. Sci. Data 2021, 13, 2753–2776. [Google Scholar] [CrossRef]
  12. Potapov, P.; Hansen, M.C.; Pickens, A.; Hernandez-Serna, A.; Tyukavina, A.; Turubanova, S.; Zalles, V.; Li, X.; Khan, A.; Stolle, F.; et al. The Global 2000-2020 Land Cover and Land Use Change Dataset Derived From the Landsat Archive: First Results. Front. Remote Sens. 2022, 3, 856903. [Google Scholar] [CrossRef]
  13. Gong, P.; Liu, H.; Zhang, M.; Li, C.; Wang, J.; Huang, H.; Clinton, N.; Ji, L.; Li, W.; Bai, Y.; et al. Stable Classification with Limited Sample: Transferring a 30-m Resolution Sample Set Collected in 2015 to Mapping 10-m Resolution Global Land Cover in 2017. Sci. Bull. 2019, 64, 370–373. [Google Scholar] [CrossRef] [PubMed]
  14. Zanaga, D.; Van De Kerchove, R.; De Keersmaecker, W.; Souverijns, N.; Brockmann, C.; Quast, R.; Wevers, J.; Grosu, A.; Paccini, A.; Vergnaud, S.; et al. ESA WorldCover 10 m 2020 V100; Zenodo: Geneva, Switzerland, 2021. [Google Scholar] [CrossRef]
  15. Duarte, D.; Fonte, C.; Costa, H.; Caetano, M. Thematic Comparison between ESA WorldCover 2020 Land Cover Product and a National Land Use Land Cover Map. Land 2023, 12, 490. [Google Scholar] [CrossRef]
  16. Brown, C.F.; Brumby, S.P.; Guzder-Williams, B.; Birch, T.; Hyde, S.B.; Mazzariello, J.; Czerwinski, W.; Pasquarella, V.J.; Haertel, R.; Ilyushchenko, S.; et al. Dynamic World, Near Real-Time Global 10 m Land Use Land Cover Mapping. Sci. Data 2022, 9, 251. [Google Scholar] [CrossRef]
  17. Esri. Sentinel-2 10 m Land Use/Land Cover Time Series (Mature Support)—Overview. Available online: https://ic.imagery1.arcgis.com/arcgis/rest/services/Sentinel2_10m_LandCover/ImageServer (accessed on 16 September 2024).
  18. Xu, P.; Tsendbazar, N.-E.; Herold, M.; De Bruin, S.; Koopmans, M.; Birch, T.; Carter, S.; Fritz, S.; Lesiv, M.; Mazur, E.; et al. Comparative Validation of Recent 10 M-Resolution Global Land Cover Maps. Remote Sens. Environ. 2024, 311, 114316. [Google Scholar] [CrossRef]
  19. Kang, J.; Yang, X.; Wang, Z.; Cheng, H.; Wang, J.; Tang, H.; Li, Y.; Bian, Z.; Bai, Z. Comparison of Three Ten Meter Land Cover Products in a Drought Region: A Case Study in Northwestern China. Land 2022, 11, 427. [Google Scholar] [CrossRef]
  20. Castle, S.E.; Newton, P.; Oldekop, J.A.; Baylis, K.; Miller, D.C. Global Forest Dataset Incongruence Creates High Uncertainties for Conservation, Climate, and Development Policy. One Earth 2026, 9, 101558. [Google Scholar] [CrossRef]
  21. Alavipanah, S.K.; Matinfar, H.R.; Emam, A.R.; Khodaei, K.; Hadji Bagheri, R.; Panah, A.Y. Criteria of Selecting Satellite Data for Studying Land Resources. Desert 2010, 15, 83–102. [Google Scholar] [CrossRef]
  22. Li, J.; Roy, D.P.; Atzberger, C.; Zhou, G. A Global Analysis of Sentinel-2A, Sentinel-2B and Landsat-8 Data Revisit Intervals and Implications for Terrestrial Monitoring. Remote Sens. 2017, 9, 902. [Google Scholar] [CrossRef]
  23. Amarsaikhan, D.; Saandar, M.; Ganzorig, M.; Blotevogel, H.H.; Egshiglen, E.; Gantuyal, R.; Nergui, B.; Enkhjargal, D. Comparison of Multisource Image Fusion Methods and Land Cover Classification. Int. J. Remote Sens. 2012, 33, 2532–2550. [Google Scholar] [CrossRef]
  24. Li, B.; Xu, X.; Liu, X.; Shi, Q.; Zhuang, H.; Cai, Y.; He, D. An Improved Global Land Cover Mapping in 2015 with 30gm Resolution (GLC-2015) Based on a Multisource Product-Fusion Approach. Earth Syst. Sci. Data 2023, 15, 2347–2373. [Google Scholar] [CrossRef]
  25. Opravil, Š.; Baumann, M.; Goga, T.; Afzali, H.; Kuemmerle, T.; Pazúr, R. Consensus Land-Cover Mapping Improves Grassland Classification in European Mountain Landscapes. Sci. Rep. 2026, 16, 8077. [Google Scholar] [CrossRef] [PubMed]
  26. Bourgoin, C.; Verhegghen, A.; Carboni, S.; Ameztoy, I.; Degreve, L.; Fritz, S.; Herold, M.; Tsendbazar, N.; Lesiv, M.; Achard, F.; et al. GFC2020: A Global Map of Forest Land Use for Year 2020 to Support the EU Deforestation Regulation. Earth Syst. Sci. Data 2026, 18, 1331–1365. [Google Scholar] [CrossRef]
  27. Ho, Y.F.; Grohmann, C.H.; Lindsay, J.; Reuter, H.I.; Parente, L.; Witjes, M.; Hengl, T. GEDTM30: Global Ensemble Digital Terrain Model at 30 m and Derived Multiscale Terrain Variables. PeerJ 2025, 13, e19673. [Google Scholar] [CrossRef] [PubMed]
  28. Kolecka, N.; Kozak, J.; Kaim, D.; Dobosz, M.; Ostafin, K.; Ostapowicz, K.; Wężyk, P.; Price, B. Understanding Farmland Abandonment in the Polish Carpathians. Appl. Geogr. 2017, 88, 62–72. [Google Scholar] [CrossRef]
  29. Kędra, M.; Szczepanek, R. Land Cover Transitions and Changing Climate Conditions in the Polish Carpathians: Assessment and Management Implications. Land Degrad. Dev. 2019, 30, 1040–1051. [Google Scholar] [CrossRef]
  30. Shahbandeh, M.; Kaim, D.; Kozak, J. The Substantial Increase of Forest Cover in Central Poland Following Extensive Land Abandonment: Szydłowiec County Case Study. Remote Sens. 2022, 14, 3852. [Google Scholar] [CrossRef]
  31. Ortyl, B.; Kasprzyk, I.; Jadczyszyn, J. Trends and Drivers of Land Abandonment in Poland Under Common Agricultural Policy. Land Use Policy 2024, 147, 107353. [Google Scholar] [CrossRef]
  32. Hoscilo, A.; Mironczuk, A.; Lewandowska, A. Determination of the Actual Forest Area in Poland Based on the Available Spatial Datasets. Sylwan 2016, 160, 627–634. [Google Scholar]
  33. Zgłobicki, W.; Gawrysiak, L.; Baran-Zgłobicka, B.; Telecka, M. Long-Term Forest Cover Changes, within an Agricultural Region, in Relation to Environmental Variables, Lubelskie Province, Eastern Poland. Environ. Earth Sci. 2016, 75, 1373. [Google Scholar] [CrossRef]
  34. Grabska-Szwagrzyk, E.; Tymińska-Czabańska, L. Sentinel-2 Time Series: A Promising Tool in Monitoring Temperate Species Spring Phenology. For. Int. J. For. Res. 2024, 97, 267–281. [Google Scholar] [CrossRef]
  35. Introduction to Dynamic World (Part 1)—Visualization and Creating Composites. Google Earth Engine. Google for Developers. Available online: https://developers.google.com/earth-engine/tutorials/community/introduction-to-dynamic-world-pt-1 (accessed on 22 May 2026).
  36. WorldCover Viewer. Available online: https://viewer.esa-worldcover.org/worldcover (accessed on 20 December 2022).
  37. Van De Kerchove, R. Product User Manual; Document Ref: WorldCover_PUM_v2.0; ESA: Paris, France, 2020. [Google Scholar]
  38. Esri. Sentinel-2 Land Cover Explorer. Available online: https://livingatlas.arcgis.com/landcoverexplorer (accessed on 21 June 2026).
  39. Esri. Land Cover. Available online: https://livingatlas.arcgis.com/landcover (accessed on 21 June 2026).
  40. Yordanov, M.; Sedano, F.; Verhegghen, A.; Strobl, P.; Zachariadis, S.; Camilleri, F.; Palmieri, A.; Eiselt, B.; Miguel Rubio Iglesias, J.; van der Velde, M. Advancements in LUCAS Copernicus 2022: Enhancing Earth Observation with Comprehensive In-Situ Data on EU Land Cover and Use. Earth Syst. Sci. Data 2023, 16, 5723–5735. [Google Scholar] [CrossRef]
  41. Ghassemi, B.; Izquierdo-Verdiguier, E.; Verhegghen, A.; Yordanov, M.; Lemoine, G.; Moreno Martínez, Á.; De Marchi, D.; van der Velde, M.; Vuolo, F.; d’Andrimont, R. European Union Crop Map 2022: Earth Observation’s 10-Meter Dive into Europe’s Crop Tapestry. Sci. Data 2024, 11, 1048. [Google Scholar] [CrossRef] [PubMed]
  42. Ballin, M.; Barcaroli, G.; Masselli, M. New LUCAS 2022 Sample and Subsamples Design—Criticalities and Solutions. Available online: https://op.europa.eu/en/publication-detail/-/publication/9113de8e-fc0f-11ec-b94a-01aa75ed71a1/language-en (accessed on 21 May 2025).
  43. Malinowski, R.; Lewiński, S.; Rybicki, M.; Gromny, E.; Jenerowicz, M.; Krupiński, M.; Nowakowski, A.; Wojtkowski, C.; Krupiński, M.; Krätzschmar, E.; et al. Automated Production of a Land Cover/Use Map of Europe Based on Sentinel-2 Imagery. Remote Sens. 2020, 12, 3523. [Google Scholar] [CrossRef]
  44. Choi, H.; Lee, H.-J.; You, H.-J.; Rhee, S.-Y.; Jeon, W.-S. Comparative Analysis of Generalized Intersection over Union and Error Matrix for Vegetation Cover Classification Assessment. Sens. Mater. 2019, 31, 3849–3858. [Google Scholar] [CrossRef]
  45. Huan, V.D. Accuracy Assessment of Land Use Land Cover LULC 2020 (ESRI) Data in Con Dao Island, Ba Ria—Vung Tau Province, Vietnam. IOP Conf. Ser. Earth Environ. Sci. 2022, 1028, 012010. [Google Scholar] [CrossRef]
  46. Zajączkowski, G.; Jabłoński, M.; Jabłoński, T.; Sikora, K.; Kowalska, A.; Małachowska, J.; Piwnicki, J. Raport o Stanie Lasów w Polsce 2021; Państwowe Gospod. Leśne Lasy Państwowe; Centrum Informacyjne Lasów Państwowych: Warsaw, Poland, 2022; p. 113. [Google Scholar]
  47. Kolecka, N. Greening Trends and Their Relationship with Agricultural Land Abandonment across Poland. Remote Sens. Environ. 2021, 257, 112340. [Google Scholar] [CrossRef]
  48. Janus, J.; Bozek, P. Land Abandonment in Poland after the Collapse of Socialism: Over a Quarter of a Century of Increasing Tree Cover on Agricultural Land. Ecol. Eng. 2019, 138, 106–117. [Google Scholar] [CrossRef]
  49. Główny Urząd Statystyczny. Rocznik Statystyczny Leśnictwa 2022 (Statistical Yearbook of Forestry); Główny Urząd Statystyczny: Warszawa/Białystok, Poland, 2022. [Google Scholar]
  50. Bihałowicz, J.; Rogula-Kozłowska, W.; Gromek, P.; Bihałowicz, J.S. What Is the Actual Composition of Specific Land Cover? An Evaluation of the Accuracy at a National Scale—Remote Sensing in comparison to topographic land cover. Remote Sens. Appl. Soc. Environ. 2024, 36, 101319. [Google Scholar] [CrossRef]
  51. Stehman, S.V.; Foody, G.M. Key Issues in Rigorous Accuracy Assessment of Land Cover Products. Remote Sens. Environ. 2019, 231, 111199. [Google Scholar] [CrossRef]
Figure 1. (I)–Esri Land Cover forest binary map; forest shown in grey; (II)–ESA WC; (III)–GDW; (IV)–overlay of binary forest maps from three global products, class numbers as in Table 3; green shows forest in all three products, white is non-forest in all three products, other colours show incongruence of binary forest maps of three products; (V)–variant A; (VI)–variant H (see text for descriptions). Central Poland, Świętokrzyskie Province.
Remotesensing 18 02215 g001
Figure 2. IoU for binary forest maps derived from the global land cover products. (A) three global products; (BD) ESA WC, ELC and GDW, respectively, against S2GLC PL. Numbers in (A) refer to provinces as in Table 5.
Remotesensing 18 02215 g002
Table 1. Global land cover products used in the study.
ProductTime PeriodLULC Classes
GDW20219 classes: Water, Trees, Grass, Flooded vegetation, Crops, Shrub and scrub, Built, Bare, Snow and ice
ESA WC202111 classes: Tree cover, Shrubland, Grassland, Cropland, Built-up, Bare/sparse vegetation, Snow and Ice, Permanent water bodies, Herbaceous Wetland, Mangrove, Moss and lichen
ELC20219 classes: Water, Trees, Flooded Vegetation, Crops, Built Area, Bare Ground, Snow/Ice, Clouds, Rangeland
Table 2. Overview of harmonized land cover classes of the global land cover products and reference datasets.
Class NameELCESA WCGDWS2GLC PLLUCAS
ForestTreesTree coverTreesBroadleaved forest, Coniferous forestCategory C: woodland
Semi-natural vegetationFlooded vegetation, RangelandShrubland, Grassland, Herbaceous Wetland, Moss and lichenGrass, Flooded vegetation, Shrub and scrubNatural grasslands, Moors, heathland and shrubs, Peat bogs and marshes, WetlandsCategory D: shrubland, Category E: grassland
Category H: wetland
CropsCropsCroplandCropsAgricultural areasCategory B: cropland
Built upBuilt areaBuilt-upBuiltArtificial surfaces Category A: buildings, greenhouses, artificial areas, non-built-up linear features
WaterWaterPermanent water bodiesWaterWater bodiesCategory G: Water
Others Bare ground, Snow/ice, CloudsBare/sparse vegetation, Snow and IceBare, Snow and iceNatural areas with no vegetationCategory F: Bareland
Table 3. Map overlay results of binary forest–non-forest classification of 3 global products.
ClassArea (km2)ELCESA WCGDW
1161,822Non-forestNon-forestNon-forest
217,714Non-forestNon-forestForest
310,349Non-forestForestNon-forest
49254Non-forestForestForest
5801ForestNon-forestNon-forest
66246ForestNon-forestForest
7106,993ForestForestForest
8444ForestForestNon-forest
Table 4. LUCAS-based assessment of land cover mapping accuracy of three global products and S2GLC PL.
Land Cover Categories / Products
ForestSemi-Natural VegetationCropsBuilt-UpWaterOthers
GDW
Precision56.6%86.1%76.4%22.6%77.6%55.6%
Recall87.5%17.6%93.0%61.5%58.5%2.0%
F168.8%29.2%83.9%33.0%66.7%3.8%
Overall accuracy 67.9%
ESA WC
Precision84.8%65.1%88.5%32.6%52.3%2.4%
Recall70.3%74.0%82.9%52.4%59.6%60.0%
F176.9%69.2%85.6%40.2%55.7%4.6%
Overall accuracy 78.6%
ELC
Precision70.1%13.5%96.1%58.5%55.4%0.0%
Recall74.5%85.5%64.8%20.4%78.3%0.0%
F172.2%23.3%77.4%30.2%64.9%0.0%
Overall accuracy 65.2%
S2GLC PL
Precision76.7%78.0%84.6%33.8%34.4%0.8%
Recall84.9%68.6%84.2%50.3%100.0%33.3%
F180.6%73.0%85.8%40.4%51.2%1.5%
Overall accuracy 80.1%
Table 5. IoU for binary forest maps in three global products and S2GLC PL, for provinces in Poland.
S2GLC PL &
Provinces3 Global ProductsESA WCGDWELC
1.Mazowieckie62.7%78.4%69.8%78.3%
2.Podkarpackie74.5%84.8%77.9%83.9%
3.Świętokrzyskie65.6%80.1%70.4%82.0%
4.Pomorskie76.0%84.4%79.7%84.7%
5.Podlaskie68.5%86.3%72.4%83.8%
6.Zachodniopomorskie73.9%85.5%75.8%84.9%
7.Śląskie67.7%78.0%73.7%79.6%
8.Opolskie76.6%83.9%81.1%85.2%
9.Dolnośląskie71.1%81.7%76.2%82.2%
10.Wielkopolskie74.6%83.4%79.9%84.4%
11.Małopolskie63.9%76.1%70.4%78.1%
12.Łódzkie65.2%78.5%72.1%79.0%
13.Warmińsko-mazurskie72.0%84.5%76.0%83.4%
14.Kujawsko-pomorskie72.6%80.1%78.7%81.9%
15.Lubelskie66.5%80.4%71.5%81.7%
16.Lubuskie81.5%89.0%83.1%88.0%
Entire country (IoU)70.5%82.3%75.2%82.6%
Table 6. Assessment of forest mapping accuracy of tested variants against LUCAS and S2GLC PL data description of tested variants—see Section 2.4.
ABCDEFGH
LUCASPrecision 84.30%79.80%76.20%83.30%73.60%79.00%75.30%73.00%
Recall 67.40%81.10%69.60%67.60%83.30%81.30%69.80%83.50%
F174.90%80.40%72.70%74.60%78.20%80.10%72.50%77.90%
S2GLC PLIoU85.90%87.10%83.20%85.80%84.50%87.00%83.10%84.40%
Disclaimer/Publisher’s Note: The statements, opinions and data contained in all publications are solely those of the individual author(s) and contributor(s) and not of MDPI and/or the editor(s). MDPI and/or the editor(s) disclaim responsibility for any injury to people or property resulting from any ideas, methods, instructions or products referred to in the content.