Article

Quantifying Landsat’s Contributions to U.S. Agricultural and Forestry Applications
by
Ellen Wengert
1,*,
Jordan Rowe
1,
Shankar Nag Ramaseri Chandra
1,
Melanie K. Vanderhoof
2,
Iris J. Garthwaite
3,
Zhuoting Wu
3,
Gregory Snyder
3,
Kimberly Casey
3,
Crista Straub
3,
Daniel Opstal
3 and
Everett Hinkley
4
1
KBR, Inc., U.S. Geological Survey, Reston, VA 20192, USA
2
Geosciences and Environmental Change Science Center, U.S. Geological Survey, Denver, CO 80225, USA
3
National Land Imaging Program, U.S. Geological Survey, Reston, VA 20192, USA
4
USDA Forest Service, 1400 Independence Ave., SW, Washington, DC 20250, USA
*
Author to whom correspondence should be addressed.
Remote Sens. 2026, 18(12), 2003; https://doi.org/10.3390/rs18122003
Submission received: 3 March 2026 / Revised: 21 May 2026 / Accepted: 10 June 2026 / Published: 16 June 2026
(This article belongs to the Section Earth Observation Data)

Highlights

What are the main findings?
  • Earth observation assessments can characterize the value of global remote sensing data.
  • Landsat-derived products provide critical support for the agriculture and forestry sectors.
What are the implications of the main findings?
  • Data collected from Earth observation assessments play an important role in demonstrating the impacts of Earth observation inputs.
  • Continued application of Landsat sensors and their derived products depends on mission continuity.

Abstract

The Landsat program has provided over 54 years of multispectral imagery, contributing vital information for agricultural and forestry scientific research and operational activities. Freely available Landsat data have enabled scientists to analyze land use patterns, assess ecological impacts, and develop strategies for sustainable management. We explored Landsat’s pivotal role through the lens of the United States Group on Earth Observations 2023 Earth Observation Assessment (EOA). The EOA included comprehensive surveys of more than 2000 federally supported Earth observation data products. We subsequently analyzed how Landsat satellite data and derived products support agricultural and forestry-related priorities compared to other Earth observation inputs. We evaluated both direct and indirect applications of the data, identifying key users across federal agencies and assessing how Landsat data contribute to critical products, services, and objectives. The results indicate that Landsat provides key information to support diverse activities across agriculture and forestry sectors, such as enhancing food supply, improving resilience to disaster and disturbance events, maximizing ecosystem productivity and conservation, and supporting regulatory requirements and decision-making. The Landsat OLI and TIRS sensors ranked 4th and 10th, respectively, out of 1171 Earth observation inputs identified in the study, underscoring their value to agriculture and forestry.

1. Introduction

Earth observation (EO) satellites and other remote sensing technologies support scientific research in agriculture and forestry by providing a global record of Earth system conditions, changes, and patterns [1,2,3]. Remote sensing data can inform risk assessments and resource management [4,5]. For example, remotely sensed data of agricultural landscapes can inform projections of crop abundance, productivity and yield and help monitor crop losses from disease and pests [5,6,7]. Applicable remote sensing technologies (e.g., aerial, satellite) are wide-ranging, including radar, microwave, thermal, lidar, hyperspectral, and multispectral sources [8,9]. Multispectral data from, for example, Landsat, Aqua and Terra Moderate Resolution Imaging Spectroradiometer (MODIS) and the National Agriculture Imaging Program (NAIP) are commonly used to predict or identify yield attributes such as crop type, plant density, leaf area index, crop phenology, leaf stress, and leaf nitrogen content [5,10]. Measuring and mapping yield-limiting attributes is vital for agronomic management and enables precision agriculture practices that improve yields [11,12,13]. Landsat, Sentinel-2, Aqua and Terra MODIS, and the Joint Polar Satellite System (JPSS) Visible Infrared Imaging Radiometer Suite (VIIRS) satellites are also used in forestry to monitor forest cover, fragmentation, deforestation, and vegetation health, as well as map shifts in land use, and quantify the impacts of disturbance events like wildland fire, insect outbreaks, and storm events [4,14,15,16]. In addition, satellite imagery is used by commercial foresters to predict tree growth and product yield by improving the precision of forest inventories [17,18]. The production of relevant data products like crop type, leaf area index, or insect outbreaks from satellite imagery often relies on additional sources of data such as ground-based weather stations, stream gages, airborne data, and field-collected datasets for product calibration and validation [19,20]. Therefore, integrating data across multiple sources and spatial scales (e.g., multiple satellites, airborne sensors, fieldwork observations) is often an important step to provide comprehensive, accurate data for decision-making and resource management [13,21].
The Landsat program has a long and rich heritage of supporting scientific and operational applications [22,23,24]. The program provides the longest continuous record of EOs (1972-present), providing users with imagery free of cost since 2008 to document surface conditions and ecological trends over the past 50+ years [25,26]. Landsat sensors have been widely used, for example, to track anthropogenic changes in forests from harvesting and mining and transitions to urban and agricultural uses, as well as natural agents of change, including fire, insect outbreaks, and drought [25,27]. A large number of commercial satellites also rely on Landsat for calibration and reference [28,29,30]. In recent decades, the number of EO satellites and other remote sensing assets has rapidly increased, providing data scientists and end users with many more EO sensors and products to potentially utilize. The increased availability of EO satellites and the products derived from them provide invaluable opportunities to inform decision-making and management within the agricultural and forestry sectors [10,31]. However, the cost of launching a satellite mission and delivering its data [32,33] has also accelerated the need to systematically assess the benefit, value, data quality, and relative contribution of different Earth observation inputs (EOI) (e.g., satellite data, airborne data) for meeting societal needs [22,24,28,34,35].
The 2010 NASA Authorization Act instructed the Director of the U.S. Office of Science and Technology Policy (OSTP) to establish a new mechanism to ensure greater coordination of civilian EOs. OSTP established a process for a U.S. government-wide assessment of the Nation’s EO portfolio, resulting in the first Earth observation assessment (EOA) (Table A1) in 2012 and a second in 2016, both of which supported the National Plan for Civil Earth Observations [36,37]. The intention of the EOA was to evaluate the nation’s civil EO portfolio and the data and information that it produces as it supports a suite of societal benefits. The EOA quantitatively assesses how an active portfolio of EO data and products enables critical science research and operational activities (e.g., tracking crop types and crop condition, mapping wildfire and insect disturbance) for society. The assessment also reveals direct and indirect dependencies among data products and quantifies the impact of a potential loss of products and the EOIs that they depend on.
The most common comparable method type to the EOA is a traditional literature review. Literature reviews summarizing the remote sensing of agriculture and forestry are common and provide either an in-depth but informal summary of the literature (e.g., [6,10,31,38]) or provide a more systematic review, for instance, following the Preferred Reporting Items for Systematic Reviews and Meta-Analyses (PRISMA) method [39]. In PRISMA analyses, paper counts are typically used as data points [3,5,7,8,9,27]. Both literature approaches evaluate trends and patterns based on subject prevalence in the literature, therefore using published literature as an indirect proxy to reflect the relative frequency of interest, use and application. However, the abundance of a sensor in the literature may or may not reflect the adoption of that sensor by operational, national-scale products and projects, making it difficult to measure the benefit, value and relative contribution from literature reviews alone. In contrast, hierarchical value trees have been used to inform decision-making by breaking down a complex problem into a hierarchy of goals, criteria, and measurable attributes, although such efforts are sparse in the literature [35,40,41]. The EOA measures impact using a hierarchical value tree and relies on a survey of key national EO-based products and projects, instead of paper counts, to measure relative impact. This source of data, therefore, provides the means to analyze the relative impact of sensors in a manner distinct from, but complementary to, more traditional literature reviews.
In this study, we sought to leverage the EOA’s extensive data to provide a novel quantification of Landsat’s contributions to agriculture and forestry applications within the United States. While our data and analysis are focused on the United States, the framework presented can be replicated in other countries or globally to provide an alternative (i.e., to a literature review) means to measure the impact of a remote sensing mission or program. More specifically, we utilized data from the 2023 EOA and focused on the “Agriculture and Forestry” Societal Benefit Area (SBA) to understand the role of the Landsat mission in these sectors. A number of previous publications have focused on the Landsat mission but were intended to share Landsat program plans [42,43], provide summaries of Landsat program changes and updates [23,26], summarize Landsat product suites [22,44], or provide case studies and literature reviews of Landsat applications [13,26,45]. In contrast, by surveying national and operational EO products and projects, our analysis provides a novel understanding of the current direct and indirect impacts of Landsat to support national and operational agriculture and forestry products and projects within the U.S. Our objective was to assess the performance of Landsat 8 and 9, the Operational Land Imager (Landsat 8 OLI, Landsat 9 OLI-2) and Thermal Infrared Sensor (Landsat 8 TIRS-2, Landsat 9 TIRS-2), herein “Landsat OLI and TIRS”, the usage of Landsat science products, and the usage of products derived from Landsat (e.g., National Land Cover Database (NLCD)) using data and analysis conducted during the EOA. Our research questions included:
  • How does Landsat contribute to meeting U.S. agricultural and forestry objectives compared to other Earth observation inputs?
  • What levels of Landsat products (level 1, level 2, level 3, level 4) provide the greatest value to federal agencies?
  • What limitations do Landsat users encounter, and how might they affect the future role of Landsat in agriculture and forestry?

2. Materials and Methods

2.1. Assessment Team and Value Tree Structure

The EOA measures the effectiveness of EOIs in meeting the U.S. federal government objectives identified within SBAs or broad categories that have significant impacts on human well-being, resilience, and quality of life (e.g., energy and mineral resources, transportation, disasters, water resources). The assessment was conducted by the staff of interagency partners, including the U.S. Geological Survey (USGS), the National Oceanic and Atmospheric Administration (NOAA), and OSTP, referred to as the assessment team. The assessment team gathered the foundational data on the Agriculture and Forestry SBA, herein “assessment”, by surveying EO data use from subject matter experts (SMEs) across the U.S. federal government. While EO data producers and users span multiple sectors, the focus of this assessment was to evaluate how EOIs currently meet federal government objectives related to agriculture and forestry (Table A2). The SBA team, comprised of 29 federal technical experts representing 14 federal agencies, was responsible for constructing the assessment value tree. The SBA team selection was designed to ensure broad representation of expertise (e.g., across agencies and topic areas) as well as representation of both researchers and agency programmatic personnel.
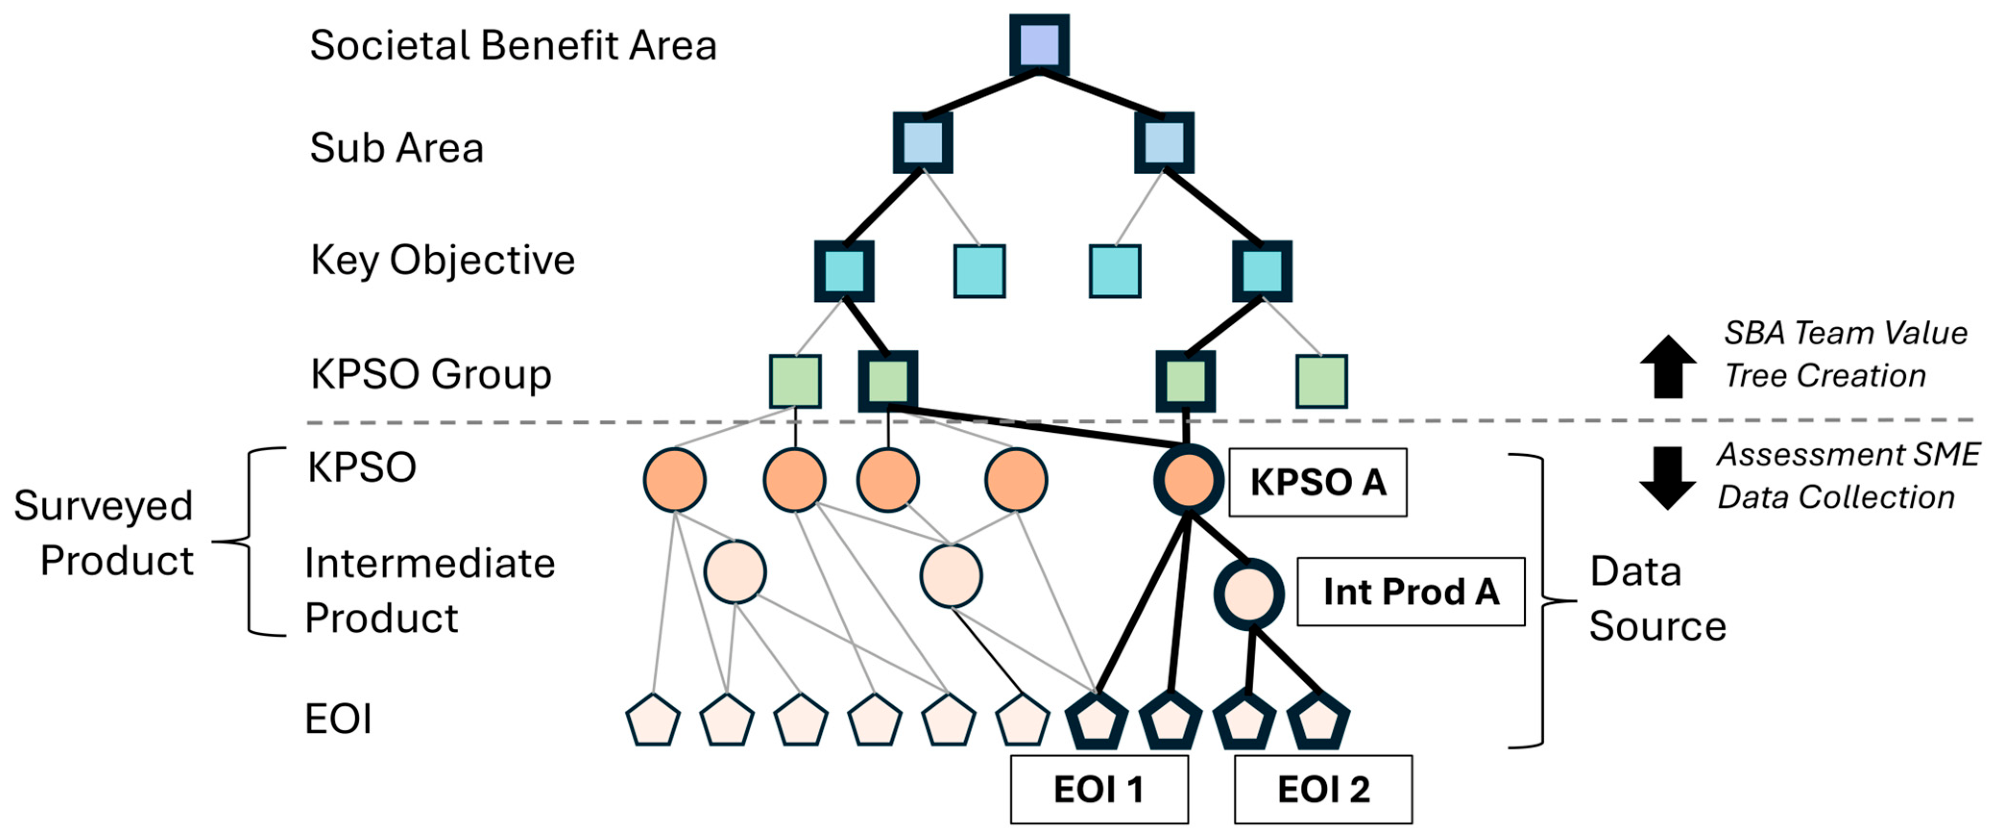
The SBA was modeled as a value tree, an organizational hierarchy [46] (2023 EOA Overview and Methodology, 2024), that demonstrates how individual EOIs connect to a societal benefit made up of nodes. At the top of the value tree is the SBA, followed by the sub-area, key objectives (KO), key product, service, or outcome group (KPSO Group), and individual KPSOs (Figure 1, Table 1). The four topical focus areas (i.e., sub-areas) of the assessment, as defined by the SBA team, included (1) enhancing food supply, (2) improving resilience to disaster and disturbance events, (3) maximizing productivity and conserving ecosystem condition, and (4) supporting regulatory requirements and evidence-based decision-making (Table A2).
In an EOA, three main groups are essential for building the value tree: the assessment team, which consisted of trained analysts who facilitate and manage the assessment process; the SBA team, comprised of subject matter experts from various federal organizations with specialized knowledge in a particular Societal Benefit Area (e.g., agriculture, forestry); and the assessment SMEs, who are federal product owners (i.e., product or project leads) and were surveyed on the product(s) that they developed or are responsible for maintaining or producing. As the product leads, the assessment SMEs were able to accurately identify and detail the required inputs to their surveyed product(s). The assessment team facilitated the process by which the SBA team created the value tree and subsequently surveyed assessment SMEs to identify the supporting data sources and EOIs for each KPSO (Table 1).

2.2. Data Collection

The goal of an EOA is to (1) construct a value tree demonstrating linkages of societal benefits to products and (2) conduct surveys quantitatively breaking down key products into supporting data sources using an elicitation scoring methodology (i.e., surveyed products). In the fall of 2022, the 29-member SBA team used collaborative consensus to identify 22 KOs that supported the four agriculture and forestry sub-areas (Table A2) to begin constructing the value tree. Agreement and consensus were achieved through team discussions, iterative comment periods, and revisions. The SBA team then identified 208 KPSOs that aligned with one or more KOs. The KPSOs were identified through engagement with representatives from, but not limited to, the National Aeronautics and Space Administration (NASA), NOAA, Department of Agriculture (USDA), U.S. Forest Service (USFS), Natural Resources Conservation Service (NRCS), Department of the Interior (DOI), USGS, Bureau of Land Management (BLM), Fish and Wildlife Service (FWS), National Park Service (NPS), and the Environmental Protection Agency (EPA). The KPSOs included federally produced products (e.g., GOES-R Land Surface Temperature), products facilitated by federal partners (e.g., MODIS burned area), or national networks (e.g., Long-Term Agroecosystem Research (LTAR)). The SBA team prioritized KPSOs that are produced as operational products, defined as routinely generated, publicly available outputs with established user adoption and repeatable production workflows, while generally excluding one-off or prototype research products. Additionally, they prioritized products covering U.S. lands exclusively but also included some global products. The assessment team acknowledges that, despite their efforts, some limitations in the completeness of KPSO product identification likely remained.
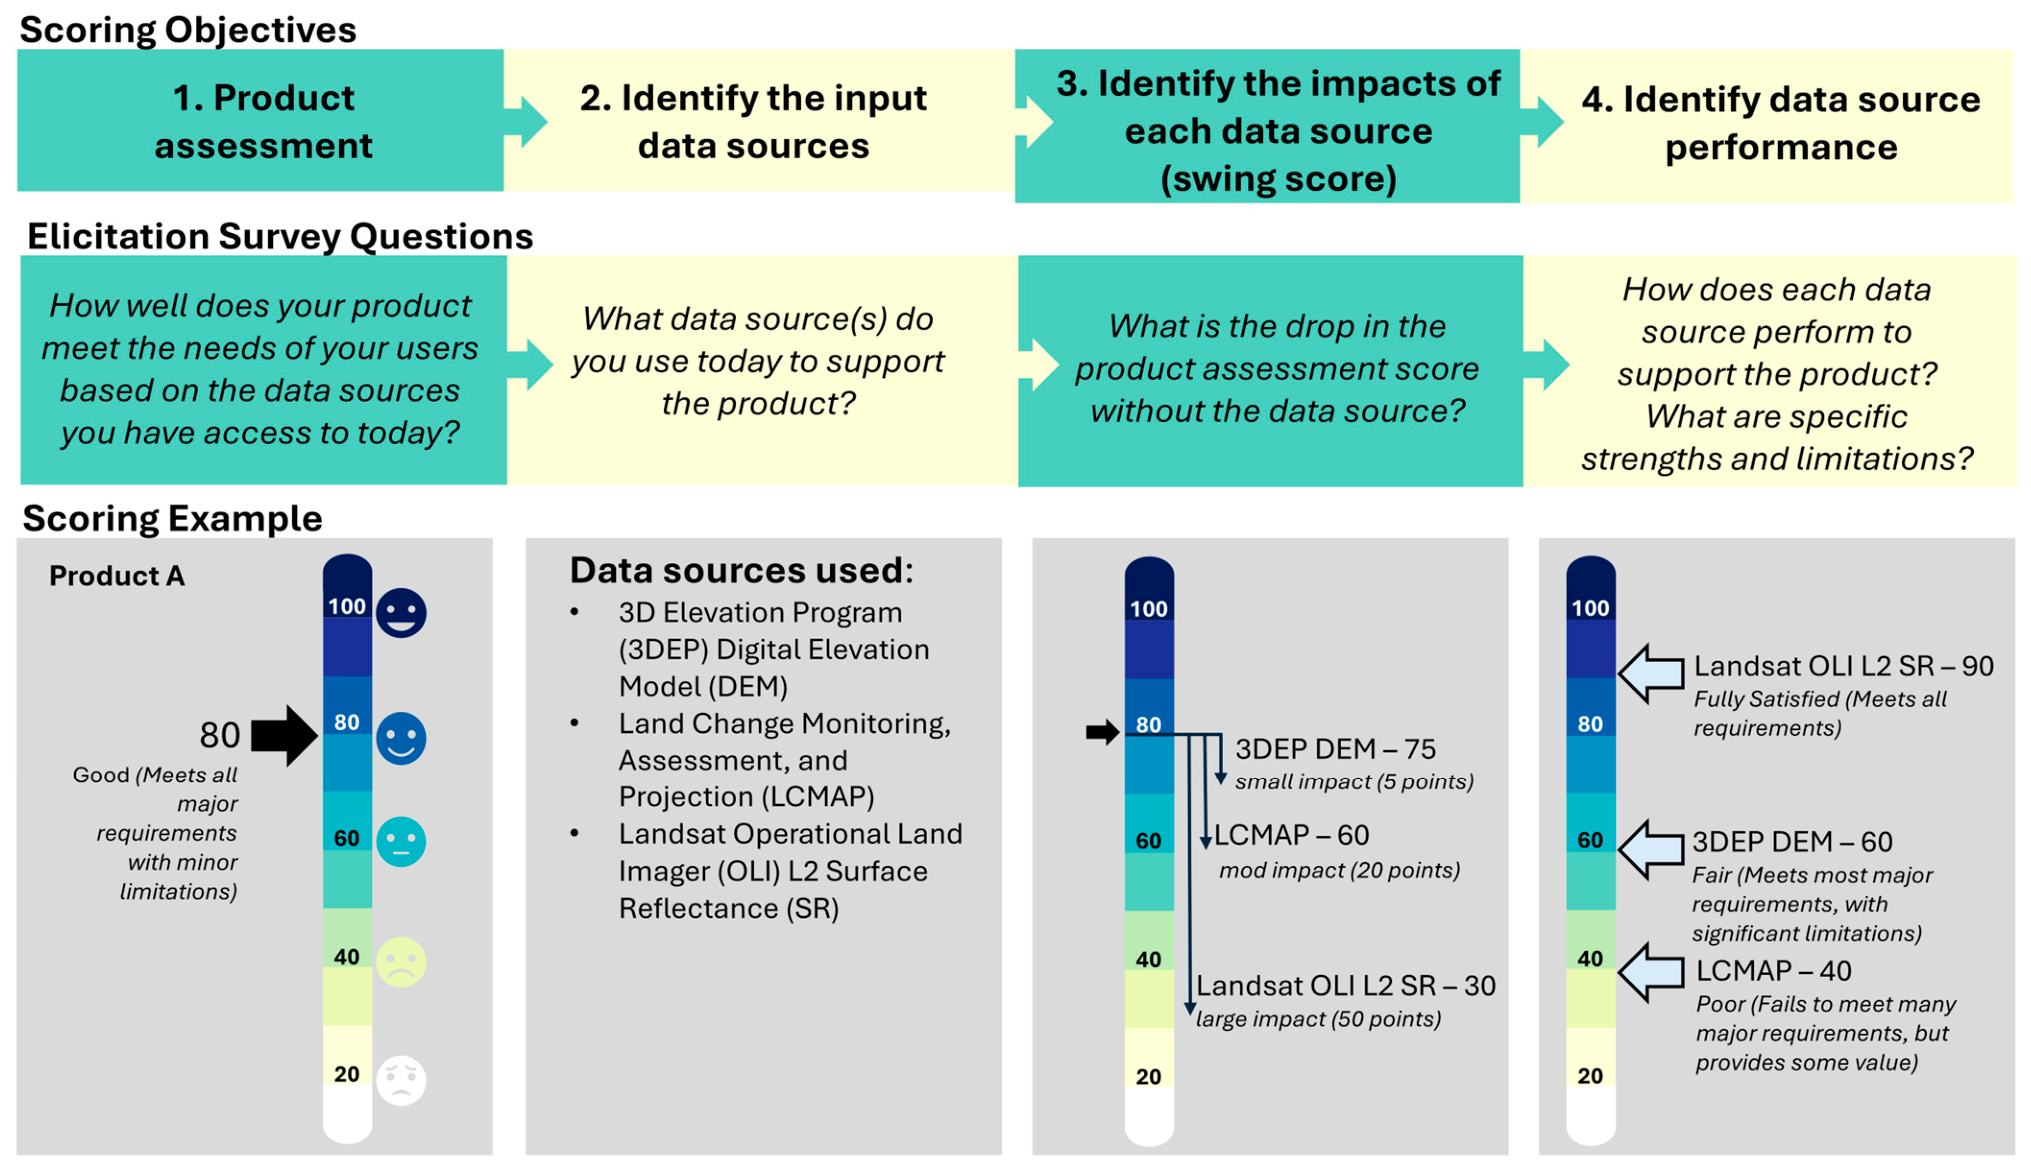
The assessment team used assessment SME elicitations, the standardized performance scale (0–100) (Table 2) and swing weighting to survey products. The assessment team interviewed a total of 647 assessment SMEs (i.e., product owners) between December 2022 and December 2023. The elicitations predominantly occurred virtually and, on average, lasted one hour each. The assessment team asked the assessment SMEs to use the performance scale to score each product’s performance (i.e., product assessment score). The assessment SMEs were also asked to provide a swing score for each data source used in producing the product. The swing score measured the importance of a data source by estimating the drop in the product assessment score if that data source was unavailable to the assessment SME (Figure 2). For example, if “removing” Landsat OLI L2 Surface Reflectance causes a significant decrease in satisfaction (i.e., a large score drop), it indicates a high impact on project success. To ensure consistency in results, the assessment team used a structured elicitation script to conduct all data collection. The assessment team then asked the assessment SMEs to use the performance scale to describe their satisfaction with each data source, including an elicitation of data source strengths and limitations. The assessment team surveyed the products following a top-down approach, starting with the KPSO, then any products the KPSOs used as data sources. The process was repeated until the products were fully broken down into their EOIs.
The assessment team used the elicitation data to construct the bottom half of the value tree (Table 1). Multiple data sources and EOIs typically contributed to a given product (Figure 1). Within each KO, KPSOs were further categorized into KPSO groups (n = 84), representing the same category or class of information products or research outcomes (e.g., soil moisture products, drought products, irrigation monitoring, forest burned area and fire severity, urban forest resources). The KPSO groupings helped reduce uncertainty related to any incompleteness within the individual KPSOs.
The EOA further categorizes data sources as indirect or direct contributors to a given product. If the SME identified the data source as an input to their product, this indicated that a data source directly contributed to a surveyed product. While SMEs generally captured all upstream data sources during the elicitations, there were cases when a data source was not identified by the assessment SME but was known to be an indirect contributor through the value tree structure (Figure 1). For example, Landsat OLI and the 3D Elevation Program (3DEP) support Rangeland Condition Monitoring Assessment and Projection (RCMAP) directly, and airborne lidar indirectly supports RCMAP through 3DEP. In this real data example, 3DEP is also a direct input to RCMAP. Additionally, we used the term “project” to refer to a set of products produced under a single entity, supporting the same science effort. For example, the USGS LANDFIRE program has over 30 individual products; however, all of these products work toward the goals of the LANDFIRE project.

2.3. Analysis

The assessment team used the Portfolio Analysis Machine (PALMA) application version 1.72 beta 7ac developed by The Mitre Corporation (McLean, VA U.S.) [47] and a value tree modeling approach [48,49] to quantify the impact of each EOI on all nodes in the value tree. The PALMA application calculated an impact score of an EOI by removing said EOI from the value tree and determining the drop in performance on all other nodes in the tree. This impact score indicated the relative influence or contribution level an EOI has in supporting the production of a given node (e.g., product, KPSO, KO, sub-area, SBA) compared to any other input.
Although the assessment team collected value tree data for this EOA irrespective of any specific satellite mission, the USGS supports the collection and delivery of Landsat imagery and the development of products, including vegetation characterization, derived from Landsat. Therefore, understanding the relative impact of Landsat to support the Agriculture and Forestry SBA is of high interest. For this analysis, we focused on Landsat data and products, including USGS-produced level 1, 2, and 3 science products [50] and a specific analysis of a Landsat-based land cover dataset, NLCD [51], to demonstrate Landsat’s value through level 4 Landsat science products (Table A3). Landsat level 1 products represent data with precision and terrain corrections applied. Landsat level 2 products are level 1 products that have been converted to surface reflectance. Landsat level 3 products are operational data products produced from level 2 products and include (1) Dynamic Surface Water Extent, (2) burned area, and (3) provisional actual evapotranspiration (Table A3). Lastly, Landsat level 4 products represent science products that rely at least in part on Landsat imagery. The assessment team noted that the EOA weighting process relied on the assessment of SME-identified product and EOI weights, and the corresponding relative impact scores, and did not include any cost analysis. Additional details on how the EOA was conducted can be found at the EOA Methods Guide on the USGEO website [46].

3. Results

3.1. Landsat Is a Key Contributor to Agriculture and Forestry

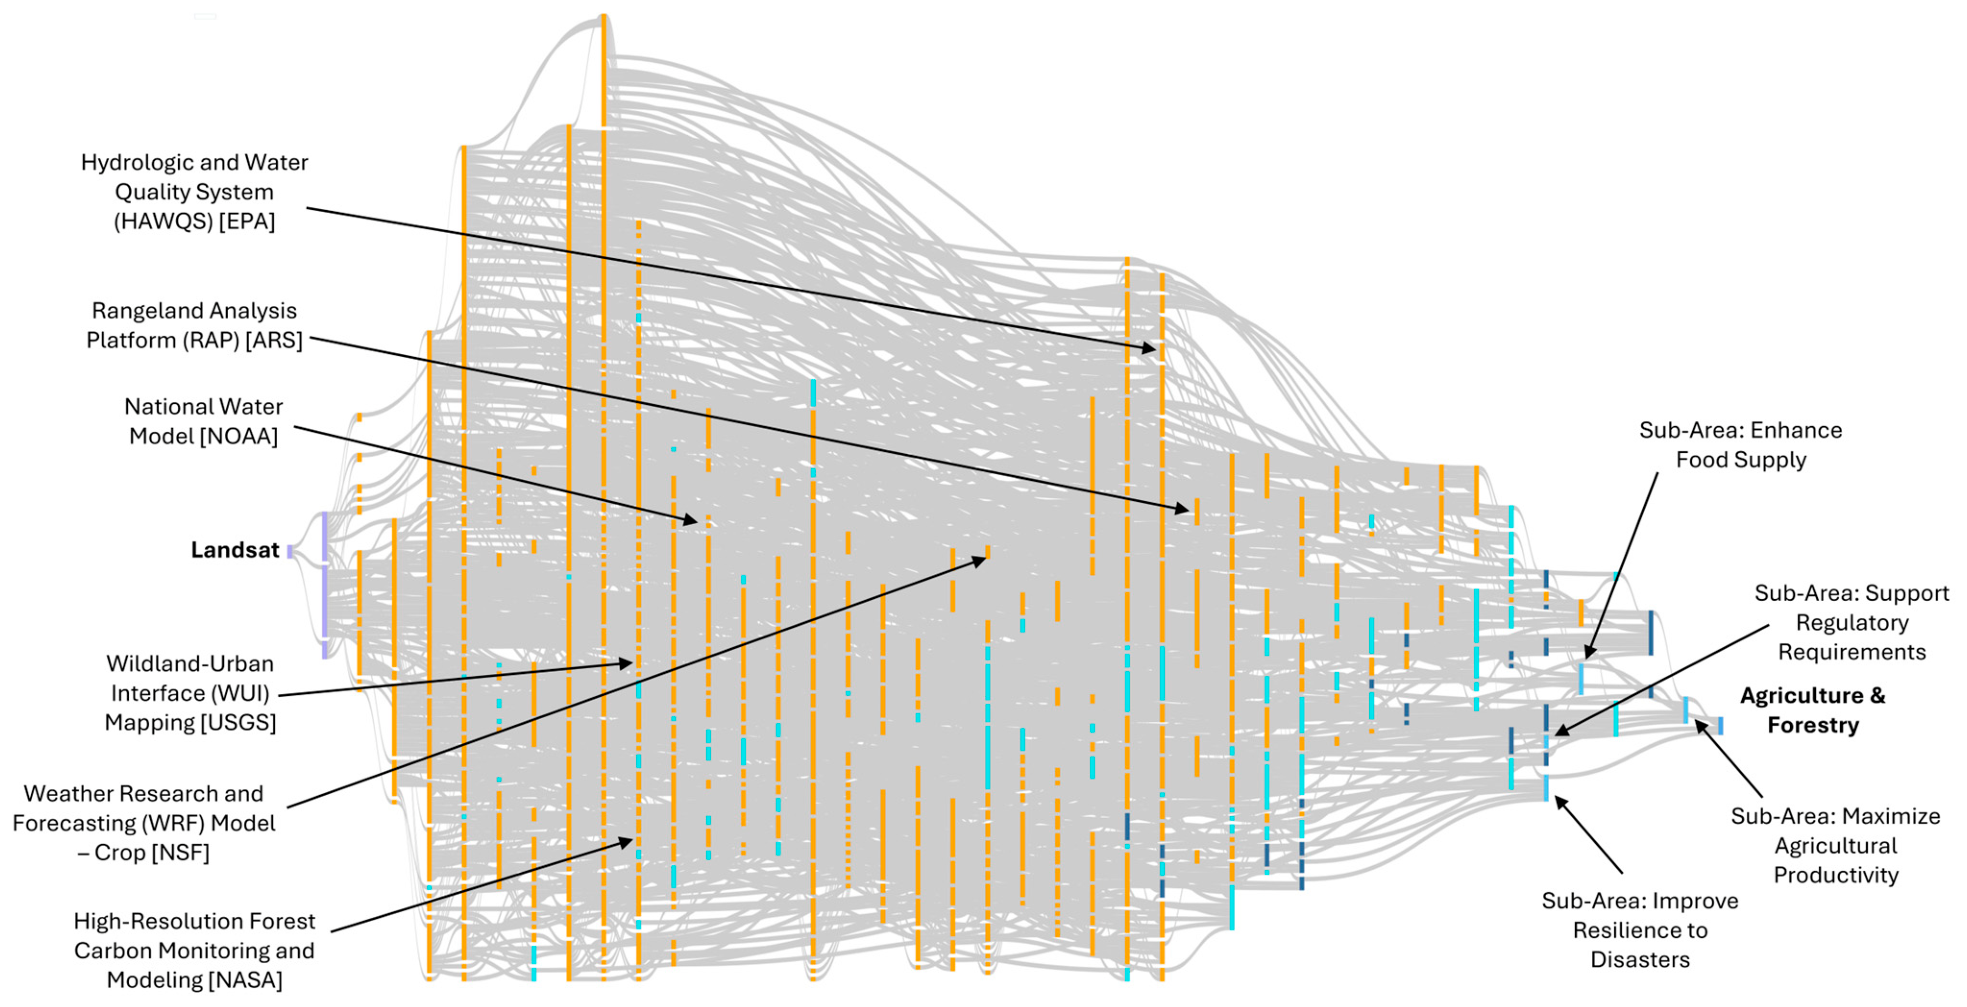
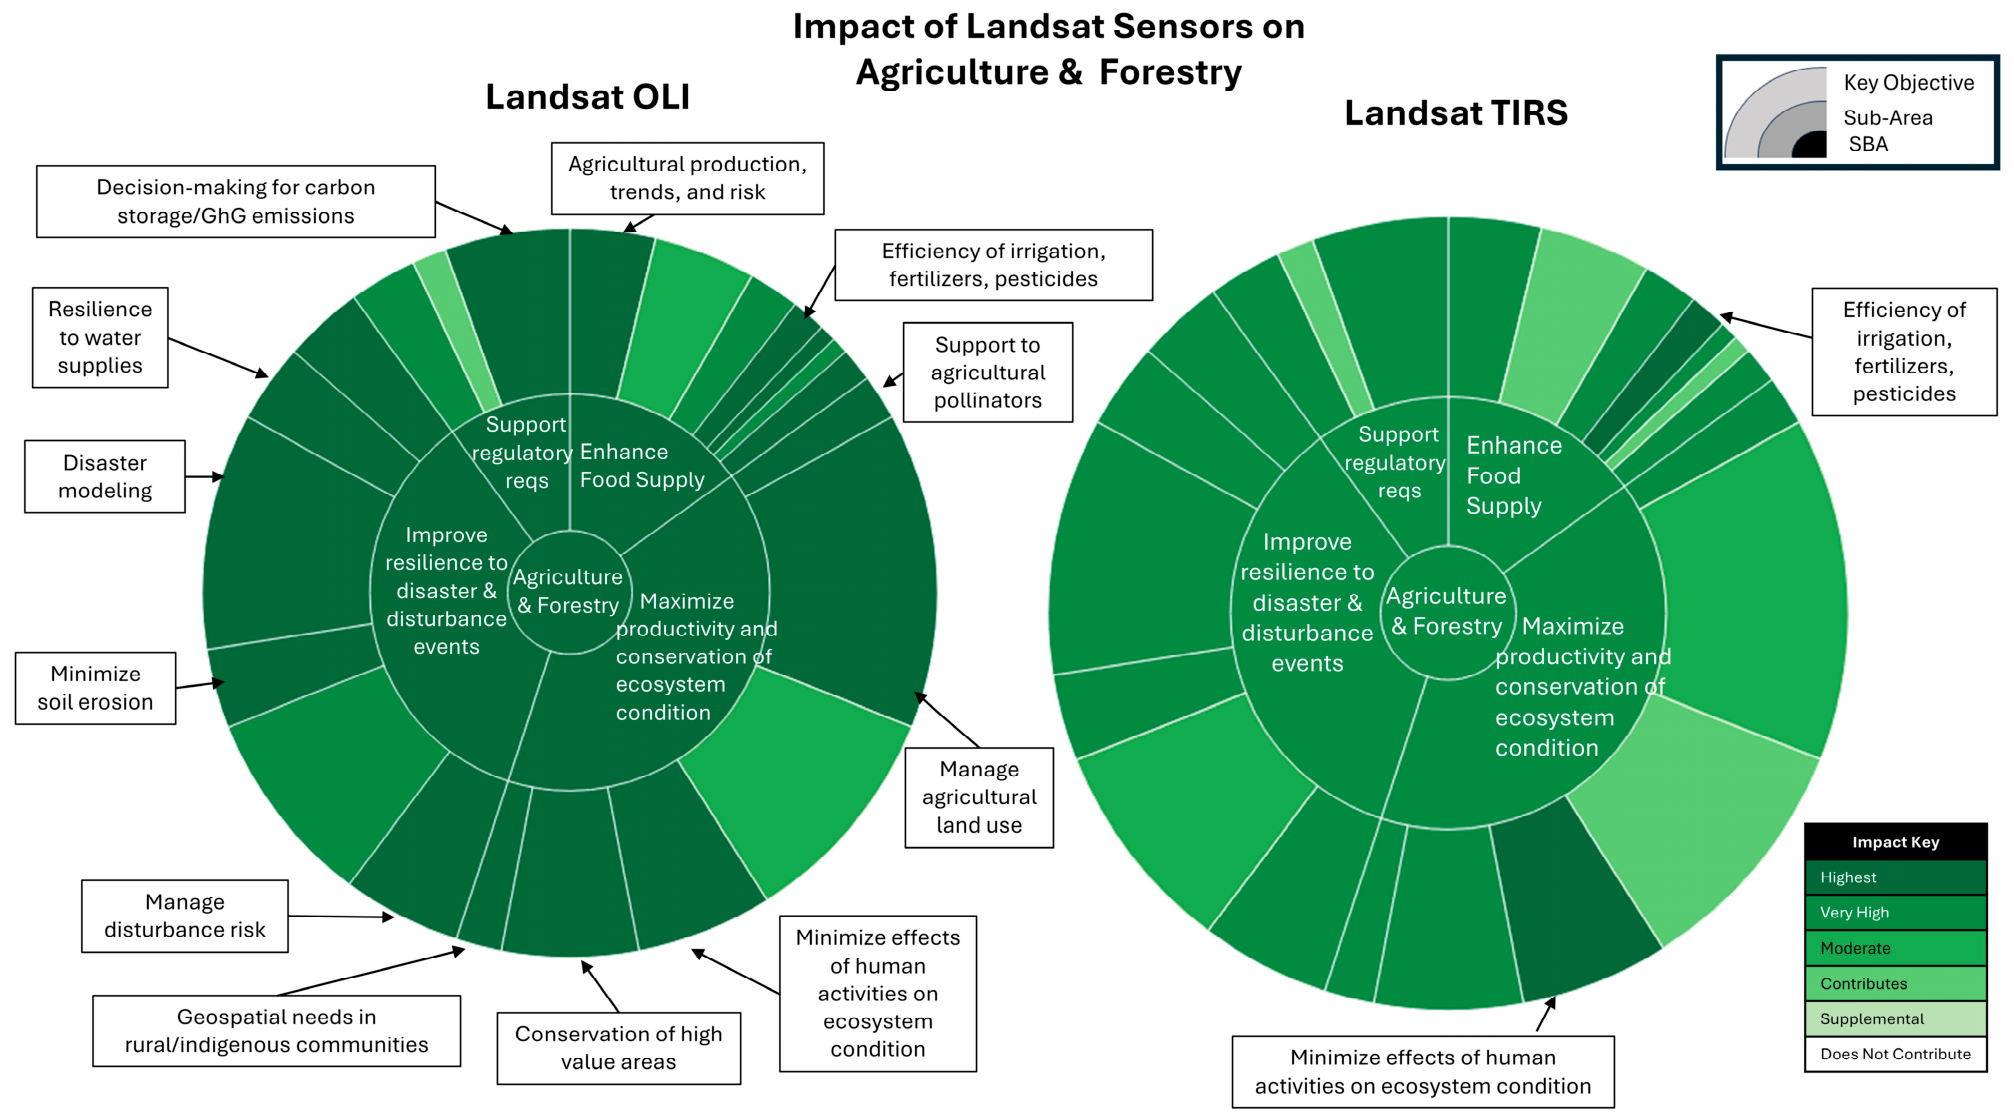
The assessment team identified a total of 1171 EOIs (i.e., observing systems or databases) and 1039 surveyed products (i.e., data, information, programs, or systems informed by EOIs) that support the 208 unique KPSOs (i.e., products, services, or outcomes that contribute to a KO) in agriculture and forestry. The two Landsat sensors emerged as two of the most important EOIs in the assessment, specifically supporting irrigation efficiency, disaster management, and land cover management; however, the impact of these sensors is notable across the entirety of the agriculture and forestry value tree. Landsat impacts 159 individual KPSOs out of a total of 208, the third-most of any single platform, while also contributing to all 22 KOs, under all sub-areas (Figure 3). Additionally, Landsat serves as an indirect input to 126 projects (i.e., product groups), creating over 1700 connections across 21 agencies (Figure A1). Landsat OLI and TIRS ranked as the fourth- and tenth-most impactful EOIs, in the 99th percentile of all inputs identified in the assessment. This percentile estimate was verified by calculating the exact nonparametric percentile (99.35%), confirming statistical significance via a rank-based test (p = 0.0065) and bounding its uncertainty within a 95% confidence interval (98.72% to 99.98%). These results imply that Landsat’s downstream dependencies are immense in the agricultural and forestry sectors. Almost 30% of KPSOs impacted by Landsat use its data directly, while the other 70% use it indirectly (i.e., Landsat data contribute to derived products). Because these indirect pathways depend on Landsat’s unparalleled continuity and calibration, they reflect strong dependence on Landsat rather than readily substitutable inputs. These direct and indirect connections demonstrate Landsat’s depth and breadth of impact for the Agriculture and Forestry SBA.
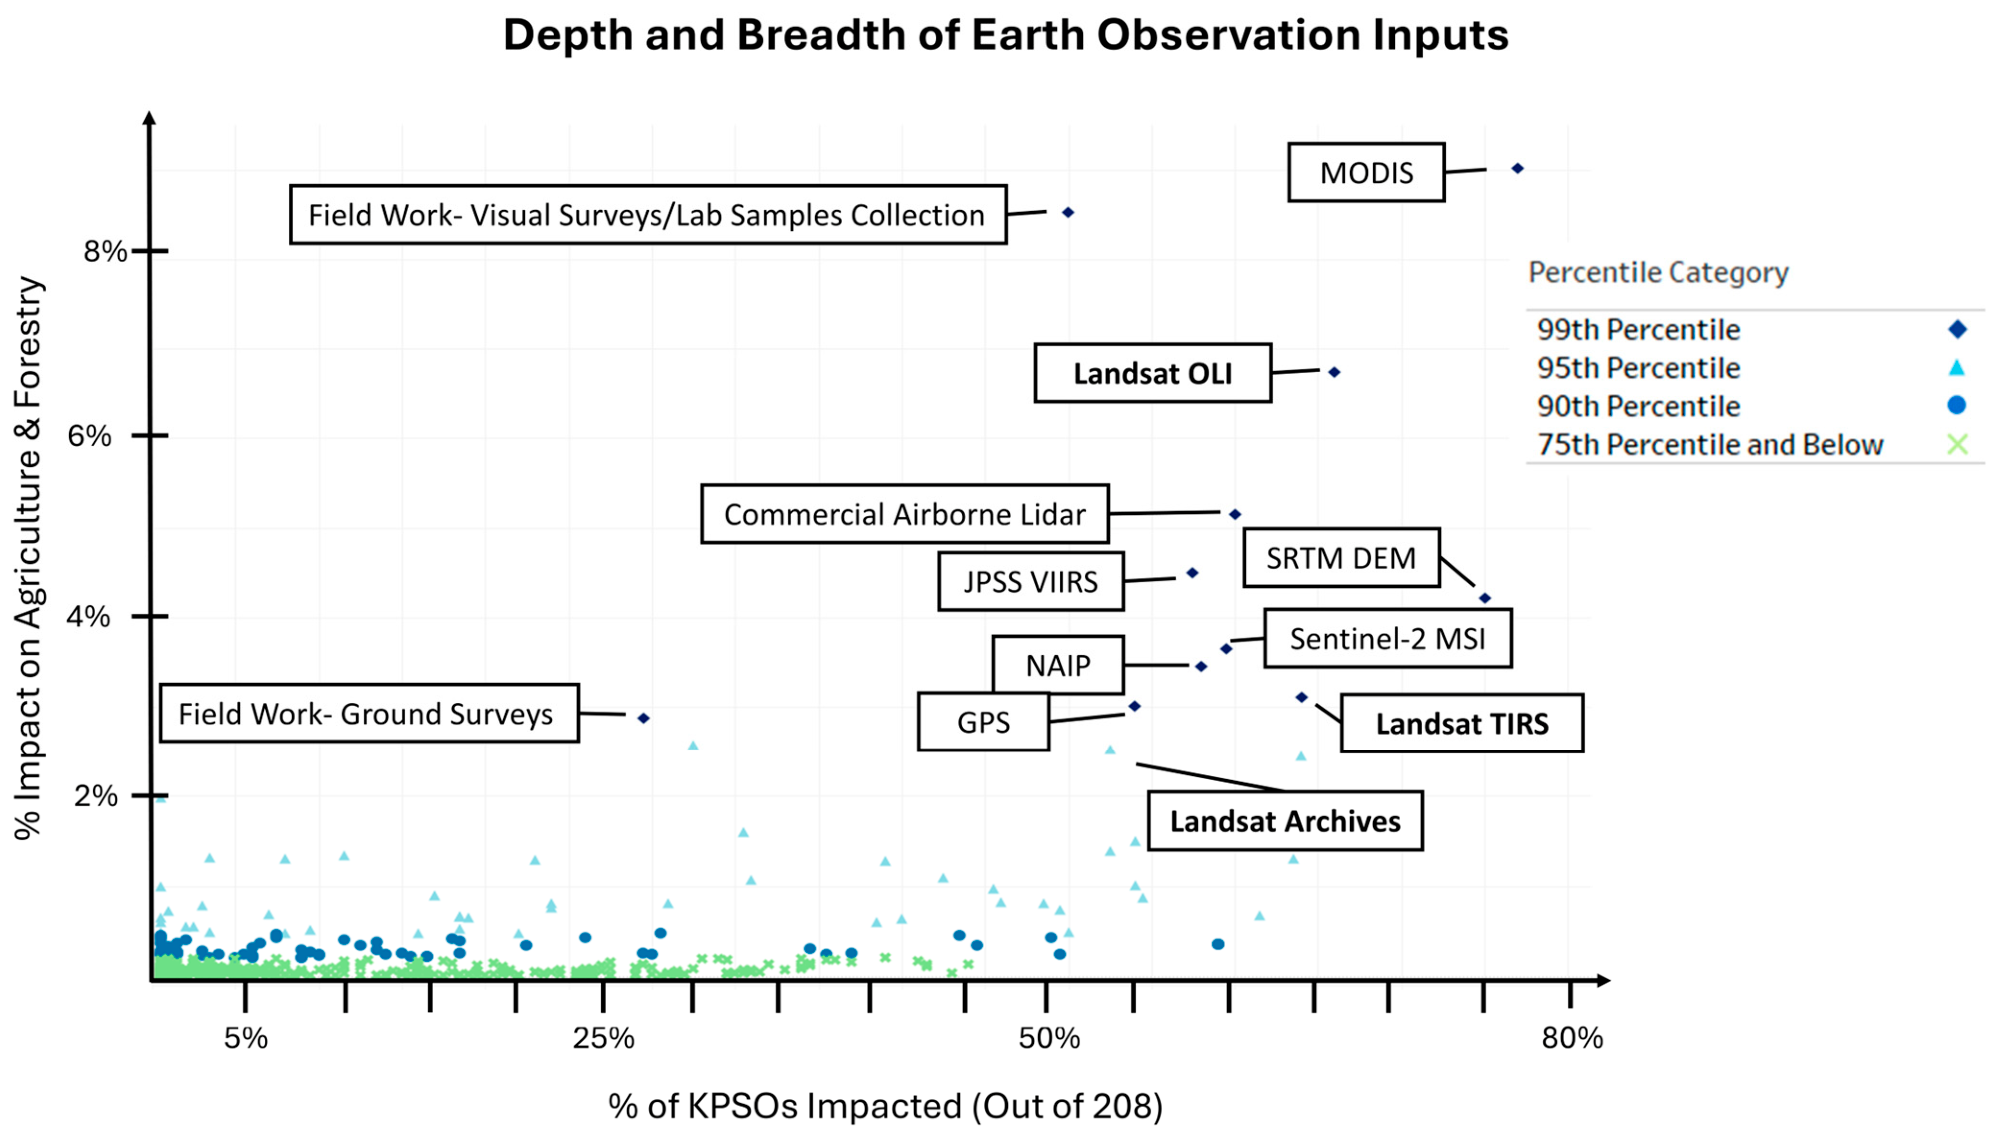
While our analysis was focused on the role of Landsat sensors, a variety of EO types ranked highly in the assessment, showcasing the multitude of data required to support the Agriculture and Forestry SBA. For instance, the average number of EOIs per KPSO was ~88. This value reflects the count of input data sources for a given KPSO and their corresponding input data sources, iterated until all products are broken down into EOIs. The high average count reflects a reliance on multiple data sources regardless of the key EOI input. Field work, in situ observations, elevation, airborne, and reference datasets, for example, were all identified as key inputs that complement highly used satellite sensors (e.g., Landsat OLI, Landsat TIRS, Aqua and Terra MODIS) by providing higher spatial resolution measurements for comparison, training, and validation (Figure 4). Consequently, field work, including visual surveys and laboratory sample collections, was found to have the second-highest impact score (8.53%). Similarly, the Shuttle Radar Topography Mission (SRTM) Digital Elevation Model (DEM) impacted the second-largest percentage of KPSOs (77%; Figure 4), underlying the widespread importance of elevation data in product development. Notably, MODIS Aqua and Terra were identified as the most impactful remote sensing observing systems (Figure 3). These EOIs impacted 110 and 164 individual KPSOs, respectively (e.g., VegScape, Global Forest Change, Invasive Species Habitation Tool). Further, VIIRS, Sentinel-2 and NAIP also stood out as major contributors with high impact scores and a high percentage of KPSOs impacted, reflecting our reliance on data sources at multiple spatial and temporal scales.

3.2. Landsat Products Drive Value

3.2.1. Landsat Level 1, 2 and 3 Products

Landsat’s high ranking is largely due to the significant reliance on its products by the land imaging community. For instance, the SBA team identified three level 3 science products—Landsat Provisional Actual Evapotranspiration (ETa), Landsat Dynamic Surface Water Extent (DSWE), and Landsat Burned Area— as KPSOs because they are crucial for supporting or achieving KOs in both operational and research activities. For example, the assessment results show that the Landsat Provisional ETa product contributes data to support KOs, such as improving agricultural productivity resilience, increasing irrigation efficiency, and managing agricultural lands, among other applications. Similarly, the Landsat Burned Area product directly supports KOs, such as sustainable forest ecosystem management and post-fire remediation activities.
We identified over 100 direct federal uses of Landsat level 1, 2, or 3 data products covering 20% of KPSOs. Multiple U.S. federal agencies heavily rely on Landsat products, consistently employing at least one OLI product and, in most organizations, a TIRS product (Table 3 and Table A4). Of the more than 100 federal Landsat product uses, about 75% rely on OLI data compared to about 25% from TIRS data.
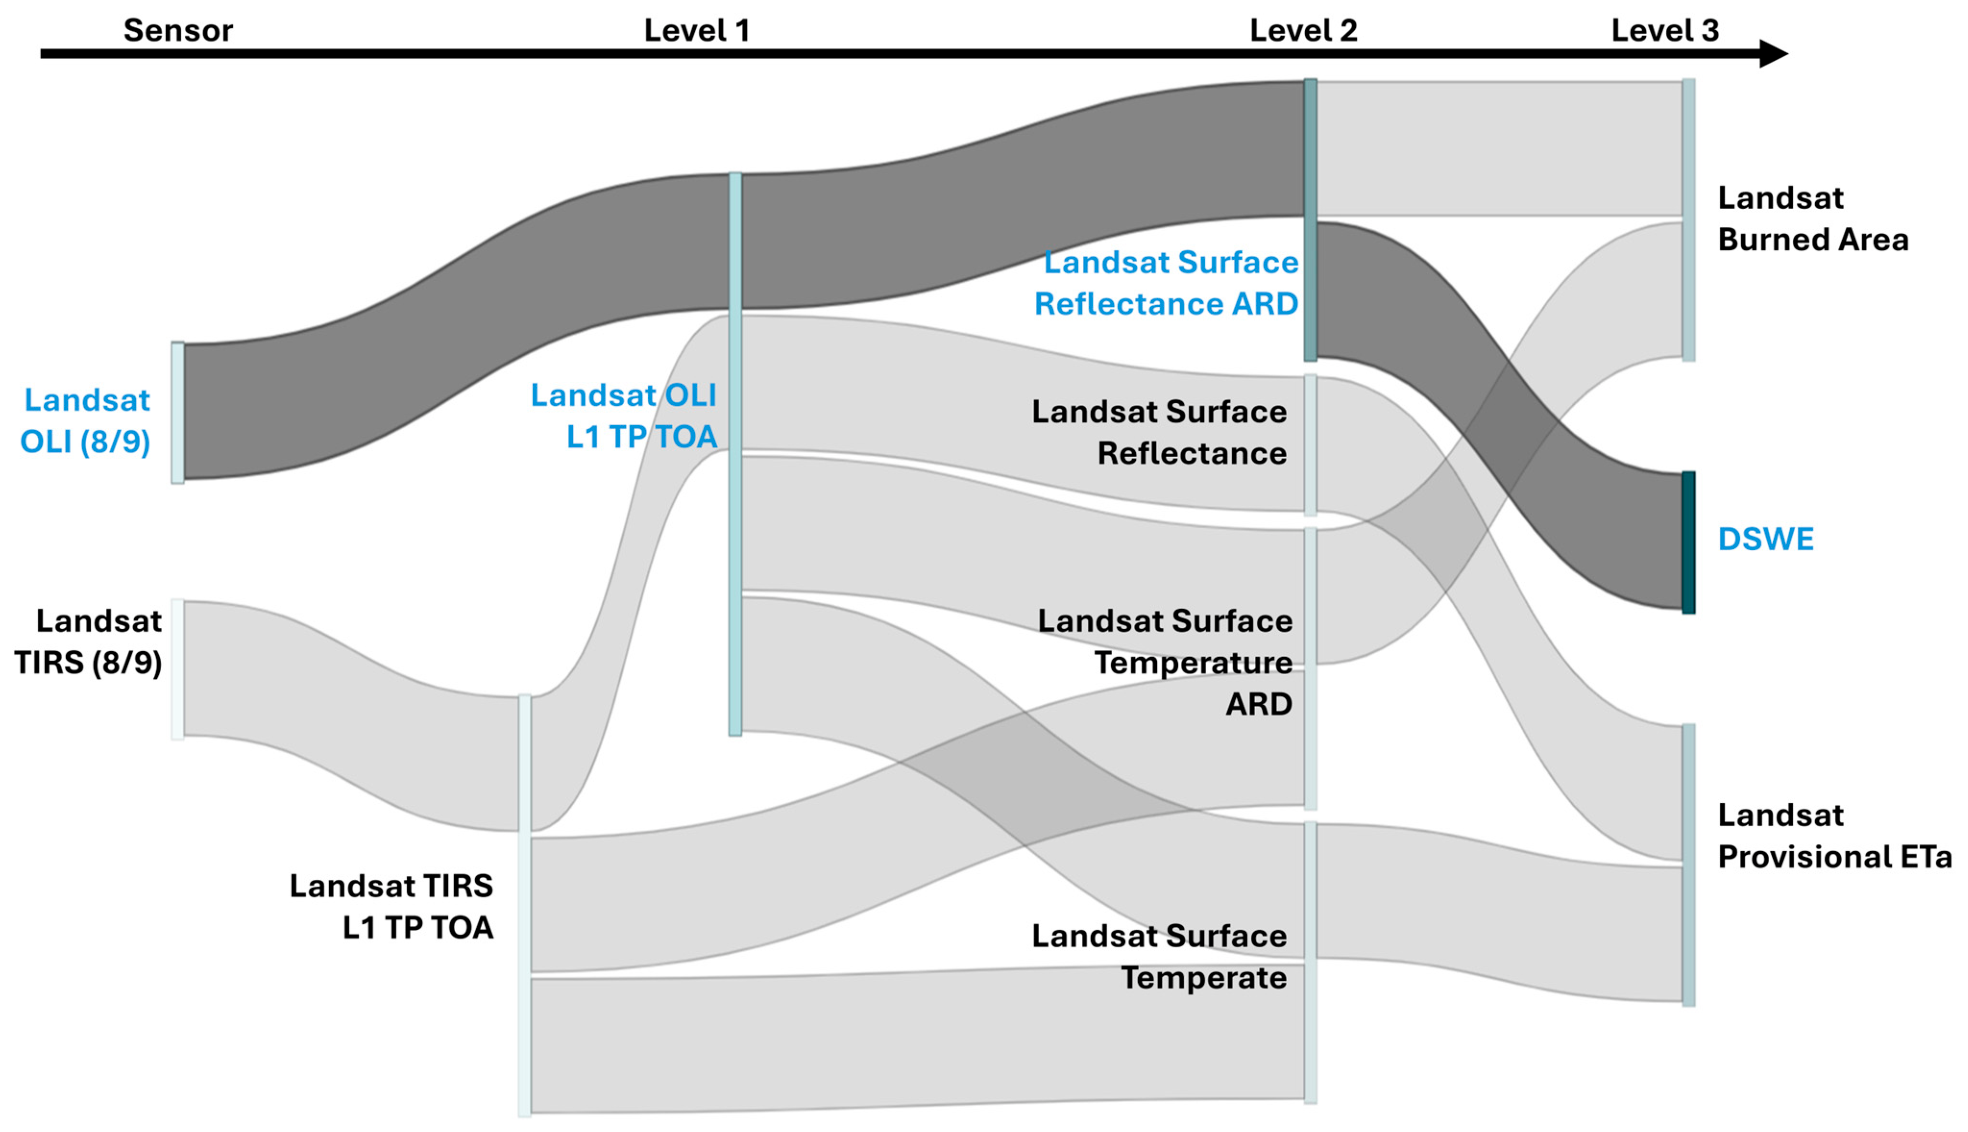
Landsat products are highly interconnected and depend on each other, progressing from sensor data to level 1, level 2, and level 3 products (Figure 4). Landsat TIRS L1 TP TOA data, for instance, provides band quality information for Landsat OLI L1 TP TOA production, resulting in its broad utility for producing all Landsat science products (Figure 5). Across the assessment, level 1 Landsat OLI, level 1 Landsat TIRS, and levels 2 and 3 science product suites contributed to all 22 KOs.
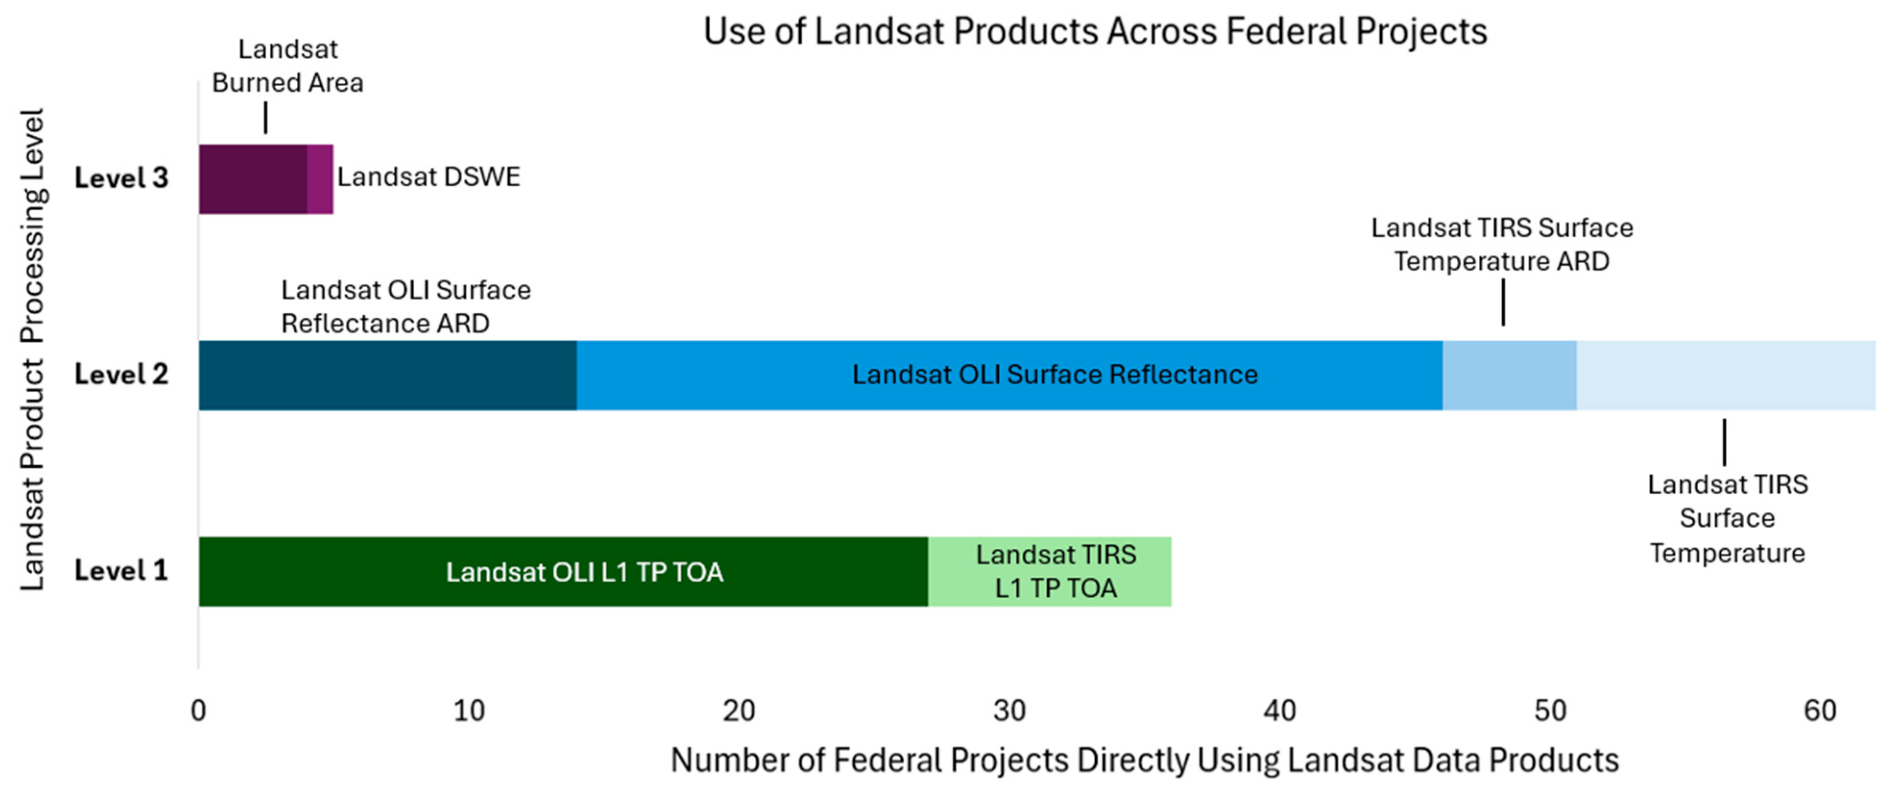
Landsat science products (levels 2 and 3, Table 4) account for over 60% of uses, with the other 40% coming from Landsat raw/calibration products (levels 0 and 1). The Landsat Surface Reflectance products support more than 30 federal projects, the highest among all Landsat products (Figure 6). This demonstrates the critical role of Landsat level 2 and 3 products in advancing broad societal objectives.
Landsat OLI products support applications such as land cover mapping, fire fuel modeling, crop insurance support, and rangeland analysis. Landsat TIRS products specifically support areas such as forest monitoring, crop estimation, water resources/quality evaluation, and evapotranspiration modeling (Table 4).

3.2.2. National Land Cover Database

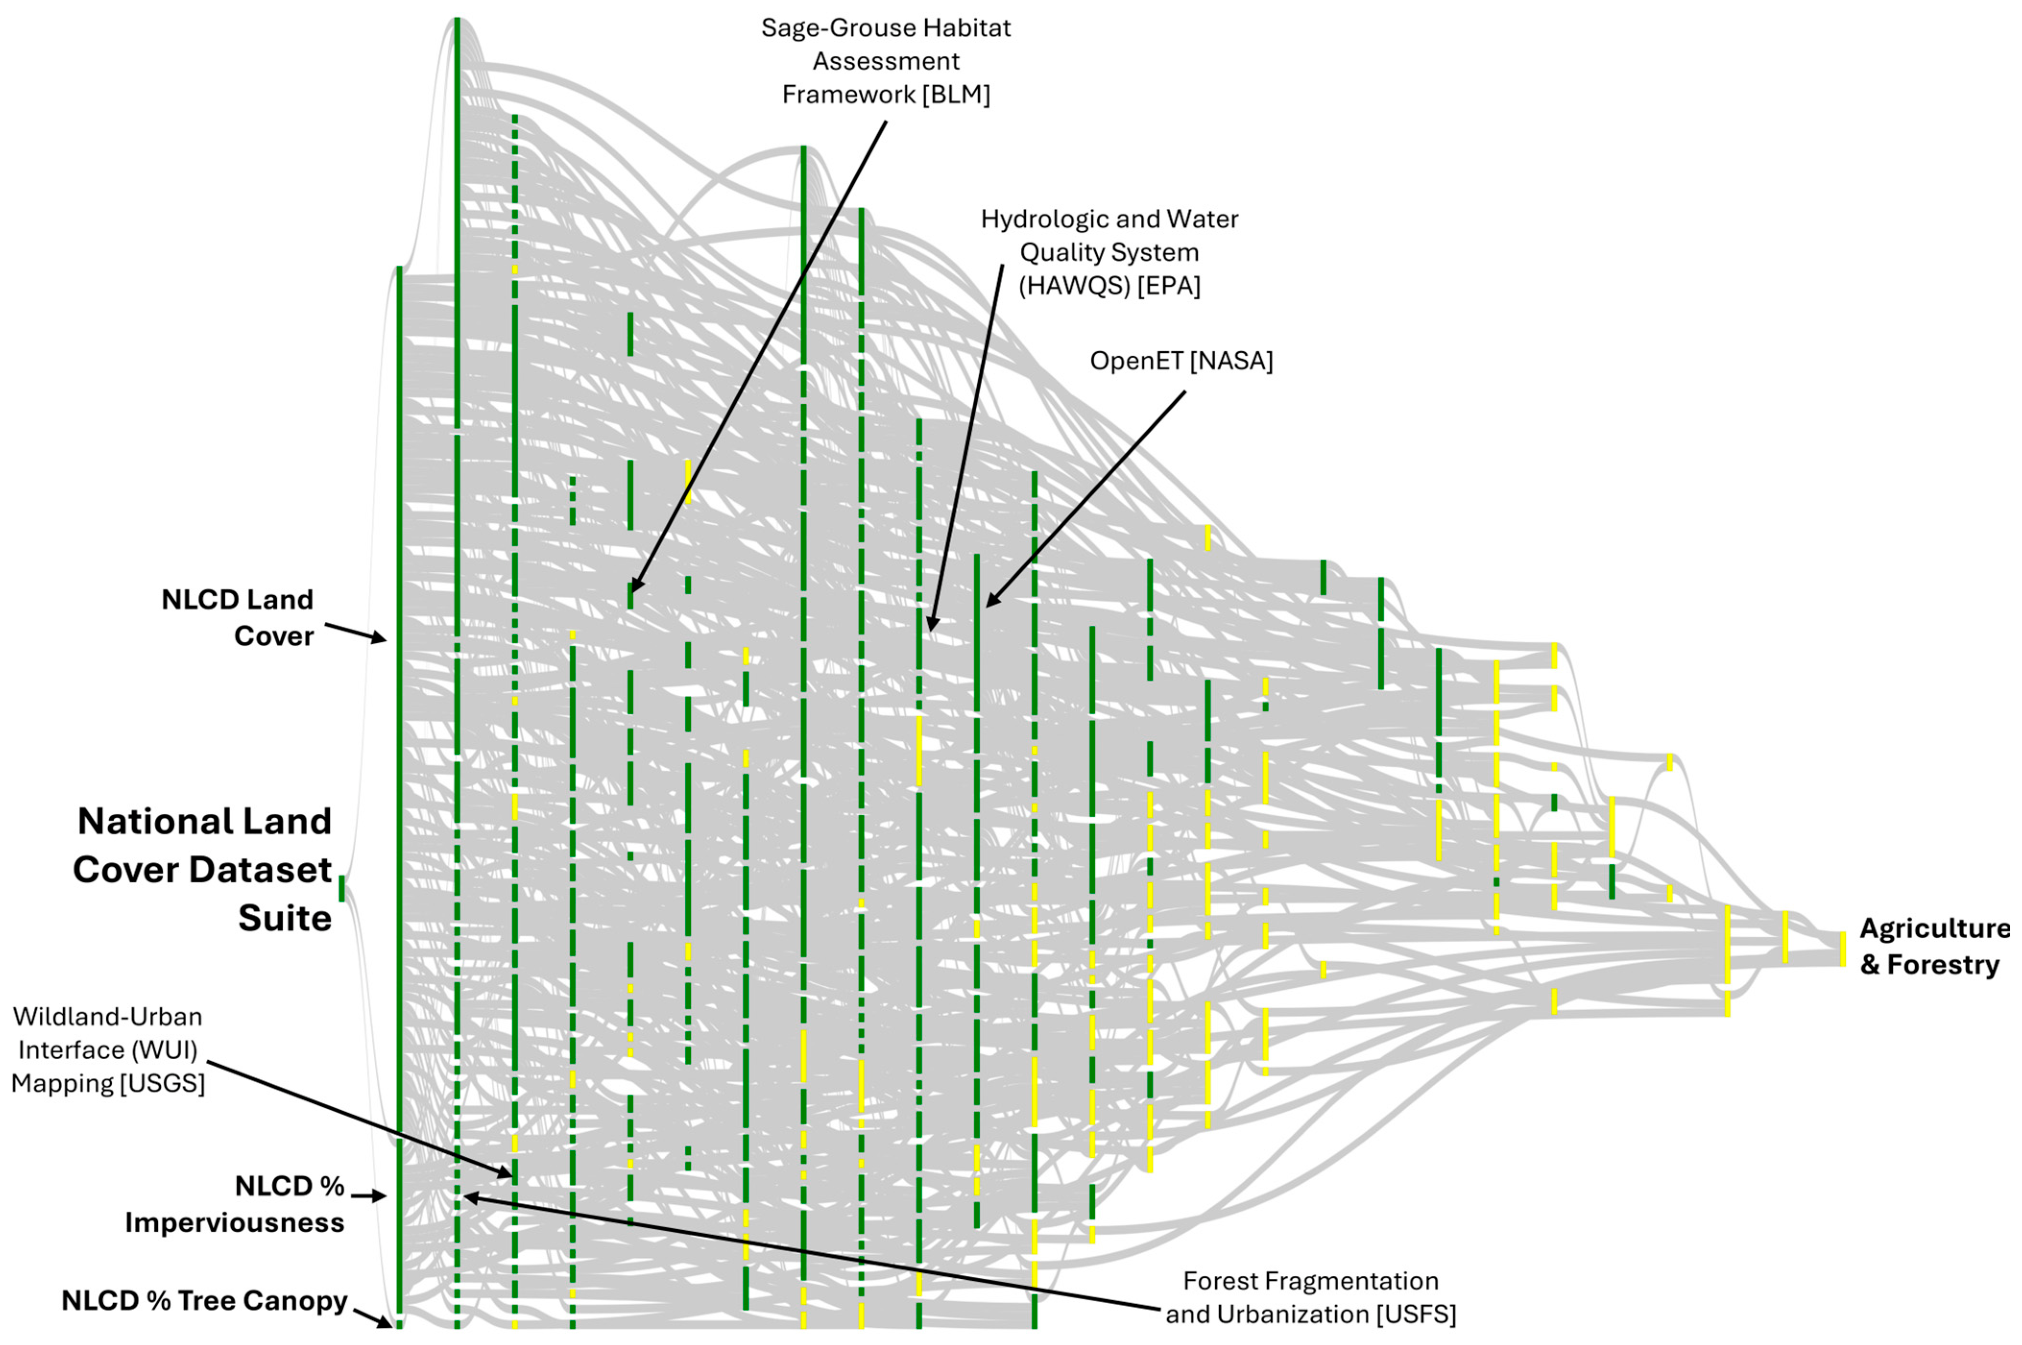
We also evaluate the impact and connections of USGS’s NLCD, which includes several map products (e.g., land cover, percent imperviousness) [51] and uses Landsat OLI L1 TP TOA, Landsat Surface Reflectance, Landsat Surface Temperature, and Landsat Surface Temperature ARD. The SBA team identified both the NLCD land cover and percentage of developed imperviousness products as KPSOs, indicating Landsat’s direct value. The NLCD project also has broad downstream federal agency usage supporting products across more than 15 federal agencies in applications such as land cover/land change, natural disasters, soil moisture, and vegetation condition (Figure 7). Landsat data are a key input data source for NLCD land cover and percentage of developed imperviousness products.

3.2.3. Landsat Product User Satisfaction

In addition to understanding the impact a dataset brings to the Agriculture and Forestry SBA, the assessment also provides insight into user satisfaction, including user-identified limitations. Overall, Landsat 8 and 9 products satisfy the needs of users, with almost 80% of unique uses rated as “Fully Satisfied”. Some users indicated limitations such as temporal resolution, spatial resolution, spectral band specifications, and data latency, with no strong differences in limitations based on product type or level. Nearly 85% of users who reported limitations cited temporal frequency as the most significant constraint, followed by spatial resolution (48%). This temporal limitation is particularly significant for agriculture and forestry activities that rely on frequent observations, such as post-disturbance monitoring, fire tracking, crop estimation, habitat assessments and the modeling of watershed dynamics. Across Landsat processing levels (i.e., level 1 vs. level 2), limitations were consistent with temporal frequency as the most prevalent limitation across both levels. Most users did not specify their desired temporal frequency, but a few requested improving the temporal frequency from today’s 8-day interval to data delivered as often as daily. Spectral bands and data latency were the third and fourth most noted limitations, respectively.

4. Discussion

4.1. Landsat Is a Critical Data Source for Agriculture and Forestry

With rapidly increasing numbers of satellite launches globally [53,54], it is becoming increasingly important to be able to articulate and quantify the value of long-term satellite missions. The EOA evaluates the impact of EO datasets using an alternative approach to that of traditional literature reviews. Literature reviews typically rely on the prevalence of papers and their corresponding research topics to identify priorities [3,5,7,8,9,27]; however, we can expect a lag between the popularity of a sensor in the literature and its subsequent incorporation into operational efforts [55,56]. Therefore, the EOA instead provides a mechanism to characterize the current relative impact of EOIs on federal goals and objectives for priority societal benefits. Our analysis found that both Landsat OLI and Landsat TIRS were among the top ten most impactful EOIs for agriculture and forestry in EOA 2023, largely consistent with findings from EOA 2016 that ranked Landsat optical as the single most impactful data source supporting the Agriculture and Forestry SBA. More broadly, this finding is also consistent with forestry-focused PRISMA literature reviews in which the dominance of Landsat is clear. Multiple analyses found that most papers relied on multispectral imagery, with Landsat being the most frequently utilized [9,57]. This pattern held even when limiting paper counts to more recent periods (e.g., 2015–2020; [8]), in part because of the increased access to cloud-computing platforms that enable rapid utilization of the multi-decadal Landsat record [10]. Landsat data have been integral in the development of EO algorithms to provide a range of applications, from mapping forest succession to crop water stress and burned areas [8,26,45,58]. Further, our finding that indirect Landsat impacts were more common than direct impacts shows the capacity of the EOA to identify potentially obscured contributions, where Landsat is used as an input to produce a product (e.g., NLCD) that is then used to guide the development of a second product. Such contributions would likely be obscured in a more traditional literature review. However, both our findings as well as findings from literature reviews support the idea that the continuity of Landsat missions is crucial for many environmental applications developed by the scientific community [23,26,43].

4.2. Landsat Products Deliver Important Value

The importance of Landsat OLI and TIRS within the Agriculture and Forestry SBA was largely realized through level 2 and level 3 products. For example, Landsat-based projects such as LANDFIRE [59], Monitoring Trends in Burn Severity (MTBS) [16], and Land Change Monitoring, Assessment and Projection (LCMAP) [60] support the ongoing characterization of forest condition, fire activity and land cover across the U.S. While these are just example products providing data on fire and land cover changes in the U.S., reviews of wildfire mapping [57,61] and land cover mapping [62,63] emphasize the prevalence of Landsat and coarser resolution data to inform national- to global-scale products. We also found that OLI and TIRS often work in tandem to support downstream Landsat products (e.g., Landsat OLI L1 TP TOA) and critical applications (e.g., evapotranspiration modeling, food security evaluation, crop evaluation). Our findings emphasize the importance of delivering simultaneously acquired visible-to-thermal infrared data for the creation of coincidentally collected surface reflectance and thermal emissive data products. NLCD was used as an example KPSO in the analysis. Previous efforts have summarized the history of NLCD and its applications [64,65] and provided thematic accuracy assessments [66,67], but this assessment provided a novel perspective on NLCD, including identifying the breadth of products and projects that rely on NLCD as an input. The assessment results highlight the importance of sustaining and improving national-scale land cover and change products, such as the NLCD, to maintain long-term continuous monitoring of the Earth’s surface for research, resource management, and decision-making.

4.3. Study Limitations

While the assessment provides a novel mechanism to quantify the impact of EOs and products, limitations and sources of uncertainty still exist. The 2023 EOA represents a snapshot in time, and with the EO space rapidly changing, the data sources used by products can also change. One example is the use of Landsat-only vs. Harmonized Landsat Sentinel-2 (HLS) data [68]. Sentinel-2 provides similar spectral bands to Landsat OLI and improves the revisit time. Efforts to integrate Sentinel-2 and Landsat data can deliver a multi-decadal record, while taking advantage of increased imagery availability from 2015 to present (e.g., [58]). Torres et al. (2021), for example, noted that despite the launch of Sentinel-2 with improved temporal and spatial resolutions, Landsat was still the most employed in forests, but that this trend could change in the near future, with many reviews discussing the role of Sentinel-2 alone or extending the impact of Landsat [8,9,31,57]. Similarly, in our analysis, we found multiple projects (e.g., HLS, MTBS, LCMAP) that were beginning to utilize Sentinel-2 data. However, users must rely on Landsat for thermal data, which Sentinel-2 does not collect.
Additionally, a team of federal scientist SMEs collaboratively and iteratively created the value tree and defined the levels of the tree, such as the sub-areas and KOs, which introduced a degree of subjectivity in the priorities identified and the corresponding range of KPSOs solicited and considered in the analysis. While SMEs were engaged from 14 different agencies and KPSOs were solicited widely across the federal government, our 208 KPSOs and 1039 corresponding surveyed products cannot be considered a complete list but instead are intended to be representative. Also, the survey of KPSO alignment, value tree weighting, and surveyed product scoring, like other survey-based analyses, were based on the subjective judgment of each SME.
Further, the assessment’s national focus provided a more comprehensive U.S. perspective rather than a global perspective, which influenced our results and limits the global applicability of our findings. For example, while a number of global agriculture and forestry Landsat products exist (e.g., [1,69,70]), most global products still typically rely on coarser resolution and frequent temporal satellite missions, like MODIS and VIIRS. However, the framework presented here can be applied elsewhere to provide a means of characterizing the reliance on a given satellite mission. Additionally, the focus of the EOA data collection on national-scale products and projects also likely influenced the results in other ways. For example, literature reviews on the application of remote sensing to agriculture differ from forest literature reviews in that they often highlight the emerging popularity of papers using uncrewed aerial systems (UAS) [6,10]), particularly for applications like precision agriculture [38]. Because the application of aerial systems is highly localized, however, UAS systems were under-represented at the scale of our analysis (i.e., national), relative to more moderate resolution sensors, like Landsat. Despite these limitations and sources of uncertainty, the EOA provides a comprehensive, unmatched assessment of EO contribution in supporting national priorities.

4.4. Data Applications

Data collected by the EOA can be used to glean many more insights beyond the impact of a single EOI. One such type of analysis is a comparison of depth versus breadth, where depth is the impact of an EOI on the SBA and the breadth is the number of KPSOs the EOI impacts within that SBA. This comparison can give insights into the criticality of an EOI on project performance across an SBA. For example, while the importance of Landsat OLI and TIRS was largely attributable to their breadth, an EOI like the USGS streamgage network may impact a smaller number of KPSOs (i.e., lower breadth) but be highly impactful (i.e., greater depth) for select KOs. Consequently, consistent with the literature review findings [3,6,7,8], we found that a large variety of data types support KOs, including coarse-resolution and fine-resolution multispectral and optical data, synthetic aperture radar (SAR) data, and lidar data. In considering all product inputs, however, the EOA was also able to highlight the importance of supporting sources of data such as field work, meteorological data, Digital Elevation Models, and even GPS data, with each EOI supporting relevant agricultural and forestry activities and uses.

5. Conclusions

Earth observation assessments are a unique, quantitative mechanism to understand and document the connections between EO data sources and high-level societal benefits provided by the federal government. This analysis uses Landsat as an example of how the federal government can leverage EOAs to discover insights into the value of data investments to support strategic decision-making. Follow-on analyses looking at other EOIs (i.e., VIIRS) or surveyed products (i.e., LANDFIRE) can be conducted to further exploit this valuable dataset. Overall, our analyses found that the Landsat missions continue to provide crucial, impactful, high-quality, pervasively used data and demonstrate their considerable value across numerous agriculture and forestry applications. Downstream Landsat science products and higher-level products that rely on Landsat, like NLCD, further emphasize and provide EO Landsat value. Assessment SMEs recognized several Landsat-based products as KPSOs, indicating the value of these products. Landsat missions have created a lasting legacy in EO by providing foundational land surface, coastal and aquatic data. The program’s uninterrupted record, spanning more than five decades, supports the nation and provides valuable societal benefits—a conclusion supported by this study and other independent assessments.

Author Contributions

Conceptualization, E.W., J.R., S.N.R.C., M.K.V., I.J.G., Z.W., G.S. and E.H.; Methodology, E.W., J.R., M.K.V., Z.W., G.S. and E.H.; Formal analysis, S.N.R.C.; Writing—original draft, E.W., J.R., S.N.R.C. and M.K.V.; Writing—review & editing, E.W., S.N.R.C., M.K.V., I.J.G., Z.W., K.C., C.S., D.O. and E.H.; Supervision, Z.W., G.S., K.C., C.S. and D.O.; Project administration, E.W. All authors have read and agreed to the published version of the manuscript.

Funding

This analysis of the EOA data was supported by the U.S. Geological Survey’s National Land Imaging program.

Data Availability Statement

For additional information on how the assessment team conducted the EOA, refer to the EOA Methods Guide on the USGEO website [71]. For more information on the EOA 2023 results, please reference the EOA page of the USGEO website [71], the data navigator [52], and the EOA 2023 data release [72]. Further inquiries can be directed to the corresponding author.

Acknowledgments

This study is supported by the U.S. Geological Survey National Land Imaging (NLI) Program and Land Change Science Program. The authors would like to thank NOAA’s Technology, Planning and Integration for Observation (TPIO) and the Science and Technology Policy Institute (STPI) for their contributions in data collection, validation, and data management to support the analyses presented in this paper. The authors appreciate the valuable contributions to the development of the 2023 Agriculture and Forestry EOA by the SBA team and SMEs. Finally, the authors thank Tim Newman, NLI Program Coordinator, for supporting the interagency development of the requirements database and tools used in the EOA analysis. Any use of trade, firm, or product names is for descriptive purposes only and does not imply endorsement by the U.S. Government.

Conflicts of Interest

Authors E.W., J.R. and S.N.R.C. were employed by the KBR, Inc. The remaining authors declare that the research was conducted in the absence of any commercial or financial relationships that could be construed as a potential conflict of interest.

Abbreviations

The following abbreviations are used in this manuscript:
3DEP DEM 3D Elevation Program Digital Elevation Model
ARD Analysis-Ready Data
ARS Agricultural Research Services
BLM Bureau of Land Management
DSWEDynamic Surface Water Extent
EOEarth observation
EOAEarth observation assessment
EOI Earth observation inputs
EPAU.S. Environmental Protection Agency
ETaActual evapotranspiration
FSA Farm Service Agency
GOES-R Geostationary Operational Environmental Satellite R Series
GPS Global Positioning System
JPSS Joint Polar Satellite System
KO Key objective
KPSOKey product, service, or outcome
MODISModerate Resolution Imaging Spectroradiometer
MRLC Multi-Resolution Land Characteristics Consortium
MSI Multispectral Instrument
NAIP National Agriculture Imagery Program
NASS National Agriculture Statistics Service
NCDL NASS National Cropland Data Layer
NLCDNational Land Cover Database
NOAANational Oceanic and Atmospheric Administration
NRCS National Resources Conservation Service
OLIOperational Land Imager
OSTPOffice of Science and Technology Policy
RCMAP Rangeland Condition Monitoring Assessment and Projection
RMA Risk Management Agency
SBASocietal Benefit Area
SME Subject matter expert
SRTM Shuttle Radar Technology Mission
TIRSThermal Infrared Sensor
TOA Top of the Atmosphere
TP Terrain- and Precision-Corrected
USBR U.S. Bureau of Reclamation
USDAU.S. Department of Agriculture
USFS U.S. Forest Service
USGEOU.S. Group on Earth Observations
USGSU.S. Geological Survey
VIIRS Visible Infrared Imaging Radiometer

Appendix A

Table A1. Glossary of paper terms and descriptions.
TermDescription
Assessment SMEAn individual who has been working in a particular field for an extensive period and who is trained in that area, with whom the elicitation team spoke.
Assessment TeamReferred to as the team that conducted the assessment by interagency partners in the U.S. Geological Survey (USGS), National Oceanic and Atmospheric Administration (NOAA), and Office of Science and Technology Policy (OSTP).
ConnectionThe linkage between value tree nodes
Data SourceThe data, information, and Earth-observing systems needed to produce a KPSO.
Direct inputData source that observes/uses the products.
Earth Observation InputAn observing system or database that is the lowest level of disaggregation in the value tree.
ImpactIn value tree development and assessment, a relative measure of an observing system’s contribution to performance at a given node in the value tree, typically the top node representing overall performance.
Indirect inputData source that uses/observes the derived product.
Key ObjectiveActivities, products, services, or desired end states that rely in part or in whole on Earth observation data to provide societal benefit.
KPSO GroupA group of KPSOs that belong to the same category or class of information products or research outcomes.
KPSOA primary important information product, service, or outcome required to make progress toward or meet a KO.
NodeEach element in the value tree is a node.
Power userDetermined by looking at the normalized impact a single Landsat product has on the user project and removing any that had less than a 35% normalized impact.
ProjectA set of products that are produced under a single entity, supporting the same science effort.
SBA TeamA group of well-established federal subject matter experts with expertise in areas relating to agriculture, forestry, or climate.
Societal Benefit AreaA defined area of socioeconomic benefit derived from Earth Observations. SBAs transcend individual agency needs and mandates and describe broad societal, scientific and economic goals.
Surveyed ProductAlso referred to as a “product”. The data, information, and Earth-observing systems needed to produce KPSOs.
Value treeAn approach that establishes the connection from the top-level, societal benefit inherent in the SBA down through sub-areas, KOs, data sources and tools and ultimately to the set of Earth-observation inputs that contribute to the SBA.
Table A2. List of agriculture and forestry sub-areas and key objectives.
Sub-AreaKey Objective
Enhance Food SupplyUnderstand current agricultural production, production trends and risks
Improve soil health, increase carbon uptake and storage, and reduce trace gas emissions from soil by promoting soil conservation practices
Improve resilience of agricultural productivity to empower climate-smart agriculture
Increase the efficiency of irrigation, fertilizers, and pesticides by encouraging sustainable and precision agriculture
Manage environmental and human health risks associated with fertilizers and pesticides
Support forage assessment and management for animal production
Improve ecosystem conditions to support diverse agricultural pollinators
Maximize Productivity and Conservation of Ecosystem ConditionPromote sustainable multi-use management of forests, grasslands, and shrublands that acknowledges Indigenous land management practices
Utilize and advance existing scientific, technical, and traditional ecological knowledge to better monitor, manage, and use agricultural lands, forests, grasslands, shrublands, and pasture and rangelands
Promote climate resilience by advocating for management practices that adapt to climate change to optimize productivity and improve conditions
Minimize adverse effects of human activities on ecosystem condition
Collaboratively promote conservation of high-value areas and minimally managed forests, grasslands, and shrublands
Collaboratively engage and support geospatial needs in rural and Indigenous communities
Improve Resilience to Disasters and Disturbance EventsAllow natural disturbance (e.g., fire) where appropriate and manage disturbance risks that affect populations (e.g., wildland–urban interface and coastal areas)
Predict and manage fire risk, tactical fire support, and post-fire remediation
Minimize soil erosion from water, wind, active management, and post-fire in agricultural and forest ecosystems
Support risk and impact modeling for drought, flood, climate extremes, pest/disease infestation, fire, and storm-prone areas
Maintain resilience of water supplies and facilitate post-disturbance restoration and rehabilitation
Improve resistance of agriculture, rangelands, grasslands, and forests to disease and pests, including invasive species
Support Regulatory Requirements and Evidence-Based Decision-MakingProvide geospatial support to firefighters, aviators, law enforcement, farmers, communities, and agencies
Monitor and promote compliance with federal laws (farm, insurance, conservation, and leases) and programs
For carbon storage and greenhouse gas emissions, support analysis and evidence-based decision-making
Table A3. Descriptions for each product evaluated in this analysis, as defined by the USGS and Multi-Resolution Land Characteristics (MRLC) Consortium.
LevelProduct NameDescription
Level 1: Raw and calibration dataLandsat Operational Land Imager (OLI) Terrain- and Precision-Corrected (TP) Top of the Atmosphere (TOA)Calibrated data from the Landsat OLI sensor with precision and terrain correction applied [73]
Landsat Thermal Infrared Scanner (TIRS) Terrain- and Precision-Corrected (TP) Top of the Atmosphere (TOA) Calibrated data from Landsat TIRS sensor with precision and terrain correction applied [73]
Level 2: ReflectanceLandsat Surface ReflectanceThe fraction of incoming solar radiation that is reflected from Earth’s surface to the Landsat sensor [44]
Landsat Surface TemperatureRepresents the temperature of the Earth’s surface in Kelvin (K) [44]
Landsat Surface Reflectance Analysis-Ready DataLandsat Collection 2 Level-1 data that are processed into Albers-projected Level-2 surface reflectance data [74]
Landsat Surface Temperature Analysis-Ready DataLandsat Collection 2 Level-1 data that are processed into the Albers-projected Level-2 surface temperature data [74]
Level 3: Level 2 data mapped on a uniform space gridDynamic Surface Water ExtentDescribes the existence and condition of surface water [75]
Burned AreaRepresents per-pixel burn classification and burn probability [15]
Provisional Actual EvapotranspirationThe quantity of water that is removed from a surface due to the process of evaporation and transpiration [76]
Level 4: Landsat-derived higher-level products National Land Cover Database (NLCD)NLCD has been one of the most widely used geospatial datasets in the U.S., serving as a basis for understanding the nation’s landscapes as a definitive source of U.S. land cover. NLCD includes map products characterizing land cover and change across nine epochs from 2001 to 2020, with 20 classes represented [51]
Table A4. List of Landsat level 1 and 2 product users, including L1TP TOA, Surface Reflectance, Surface Temperature, Surface Reflectance Analysis-Ready Data (ARD), and Surface Temperature ARD supporting the Agriculture and Forestry Societal Benefit Area (SBA) (✓ = used, X = not used). Duplicative uses within a single project were consolidated for the purposes of this table. Power users were determined by looking at the normalized impact a single Landsat product has on the user project and removing any that had less than a 35% normalized impact. This serves to eliminate any projects where Landsat is an ancillary dataset.
DepartmentAgencySurveyed Product NamePower UserLandsat OLILandsat TIRS
Department of the InteriorBureau of Land ManagementEmergency Stabilization and Rehabilitation or Burned Area Emergency Response (BAER)XX
Fish and Wildlife ServiceFWS Wetland Evaluation Tool (WET)X
National Wildlife Refuge SystemXX
Wildlife Landscape ManagementX
National Parks ServiceAK Fire Perimeter MappingXX
Land Cover Change MonitoringX
U.S. Bureau of ReclamationConsumptive Water Use and Loss ReportsX
Energy-Based and Remotely Sensed ET Estimates
U.S. Geological SurveyGlobal Food Security Support Analysis Data (GFSAD30)
Invasive Species Habitation Tool (INHABIT)X
Land Change Monitoring, Assessment and Projection (LCMAP)X
LANDFIRE Annual DisturbanceX
National Land Cover Database (NLCD) Land Cover
National Land Cover Database (NLCD) Percent Developed Imperviousness
Rangeland Condition Monitoring Assessment and Projection (RCMAP)X
Remote Sensing of Water QualityX
Tribal Land Vegetation and Watershed ModelingX
Understanding Agriculture Conservation PracticesX
USGS DECODE ModelX
Burned Area Reflectance Classification (BARC)X
U.S. Department of AgricultureAgricultural Research ServiceDisaggregation of the Atmosphere-Land Exchange Inverse (DisALEXI) Model
LTAR CroplandsX
LTAR Grazing LandsX
Rangeland Analysis Platform (RAP)—CoverX
Rangeland Analysis Platform (RAP)—ProductionX
Rangeland Hydrology and Erosion Model (RHEM)X
Foreign Agricultural ServiceFAS Crop AreaXX
FAS Crop YieldXX
Farm Service AgencyFSA Post-Disaster ResponseXX
National Agricultural Statistics ServiceEarly Season (in-season) CDLsXX
IMAGES Early Season Crop ForecastsXX
National Cropland Data Layer (NCDL)
Natural Resources Conservation ServiceNational Resources Inventory (NRI)XX
NRCS CEAP Wetland National AssessmentX
Soil Survey Interpretation MapsXX
SSURGOXX
Risk Management AgencyActuarial Rate MapsXX
U.S. Forest ServiceActive Fire MappingX
Big Data Mapping & Analytical Program (BIGMAP)X
FuelcastX
Hazard/Disaster Support on National Forest System LandsXX
INREV Existing Vegetation Mapping ProjectX
Insect and Disease Detection Surveys (IDS) and Condition ReportsX
Landscape Change Monitoring System (LCMS)X
Mid-Level Forest Vegetation MappingX
Monitoring Trends in Burn Severity (MTBS) XX
National Land Cover Database (NLCD) Percent Tree Canopy CoverX
Rangeland Production Monitoring Service (RPMS)X
Rapid Assessment of Vegetation Condition after Wildfire (RAVG) X
National Aeronautics and Space Administration- Global Land Cover Mapping Estimation (GLanCE) X
Google Earth Engine implementation of the Mapping Evapotranspiration at high Resolution with Internalized Calibration model (eeMETRIC) Model
Google Earth Engine implementation of the Surface Energy Balance Algorithm for Land (GEESEBAL) Model
NASA Evaporative Stress Index (ESI)XX
Operational Simplified Surface Energy Balance (SSEBOP) Model
Priestley-Taylor Jet Propulsion Laboratory (PTJPL) Model
Satellite Irrigation Management Support (SIMS) ModelX
National Oceanic and Atmospheric Administration- Coastal Change Analysis Program (C-CAP) 30 m Regional Land Cover and Change Data: OCMX
National Interagency Fire Center (NIFC) Fire Perimeter DataXX
Figure A1. Sankey diagram depicting Landsat’s connections to the Agriculture and Forestry Societal Benefit Area (SBA) value tree with Landsat colored in purple, products colored in orange, and the levels of the SBA in shades of blue. Not all connections are shown; reduced for presentation purposes. Noted agencies include the Environmental Protection Agency (EPA), the National Aeronautics and Space Administration (NASA), the U.S. Geological Survey (USGS), the Agriculture Research Service (ARS), the National Science Foundation (NSF), and the National Oceanic and Atmospheric Administration (NOAA).
Remotesensing 18 02003 g0a1

References

  1. Hansen, M.C.; Potapov, P.V.; Moore, R.; Hancher, M.; Turubanova, S.A.; Tyukavina, A.; Thau, D.; Stehman, S.V.; Goetz, S.J.; Loveland, T.R.; et al. High-Resolution Global Maps of 21st-Century Forest Cover Change. Science 2013, 342, 850–853. [Google Scholar] [CrossRef] [Scilit] [PubMed]
  2. Li, Z.; Xu, D.; Guo, X. Remote Sensing of Ecosystem Health: Opportunities, Challenges, and Future Perspectives. Sensors 2014, 14, 21117–21139. [Google Scholar] [CrossRef] [Scilit] [PubMed]
  3. Gao, Y.; Skutsch, M.; Paneque-Gálvez, J.; Ghilardi, A. Remote Sensing of Forest Degradation: A Review. Environ. Res. Lett. 2020, 15, 103001. [Google Scholar] [CrossRef] [Scilit]
  4. Lechner, A.M.; Foody, G.M.; Boyd, D.S. Applications in Remote Sensing to Forest Ecology and Management. One Earth 2020, 2, 405–412. [Google Scholar] [CrossRef] [Scilit]
  5. Weiss, M.; Jacob, F.; Duveiller, G. Remote Sensing for Agricultural Applications: A Meta-Review. Remote Sens. Environ. 2020, 236, 111402. [Google Scholar] [CrossRef] [Scilit]
  6. Sishodia, R.P.; Ray, R.L.; Singh, S.K. Applications of Remote Sensing in Precision Agriculture: A Review. Remote Sens. 2020, 12, 3136. [Google Scholar] [CrossRef] [Scilit]
  7. Muruganantham, P.; Wibowo, S.; Grandhi, S.; Samrat, N.H.; Islam, N. A Systematic Literature Review on Crop Yield Prediction with Deep Learning and Remote Sensing. Remote Sens. 2022, 14, 1990. [Google Scholar] [CrossRef] [Scilit]
  8. Torres, P.; Rodes-Blanco, M.; Viana-Soto, A.; Nieto, H.; García, M. The Role of Remote Sensing for the Assessment and Monitoring of Forest Health: A Systematic Evidence Synthesis. Forests 2021, 12, 1134. [Google Scholar] [CrossRef] [Scilit]
  9. Álvarez-Martínez, J.M.; Lugonja, T.N.; Valdés, A.; González Le Barbier, J.; Suárez, M.P.; Romero, G.H.; Radulović, M.; Knežević, M.; Tarčak, S.; Brkljač, B.; et al. Four Decades of Remote Sensing for Monitoring Terrestrial Ecosystems: A Global Review and Future Challenges. Sci. Remote Sens. 2026, 13, 100341. [Google Scholar] [CrossRef] [Scilit]
  10. Khanal, S.; Kc, K.; Fulton, J.P.; Shearer, S.; Ozkan, E. Remote Sensing in Agriculture—Accomplishments, Limitations, and Opportunities. Remote Sens. 2020, 12, 3783. [Google Scholar] [CrossRef] [Scilit]
  11. Damian, J.M.; Santi, A.L.; Fornari, M.; Da Ros, C.O.; Eschner, V.L. Monitoring Variability in Cash-Crop Yield Caused by Previous Cultivation of a Cover Crop under a No-Tillage System. Comput. Electron. Agric. 2017, 142, 607–621. [Google Scholar] [CrossRef] [Scilit]
  12. Georgi, C.; Spengler, D.; Itzerott, S.; Kleinschmit, B. Automatic Delineation Algorithm for Site-Specific Management Zones Based on Satellite Remote Sensing Data. Precis. Agric. 2018, 19, 684–707. [Google Scholar] [CrossRef] [Scilit]
  13. Leslie, C.R.; Serbina, L.O.; Miller, H.M. Landsat and Agriculture—Case Studies on the Uses and Benefits of Landsat Imagery in Agricultural Monitoring and Production; U.S. Geological Survey: Reston, VA, USA, 2017; p. 27.
  14. Giuliani, G.; Chatenoux, B.; Benvenuti, A.; Lacroix, P.; Santoro, M.; Mazzetti, P. Monitoring Land Degradation at National Level Using Satellite Earth Observation Time-Series Data to Support SDG15—Exploring the Potential of Data Cube. Big Earth Data 2020, 4, 3–22. [Google Scholar] [CrossRef] [Scilit]
  15. Hawbaker, T.J.; Vanderhoof, M.K.; Schmidt, G.L.; Beal, Y.-J.; Picotte, J.J.; Takacs, J.D.; Falgout, J.T.; Dwyer, J.L. The Landsat Burned Area Algorithm and Products for the Conterminous United States. Remote Sens. Environ. 2020, 244, 111801. [Google Scholar] [CrossRef] [Scilit]
  16. Picotte, J.J.; Bhattarai, K.; Howard, D.; Lecker, J.; Epting, J.; Quayle, B.; Benson, N.; Nelson, K. Changes to the Monitoring Trends in Burn Severity Program Mapping Production Procedures and Data Products. Fire Ecol. 2020, 16, 16. [Google Scholar] [CrossRef] [Scilit]
  17. Brooks, E.B.; Coulston, J.W.; Wynne, R.H.; Thomas, V.A. Improving the Precision of Dynamic Forest Parameter Estimates Using Landsat. Remote Sens. Environ. 2016, 179, 162–169. [Google Scholar] [CrossRef] [Scilit]
  18. NASA. Landsat’s Critical Role in Forest Management; NASA: Washington, DC, USA, 2022.
  19. Cohen, W.B.; Justice, C.O. Validating MODIS Terrestrial Ecology Products. Remote Sens. Environ. 1999, 70, 1–3. [Google Scholar] [CrossRef] [Scilit]
  20. Huang, X.; Zheng, Y.; Zhang, H.; Lin, S.; Liang, S.; Li, X.; Ma, M.; Yuan, W. High Spatial Resolution Vegetation Gross Primary Production Product: Algorithm and Validation. Sci. Remote Sens. 2022, 5, 100049. [Google Scholar] [CrossRef] [Scilit]
  21. Nagy, R.C.; Balch, J.K.; Bissell, E.K.; Cattau, M.E.; Glenn, N.F.; Halpern, B.S.; Ilangakoon, N.; Johnson, B.; Joseph, M.B.; Marconi, S.; et al. Harnessing the NEON Data Revolution to Advance Open Environmental Science with a Diverse and Data-capable Community. Ecosphere 2021, 12, e03833. [Google Scholar] [CrossRef] [Scilit]
  22. Loveland, T.R.; Dwyer, J.L. Landsat: Building a Strong Future. Remote Sens. Environ. 2012, 122, 22–29. [Google Scholar] [CrossRef] [Scilit]
  23. Wulder, M.A.; Masek, J.G.; Cohen, W.B.; Loveland, T.R.; Woodcock, C.E. Opening the Archive: How Free Data Has Enabled the Science and Monitoring Promise of Landsat. Remote Sens. Environ. 2012, 122, 2–10. [Google Scholar] [CrossRef] [Scilit]
  24. Kennedy, R.E.; Andréfouët, S.; Cohen, W.B.; Gómez, C.; Griffiths, P.; Hais, M.; Healey, S.P.; Helmer, E.H.; Hostert, P.; Lyons, M.B.; et al. Bringing an Ecological View of Change to Landsat-Based Remote Sensing. Front. Ecol. Environ. 2014, 12, 339–346. [Google Scholar] [CrossRef] [Scilit]
  25. Hemati, M.; Hasanlou, M.; Mahdianpari, M.; Mohammadimanesh, F. A Systematic Review of Landsat Data for Change Detection Applications: 50 Years of Monitoring the Earth. Remote Sens. 2021, 13, 2869. [Google Scholar] [CrossRef] [Scilit]
  26. Wulder, M.A.; Roy, D.P.; Radeloff, V.C.; Loveland, T.R.; Anderson, M.C.; Johnson, D.M.; Healey, S.; Zhu, Z.; Scambos, T.A.; Pahlevan, N.; et al. Fifty Years of Landsat Science and Impacts. Remote Sens. Environ. 2022, 280, 113195. [Google Scholar] [CrossRef] [Scilit]
  27. Abad-Segura, E.; González-Zamar, M.-D.; Vázquez-Cano, E.; López-Meneses, E. Remote Sensing Applied in Forest Management to Optimize Ecosystem Services: Advances in Research. Forests 2020, 11, 969. [Google Scholar] [CrossRef] [Scilit]
  28. Shiroma, W.; Martin, L.; Akagi, J.; Akagi, J.; Wolfe, B.; Fewell, B.; Ohta, A. CubeSats: A Bright Future for Nanosatellites. Open Eng. 2011, 1, 9–15. [Google Scholar] [CrossRef] [Scilit]
  29. Kropuenske, T.; Clauson, J.; Shaw, J.; Vrabel, J.; Ali, M.; Ranjitkar, B.; Rusten, T.; Anderson, C. JACIE Compendium\EROS CalVal Center of Excellence. 2024. Available online: https://calval.cr.usgs.gov/apps/compendium (accessed on 12 February 2026).
  30. Ramaseri Chandra, S.N.; Christopherson, J.; Casey, K.A.; Lawson, J.; Sampath, A. 2022 Joint Agency Commercial Imagery Evaluation—Remote Sensing Satellite Compendium; U.S. Geological Survey: Reston, VA, USA, 2022.
  31. Fassnacht, F.E.; White, J.C.; Wulder, M.A.; Næsset, E. Remote Sensing in Forestry: Current Challenges, Considerations and Directions. For. Int. J. For. Res. 2024, 97, 11–37. [Google Scholar] [CrossRef] [Scilit]
  32. Sweeting, M.N. Modern Small Satellites-Changing the Economics of Space. Proc. IEEE 2018, 106, 343–361. [Google Scholar] [CrossRef] [Scilit]
  33. Kim, M.J. Counting Stars and Costs: An Empirical Examination of Space Launch Cost Trend at NASA. Acta Astronaut. 2025, 232, 633–639. [Google Scholar] [CrossRef] [Scilit]
  34. World Economic Forum. Amplifying the Global Value of Earth Observation; World Economic Forum: Davos, Switzerland, 2024. [Google Scholar]
  35. Mustajoki, J.; Saarikoski, H.; Belton, V.; Hjerppe, T.; Marttunen, M. Utilizing Ecosystem Service Classifications in Multi-Criteria Decision Analysis—Experiences of Peat Extraction Case in Finland. Ecosyst. Serv. 2020, 41, 101049. [Google Scholar] [CrossRef] [Scilit]
  36. National Science & Technology Council. 2019 National Plan for Civilian Earth Observations; U.S. Geological Survey; National Science & Technology Council: Washington, DC, USA, 2019.
  37. National Science & Technology Council. National Plan for Civil Earth Observations; U.S. Geological Survey; Office of Science and Technology Policy: Washington, DC, USA, 2014.
  38. Victor, N.; Maddikunta, P.K.R.; Mary, D.R.K.; Murugan, R.; Chengoden, R.; Gadekallu, T.R.; Rakesh, N.; Zhu, Y.; Paek, J. Remote Sensing for Agriculture in the Era of Industry 5.0—A Survey. IEEE J. Sel. Top. Appl. Earth Obs. Remote Sens. 2024, 17, 5920–5945. [Google Scholar] [CrossRef] [Scilit]
  39. Page, M.J.; McKenzie, J.E.; Bossuyt, P.M.; Boutron, I.; Hoffmann, T.C.; Mulrow, C.D.; Shamseer, L.; Tetzlaff, J.M.; Moher, D. Updating Guidance for Reporting Systematic Reviews: Development of the PRISMA 2020 Statement. J. Clin. Epidemiol. 2021, 134, 103–112. [Google Scholar] [CrossRef] [Scilit] [PubMed]
  40. Ahmad, S.; Ouenniche, J.; Greening, P.; Kolosz, B.; Andresen, J.; Maroto-Valer, M.; Xu, B. A value tree for multi-criteria evaluation of sustainable aviation fuels. In Proceedings of the ICAE2019: The 11th International Conference on Applied Energy, Västerås, Sweden, 12–15 August 2019. [Google Scholar]
  41. Kaushik, P.P.; Kim, S. Value Tree Analysis Approach for Integrated Risk-Informed Decision Making: Revision of Allowed Outage Time. In Proceedings of the Reliability, Safety and Hazard Assessment for Risk-Based Technologies; Varde, P.V., Prakash, R.V., Vinod, G., Eds.; Springer: Singapore, 2020; pp. 957–966. [Google Scholar]
  42. Loveland, T.R.; Irons, J.R. Landsat 8: The Plans, the Reality, and the Legacy. Remote Sens. Environ. 2016, 185, 1–6. [Google Scholar] [CrossRef] [Scilit]
  43. Masek, J.G.; Wulder, M.A.; Markham, B.; McCorkel, J.; Crawford, C.J.; Storey, J.; Jenstrom, D.T. Landsat 9: Empowering Open Science and Applications through Continuity. Remote Sens. Environ. 2020, 248, 111968. [Google Scholar] [CrossRef] [Scilit]
  44. Crawford, C.J.; Roy, D.P.; Arab, S.; Barnes, C.; Vermote, E.; Hulley, G.; Gerace, A.; Choate, M.; Engebretson, C.; Micijevic, E.; et al. The 50-Year Landsat Collection 2 Archive. Sci. Remote Sens. 2023, 8, 100103. [Google Scholar] [CrossRef] [Scilit]
  45. Goward, S. Landsat and Earth Systems Science: Development of Terrestrial Monitoring. Photogramm. Eng. Remote Sens. 1997, 63, 887–900. [Google Scholar]
  46. Subcommittee on the United States Group on Earth Observations. 2023 Earth Observations Assessment Report: Overview and Methodology; Subcommittee on the United States Group on Earth Observations: Washington, DC, USA, 2024.
  47. MITRE. Introduction to PALMA: A Tool for Portfolio Investment Analysis; MITRE: Burlington, MA, USA, 2020; p. 13. [Google Scholar]
  48. Keeney, R.L. Value-Focused Thinking: A Path to Creative Decisionmaking; Harvard University Press: Cambridge, MA, USA, 2010. [Google Scholar]
  49. Loerch, A.G.; Rainey, L.B. Methods for Conducting Military Operational Analysis; Military Operations Research Society: Alexandria, VA, USA, 2007. [Google Scholar]
  50. Landsat Science Products\U.S. Geological Survey. 2023. Available online: https://www.usgs.gov/landsat-missions/landsat-science-products (accessed on 12 February 2026).
  51. Homer, C.; Dewitz, J.; Jin, S.; Xian, G.; Costello, C.; Danielson, P.; Gass, L.; Funk, M.; Wickham, J.; Stehman, S.; et al. Conterminous United States Land Cover Change Patterns 2001–2016 from the 2016 National Land Cover Database. ISPRS J. Photogramm. Remote Sens. 2020, 162, 184–199. [Google Scholar] [CrossRef] [Scilit] [PubMed]
  52. EOA2023 Agriculture and Forestry Tableau Dashboard. 2024. Available online: https://data.usgs.gov/datacatalog/data/USGS:661020a2d34e633466504b6a (accessed on 12 February 2026).
  53. Villela, T.; Costa, C.A.; Brandão, A.M.; Bueno, F.T.; Leonardi, R. Towards the Thousandth CubeSat: A Statistical Overview. Int. J. Aerosp. Eng. 2019, 2019, 5063145. [Google Scholar] [CrossRef] [Scilit]
  54. Bouzoukis, K.-P.; Moraitis, G.; Kostopoulos, V.; Lappas, V. An Overview of CubeSat Missions and Applications. Aerospace 2025, 12, 550. [Google Scholar] [CrossRef] [Scilit]
  55. Liang, X.; Kukko, A.; Balenović, I.; Saarinen, N.; Junttila, S.; Kankare, V.; Holopainen, M.; Mokroš, M.; Surový, P.; Kaartinen, H.; et al. Close-Range Remote Sensing of Forests: The State of the Art, Challenges, and Opportunities for Systems and Data Acquisitions. IEEE Geosci. Remote Sens. Mag. 2022, 10, 32–71. [Google Scholar] [CrossRef] [Scilit]
  56. Wu, B.; Zhang, M.; Zeng, H.; Tian, F.; Potgieter, A.B.; Qin, X.; Yan, N.; Chang, S.; Zhao, Y.; Dong, Q.; et al. Challenges and Opportunities in Remote Sensing-Based Crop Monitoring: A Review. Natl. Sci. Rev. 2023, 10, nwac290. [Google Scholar] [CrossRef] [Scilit] [PubMed]
  57. Guiop-Servan, R.E.; Cotrina-Sanchez, A.; Puerta-Culqui, J.; Oliva-Cruz, M.; Barboza, E. Remote Sensing for Wildfire Mapping: A Comprehensive Review of Advances, Platforms, and Algorithms. Fire 2025, 8, 316. [Google Scholar] [CrossRef] [Scilit]
  58. Chen, N.; Feng, Y.; Wang, N.; Yu, J.; Alizadeh, M.R.; Cui, Y.; Ye, N.; Jiao, W.; Fisher, J.B.; Terrer, C. High Spatiotemporal Resolution Monitoring of Crop Water Stress across the Contiguous United States Using Harmonized Landsat and Sentinel-2 Data. Agric. Water Manag. 2026, 323, 110094. [Google Scholar] [CrossRef] [Scilit]
  59. Ryan, K.C.; Opperman, T.S. LANDFIRE—A National Vegetation/Fuels Data Base for Use in Fuels Treatment, Restoration, and Suppression Planning. For. Ecol. Manag. 2013, 294, 208–216. [Google Scholar] [CrossRef] [Scilit]
  60. Xian, G.Z.; Smith, K.; Wellington, D.; Horton, J.; Zhou, Q.; Li, C.; Auch, R.; Brown, J.F.; Zhu, Z.; Reker, R.R. Implementation of the CCDC Algorithm to Produce the LCMAP Collection 1.0 Annual Land Surface Change Product. Earth Syst. Sci. Data 2022, 14, 143–162. [Google Scholar] [CrossRef] [Scilit]
  61. Kurbanov, E.; Vorobev, O.; Lezhnin, S.; Sha, J.; Wang, J.; Li, X.; Cole, J.; Dergunov, D.; Wang, Y. Remote Sensing of Forest Burnt Area, Burn Severity, and Post-Fire Recovery: A Review. Remote Sens. 2022, 14, 4714. [Google Scholar] [CrossRef] [Scilit]
  62. Chaves, M.E.D.; Picoli, M.C.A.; Sanches, I.D. Recent Applications of Landsat 8/OLI and Sentinel-2/MSI for Land Use and Land Cover Mapping: A Systematic Review. Remote Sens. 2020, 12, 3062. [Google Scholar] [CrossRef] [Scilit]
  63. Macarringue, L.; Bolfe, É.; Roberto, P. Developments in Land Use and Land Cover Classification Techniques in Remote Sensing: A Review. J. Geogr. Inf. Syst. 2022, 14, 1–28. [Google Scholar] [CrossRef]
  64. Yang, L.; Jin, S.; Danielson, P.; Homer, C.; Gass, L.; Bender, S.M.; Case, A.; Costello, C.; Dewitz, J.; Fry, J.; et al. A New Generation of the United States National Land Cover Database: Requirements, Research Priorities, Design, and Implementation Strategies. ISPRS J. Photogramm. Remote Sens. 2018, 146, 108–123. [Google Scholar] [CrossRef] [Scilit]
  65. Sohl, T.; Jin, S.; Dewitz, J.; Wickham, J.; Brown, J.; Stehman, S.; Herold, N.; Schleeweis, K.; Tollerud, H.; Deering, C. Thirty Years of the U.S. National Land Cover Database: Impacts and Future Direction. Photogramm. Eng. Remote Sens. 2025, 91, 647–659. [Google Scholar] [CrossRef] [Scilit]
  66. Wickham, J.; Stehman, S.V.; Sorenson, D.G.; Gass, L.; Dewitz, J.A. Thematic Accuracy Assessment of the NLCD 2019 Land Cover for the Conterminous United States. GIScience Remote Sens. 2023, 60, 2181143. [Google Scholar] [CrossRef] [Scilit] [PubMed]
  67. Wickham, J.; Stehman, S.V.; Homer, C.G. Spatial Patterns of the United States National Land Cover Dataset (NLCD) Land-Cover Change Thematic Accuracy (2001–2011). Int. J. Remote Sens. 2018, 39, 1729–1743. [Google Scholar] [CrossRef] [Scilit] [PubMed]
  68. Claverie, M.; Ju, J.; Masek, J.G.; Dungan, J.L.; Vermote, E.F.; Roger, J.-C.; Skakun, S.; Justice, C.O. The Harmonized Landsat and Sentinel-2 Surface Reflectance Data Set. Remote Sens. Environ. 2018, 219, 145–161. [Google Scholar] [CrossRef] [Scilit]
  69. Pekel, J.-F.; Cottam, A.; Gorelick, N.; Belward, A.S. High-Resolution Mapping of Global Surface Water and Its Long-Term Changes. Nature 2016, 540, 418–422. [Google Scholar] [CrossRef] [Scilit] [PubMed]
  70. Long, T.; Zhang, Z.; He, G.; Jiao, W.; Tang, C.; Wu, B.; Zhang, X.; Wang, G.; Yin, R. 30 m Resolution Global Annual Burned Area Mapping Based on Landsat Images and Google Earth Engine. Remote Sens. 2019, 11, 489. [Google Scholar] [CrossRef] [Scilit]
  71. USGEO. About the Earth Observation Assessment. 2025. Available online: https://usgeo.gov/eoa/ (accessed on 13 February 2026).
  72. Rowe, J.M.; Vanderhoof, M.K. Earth Observation Assessment (EOA) 2023 Tableau Dashboard Data. 2024. Available online: https://www.usgs.gov/data/earth-observation-assessment-eoa-2023-tableau-dashboard-data (accessed on 13 February 2026).
  73. Earth Resources Observation and Science (EROS) Center. Landsat 8-9 Operational Land Imager/Thermal Infrared Sensor Level-1, Collection 2. 2020. Available online: https://data.usgs.gov/datacatalog/data/USGS:EROS5e81f14f59432a27 (accessed on 28 January 2026).
  74. Earth Resources Observation and Science (EROS) Center. Landsat 4-9 U.S. Analysis Ready Data, Collection 2. 2021. Available online: https://www.usgs.gov/centers/eros/science/usgs-eros-archive-landsat-archives-landsat-collection-2-us-analysis-ready-data (accessed on 28 January 2026).
  75. Jones, J.W. Improved Automated Detection of Subpixel-Scale Inundation—Revised Dynamic Surface Water Extent (DSWE) Partial Surface Water Tests. Remote Sens. 2019, 11, 374. [Google Scholar] [CrossRef] [Scilit]
  76. Senay, G.B. Satellite Psychrometric Formulation of the Operational Simplified Surface Energy Balance (SSEBop) Model for Quantifying and Mapping Evapotranspiration. Appl. Eng. Agric. 2018, 34, 555–566. [Google Scholar] [CrossRef] [Scilit]
Figure 1. The value tree structure, including Societal Benefit Area (SBA); sub-area; key objective (KO); key product, service, or outcome group (KPSO Group); key product, service, or outcome (KPSO); intermediate product (int prod); Earth observation input (EOI); and the role of the subject matter expert (SME). The SBA, sub-area, KO, and KPSO Groups are developed by the SBA team, indicated by an up arrow, while the KPSOs, intermediate products, and EOIs are collected by the Assessment SMEs as indicated by the down arrow, divided by a dashed line. This example shows in bold all the value tree connections for KPSO A, specifically how EOI 1 directly supports KPSO A and EOI 2 indirectly supports KPSO A. Note that KPSOs and intermediate products are both types of surveyed products. KPSOs, intermediate products (int prod), and EOIs are all considered data sources. An indirect contribution was an inherent contribution of a data source through the value tree, not mentioned by the assessment SME. EOI 1 supports KPSO A and EOI 2 supports KPSO A through Int Prod A and thus is indirectly tied. Int Prod A is also considered a direct input to KPSO A.
Remotesensing 18 02003 g001
Figure 2. Flow diagram of the value tree elicitation process that scores project and data source impact and satisfaction, including an example data collection. Data products, data sources, and scores are included for exemplary purposes only and do not represent real data collected during the assessment.
Remotesensing 18 02003 g002
Figure 3. Sunburst charts showing the impact category for Landsat Operational Land Imager (OLI) and Thermal Infrared Scanner (TIRS) for the Agriculture and Forestry Societal Benefit Area (SBA) with “Highest” indicating that it provides the highest contribution to support that area of the value tree, “Very High” indicating that it provides critical contribution, “High” indicating that it provides significant contribution, “Moderate” indicating that it provides notable contribution, “Contributes” indicating that it provides some contribution, “Supplemental” indicating that it provides minimal contribution, and “Does not contribute” indicating that it provides no contribution. A sample of key objectives with Landsat as one of the highest contributors is labelled. GhG—Greenhouse gas; reqs—requirements.
Remotesensing 18 02003 g003
Figure 4. Scatterplot depicting the impact on the Agriculture and Forestry Societal Benefit Area and the percentage of key products, services, or outcomes (KPSOs) impacted by each Earth observation input (EOI). Noted EOIs include Moderate Resolution Imaging Spectroradiometer (MODIS), Landsat Operational Land Imager (OLI), Joint Polar Satellite System (JPSS) Visible Infrared Imaging Radiometer Suite (VIIRS), Shuttle Radar Topography Mission (SRTM) Digital Elevation Model (DEM), Sentinel-2 Multispectral Instrument (MSI), and the Landsat Thermal Infrared Scanner (TIRS). Note that Aqua MODIS and Terra MODIS were abbreviated to simply “MODIS” for display efficiency. An interactive version of the tableau is available on the U.S. Group on Earth Observation website [52]. NAIP—National Agriculture Imagery Program; GPS—Global Positioning System.
Remotesensing 18 02003 g004
Figure 5. Sankey diagram of Landsat product dependencies documented in the Agriculture and Forestry Societal Benefit Area, excluding panchromatic products. The arrow shows the path from sensors to level 1–3 products. The path highlighted in dark gray with blue text is an example product flow from the Landsat Operational Land Imager (OLI) to the Landsat OLI level 1 (L1) Terrain- and Precision-Corrected (TP) Top of the Atmosphere (TOA) to the Landsat Dynamic Surface Water Extent (DSWE) product. TIRS—Thermal Infrared Sensor; ETa—actual evapotranspiration.
Remotesensing 18 02003 g005
Figure 6. Bar graph of Landsat data product users, disaggregated by product name and processing level, including Landsat Dynamic Surface Water Extent (DSWE), Landsat Operational Land Imager (OLI) Surface Reflectance, Landsat OLI Analysis-Ready Data (ARD), Landsat Thermal Infrared Scanner (TIRS) Surface Temperature, Landsat TIRS Surface Temperature Analysis-Ready Data (ARD), Landsat OLI Level 1 (L1) Terrain- and Precision-Corrected (TP) Top of the Atmosphere (TOA), and Landsat TIRS level 1 (L1) Terrain- and Precision-Corrected TP TOA.
Remotesensing 18 02003 g006
Figure 7. Sankey diagram depicting the NLCD Product Suite’s connections in the Agriculture and Forestry Societal Benefit Area, with data sources colored green and value tree nodes colored yellow. Not all connections are shown; reduced for presentation purposes. USGS—U.S. Geological Survey; BLM—Bureau of Land Management; EPA—Environmental Protection Agency; USFS—U.S. Forest Service.
Remotesensing 18 02003 g007
Table 1. Value tree elements, descriptions, and an example in the Agriculture and Forestry SBA.
Value Tree ElementDescriptionExample
SBASocietal Benefit Area (SBA)Agriculture & Forestry
SBA Sub-AreaNatural thematic subdivisions of the parent SBAEnhance food supply
Key Objective (KO)An activity within a sub-area that is clearly supported by and can be linked to Earth-observing systems, data, and productsSupport forage assessment and management for animal production
Key Product, Service, or Outcome (KPSO) GroupA group of KPSOs that belong to the same category or class of information products or research outcomesIndicators of grazing conditions
KPSOA primary or important information product, service, or outcome required to make progress toward or meet a key objectiveRangeland Condition Monitoring Assessment and Projection (RCMAP)
Data Source (Surveyed Product and/or Earth Observations Input)The data, information, and Earth-observing systems needed to produce KPSOs3D Elevation Program (3DEP) Digital Elevation Model (DEM)
Earth Observation InputAn observing system or database that is the lowest level of disaggregation in the value treeAirborne lidar
Table 2. Performance scale used to score products during the value tree elicitation process.
ScorePerformanceDescription
90Fully SatisfiedMeets all requirements
80–89GoodMeets most major requirements, with significant limitations
60–79FairMeets most major requirements, with significant limitations
40–59PoorFails to meet many major requirements, but provides some value
2–39Very PoorFails to meet most major requirements, but provides minor value
1No CapabilityProvides no value
Table 3. Landsat science product power users by organization and product group, including a list of covered applications (✓ = used, X = not used). Organizations include the Fish and Wildlife Service (FWS), the National Parks Service (NPS), the U.S. Bureau of Reclamation (USBR), the U.S. Geological Survey (USGS), the Agricultural Research Service (ARS), the National Agricultural Statistics Service (NASS), the National Resources Conservation Service (NRCS), the U.S. Forest Service (USFS), the National Aeronautics and Space Administration (NASA), and National Oceanic and Atmospheric Administration (NOAA).
DepartmentAgencyLandsat OLI ProductsLandsat TIRS ProductsSample Applications
Department of the InteriorFWSXWetlands evaluation, wildlife landscape management
NPSXLand cover change monitoring
USBREvapotranspiration estimates
USGSCoastal change, food security analysis, LANDFIRE, invasive species habitat, rangeland condition monitoring
Department of AgricultureARSEvaluation of evapotranspiration, rangeland analysis
NASSPost-disaster assessment, cropland data evaluation
NRCSXWetlands evaluation
USFSFuel estimation, landscape change monitoring, rangeland assessment
NASA-Conservation evaluation, disaster support, irrigation modeling
NOAA-XCoastal changes
Table 4. Landsat Thermal Infrared Sensor (TIRS) product users by application.
ApplicationOrganizationLandsat TIRS Example Product Users
ForestryAcademiaGlobal Forest Change
U.S. Geological Survey (USGS)National Land Cover Database (NLCD)
CropsNational Agriculture Statistics ServiceNational Cropland Data Layer
USGSGlobal Food Security Support Analysis
Water resources/qualityAgricultural Research ServiceRangeland Hydrology and Erosion Model
USGSRemote Sensing of Water Quality
Evapotranspiration (ET)U.S. Bureau of ReclamationEnergy-Base and Remotely Sensed ET Estimates
NASAEvaporative Stress Index
InteragencyOpenET
Disclaimer/Publisher’s Note: The statements, opinions and data contained in all publications are solely those of the individual author(s) and contributor(s) and not of MDPI and/or the editor(s). MDPI and/or the editor(s) disclaim responsibility for any injury to people or property resulting from any ideas, methods, instructions or products referred to in the content.