Article

Progressive Deep Learning for Accurate Winter Rapeseed Mapping in Complex Terrain: A Case Study of Hanzhong Basin, China


1
Shaanxi Key Laboratory of Land Consolidation, School of Land Engineering, Chang’an University, Xi’an 710054, China
2
School of Earth Science and Resources, Chang’an University, Xi’an 710054, China
*
Author to whom correspondence should be addressed.
Remote Sens. 2026, 18(11), 1706; https://doi.org/10.3390/rs18111706
Submission received: 8 February 2026 / Revised: 17 May 2026 / Accepted: 20 May 2026 / Published: 25 May 2026

Highlights

What are the main findings?
  • A three-stage progressive deep learning strategy based on the UNet++ architecture was developed, achieving an overall accuracy (OA) of 98.65% and mean intersection over union (mIoU) of 95.29% for winter rapeseed mapping in the Hanzhong Basin during a single growing season.
  • The proposed framework outperforms traditional physical indices (FI-R) and machine learning (SVM), effectively eliminating salt-and-pepper noise and resolving boundary ambiguity in fragmented agricultural landscapes.
  • A high-dimensional feature pool (199 variables) integrating spectral, texture, and topographic data was optimized via Random Forest, while the deep learning approach demonstrated superior semantic consistency and spatial connectivity.
What is the implication of the main finding?
  • This study establishes a high-precision technical framework for crop monitoring in fragmented basin terrains, offering critical support for regional agricultural management.
  • The progressive training mechanism provides an effective solution to the class imbalance problem and promotes stable model convergence in high-dimensional feature tensors.

Abstract

Accurate mapping of winter rapeseed cultivation areas is crucial for food security assessment and agricultural resource management, yet remains a persistent challenge in mountainous regions characterized by complex topography and highly fragmented field parcels. To address these challenges, this study develops a progressive deep learning framework using single growing-season data from the Hanzhong Basin. We conducted a structured comparison of remote sensing indices, machine learning, and deep learning approaches for rapeseed identification in heterogeneous landscapes. First, sensitivity analysis of the Flowering Index for Rapeseed was performed to identify the optimal parameterization, yielding high inter-class separability (ND = 0.959) during peak flowering and a threshold-based overall accuracy (OA) of 94.41%. Second, a multidimensional feature space was constructed by integrating Sentinel-2 spectral bands, image texture metrics, and topographic variables; Random Forest-based feature importance selection subsequently enhanced Support Vector Machine classification performance to an OA of 90.70%. Third, we proposed an innovative three-stage progressive UNet++ architecture: Stage1 focuses on binary rapeseed/non-rapeseed classification to establish spatial priors; Stage2 refines discrimination among spectrally similar vegetation classes (rapeseed and other vegetation); and Stage3 achieves comprehensive seven-class semantic segmentation. A weighted focal loss function combined with a weight inheritance mechanism was employed to mitigate class imbalance and facilitate inter-stage knowledge transfer. The final model attained an OA of 98.65% and a mean intersection over union of 95.29%, while effectively suppressing salt-and-pepper noise artifacts in geometrically fragmented parcels. Our findings demonstrate the substantial advantages of progressive deep learning strategies for crop monitoring in topographically constrained environments.

1. Introduction

As a foundational oilseed crop and a strategic bioenergy feedstock in China, winter rapeseed (Brassica napus L.) possesses substantial economic value and broad ecological benefits and has been widely cultivated across multiple continents [1]. Previous studies have demonstrated that rapeseed cultivation can effectively improve soil structure, enhance soil fertility, and reduce chemical fertilizer inputs, thereby playing a crucial role in establishing sustainable crop rotation systems [2,3,4]. In recent years, under the combined pressures of global climate change and increasingly scarce arable land resources, the timely and accurate acquisition of spatially explicit information on cultivation areas has become critical for agricultural policy formulation and establishing a spatial baseline for yield assessment, and production management [5,6,7].
Compared with traditional field surveys, remote sensing techniques, which are characterized by wide spatial coverage, high temporal resolution, non-contact observation, and cost efficiency, have emerged as a core tool for monitoring crop growth dynamics across multiple spatiotemporal scales [8]. Optical remote sensing has been most extensively applied to winter rapeseed phenological monitoring and planting area extraction. From a biophysical perspective, the conspicuous yellow flower clusters during the full flowering stage generate strong spectral responses in the red and green bands, which serve as a key phenological signature for distinguishing winter rapeseed from coexisting crops such as winter wheat [7,9]. Building on this characteristic, a diverse range of spectral-feature-based extraction methods have been proposed, ranging from early single vegetation indices to specialized flowering-stage indices, achieving satisfactory mapping performance in flat terrain.
However, winter rapeseed mapping in heterogeneous regions based solely on optical imagery still faces significant limitations [10]. On the one hand, the flowering period of winter rapeseed is relatively brief and frequently coincides with persistently cloudy and rainy weather conditions, resulting in a narrow effective observation window for optical data acquisition. On the other hand, the diversity of rapeseed cultivars and substantial variation in sowing dates lead to pronounced spatial and temporal shifts in flowering phenology across regions, complicating the unified selection of imagery and threshold settings.
With the rapid development of high-resolution optical satellites, unmanned aerial vehicles (UAVs) [11], and hyperspectral sensors, research in this field has progressed considerably. Current methodological trends can be summarized as follows: (1) time-series analyses based on NDVI or flowering-sensitive indices to support phenological detection and regional identification [7,12]; (2) the increasing adoption of multi-source data fusion strategies that integrate spectral information, texture features, and topographic factors to enhance the spatiotemporal completeness and classification robustness [13]; and (3) the application of machine learning (ML) and deep learning (DL) methods to exploit high-dimensional features spaces and spatial contextual information, demonstrating notable advantages in complex scene classification that supports future yield estimation [14,15,16]. Representative approaches include semantic segmentation based on U-Net and DeepLab architectures [13,16], pixel-level time-series classification using 1D-CNN or LSTM models [13], flower cluster detection, counting, and canopy spatial identification designed specifically for ultra-high-resolution imagery.
Despite these advances, significant challenges persist in hilly and basin-transition regions characterized by pronounced topographic relief and highly fragmented landscapes. These challenges manifest primarily in three respects. First, cultivated parcels in such regions are typically small and irregularly shaped, resulting in geometrically complex land-cover boundaries. Conventional pixel-based spectral index methods and traditional ML algorithms tend to disregard spatial contextual information, making it difficult to capture intra-field spatial continuity and leading to prominent salt-and-pepper noise and terrain-shadow interference caused by mixed pixels [17,18]. Second, in hilly–basin transition zones, the high reflectance signals of rapeseed flowers are prone to spectral confusion with bare soil, understory vegetation, and certain built-up land categories. In landscapes with interwoven and heterogeneous land-cover types, reliance on single spectral features is insufficient for stable and robust discrimination, substantially constraining further improvements in classification accuracy [7,12]. Third, existing studies have largely concentrated on incremental improvements to individual methods, whereas systematic and quantitative comparisons among physical indices approaches, conventional ML models, and DL frameworks within the same complex terrain context remain scarce. Consequently, the relative advantages, limitations, and complementary mechanisms of these methodological families are not yet comprehensively understood. Notably, while crop condition monitoring and yield estimation are ultimate goals of precision agriculture, achieving high-precision spatial identification in topographically complex and fragmented regions remains an essential prerequisite and a major technical bottleneck.
Against this background, this study selects the Hanzhong Basin, a representative winter rapeseed cultivation area in the Qinba Mountains, as the study area and proposes a comparative framework for fine-scale mapping of winter rapeseed in complex terrain. The main objectives are as follows:
(1) To refine and optimize the regional adaptability of the FI-R index through systematic parameter sensitivity analysis, with particular emphasis on its ability to suppress background noise and enhance spectral responses during the flowering stage;
(2) To construct a multidimensional feature space integrating spectral, texture, and topographic variables, and to identify key discriminative features using an RF algorithm, thereby evaluating the effectiveness of multi-source feature synergy in alleviating spectral confusion among land-cover types [13,16];
(3) To address land-cover complexity and sample imbalance by proposing a three-stage progressive learning strategy based on the UNet++ architecture, in which an adaptive weight evolution mechanism progressing from easy to difficult samples is employed to improve boundary delineation accuracy and spatial completeness for fragmented field parcels;
(4) To systematically compare the improved index-based method, ML approaches, and DL models in terms of classification accuracy, patch completeness, and overall mapping quality, thereby providing spatial information products and methodological references for winter rapeseed mapping across topographically complex terrain regions.

2. Materials and Methods

2.1. Study Area

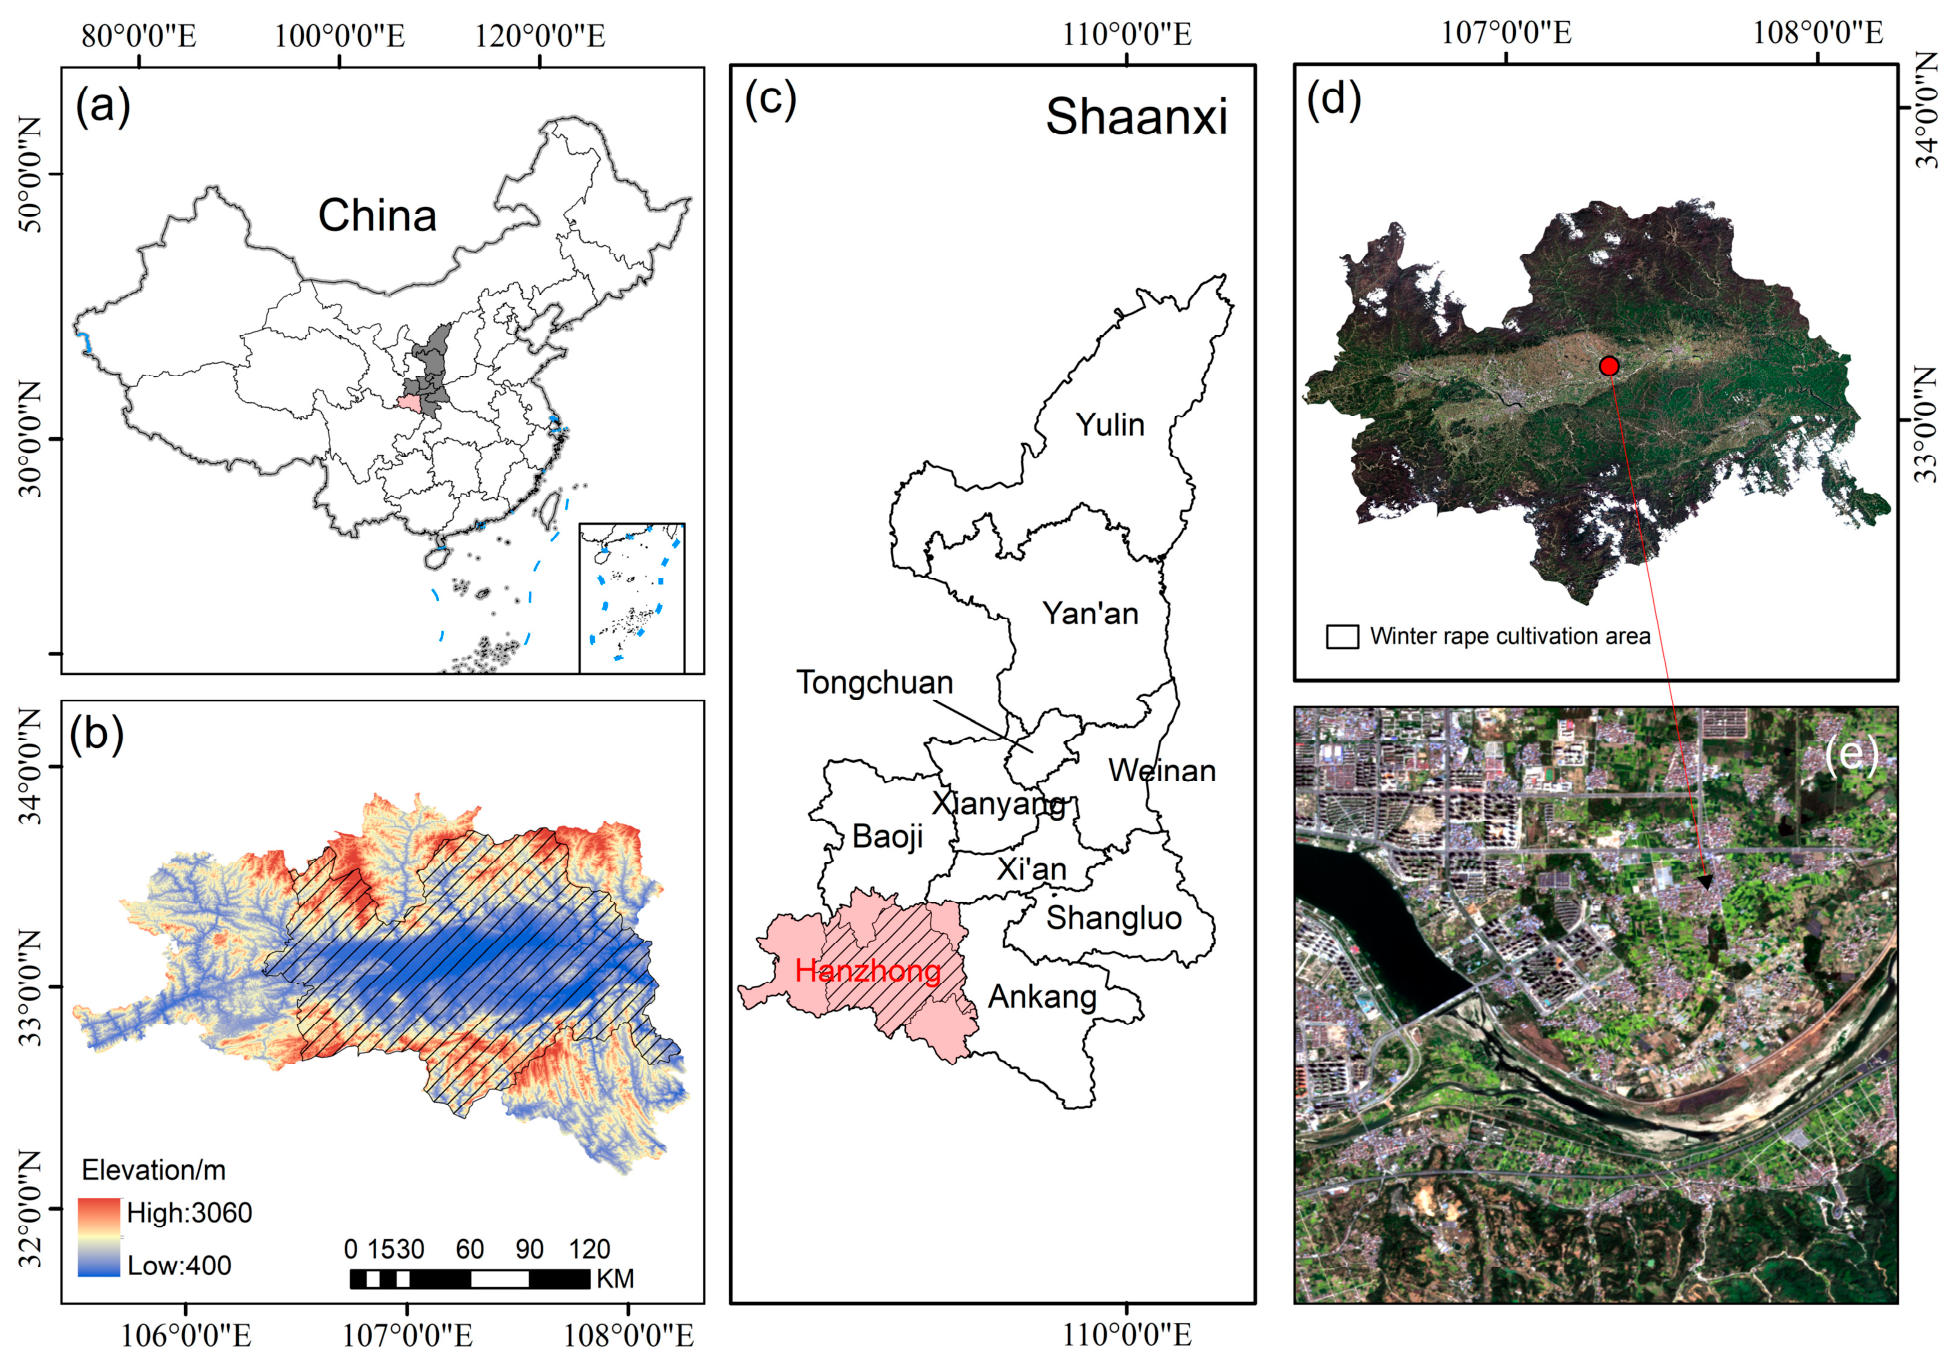
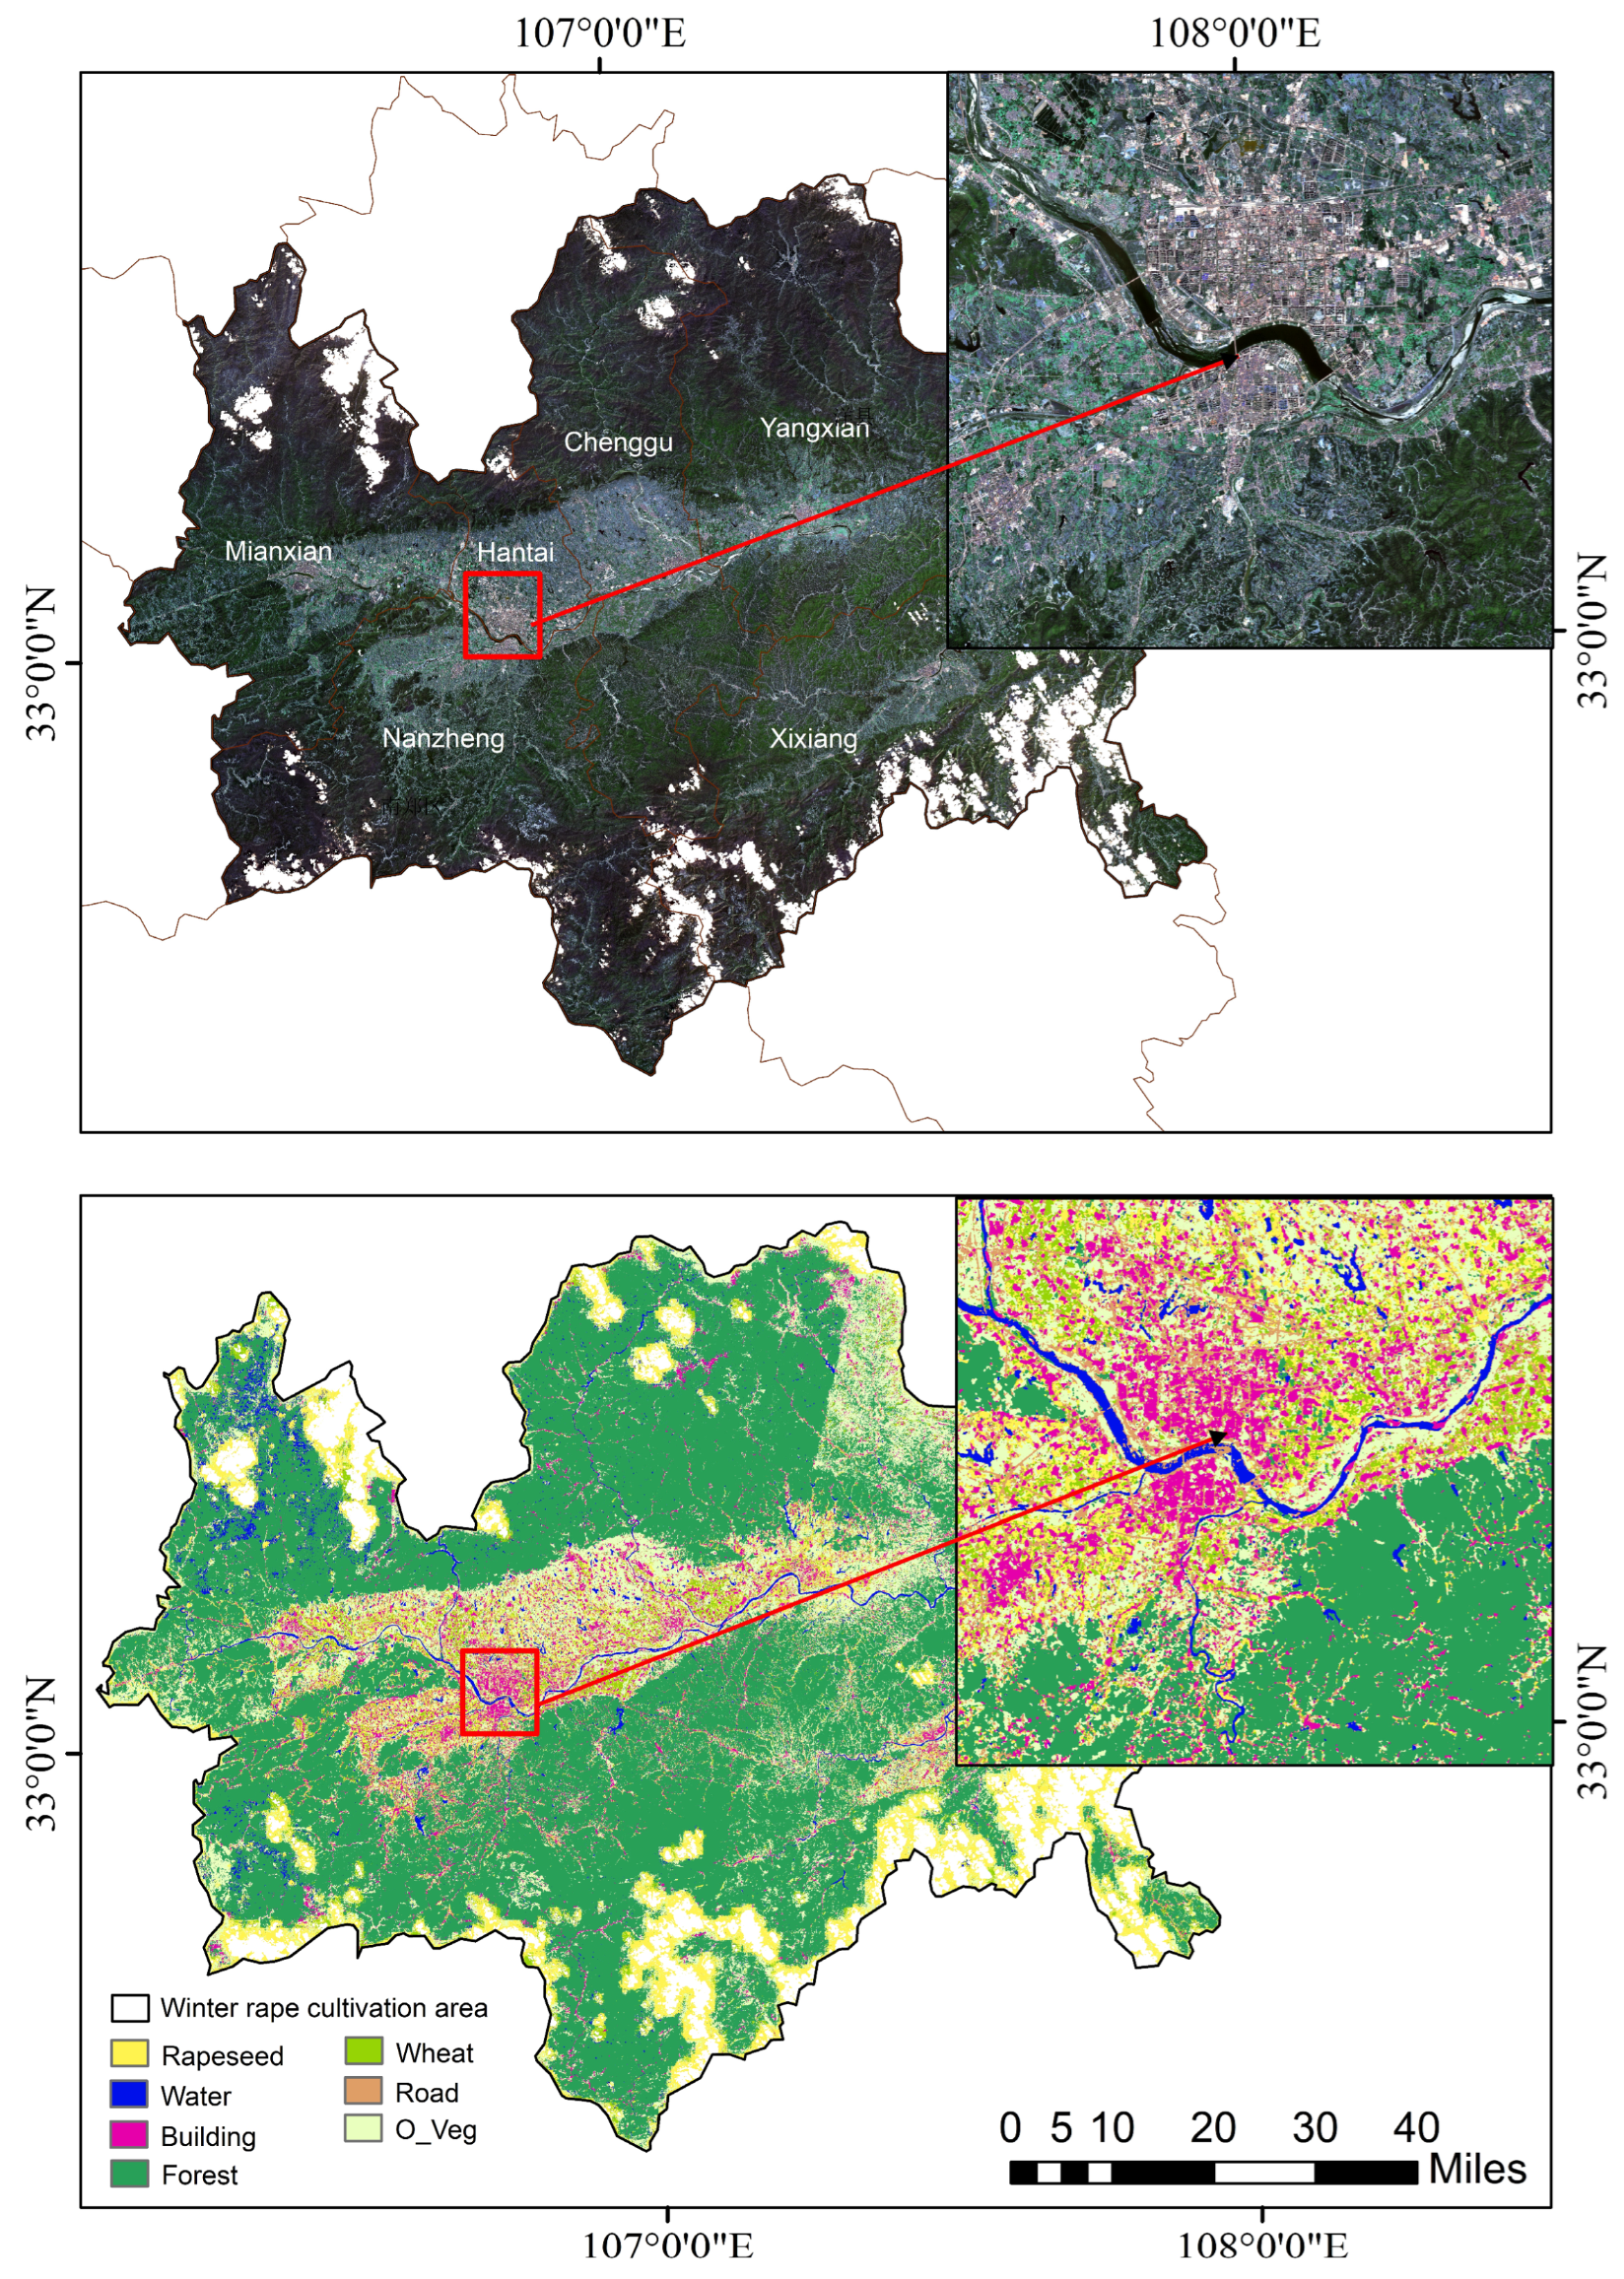
The study area is located in the Hanzhong Basin in southern Shaanxi Province (32°10′–33°20′N, 106°30′–108°10′E) (Figure 1). Situated at the junction of the southern foothills of the Qinling Mountains and the northern slopes of the Bashan Range, the basin experiences a humid subtropical monsoon climate, with a mean annual temperature of approximately 14 °C and mean annual precipitation of 850–950 mm. During the study period (2024–2025), meteorological records from the Hanzhong Municipal Meteorological Bureau indicated favorable agrometeorological conditions following autumn sowing. Notably, 90.3% of the rapeseed crop was assessed as exhibiting good or excellent growth status. The sustained temperature recovery after early February 2025 accelerated crop development and resulted in a synchronized flowering peak in mid-March. These conditions ensure that the phenological signals captured reflect standard regional patterns for this single growing season, providing a methodological benchmark for evaluating the proposed spatial mapping framework [19]. The topography exhibits pronounced vertical zonation, with elevations rising sharply from approximately 400 m at the basin floor to over 3000 m along the peripheral margins, where marked spatial heterogeneity poses a substantial challenge to crop discrimination under varying topographic conditions.
Winter rapeseed and winter wheat are the primary winter rotational crops in the study area, sharing a similar phenological calendar from sowing in October to harvest in May [20,21]. During the critical window from March to mid-April, winter rapeseed enters its peak flowering stage, marked by a distinctive yellow canopy [22]. In contrast, winter wheat is in the jointing–booting stage, exhibiting typical green vegetation spectral traits. These contrasts, coupled with a topographically complex background featuring an elevation range over 2500 m [1] and highly fragmented parcels, make this region a representative site for validating synergistic remote sensing identification strategies [23,24].

2.2. Data Sources

2.2.1. Sentinel-2 Imagery

Sentinel-2 L2A surface reflectance products covering the complete growth cycle of winter rapeseed (October 2024 to May 2025) were acquired via the Google Earth Engine (GEE) platform [25]. The Sentinel-2 mission provides multispectral imagery that is essential for operational land surface monitoring [26]. All products had undergone atmospheric correction, providing a reliable spectral foundation for constructing vegetation indices with strong sensitivity to crop phenological dynamics.
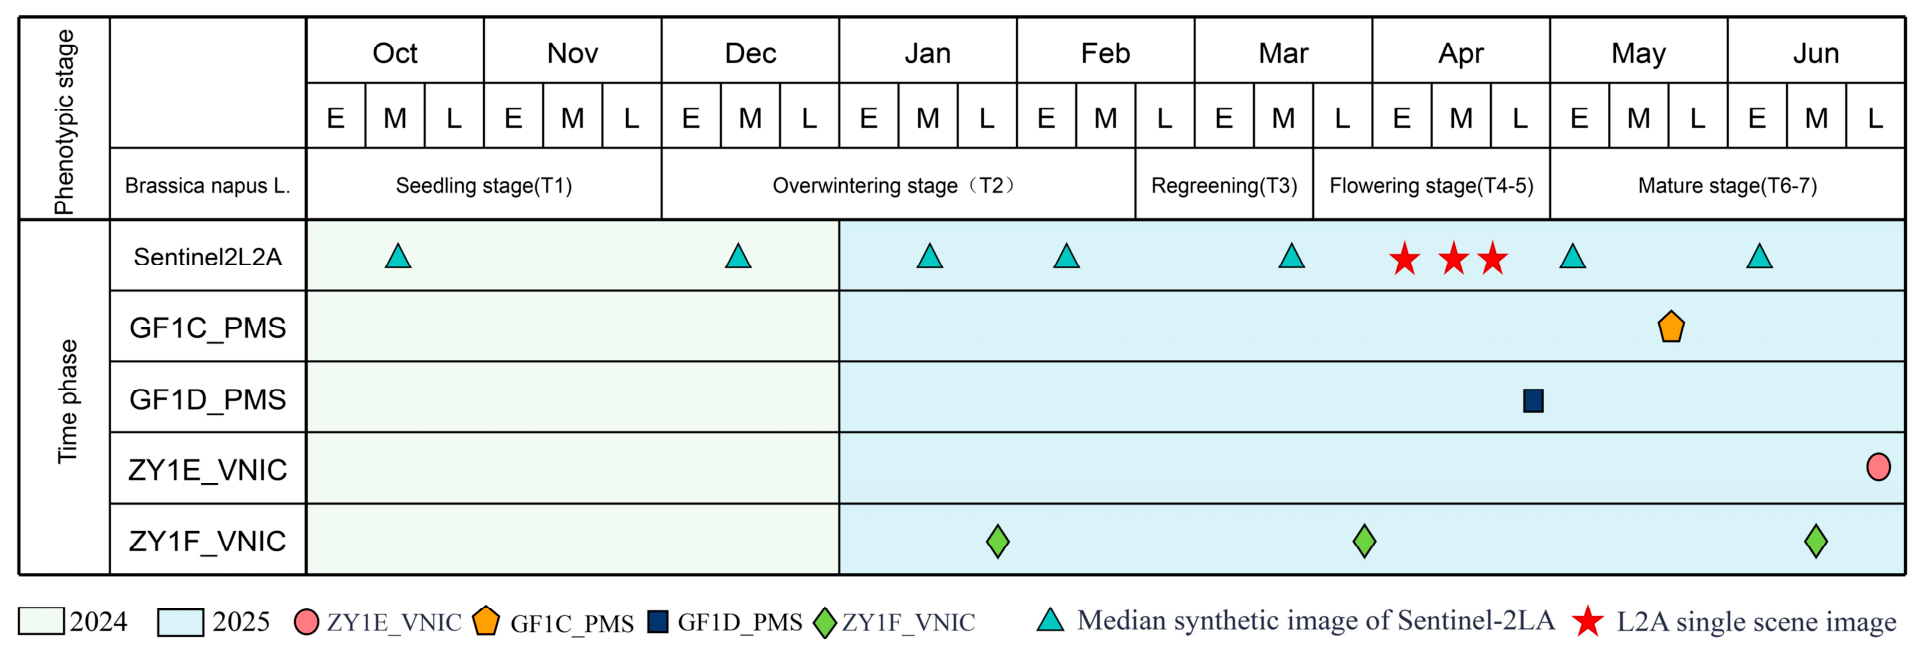
To address the limitations imposed by periodic cloud cover, a hybrid time-series synthesis strategy was implemented [27]. During non-critical phenological stages, including sowing, overwintering, and ripening, a 15-day time window was used for median synthesis, which leverages temporal redundancy to eliminate random cloud noise and shadow artifacts. During the peak flowering and pod-setting stages, where phenological transitions are rapid, cloud cover was strictly constrained to below 10%. For these periods, high-quality single-date scenes or short-window composite images spanning 3 to 5 days were selected to capture instantaneous spectral signatures and preserve the maximum phenological dynamic information [28,29].
Ten core spectral bands were utilized: visible (B2, B3, B4), red-edge (B5, B6, B7), near-infrared (B8, B8A), and shortwave infrared (B11, B12). All bands were resampled to 10 m using cubic convolution and normalized through Z-score transformation to eliminate inter-band dimensional discrepancies. This preprocessing pipeline established a consistent spectral baseline for subsequent multidimensional feature construction, yielding a multispectral dataset spanning nine critical phenological phases.

2.2.2. Topographic Data

To suppress spectral interference originating from high-altitude non-cropping areas and to mitigate the same spectrum, different objects phenomenon, elevation, slope, and aspect features were derived from SRTM 30 m digital elevation model (DEM) data [30]. These topographic variables were resampled to 10 m resolution using cubic convolution interpolation and incorporated into the modeling framework as static independent feature layers, providing spatial structural priors to guide the classification process [31].

2.2.3. High-Resolution Reference Data

To compensate for the inherent limitations of Sentinel-2 imagery in mixed-pixel decomposition and to facilitate sample labeling, high-resolution images from the Gaofen series (GF-1C, GF-1D, and GF-2D) and the Ziyuan-1 series (ZY-1E and ZY-1F) were collected during the winter rapeseed growth season [32]. These data served two primary functions: assisting in visual interpretation to construct a high-confidence training sample library; and serving as an independent validation source to evaluate the spatial detail of Sentinel-2 classification outputs.
A regional baseline database with a spatial resolution finer than 2 m was established through geometric correction and image fusion, with all imagery sourced from the China Centre for Resources Satellite Data and Application (CRESDA). Detailed acquisition dates are presented in Figure 2.
Specifically, the multispectral and panchromatic bands of the GF and ZY imagery were fused using the Gram–Schmidt pan-sharpening algorithm, producing high quality products with spatial resolutions of 0.8 m for GF 2 and 2.0 m for GF 1 and ZY 1. As illustrated in the spatiotemporal data acquisition framework, these images were strategically collected during the peak flowering stage from March to April and the maturity stage in May. This timing ensures that the high-resolution reference data accurately capture the distinctive yellow canopy phenotype and structural transitions of winter rapeseed, thereby providing a reliable benchmark for both training sample augmentation and independent accuracy validation.

2.2.4. Sample Library Construction

High-quality samples are essential for training reliable machine learning (ML) and deep learning (DL) models [33,34]. This study combined ground-truth field surveys with high-resolution image interpretation to construct a comprehensive sample library containing seven land cover categories: winter rapeseed, winter wheat, water bodies, roads, buildings, other vegetation, and forests.
Field surveys were conducted in Hanzhong City, Shaanxi Province, during mid-February 2025. Handheld GPS devices were used to record the geographic coordinates and attribute information of 225 representative plots, collectively covering all major land categories. The collected samples represent the dominant Hanyou series (hybrid varieties) widely cultivated in the Hanzhong Basin, which are characterized by high yield and synchronized flowering phenology. According to local agronomic practices, these crops followed a standardized management regime, including sowing in mid-October and targeted fertilization (e.g., boron application) during the early flowering stage in March. Such management consistency effectively reduces spectral variability associated with heterogeneous farming practices, thereby enabling the model to better capture intrinsic phenological differences among crop type variability induced by divergent farming techniques, allowing the model to focus on categorical phenological differences. Based on the field control points, sample expansion was performed by integrating Google Earth historical high-resolution imagery and GF-2 imagery with the NDVI time-series characteristics derived from concurrent Sentinel-2 data [35,36].
To ensure the fairness and independence of model evaluation, all samples were randomly partitioned into a training set (2723 samples), a validation set (389 samples), and a test set (778 samples) following a 7:1:2 ratio. The three subsets were maintained as geographically independent to prevent spatial data leakage [37]. Standardized management and favorable 2024–2025 agrometeorological conditions (Table 1) ensured that 90.3% of fields exhibited representative patterns, supporting this single-season dataset as a reliable baseline for spatial identification. A total of 3890 polygons were subsequently generated through random and spatially uniform sampling across the study area, including 1100 samples of winter rapeseed and 530 samples of winter wheat. To assess the reliability of the expanded sample library, 10% of the polygons were randomly selected for secondary cross-validation using 0.8 m resolution GF-2 imagery. The validation results achieved an overall F1-score of 0.9550, with the winter rapeseed category reaching 0.9620. These results demonstrate that the sample expansion strategy, constrained by field observations and agronomic knowledge (Table 1), is highly reliable.

2.3. Methods

This study presents a progressive remote sensing identification framework for winter rapeseed, advancing systematically from physical spectral indices to deep learning-based semantic segmentation [33,34].
Initially, to address the same spectrum, different objects phenomenon (spectral isomorphism), local parameter optimization was performed on the Flowering Index for Rapeseed (FI-R) [22]. This index-based approach leverages the unique spectral signature of the yellow canopy during the flowering stage to distinguish winter rapeseed from other green vegetation [20,21].
Secondly, by integrating multi-temporal spectral, textural, and topographic features, differentiated feature sets were constructed for both machine learning and deep learning models [29,37]. To enhance model efficiency and accuracy, redundant features were subsequently eliminated using a combination of the Random Forest (RF) classifier and the Sequential Backward Selection (SBS) algorithm [38]. This step ensures that the most discriminative variables—such as red-edge bands and terrain-derived slope/aspect—are prioritized [36].
Finally, a three-stage progressive learning strategy was introduced in conjunction with an enhanced UNet++ model to achieve spatial identification and mapping of winter rapeseed within highly fragmented landscapes [23,27]. This architecture effectively captures multi-scale spatial features, mitigating the limitations of mixed pixels in smallholder agricultural regions [32,33].

2.3.1. FI-R Index Localization and Parameter Optimization

To overcome the challenge of distinguishing winter rapeseed from spectrally similar land covers, such as winter wheat, within the context of complex topography and fragmented parcels, the FI-R was introduced and localized for this study.
During the peak flowering stage, the canopy spectrum is significantly influenced by the scattering of yellow petals, resulting in high reflectance in the green band and distinct absorption characteristics in the blue and red bands. The mathematical expression for the FI-R index is as follows [22]:
FI-R   = ρ G r e e n ρ B l u e m × ρ N I R n ρ R e d n ρ S W I R
In the equation, the first term ( ρ G r e e n / ρ B l u e ) m   is used to quantify the canopy yellowness, where the adjustment factor m controls the sensitivity to floral color characteristics. The second term ρ N I R n ρ R e d n ρ S W I R   captures the peak features of the near-infrared (NIR), with the characteristic factor n primarily balancing the weights of the red and short-wave infrared (SWIR) bands for background suppression.
Given the regional dependency of the parameters, a grid search strategy was employed for sensitivity analysis, expanding the value ranges recommended in the literature [22]. The parameter m was set from 1.0 to 10.0 with a step of 0.5, while n ranged from 0.05 to 0.35 with a step of 0.05, resulting in 35 parameter combinations.
The evaluation metrics integrated two dimensions: inter-class separability (normalized distance, ND) and classification robustness (F1-score and Area Under Curve, AUC). The formula for inter-class separability is as follows:
N D A , B = | μ A μ B | σ A + σ B
where μ A , μ B and σ 1 , σ 2 represent the mean and standard deviation of winter rapeseed and contrast land covers in the FI-R feature space, respectively. The study focuses on the discriminability between winter rapeseed and winter wheat, as well as between winter rapeseed and other photosynthetic vegetation.
For each parameter combination, the F1-score and AUC values based on optimal threshold segmentation were calculated. To balance the suppression capability of core confusing land covers with overall classification performance, a weighted fusion scoring mechanism was constructed:
S c o r e = 0.4 × N D B W + 0.3 × N D B P V + 0.3 × F 1 n o r m  
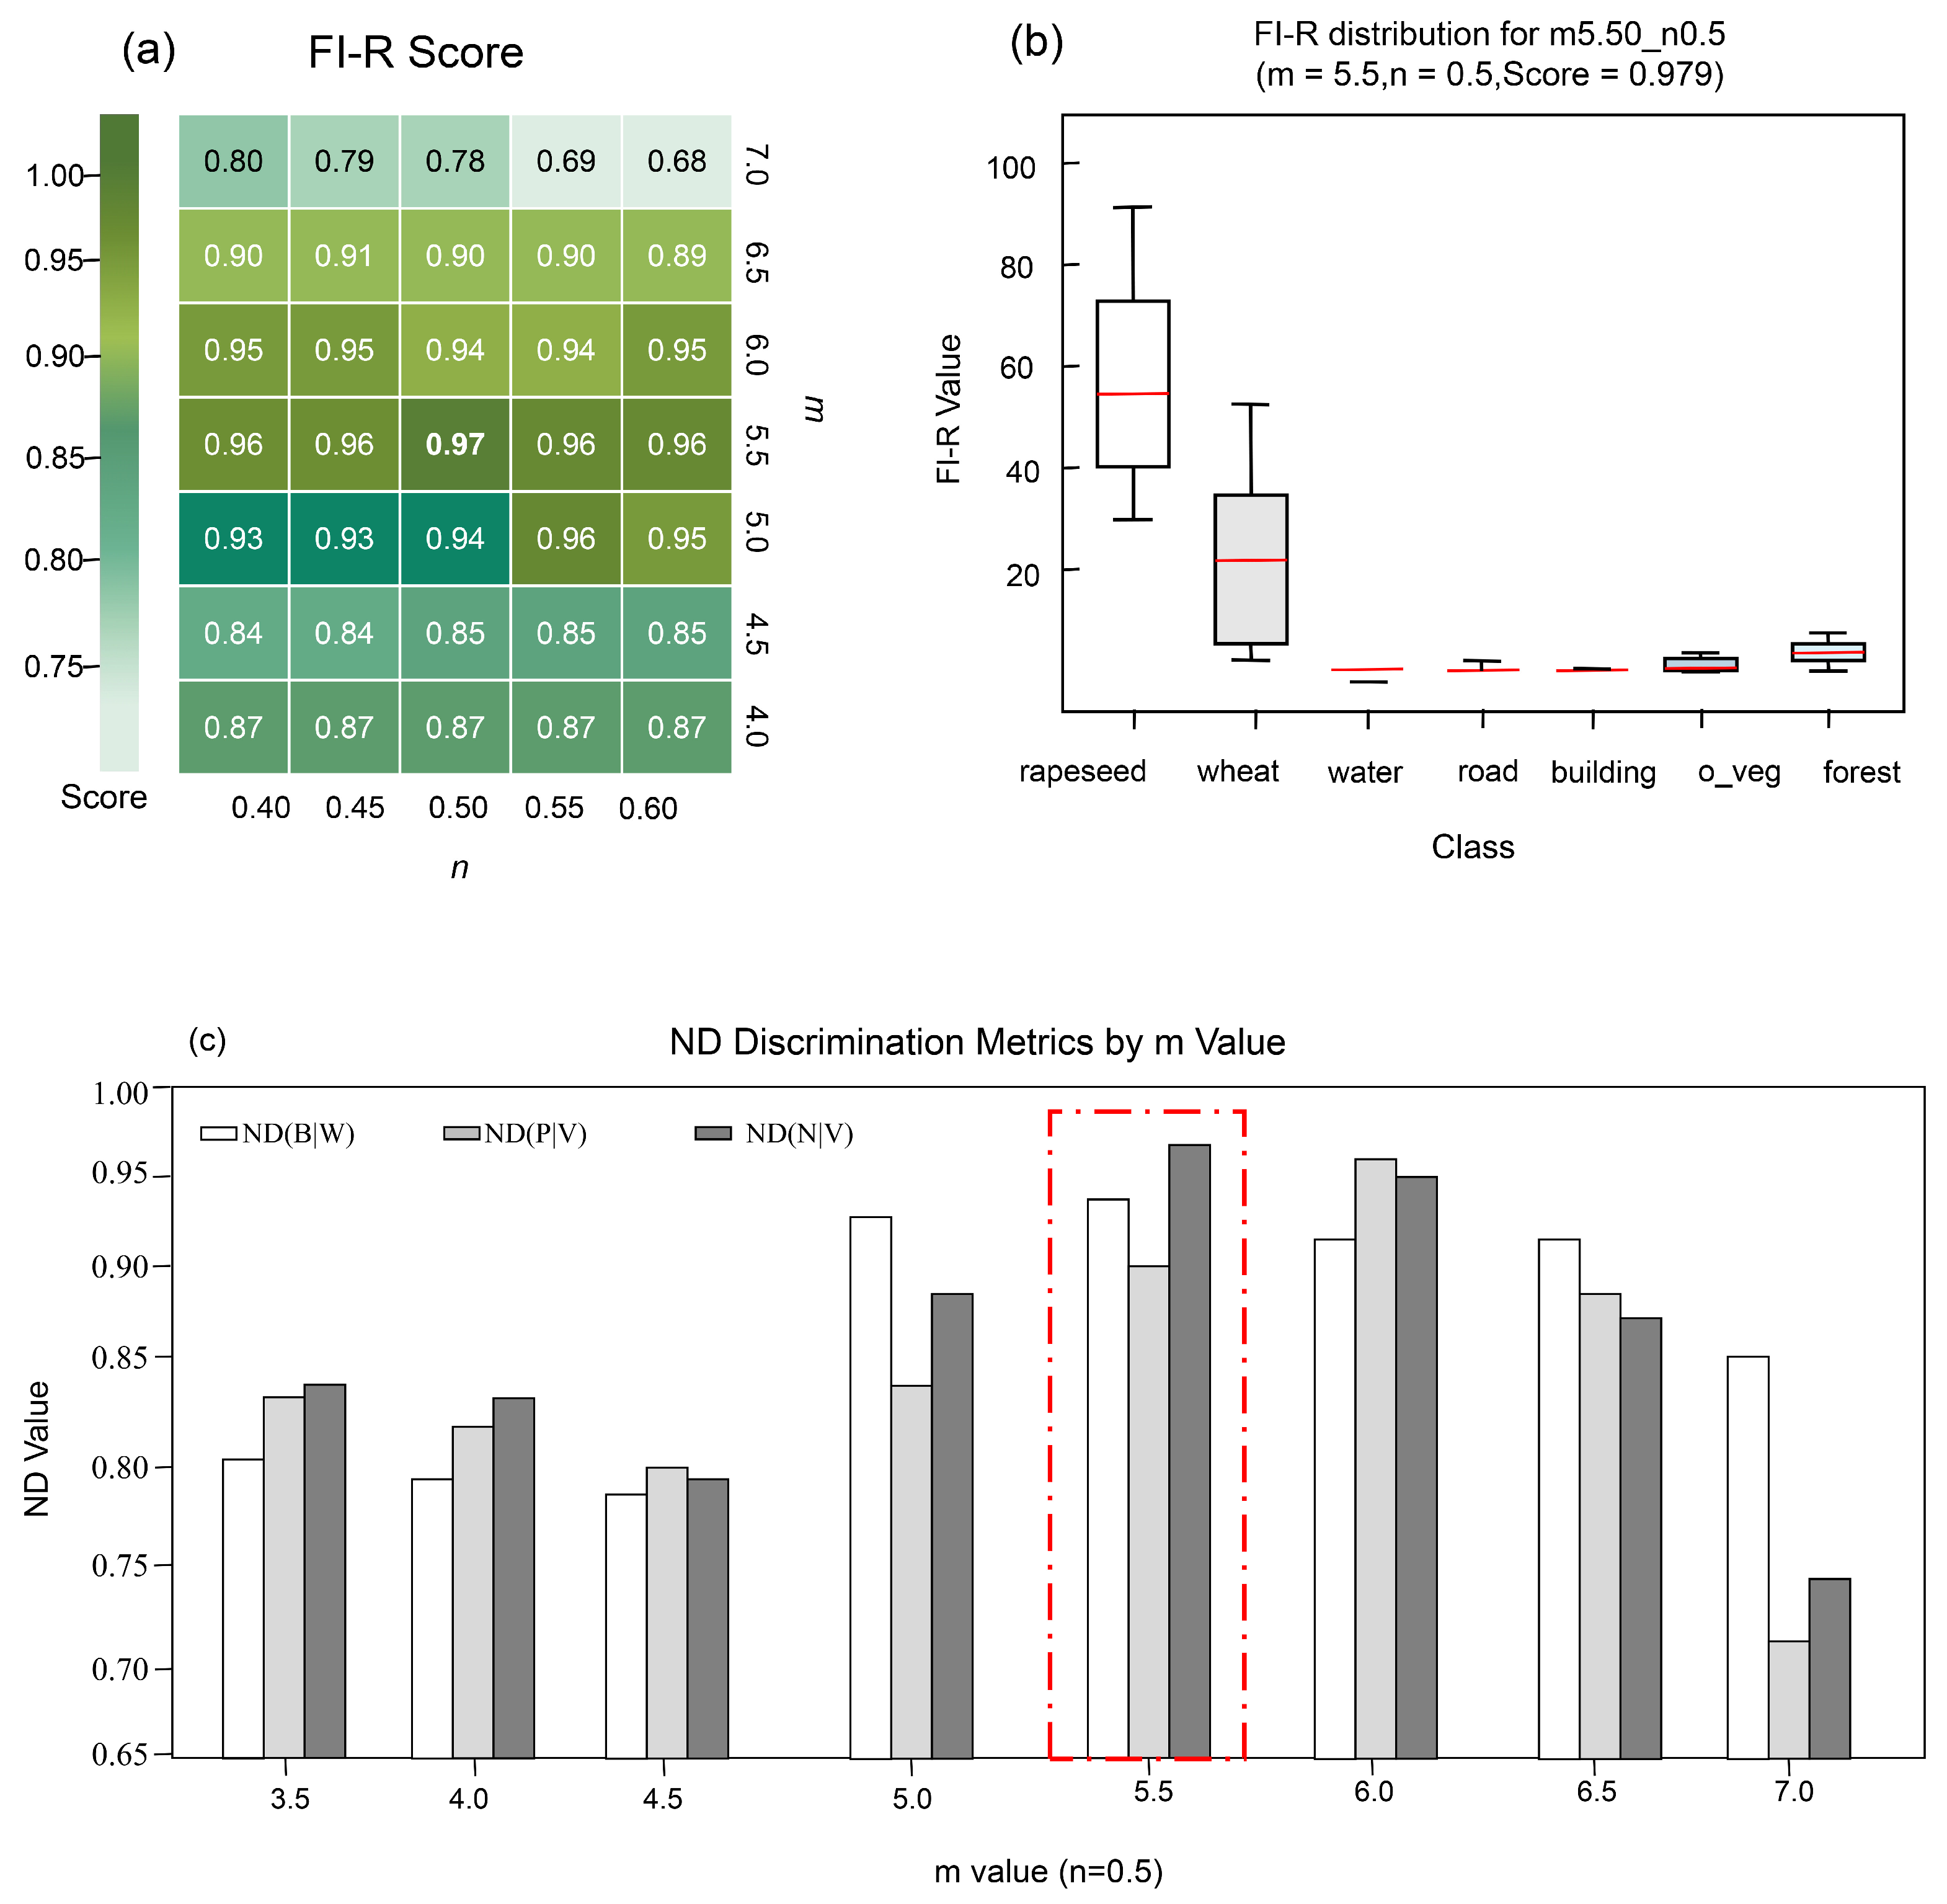
In the formula, F 1 n o r m represents the normalized F1-score. By assigning the highest weight to N D B W , the parameter optimization was driven toward maximizing contrast. Ultimately, the localized optimal parameter combination was determined as m = 5.5 and n = 0.5, serving as the foundation for subsequent multidimensional feature construction, striking a stable balance between stability and physical separability.

2.3.2. Feature Set Construction

Pixel-Level Multidimensional Feature Pool
A total of 199 initial feature variables were extracted from remote sensing imagery across nine key phenological phases to construct a multidimensional feature space (Table 2).
(1)
Spectral Features
The raw reflectance from ten core Sentinel-2 bands (B2–B8A, B11–B12) was utilized to preserve the fundamental spectral and physical characteristics of ground objects.
(2)
Vegetation Indices
Ten representative indices were computed, including conventional vegetation indices (e.g., NDVI, EVI, and SAVI), a water-related index (NDWI), and optimized indices tailored to the rapeseed flowering stage (FI-R and NDYI). These indices effectively enhance spectral separability between target crops and the surrounding background.
(3)
Texture Features
To alleviate salt-and-pepper noise caused by fragmented parcels, Gray-Level Co-occurrence Matrix (GLCM) operations were performed on the first principal component (PC1) derived from Principal Component Analysis (PCA). Eight texture metrics, including mean, variance, homogeneity, contrast, entropy, correlation, Angular Second Moment (ASM), and dissimilarity, were extracted to capture fine-scale spatial structure and heterogeneity within agricultural fields.
(4)
Topographic Features
Elevation, slope, and aspect were derived from SRTM DEM data. These variables provide terrain-related priors that help correct topographic effects on spectral reflectance and reduce misclassification in high-altitude non-cropland areas.
By integrating spectral, index-based, textural, and topographic information, a comprehensive multidimensional feature system was established, providing a robust foundation for subsequent feature selection and classification model development.
Spatial–Temporal Tensor Construction for Deep Learning
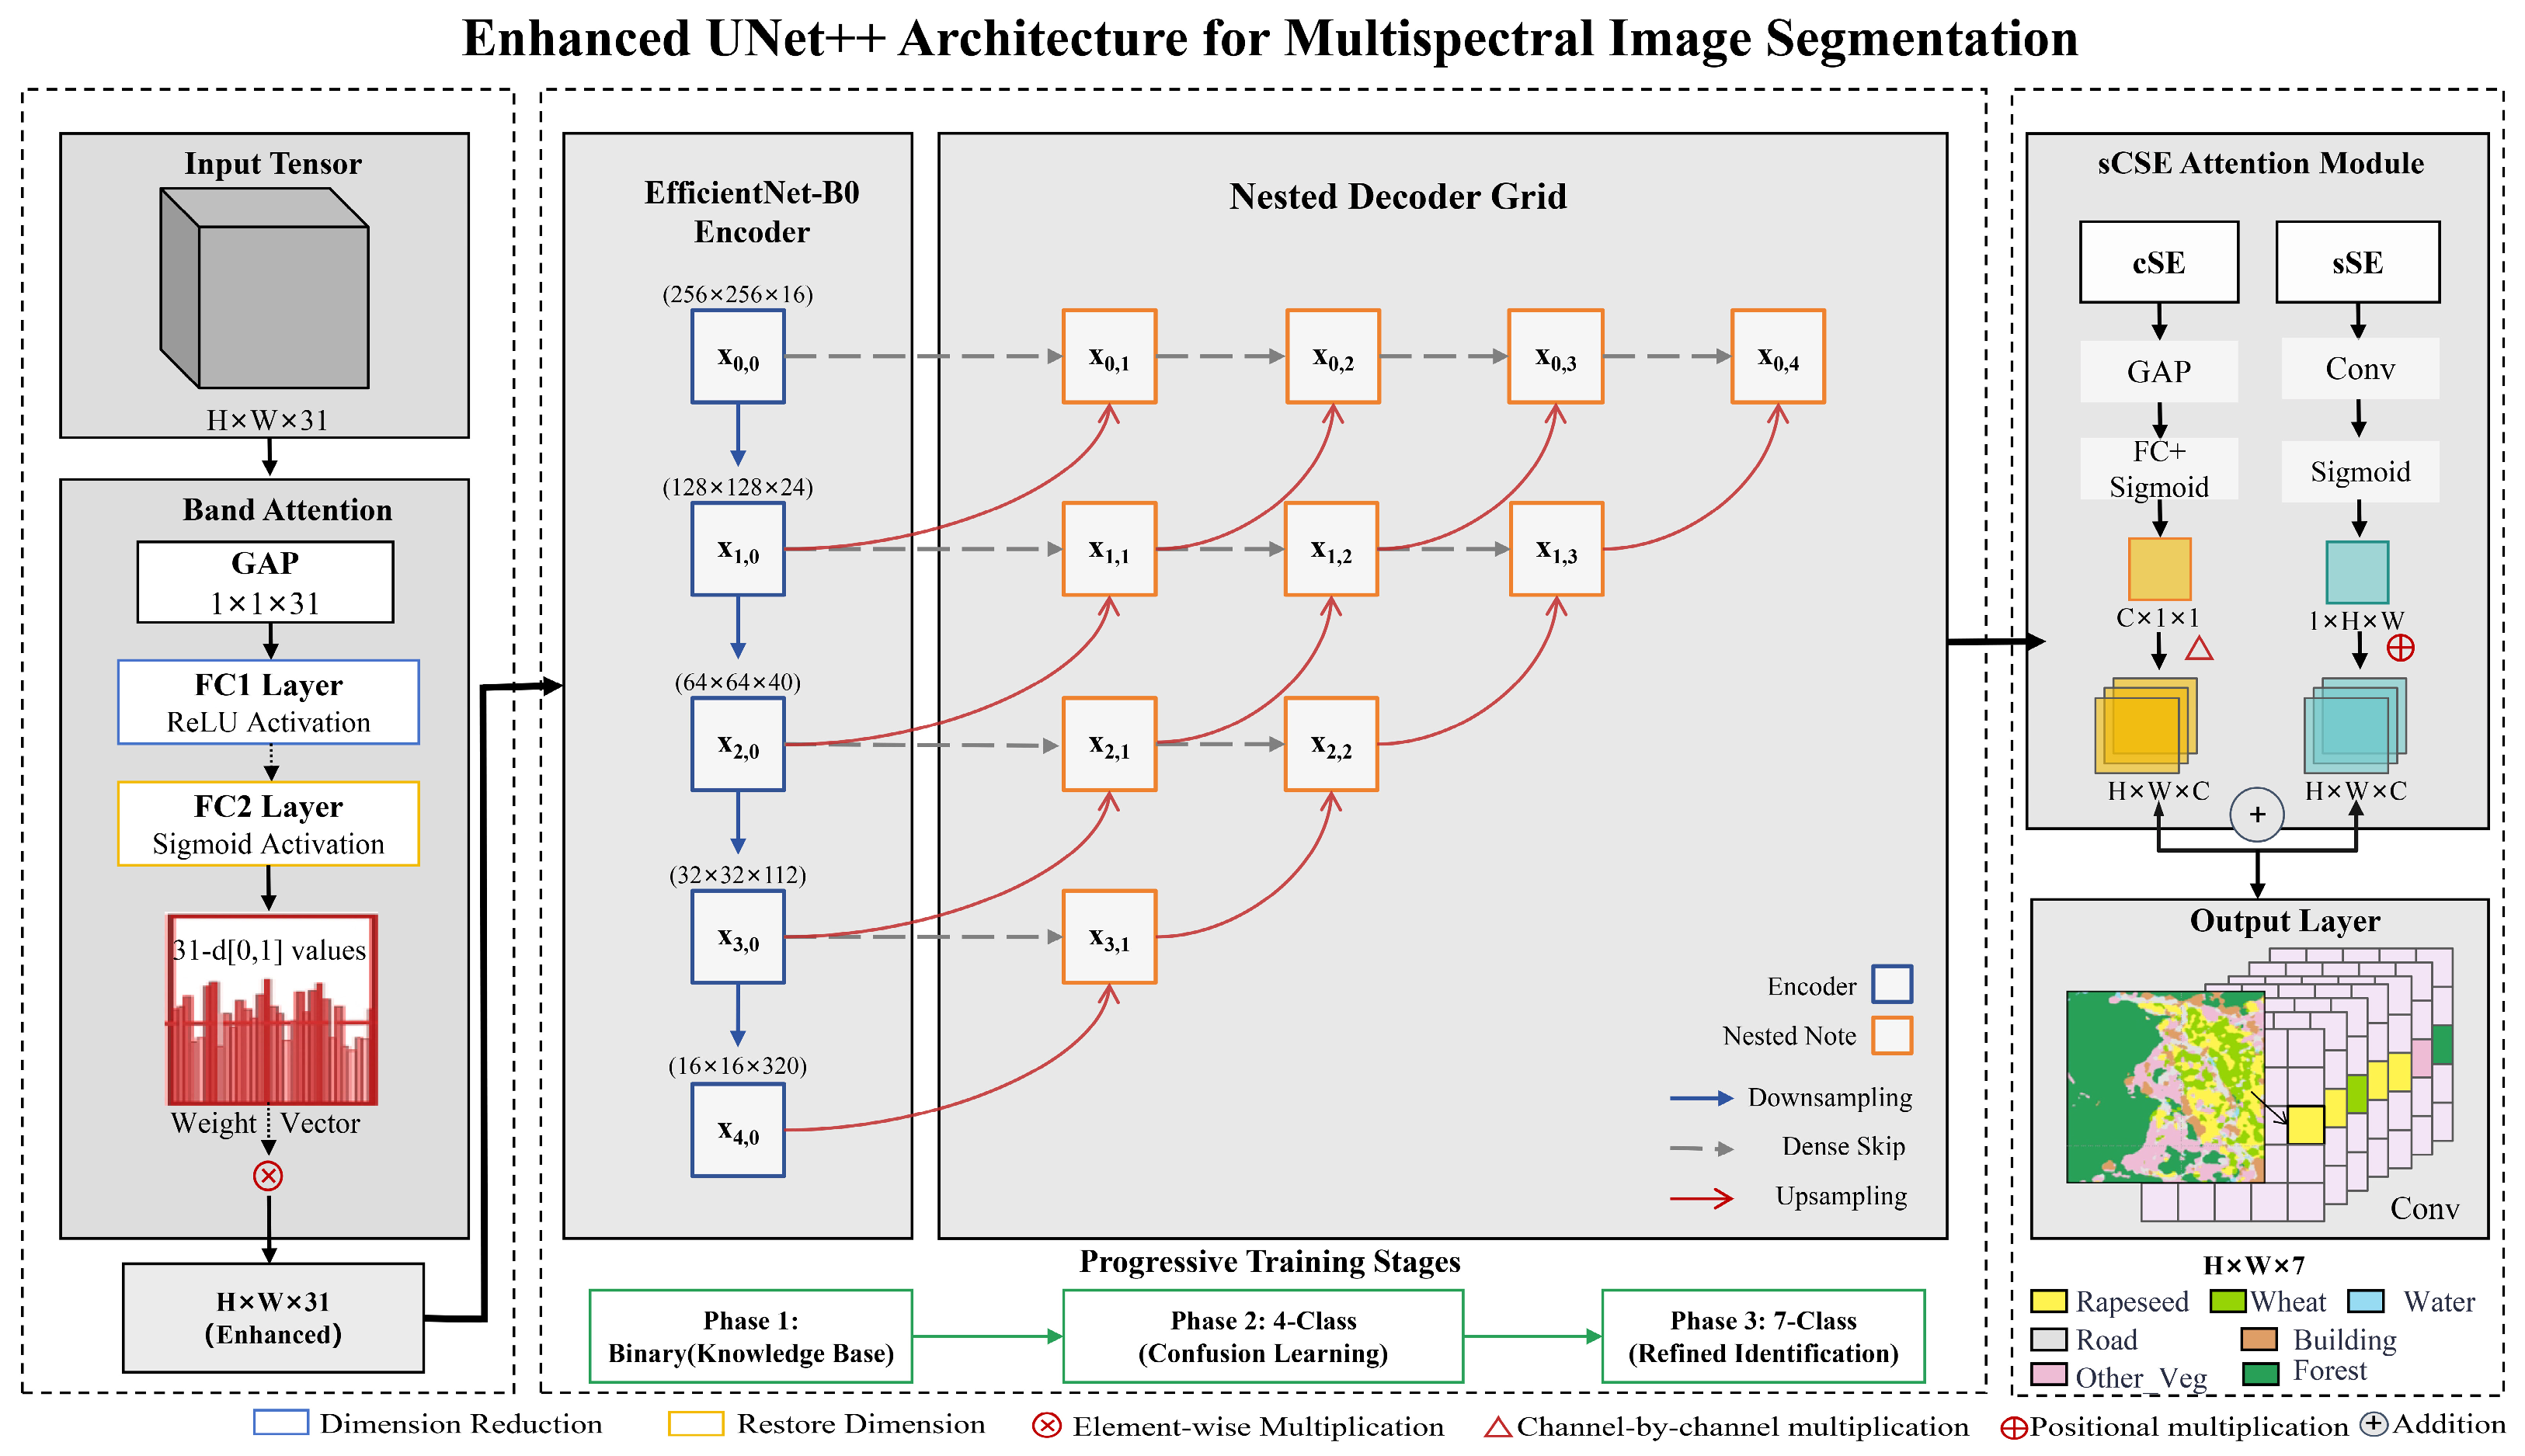
Unlike traditional machine learning approaches that rely on exhaustive feature inputs, deep learning models place greater emphasis on spatial contextual information. In this study, the 199 initial variables were refined into a 31-channel spatiotemporal feature tensor (Figure 3), integrating core spectral bands from six key phenological stages along with topographic variables.
(1)
Geometric Registration and Normalization
Accurate geometric alignment at a 10 m spatial resolution was achieved using virtual raster transformation techniques. Z-score normalization was first applied to accelerate model convergence, followed by a min–max scaling strategy to map all features into the [0, 1] range, ensuring consistency across sensors and temporal phases.
(2)
Pixel-level Label Generation
Based on high-resolution image interpretation, pixel-level label masks for seven land-cover categories were generated and strictly co-registered with the feature tensor. To address class imbalance, a random undersampling strategy was applied during rasterization to reduce the dominance of majority classes (e.g., forests and built-up areas). In addition, invalid regions were assigned an ignore index (255) to exclude non-study areas from gradient backpropagation during training.
(3)
Spatial Block Partitioning
To prevent data leakage caused by spatial autocorrelation, a sliding-window approach combined with stratified spatial block sampling was implemented. The procedure is summarized as follows:
  • Image tiles were generated using a window size of 256 × 256 pixels with a stride of 128 pixels (50% overlap), enabling data augmentation while preserving boundary continuity between adjacent patches.
  • Sequential tiles were grouped into spatially contiguous blocks based on geographic proximity.
  • Land-cover composition profiles were computed for each block based on class proportions, and stratified sampling was conducted accordingly.
  • Spatially independent blocks were then divided into training, validation, and test sets in a 7:1:2 ratio.
This strategy ensures strict geographic separation between training and test datasets, thereby providing a methodological basis for fine-scale classification in fragmented landscapes. To further enhance spatial independence, a grid-based regional isolation strategy was adopted. The study area was partitioned into multiple non-overlapping geographic units, and 3890 vector samples were assigned to these units according to their spatial coordinates. These units served as the minimum sampling entities for dataset partitioning. As a result, the test set contains 778 polygons located in entirely unseen regions, enabling an objective evaluation of model generalization under complex landscape conditions.

2.3.3. Feature Selection

While high-dimensional feature spaces can capture detailed information, they are prone to the “curse of dimensionality,” leading to overfitting and increased computational cost. To address this issue, feature importance was evaluated using the Gini importance metric derived from the Random Forest algorithm, quantifying each feature’s contribution to classification performance.
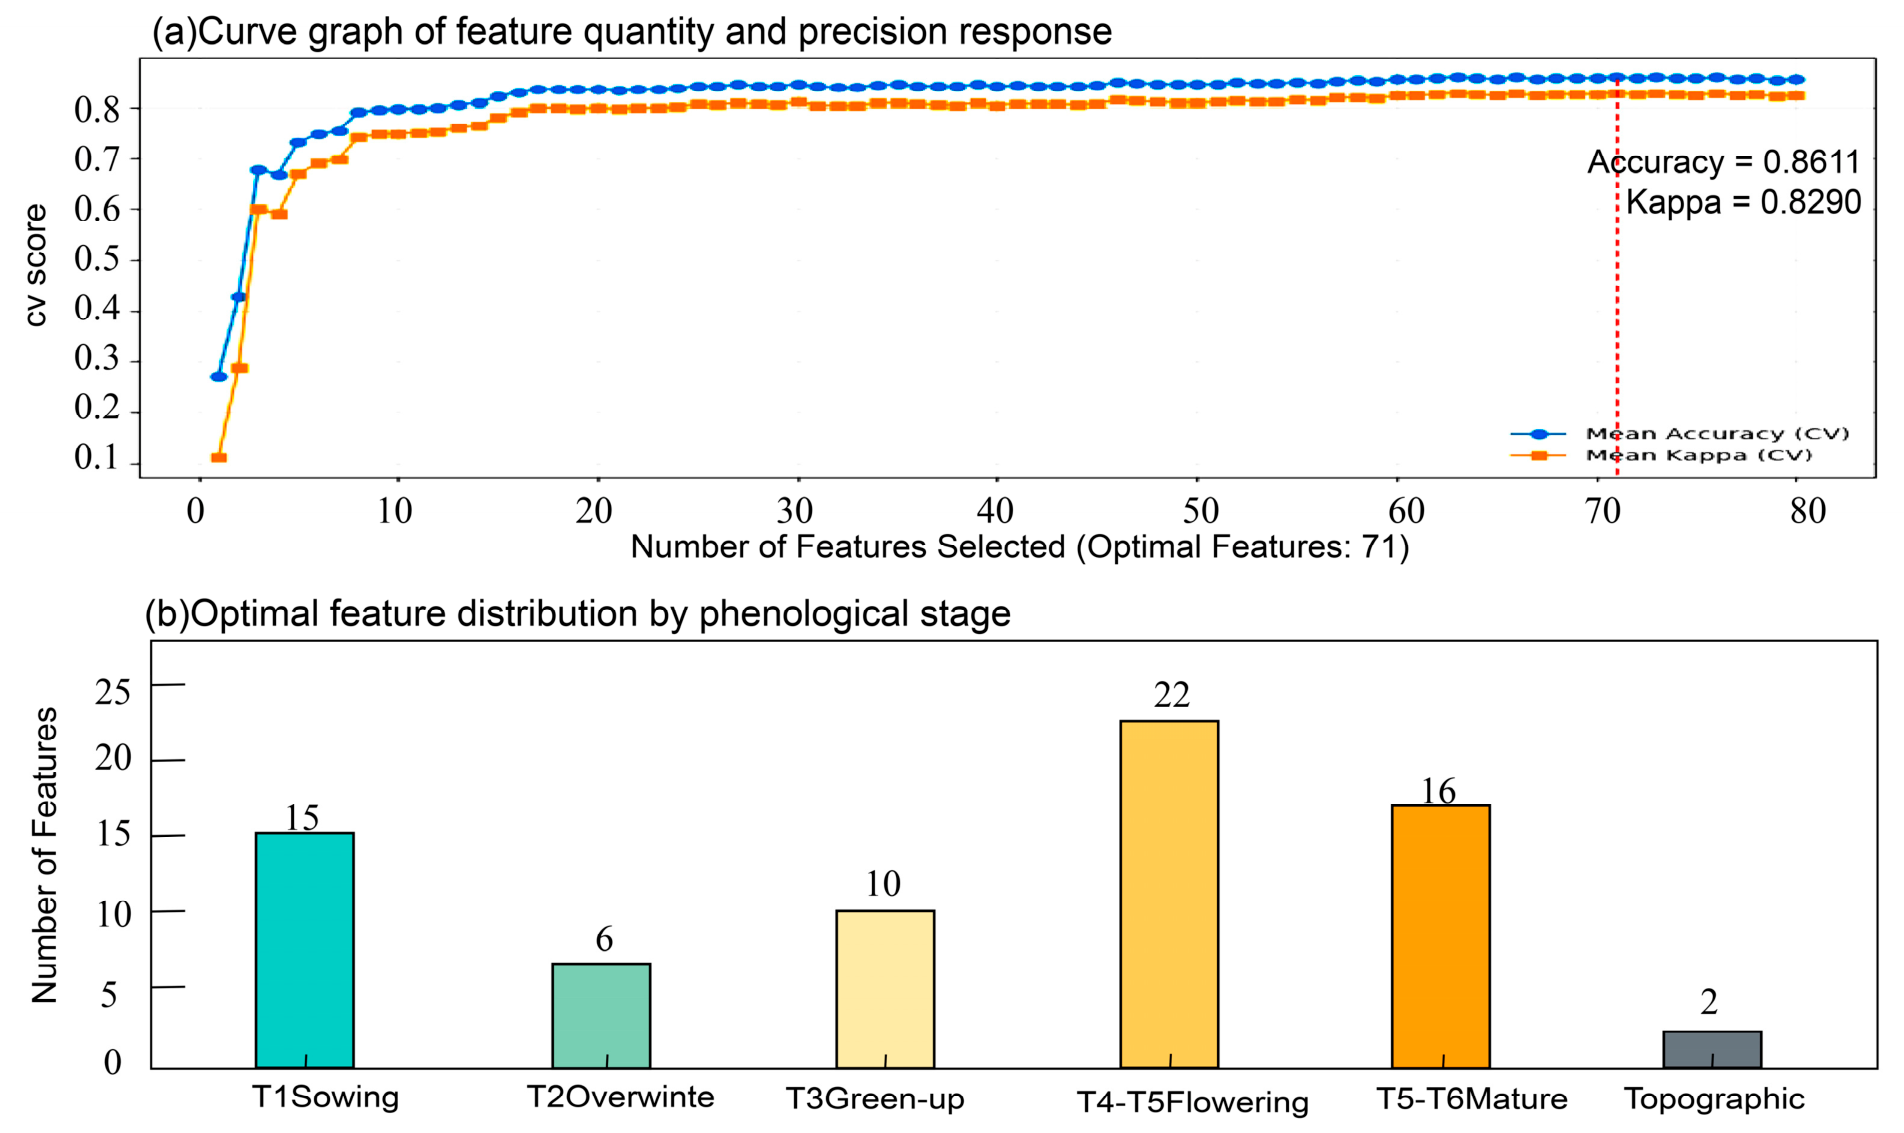
Subsequently, a Sequential Backward Selection (SBS) strategy was employed to iteratively remove low-importance features, while continuously monitoring overall accuracy on the validation set. The results show that retaining the top 71 features yields optimal classification performance with minimal redundancy, eliminating approximately 64.3% of irrelevant information.
The 71-feature subset was optimized for traditional machine learning models to maximize discriminative capability in high-dimensional space. However, directly incorporating all 71 features into a 3D spatiotemporal tensor for deep learning would significantly increase computational burden and risk GPU memory overflow.
Therefore, a further refinement was conducted to construct a compact 31-channel tensor. This selection was guided by both Gini importance ranking and key phenological stages of winter rapeseed (e.g., sowing and peak flowering). By prioritizing features with strong physical interpretability and representative temporal signals, the proposed UNet++ framework achieves an effective balance between computational efficiency and classification accuracy.
Unlike machine learning models that depend on high dimensional feature engineering, convolutional neural networks (CNNs) inherently learn spatial and hierarchical representations. Accordingly, the 31 selected features, comprising the most informative spectral bands, vegetation indices, and texture descriptors, serve as the input baseline for the deep learning model. This streamlined design reduces feature redundancy within the 3D tensor and significantly improves training efficiency in GPU-based environments while maintaining strong predictive performance.
The reduction from 71 to 31 features for the deep learning (DL) framework is guided by a dual objective: improving computational efficiency while preserving phenological signal density. Although the full set of 71 features maximizes dimensionality for pixel-based machine learning, incorporating all channels into a 3D spatiotemporal tensor (Height × Width × Channels) would introduce substantial parameter redundancy and risk GPU memory overflow in convolutional neural networks (CNNs).
To determine the optimal subset of 31 features, a phased importance-based screening strategy was employed. Specifically, the Gini importance of all 71 variables was computed, and the top-ranked features within each key phenological stage were selected to ensure a complete representation of the crop growth trajectory.
The resulting 31-channel tensor is composed of: (1) eight features from the sowing stage (T1), including B6, B7, B8, B8A, B12, NDWI, GNDVI, and FIR, to establish the farm-land baseline; (2) two features from the regreening stage (T3); (3) fourteen features from the critical flowering period (T4–T5), incorporating key indices such as FI-R, NDYI, RVI, and ARVI alongside red-edge bands to capture peak spectral variations; and (4) seven features from the maturity stages (T6–T7), such as NDWI and NDVI, to refine end-of-season classification.
This configuration reduces the data volume by 56.3% relative to the original 71-feature set, enabling the UNet++ model to focus on the most informative phenological fingerprints while maintaining stable convergence in a high-dimensional tensor environment.

2.3.4. Classification Methods and Model Evolution

Baseline: Physical Model Extraction Based on FI-R Index
As a baseline control model, the optimized FI-R index was used for single-band threshold segmentation. This method directly leverages the spectral physical characteristics of the rapeseed flowering stage. Utilizing the localized parameters determined in Section 2.3.1 (m = 5.5, n = 0.5), an FI-R feature image was generated. Subsequently, an optimal threshold method based on training sample statistics was used to binarize the image and identify rapeseed planting areas. This approach is computationally simple with clear physical significance, serving as a benchmark for evaluating the performance gains of subsequent high-order algorithms.
Machine Learning Classification Algorithms
To address the complex topographical conditions and the “same spectrum, different objects” phenomenon in the study area, four progressive feature contexts were constructed to quantitatively evaluate the contribution of incremental features to classification performance.
  • Dataset 1 serves as the spectral baseline, consisting solely of the ten raw Sentinel-2 spectral bands across the full growth cycle.
  • Dataset 2 augments Dataset 1 by incorporating key spectral indices and static topographic features, introducing terrain priors to mitigate misclassification in high-altitude mountainous regions.
  • Dataset 3 further integrates eight PCA-derived GLCM texture features, enhancing the model’s ability to capture spatial heterogeneity and discriminate fragmented landscape patterns through texture characterization.
  • Dataset 4 applies feature selection to Dataset 3 based on the method described in Section 2.3, yielding an optimal subset of 71 core features that balances model performance and computational efficiency.
To ensure robust validation, four widely used classifiers were employed for comparative evaluation. The Random Forest (RF) model leverages ensemble learning to improve robustness against noise and spatial fragmentation by aggregating multiple decision trees. The Support Vector Machine (SVM), implemented with a Radial Basis Function (RBF) kernel, constructs an optimal hyperplane in high-dimensional space and performs well on small-sample, non-linear classification tasks. Gaussian Naive Bayes (GNB) evaluates the generalization capability of the feature set from a probabilistic generative perspective. The Artificial Neural Network (ANN), based on a multi-layer perceptron architecture, assesses feature representation capacity through non-linear function approximation.
All models were trained and tested across the progressive feature contexts using 5-fold cross-validation to ensure statistical reliability. A grid search strategy was adopted to globally optimize key hyperparameters.
Deep Learning Model Based on Progressive Learning
To validate the effectiveness of the proposed progressive learning framework, a standard U-Net was implemented as a deep learning baseline. The U-Net was trained using the same 31-channel input tensor under a conventional single-stage, seven-class classification scheme, enabling direct comparison with the proposed three-stage progressive UNet++ model.
(1)
Network Architecture Design
To address the challenge of distinguishing winter rapeseed from spectrally similar vegetation, a deep learning framework integrating spatial context awareness with progressive optimization was developed. The framework is built upon an enhanced UNet++ (Nested U-Net) architecture. By introducing dense nested skip connections, UNet++ effectively reduces the semantic gap between encoder and decoder, enabling better feature fusion and more accurate preservation of boundary details in fragmented landscapes.
In addition, a three-stage Progressive Learning Scheme (PLS) was incorporated to guide the model from coarse target localization to fine-grained classification, mimicking the hierarchical process of human visual interpretation.
At the backbone level, the encoder was replaced with EfficientNet-B0, whose inverted residual blocks and MBConv modules improve non-linear feature extraction while suppressing salt-and-pepper noise, thereby enhancing spectral representation capability.
(2)
Weighted Focal Loss Function
To address class imbalance caused by uneven land-cover distribution, a weighted focal loss function was introduced (Equation (4)):
L W F L = α i ( 1 p t ) γ log ( p t )
The focusing parameter γ was set to 2.0 to down-weight easily classified samples (e.g., water bodies and forests) and force the model to focus on hard-to-classify categories such as rapeseed and wheat. The class weight coefficient αi was dynamically assigned according to the proportional area of each land-cover type, significantly improving recall for small and fragmented crop parcels.
(3)
Three-stage Progressive Learning Strategy (PLS)
A three-stage PLS was designed to evolve from basic cognitive recognition to fine-scale discrimination, mimicking human visual interpretation logic.
  • Stage 1: Rapeseed Focus Learning
A binary classification strategy is adopted to filter background noise and establish a coarse-level representation of rapeseed during the peak flowering period. The loss weights were set to αrapeseed = 15.0 and αbackground = 1.0.
  • Stage 2: Vegetation Sub-class Discrimination
Based on pre-trained weights, this stage enhances the model’s ability to distinguish phenological differences between rapeseed and wheat, thereby reducing spectral confusion. The weights were set to αrapeseed = 10.0, αwheat = 8.0, and αothers = 6.0.
  • Stage 3: Full-element Fine Segmentation
The model is extended to a seven-class classification task, refining global parameters using accumulated knowledge from previous stages. This stage maintains high accuracy for rapeseed extraction while improving spatial consistency for non-agricultural features such as roads and buildings.
(4)
Inference Strategy
To ensure spatial continuity and mitigate edge effects inherent in convolutional neural networks, an overlapping sliding-window inference strategy was adopted. A 32-pixel overlap combined with Gaussian-weighted probability fusion was applied to smooth transitions between adjacent tiles, effectively eliminating boundary artifacts and stitching seams in large-scale mapping results.

2.3.5. Accuracy Assessment and Inference

A multidimensional evaluation framework was established to comprehensively assess model reliability and generalization capacity. Overall accuracy (OA) and the Kappa coefficient were employed to characterize global classification consistency. For the primary target classes of rapeseed and winter wheat, Producer’s Accuracy (PA) and User’s Accuracy (UA) were additionally computed to quantify omission and commission errors, respectively. To capture pixel-level spatial overlap performance, which is particularly critical for evaluating deep learning-based semantic segmentation, mean Intersection over Union (mIoU) and weighted F1-score were adopted to assess boundary delineation precision at the individual pixel scale. Furthermore, normalized confusion matrices were constructed to quantitatively characterize misclassification patterns among rapeseed, wheat, and other vegetation categories. These matrices provide a direct and interpretable basis for evaluating each model’s capacity to resolve the pervasive “same spectrum, different objects” spectral confusion challenge.
To ensure a strictly fair comparison, we evaluated all models on the exact same spatial regions defined by the 778 test polygons within isolated geographic blocks. Although the deep learning model processes data at the patch level (256 × 256 pixels) to leverage spatial context, the final accuracy metrics, including OA, Kappa, F1-score, and IoU, were calculated at the pixel level. This was achieved by comparing predicted values against ground-truth labels within the test polygons. We maintained a consistent pixel-level class distribution between the test and training sets to ensure statistical reliability.

3. Results

3.1. Feature Engineering and Physical Index Analysis

3.1.1. Sensitivity Analysis and Localization Assessment of FI-R Parameters

The spectral expression intensity of winter rapeseed during the flowering stage depends heavily on the scaling factor m and background adjustment factor n in the FI-R index (FI-R). Through a grid search of 35 parameter combinations, this study found that the index performance is particularly sensitive to the canopy yellowness parameter. Experimental results demonstrate that a comprehensive evaluation framework integrating F1-score, AUC, and inter-class separability clearly reveals the evolutionary patterns of the parameter space. As the value of m increases, the yellow phenotype signal is significantly amplified, leading to a steady rise in inter-class separability. As observed in Figure 4c, separability reaches a plateau near m = 5.5, indicating minimal overlap between the probability distributions of rapeseed and background features, which results in high discriminative purity in the feature space. However, when m > 6.0, the simultaneous amplification of background noise causes distribution overlap, thereby compromising classification stability. Through localized adaptation, the optimal parameter combination was determined as m = 5.5 and n = 0.5. This configuration achieved the best performance on the validation set, with a composite score of 0.9786 and an F1-score of 0.9173, striking a balanced relationship between stability and physical separability.
The optimized FI-R index exhibits strong inter-class discriminative power in its statistical distribution (Figure 4b). Quantitative analysis shows that under the optimal parameter configuration, the mean FI-R value for winter rapeseed reaches 54.23, while the normalized distance (ND) between rapeseed and winter wheat—the confusion crop with the most similar phenological characteristics—is 0.9591, representing high inter-class separability between the target and its primary spectral competitor, and box plots reveal almost no overlap between their interquartile ranges. This significant numerical gradient effectively widens the spectral contrast between winter rapeseed and concurrent green vegetation. Furthermore, the suppression effect of FI-R on non-vegetation features such as buildings and water bodies remains stable above 0.95, confirming the reliability of the physical model in eliminating complex background interference within the basin. Although the index still faces challenges in handling forest-edge shadows and mixed pixels at the boundaries of fragmented plots, the feature baseline established through localized parameter optimization provides a useful spectrophysical foundation for the performance enhancement of subsequent high-order algorithms, serving as the logical anchor for the synergistic interpretation framework.

3.1.2. Multidimensional Feature Importance Assessment and Redundancy Elimination

After constructing the high-dimensional feature fusion space, identifying core variables and eliminating redundancy are critical steps for enhancing extraction accuracy. This study utilized the Random Forest algorithm to quantify and rank the importance of all features based on the Mean Decrease Impurity (MDI) principle. Simultaneously, a sequential backward feature selection strategy with 5-fold cross-validation monitored the evolution of OA and Kappa coefficients.
Results indicate clear differences in feature contributions across various growth stages (Figure 5). Vegetation indices during sowing and peak flowering exhibited higher discriminative capability, suggesting that red-edge spectral responses and unique flowering phenotypes are the core physical bases for distinguishing winter rapeseed from other land covers. Additionally, topographic factors carry substantial weight, highlighting the constraining role of topographic priors in the detailed interpretation of fragmented parcels. Model accuracy increased rapidly before reaching a saturation point; beyond this threshold, the accuracy curve entered a plateau due to the inclusion of redundant features.
The distribution of the optimal feature set (Table 3) reveals clear temporal heterogeneity in feature contributions. Features from the sowing and peak flowering stages are identified as important windows for differentiation. During the sowing stage, as the surface transitions from bare soil to seedlings, red-edge bands effectively characterize the differences between the farmland background and early vegetation. At peak flowering, the unique yellow petals of winter rapeseed alter canopy reflectance properties, causing the contributions of indices such as FI-R and NDYI to peak, providing a robust classification basis for the model. In contrast, features from the overwintering and green-up stages primarily provide spatial structure compensation through mean texture and certain water indices. During the maturity stage, indices like NDWI and RVI demonstrate the ability to capture vegetation moisture loss and residue cover. Furthermore, topographic factors provide necessary spatial priors, enhancing identification stability in high-altitude zones and fragmented edges.

3.2. Experimental Evaluation of Machine Learning Classification Performance

The comparison of classification results under different feature combinations indicates that the expansion and optimization of the feature space enhances winter rapeseed identification accuracy. Experimental results (Table 4) show that Dataset 1, which is based solely on original spectral bands, exhibits significant limitations in characterizing land cover. Specifically, topographic shadows in the study area cause spectral overlaps between winter wheat, forest, and winter rapeseed, leading to severe misclassification and low OA and Kappa coefficients. The introduction of topographic factors in Dataset 2 provides stronger spatial constraints, improving accuracy. Elevation and slope effectively mitigate pseudo-artifacts in high-altitude forested areas and slopes. In Dataset 3, the inclusion of texture features improves visual continuity of the classification maps, although the high dimensionality introduces some feature redundancy that slightly affects pixel-level metrics. All models achieve their peak performance with the optimal feature set, Dataset 4, which retains core discriminative information while eliminating highly correlated redundant variables. By coupling multidimensional features with phenological logic, Dataset 4 improves the F1-score of winter rapeseed, demonstrating the efficacy of a progressive feature mining strategy.
Using Dataset 4 as the benchmark input, this study conducted a horizontal comparison of four common machine learning models (RF, SVM, GNB, and ANN). Results indicate that SVM exhibits high classification performance and generalization capability, achieving an OA of 0.9070 and a Kappa of 0.8871 on the independent test set. Regarding winter rapeseed accuracy, SVM maintains a high balance with UA and PA both at 0.91. This suggests that the optimal hyperplane constructed via the Radial Basis Function (RBF) kernel effectively suppresses interference from spectral similarity (different objects with similar spectra) while alleviating the non-linear classification challenges posed by sample sparsity in high-dimensional spaces. Meanwhile, RF demonstrates strong robustness with an OA of 0.8895 and a Kappa of 0.8660. Its high UA (0.93) for rapeseed reflects a stringent identification of crop parcels. This noise resistance stems from the bagging mechanism of ensemble learning, which maintains stable predictions for high-dimensional heterogeneous data without extensive hyperparameter tuning. In contrast, ANN’s accuracy fluctuates significantly with feature dimensionality, reflecting its sensitivity to feature redundancy. In the full feature set, the ANN’s PA dropped to 0.84, indicating a notable omission rate. GNB yielded the lowest performance (OA = 0.7628), as it failed to account for the inherent spatial and spectral correlations between remote sensing bands, leading to insufficient discriminative power in highly fragmented landscapes.
In summary, the feature optimization strategy optimizes machine learning performance. Compared to the full feature set, all models show improved accuracy despite a 64% reduction in feature dimensionality; specifically, the SVM’s PA recovers from 0.83 to 0.91. These findings demonstrate that excluding redundant features and balancing class-specific accuracy are important factors for the spatial mapping of winter rapeseed.

3.3. Accuracy Analysis of Progressive Deep Learning Extraction

3.3.1. Convergence Analysis of the Three-Stage Progressive Learning Process

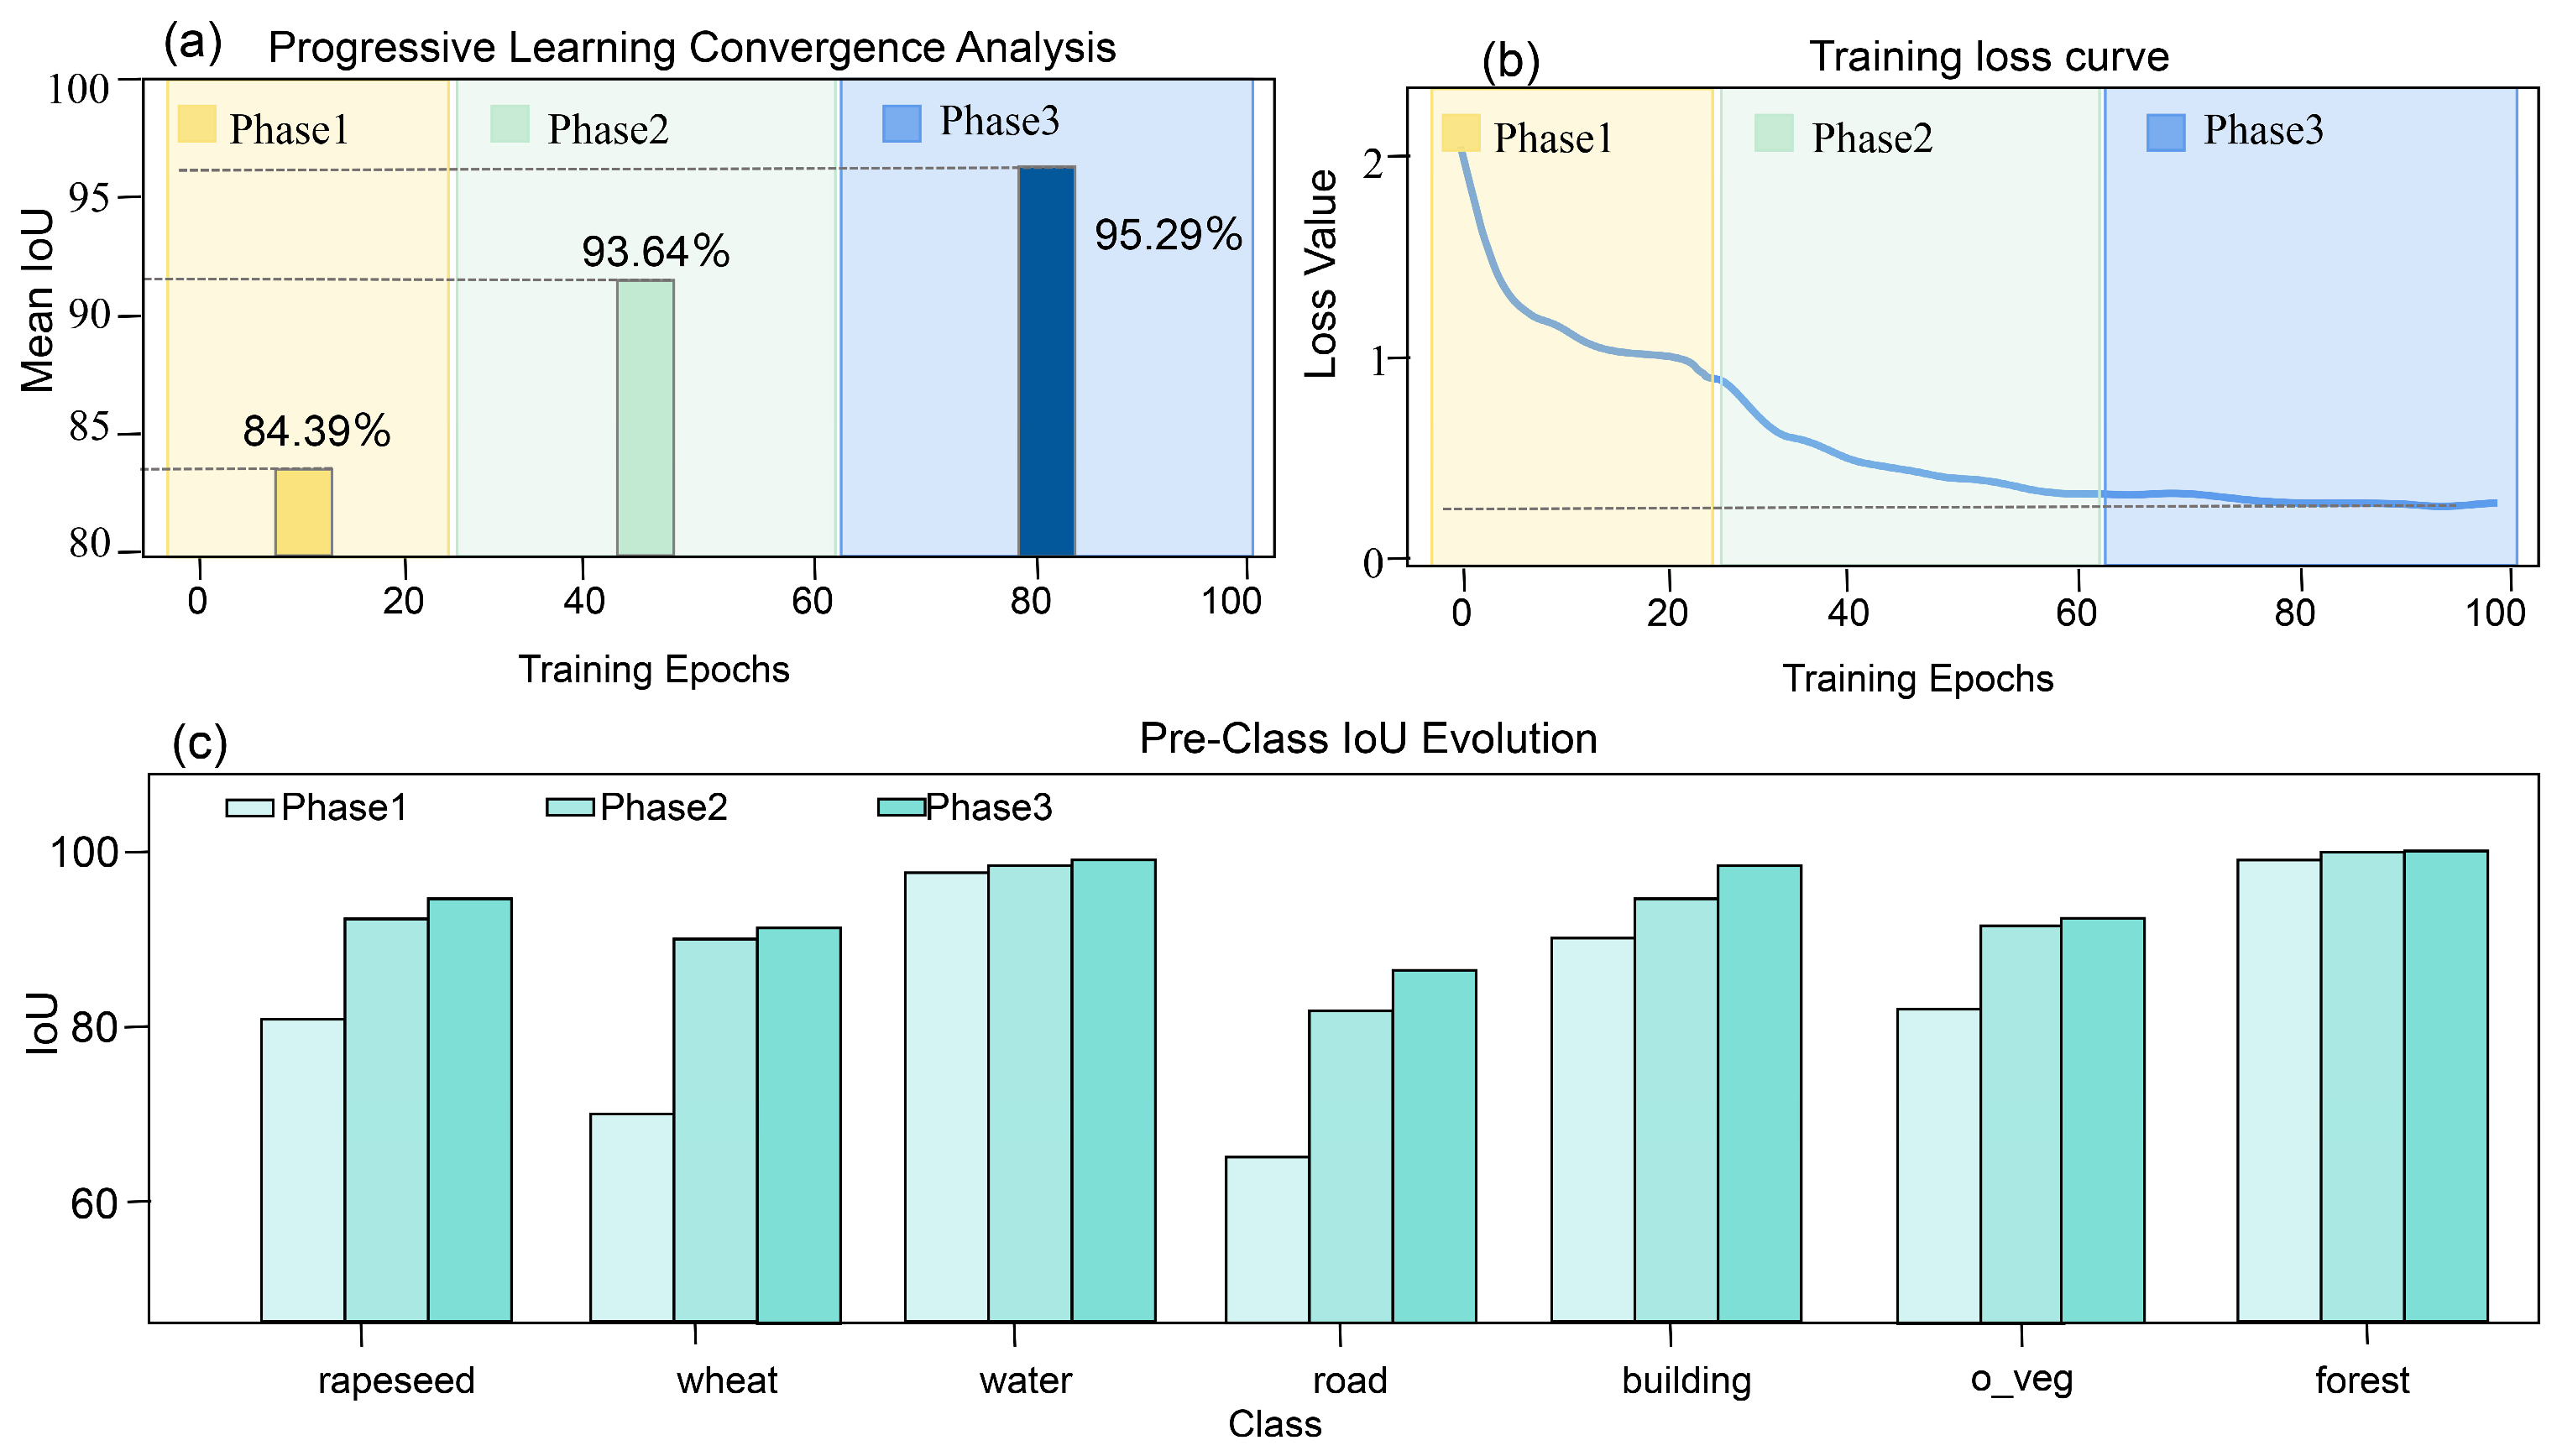
The progressive learning strategy based on weight inheritance effectively guides the parameter evolution of the UNet++ model (Figure 6). In the first stage of rapeseed-focused recognition, the model demonstrated a robust ability to capture target features. By utilizing a 15.0 weight for the rapeseed category and applying weighted focal loss, the loss curve drops significantly, quickly establishing a binary discrimination boundary between rapeseed and the background. Experimental results show that the overall accuracy (OA) at the end of this stage reaches 95.27%. Although the mIoU of 84.39% is limited by the coarse interpretation of non-target features, the IoU for winter rapeseed reaches 80.35%. This indicates that through initial learning, the model successfully identifies the spatial distribution of rapeseed within a complex spectral background.
In the second stage of vegetation differentiation, the objective is to improve the accuracy of fine-scale vegetation classification. Due to the pre-training of encoder weights in the first stage, the model avoids training oscillations despite the increased task complexity. By adjusting the category weights to 10.0 for rapeseed, 8.0 for wheat, and 6.0 for other vegetation, the model focuses on distinguishing between different vegetation types that share similar spectral characteristics. The results show that the IoU of rapeseed increases to 93.78%, while the IoU of wheat, which was previously prone to being misclassified as rapeseed, increases from 70.97% to 90.61%. This indicates that the progressive strategy successfully guides the model to shift from a focus on yellow spectral phenotypes during the flowering period toward deeper phenological and temporal characteristics, significantly improving the interpretation accuracy of similar vegetation types.
In the third stage of full-element fine segmentation, the goal is to optimize the balance across all land-cover types. During this stage, the learning rate is reduced to 5 × 10⁻⁵ to fine-tune the classification of the seven land features. Convergence curves and accuracy comparisons show that the mIoU of the validation set stabilizes at 95.29% around the 50th epoch. Compared to the first stage, the final accuracy for wheat and roads increases by 21.38% and 21.86% respectively, while the IoU of rapeseed stabilizes at 94.31% (Table 5). This point-to-surface training logic effectively alleviates training instability caused by imbalanced small-sample categories in the study area. This enables the model to maintain high extraction accuracy for rapeseed while achieving a sophisticated interpretation of all land types and reaching global optimal convergence.
The quantitative evolution of classification performance across the three phases is summarized in Table 5. This table details the accuracy improvements for both overall metrics and individual land-cover categories.
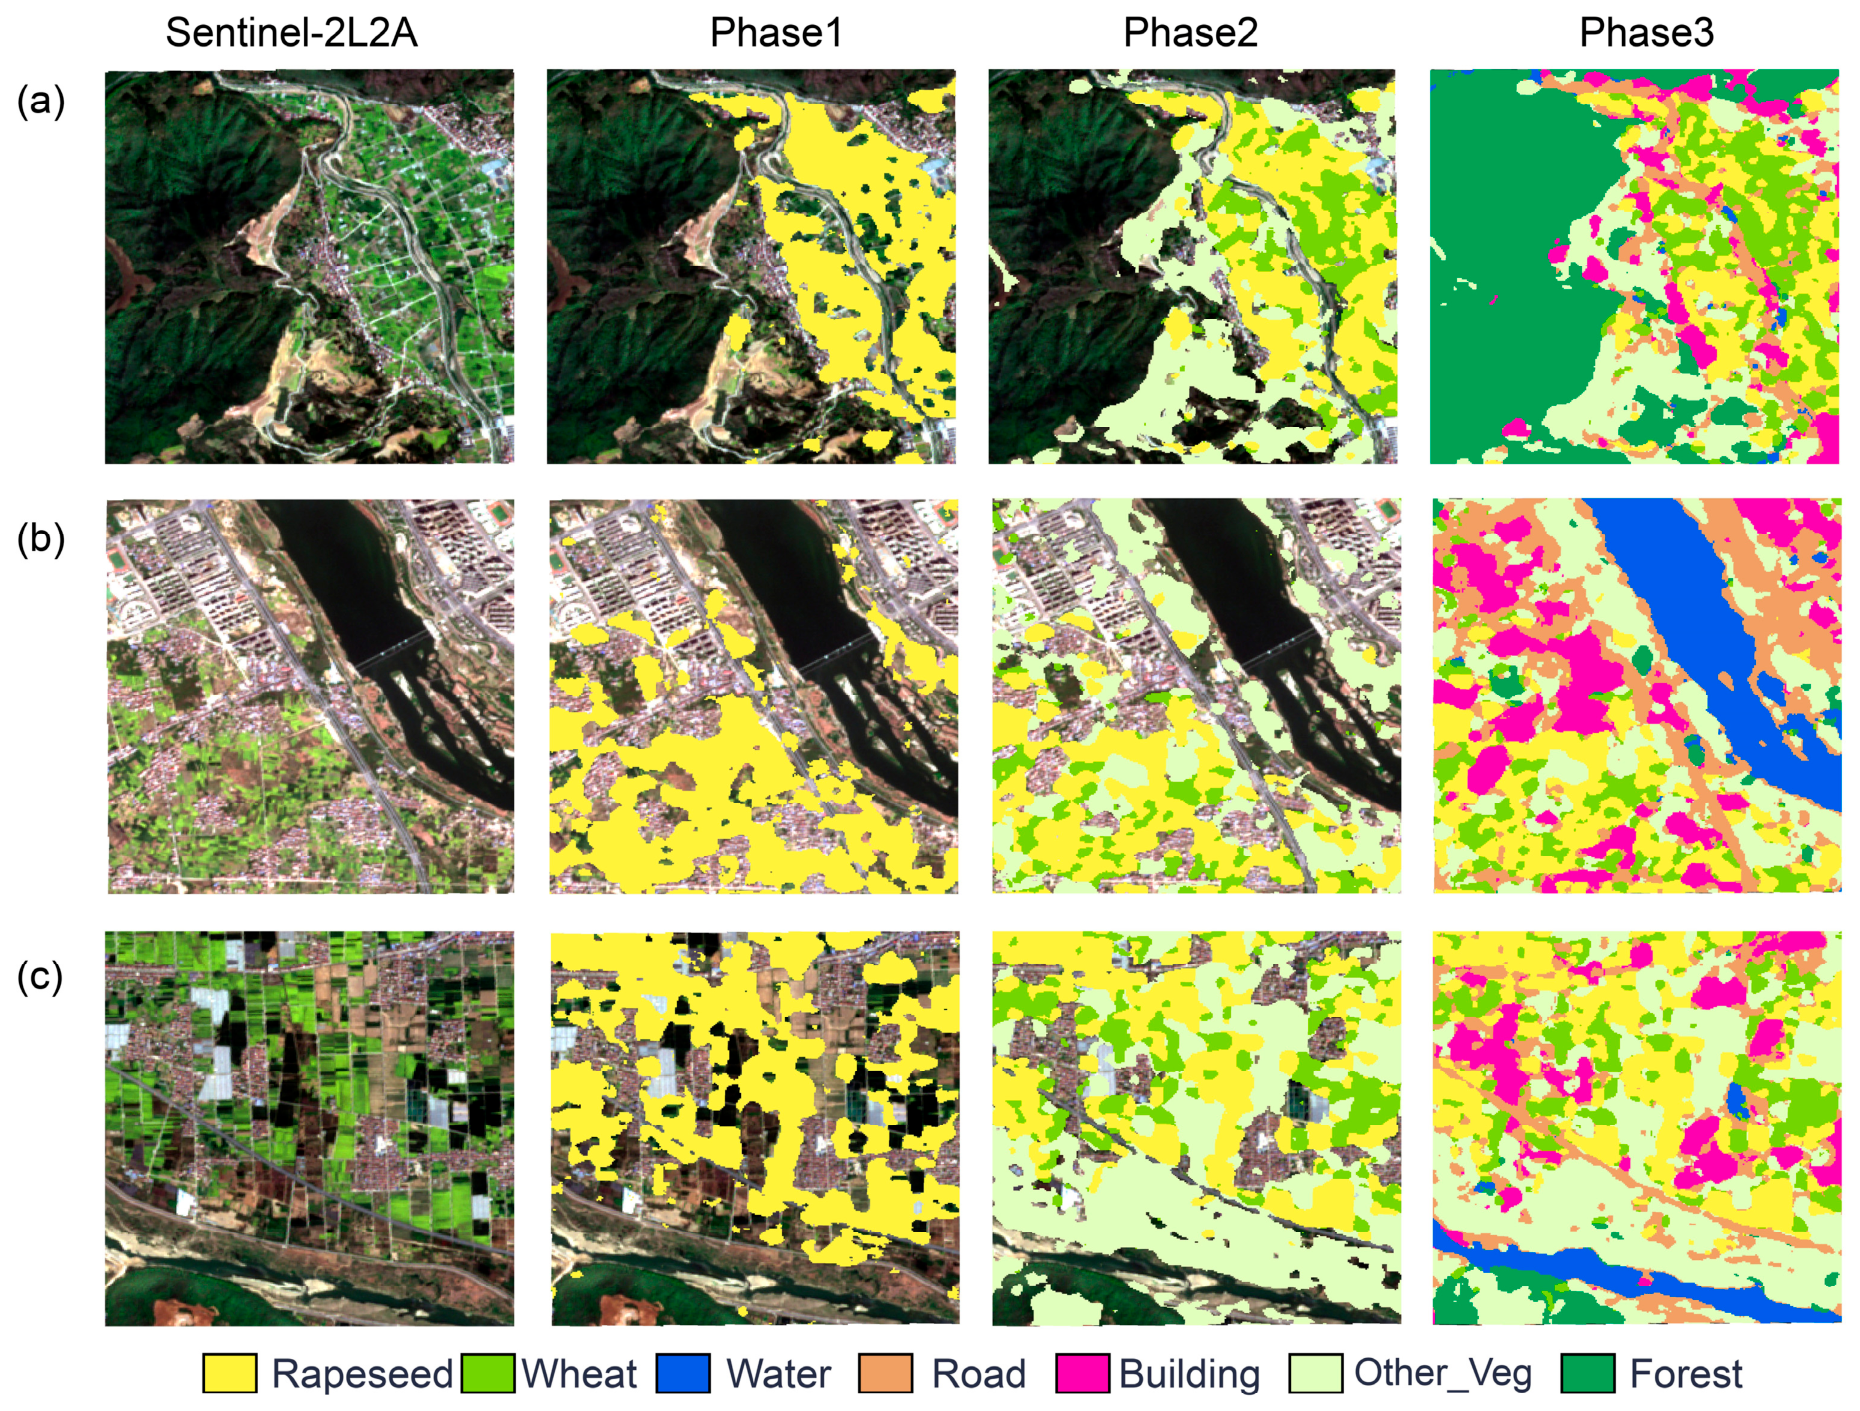
To verify the robustness of the model in complex landscapes, the study selected three representative terrain areas within the study region: mountainous valleys, areas combining buildings and farmland, and contiguous planting zones. The evolution process of the three-stage identification was demonstrated (Figure 7). Through a progressive learning strategy to reduce salt-and-pepper noise interference, the planting distribution became more in line with reality, showcasing the outstanding performance in extracting fragmented features in complex geographical backgrounds.
To further evaluate the effectiveness of the three-stage progressive learning strategy (PLS), it was compared with a standard UNet trained from scratch for seven-class segmentation. The results show that the single-stage model is strongly affected by class imbalance, achieving an mIoU of 91.09%, which is 4.20 percentage points lower than that of the PLS framework (95.29%). In particular, the single-stage model exhibits persistent spectral confusion between rapeseed and wheat, resulting in a 6.12% lower IoU for the rapeseed class.
The weight inheritance mechanism in the PLS enables the model to stabilize feature representations during the initial target-focused stage, thereby providing a more robust initialization and facilitating faster convergence in subsequent fine-grained segmentation.

3.3.2. Analysis of Hard-to-Classify Samples and Confusion Matrix Evaluation

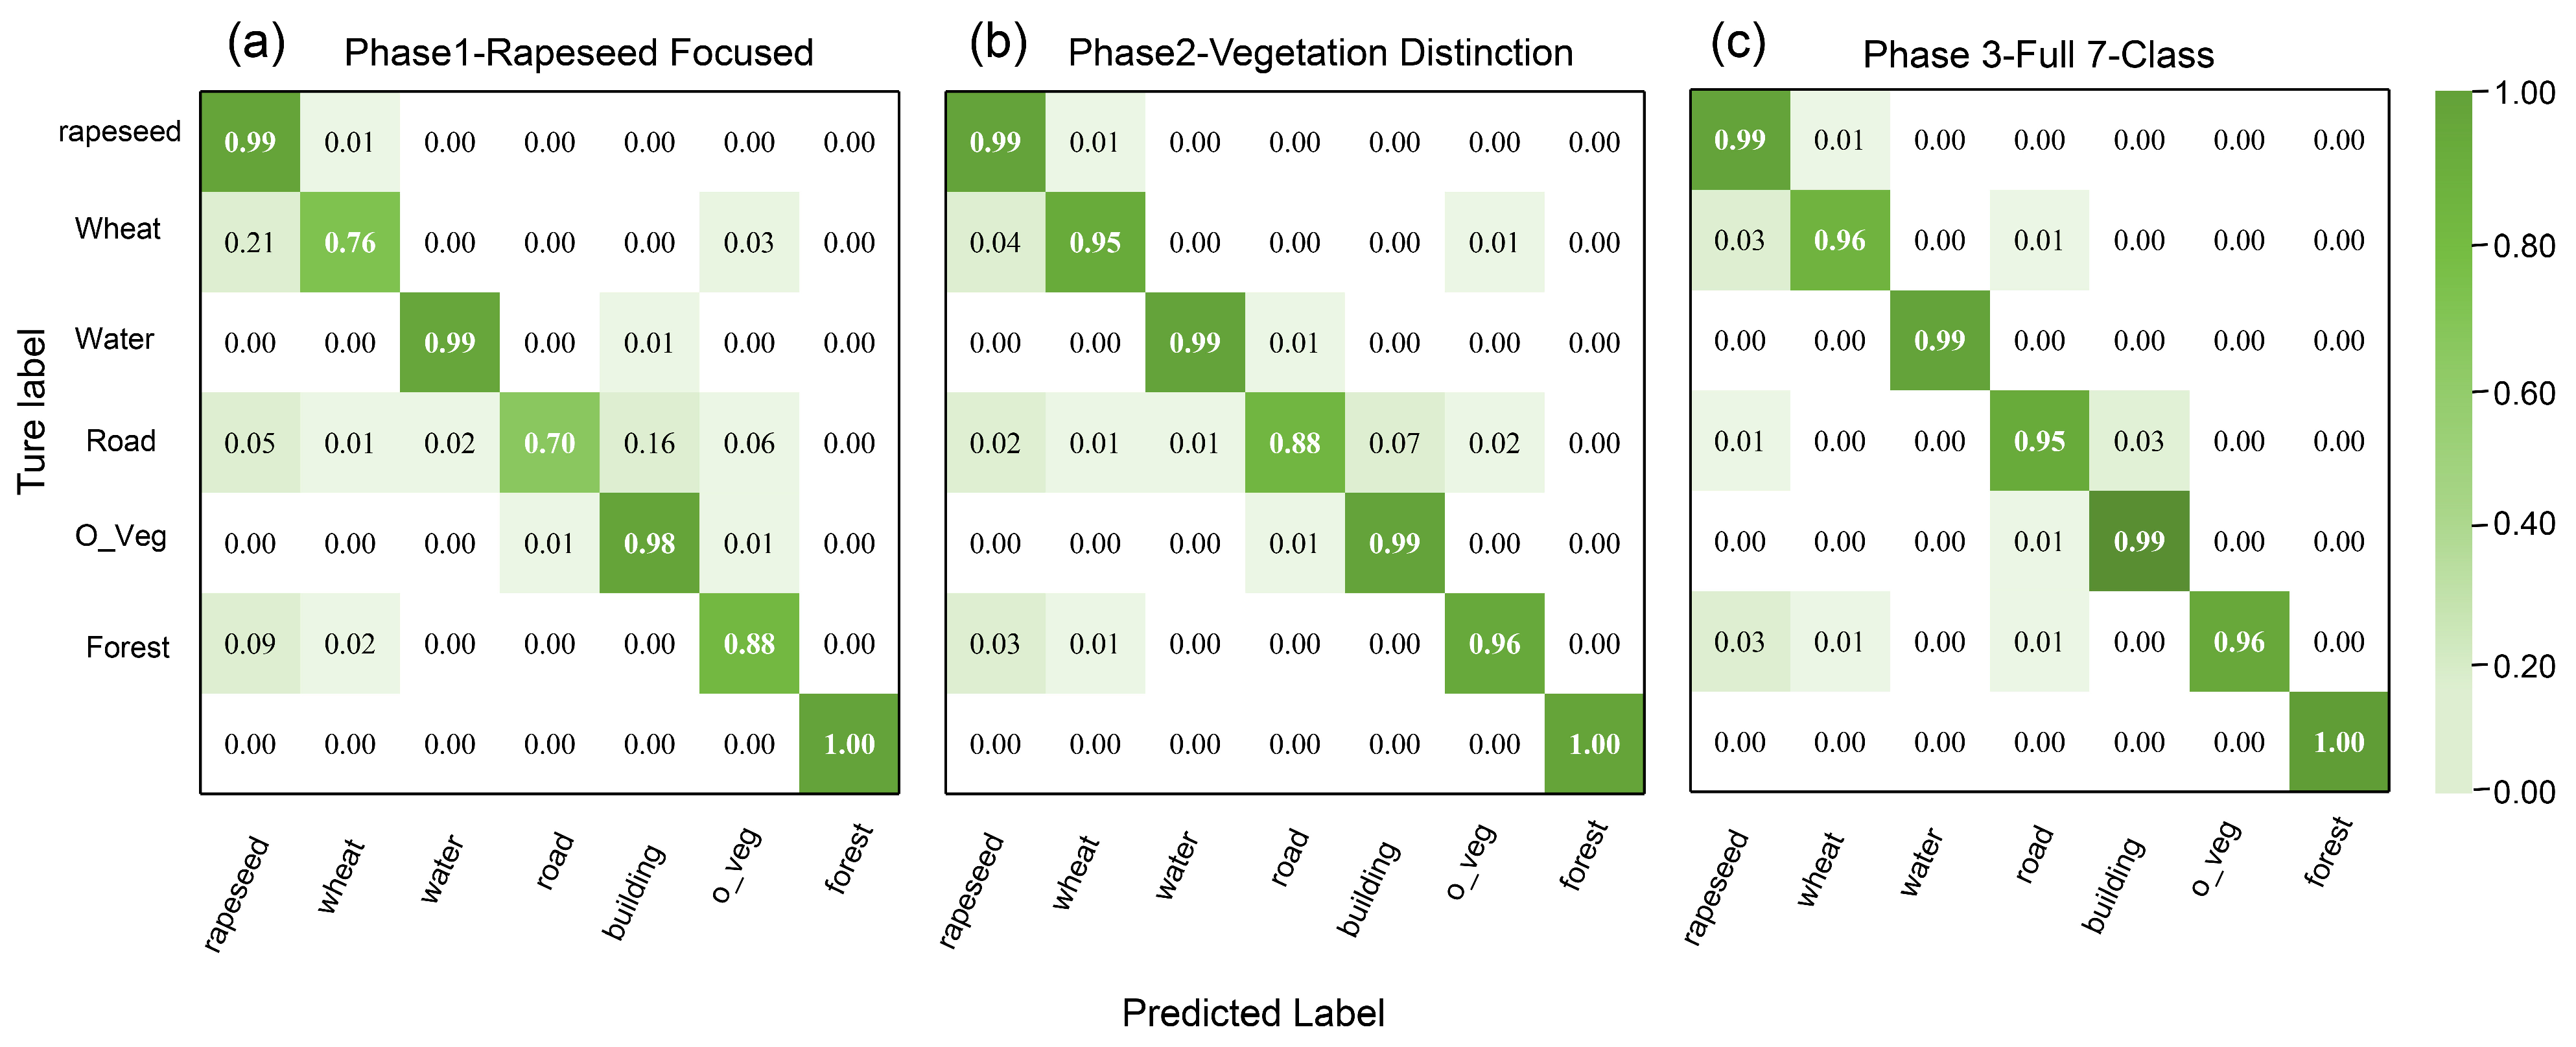
Quantitative evaluation results based on the test set show that the UNet++ model achieved high classification performance in the final stage, with an overall accuracy of 98.65% and a Kappa coefficient of 0.9830. Analysis of the normalized confusion matrix for the three-stage full-element classification provides further insights into the model’s performance in extracting fragmented ground objects. Regarding target object recognition, the model exhibits a distinct advantage in identifying winter rapeseed, with its IoU ultimately stabilizing at 94.31%. The confusion matrix reveals that the misclassification rates between rapeseed, wheat, and other vegetation were suppressed to minimal levels. This proves that the effective integration of multi-temporal phenological features with a progressive learning strategy allows the model to accurately capture the unique yellow spectral phenotype of winter rapeseed during the peak flowering stage while successfully filtering out interference from spectrally similar background vegetation. Additionally, the IoU for water bodies and forests reached 99.30% and 99.98%, respectively; their distinct spectral signatures throughout the time-series imagery result in high discriminative power with almost no class crossover.
In terms of hard-to-classify samples, the experimental results highlight certain local interpretation bottlenecks. The confusion matrix indicates that approximately 7.65% of wheat pixels were misclassified as other vegetation, primarily since the canopy structure and biomass characteristics of some late-sown wheat during the green-up stage are highly similar to those of weeds. Furthermore, although the IoU for roads improved by 21.86% compared to Stage 1, a portion of road pixels remained confused with buildings. This is likely due to the high spectral overlap between hardened road surfaces and building roofs near residential areas, Additionally, small-scale roads are susceptible to occlusion by trees on both sides, leading to pronounced mixed pixel effects.
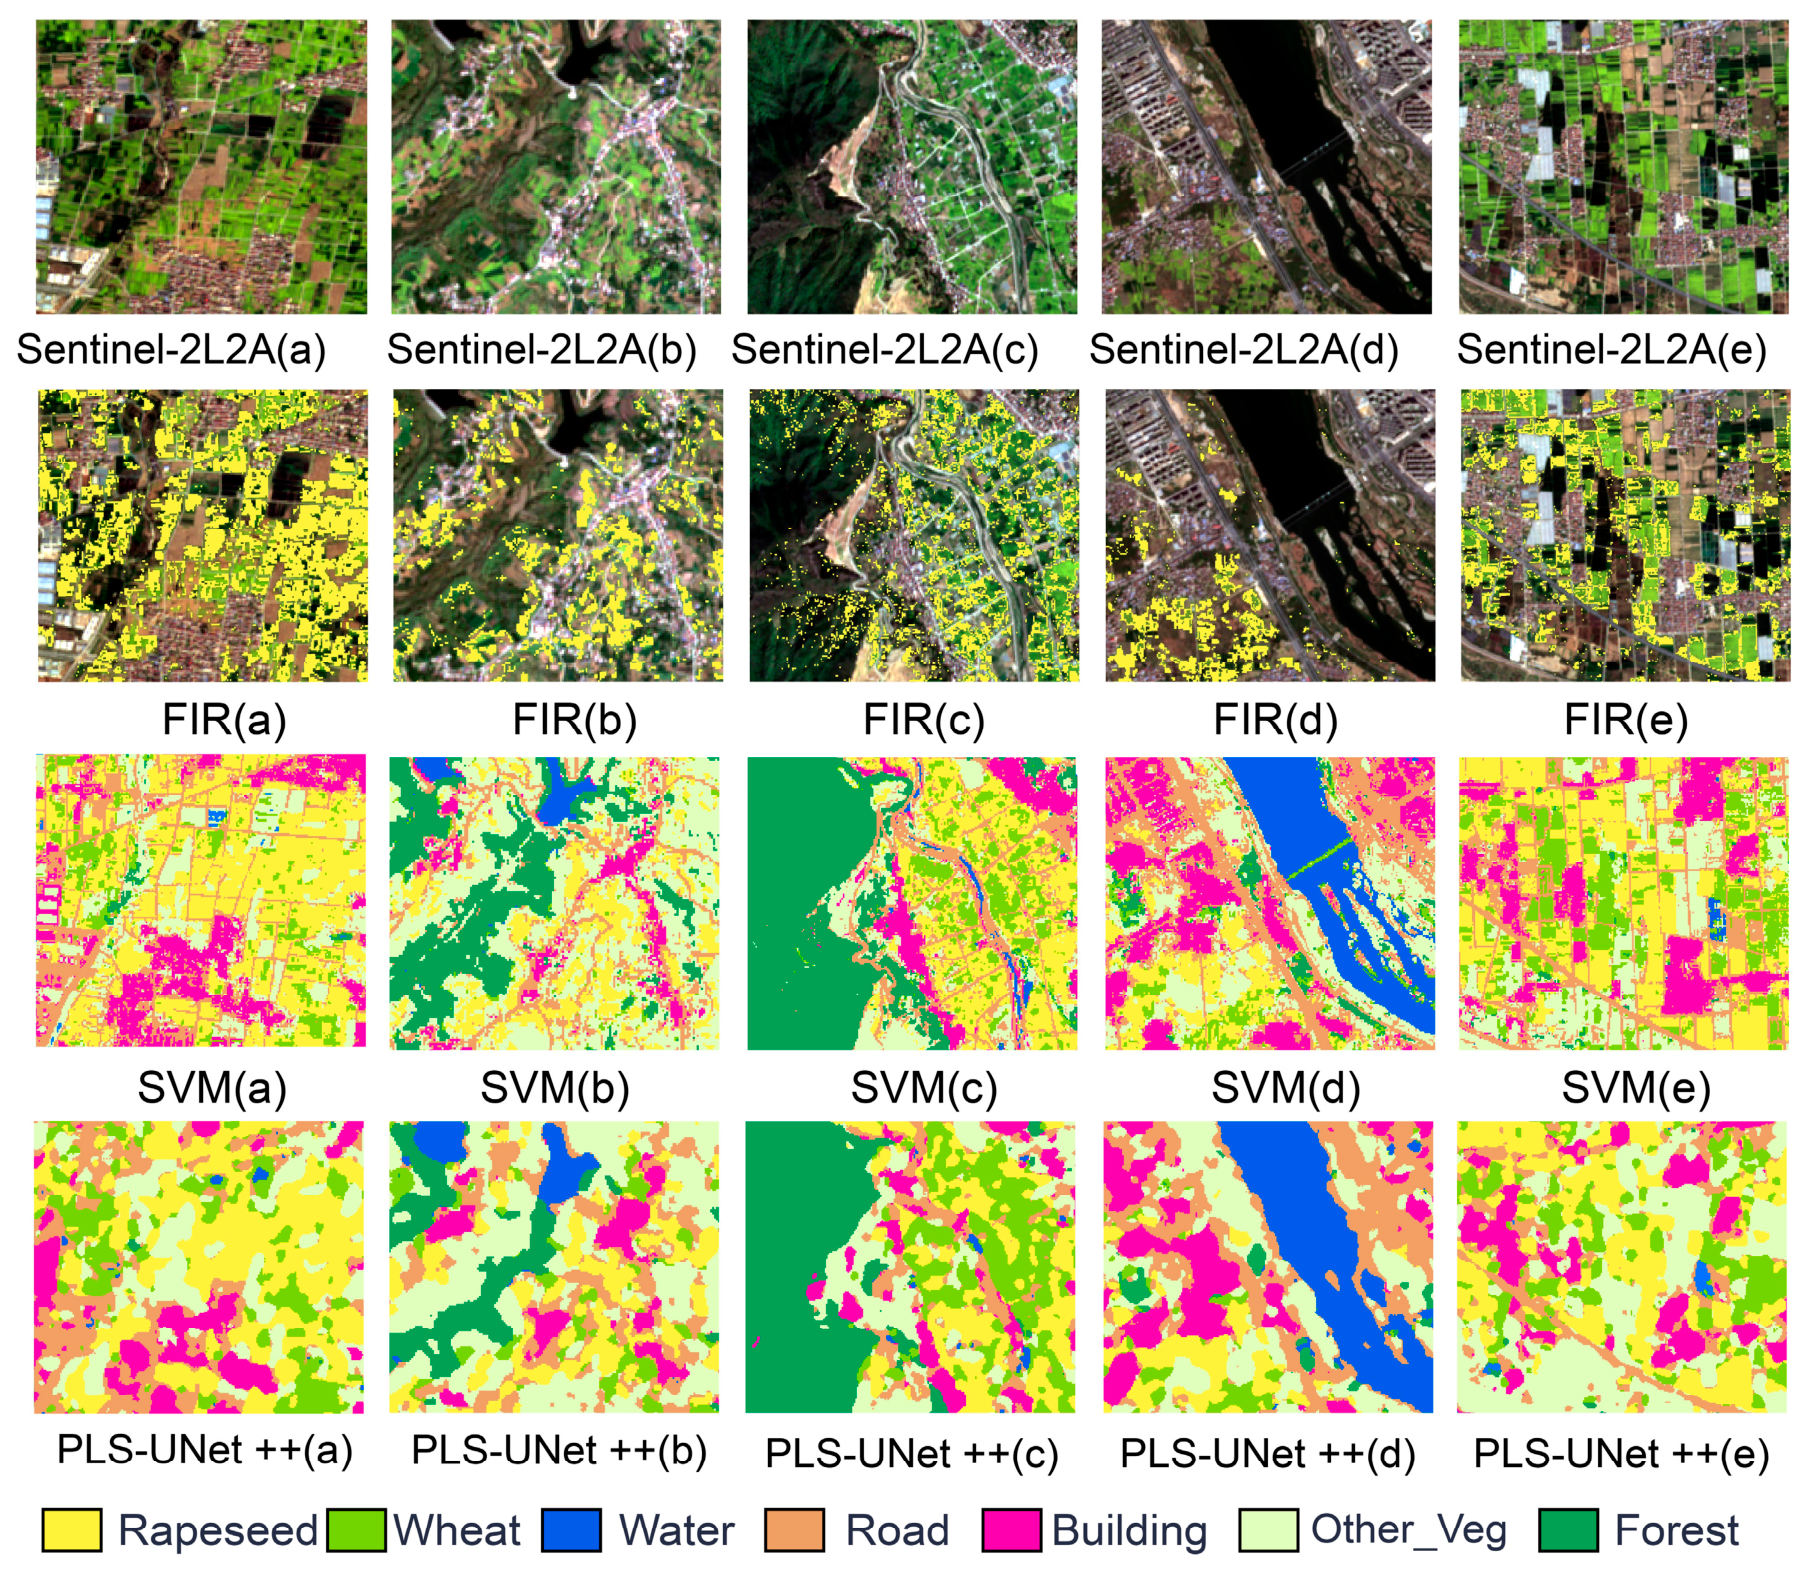
In terms of spatial logic expression, compared to the salt-and-pepper noise inherent in pixel-based machine learning models, deep learning effectively captures rich contextual spatial semantics through deep convolutions. Even in vegetation boundaries or scattered building clusters where pixel-level features are highly confused, the model maintains smooth extraction by leveraging the logical consistency of neighboring pixels. This transition from independent pixel discrimination to regional semantic consistency effectively addresses the challenge of fuzzy boundary recognition. By balancing spatial connectivity and semantic accuracy, this approach provides more precise data support for subsequent crop parcel mapping.

3.4. Comprehensive Comparison of Physical Index, Machine Learning, and Deep Learning Strategies

A comparative analysis of the physical index, machine learning (ML), and deep learning (DL) frameworks reveals a clear upward trend in accuracy across the different methodologies (Figure 8). As a physical benchmark, the FI-R index exhibited substantial target extraction capability under the optimal parameter combination (m = 5.5, n = 0.5), achieving an F1-score of 0.917. This validates the effectiveness of characterizing spectral features during the peak flowering stage through physical phenotypes. However, the FI-R index is inherently limited by single-band threshold discrimination. Its NDB-W (normalized distance between classes) of 0.730 indicates that, under complex vegetation backgrounds such as wheat and weeds, spectral overlap between classes still results in both over-segmentation and omission, thereby limiting its robustness in comprehensive classification. Although an overall accuracy (OA) of 94.41% was achieved, misclassifications remain evident in the mapped results, particularly where forested areas in small hilly regions are incorrectly identified as winter rapeseed.
In contrast, ML methods improved classification robustness via the non-linear mapping of multidimensional feature spaces. Driven by the optimal feature set, the SVM exhibited high performance among ML models, with an OA of 0.9070 and a Kappa coefficient of 0.8871, achieving a balanced distinction between winter rapeseed and background features. Nevertheless, because ML models rely on attribute determination based on isolated pixels, they face challenges in overcoming spectral heterogeneity under complex topographical conditions (Table 6).
The progressive learning strategy (PLS), combined with the UNet++ model, achieved high numerical accuracy among the evaluated methods. Through the three-stage strategy, the UNet++ model maintained high precision for winter rapeseed with an IoU of 94.31%, while elevating the OA to 98.65%. Quantitative data indicate that the mIoU of the deep learning model in complex habitats is higher than that of other models, confirming the effectiveness of semantic segmentation in capturing spatiotemporal phenological features. The recognition results of all the methods are presented in Figure 9.

3.5. Spatial Distribution Characteristics of Winter Rapeseed in the Hanzhong Basin

The extraction results exhibit a distinct pattern of central aggregation and peripheral fragmentation (Figure 10). Winter rapeseed is predominantly distributed across the flat and well-drained terrain of the basin core, as well as along secondary river terraces adjacent to major watercourses, while smaller, fragmented patches are scattered across dissected hillside areas.
At the regional scale, winter rapeseed shows a high-density concentration in the basin interior, gradually transitioning into a more dispersed pattern within the surrounding shallow mountain and hilly zones. This spatial heterogeneity is primarily driven by vertical climatic gradients in the Qinba Mountains, variations in cultivated land fragmentation, and differences in county-level agricultural land-use planning, resulting in significant disparities in rapeseed cultivation across administrative regions.
The central basin areas, including Hantai District, Nanzheng District, and Mian County, benefit from open, low-relief terrain and favorable agricultural conditions, forming the core zones of high-density rapeseed cultivation. From an agronomic perspective, this spatial aggregation is closely associated with the established paddy–rapeseed rotation system. In these areas, well-developed irrigation infrastructure and flat terrain support mechanized, large-scale farming, resulting in continuous and homogeneous planting patterns.
In contrast, rapeseed cultivation in Xixiang and Yang Counties exhibits a fragmented pattern, typically distributed linearly along valley floors. This spatial differentiation reflects smallholder farming systems adapted to narrow valley corridors and complex micro-topography, where crop selection is primarily constrained by soil conditions and terrain relief rather than regional agricultural planning.
Overall, this spatial dichotomy highlights the strong constraints imposed by complex terrain on agricultural land organization, while revealing a clear correspondence between water–soil resource availability and crop distribution. These findings underscore the importance of high-resolution mapping for regional agricultural monitoring in fragmented basin landscapes.

4. Discussion

(1)
Physical Phenotype-Driven Localization and Validation of the FI-R Index
The locally calibrated FI-R parameter configuration (m = 5.5, n = 0.5), determined through systematic sensitivity analysis, corroborates previous findings that the peak flowering stage represents the optimal phenological window for remote sensing identification of winter rapeseed. Experimental results demonstrate that the optimized FI-R index achieves an F1-score of 0.917 and exhibits strong target capture capability within the spectrally complex background of the study area. This represents a level of performance consistent with rapeseed identification studies conducted in topographically simpler plain regions. From a physical standpoint, this parameter configuration effectively widens the spectral contrast between the rapeseed floral canopy and background land covers in the red-edge and near-infrared spectral domains, suggesting that nonlinear amplification of the yellow phenotype signal to isolate crop-specific phenological characteristics constitutes a physically grounded and effective pathway for accurate crop identification.
Beyond its role as a standalone extraction tool, the FI-R index provides broader knowledge-guiding value throughout the subsequent machine learning and deep learning modeling stages. In feature optimization experiments, the FI-R distills complex multi-band combinations into physically interpretable and highly sensitive features, significantly reducing search redundancy within high-dimensional feature spaces. In the deep learning phase, its incorporation serves as an explicit phenological prior for the convolutional neural network, enabling the model to localize the spatial distribution of target parcels more effectively during the winter rapeseed-focused recognition stage. This paradigm of combining physical domain knowledge with data-driven modeling effectively compensates for the limitations of a single-index approach under complex illumination conditions and at the boundaries of geometrically fragmented parcels, significantly enhancing the model’s adaptability to heterogeneous landscapes.
(2)
Synergistic Interpretation Effects of Multi-source Features in Complex Landscapes
Given the highly fragmented farmland structure and heterogeneous land cover distribution characteristic of the Hanzhong Basin, the introduction of topographic and textural features serves simultaneously as a dimensional enrichment of the feature space and as a spatially explicit constraint grounded in geographic priors. Although the interior of the basin is relatively flat, slope gradients associated with randomly distributed small-scale hilly terrain and localized micro-topographic features continue to exert meaningful influence on solar irradiance distribution and associated spectral variability. Topographic variables, by characterizing vertical zonation patterns, assist the model in suppressing transient spectral interference originating from non-agricultural land covers. Complementarily, GLCM-derived texture features augment the spectral information by capturing intra-parcel spatial homogeneity and edge contrast, thereby compensating for the inherent limitations of multi-temporal imagery in representing fine-scale spatial structures. The synergistic integration of these multi-source feature types significantly mitigates pixel-level salt-and-pepper noise and imposes coherent spatial logic at the micro-scale. Through the macro-level constraints provided by topographic variables and the micro-level spatial representation afforded by texture descriptors, precise isolation of winter rapeseed is achieved within spectrally complex and spatially heterogeneous backgrounds.
(3)
Methodological Shift Toward Deep Learning in Fine-scale Agricultural Monitoring
The three-stage progressive deep learning strategy adopted in this study represents a fundamental methodological shift in crop monitoring, moving from isolated pixel-level spectral discrimination toward spatially continuous semantic understanding of agricultural landscapes. The core advantage of UNet++ resides in the ability of its multi-scale convolutional kernels to simultaneously learn morphological and spectral features, capturing the distinctive reflectance characteristics of the rapeseed canopy during peak flowering while simultaneously mining the geometric patterns inherent to agricultural parcel boundaries. This dual capability enables the model to automatically fill classification holes within small agricultural parcels and produce mapping outputs characterized by smooth boundaries and topological connectivity, partially resolving the chronic challenge of boundary ambiguity at basin margins and urban–rural transition zones.
This training strategy directly addresses the pervasive class imbalance problem in remote sensing classification. Through a weight inheritance mechanism that progressively evolves from simple binary recognition to full multi-class segmentation, the model first consolidates a robust spectral prototype for winter rapeseed before smoothly transitioning to comprehensive land cover discrimination. This structured hierarchical guidance ensures stable network convergence within an extremely high-dimensional feature space. Although deep learning inherently demands substantial computational resources, its advantages in semantic spatial consistency and overall mapping quality are pronounced when processing landscapes characterized by fragmented parcel structures and spectrally heterogeneous land covers.
(4)
Sources of Uncertainty and Technical Bottlenecks in Complex Land cover Extraction
Despite the promising performance of the proposed synergistic identification framework, several limitations warrant acknowledgment. A primary source of uncertainty stems from the inherent susceptibility of optical remote sensing to cloud contamination; the humid climate of the Qinling–Bashan Mountain region generates frequent cloud cover and precipitation events that compromise the temporal completeness of time-series features during critical phenological stages. Additionally, the 10 m spatial resolution Sentinel-2 imagery constrains the framework’s capacity to resolve extremely small-scale dispersed parcels, where residual mixed-pixel effects continue to introduce boundary ambiguity and affect the precision of area estimation for smallholder farms.
Future research should prioritize multi-source heterogeneous data fusion as a key avenue for addressing these limitations. The integration of cloud-penetrating Synthetic Aperture Radar (SAR) data alongside higher-resolution multi-source imagery represents a critical pathway toward enhancing model robustness under adverse atmospheric conditions. Furthermore, systematically evaluating the transferability of the progressive learning framework developed in this study to analogous complex terrain contexts, including comparable basin landforms and fragmented agricultural landscapes in other geographic regions, and rigorously assessing its generalization potential in large-scale cross-regional operational mapping, constitutes an important and necessary direction for follow-up research.
(5)
Limitations and Future Research Directions
Accurate spatial mapping of crop distribution provides an important basis for precision agricultural management, yet achieving this in topographically complex and highly fragmented landscapes remains a persistent technical challenge. The Hanzhong Basin, characterized by rugged terrain and irregular field boundaries, presents a representative and demanding test environment for remote sensing-based crop mapping. Therefore, this study focuses strictly on the spatial extent of winter rapeseed cultivation within a single region and a single growing season (2024–2025), presenting a progressive deep learning framework tailored to overcome mapping bottlenecks in fragmented environments.
It must be explicitly acknowledged that the scope of the present work, confined to a single region and growing season, positions the current findings primarily as a methodological demonstration rather than a fully operational system for yield or crop growth diagnosis. Extending this framework toward broader operational applicability will require the systematic integration of multi-year agrometeorological records, detailed soil property datasets, field-level crop management histories, and georeferenced yield measurements. Such comprehensive data integration will be necessary to facilitate a substantive transition from static spatial distribution mapping to dynamic crop growth diagnostics, ultimately fulfilling the data-driven requirements of modern precision agriculture.

5. Conclusions

This study presents a high-precision remote sensing spatial identification framework for winter rapeseed in complex basin landscapes based on remote sensing data from a single growing season (2024–2025). Leveraging Sentinel-2 multispectral and GF-2 imagery, a systematic series of comparative experiments was conducted, integrating existing technologies within a progressive deep learning architecture. The principal conclusions are as follows:
  • The FI-R index, specifically designed to exploit the spectral phenotype of winter rapeseed during peak flowering, demonstrates strong inter-class discriminative power following region-specific parameter optimization (m = 5.5, n = 0.5). The optimized physical model effectively amplifies the numerical contrast between winter rapeseed and co-existing winter wheat or background vegetation, achieving a normalized distance (ND) of 0.730. Although threshold-based segmentation retains inherent limitations in resolving mixed pixels along parcel boundaries, it furnishes useful spectral prior information for downstream models and establishes a preliminary spatial reference for crop identification.
  • Phenological window analysis demonstrates the important contribution of the distinctive spectral trajectory of winter rapeseed to fine-scale identification. Results indicate that the peak flowering stage constitutes the primary discriminative window for distinguishing rapeseed from background vegetation, while the spectral response during the sowing stage provides an important reference for early-season farmland background delineation. Features from sowing and peak flowering stages collectively dominate the full-cycle feature importance ranking, not only elucidating the phenological drivers underlying accuracy improvements but also providing a methodological reference for optimizing computational efficiency in large-scale monitoring within this specific study region.
  • The construction of multi-source feature sets combined with systematic feature selection represents an important factor of machine learning classification performance. After eliminating 64.3% of redundant variables, the optimal subset of 71 core features enhanced model robustness across all evaluated classifiers. Based on this optimal feature set, the Support Vector Machine (SVM) exhibited the highest classification performance among the machine learning models, attaining an OA of 0.9070 and a Kappa coefficient of 0.8871, with both User’s Accuracy and Producer’s Accuracy for winter rapeseed reaching 0.91. The incorporation of topographic features proved helpful in mitigating misidentification in topographically complex zones.
  • The deep learning framework combining a three-stage progressive learning strategy with the UNet++ architecture achieves a transition from pixel-level spectral classification to object-aware semantic segmentation for crop spatial mapping. By effectively leveraging multi-scale spatial contextual features, the proposed model achieved a high overall accuracy of 98.65% and an mIoU of 95.29% on the independent test set, with the rapeseed-specific IoU reaching 94.31%. This approach mitigates salt-and-pepper noise in geometrically fragmented parcels and outperformed comparative methods in terms of mapping coherence and parcel boundary delineation. The integrated framework provides a preliminary technical reference for high-precision crop mapping in topographically complex terrain.

Author Contributions

Conceptualization, F.Y.; Formal analysis, F.Y. and X.Y.; Funding acquisition, L.L.; Investigation, X.Y., Y.W. and F.Y.; Methodology, F.Y. and L.L.; Project administration, L.L.; Resources, F.Y.; Writing—original draft, F.Y. and X.Y.; Writing-review and editing, F.Y., X.Y. and L.L. All authors have read and agreed to the published version of the manuscript.

Funding

This research was funded by the Key Research and Development Program of Shaanxi (2024SF-YBXM-570) and the Development and Comprehensive Demonstration of Agricultural Remote Sensing Integrated Application Service Software (30-Y60B01-9003-22/23-07).

Data Availability Statement

No new data were created or analyzed in this study. Data sharing is not applicable to this article.

Conflicts of Interest

The authors declare no conflicts of interest.

References

  1. Borges, C.E.; von dos Santos Veloso, R.; da Conceição, C.A.; Mendes, D.S.; Ramirez-Cabral, N.Y.; Shabani, F.; Shafapourtehrany, M.; Nery, M.C.; da Silva, R.S. Forecasting Brassica napus production under climate change with a mechanistic species distribution model. Sci. Rep. 2023, 13, 12656. [Google Scholar] [CrossRef] [PubMed]
  2. Fang, Y.; Ren, T.; Zhang, S.; Liu, Y.; Liao, S.; Li, X.; Cong, R.; Lu, J. Rotation with oilseed rape as the winter crop enhances rice yield and improves soil indigenous nutrient supply. Soil Tillage Res. 2021, 212, 105065. [Google Scholar] [CrossRef]
  3. Wang, K.; Ren, T.; Yan, J.; Zhu, D.; Fang, Y.; Cong, R.; Lu, Z.; Li, X.; Lu, J. Straw residue incorporation: Influence on soil microbial biomass and carbon–nitrogen dynamics in an oilseed rape–rice rotation. Soil Use Manag. 2024, 40, e12990. [Google Scholar] [CrossRef]
  4. Zhang, S.; Lu, J.; Zhu, Y.; Fang, Y.; Cong, R.; Li, X.; Ren, T. Rapeseed as a previous crop reduces rice N fertilizer input by improving soil fertility. Field Crops Res. 2022, 281, 108487. [Google Scholar] [CrossRef]
  5. Jankowski, K.J.; Sokólski, M.; Załuski, D. winter oilseed rape: Agronomic management in different tillage systems and energy balance. Energy 2023, 277, 127590. [Google Scholar] [CrossRef]
  6. Zhu, J.; Dai, W.; Chen, B.; Cai, G.; Wu, X.; Yan, G. Research progress on the effect of nitrogen on rapeseed between seed yield and oil content and its regulation mechanism. Int. J. Mol. Sci. 2023, 24, 14504. [Google Scholar] [CrossRef]
  7. Tao, J.B.; Zhang, X.Y.; Wu, Q.F.; Wang, Y. Mapping winter rapeseed in South China using Sentinel-2 data based on a novel separability index. J. Integr. Agric. 2023, 22, 1645–1657. [Google Scholar] [CrossRef]
  8. Tian, H.; Chen, T.; Li, Q.; Mei, Q.; Wang, S.; Yang, M.; Wang, Y.; Qin, Y. A novel spectral index for automatic canola mapping by using Sentinel-2 imagery. Remote Sens. 2022, 14, 1113. [Google Scholar] [CrossRef]
  9. Wu, F.; Lu, P.; Chen, S.; Xu, Y.; Wang, Z.; Dai, R.; Zhang, S. Identifying the peak flowering dates of winter rapeseed with a NBYVI index using Sentinel-1/2. Remote Sens. 2025, 17, 1051. [Google Scholar] [CrossRef]
  10. Cui, J.; Zhang, X.; Wang, W.; Wang, L. Integration of optical and SAR remote sensing images for crop-type mapping based on a novel object-oriented feature selection method. Int. J. Agric. Biol. Eng. 2020, 13, 178–190. [Google Scholar] [CrossRef]
  11. Singh, K.D.; Duddu, H.S.N.; Vail, S.; Parkin, I.; Shirtliffe, S.J. UAV-based hyperspectral imaging technique to estimate canola (Brassica napus L.) seedpods maturity. Can. J. Remote Sens. 2021, 47, 33–47. [Google Scholar] [CrossRef]
  12. Meng, S.; Zhong, Y.; Luo, C.; Hu, X.; Wang, X.; Huang, S. Optimal temporal window selection for winter wheat and rapeseed mapping with Sentinel-2 images: A case study of Zhongxiang in China. Remote Sens. 2020, 12, 226. [Google Scholar] [CrossRef]
  13. Zhu, Z.; Chen, Y.; Lu, C.; Yang, M.; Xia, Y.; Huang, D.; Lv, J. Research on crop classification using U-Net integrated with multimodal remote sensing temporal features. Sensors 2025, 25, 5005. [Google Scholar] [CrossRef]
  14. Tufail, R.; Tassinari, P.; Torreggiani, D. Deep learning applications for crop mapping using multi-temporal Sentinel-2 data and red-edge vegetation indices: Integrating convolutional and recurrent neural networks. Remote Sens. 2025, 17, 3207. [Google Scholar] [CrossRef]
  15. Ienco, D.; Interdonato, R.; Gaetano, R.; Ho Tong Minh, D. Combining Sentinel-1 and Sentinel-2 satellite image time series for land cover mapping via a multi-source deep learning architecture. ISPRS J. Photogramm. Remote Sens. 2019, 158, 11–22. [Google Scholar] [CrossRef]
  16. Chang, Z.; Li, H.; Chen, D.; Liu, Y.; Zou, C.; Chen, J.; Han, W.; Liu, S.; Zhang, N. Crop type identification using high-resolution remote sensing images based on an improved DeepLabV3+ network. Remote Sens. 2023, 15, 5088. [Google Scholar] [CrossRef]
  17. Li, W.; Liang, S.; Chen, K.; Chen, Y.; Ma, H.; Xu, J.; Ma, Y.; Zhang, Y.; Guan, S.; Fang, H.; et al. AgriFM: A multi-source temporal remote sensing foundation model for agriculture mapping. Remote Sens. Environ. 2026, 334, 115234. [Google Scholar] [CrossRef]
  18. Jiang, J.; Zhang, J.; Wang, X.; Zhang, S.; Kong, D.; Wang, X.; Ali, S.; Ullah, H. Fine extraction of multi-crop planting area based on deep learning with Sentinel-2 time-series data. Environ. Sci. Pollut. Res. 2025, 32, 11931–11949. [Google Scholar] [CrossRef] [PubMed]
  19. Wang, H.; Tang, Y.; Jing, L.; Li, H.; Ding, H.; Dou, C. Multi-source remote sensing data for monitoring natural reserves: A case study on the Shaanxi Hanzhong crested ibis National Nature Reserve, China. Int. J. Digit. Earth 2025, 18, 2528655. [Google Scholar] [CrossRef]
  20. Han, J.; Zhang, Z.; Luo, Y.; Cao, J.; Zhang, L.; Zhang, J.; Li, Z. The RapeseedMap10 database: Annual maps of rapeseed at a spatial resolution of 10 m based on multi-source data. Earth Syst. Sci. Data 2021, 13, 2857–2874. [Google Scholar] [CrossRef]
  21. Mercier, A.; Betbeder, J.; Baudry, J.; Le Roux, V.; Spicher, F.; Lacoux, J.; Roger, D.; Hubert-Moy, L. Evaluation of Sentinel-1 & 2 time series for predicting wheat and rapeseed phenological stages. ISPRS J. Photogramm. Remote Sens. 2020, 163, 231–256. [Google Scholar]
  22. Yin, S.; Wu, T.; Wang, S.; Chen, R.; Yang, Y.; Tang, H. Development of the FI-R model, a novel remote sensing method for fine-scale extraction of vegetation, using rapeseed as an example. J. Integr. Agric. 2025, in press. [CrossRef]
  23. Zhang, P.; Hu, S.; Li, W.; Zhang, C. Parcel-level mapping of crops in a smallholder agricultural area: A case of central China using single-temporal VHSR imagery. Comput. Electron. Agric. 2020, 175, 105581. [Google Scholar] [CrossRef]
  24. Sun, C.; Bian, Y.; Zhou, T.; Pan, J. Using of multi-source and multi-temporal remote sensing data improves crop-type mapping in the subtropical agriculture region. Sensors 2019, 19, 2401. [Google Scholar] [CrossRef]
  25. Gorelick, N.; Hancher, M.; Dixon, M.; Ilyushchenko, S.; Thau, D.; Moore, R. Google Earth Engine: Planetary-scale geospatial analysis for everyone. Remote Sens. Environ. 2017, 202, 18–27. [Google Scholar] [CrossRef]
  26. Drusch, M.; Del Bello, U.; Carlier, S.; Colin, O.; Fernandez, V.; Gascon, F.; Hoersch, B.; Isola, C.; Laberinti, P.; Martimort, P.; et al. Sentinel-2: ESA’s optical high-resolution mission for GMES operational services. Remote Sens. Environ. 2012, 120, 25–36. [Google Scholar] [CrossRef]
  27. Griffiths, P.; Nendel, C.; Hostert, P. Intra-annual reflectance composites from Sentinel-2 and Landsat for national-scale crop and land cover mapping. Remote Sens. Environ. 2019, 220, 135–151. [Google Scholar] [CrossRef]
  28. Ni, R.; Tian, J.; Li, X.; Yin, D.; Li, J.; Gong, H.; Zhang, J.; Zhu, L.; Wu, D. An enhanced pixel-based phenological feature for accurate paddy rice mapping with Sentinel-2 imagery in Google Earth Engine. ISPRS J. Photogramm. Remote Sens. 2021, 178, 282–296. [Google Scholar] [CrossRef]
  29. Zhang, H.; Kang, J.; Xu, X.; Zhang, L. Accessing the temporal and spectral features in crop type mapping using multi-temporal Sentinel-2 imagery: A case study of Yi’an County, Heilongjiang Province, China. Comput. Electron. Agric. 2020, 176, 105618. [Google Scholar] [CrossRef]
  30. Farr, T.G.; Rosen, P.A.; Caro, E.; Crippen, R.; Duren, R.; Hensley, S.; Kobrick, M.; Paller, M.; Rodriguez, E.; Roth, L.; et al. The Shuttle Radar Topography Mission. Rev. Geophys. 2007, 45, RG2004. [Google Scholar] [CrossRef]
  31. Ran, X.; Di, G.; Ali, A.; Shenshen, M.; Tao, L.; Chunyan, R.; Ronghua, L.; Zengqiang, Z. Accumulation, ecological-health risks assessment, and source apportionment of heavy metals in paddy soils: A case study in Hanzhong, Shaanxi, China. Environ. Pollut. 2019, 248, 349–357. [Google Scholar] [CrossRef]
  32. Pan, X.; Zhong, Y.; Liu, Y.; Luo, C.; Zhang, L. Multiscale high-resolution satellite imagery for land-cover classification via a deep spatial-temporal-spectral learning framework. IEEE Trans. Geosci. Remote Sens. 2019, 58, 3692–3709. [Google Scholar]
  33. Zhong, L.; Hu, L.; Zhou, H. Deep learning based multi-temporal crop classification. Remote Sens. Environ. 2019, 221, 430–443. [Google Scholar] [CrossRef]
  34. Ben Hamida, A.; Benoit, A.; Lambert, P.; Ben Amar, C. 3-D deep learning approach for remote sensing image classification. IEEE Trans. Geosci. Remote Sens. 2018, 56, 4420–4434. [Google Scholar] [CrossRef]
  35. Yadav, K.; Gorelick, N.; Thenkabail, P.S.; Teluguntla, P.; Xiong, J.; Tilton, J.; Oliphant, A.; Gumma, M.K.; Congalton, R. Nominal 30-m cropland extent map of continental Africa by integrating pixel-based and object-based algorithms using Sentinel-2 and Landsat-8 data on Google Earth Engine. Remote Sens. 2017, 9, 1065. [Google Scholar]
  36. Adrian, J.; Sagan, V.; Maimaitijiang, M. Sentinel SAR-optical fusion for crop type mapping using deep learning and Google Earth Engine. ISPRS J. Photogramm. Remote Sens. 2021, 175, 215–235. [Google Scholar] [CrossRef]
  37. Feng, Q.; Liu, J.; Gong, J. UAV remote sensing for urban vegetation mapping using Random Forest and texture analysis. Remote Sens. 2015, 7, 1074–1094. [Google Scholar] [CrossRef]
  38. Rodriguez-Galiano, V.F.; Ghimire, B.; Rogan, J.; Chica-Olmo, M.; Rigol-Sanchez, J.P. An assessment of the effectiveness of a Random Forest classifier for land-cover classification. ISPRS J. Photogramm. Remote Sens. 2012, 67, 93–104. [Google Scholar] [CrossRef]
Figure 1. Multi-scale overview of the study area: geographic location, topographic distribution, and land-use classification. (a) Location of the study area within China (national scale); (b) topographic elevation of the study area; (c) location of Hanzhong within Shaanxi Province (provincial scale); (d) distribution of winter rapeseed cultivation areas in Hanzhong City; (e) high-resolution view of the study site’s landscape.
Remotesensing 18 01706 g001
Figure 2. Spatiotemporal framework of multi-source data acquisition and winter rapeseed phenology. ‘E’, ‘M’ and ‘L’ represent the first, middle and last ten days of the month, respectively.
Remotesensing 18 01706 g002
Figure 3. Overall architecture of the enhanced UNet++ network. The model consists of four primary components: band attention module, backbone network, sCSE attention module, and progressive training strategy.
Remotesensing 18 01706 g003
Figure 4. FI-R index parameter optimization, distribution characteristics, and inter-class separability evaluation: (a) FI-R parameter sensitivity heatmap; (b) distribution of the optimal parameter combination for rapeseed diagnosis; (c) inter-class graded scoring graph.
Remotesensing 18 01706 g004
Figure 5. Curve graph of feature quantity and accuracy response. The red dashed line marks the optimal number of features (71), at which the cross-validation accuracy reaches 0.8611 and the Kappa coefficient reaches 0.8290.
Remotesensing 18 01706 g005
Figure 6. Convergence characteristics and multidimensional accuracy evolution of the UNet++ model under the progressive learning strategy.
Remotesensing 18 01706 g006
Figure 7. Visualization of the extraction results at each stage of progressive deep learning. (a) Results for the mountain-valley terrain site, showing from left to right: the original Sentinel-2 L2A image, and the classification outputs of Phase 1, Phase 2, and Phase 3; (b) Results for the urban-river terrain site; (c) Results for the basin farmland terrain site. The legend illustrates the color coding for different land cover classes, including rapeseed, wheat, water, road, building, other vegetation, and forest.
Remotesensing 18 01706 g007
Figure 8. Full-element normalized confusion matrix.
Remotesensing 18 01706 g008
Figure 9. Comparison of land cover classification results using different methods across typical areas. The first row presents Sentinel-2L2A original images (ae); the second row shows FIR classification results (ae); the third row displays SVM classification results (ae); the fourth row illustrates PLS-UNet++ classification results (ae). The color legend represents land-cover types.
Remotesensing 18 01706 g009
Figure 10. Remote sensing images of winter rapeseed flowering period and planting distribution map in the study area.
Remotesensing 18 01706 g010
Table 1. Dominant agronomic practices, environmental conditions, and their implications for winter rapeseed identification in the Hanzhong Basin during the 2024–2025 growing season.
FactorCharacteristics in the Hanzhong Basin (2024–2025)Implication for Remote Sensing Identification
VarietyDominant Hanyou hybrid series with synchronized flowering traits.Stabilizes canopy structure; reduces intra-class spectral variability.
Sowing DateStandardized mid-October sowing following regional guidance.Aligns phenological stages; ensures predictable temporal signatures.
FertilizationCoordinated boron spray during early flowering (March).Uniforms canopy vigor; enables the classifier to focus on categorical phenological differences.
IrrigationIntensive on central plains; rain-fed in mountainous fringes.Validates the “central aggregation—marginal fragmentation” spatial pattern.
Soil and TerrainDeep alluvial (center) vs. shallow, heterogeneous soils (edges).Reinforces spatial boundaries; captured via texture and topographic (DEM) features.
ClimateFavorable conditions (90.3% good/excellent); stable warming after early Feb.Ensures typical phenological signals; provides a reliable single-season benchmark.
Pheno-SyncHighly synchronized growth driven by uniform management.Maximizes phenological separability in multi-temporal imagery.
Table 2. Feature variables list.
Data TypeCategoryVariable
Name
DescriptionSource
Sentinel-2SpectralB2, B3, B4, B5, B6, B7, B8, B8A, B11, B12Blue light, green light, red light, red edge, near-infrared, short-wave infrared, etc.Sentinel-2 L2A
IndexFI-R (Key features)Rapeseed flowering indexBand Math
NDVINormalized vegetation indexBand Math
EVIEnhanced vegetation indexBand Math
NDYINormalized difference yellow vegetation indexBand Math
RVIRatio vegetation indexBand Math
SAVISoil regulated vegetation indexBand Math
NDWINormalized difference water indexBand Math
DVIDifference vegetation indexBand Math
GNDVIGreen normalized vegetation indexBand Math
ARVIAtmospheric attenuation vegetation indexBand Math
TextureGLCM_Mean, variance, homogeneity, contrast, dissimilarity, entropy, ASM, correlationSentinel-2 (PCA)
DEMTerrainDEM, slope, aspectElevation, slope, aspectSRTM DEM
Table 3. Optimal subset: distribution of 71 features at different phenological stages.
Stage/CategoryNumber of FeaturesExample of Feature Variables
Sowing period (T1)15B6, B8A, B7, B8, B12, B4, B5, Tex Mean, RVI, ARVI, DVI
Overwintering period (T2)6NDYI, Tex Mean, FIR, GNDVI, B11, B12
The green-up period (T3)10Tex_Mean, NDYI, B8A, SAVI, RVI, NDWI, B6, EVI, FIR
Flowering period (T4–T5)22FI-R, RVI, NDYI, NDWI, B5, B4, NDVI, ARVI, B12, B7, EVI
Mature stage (T5–T6)16NDYI, NDWI, B12, B6, B11, RVI, B4, FIR, B8, GNDVI
Topographic features2Elevation, Slope
Table 4. Statistical table of classification accuracy of standard machine learning models in different feature scenarios.
GroupIndicatorANNSVMRFGNB
Dataset 1UA/PA0.90/0.900.92/0.920.93/0.910.87/0.91
OA0.8854 0.9057 0.8814 0.7655
Kappa0.86100.88560.85610.7167
Dataset 2UA/PA0.93/0.900.91/0.900.93/0.910.90/0.90
OA0.90430.90030.88410.7264
Kappa0.88370.87890.85940.6700
Dataset 3UA/PA0.92/0.840.93/0.830.88/0.930.93/0.87
OA0.87040.87230.87410.7810
Kappa0.83980.84190.84480.7291
Dataset 4UA/PA0.90/0.910.91/0.910.93/0.900.88/0.91
OA0.87740.90700.88950.7628
Kappa0.85130.88710.86600.7141
Note: In the table, UA and PA represent the User’s Accuracy and Producer’s Accuracy of winter rapeseed, while OA and Kappa represent the overall accuracy of the test set and the Kappa coefficient of the test set, respectively. Datasets 1–4 correspond to the spectral feature group, the spectral and terrain feature group, the full feature group, and the optimal preferred feature group, respectively.
Table 5. Comparison of overall performance and class-wise IoU at different stages.
Evaluation IndicatorsPhase 1Phase 2Phase 3
Overall performanceOverall Accuracy95.27%98.17%98.65%
Mean IoU (mIoU)84.39%93.64%95.29%
Weighted IoU91.38%96.48%97.38%
Kappa0.94050.97690.9830
Weighted F195.18%98.16%98.65%
IoURapeseed80.35%93.78%94.31%
Wheat70.97%90.61%92.35%
Water98.42%98.86%99.30%
Road66.87%82.55%88.73%
Building90.73%95.11%97.49%
Other_Veg83.62%94.62%94.87%
Forest99.79%99.98%99.98%
Table 6. Physical index, machine and deep learning accuracy assessment table.
MethodUAPAOAKappaF1IoU
FI-R0.850.960.94410.89150.9173-
SVM0.910.910.90700.88710.9070-
RF0.930.900.88950.86600.8912-
ANN0.930.900.90430.88370.8774-
GNB0.930.870.78100.72910.7810-
UNet (Baseline DL)0.950.940.90040.87520.94660.8986
UNet++0.970.960.98650.98300.97070.9431
Disclaimer/Publisher’s Note: The statements, opinions and data contained in all publications are solely those of the individual author(s) and contributor(s) and not of MDPI and/or the editor(s). MDPI and/or the editor(s) disclaim responsibility for any injury to people or property resulting from any ideas, methods, instructions or products referred to in the content.