Article

An Enhanced Image Feature Extraction and Matching Method for Three-Dimensional Reconstruction of Forest Scenes

The Academy of Digital China, Fuzhou University, Fuzhou 350108, China
*
Author to whom correspondence should be addressed.
Remote Sens. 2026, 18(11), 1681; https://doi.org/10.3390/rs18111681
Submission received: 20 March 2026 / Revised: 15 May 2026 / Accepted: 20 May 2026 / Published: 22 May 2026
(This article belongs to the Special Issue Digital Modeling for Sustainable Forest Management)

Highlights

What are the main findings?
  • We propose an improved image-based 3D tree reconstruction method integrating ALIKED feature extraction and LightGlue matching with neighborhood constraints.
  • Our approach increases feature points by ~50%, improves matching accuracy by 4–8%, achieves 100% registration rate, and boosts point cloud density by up to 1.2×.
What are the implications of the main findings?
  • The method effectively mitigates pose drift artifacts and spurious reconstructions, enabling high-fidelity 3D modeling even under severe occlusion and repetitive textures.
  • Integration of deep learning-based feature extraction and matching models into the SfM pipeline provides an effective solution for 3D reconstruction in challenging forested scenes using videos and images as input.

Abstract

Accurate and efficient 3D reconstruction of trees is of paramount importance for studying forest spatial structures and dynamic resource patterns, optimizing forest management, protecting environments, and analyzing carbon cycles. Currently, Light Detection and Ranging (LiDAR) remains the dominant method for generating 3D models of forest scenes. However, with advancements in computer vision, photogrammetry has emerged as a crucial tool for forest inventory and 3D reconstruction due to its cost-effectiveness. Nevertheless, in practical forestry applications, traditional photogrammetry often suffers from low reconstruction efficiency and poor quality during feature extraction and matching. These issues stem from the complex structure of forest scenes, severe occlusion, and repetitive texture patterns. To address these challenges, this paper proposes an improved 3D tree reconstruction approach based on images, integrating deep learning-based methods. In the sparse reconstruction stage, we utilize the ALIKED (A LIghter Keypoint and descriptor Extraction network with Deformable transformation) algorithm and construct an image pyramid to extract multi-scale robust features. Furthermore, by combining the LightGlue matching algorithm with a neighborhood search constraint strategy, we enhance the stability of camera pose recovery while reducing redundant computations. Experimental results demonstrate that our method outperforms traditional algorithms in both accuracy and robustness regarding image matching. Compared to baseline models, the proposed approach increases the number of feature points by approximately 50% with a more widespread distribution, improves matching accuracy by 4% to 8%, and achieves a 100% image registration rate. Consequently, under the condition of maintaining equivalent re-projection errors, the subsequent sparse point clouds exhibit an average track length increase of 0.6 to 1.4 and a density increase of up to 1.2 times. Notably, this method effectively mitigates artifacts and spurious reconstructions caused by pose drift in forest photogrammetry.

1. Introduction

As the largest and most complex terrestrial ecosystem on Earth, forests play an irreplaceable role in maintaining ecological balance and preserving biodiversity. Investigating forest spatial structures and the dynamics of resource changes is of vital significance for forest management, ecological conservation, and carbon cycle analysis [1]. In urban environments, forest landscapes also constitute a vital component of urban ecosystems [2]. Urban forests not only improve air quality and regulate microclimates, but also mitigate the urban heat island effect, thereby enhancing the stability of urban ecological systems. Key parameters such as tree height, diameter at breast height (DBH), crown area, crown width, and above-ground biomass serve as critical indicators for assessing forest structure and function. These parameters not only reflect the growth status and spatial characteristics of individual trees but also reveal ecological functions at the community level [3]. Consequently, the efficient and accurate acquisition of 3D forest structural information is indispensable for forest resource inventory and management.
Traditional forest inventory methods primarily rely on plot sampling and manual measurements. While these approaches offer high accuracy, they are cost-prohibitive and ill-suited for large-scale, rapid surveys [4,5,6]. With the advancement of remote sensing and 3D reconstruction technologies, forest inventory is increasingly trending toward digitization and automation. Among available techniques, Light Detection and Ranging (LiDAR) [7] and Close-Range Photogrammetry (CPR) [8] have emerged as the two dominant methodologies [9]. LiDAR can directly acquire high-precision point cloud data; in particular, Terrestrial Laser Scanning (TLS) [10] demonstrates superior accuracy in measuring forest structures at the individual tree and small-plot scales. For instance, Lee et al. [11] utilized LiDAR scanning to achieve 3D reconstruction of citrus trees, quantifying geometric parameters such as crown height, width, and volume. This work laid a foundation for yield estimation and precision irrigation and spraying operations for citrus orchards. Similarly, Torralba et al. [12] employed TLS to measure the DBH of trees in the Mediterranean region, comparing the performance of single-station versus multi-station scanning configurations. However, TLS faces significant limitations in capturing complete upper canopy structures due to restricted scanning angles and severe canopy occlusion [13]. Furthermore, the operation of such LiDAR equipment often requires specialized personnel and involves complex data processing workflows, which hinders its widespread adoption for large-scale, routine forest inventories. In contrast, fueled by advancements in computer vision, photogrammetry has become an economically viable alternative, leveraging lightweight equipment and low-cost imagery. The standard workflow typically integrates Structure-from-Motion (SfM) [14] and Multi-View Stereo (MVS) [15]. Specifically, SfM estimates camera poses and reconstructs a sparse point cloud through feature detection and matching combined with geometric constraints, while MVS subsequently generates dense point clouds based on these results. Although SfM-MVS-based methods have been widely applied in 3D forest reconstruction [16,17,18,19], they still suffer from issues such as low efficiency in feature matching and insufficient reconstruction accuracy under occluded conditions.
The core of Structure-from-Motion (SfM) lies in robust feature extraction and matching, which fundamentally determine the accuracy of initial camera pose estimation and the quality of sparse point clouds [20]. Traditional handcrafted feature extraction methods, such as Scale-Invariant Feature Transform (SIFT) [21], operate by detecting stable keypoints and computing descriptors for matching. However, when confronted with large-scale, complex scenes and severe occlusion, these conventional approaches often exhibit low matching efficiency and accuracy [22]. As noted in the review by Iglhaut et al. [23], environmental factors such as occlusion and complex textures frequently cause traditional geometric features (e.g., SIFT) to suffer from matching breaks or drift. In recent years, deep learning-based feature extraction methods, including SuperPoint [24], DISK [25], and ALIKED [26], have significantly enhanced matching robustness and efficiency by automatically learning image representations through deep neural networks. Concurrently, graph neural network-based matching algorithms, such as SuperGlue [27] and its accelerated variant LightGlue [28], have demonstrated superior performance in scenarios characterized by significant viewpoint and illumination variations. These deep learning approaches overcome the limitations of handcrafted features under challenging conditions—such as varying lighting, diverse viewpoints, and texture scarcity—by leveraging high-level semantic features learned from data [29]. Specific applications in forestry have already shown some promise: Pritchard et al. [30] fine-tuned LightGlue to achieve accurate camera pose estimation in forest scenes using only 25% of the keypoints required by traditional baseline models. Similarly, Zhang et al. [31] employed a SuperPoint + LightGlue pipeline to reconstruct densely planted rice seedlings in three-dimension. Furthermore, accurate 3D reconstructions have been achieved for UAV images [32,33,34] and satellite imagery [35]. In their review on reconstructing unstructured complex terrains, Tong et al. [36] emphasized that the transition from geometry-driven to data-driven paradigms is key to resolving matching failures in weakly textured scenes, highlighting the advantages of deep neural networks in high-dimensional semantic feature representation. Despite the successful application of deep learning-based image matching in 3D reconstruction of regular objects and structured scenes, existing studies predominantly focus on small-scale environments [37] or medium-to-small objects [38]. Research dedicated to vegetation, particularly large-scale forest scenes, remains relatively limited, with most efforts concentrated on precise reconstruction of low-growing crops [31,39]. Moreover, there is a notable lack of deep learning-based matching and sparse reconstruction methods specifically designed for multi-tree, multi-layered structures in complex forest environments. In such scenes—characterized by repetitive textures, dense canopies, and branch-leaf occlusion—image matching algorithms are prone to erroneously associating regions that are spatially distinct but visually similar. Therefore, further optimization of image matching algorithms and strategies is essential to enhance their performance in these complex natural settings.
High-quality sparse point clouds and accurate camera poses serve not only as reliable geometric priors for Multi-View Stereo (MVS) but also lay a solid foundation for subsequent optimization processes. Inaccuracies in feature extraction or matching during the Structure-from-Motion (SfM) stage can directly compromise the completeness and precision of the resulting sparse point cloud, ultimately leading to structural artifacts in the final dense reconstruction. Consequently, optimizing the feature detection and matching stages of SfM is critical for enhancing overall 3D reconstruction performance.
This study focuses on the role of SfM initialization quality in downstream 3D reconstruction. Specifically, we address the insufficient accuracy of feature detection and matching in traditional SfM pipelines when applied to forest scenes. By optimizing feature detection and matching algorithms, we aim to significantly enhance the accuracy and robustness of image matching. Furthermore, to mitigate erroneous matches caused by repetitive textures across images, we propose an optimized matching strategy designed to improve the fidelity and precision of the resulting sparse point clouds.

2. Materials and Methods

2.1. Overview of the Study Area

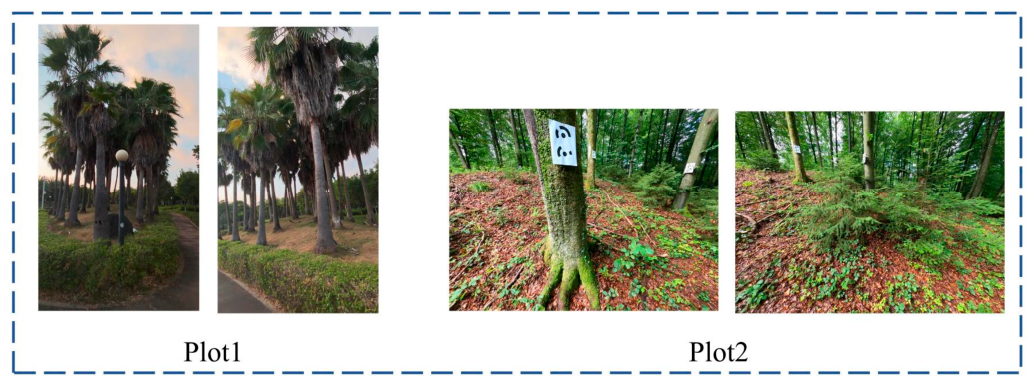
We selected an urban forest plot located at the Qishan Campus of Fuzhou University, Fujian Province, China (26.05°N, 119.19°E), and a temperate mixed forest wild plot near Zurich, Switzerland, as the research objects. Plot 1 was selected as a relatively simple urban forest site for experimentation: this area is an irregular ellipse with terrain that is high in the center and low at the edges, containing 34 palm trees. Plot 2 is a complex wild plot measuring 50 m × 50 m, where the main trees are beech, fir, and spruce. This area has lush understory vegetation and a more complex overall environment. Figure 1 shows the general conditions of the two plots, and Table 1 summarizes the relevant tree information for both plots.

2.2. Research Methods

2.2.1. Sparse Reconstruction Algorithm for Forest Stand Images

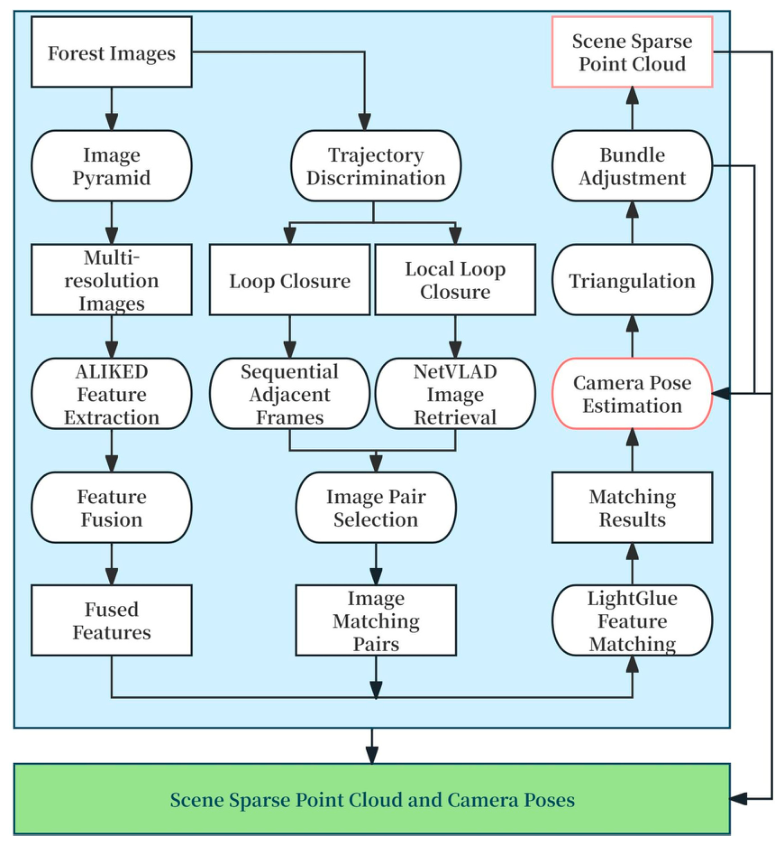
This study proposes a sparse reconstruction framework specifically designed for forest stand images. The framework integrates deep learning-based feature extraction and matching algorithms, including ALIKED and LightGlue, and incorporates an image pyramid to achieve multi-scale feature extraction. In the feature matching stage, a neighborhood constraint matching strategy is employed to select matching pairs for subsequent sparse reconstruction.
(1) ALIKED Feature Extraction Algorithm
Built on a lightweight neural network, the algorithm achieves keypoint detection through probability density estimation. Compared to traditional operators, it better captures the stable structural information of fragmented branches and leaves in forest images. Given an input image, it outputs keypoint coordinates, descriptors, and confidence scores.
(2) LightGlue Feature Matching Algorithm
To align the extracted high-dimensional features, this study employs the LightGlue algorithm based on an adaptive Transformer architecture. By leveraging a dual attention mechanism, LightGlue performs deep reasoning between two images, enabling it to identify complex occlusions and illumination variations in forest scenes. Furthermore, its unique token pruning mechanism automatically eliminates low-quality matching points. This ensures the acquisition of highly accurate image matching pairs, even in forest stand images characterized by weak or highly repetitive textures. Given two sets of feature data as input, the algorithm outputs the matching indices, match scores, and pruning masks.
(3) Feature Enhancement Based on Image Pyramid
An image pyramid is an effective structure for interpreting images in a multi-resolution format. It treats the original image as the base of the pyramid, generating a sequence of images with progressively lower spatial resolutions through continuous Gaussian smoothing and downsampling operations. In this study, rather than adopting traditional constant-ratio scaling, the construction of the image pyramid relies on resampling based on a hierarchical linear scaling factor. Let the original resolution be R, the total number of pyramid levels be n, then the resolution Ri of the i-th level (i starts from 1) is defined as follows:
R i   =   n   -   i   +   1 n × R
Although ALIKED possesses inherent scale adaptability through multi-level feature aggregation, its internal mechanism primarily utilizes multi-level semantic information to guide feature point selection and enhance descriptor discriminability. Consequently, the actual extraction of feature points is still performed on the heat map of a single-scale input image. However, in the original images of complex forest stand scenes, high-frequency textures (such as fine branches and leaves) and low-frequency structures (such as stout trunks) are heavily intertwined. Because high-frequency textures typically exhibit stronger gradient responses, the algorithm tends to overlook low-frequency structures, resulting in an uneven distribution of feature points. The image pyramid is essentially an explicit feature augmentation technique. By independently performing sampling across different resolution levels, it effectively circumvents the high-frequency interference and the bottleneck in feature quantity inherent to a single scale. Building upon the original ALIKED algorithm, we introduce an image pyramid strategy and propose a multi-scale feature extraction method termed Multi-Scale ALIKED (MS-ALIKED). This strategy not only significantly increases the absolute number of extracted feature points but also optimizes their spatial distribution and stability. It is worth noting that in natural scenes such as forests, non-rigid objects like leaves are not absolutely stationary. The image pyramid employs downsampling to blur these dynamic details, thereby focusing attention on stable rigid structures like branches and trunks. This helps in extracting more robust feature points.
(4) Neighborhood Constraint Matching Strategy
This study implements distinct image matching pair constraints tailored to different image acquisition strategies. For the urban forest plot (Plot 1), which is characterized by a circular shooting path with a loop closure, a neighborhood constraint is introduced. Under this constraint, matching is exclusively performed between each image and its temporally adjacent frames (preceding and succeeding) that exhibit visual overlap. Conversely, for the natural forest plot (Plot 2), the complexity of the environment makes it difficult to achieve a single complete closed-loop shooting path. Nevertheless, to ensure comprehensive coverage of the plot, partial local loop closures (via intersecting shooting paths) are typically executed. As a result, the spatiotemporal relationship of the image sequence is not purely linear; it also contains significant visual overlap among non-adjacent frames. Relying exclusively on temporal sequence matching would fail to effectively detect these local loop closures, making it impossible to eliminate accumulated errors. This leads to trajectory drift, which ultimately results in reconstruction failure or ghosting artifacts. To address this issue, building upon the neighborhood constraints, this study introduces a global image retrieval mechanism based on NetVLAD [40] (Vector of Locally Aggregated Descriptors). Consequently, matching is restricted to the top-K highly similar candidate frames obtained from the retrieval, alongside the temporally adjacent frames. This mechanism overcomes the time-window limitations of sequential matching. By extracting high-dimensional semantic descriptors from the images, it can rapidly identify non-adjacent yet spatially overlapping candidate loop-closure frames from a vast pool of images. This facilitates the construction of an image connectivity graph equipped with global constraints, thereby effectively correcting the trajectory drift. This study employed a publicly available pre-trained NetVLAD model rather than a self-trained one. The model utilizes a VGG-16 backbone and was trained on the large-scale place recognition dataset Pittsburgh 250k. In the experiments, we leveraged these pre-trained weights to extract a 4096-dimensional global descriptor from each input image for similarity-based retrieval.
The main process of sparse reconstruction for forest stand images is illustrated in Figure 2:

2.2.2. Data Collection

Data acquisition for Plot 1 was conducted in autumn (October) of 2025. A smartphone camera was utilized to capture 1980 × 1080 video clip at 30 frames per second (fps) on the ground, adopting a circular shooting trajectory around the plot. Subsequently, individual frames were extracted from the video at a rate of two frames per second, ensuring an overlap rate exceeding 75% between consecutive images. The dataset for Plot 2, sourced from Kükenbrink et al. [41], was acquired using a GoPro (GoPro Inc., San Mateo, CA, USA) action camera within a pre-defined plot boundary. To enhance stabilization and mitigate motion blur, the GoPro was mounted on a gimbal. The camera was configured to capture time-lapse images at 0.5 s intervals. The lens was set to wide-angle mode with a focal length of 16 mm (35 mm equivalent), yielding an image resolution of 4000 × 3000. While the original collection comprises over 1700 photographs, a subset of 608 images, representing the highly complex core area of the stand, was selected for testing. Table 2 summarizes the characteristics of these two image datasets.
For the Plot 1 reference data, we used a handheld laser scanner Lixel L1 (XGRIDS Inc., Shenzhen, China) for collecting LiDAR point cloud (the parameters are as follows: scanning range 0.05 m to 120 m, scanning rate 320,000 points per second, accuracy 5 cm, field of view 360° × 270°, working time per session approximately 90 min). We walked around the plot in a full circle in order to obtain a comprehensive LiDAR dataset. The LiDAR point cloud data for Plot 2 was described in detail in [41] and provided by its corresponding authors. Photogrammetric and LiDAR point clouds were registered in CloudCompare (Version 2.13.2) based on common features on the ground with centimeter level precision.

2.2.3. Data Processing

For the acquired image data, we determined through extensive experimentation that a four-level image pyramid was appropriate. We then constructed such a pyramid, generating image sequences at the original resolution, 3/4 resolution, 1/2 resolution, and 1/4 resolution. We used the ALIKED algorithm for feature point extraction (up to 20,000 points per level to ensure comprehensive feature capture), followed by feature fusion. During the fusion process, we employed a cross-scale non-maximum suppression (NMS) algorithm with a radius of 1 pixel; specifically, only the feature points with the highest confidence at the same pixel location were retained, and all features were then normalized.
Subsequently, the LightGlue algorithm was utilized to perform feature matching on image pairs selected via neighborhood constraints. Our previous experiments demonstrated that a balance between efficiency and accuracy was achieved by setting the linear neighborhood window to 5 for Plot 1 (matching each image with its five preceding and five succeeding neighbors) and the similarity neighborhood window to 10 for Plot 2 (matching each image with its top 10 most similar images). Matching pairs with a score exceeding 0.5 were retained. Finally, the feature matching results were imported into the open-source COLMAP software for Structure-from-Motion (SfM) processing to generate sparse point clouds and camera poses, which served as the input for Multi-View Stereo (MVS) reconstruction.
The experimental environment utilizes Visual Studio Code (Version 1.116) as the code editor and is implemented based on the Deep-image-matching [42] framework. The hardware consists of a cloud server system equipped with a Linux operating system, a 12-core CPU, 24 GB of RAM, and an NVIDIA GeForce RTX 4090 GPU with 24 GB VRAM.

3. Results

3.1. Experimental Results of Feature Extraction and Matching

To verify the effectiveness of the proposed method, we compare our improved algorithm (MS-ALIKED + LightGlue) with the traditional handcrafted method (SIFT) and the baseline method (ALIKED + LightGlue). The experimental comparison and analysis are conducted based on several evaluation metrics, including the number of extracted feature points (Count), feature point coverage (Coverage), Average Number of matched point pairs (AN), Average Inlier Number (AIN), and Average Precision (AP). Specifically, the feature point count refers to the total number of feature points extracted per image. Feature Coverage indicates the distribution extent of the detected feature points within the image pixel space, expressed as a percentage; a larger value (closer to 100%) signifies a broader distribution of the extracted feature points. The Average Number of matched point pairs (AN) represents the average count of matched feature points between images within the dataset. The Average Inlier Number (AIN) refers to the number of inliers, which are matches that fit the estimated geometric constraint (such as a homography or fundamental matrix). In this work, we utilize the LO-RANSAC (Locally Optimized RANSAC) implementation integrated within COLMAP to estimate the fundamental matrix and determine inlier correspondences, with an inlier threshold set to 1 pixel. Finally, the Average Precision (AP) is the ratio of the correctly matched point pairs (inliers) to the initial matched point pairs, expressed as follows:
AP   =   AIN AN   ×   100 %
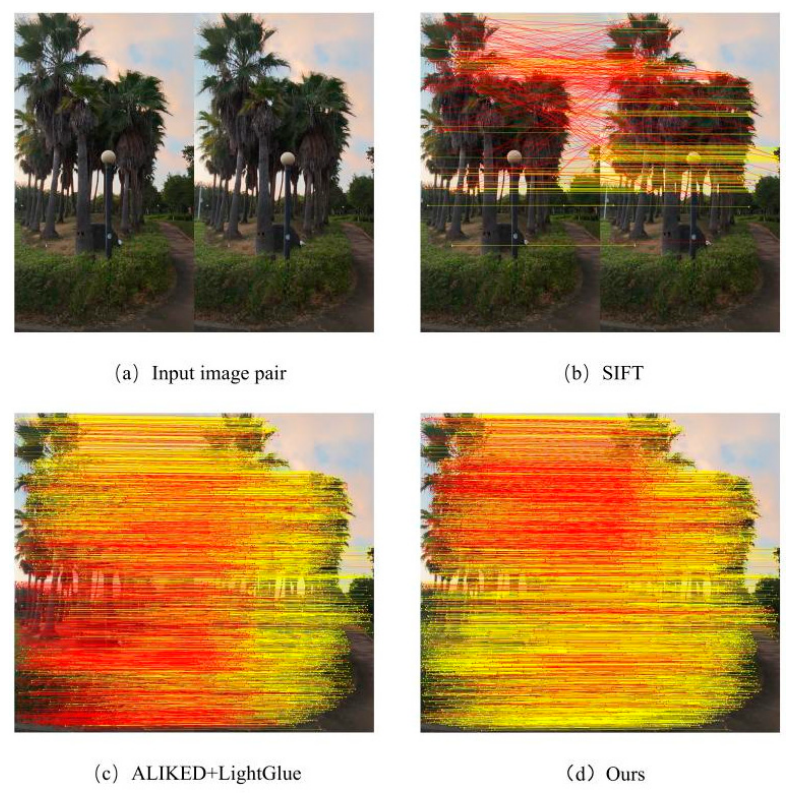
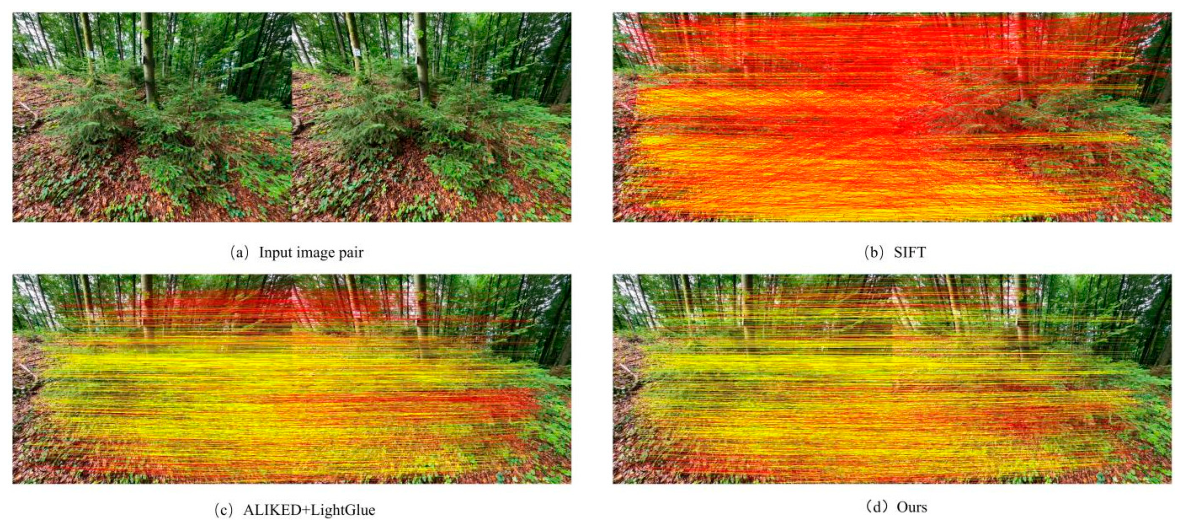
Comparative experiments regarding feature extraction and feature matching were conducted on the forest stand image datasets from both the urban and wild forest plots, evaluating SIFT, ALIKED + LightGlue, and our algorithm. In the feature extraction results, the extracted feature points are denoted by red dots. As for the feature matching results, incorrect matches are indicated by red lines, while correct matches are represented by yellow lines.
(1) Analysis of Feature Extraction Experimental Results
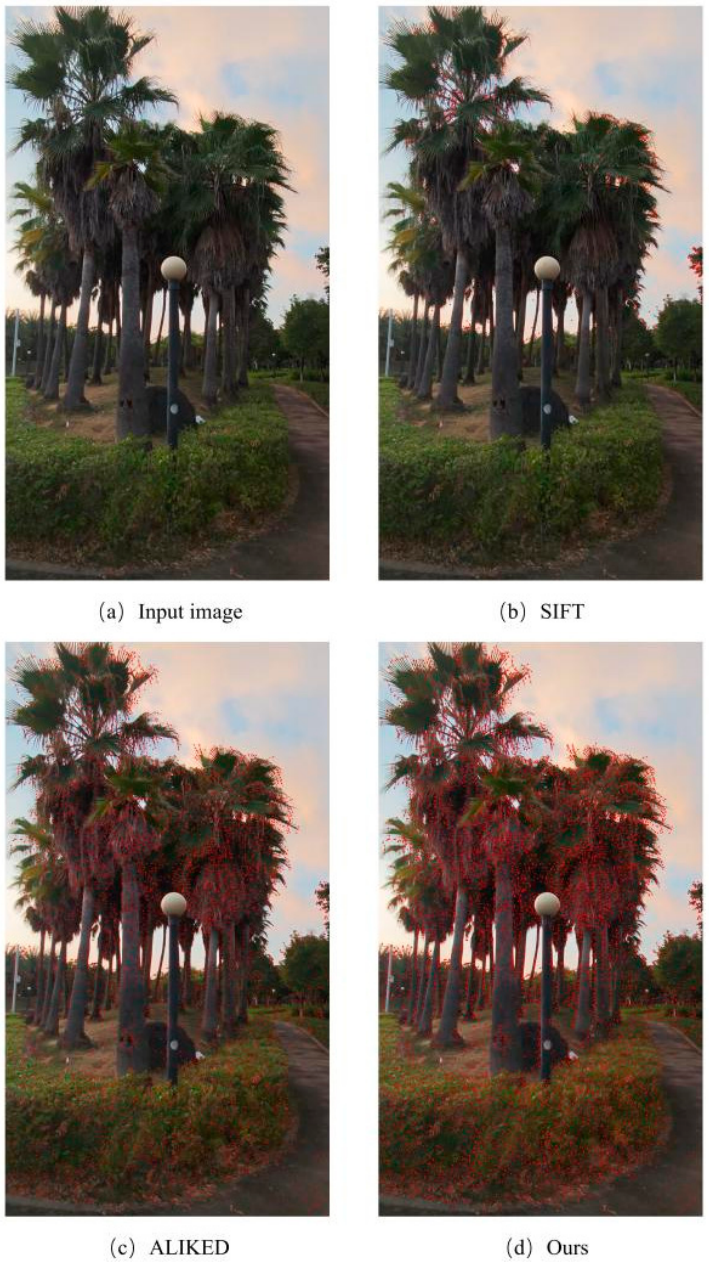
Figure 3 illustrates the feature extraction results for a selected image from Plot 1. Qualitative analysis reveals that the SIFT algorithm, constrained by the limitations of its handcrafted design, extracts extremely sparse points that are exclusively clustered in the highly salient regions of the canopy. Although the ALIKED algorithm improves the uniformity of the spatial distribution and achieves coverage over the trunks and ground, extraction blind spots persist in certain texture-weak areas. In contrast, by introducing an image pyramid to construct multi-scale feature representations, our method effectively overcomes the extraction bottleneck inherent to a single scale, successfully achieving dense feature coverage even in non-salient regions. Furthermore, the quantitative data presented in Table 3 demonstrates that our method extracts up to 13,259 feature points—14.2 times and 1.53 times the amounts extracted by SIFT and ALIKED, respectively. This significantly enhances both feature richness and the algorithm’s adaptability to complex scenes.
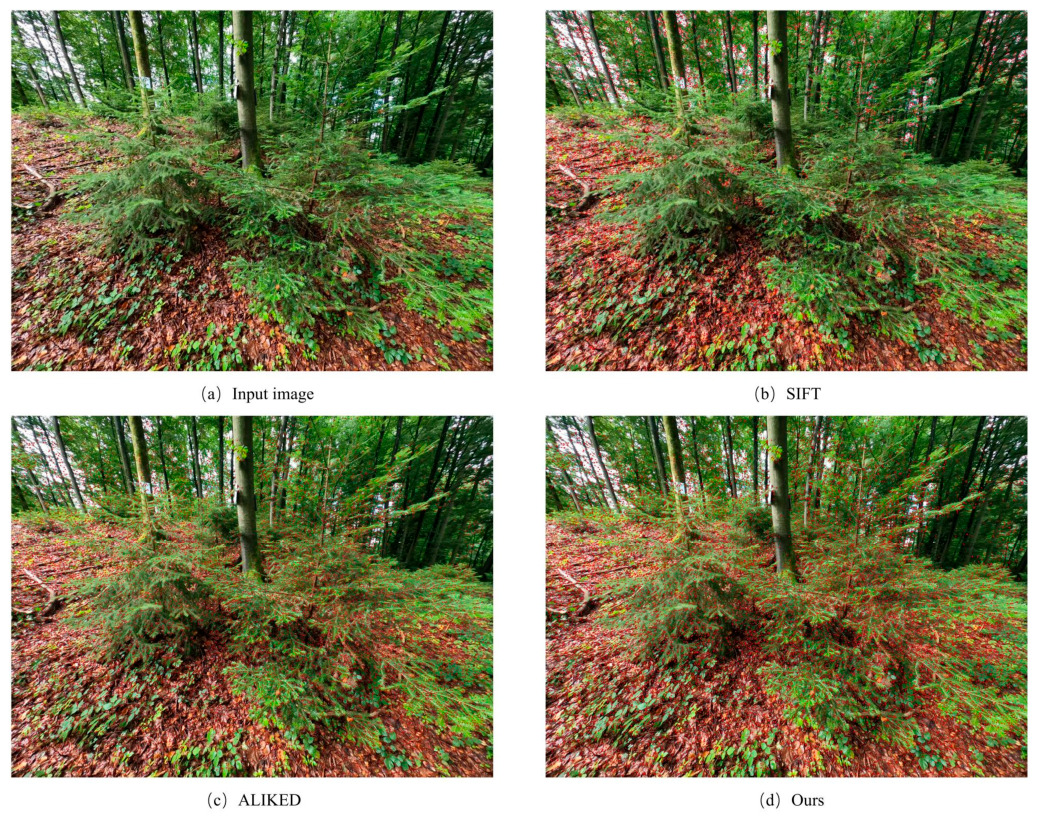
For the wild forest plot (Plot 2) shown in Figure 4, it is evident that the feature points extracted by the SIFT algorithm are predominantly concentrated in the ground areas, with relatively few points detected on the trunks, branches, and leaves. While the baseline ALIKED algorithm manages to extract a sufficient overall number of feature points, it still fails to capture an adequate quantity specifically on the tree trunks. In contrast, the proposed method achieves the most widely distributed feature points across the entire scene. Based on the quantitative analysis presented in Table 4, the SIFT algorithm extracts an average of 9626 feature points. Meanwhile, the ALIKED algorithm and the proposed method extract 10,632 and 20,147 points, respectively, representing approximately 1.1 and 2.09 times the amount extracted by SIFT. Furthermore, the feature coverage rate increases notably from 71.31% to 81.19%.
(2) Analysis of Feature Matching Results
As illustrated by the feature matching results for the forest stand images of Plot 1 in Figure 5, the SIFT algorithm finds the lowest number of matched points. Furthermore, these points are predominantly distributed in regions with highly distinct features, such as the top of the tree canopy and its surrounding areas. In contrast, the ALIKED+LightGlue method extracts a significantly higher number of matched points, which are not solely concentrated at the canopy top but are widely distributed across the canopy, trunks, and ground regions. However, both of these methods still yield a considerable number of outliers. By integrating a multi-resolution image pyramid and removing redundant feature points within the same region based on confidence scores, our method significantly increases the total number of matched points, achieving a substantial improvement over the SIFT algorithm. Moreover, compared to the baseline ALIKED + LightGlue method, our approach effectively reduces the number of outliers while simultaneously increasing the number of inliers. The quantitative analysis of the feature matching results for Plot 1, as presented in Table 5, demonstrates that the average number of matched point pairs for the SIFT algorithm is merely 425. In contrast, the ALIKED + LightGlue method and our proposed method achieve 5668 and 7624 pairs, respectively, representing approximately 13 and 18 times the amount obtained by SIFT. Regarding matching accuracy, the precision of the SIFT algorithm is only 43.53%, whereas the ALIKED + LightGlue method reaches 74.37%. Enhanced by the image pyramid and neighborhood constraint strategy, the matching precision of the proposed method is further improved to 82.87%, yielding an increase of 8.5%. Correspondingly, the absolute number of inliers also increases from 4223 to 6318.
As shown in Figure 6, the feature matching results for the forest stand images of Plot 2 reveal trends similar to those of Plot 1. The SIFT algorithm extracts the fewest matched points, which are predominantly concentrated in areas with distinct features. In contrast, the ALIKED+LightGlue method extracts a greater number of matched points with a significantly broader distribution. Nevertheless, these existing methods still generate a noticeable number of outliers. By comparison, our proposed method significantly surpasses the SIFT algorithm in terms of the absolute number of matched points. It effectively mitigates the influence of outliers while simultaneously boosting the number of inliers. The quantitative analysis of feature matching for this plot (presented in Table 6) indicates that the Average Number (AN) of matched points for the SIFT algorithm is 3877. Meanwhile, the ALIKED + LightGlue method and our proposed approach achieve 4552 and 7300, respectively—approximately 1.2 and 1.9 times the amount produced by SIFT. In terms of Average Precision (AP), the SIFT algorithm stands at 45.09%, whereas ALIKED + LightGlue reaches 67.90%. Through our algorithmic improvements, the matching precision of the proposed method is further elevated to 72.00%, marking a substantial increase of 26.91% compared to SIFT. Furthermore, the average inlier number (AIN) also increased significantly from 1748 for the SIFT algorithm to 5256.

3.2. Experimental Results and Analysis of Sparse Point Cloud Reconstruction

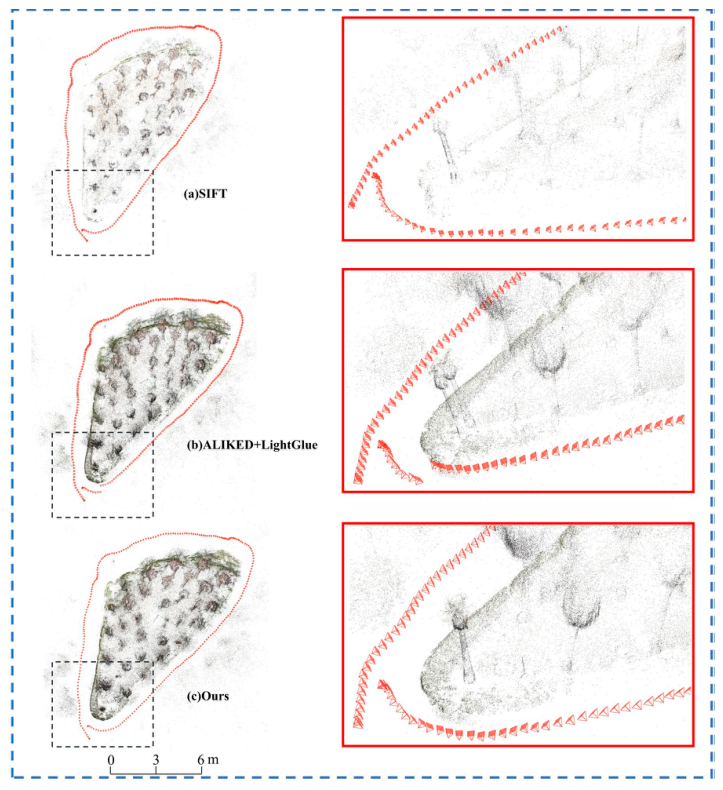
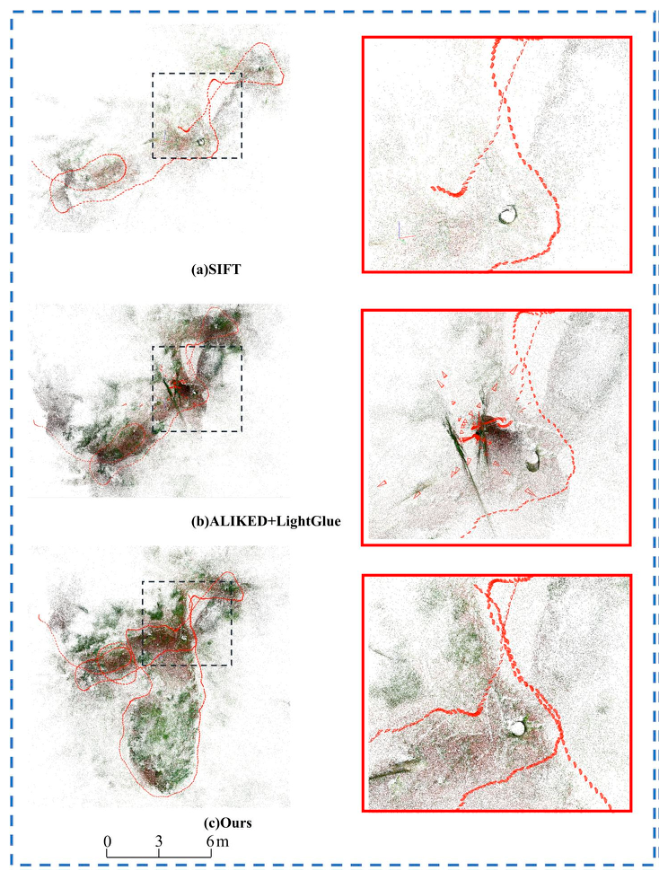
Extracting a wider distribution and a larger quantity of feature points to obtain higher-accuracy feature matching results is essential for generating a more complete sparse point cloud and recovering more accurate camera poses. To further verify the effectiveness of the proposed method, we performed SfM sparse point cloud reconstruction for Plot 1 and Plot 2 based on the matching results obtained from the three methods discussed in the previous section. In the results, red markers represent the recovered camera positions and orientations (poses); the area enclosed by the camera constitutes the sparse point cloud of the sample plot scene generated by the reconstruction. The SfM sparse reconstruction results are comprehensively evaluated and compared across different methods: completeness is assessed via the sparse point cloud models (the number of points) and the ratio of registered images, while accuracy is evaluated through metrics such as mean reprojection error, mean track length, total observed 3D points, and mean observations per image. Among these, the mean reprojection error represents the average value of the errors of 3D points re-projected onto their respective 2D matching points, measured in pixels. A smaller error indicates higher reconstruction accuracy. Generally, a reprojection error within the range of 0.5 to 2 pixels is considered normal or acceptable. Mean track length refers to the average number of matches for the same 3D point across multiple images. A longer track length typically means the 3D point is subject to more geometric constraints from multiple viewpoints, making its spatial position estimation more stable, which in turn improves the reliability of camera pose recovery and the overall reconstruction results. It should be noted that the mean track length does not directly participate in the calculation of the reprojection error; its role is to reflect the sufficiency of multi-view geometric constraints. Under conditions of sufficient constraint, the reprojection error can more reliably reflect the geometric consistency between camera poses and the 3D structure. When the mean track length is high, multi-view geometric constraints are more adequate, and the reprojection error possesses higher credibility in evaluating the quality of camera pose recovery. Conversely, in cases of insufficient track length, due to inadequate geometric constraints, geometric degradation and spurious reconstructed phenomena may still occur even if the reprojection error is small. The total observed 3D points represent the total number of feature point observations across all images. A higher number of observations generally indicates higher model redundancy. Mean observations per image is the ratio of total observed 3D points to the number of registered images, representing the average number of 2D-3D observations contributed by each image.
An analysis combining the visualizations in Figure 7 and the quantitative metrics in Table 7 reveals significant differences in reconstruction quality among the three methods. Constrained by the inadequate representational capacity of handcrafted features in weak-textured regions, the SIFT algorithm generates an extremely sparse point cloud. This makes it challenging to accurately capture key structural details of the forest stand, such as tree trunks, branches, and canopy architectures. Although the ALIKED + LightGlue baseline significantly increases the volume of the point cloud, its camera pose recovery exhibits noticeable flaws. Subject to the interference of repetitive textures within the forest, it suffers from the accumulation of motion estimation errors. This ultimately leads to geometric distortions, including pose drift and ghosting artifacts towards the end of the image sequence. In contrast, by incorporating multi-scale features via an image pyramid alongside a neighborhood constraint strategy, our proposed method effectively overcomes matching ambiguities. It not only eliminates the phenomena of trajectory breakage and spurious reconstruction to achieve precise global pose recovery but also attains optimal values across metrics such as point cloud density, mean track length, and total observations. Although the mean reprojection error exhibits a marginal increase of 0.02 pixels compared to ALIKED+LightGlue, this remains well within acceptable engineering tolerances. The proposed method successfully leverages this minuscule accuracy trade-off to achieve a substantial enhancement in both reconstruction completeness and geometric stability.
Figure 8 illustrates the 3D models generated via sparse reconstruction on the Plot 2 dataset using SIFT, ALIKED + LightGlue, and the proposed method. As observed from the visual results, both the SIFT and ALIKED + LightGlue methods suffer from missing partial sparse point clouds and camera poses in the upper-right region. Furthermore, the SIFT method only manages to register the upper-middle section. In contrast, the proposed method successfully recovers the complete camera poses, featuring a significantly denser point distribution. The specific quantitative reconstruction metrics (Table 8) demonstrate that the proposed method outperforms the other two approaches across five key indicators: the ratio of registered images, the number of points in the point cloud, total observed 3D points, mean observations per image, and mean track length. Notably, its point cloud count reaches 8,175,591, which is 7.5 times that of the SIFT method and also surpasses the ALIKED + LightGlue baseline. Although the proposed method slightly trails the comparative methods in terms of the mean reprojection error, this is primarily attributed to its successful registration of more challenging images—which the baseline methods simply discarded as difficult cases. This inevitably leads to a statistical accumulation of observation errors. Overall, within the highly complex environment of Plot 2, our method achieves high-density reconstruction while strictly preserving camera recovery completeness. This effectively validates its technical superiority for the 3D reconstruction of complex forest scenes.

3.3. Ablation Study and Analysis

Here, we quantitatively analyze the effectiveness of the image pyramid-based feature enhancement module and the neighborhood constraint-based match pair control module by comparing evaluation metrics of sparse point cloud reconstruction. The baseline method employs the ALIKED + LightGlue combination with a global matching strategy. As shown in Table 7 and Table 8, the baseline model not only has more image-pairs to process, which requires longer computation time, but also has limited reconstruction accuracy. The image pyramid feature enhancement module demonstrates the most significant improvement in reconstruction performance. After feature enhancement via image pyramid, the average tracking length is substantially strengthened, and the point cloud quantity is greatly increased. However, due to sub-pixel bias generated by multi-scale mapping, the average reprojection error also increases. To further improve accuracy, a neighborhood constraint strategy is introduced to reduce or eliminate cross-image mismatches caused by repetitive textures in complex forest scenes.
The results show the following: for Plot 1, the sparsely reconstructed point cloud quantity decreased by 6787 points, the mean reprojection error reduced by 0.015 pixels (from 1.327 pixels to 1.312 pixels), and calculations reveal that the average reprojection error of those eliminated 6787 points reached 2.088 pixels, which resulted in a slightly improved mean reprojection error. For Plot 2, a natural forest scene dataset with high overlap repetition, a neighborhood window of 10 was set to ensure sufficient image matching constraints. After feature enhancement via image pyramid, registered images increased from 411 to 608, achieving 100% registration rate. Furthermore, after neighborhood constraint, the point cloud quantity decreased by 12,240 points, the average reprojection error reduced by 0.024 pixels, and the average reprojection error of these eliminated points reached 2.737 pixels. The above data indicate that neighborhood constraints can catch outlier match pairs with large errors, effectively refining observation data while maintaining reconstruction scale, and significantly improving the geometric accuracy of sparse point clouds in forest scenes. Although there are marginal decreases in point cloud quantity, average tracking length, total observed 3D points, and mean observations per image, our method essentially removes geometric noises that have large spatial error while still effectively maintaining key structural information.
In terms of runtime efficiency, SIFT remains the most efficient algorithm even without the matching neighborhood constraint. After the image pyramid feature enhancement, the matching time for learned algorithms (ALIKED + LightGlue) increased a little bit. Following the application of constrained matching pairs, the time was reduced considerably, to the same order as that of SIFT. It is worth noting that the memory usage based on deep learning algorithms is usually higher, peaking at around 25 GB.

3.4. Visual Comparison of Dense Reconstruction Results

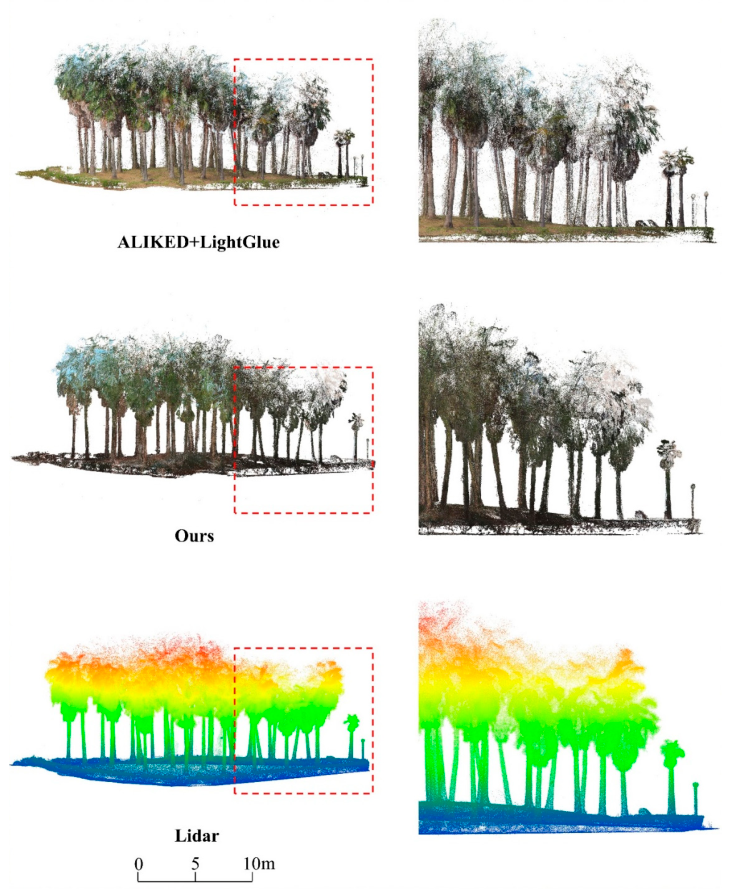
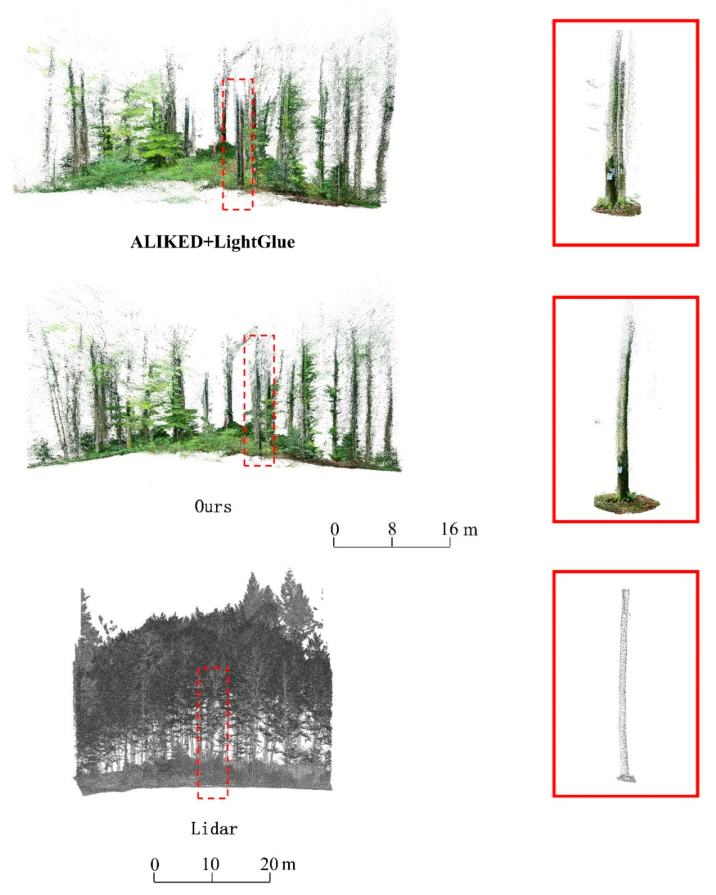
To comprehensively evaluate the effectiveness of the proposed sparse reconstruction framework, we conduct MVS dense reconstruction on the aforementioned plots using both the global matching framework (based on ALIKED + LightGlue) and the neighborhood-constrained matching framework (using our improved algorithm), with LiDAR point clouds serving as reference data. We assess the dense reconstruction results only qualitatively in this report; a more thorough, quantitative evaluation about the reconstructed point cloud completeness, accuracy and the resulting tree information (DBH, tree height and number of trees) will be presented in the future. It should be noted that since the SIFT method failed to recover all camera poses for Plot 2, SIFT-based sparse reconstruction results were excluded from the dense reconstruction process for both plots to ensure consistency.
Although the global matching framework based on ALIKED+LightGlue successfully reconstructed the overall structural point cloud, it recovered incorrect camera poses during the sparse reconstruction stage. Consequently, errors accumulated progressively during the dense reconstruction and point cloud registration processes, leading to the appearance of duplicate point cloud regions. As illustrated in Figure 9 and Figure 10, visual comparison with our reconstruction result and the LiDAR reference data reveals that for Plot 1, the point cloud on the right side exhibits significant duplication, while the central trunk area shows artifacts and obvious noise within the forest, with relatively sparse canopy coverage. Regarding Plot 2, due to the complexity of the plot, specific variations were difficult to discern from the global point cloud; therefore, a single tree was extracted for detailed comparison. The results demonstrate that while the global matching framework produced severe artifacts, these artifacts were effectively eliminated in the tree generated using our proposed method.

4. Discussion

It is clear that traditional feature detection and matching algorithms can handle most of the cases for forest scene reconstruction from images, as evidenced by these recent [43,44,45,46,47] and many earlier studies. Both conventional open-source and commercial computer vision and photogrammetry software were regularly used in the applications. However, there are situations where the complexity and similarity of the forested images can confuse these algorithms, and result in failed reconstruction, yet such failures are rarely reported.
Aiming at the challenges brought by complex scale, illumination changes, and repetitive textures in those difficult forest scenes, the SfM sparse reconstruction framework proposed in this study, which takes the ALIKED + LightGlue algorithms as the core and constructs an image pyramid and uses a neighborhood constraint strategy, demonstrates significant performance advantages. The image pyramid effectively enhances the algorithm’s adaptability to unstructured environments through multi-scale feature extraction. Due to the increase in feature points, its computational load also increases, and the time cost of a single matching pair will increase correspondingly, but thanks to the adaptive token pruning mechanism of LightGlue, the time consumed for matching does not increase linearly; when the number of feature points increases to 1.5 times, the matching time increases to 1.18 times. Meanwhile, the neighborhood constraint strategy fundamentally blocks the occurrence of long-distance cross-image mismatches by restricting the matching search space. This strategy, combining local and global aspects, significantly improves the geometric consistency of feature points, thereby ensuring the accuracy of camera pose recovery, and solves the problems of pose drift, breakage, and point cloud artifacts that are prone to occur in traditional SfM in large-scale dynamic forest scenes. However, when facing different natural scenes and image collection methods, it is still necessary to discreetly determine the constraint method that can be appropriately applied.
We also introduce matching pairs and neighborhood constraints to the SIFT method. Even in complex forest scenes, traditional handcrafted algorithms such as SIFT can also achieve improved sparse reconstruction quality by limiting the number of matches. This experimental result indirectly suggests the effectiveness and generalizability of our approach.
Our findings validate the perspectives of studies [31,39], specifically that a deep learning-based feature detection and matching strategy offers significant benefits in complex agricultural and forestry scenarios. Although learned methods bring a larger number of feature points and a greater number of matches, they also bring greater computational requirements. Traditional handcrafted methods generally require less computing power, memory and shorter time to process the same number of image matches. Further study on optimizations should be carried out targeting the computational efficiency bottleneck, studying how to reduce inference latency without sacrificing feature extraction accuracy, thereby promoting the real-time application of this method in resource-constrained environments.
This study focuses on exploring the effectiveness of the improved ALIKED+LightGlue baseline model combination in SfM reconstruction of forest scenes. It does not intend to provide a systematic or exhaustive comparison with other mainstream deep learning feature matching methods, such as SuperPoint + SuperGlue or LoFTR [48]. This limitation restricts a comprehensive evaluation of the performance advantages of the proposed approach.
Although recently developed unconstrained 3D reconstruction paradigms—such as DUSt3R [49] and VGGT [50], which operate without prior information about camera calibration or viewpoint poses—show great potential in terms of robustness and effectiveness, they are currently limited by prohibitive computational overhead and insufficient geometric accuracy when processing long image sequences of natural scenes. We anticipate that future work will also explore the integration of feed-forward neural networks with geometric constraint frameworks to further enhance the automation of high-precision reconstruction in complex environments.


5. Conclusions

To deal with the problems of low reconstruction efficiency and poor reconstruction quality in the image feature extraction and matching steps of traditional photogrammetry in complex forest scenes, this study introduces an image pyramid and neighborhood constraints to improve the deep learning-based feature extraction and matching methods, aiming to optimize the initial point cloud generated by SfM. By introducing the image pyramid, image features are effectively extracted at multiple scales, solving the problems caused by scale variations and low-resolution images in large-scale scenes. The introduction of the neighborhood constraint effectively reduces mismatches caused by cross-image feature matching and ensures the geometric consistency of feature points, thereby improving the accuracy of point cloud initialization. This framework is comprehensively evaluated from numerous aspects, including processing efficiency, the number of extracted features, feature matching accuracy, the quality of the sparse reconstructed point cloud, and the quality of the dense reconstructed point cloud model. The experimental results show that
  • Compared with traditional handcrafted feature extraction methods, deep learning–based approaches significantly increase both the number and spatial coverage of extracted features. When combined with the image pyramid, the proposed method further boosts the number of detected keypoints by approximately 1.5 times, and improves feature coverage by 3% to 10%.
  • Compared with traditional handcrafted feature matching methods, deep learning–based matching achieves more accurate results. Integrating our proposed approach further enhances matching accuracy by 4.1% to 8.4%.
  • In terms of camera pose recovery, our method yields more accurate poses. Under consistent reprojection error thresholds, the average track length increases by 0.6 to 1.3, effectively mitigating camera pose drift.
  • By introducing neighborhood constraints, our method effectively reduces mismatches caused by cross-image feature matching, eliminating a large portion of point cloud points with reprojection errors greater than 2 pixels. This ensures geometric consistency among matched features and thereby improves the accuracy of point cloud initialization.

Author Contributions

Conceptualization, H.W. and H.H.; methodology, H.W. and H.H.; software, H.W.; validation, H.W. and H.H.; formal analysis, H.W. and H.H.; investigation, H.W. and H.H.; resources, H.W. and H.H.; data curation, H.W. and H.H.; writing—original draft preparation, H.W. and H.H.; writing—review and editing, H.W. and H.H.; visualization, H.W. and H.H.; supervision, H.H.; project administration, H.H.; funding acquisition, H.H. All authors have read and agreed to the published version of the manuscript.

Funding

This research received no external funding.

Data Availability Statement

Dataset available on request from the authors.

Conflicts of Interest

The authors declare no conflict of interest.

References

  1. Wigneron, J.-P.; Ciais, P.; Li, X.; Fraser, B.; Al-Yaari, A.; Fan, L.; Chave, J.; Fensholt, R.; Brandt, M.; Yuan, W.; et al. Global carbon balance of the forest: Satellite-based L-VOD results over the last decade. Front. Remote Sens. 2024, 5, 1338618. [Google Scholar] [CrossRef]
  2. Yang, Y.; Ma, J.; Liu, H.; Li, S.; Liu, Y.; Zhang, C. Spatial Heterogeneity analysis of urban forest ecosystem services in Zhengzhou City. PLoS ONE 2023, 18, e0286800. [Google Scholar] [CrossRef]
  3. Zhang, B.; Li, X.; Du, H.; Han, N.; Mao, F.; Li, X.; Cui, L.; Liu, T. Estimation of urban forest characteristic parameters using UAV-Lidar coupled with canopy volume. Remote Sens. 2022, 14, 6375. [Google Scholar] [CrossRef]
  4. Shao, J.; Lin, Y.-C.; Wingren, C.; Zhang, W.; Ågren, A.M.; Olsson, H.; Huo, L.; Persson, H.J. Large-scale inventory in natural forests with mobile LiDAR point clouds. Sci. Remote Sens. 2024, 10, 100168. [Google Scholar] [CrossRef]
  5. Jurjević, L.; Liang, X.; Gašparović, M.; Balenović, I. Is field-measured tree height as reliable as believed–Part II, A comparison study of tree height estimates from conventional field measurement and low-cost close-range remote sensing in a deciduous forest. ISPRS J. Photogramm. Remote Sens. 2020, 169, 227–241. [Google Scholar]
  6. Luoma, V.; Saarinen, N.; Wulder, M.A.; White, J.C.; Vastaranta, M.; Holopainen, M.; Hyyppä, J. Assessing precision in conventional field measurements of individual tree attributes. Forests 2017, 8, 38. [Google Scholar] [CrossRef]
  7. Wu, Y.; Zhong, S.; Ma, Y.; Lin, J.; Lin, Y.; Lin, J.; Chen, C.; Lin, W.; He, Z.; Liu, J. Application of SLAM-based mobile laser scanning in forest inventory: Methods, progress, challenges, and perspectives. Forests 2025, 16, 920. [Google Scholar] [CrossRef]
  8. Luhmann, T. Close range photogrammetry for industrial applications. ISPRS J. Photogramm. Remote Sens. 2010, 65, 558–569. [Google Scholar] [CrossRef]
  9. Goodbody, T.R.; Coops, N.C.; White, J.C. Digital aerial photogrammetry for updating area-based forest inventories: A review of opportunities, challenges, and future directions. Curr. For. Rep. 2019, 5, 55–75. [Google Scholar] [CrossRef]
  10. Liang, X.; Kankare, V.; Hyyppä, J.; Wang, Y.; Kukko, A.; Haggrén, H.; Yu, X.; Kaartinen, H.; Jaakkola, A.; Guan, F.; et al. Terrestrial laser scanning in forest inventories. ISPRS J. Photogramm. Remote Sens. 2016, 115, 63–77. [Google Scholar] [CrossRef]
  11. Lee, K.-H.; Ehsani, R. Comparison of two 2D laser scanners for sensing object distances, shapes, and surface patterns. Comput. Electron. Agric. 2008, 60, 250–262. [Google Scholar] [CrossRef]
  12. Torralba, J.; Carbonell-Rivera, J.P.; Ruiz, L.Á.; Estornell, J.; Crespo-Perona, J. Analyzing TLS scan distribution and point density for the estimation of forest stand structural parameters. Forests 2022, 13, 2115. [Google Scholar] [CrossRef]
  13. Gan, Y.; Wang, Q.; Song, G. Non-destructive estimation of deciduous forest metrics: Comparisons between UAV-LiDAR, UAV-DAP, and terrestrial LiDAR leaf-off point clouds using two QSMs. Remote Sens. 2024, 16, 697. [Google Scholar] [CrossRef]
  14. Westoby, M.J.; Brasington, J.; Glasser, N.F.; Hambrey, M.J.; Reynolds, J.M. Structure-from-Motion photogrammetry: A low-cost, effective tool for geoscience applications. Geomorphology 2012, 179, 300–314. [Google Scholar] [CrossRef]
  15. Seitz, S.M.; Curless, B.; Diebel, J.; Scharstein, D.; Szeliski, R. A comparison and evaluation of multi-view stereo reconstruction algorithms. In Proceedings of the 2006 IEEE Computer Society Conference on Computer Vision and Pattern Recognition (CVPR′06), New York, NY, USA, 17–22 June 2006; IEEE: New York, NY, USA, 2006; pp. 519–528. [Google Scholar]
  16. Bayati, H.; Najafi, A.; Vahidi, J. 3D reconstruction of uneven-aged forest in single tree scale using digital camera and SfM-MVS technique. Scand. J. For. Res. 2021, 36, 210–220. [Google Scholar] [CrossRef]
  17. Lei, S.; Liu, L.; Xie, Y.; Zheng, W.; Feng, Z. 3D visualization technology for rubber tree forests based on a terrestrial photogrammetry system. Front. For. Glob. Change 2023, 6, 1206450. [Google Scholar] [CrossRef]
  18. Tian, G.; Chen, C.; Huang, H. Comparative Analysis of Novel View Synthesis and Photogrammetry for 3D Forest Stand Reconstruction and extraction of individual tree parameters. Remote Sens. 2025, 17, 1520. [Google Scholar] [CrossRef]
  19. Huang, H.; Tian, G.; Chen, C. Evaluating the point cloud of individual trees generated from images based on Neural Radiance fields (NeRF) method. Remote Sens. 2024, 16, 967. [Google Scholar] [CrossRef]
  20. Schönberger, J.L.; Frahm, J.M. Structure-from-Motion Revisited. In Proceedings of the 2016 IEEE Conference on Computer Vision and Pattern Recognition (CVPR), Las Vegas, NV, USA, 27–30 June 2016; pp. 4104–4113. [Google Scholar]
  21. Lowe, D.G. Distinctive image features from scale-invariant keypoints. Int. J. Comput. Vis. 2004, 60, 91–110. [Google Scholar] [CrossRef]
  22. Bonilla, S.; Di Vece, C.; Daher, R.; Trulls, E.; Fua, P.; Yi, K.M. Mismatched: Evaluating the Limits of Image Matching Approaches and Benchmarks; European Conference on Computer Vision; Springer: Berlin/Heidelberg, Germany, 2024; pp. 120–137. [Google Scholar]
  23. Iglhaut, J.; Cabo, C.; Puliti, S.; Piermattei, L.; O′Connor, J.; Rosette, J. Structure from motion photogrammetry in forestry: A review. Curr. For. Rep. 2019, 5, 155–168. [Google Scholar] [CrossRef]
  24. Detone, D.; Malisiewicz, T.; Rabinovich, A. SuperPoint: Self-Supervised Interest Point Detection and Description. In Proceedings of the IEEE/CVF Conference on Computer Vision and Pattern Recognition (CVPR), Salt Lake City, UT, USA, 18–23 June 2018; IEEE: New York, NY, USA, 2018; pp. 224–236. [Google Scholar]
  25. Tyszkiewicz, M.J.; Fua, P.; Trulls, E. DISK: Learning local features with policy gradient. Adv. Neural Inf. Process. Syst. 2020, 33, 14254–14265. [Google Scholar]
  26. Zhao, X.; Wu, X.; Chen, W.; Chen, C.; Li, S.; Zhang, H. ALIKED: A Lighter Keypoint and Descriptor Extraction Network via Deformable Transformation. IEEE Trans. Instrum. Meas. 2023, 72, 1–16. [Google Scholar] [CrossRef]
  27. Sarlin, P.-E.; DeTone, D.; Malisiewicz, T.; Rabinovich, A. SuperGlue: Learning Feature Matching with Graph Neural Networks. In Proceedings of the IEEE/CVF Conference on Computer Vision and Pattern Recognition, Seattle, WA, USA, 13–19 June 2020; pp. 4938–4947. [Google Scholar]
  28. Lindenberger, P.; Sarlin, P.-E.; Pollefeys, M. LightGlue: Local Feature Matching at Light Speed. In Proceedings of the IEEE/CVF Conference on Computer Vision and Pattern Recognition, Vancouver, BC, Canada, 17–24 June 2023; pp. 17627–17638. [Google Scholar]
  29. Ma, J.; Jiang, X.; Fan, A.; Jiang, J.; Yan, J. Image matching from handcrafted to deep features: A survey. Int. J. Comput. Vis. 2021, 129, 23–79. [Google Scholar] [CrossRef]
  30. Pritchard, T.; Ijaz, S.; Clark, R. Forestvo: Enhancing visual odometry in forest environments through ForestGlue. IEEE Robot. Autom. Lett. 2025, 10, 5233–5240. [Google Scholar] [CrossRef]
  31. Zhang, Z.; Wang, L.; Ren, W.; Zheng, S. Three-dimensional reconstruction of densely planted rice seedlings based on MultiView images. Plant Phenomics 2025, 7, 100122. [Google Scholar] [CrossRef]
  32. Trybała, P.; Morelli, L.; Remondino, F.; Toffanin, C.; Nex, F. Under-canopy drone 3D surveys for wild fruit hotspot mapping. Drones 2024, 8, 577. [Google Scholar] [CrossRef]
  33. Kim, S.; Ban, S.; Kim, H.; Han, Y. Analysis of LightGlue Matching for Robust TIN-Based UAV Image Mosaicking. Remote Sens. 2025, 17, 3767. [Google Scholar] [CrossRef]
  34. Jiang, S.; Jiang, W.; Guo, B.; Li, L. Learned local features for structure from motion of UAV images: A comparative evaluation. IEEE J. Sel. Top. Appl. Earth Obs. Remote Sens. 2021, 14, 10583–10597. [Google Scholar] [CrossRef]
  35. Wang, L.; Lan, C.; Wu, B.; Yao, G.; Wei, S.; Li, X.; Lu, L.; Ma, D. A method for detecting feature-sparse regions and matching enhancement. Remote Sens. 2022, 14, 6214. [Google Scholar] [CrossRef]
  36. Tong, X.; Huang, R.; Cao, J.; Ye, Z.; Feng, T.; Wu, L.; Xie, H. Intelligent methods for 3Dterrainreconstruction of the Moon and near-Earth planets: A review of current advances and future perspectives. Acta Geod. Cartogr. Sinica 2025, 54, 1917–1933. [Google Scholar]
  37. Zhong, J.; Li, M.; Gruen, A.; Cao, M.; Zhang, R.; Zhang, Y.; Jiang, T.; Lin, M. Cutting-edge 3D reconstruction solutions for underwater coral reef images: A review and comparison. ISPRS J. Photogramm. Remote Sens. 2025, 230, 779–803. [Google Scholar] [CrossRef]
  38. Kulkarni, N.; Devarashetti, A.; Cluss, C.; Shen, J.; Roy, K.; Shrivastava, A.; Kim, J.; Forsyth, D.; Sunkavalli, K.; Zhang, S.; et al. Rig-Aware 3D Reconstruction of Vehicle Undercarriages using Gaussian Splatting. arXiv 2026, arXiv:260114208. [Google Scholar] [CrossRef]
  39. Lingua, A.M.; Manca, S.; Gallitto, F.; Maschio, P. Improving Image Alignment in vineyard environment with deep learning image matching. Int. Arch. Photogramm. Remote Sens. Spat. Inf. Sci. 2025, 48, 61–67. [Google Scholar] [CrossRef]
  40. Arandjelovic, R.; Gronat, P.; Torii, A.; Pajdla, T.; Sivic, J.; Jégou, H.; Perronnin, F.; Zisserman, A.; Krizhevsky, A.; Sutskever, I.; et al. NetVLAD: CNN architecture for weakly supervised place recognition. In Proceedings of the IEEE Conference on Computer Vision and Pattern Recognition, Las Vegas, NV, USA, 27–30 June 2016; pp. 5297–5307. [Google Scholar]
  41. Kükenbrink, D.; Marty, M.; Bösch, R.; Brun, P.; Waser, L.T. Benchmarking laser scanning and terrestrial photogrammetry to extract forest inventory parameters in a complex temperate forest. Int. J. Appl. Earth Obs. Geoinf. 2022, 113, 102999. [Google Scholar] [CrossRef]
  42. Ioli, F.; Morelli, L.; Pinto, L.; Remondino, F. Deep-Image-Matching: An open-source toolbox for multi-view image matching of complex geomorphological scenarios. In Proceedings of the European Geosciences Union General Assembly 2024 (EGU24), Vienna, Austria, 14–19 April 2024; p. 16412. [Google Scholar]
  43. Lin, J.; Bolding, M.C.; Conrad, J., IV; Peduzzi, A.; Lu, G. 3D wood reconstruction and volume estimation for determining log truck payloads using consumer-grade cameras. Smart Agric. Technol. 2026, 10, 102142. [Google Scholar]
  44. Ravaglia, J.; Hétroy-Wheeler, F.; Herrault, P.-A.; Wheeler, P.M. A 3D data processing pipeline to automatically estimate tree dendrometric parameters from a single mobile phone video. Ecol. Inform. 2025, 93, 103552. [Google Scholar] [CrossRef]
  45. Hristova, H.; Blattert, C.; Condrea, B.; Nita, M.; Florea, S.; Kushwaha, S.K.P.; Schweier, J. Enhancing forest inventory via a videogrammetry approach for robust 3D reconstruction: A study using Insta 360 Pro 2. Ecol. Inform. 2025, 91, 103398. [Google Scholar] [CrossRef]
  46. Usenko, D.; Helman, D.; Giladi, C. Using 3D reconstruction from image motion to predict total leaf area in dwarf tomato plants. Comput. Electron. Agric. 2025, 237, 110627. [Google Scholar] [CrossRef]
  47. Ghasemi, M.; Latifi, H.; Iranmanesh, Y. Geometry-based point cloud fusion of dual-layer UAV photogrammetry and a modified unsupervised generative adversarial network for 3D tree reconstruction in semi-arid forests. Comput. Electron. Agric. 2025, 239, 111024. [Google Scholar] [CrossRef]
  48. Sun, J.; Shen, Z.; Wang, Y.; Bao, H.; Zhou, X. LoFTR: Detector-free local feature matching with transformers. In Proceedings of the IEEE/CVF Conference on Computer Vision and Pattern Recognition (CVPR), Virtual, 19–25 June 2021; pp. 8922–8931. [Google Scholar]
  49. Wang, S.; Leroy, V.; Cabon, Y.; Revaud, J.; Weinzaepfel, P. DUSt3R: Geometric 3D Vision Made Easy. In Proceedings of the IEEE/CVF Conference on Computer Vision and Pattern Recognition (CVPR), Seattle, WA, USA, 17–21 June 2024; pp. 20697–20709. [Google Scholar]
  50. Wang, J.; Chen, M.; Karaev, N.; Shekhovtsov, I.; Laina, I.; Vedaldi, A.; Rupprecht, C.; Arandjelović, R.; Novotny, D.; Graham, B.; et al. VGGT: Visual Geometry Grounded Transformer. In Proceedings of the IEEE/CVF Conference on Computer Vision and Pattern Recognition (CVPR), Nashville, TN, USA, 11–15 June 2025; pp. 5294–5306. [Google Scholar] [CrossRef]
Figure 1. Sample images of the two study plots.
Remotesensing 18 01681 g001
Figure 2. Framework for sparse reconstruction of forest images.
Remotesensing 18 01681 g002
Figure 3. Comparison of feature point extraction results for Plot 1 forest stand image. The extracted feature points are denoted by red dots.
Remotesensing 18 01681 g003
Figure 4. Comparison of feature point extraction results for Plot 2 image. The extracted feature points are denoted by red dots.
Remotesensing 18 01681 g004
Figure 5. Comparison of plot 1 forest stand image feature matching results. Incorrect matches are indicated by red lines, while correct matches are represented by yellow lines.
Remotesensing 18 01681 g005
Figure 6. Comparison of plot 2 stand image feature matching results. Incorrect matches are indicated by red lines, while correct matches are represented by yellow lines.
Remotesensing 18 01681 g006
Figure 7. Comparison of sparse reconstruction results for Plot 1. The right column shows the zoomed-out region. Note the spatial distribution of camera poses (red pyramid frustums), and the reconstructed 3D points which vary in density among different results.
Remotesensing 18 01681 g007
Figure 8. Comparison of sparse reconstruction results for Plot 2. The right column shows the zoomed-out region. Note the spatial distribution of camera poses (red pyramid frustums), and the reconstructed 3D points which vary in density among different results.
Remotesensing 18 01681 g008
Figure 9. Plot 1 dense reconstruction results comparison. The right column shows the zoomed-out region.
Remotesensing 18 01681 g009
Figure 10. Plot 2 dense reconstruction results comparison. The right column shows the zoomed-out region.
Remotesensing 18 01681 g010
Table 1. Detailed information on the study plots.
Plot NameComplexityDominant Tree SpeciesNumber of TreesTree Height Range (m)DBH Range (cm)
Plot 1SimplePalm345.3–1327–41
Plot 2ComplexSpruce904.32–40.67–69
Table 2. Image dataset information for two forest plots.
SiteImage NumberImage Resolution
Plot 12551980 × 1080
Plot 26084000 × 3000
Table 3. Evaluation metrics for the extraction of image feature points from Plot 1.
MethodFeature CountCoverage
SIFT9307.21%
ALIKED868364.68%
Ours13,25967.48%
Note: Bold numbers represent the best-performing metrics. The same applies to the tables below.
Table 4. Evaluation metrics for feature point extraction from Plot 2 forest plot images.
MethodFeature CountCoverage
SIFT962647.32%
ALIKED10,63271.31%
Ours20,14781.19%
Table 5. Evaluation metrics for the matching of Plot 1 forest stand image features.
MethodANAINAP
SIFT42518543.53%
ALIKED + LightGlue5668422374.37%
Ours7624631882.87%
AN: the average number of matched point pairs; AIN: average number of inliers; AP: average precision.
Table 6. Evaluation metrics for the matching of Plot 2 forest stand image features.
MethodANAINAP
SIFT3877174845.09%
ALIKED + LightGlue4552309367.90%
Ours7300525672.00%
AN: the average number of matched point pairs; AIN: average number of inliers; AP: average precision.
Table 7. Evaluation metrics for the sparse reconstruction of Plot 1 images. These metrics were derived from the original algorithms and from their variants that applied image pyramids and/or neighborhood constraints (Our method applied both).
MetricsSIFTSIFT ALIKED + LightGlueALIKED * + LightGlueOurs
Image registration ratio255/255255/255255/255255/255255/255
Number of points107,71983,845288,393351,024344,237
Average tracking length4.6964.63565.4406.1776.015
Total observed 3D points505,820388,6721,568,8922,168,1562,070,653
Mean Observations per Image1983.611524.261528502.578120.21
Mean Reprojection Error (pixels)1.0021.0011.2951.3271.312
Number of Matching Image-pairs32,385126532,38532,3851265
Total time for image matching (minutes)7.60.3677810
Note: Methods marked with an asterisk (*) have undergone feature enhancement via an image pyramid, while those marked with the infinity symbol (∞) have passed the constraint-matching process using neighborhood constraints.
Table 8. Evaluation metrics for the sparse reconstruction of Plot 2 images. These metrics were derived from the original algorithms and from their variants that applied image pyramids and/or neighborhood constraints (Our method applied both).
MetricsSIFTSIFT ALIKED + LightGlueALIKED * + LightGlueOurs
Image registration ratio284/608302/608411/608608/608608/608
Number of points108,430105,037537,633829,831817,591
Average tracking length4.2854.401746.7248.0628.116
Total observed 3D points464,64346234636150936,690,0026,635,682
Mean Observations per Image1636.071530.958795.8511,003.310,914
Mean Reprojection Error (pixels)1.0550.6999761.1481.1931.170
Number of Matching Image-pairs184,5286025184,528184,5286025
Total time for image matching (minutes)22.40.7438445640
Note: Methods marked with an asterisk (*) have undergone feature enhancement via an image pyramid, while those marked with the infinity symbol (∞) have passed the constraint-matching process using neighborhood constraints.
Disclaimer/Publisher’s Note: The statements, opinions and data contained in all publications are solely those of the individual author(s) and contributor(s) and not of MDPI and/or the editor(s). MDPI and/or the editor(s) disclaim responsibility for any injury to people or property resulting from any ideas, methods, instructions or products referred to in the content.