Article

Model of Randomly Oriented Spheroids for the Retrieval of Non-Spherical Particle Microphysical Parameters from 3β + 2α + 3δ Lidar Measurements, Part 1: Structure and Analysis of the Information Content of a Central Spheroid Look-Up Table


1
Prokhorov General Physics Institute of the Russian Academy of Sciences, 119991 Moscow, Russia
2
School of Remote Sensing and Information Engineering, Wuhan University, Wuhan 430072, China
*
Author to whom correspondence should be addressed.
Remote Sens. 2026, 18(10), 1595; https://doi.org/10.3390/rs18101595
Submission received: 23 March 2026 / Revised: 4 May 2026 / Accepted: 8 May 2026 / Published: 16 May 2026

Highlights

What are the main findings?
  • Spheroid reference look-up table (RLUT) that contains 64,032 entries of synthetic optical data, i.e., extinction (α), scatter (ζ), total backscatter (β) and cross-polarized backscatter (β) coefficients at wavelengths λ = 355, 532 and 1064 nm is developed. The synthetic optical data are calculated based on a model of randomly oriented spheroids (described by different complex refractive indices) and volume particle size distributions (described by lognormal function for different mean radii and mode widths).
  • Synthetic particle linear depolarization ratios (δ) at 355, 532 and 1064 nm from the RLUT contain significant information about particle size and the particle size distributions (PSDs) themselves. In particular, the δ(λ) spectrum is a function that monotonically decreases (increases) with wavelength in case of fine (coarse) mode particles and it is a function that is shaped convex-downwards (convex-upwards) in the case of a bimodal PSD (submicron mode particles that are intermediate between the fine mode and the coarse mode).
What are the implications of the main findings?
  • The unique feature of the interdependency between cross-polarized backscatter-related Ångström exponents ( β ˙ ) at the wavelength pairs 532/1064 nm and 355/532 nm is a hysteresis, i.e., it shows a cycloid-like behavior in the interdependency, which means that the size of the non-spherical particles changes.
  • In the next part of this research work the spheroid RLUT will be involved in the development of the retrieval algorithm that can be used for the inversion of 3β + 2α + 3δ lidar data into particle microphysical parameters.

Abstract

We developed a reference look-up table (RLUT) of particles of spheroidal shape. This RLUT will be used in our lidar-data inversion algorithm we have developed in the past 25 years for the retrieval of microphysical parameters of non-spherical particles from 3β + 2α + 3δ optical datasets measured with Raman/HSRL lidar. The optical datasets are described by particle backscatter coefficients (β) at three wavelengths λ = 355, 532, and 1064 nm, particle extinction coefficients (α) at two wavelengths λ = 355 and 532 nm, and particle linear depolarization ratios (PLDRs, δ) at three wavelengths λ = 355, 532, and 1064 nm. The RLUT contains 64,032 synthetic 3β + 2α + 3δ—datasets calculated on the basis of a light-scattering model of randomly oriented spheroids and spheroid particle size distributions described by different particle complex refractive indices (CRIs) and lognormal functions with different Gauss parameters such as mean radius (μ) and standard deviation (σ). We investigate major features of the RLUT such as information content encoded in the 3β + 2α + 3δ datasets, conditionality, determinacy and the sensitivity of the retrievals to the underlying measurement errors. We find that major features of the sphere and spheroid RLUTs are similar; however, extra information is encoded in the PLDRs. The PLDR spectrum on the domain λ ∈ [355; 1064] μm contains significant information about the size of spheroid particles. The analysis of the information content is more productive if we use the cross-polarized backscatter-related Ångström exponent (CrPBAE) at the wavelength pairs 355 and 532 nm [ β ˙ (355/532)] and the wavelength pairs 532 and 1064 nm [ β ˙ (532/1064)]. In particular, the cycloid-like behavior of the interdependency β ˙ (355/532) versus β ˙ (532/1064), i.e., hysteresis, means that non-spherical particle size changes.

1. Introduction

Atmospheric aerosols play an important role in many atmospheric processes [1]. Information about aerosol optical and microphysical properties is necessary for the better understanding of the processes. Collecting information on aerosol properties is a complicated scientific task and to solve this task it requires the use of state-of-the-art measurement techniques. At present the techniques based on the application of remote sensing tools press forward [2,3]. These tools allow both for passive, e.g., sun photometer [4] and active, i.e., lidar [5] measurements of aerosol optical properties. For instance, High Spectral Resolution Lidars (HSRLs) can measure the particle backscatter coefficient (β) at three wavelengths λ = 355, 532, and 1064 nm, the particle extinction coefficient (α) at two wavelengths λ = 355 and 532 nm, and the particle linear depolarization ratio (δ) at three wavelengths λ = 355, 532, and 1064 nm, which we denote as 3β + 2α + 3δ optical dataset [6].
In turn, the optical properties are considered as input for evaluation of aerosol microphysical characteristics such as particle size distribution (PSD) and complex refractive index (CRI). These characteristics allow for estimating effective radius, number, surface-area, and volume concentrations, and single scattering albedo (SSA), etc. The inversion of optical properties to microphysical parameters is an ill-posed mathematical problem [7]. One of the stages to solve this mathematical problem is to use a light scattering model that describes the relationship between aerosol optical and microphysical characteristics. In the framework of this development stage important features such as (a) information content that is encoded in the measurements, and (b) conditionality, determinacy and sensitivity of the ill-posed problem to the measurement errors are studied based on the applied light-scattering model.
In the case of spherical aerosol particles, the well-known Lorenz–Mie theory describes the light-scattering model [8] in an analytical fashion. This theory is the most developed light-scattering model. It is well studied and widely used in many applications related to remote sensing measurements [9,10]. The model features were studied by [11,12,13,14,15,16] in the case of 3β + 2α data taken with lidar. Results derived in these studies show the following features of the sphere-based light-scattering model:
(a)
Only the combination of backscatter and extinction coefficients allows for extracting robust information about particle microphysical parameters (PMPs).
(b)
The number of independent pieces of measured information does not exceed five or are not more than five even if the measurement errors are higher than 10%.
(c)
The highest accuracy of PMP retrieval is achieved for particles that are optically the most active ones in the available remote sounding wavelength range λ ∈ [355; 1064] μm. For example, the extinction-related Ångström exponent α ˙ (EAE) of these optically most active particles at the pair of wavelengths 355 and 532 nm fulfills the condition 0.2 < α ˙ < 2.0.
(d)
Strong correlations exist between the surface-area concentration of the investigated PSDs and the particle extinction coefficient at 355 nm, the effective radius of the PSDs and the EAE, and the SSA at 532 nm and the backscatter-related Ångström exponent (BAE; defined for the wavelengths pairs 355 and 532 nm). Therefore, the simultaneous profile retrieval that uses 3β + 2α data of the whole column and constraints on the correlations between height bins of the profiles improves the information content compared to the separate, height-by-height retrieval.
(e)
The principle of polydisperse particle optical invariance (PPPOI) holds true. The principle helps us to understand why the solution to the ill-posed problem is not unique, see [7] for example. The PPPOI can be formulated as follows: the same 3β + 2α dataset can be simultaneously reproduced by
-
smaller particles, and a larger number concentration and CRI of the investigated PSDs, as well as
-
larger particles, and a smaller number concentration and CRI of the investigated PSDs.
One specific property of spherical particles is that they do not cause depolarization of the impinging polarized laser light, i.e., δ(λ) = 0. However, lidar measurements demonstrate in many practical applications that δ(λ) > 0. Such a result means that particle shape is not spherical and therefore a sphere-based light-scattering model, such as the one described by the Lorenz–Mie theory does not properly work for solving ill-posed mathematical problems like the one considered in our study.
We thus need to work with a light-scattering model that allows us to consider non-spherical particle shape. In this regard, a spheroid is the simplest geometrical shape for describing a particle that is not a perfect sphere. Spheroids can be used for the approximation of the light-scattering properties of particles of non-spherical shape. In our study we will use the light scattering model of randomly oriented spheroids developed by Dubovik et al. [17]. The model was used in different studies in the framework of passive remote sensing by sensors aboard satellites and sun photometers as well as lidar observations of atmospheric aerosol particles [18,19,20]. The results obtained from these lidar measurements are reasonable and agree with results obtained from in situ observations of aerosol particles and passive remote sensing.
However, challenges in the use of the spheroid-based light-scattering models lead to significant limitations of their applicability. Firstly, we know from experiments that the PLDR across the wavelength range λ ∈ [355; 1064] μm contains significant information about particle size [21,22]. In particular, the PLDR is a function that monotonically increases with wavelength for large particles whereas the PLDR of small particles monotonically decreases with wavelength. At this moment we are not aware of a study that investigates features of the spheroid-based light-scattering model in the context of the following questions: What information is encoded in 3β + 2α + 3δ datasets? To the best of our knowledge there exists no study that explains how far the features of spheroid particles accurately reflect the a priori information. Inversion of a 3β + 2α + 3δ dataset fails and hence the solution of the ill-posed problem is not consistent with the a priori information and results obtained from in situ and passive measurements. More details about results retrieved from 3β + 2α + datasets can be found in ref. [23]. Therefore, we do not understand at what point one or more of the following problems arises:
-
computational accuracy of the T-matrix method [24] or the approximate geometric optics integral equation method [25] that has been used by Dubovik et al. [17] for the development of the spheroid-based model in backward direction;
-
complex morphology of highly irregular particles that cannot be properly approximated by randomly oriented spheroids [26];
-
retrieval algorithms themselves that use the spheroid-based model;
-
quality of the PLDR measurements with lidar.
This contribution serves as introduction to two more contributions which aim at validating the results obtained with the spheroid-based particle light-scattering model. In this first part we develop a spheroid reference (etalon) look-up table (RLUT) and investigate its major features. In the next, second part we develop the retrieval algorithm that uses both the RLUT of spheroid particles and the RLUT of spheres. In the third part we carry out two case studies in which HSRL 3β + 2α + 3δ measurements are available together with results on particles obtained from in situ observations.
In Section 2 we describe the methodology of the development of the spheroid RLUT. In Section 3 we investigate the major features of the spheroid RLUT. In Section 4 we discuss the results obtained with the spheroid RLUT. Section 5 summarizes the results we found in part 1 of our trilogy.

2. Methodology

In our study we use the spheroid-based particle model to mimic optical and microphysical properties of particles of non-spherical shape (N) [19]. The model is described by an ensemble of polydisperse, randomly oriented spheroids. The aspect-ratio distribution of the ensemble is size independent, uniform and is described by a fixed function in the dimensionless range (1.44; 3.0). Particle extinction (g = α), particle scatter (g = ζ) and total particle backscatter (g = β) cross-sections per particle volume, i.e., KgN, for the spheroid-based model were developed by Dubovik et al. [17]. Optical characteristics of such an ensemble of polydisperse, randomly oriented spheroids such as extinction (α), scatter (ζ), total backscatter (β) and cross-polarized backscatter (β) coefficients are related to the volume particle size distribution (PSD) dv(r)/dlnr via integral equations
g ( λ ) = 0 K g N ( λ , m , r ) d v ( r ) d ln r d ln r
where λ, m = mRimI and r denote the wavelength, particle complex refractive index (CRI) and radius of a sphere of volume that is equivalent to the spheroid, respectively.
Another important optical characteristic of non-spherical particles is the particle linear depolarization ratio (PLDR)
δ λ = β ( λ ) β ( λ ) β ( λ )
For the description of the volume PSD we use a lognormal function LN(µ,σ,r) with Gauss mean radius (μ) and standard deviation (σ) so that
d v ( r ) d l n r = 4 3 π n r 4 L N μ , σ , r ,
where
L N ( μ , σ , r ) = 1 2 π 1 / 2 r ln σ exp ( ln r ln μ ) 2 2 ln σ 2
Here n is the particle number concentration in cm−3. The spheroid cross-sections KgN are defined on the radius domain r ∈ [rmin; rmax] = [0.03; 25] μm. Any pair of the Gauss parameters (μ, σ) allows us to define arbitrary monomodal PSDs on the radius domain. We use 13 values of σ in the interval [1.35; 2.55] with stepsize 0.1 and 20 values of μ in the interval [0.055; 3.845] μm. The μ-values are described by the geometric sequence with ratio 1.25 which thus restricts the number of possible combinations. Another restriction we use for the Gauss parameters is given by the following inequalities
d v ( r m i n ) d l n r [ d v μ v d l n r ] 1 < 10 3 ,             d v ( r m a x ) d l n r [ d v μ v d l n r ] 1 < 10 3
where μv is the particle mean radius in terms of the volume PSD. The conditions in (5) ensure that the volume PSD (3) is fully included within in domain [rmin; rmax]. Table 1 summarizes the Gauss parameters that fulfil these conditions and the respective effective radius which is equal to
r eff = μ exp ( 2.5 ln 2 σ )
As we can see from the table the effective radius varies between approximately 0.07 and 5 μm. The total number of monomodal PSDs is 174 in view of the conditions (5).
Particle optical properties depend on CRI, too. The spheroid cross-sections are defined on the domains
mR ∈ [1.325; 1.69]    mI ∈ [i0.0005; i0.1]
We obtain 16 different values of the real part on the respective domain for a stepsize of 0.025. In the case of the imaginary part, we obtain 23 different values. In this case the stepsizes are i0.0025 for mI < i0.01 and i0.005 for mIi0.01.
Thus, we can compute on basis of Equation (1) 174 × 16 × 23 = 64,032 different datasets (or records in terms of the databases) of optical coefficients α, ζ, β, β at λ = 355, 532 and 1064 nm and save them in the spheroid reference look-up table (RLUT). We also include the particle microphysical parameters (PMPs) in each of these datasets and save them to the RLUT. The PMPs are described by mean and effective radii (μ and reff), standard deviation (σ), surface-area concentration
s = 0 3 r d v ( r ) d ln r d ln r = 4 π n μ 2 exp ( 2 ln 2 σ )
and volume concentration
v = 0 d v ( r ) d ln r d ln r = 4 3 π n μ 3 exp ( 4.5 ln 2 σ )
and their real (mR) and imaginary (mI) parts of the CRI. The number concentration for all the datasets is equal to n = 1 cm−3.
We need to stress that the RLUT permits us to study the properties of the particles in terms of the number of modes of the investigated PSDs. A bimodal PSD can be created by taking the sum of two PSDs from the RLUT, where for example one PSD has an reff that is equal to 0.1 μm (fine mode) and the other one has an effective radius of 1 μm (coarse mode) μm. The strength (contribution or intensity) of the fine and coarse mode can be defined by their respective number concentrations. In the next section we investigate the optico-microphysical properties of the particles that are described by the spheroid-based model and stored in the RLUT.

3. Analysis of the Spheroid Reference Look-Up Table

Particle optical properties measured by lidar are expressed by Equations (1) and (2). These equations yield the intensive parameters (IP) independent on number concentration. IPs are useful for the characterization of particles of different types at available measurement wavelength λi or pair of wavelengths λi and λi+1 such as lidar ratios (extinction-to-backscatter ratios; Λ), and extinction-( α ˙ ) and backscatter-( β ˙ ) related Ångström exponents (EAE and BAE). We can write these parameters as
Λ ( λ ) = α ( λ i ) / β ( λ i )               i = 1 ,   2 α ˙ = α ˙ ( λ i / λ i + 1 ) = ln [ α ( λ i + 1 ) / α ( λ i ) ] ln 1 ( λ i / λ i + 1 )               i = 1 β ˙ ( λ i / λ i + 1 ) = ln [ β ( λ i + 1 ) / β ( λ i ) ] ln 1 ( λ i / λ i + 1 )               i = 1 ,   2
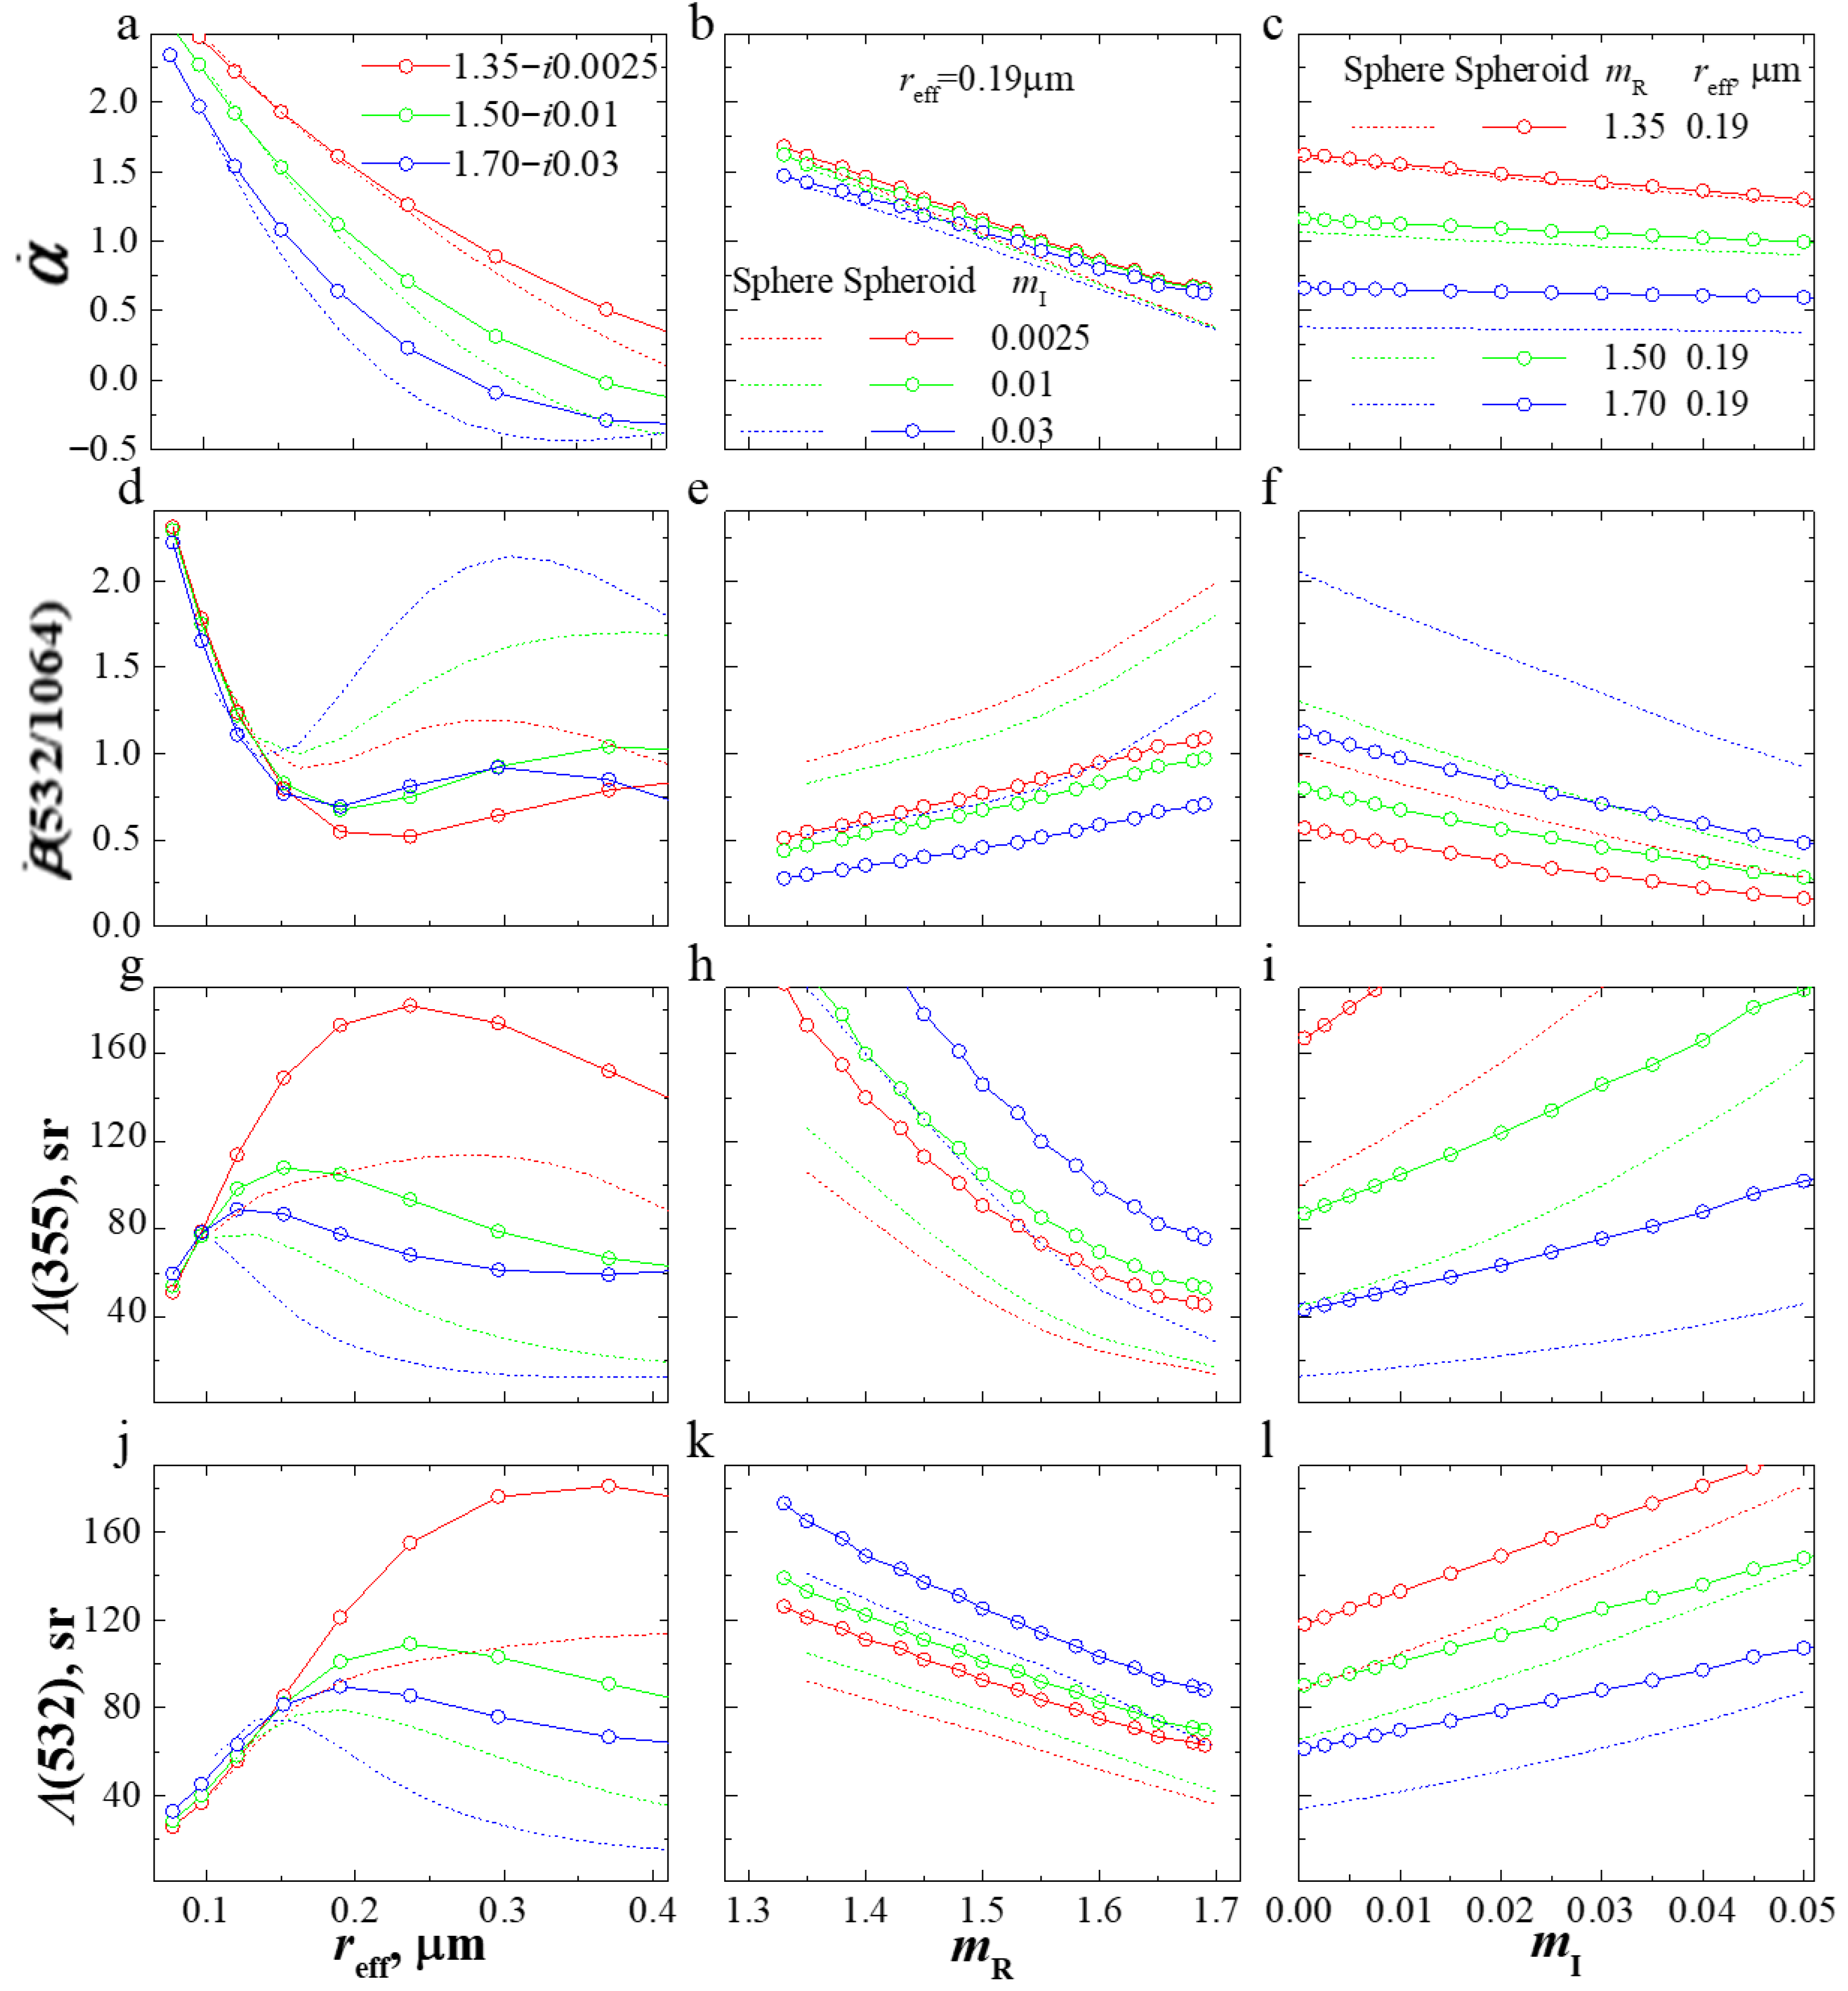
In the first step of our research work we investigate the dependence of the IPs on effective radius and CRI of the fine mode particles of PSDs on the basis of the database entries in the spheroid RLUT (see solid curves in Figure 1). In order to simplify the analysis of this multi-parametric space we consider three scenarios
(1)
The mean/effective radius changes for fixed σ in the case of low (m = 1.35 − i0.0025, red), moderately (m = 1.50 − i0.01, green) and strongly (m = 1.69 − i0.03, blue) light-absorbing particles (left panel);
(2)
The CRI real part changes for fixed effective radius [μ(reff) = 0.135 (0.19) μm and σ = 1.45] in the case of low (mI = i0.0025, red), moderately (mI = i0.01, green) and strongly (mI = i0.03, blue) light-absorbing particles (middle panel);
(3)
The CRI imaginary part changes for fixed effective radius [μ(reff) = 0.135 (0.19) μm and σ = 1.45] in the case of low (mR = 1.35, red), moderate (mR = 1.50, green) and high (mR = 1.70, blue) real parts (right panel).
The EAE is mainly sensitive to particle size (see Figure 1a), weakly sensitive to the CRI imaginary part (see Figure 1c) and moderately sensitive to the CRI real part (see Figure 1b). The EAE monotonically decreases from a maximum value of 2.5 to a minimum value of 0 or even slightly negative values if we increase effective radius from 0.08 to 0.40 μm. The monotonous decrease in the EAE versus the real part of the CRI does not exceed 0.7 for the low, moderately and highly light-absorbing particles on the domain mR ∈ [1.325; 1.7]. The decrease in the EAE versus the imaginary part of the CRI on the domain mI ∈ [i0.00; i0.05] is even less and does not exceed 0.25.
The BAE at the wavelength pair 532 and 1064 nm is sensitive to both particle size and CRI (see Figure 1d–f). Moreover, in contrast to the EAE the β ˙ (532/1064).
-
may both decrease and increase with reff,
-
monotonically increases with mR and
-
is more sensitive to mI.
The LRs as well as the BAE are sensitive to particle size and CRI (see Figure 1d–l). The dependence of the LRs and BAEs distinguishes these two parameters. The LRs versus the CRI real parts exhibit monotonically decreasing functions whereas the LRs versus the CRI imaginary parts are monotonically increasing functions. Unfortunately, fine mode particles show LRs from values as low as 10 sr to values as large as 200 sr. Simultaneously, particles of one and the same effective radii can be described by similar LRs. Thus, particle sizes cannot be distinguished if only LRs are used. We note two points:
(1)
We only consider in this analysis the values obtained from our RLUTs and not results from actual lidar observations of atmospheric particles where values usually remain between approximately 20 sr and 100 sr at ultraviolet and visible measurement wavelengths.
(2)
Lower and higher lidar ratios have been reported for some aerosol types [27].
Results for the BAE at the wavelength pair 355 and 532 nm can be directly derived on the basis of the EAE and LRs with the equation:
β ˙ 355 532 = l n Λ ( 355 ) Λ ( 532 ) l n 355 532 + α ˙
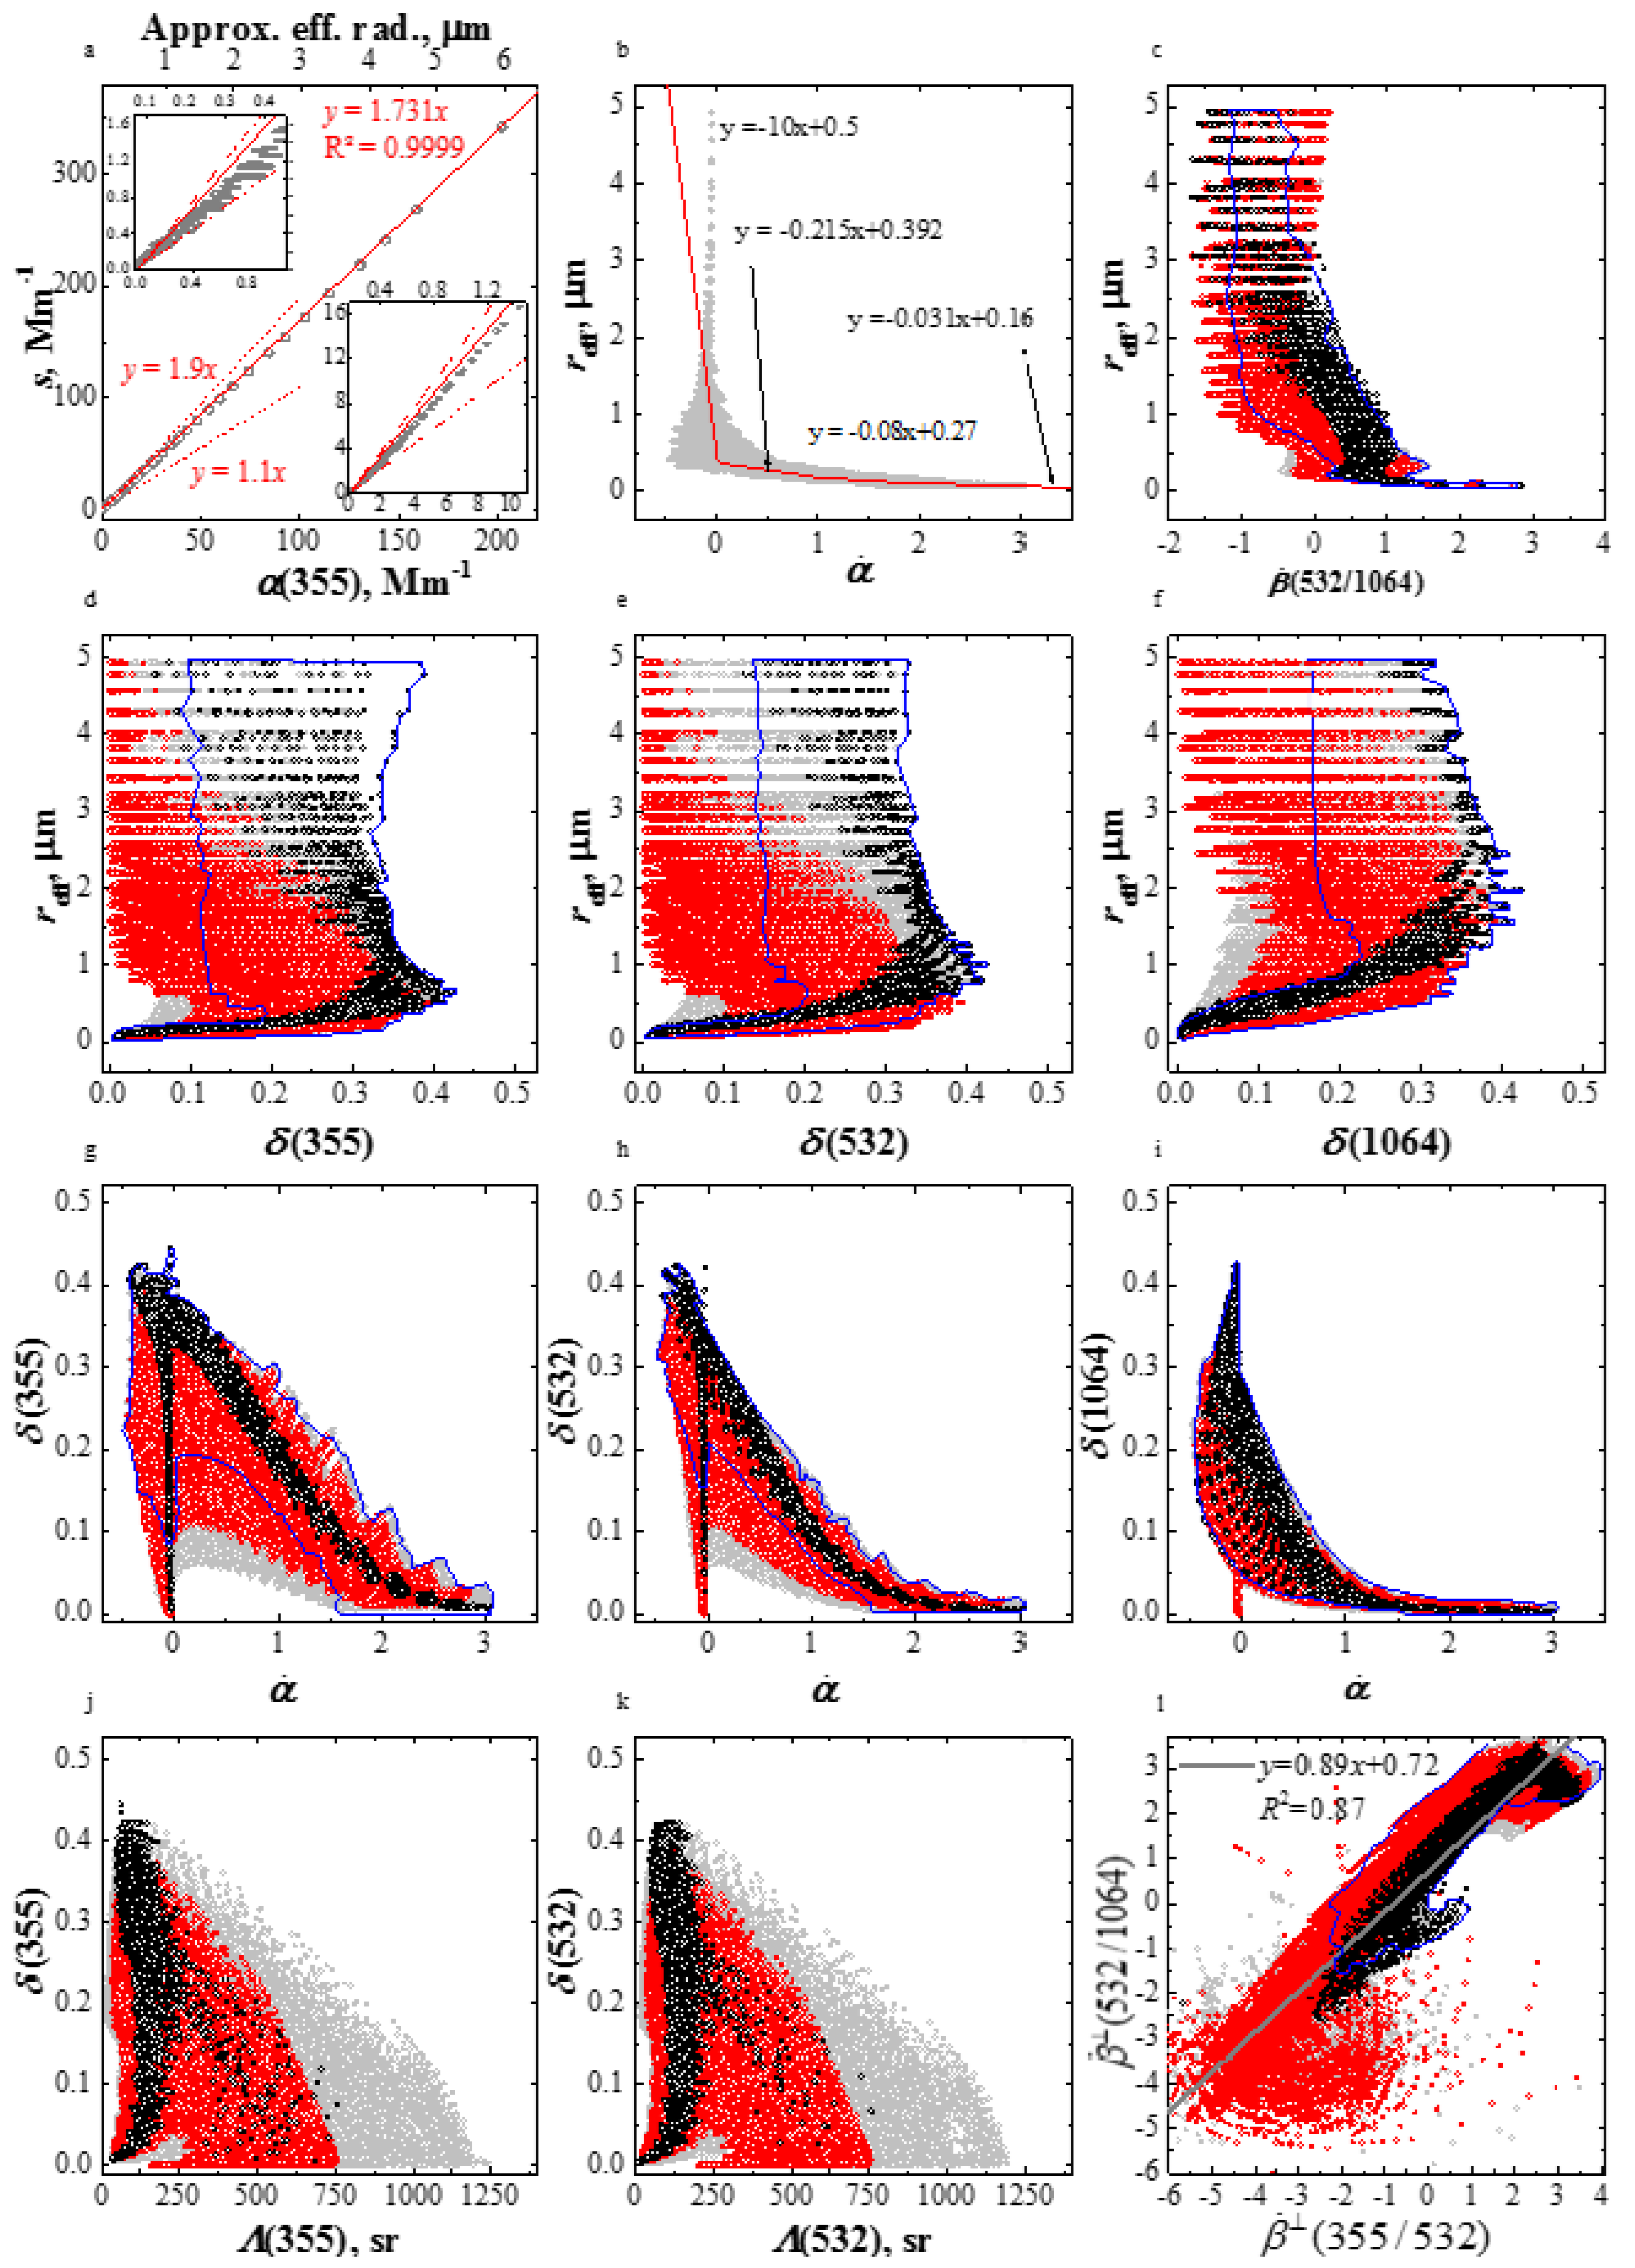
In the next step we investigate one of the “big pictures”, i.e., the structure of the spheroid RLUT for specific parameters. Figure 2a shows the statistics of surface-area concentration versus extinction coefficient at 355 nm. We find a linear correlation that can be described by the regression equation y = 1.731x (red solid) and the correlation coefficient R2 = 0.9999. The inserts in Figure 2a, i.e., the boxes that zoom into the respective parts of the datasets, allow us to see the statistics for the smallest effective radii (see top axis describing approximate values of effective radius). The spread of the statistical relationship “s vs. α(355)” is limited by lines that can be described by the equations y = 1.1x (lower limit, red dotted line) and y = 1.9x (upper limit, red dot dotted line). An exception is possible for the smallest particles in our RLUT (i.e., reff < 0.1 μm). However, CCN correction limits the s-parameters of the smallest particles of the spheroid RLUT, see the red dotted lines in Figure 2a. The application of the CCN correction implies that particles larger than r > 0.05 μm are considered. In this case the lower limit of integration in Equation (8) is equal to 0.05 μm [28].
Figure 2b shows that the effective radius is nearly inversely proportional to the EAE if we consider the three intervals independent of each other, i.e., α ˙ ∈ [2; ∞), α ˙ ∈ [1; 2), and α ˙ ∈ [0.5; 1). The regression equations that describe the linear correlation (red) for each interval are shown in the legend. The spreads of the data points from the respective lines do not exceed 0.05, 0.07 and 0.08 μm respectively. For the coarse mode particles considered in our research work (reff > 1 μm) the EAE is slightly negative and converges to 0 for increasing reff.
Figure 2c shows that in contrast to the EAEs any value of the BAE (at the wavelength pair 532 and 1064 nm) of less than 1.5 results in a wide spread of the effective radius. Even for the interval (1; 2) the effective radius varies from ~0 to 1 μm. In addition, the β ˙ (532/1064) changes between −1.5 and 1.0 for coarse mode particles (reff > 1 μm). The behavior of the relationships of reff versus β ˙ (532/1064) and reff versus β ˙ (355/532) is qualitatively similar.
Figure 2d–f shows the statistics of effective radius versus the PLDRs at 355, 532 and 1064 nm. On the one hand the spheroidal particles may produce a PLDR as large as 0.4 at any of these three wavelengths. On the other hand, the PLPR may decrease to 0 in the case of highly light-absorbing particles, i.e., mR > 1.4 and mI > 0.01 (see red circles). Small particles, i.e., reff < 0.1 μm, do not produce PLDRs larger than 0.1 either. One of the specific features of the statistics is that a PLDR peak value of 0.43 at 355, 532 and 1064 nm is reached at reff = 0.6, 1 and 2 μm respectively. This feature leads to one of the fundamental principles that describes the dependence of the spectrum of the PLDR on particle size [21,22]: The function δ(λ) decreases monotonically if the particles are small (for instance, particles of the fine mode fraction of a PSD) whereas the function δ(λ) increases monotonically if the particles are large (for instance, particles of the coarse mode fraction of a PSD).
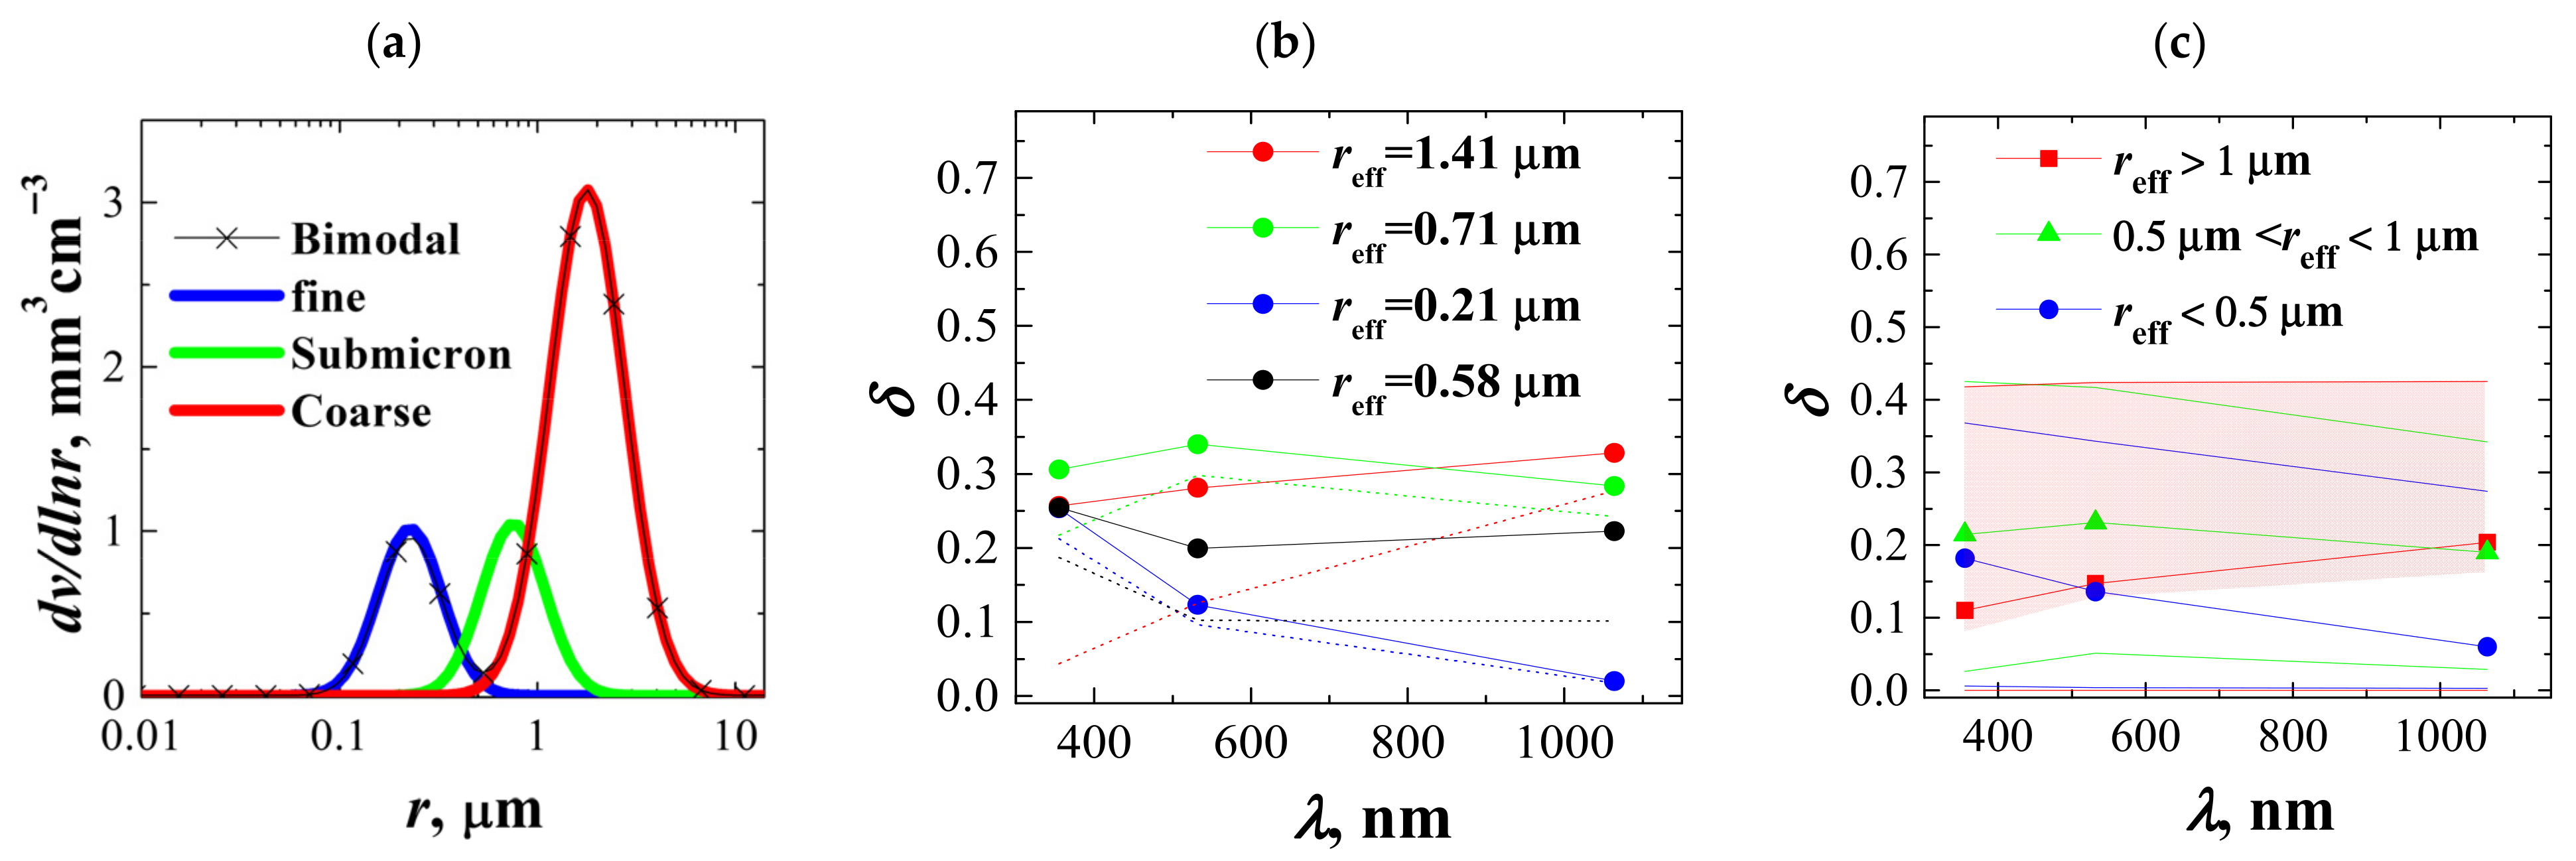
We illustrate the principle in Figure 3. This figure presents the PLDR spectra (see Figure 3b) that were found for the fine (μ = 0.15 μm, σ = 1.45), submicron, i.e., intermediate (μ = 0.5 μm, σ = 1.45) and coarse (μ = 1 μm, σ = 1.55) mode particles (see Figure 3a). The spectra were found for low (m = 1.5 − i0.005, solid) and highly (m = 1.5 − i0.05, dot) light-absorbing particles. The spectra are
-
monotonically decreasing functions for fine mode (small) particles,
-
monotonically increasing functions for coarse mode (large) particles, and
-
functions with a maximum at 532 nm for submicron particles.
The behavior of the functions versus wavelength holds true for all datasets from the spheroid RLUT. Figure 3c shows the mean (symbols) and spread (solid) of all datasets from the spheroid RLUT for small (reff < 0.1 μm, blue), submicron (reff ∈ [0.4; 1] μm, green) and large (reff > 1 μm, red) particles.
We know from the lidar measurements that the PLDR spectrum can be a function that either reaches a minimum at 532 nm or remains almost constant across the measurement wavelength range from 355 to 1064 nm [29,30,31]. Theoretically this spectral behavior is possible if we consider a superposition of the spectra (wavelength dependence) of PLDRs of the fine and coarse mode, respectively. We show this superposition effect in Figure 3. There the black curves correspond to the bimodal PSD and the ratio of the number concentrations of the fine and coarse mode particles is equal to 100.
According to Figure 3, the lidar measurements permit us to make a qualitative analysis of the non-spherical PSDs based on the spectral behavior of the measured PLDRs. However, the value of the PLDRs becomes smaller if we consider mixtures of spherical with non-spherical particles. Thus, it would be valuable to find a parameter that simultaneously is defined by the non-spherical particles only and does not depend on the contribution of spherical particles in such a particle mix.
Therefore, we investigate the properties of the cross-polarized backscatter coefficients and their respective BAEs β ˙ which we denote in the following as CrPBAE. From the theoretical point of view a larger β results in a larger δ and vice versa (see Equation (2)). Thus, the spectral behavior of β allows us to make a qualitative analysis of the size of non-spherical particles, too. Moreover, we can describe the behavior of β in terms of the magnitude of the CrPBAE. This parameter does depend on particle concentration, and we can therefore carry out a qualitative analysis of the part of a PSD that consists of non-spherical particles as follows:
(1)
The β spectrum is a function that monotonically decreases with wavelength, i.e., β ˙ (355/532) > 0 and β ˙ (532/1064) > 0, in the case of fine mode particles.
(2)
The β spectrum is a function that monotonically increases with wavelength, i.e., β ˙ (355/532) < 0 and β ˙ (532/1064) < 0, in the case of coarse mode particles.
(3)
The β spectrum is a convex upwards function, i.e., β ˙ (355/532) < 0 and β ˙ (532/1064) > 0, in the case of submicron mode particles.
(4)
The β spectrum is a convex downwards function, i.e., β ˙ (355/532) > 0 and β ˙ (532/1064) < 0, in the case of a mixture of fine and coarse mode particles, i.e., a bimodal PSD.
We investigate in detail the CrPBAEs that we obtain from the mathematical description of the spheroid particles of our RLUT. Figure 2l shows the statistics of β ˙ (532/1064) versus β ˙ (355/532). Both CrPBAEs vary between −6 and 4. Their variation significantly exceeds the variations in the EAEs and BAEs (see Figure 2b,c). However, the statistics are linearly correlated. The regression equation and correlation coefficient are y = 0.89x + 0.72 and R2 = 0.87.
We further investigate the structure of the statistics of β ˙ (532/1064) versus β ˙ (355/532). We consider three scenarios of the monomodal PSDs:
-
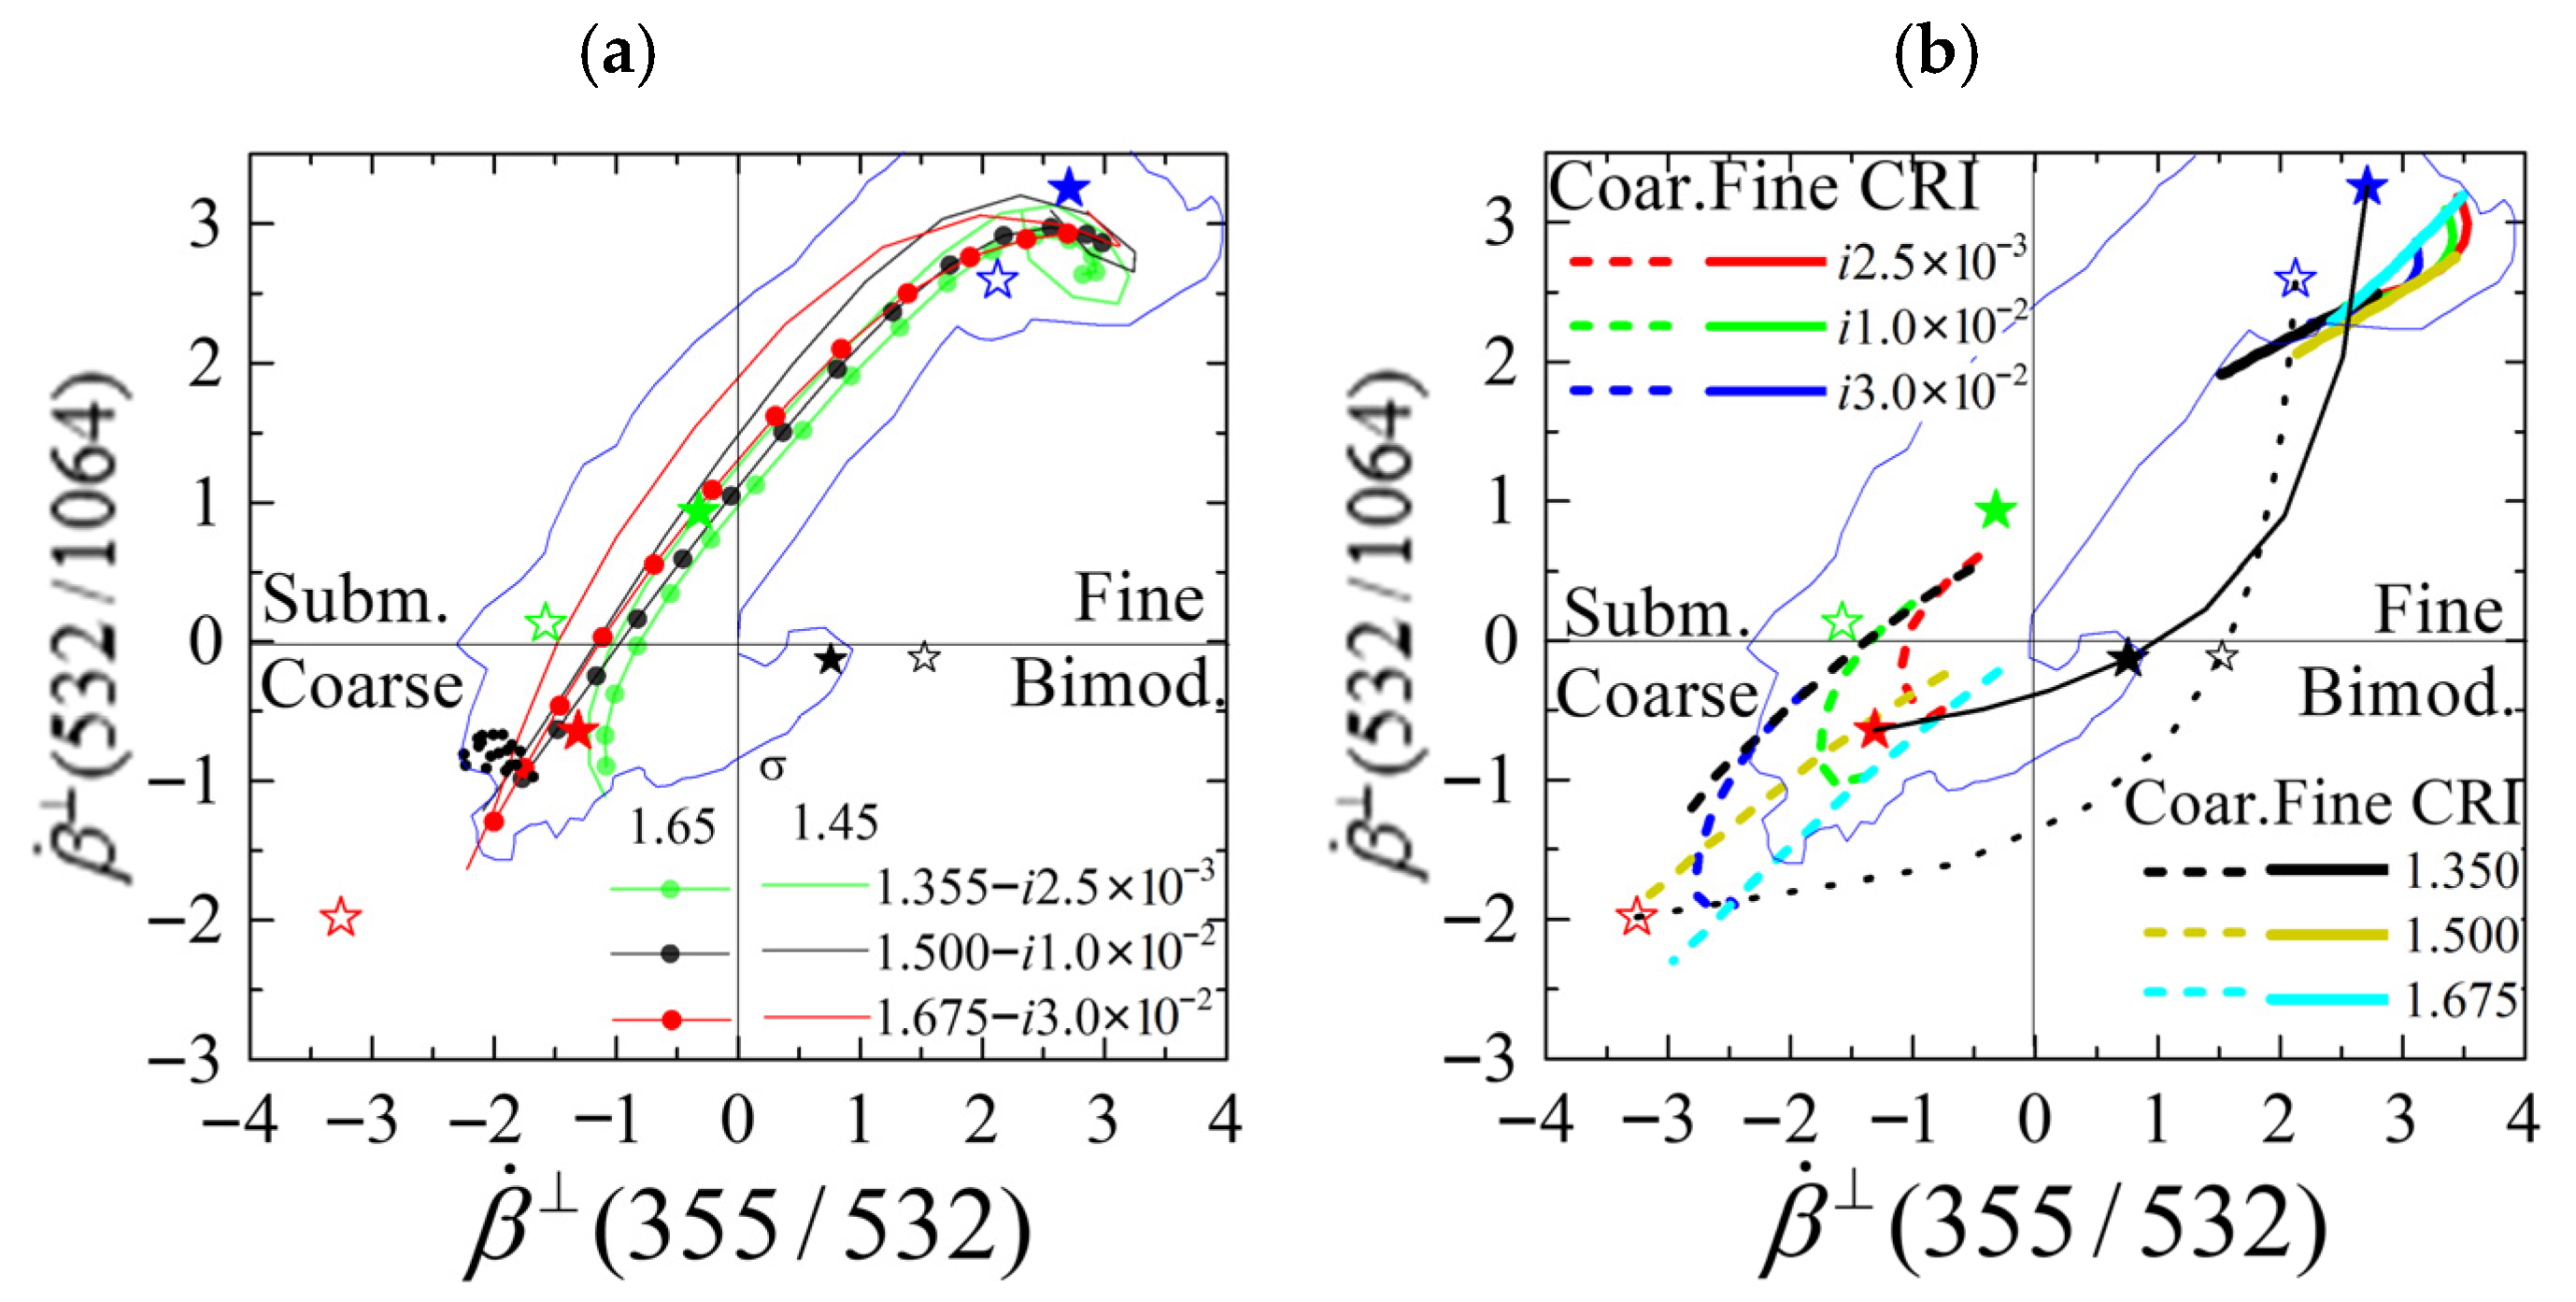
The mean radius of low (m = 1.35 − i0.0025, green), moderately (m = 1.50 − i0.01, black) and highly (m = 1.69 − i0.03, red) light-absorbing particles changes within the domain [0.055; 3.845] μm (see Figure 4a). We consider two fixed mode widths, i.e., at σ = 1.45 (solid curves without bullets) and 1.65 (solid curves with bullets);
-
The real part of the CRI changes within the domain of values given by (7) (see Figure 4b). We consider three different scenarios, i.e., low (red), moderately (green) and highly (blue) light-absorbing particles of the fine (thick solid curves) and coarse (thick dashed curves) modes, respectively;
-
The imaginary part of the CRI changes within the domain of values given by (7) (see Figure 4b). We consider three different scenarios, i.e., low (black), moderate (yellow) and high (cyan) real parts for the fine and coarse mode particles, respectively.
Moreover, we determine the interdependencies of β ˙ (532/1064) versus β ˙ (355/532) for three different types of bimodal PSDs:
(1)
Both fine and coarse modes of the PSDs consist of spheroidal particles of low light absorption capacity, i.e., m = 1.5 − i0.005. The effective radius of the fine mode is reff = 0.2 μm. The effective radius of the coarse mode is reff = 1.5 µm (see black curve in Figure 3a). The contributions, expressed in terms of parameter g, to the bimodal PSD continuously change from a minimum (i.e., 0%) to a maximum (i.e., 100%) (see thin solid black curve in Figure 4b).
(2)
As in case (1) we use PSDs again that consist of spheroidal particles in the fine and the coarse mode, but this time we consider highly light-absorbing particles, i.e., m = 1.5 − i0.05 (see black curve in Figure 3a). The contributions, expressed in terms of parameter g, to the bimodal PSD again continuously change from a minimum (i.e., 0%) to a maximum (i.e., 100%) (see dotted thin-solid black curve in Figure 4b).
(3)
The fine mode of the PSDs is represented by organic carbon (spherical) particles whereas the coarse mode is represented by dust (spheroid) particles (see part 2 of our trilogy for details). The contributions, expressed in terms of parameter g, to the bimodal PSD continuously change from a minimum (i.e., 0%) to a maximum (i.e., 100%) (see dotted black curve in Figure 4a).
We obtain the following results:
  • The sensitivity of the CrPBAEs with respect to changes in the mR is weak in the case of fine and coarse mode particles (see thick red, green and blue curves in Figure 4b). The β ˙ (355/532) variations do not exceed ±0.7 even though the mR occupies the full domain given by expression (7). We observe a similar property for the fine mode particles (see thick black, yellow and cyan curves in Figure 4b) if the mI is changed within the domain described by expression (7). For the coarse mode particles the variation in the CrPBAEs versus mI drops to ±0.7, too, if we take into account particles described by LRs less than 150 sr at 355 and 532 nm, respectively (see thin blue curve that constrains the respective datapoints in Figure 4). The value ±0.7 corresponds to a measurement error of approximately ±15% for β. Thus, lidar data with such strong uncertainties do not allow for an estimation of the CRI from the CrPBAEs and PLDRs.
  • The CrPBAEs are sensitive to changes in the reff for the three cases of low, moderately and highly light-absorbing particles. The interdependencies of β ˙ (532/1064) versus β ˙ (355/532) are linearly correlated and the correlation coefficient is comparably high. However, these interdependencies may take the shape of cycloids (hysteresis effects) which means the size of the non-spherical particles change (i.e., hysteresis effects appear for spheroid particles as the effective radius of which is changed).
  • The CrPBAEs of bimodal non-spherical PSDs are sensitive to changes in the contributions of the fine and coarse modes, respectively. This result agrees with the results we find in point 2. Reason for this agreement is that the effective radius of bimodal non-spherical PSDs is defined by the contributions of the two modes (e.g., in terms of their respective number concentrations). In contrast, the CrPBAEs do not depend on the contributions of the two modes if one of the modes contains spherical particles, as is the case for a mixture of organic carbon (fine mode) and dust particles (coarse mode) (see black dotted curve in Figure 4a). Slight variations in the CrPBAEs for such particle mixtures are the result of perturbations of 10%. This level of data perturbation was included in the synthetic data we used in our numerical simulations. Note: we will show more details about these particle mixtures and the results of the numerical simulations in one of the following parts of our trilogy of research works on this topic.
  • The [ β ˙ (532/1064), β ˙ (355/532)]-plane can be split into four sectors. The datapoints that fall into the 1st, 2nd and 3rd section are the result of the monomodal PSDs that solely consist of fine, submicron, and coarse mode particles. In contrast, datapoints in the 4th sector can be attributed to bimodal PSDs of non-spherical particles. We note that the parts of the 1st and 3rd sector adjacent to the 4th sector also contribute as there naturally exists some overlap between these three sectors. Splitting the [ β ˙ (532/1064), β ˙ (355/532)]-plane into four sectors can be useful in practical application if we want to (1) classify non-spherical particles in terms of size and (2) carry out a qualitative analysis of the lidar data in terms of the CrPBAEs.
In view of the high information content that is encoded in the CrPBAEs, i.e., in the PLDRs, with respect to particle size we analyze the statistics of the EAEs versus the PLDRs at the different wavelength pairs that can be constructed from the three lidar measurement wavelengths, i.e., 355, 532 and 1064 nm, and the use of the spheroid RLUT (see Figure 2g–i). In fact, the dependencies of α ˙ versus δ(λi) create structures in the plots that look like high-heeled shoes. We find a similar structure if we plot reff versus α ˙ . The key feature of this structure is the “heel” which in the first case can be attributed to large particles with reff > 1 μm. This “heel” disappears if we exclude the datapoints for which the LRs exceed 150 sr at any of the three wavelengths (see blue curve that restricts the data to Λ(λ) < 150 sr). If we exclude the “heel” from this analysis, because it corresponds to data with unrealistic LRs [27], the interdependency PLDR at 532 nm versus EAE becomes highly correlated (R > 0.9). This result means that the PLDR contains a significant level of information about particle size.
Figure 2j,k shows the statistics of the PLDR versus the LR at the wavelengths 355 and 532 nm. There is no correlation between the datapoints. The PLDRs and LRs vary from 0 to 0.43 and from 16 to 1200 sr, respectively, for both wavelengths. We note that approximately 55% of all datapoints in our RLUT are characterized by LRs exceeding 150 sr (at the wavelengths 355 and 532 nm). Such high values are not realistic from the point of view of lidar measurements of aerosol particles [27]. Therefore, we restrict the dataspace to datapoints that correspond to Λ(λ) < 150 sr in Figure 2 (indicated by the blue lines).
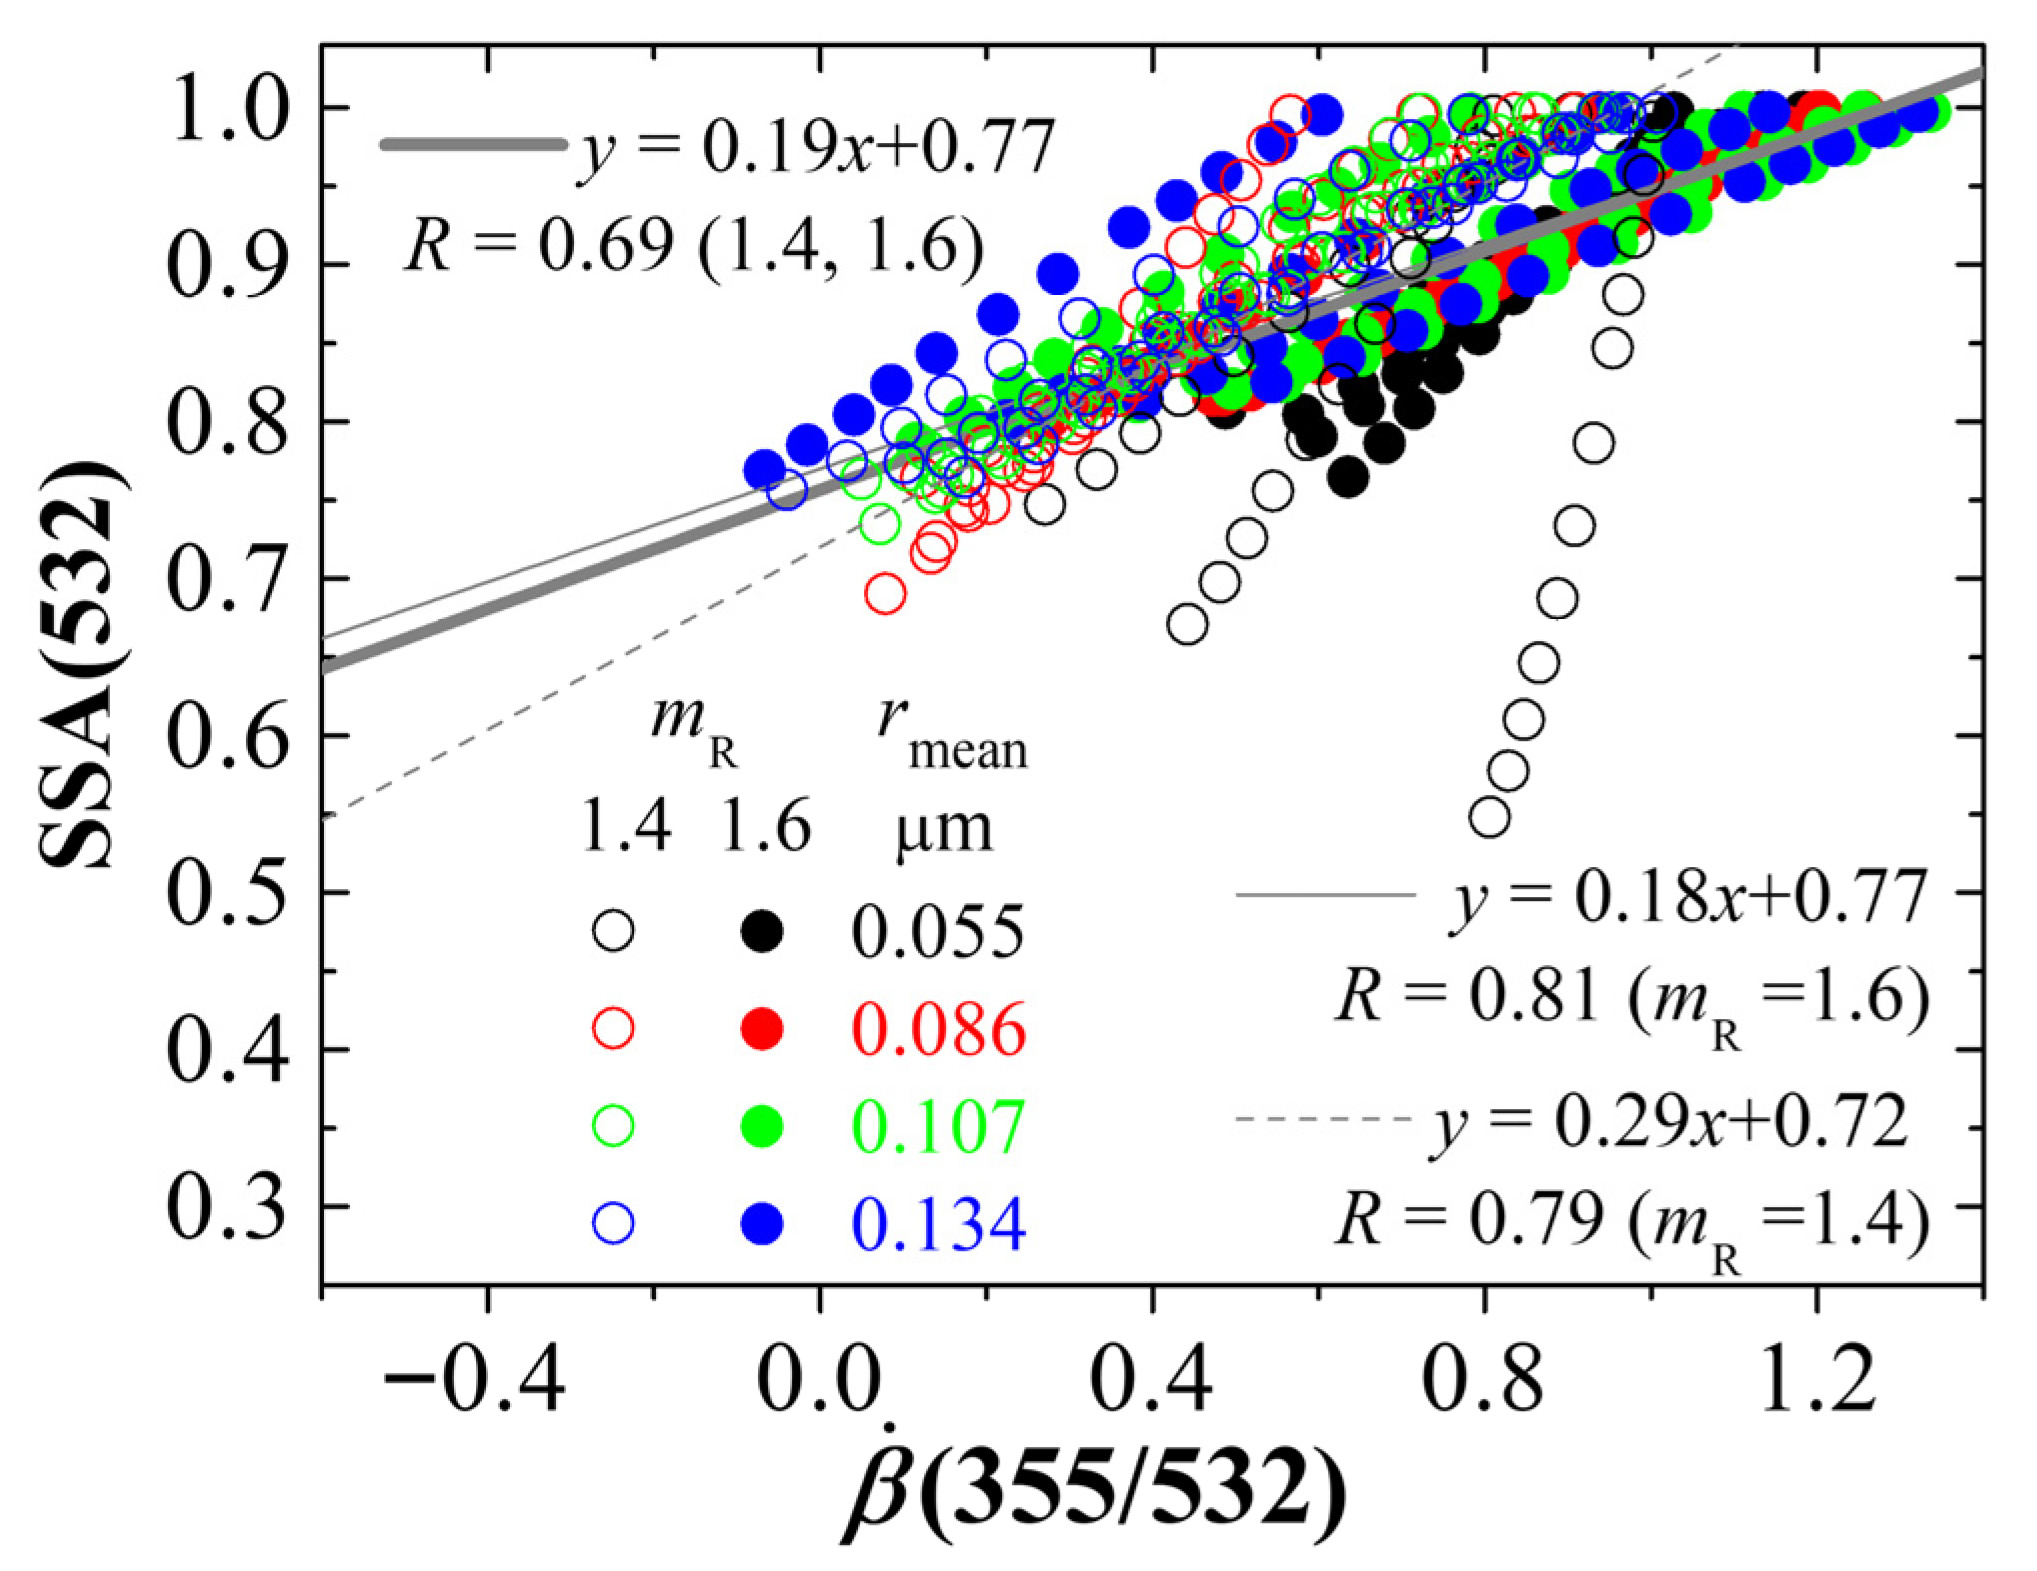
We finalize our study of the properties of the spheroid RLUT with an analysis of the statistics of the single scattering albedo (SSA = ζ/α) at 532 nm versus the BAE at the wavelength pair 355 and 532 nm (see Figure 5). In this study we consider (1) four different values of the mean radii μ = 0.055, 0.086, 0.107 and 0.134 μm of the fine mode of the investigated PSDs, and (2) two values of the CRI, i.e., real parts of mR = 1.4 and 1.6. Furthermore, we use (3) standard deviations in the domain σ ∈ [1.45; 1.95] and (4) imaginary parts in the domain mI ∈ [i0.0005; i0.05].
Figure 5 shows that both the BAEs and the SSAs depend on particle size. Hence, we find a layer structure in which each layer corresponds to a different standard deviation σ. However, the major factor that decides on the values of these parameters (BAE and SSA) is the imaginary part. Variations in the mI between 0 and 0.05 result in an interdependency between BAE and SSA. This interdependency can be described by the linear regression equation y = 0.29x + 0.72 for mR = 1.4 and y = 0.18x + 0.77 for mR = 1.6. The correlation coefficients are R = 0.81 and 0.79, respectively.

4. Discussion

Here we discuss the results obtained in our study of the spheroid RLUT and thereby also put it into context to results obtained for spherical particles from previous investigations. An analysis of sphere-based light-scattering models and respective RLUTs can be found in different studies, e.g., [12,13,14,32]. In our research we extended these studies to detailed investigations of non-spherical particles, i.e., an RLUT produced by a light-scattering model for spheroids. In the following we compare the results of these two different types of RLUTs.
Figure 1 shows results for fine mode particles (dotted curves):
  • The interdependencies “EAE versus reff, mR and mI” for spheres and spheroid particles are very similar (see the 1st row).
  • The interdependencies “LRs versus reff, mR and mI” for spheres and spheroid particles are similar but there is bias, i.e., the LRs of spheroids are larger than the LRs of volume-equivalent spheres (see the 3rd and 4th rows). This result therefore corroborates our a priori information about non-spherical particles [19].
  • The interdependencies “BAE(532/1064) versus reff, mR, and mI” are similar for spheres and spheroid particles but there is a bias, i.e., the BAEs of spheroids are lower compared to the BAEs of volume-equivalent spheres (see the 2nd row). The same result holds true for the wavelength pair 355 and 532 nm.
  • Any differences between the optical properties of spheres and spheroid particles discussed in this work disappear if the particle effective radius is less than 0.1 µm for the CRI domain defined by expression (7). Thus, another fundamental principle holds true: optical properties of such very small particles do not depend on their shape [33].
We also compare the results for spheres [14,32] and spheroid particles in the coarse-mode fraction of the PSDs. The comparison results a. and b. that we obtain for the fine mode particles also hold true for the coarse mode particles. However, the difference between the BAEs of spheres and spheroid particles in the coarse mode of PSDs disappears (see the comparison result c. for the fine mode particles).
Finally, we compare the interdependencies and the statistics of the PMPs versus the optical coefficients and the respective correlation characteristics of the investigated PSDs. The interdependencies, statistics, and correlations for spherical particles were studied in detail by Kolgotin et al. [14,15]. We find:
-
The statistics of surface-area concentration versus the extinction coefficient at 355 nm for spheres and spheroid particles and their respective correlation characteristics coincide (see Figure 1c in [14] and Figure 2a).
-
The statistics of effective radius versus EAE for spheres and spheroid particles, and the respective correlation characteristics almost coincide (see Figure 1a in [14] and Figure 2b). Moreover, the statistics collected for spheres and spheroid particles for a fixed value of the mR almost coincide, too.
-
The statistics of effective radius versus BAE for spheres and spheroid particles are similar but there is a bias, i.e., the BAEs of spheroids are lower than the BAEs of volume-equivalent spheres (see Figures 2c and 1b in [14]).
-
The interdependencies of SSA at 532 nm versus BAE at the wavelength pair at 355 and 532 nm are similar for spheres and spheroid particles (see Figure 8a in [15] and Figure 5).
This comparison analysis allows us to generalize our findings we developed for spherical particles also to spheroid particles:
  • the information content encoded in 3β + 2α data;
  • the conditionality, determinacy, and sensitivity of the ill-posed problem to the measurement errors (see points (a)–(e) in Section 1;
  • the gradient correlation method (GCM) [34];
  • the error analysis methodology of PMP retrievals [16];
  • the optical data quality assurance (ODQA) methodology [32].
Moreover, we obtain extra pieces of information for spheroids from their PLDRs which are measured at 355, 532 and 1064 nm. In view of the information content, we conclude:
  • The total number of independent pieces of measured information encoded in 3β + 2α + 3δ dataset is 8.
  • The qualitative analysis and condition of smoothness of our ODQA methodology can be updated with measurements of PLDRs thanks to the high correlation between the EAEs and PLDRs [32]. We will develop this modification of the ODQA methodology in our future studies.
  • In contrast to spherical particles, values of the β ˙ (532/1064) of less than 0.5 cannot be used for flagging the presence of coarse mode particles of non-spherical PSDs.
  • Values of the β ˙ (532/1064) of less than 0.5 can be used as a flag value of the presence of coarse mode particles of PSDs.

5. Conclusions

We have developed a spheroid RLUT that contains 64,032 entries of synthetic optical data, i.e., extinction, scatter, total backscatter and cross-polarized backscatter coefficients at 355, 532 and 1064 nm, and their respective PMPs, i.e., mean/effective radius, standard deviation and complex refractive index CRI in the domain defined by the relationships given in (7). The synthetic optical data were calculated with Equation (1) on the basis of a model of randomly oriented spheroids [17] and volume PSDs described by lognormal functions for different mean radii and mode widths (see Table 1). The PSDs have been normalized to number concentration n = 1 cm−3 (see Equation (3)).
We have analyzed the optical and microphysical properties of the spheroid particles from the RLUT and compared them with the respective properties of spherical particles of equivalent volume concentration. We find the following results:
  • The optical properties of spheres and spheroids investigated in this research work, i.e., LRs at 355 and 532 nm, BAEs at the wavelength pairs (355, 532) and (532, 1064) nm, and EAEs at the wavelength pair (355, 532) nm are not distinguishable if the effective radius is less than 0.1 μm. This result may explain the applicability of the sphere-based light-scattering model (Lorenz–Mie model) in practical cases (lidar observations) in situations where the PLDRs are moderately high, i.e., δ(λi) ≤ 0.1, but do not drop to 0.
  • The difference between spheres and spheroids manifests in LRs which are systematically larger for PSDs of spheroids compared to the same (the same CRI, volume and effective radius) PSDs of spheres. Another manifestation of the difference in the two particle models are the BAEs (wavelength pairs 355/532 nm and 532/1064 nm). The BAEs of PSDs that consist of spheroids are systematically lower than the respective BAEs of PSDs that consist of spheres. The exception to this rule is coarse mode particles for which the difference between the BAEs of sphere and volume-equivalent spheroids disappears, i.e., the difference becomes negligibly small.
The similarities of the optical properties of spheres and spheroids allow us to generalize the results we found (from previous work) for spherical particles to the cases of spheroids. In particular, we can make the following statements with respect to the applicability of the following methods to the analysis/retrievals of optical data/PSDs described by spheroids:
1.a.
The information content encoded in 3β + 2α data of spheres [11,12,13] and spheroids is the same.
1.b.
GCM [34] can be applied to the case of spheroids.
1.c.
The error analysis methodology used for retrievals of PMPs [16] can be applied to spheroids.
1.d.
Our optical data quality assurance (ODQA) methodology [32] can be applied to the case of spheroids.
Spheroid particles also are characterized by PLDRs and their value is 0 in the case of a perfect sphere (and the situation of single-light-scattering events). Our analysis of the spheroid RLUT regarding the PLDRs at the available wavelengths 355, 532 and 1064 nm reveals the following results:
2.a.
The PLDRs contain information about the CRI but extracting this information, i.e., estimating the CRI from lidar data, may become impossible if the measurement errors exceed 10–15% at any of the three standard lidar measurement wavelengths.
2.b.
The PLDRs contain significant information about particle size and the PSDs themselves, e.g., the number of modes.
2.c.
The number of independent pieces of measured information encoded in 3β + 2α + 3δ datasets is 8.
The PLDR-spectrum allows us to evaluate whether the PSD of non-spherical particles is bimodal or monomodal. This spectrum allows us to determine what particles are attributed to a monomodal PSD (fine, submicron or coarse mode). We furthermore find:
3.a.
The δ(λ) spectrum is a function that monotonically decreases with wavelength, i.e., β ˙ (355/532) > 0 and β ˙ (532/1064) > 0 in terms of CrPBAEs, in the case of fine mode particles.
3.b.
The δ(λ) spectrum is a function that monotonically increases with wavelength, i.e., β ˙ (355/532) < 0 and β ˙ (532/1064) < 0, in the case of coarse mode particles.
3.c.
The δ(λ) spectrum is a function that is shaped convex-upwards, i.e., β ˙ (355/532) < 0 and β ˙ (532/1064) > 0, in the case of submicron mode particles that are intermediate between the fine mode and the coarse mode.
3.d.
The δ(λ) spectrum is a function that is shaped convex-downwards, i.e., β ˙ (355/532) > 0 and β ˙ (532/1064) < 0, in the case of a mixture of fine and coarse mode particles, i.e., a bimodal PSD.
The analysis allows us to extract more information if we consider the data on the CrPBAE plane [ β ˙ (355/532); β ˙ (532/1064)]. On such a plane the datapoints are falling in four different sectors. Datapoints in the 1st, 2nd and 3rd sector belong to fine, submicron (i.e., intermediate) and coarse mode particles of monomodal PSD, respectively. In contrast, data of the 4th sector, including datapoints in adjacent parts of the 1st and 3rd sectors can be attributed to bimodal PSDs that consist of non-spherical particles (see Figure 4). The unique feature of the interdependency “ β ˙ (532/1064) versus β ˙ (355/532)” is a hysteresis, i.e., it shows a cycloid-like behavior of the interdependency, which means that the size of the non-spherical particles changes. The significance of this result will be shown in part 3 of our trilogy [35].
In part 2 of our research work we will develop the retrieval algorithm that can be used in conjunction with the RLUTs of spheroids and spheres for the inversion of 3β + 2α + 3δ lidar data into PMPs [36].

Author Contributions

Methodology, A.K.; writing—original draft preparation, A.K.; writing—review and editing, D.M. and A.K.; supervision, D.M. All authors have read and agreed to the published version of the manuscript.

Funding

This research received no external funding.

Data Availability Statement

The data presented in this study are available on request from the corresponding author. The data are not publicly available due to privacy restrictions.

Conflicts of Interest

The authors declare no conflicts of interest.

Abbreviations

The following abbreviations and denotations are used in this manuscript:
αparticle extinction coefficient
βparticle backscatter coefficient
βparticle cross-polarized backscatter coefficient
gparticle backscatter or extinction coefficient
δparticle linear depolarization ratio (PLDR)
ζparticle scatter coefficient
λwavelength
α ˙ extinction-related Ångström exponent (EAE)
β ˙ backscatter-related Ångström exponent (BAE)
β ˙ cross-polarized BAE (CrPBAE)
Aratio of two extinction coefficients
Bratio of two backscatter coefficients
Λlidar ratio (LR)
LNlognormal function
Kcross sections per particle volume
mcomplex refractive index (CRI)
mRCRI real part
mICRI imaginary part
dv(r)/dlnrvolume PSD
nnumber concentration
ssurface-area concentration
vvolume concentration
rradius
reffeffective radius
σstandard deviation (Gauss parameter)
μmean radius (Gauss parameter)
φportion, fraction
ρdiscrepancy
Pparameter
CCNcloud condensation nuclei
GCMgradient correlation method
Nnon-spherical shape
PSDparticle size distribution
RLUTreference look-up table
SSAsingle scattering albedo

References

  1. IPCC. Climate Change 2023: Synthesis Report. Contribution of Working Groups I, II and III to the Sixth Assessment Report of the Intergovernmental Panel on Climate Change; Core Writing Team, Lee, H., Romero, J., Eds.; IPCC: Geneva, Switzerland, 2023; pp. 35–115. [Google Scholar]
  2. Kaufman, Y.J.; Tanré, D.; Boucher, O. A satellite view of aerosols in the climate system. Nature 2002, 419, 215–223. [Google Scholar] [CrossRef]
  3. Su, X.; Wang, L.; Gui, X.; Yang, L.; Li, L.; Zhang, M.; Qin, W.; Tao, M.; Wang, S.; Wang, L. Retrieval of total and fine mode aerosol optical depth by an improved MODIS Dark Target algorithm. Environ. Int. 2022, 166, 107343. [Google Scholar] [CrossRef]
  4. Holben, B.N.; Eck, T.F.; Slutsker, I.A.; Tanré, D.; Buis, J.P.; Setzer, A.; Vermote, E.; Reagan, J.A.; Kaufman, Y.J.; Nakajima, T.; et al. AERONET—A federated instrument network and data archive for aerosol characterization. Remote Sens. Environ. 1998, 66, 1–16. [Google Scholar] [CrossRef]
  5. Illingworth, A.J.; Barker, H.W.; Cole, J.; Shephard, M.W.; Beljaars, A.; Ceccaldi, M.; Delano, J.; Chepfer, H.; Clerbaux, N.; Blázquez, V.-A.; et al. The EARTHCARE satellite: The next step forward in global measurements of clouds, aerosols, precipitation, and radiation. Bull. Am. Meteor. Soc. 2015, 96, 1311–1332. [Google Scholar] [CrossRef]
  6. Hair, J.W.; Hostetler, C.A.; Cook, A.L.; Harper, D.B.; Ferrare, R.A.; Mack, T.L.; Welch, W.; Izquierdo, L.R.; Hovis, F.E. Airborne High Spectral Resolution Lidar for profiling aerosol optical properties. Appl. Opt. 2008, 47, 6734–6752. [Google Scholar] [CrossRef]
  7. Twomey, S. (Ed.) Introduction to the Mathematics of Inversion in Remote Sensing and Direct Measurements; Elsevier: New York, NY, USA, 1977; p. 243. [Google Scholar]
  8. Bohren, C.F.; Huffman, D.R. (Eds.) Absorption and Scattering of Light by Small Particles; Wiley: New York, NY, USA, 1983. [Google Scholar]
  9. Dubovik, O.; King, M.D. A Flexible inversion algorithm for retrieval of aerosol optical properties from Sun and sky radiance measurements. J. Geophys. Res. 2000, 105, 20673–20696. [Google Scholar] [CrossRef]
  10. Sawamura, P.; Moore, R.H.; Burton, S.P.; Chemyakin, E.; Müller, D.; Kolgotin, A.; Ferrare, R.A.; Hostetler, C.A.; Ziemba, L.D.; Beyersdorf, A.J.; et al. HSRL-2 aerosol optical measurements and microphysical retrievals vs. airborne in situ measurements during DISCOVER-AQ 2013: An intercomparison study. Atmos. Chem. Phys. 2017, 17, 7229–7243. [Google Scholar] [CrossRef]
  11. Veselovskii, I.; Kolgotin, A.; Müller, D.; Whiteman, D.N. Information content of multiwavelength lidar data with respect to microphysical particle properties derived from eigenvalue analysis. Appl. Opt. 2005, 44, 5292–5303. [Google Scholar] [CrossRef][Green Version]
  12. Burton, S.P.; Chemyakin, E.; Liu, X.; Knobelspiesse, K.; Stammes, S.; Sawamura, P.; Moore, R.H.; Hostetler, C.A.; Ferrare, R.A. Information content and sensitivity of the 3β+2α lidar measurement system for aerosol microphysical retrievals. Atmos. Meas. Tech. 2016, 9, 5555–5574. [Google Scholar] [CrossRef]
  13. Chemyakin, E.; Burton, S.; Kolgotin, A.; Müller, D.; Hostetler, C.; Ferrare, R. Retrieval of aerosol parameters from multiwavelength lidar. Investigation of underlying inverse mathematical problem. Appl. Opt. 2016, 55, 2188–2202. [Google Scholar] [CrossRef] [PubMed]
  14. Kolgotin, A.; Müller, D.; Chemyakin, E.; Romanov, A. Improved identification of the solution space of aerosol microphysical properties derived from the inversion of profiles of lidar optical data, part 1: Theory. Appl. Opt. 2016, 55, 9839–9849. [Google Scholar] [CrossRef]
  15. Kolgotin, A.; Müller, D.; Korenskiy, M.; Veselovskii, I. ORACLES campaign, September 2016: Inversion of HSRL-2 observations with regularization algorithm into particle microphysical parameters and comparison to airborne in situ data. Atmosphere 2023, 14, 1661. [Google Scholar] [CrossRef]
  16. Kolgotin, A.; Müller, D.; Romanov, A. Particle microphysical parameters and the complex refractive index from 3β + 2α HSRL/Raman lidar measurements: Conditions of accurate retrieval, retrieval uncertainties and constraints to suppress the uncertainties. Atmosphere 2023, 14, 1159. [Google Scholar] [CrossRef]
  17. Dubovik, O.; Sinyuk, A.; Lapyonok, T.; Holben, B.N.; Mishchenko, M.; Yang, P.; Eck, T.F.; Volten, H.; Muñoz, O.; Veihelmann, B.; et al. Application of spheroid models to account for aerosol particle nonsphericity in remote sensing of desert dust. J. Geophys. Res. 2006, 111, D11208. [Google Scholar] [CrossRef]
  18. Holben, B.N.; Eck, T.F.; Slutsker, I.; Smirnov, A.; Sinyuk, A.; Schafer, J.; Giles, D.; Dubovik, O. AERONET’s Version 2.0 quality assurance criteria. In Proceedings of the 2006 Society of Photo-Optical Instrumentation Engineers, Goa, India, 8 December 2006; Volume 6408, p. 64080Q. [Google Scholar] [CrossRef]
  19. Veselovskii, I.; Dubovik, O.; Kolgotin, A.; Lapyonok, T.; Di Girolamo, P.; Summa, D.; Whiteman, D.N.; Mishchenko, M.; Tanré, D. Application of randomly oriented spheroids for retrieval of dust particle parameters from multiwavelength lidar measurements. J. Geophys. Res. 2010, 115, D21203. [Google Scholar] [CrossRef]
  20. Müller, D.; Veselovskii, I.; Kolgotin, A.; Tesche, M.; Ansmann, A.; Dubovik, O. Vertical profiles of pure dust and mixed smoke-dust plumes inferred from inversion of multiwavelength Raman/polarization lidar data and comparison to AERONET retrievals and in situ observations. Appl. Opt. 2013, 52, 3178–3202. [Google Scholar] [CrossRef] [PubMed]
  21. Burton, S.P.; Hair, J.W.; Kahnert, M.; Ferrare, R.A.; Hostetler, C.A.; Cook, A.L.; Harper, D.B.; Berkoff, T.A.; Seaman, S.T.; Collins, J.E.; et al. Observations of the spectral dependence of linear particle depolarization ratio of aerosols using NASA Langley airborne High Spectral Resolution Lidar. Atmos. Chem. Phys. 2015, 15, 13453–13473. [Google Scholar] [CrossRef]
  22. Noh, Y.; Müller, D.; Lee, K.; Kim, K.; Lee, K.; Shimizu, A.; Kim, S.-W.; Sano, I.; Park, C.B. Depolarization ratios retrieved by AERONET sun–sky radiometer data and comparison to depolarization ratios measured with lidar. Atmos. Chem. Phys. 2017, 17, 6271–6290. [Google Scholar] [CrossRef]
  23. Tesche, M.; Kolgotin, A.; Haarig, M.; Burton, S.P.; Ferrare, R.A.; Hostetler, C.A.; Müller, D. 3+2+X: What is the most useful depolarization input for retrieving microphysical properties of non-spherical particles from lidar measurements using the spheroid model of Dubovik et al. (2006)? Atmos. Meas. Tech. 2019, 12, 4421–4437. [Google Scholar] [CrossRef]
  24. Mishchenko, M.I.; Travis, L.D. T-matrix computations of light scattering by large spheroidal particles. Opt. Commun. 1994, 109, 16–21. [Google Scholar] [CrossRef]
  25. Yang, P.; Liou, K.N. Geometric-optics-integral-equation method for light scattering by nonspherical ice crystals. Appl. Opt. 1996, 35, 6568–6584. [Google Scholar] [CrossRef] [PubMed]
  26. Saito, M.; Yang, P. Quantifying the impact of the surface roughness of hexagonal ice crystals on backscattering properties for lidar-based remote sensing applications. Geophys. Res. Lett. 2023, 50, 2023GL104175. [Google Scholar] [CrossRef]
  27. Floutsi, A.A.; Baars, H.; Engelmann, R.; Althausen, D.; Ansmann, A.; Bohlmann, S.; Heese, B.; Hofer, J.; Kanitz, T.; Haarig, M.; et al. DeLiAn—A growing collection of depolarization ratio, lidar ratio and Ångström exponent for different aerosol types and mixtures from ground-based lidar observations. Atmos. Meas. Tech. 2023, 16, 2353–2379. [Google Scholar] [CrossRef]
  28. Mamouri, R.-E.; Ansmann, A. Potential of polarization lidar to provide profiles of CCN- and INP-relevant aerosol parameters. Atmos. Chem. Phys. 2016, 16, 5905–5931. [Google Scholar]
  29. Freudenthaler, V.; Esselborn, M.; Wiegner, M.; Heese, B.; Tesche, M.; Ansmann, A.; Müller, D.; Althausen, D.; Wirth, M.; Fix, A.; et al. Depolarization ratio profiling at several wavelengths in pure Saharan dust during SAMUM 2006. Tellus 2009, 61, 165–179. [Google Scholar] [CrossRef]
  30. Groß, S.; Freudenthaler, V.; Schepanski, K.; Toledano, C.; Schäfler, A.; Ansmann, A.; Weinzierl, B. Optical properties of long-range transported Saharan dust over Barbados as measured by dual-wavelength depolarization Raman lidar measurements. Atmos. Chem. Phys. 2015, 15, 11067–11080. [Google Scholar] [CrossRef]
  31. Haarig, M.; Ansmann, A.; Baars, H.; Jimenez, C.; Veselovskii, I.; Engelmann, R.; Althausen, D. Depolarization and lidar ratios at 355, 532, and 1064 nm and microphysical properties of aged tropospheric and stratospheric Canadian wildfire smoke. Atmos. Chem. Phys. 2018, 18, 11847–11861. [Google Scholar] [CrossRef]
  32. Kolgotin, A.; Müller, D.; Veselovskii, I.; Korenskiy, M.; Wang, X. Pre-filter analysis for retrieval of microphysical particle parameters: A quality-assurance method applied to 3 backscatter (β) +2 extinction (α) optical data taken with HSRL/Raman lidar. Appl. Opt. 2023, 62, 5203–5223. [Google Scholar] [CrossRef]
  33. van de Hulst, H.C. Light Scattering by Small Particles; John Wiley&Sons: New York, NY, USA, 1957; 537p. [Google Scholar]
  34. Kolgotin, A.; Müller, D.; Chemyakin, E.; Romanov, A.; Alehnovich, V. Improved identification of the solution space of aerosol microphysical properties derived from the inversion of profiles of lidar optical data, part 3: Case studies. Appl. Opt. 2018, 57, 2499–2513. [Google Scholar] [CrossRef]
  35. Kolgotin, A.; Müller, D. Model of randomly oriented spheroids for the retrieval of non-spherical particle microphysical parameters from 3β+2α+3δ lidar measurements, part 3: Case studies. Remote Sens. 2026; submitted.
  36. Kolgotin, A.; Müller, D. Model of randomly oriented spheroids for the retrieval of non-spherical particle microphysical parameters from 3β+2α+3δ lidar measurements, part 2: ATLAS (version 2.0) retrieval algorithm. Remote Sens. 2026; submitted.
Figure 1. Properties of the fine modes of the monomodal PSDs obtained with the spheroid (solid) and spherical (dot) RLUT. Shown are the optical intensive parameters EAE α ˙ (355/532) (ac), BAE β ˙ (532/1064) (df), LR Λ(355) (gi) and LR Λ(532) (jl) versus the following microphysical intensive parameters: effective radius reff at standard deviation σ = 1.45 (a,d,g,j), real part of the CRI (b,e,h,k) and imaginary part of the CRI (c,f,i,l).
Remotesensing 18 01595 g001
Figure 2. Statistics of the parameters obtained from the spheroid RLUT (see text for details). Shown are the surface-area concentration versus extinction coefficient at 355 nm (a), effective radius versus EAE α ˙ (355/532) (b), effective radius versus BAE β ˙ (532/1064) (c), effective radius versus PLDR at 355 nm (d), effective radius versus PLDR at 532 nm (e), effective radius versus PLDR at 1064 nm (f), PLDR at 355 nm versus EAE α ˙ (355/532) (g), PLDR at 532 nm versus EAE α ˙ (355/532) (h), PLDR at 1064 nm versus EAE α ˙ (355/532) (i), PLDR at 355 nm versus LR Λ(355) (j), PLDR at 532 nm versus LR Λ(532) (k), CrPBAEs β ˙ (532/1064) versus β ˙ (355/532) (l). Gray, red and black points correspond to all datasets, highly (mR > 1.4, mI > 0.01) and low/moderately (mR ≤ 1.4, mI < 0.01) light-absorbing particles. The solid lines describe the linear regression equations. The blue curve restricts the data for which LRs do not exceed 150 sr at 355 and 532 nm.
Remotesensing 18 01595 g002
Figure 3. Bimodal PSD (black) and monomodal PSDs represented by fine (blue), submicron (green) and coarse (red) mode particles (a) and the respective PLDR spectra (b). The data were collected from the spheroid RLUT and represent low(m = 1.5 − i0.005, solid) and highly (m = 1.5 − i0.05, dot) light-absorbing particles. The mean values (symbols) and the spreads (solid) of all datasets from the spheroid RLUT for small (blue), submicron (green) and large (red) particles are shown in (c). The red-shaded area restricts the spread of all datasets (from spheroid RLUT) to LRs less than 150 sr at 355 and 532 nm.
Remotesensing 18 01595 g003
Figure 4. Interdependencies β ˙ (532/1064) versus β ˙ (355/532) for the cases: (a) Mean radius of low (m = 1.35 − i0.0025, green), moderately (m = 1.50 − i0.01, black) and highly (m = 1.69 − i0.03, red) light-absorbing particles changes for fixed σ = 1.45 (solid curves without bullets) and σ = 1.65 (solid curves with bullets) on the domain μ ∈ [0.055; 3.845] μm. (b) CRI real part of low (red), moderately (green) and highly (blue) light-absorbing particles of fine (thick solid curves) and coarse (thick dashed curves) mode changes on the domain mR ∈ [1.325; 1.69]. The imaginary part of the CRI changes for low values (black), moderate values (yellow) and high values (cyan) of the real part for the case of fine and coarse mode particles on the domain mI ∈ [i0.0005; i0.1]. Thin black curves correspond to bimodal low (solid) and highly (dot) light-absorbing PSDs. Dotted black curve corresponds to bimodal PSD of organic carbon–dust mix. The stars correspond to low (closed symbols) and highly (open symbols) light-absorbing particles of the fine (blue), intermediate (submicron) (green), coarse (red) modes and bimodal PSD (black) shown in Figure 3a. The thin blue curve restricts the data for which the LRs do not exceed 150 sr at 355 and 532 nm.
Remotesensing 18 01595 g004
Figure 5. Statistics of SSA at 532 nm versus BAE at the wavelength pair 355 and 532 nm. Datapoints were taken from the spheroid RLUT. The datapoints belong to the domains σ ∈ [1.45; 1.95] and mI ∈ [i0.0005; i0.05].
Remotesensing 18 01595 g005
Table 1. Pair of Gauss parameters (μ, σ) and respective effective radius used in the spheroid RLUT.
σ1.351.451.551.651.751.851.952.052.152.252.352.452.55
μ, μm
0.0550.0690.0780.0890.1030.1200.1420.1680.1990.2380.2850.3410.4090.492
0.0690.0860.0970.1120.1290.1510.1780.2100.2500.2990.3570.4280.5140.617
0.0860.1080.1210.1390.1610.1880.2220.2620.3120.3720.4450.5330.6400.769
0.1080.1350.1530.1750.2020.2360.2780.3290.3920.4670.5590.6700.8040.966
0.1350.1690.1910.2180.2530.2950.3480.4120.4900.5840.6990.8371.0051.207
0.1690.2120.2390.2730.3160.3700.4350.5150.6130.7310.8751.0481.258
0.2110.2640.2980.3410.3950.4620.5430.6430.7650.9131.0921.3091.571
0.2640.3310.3730.4270.4940.5780.6800.8050.9571.1421.3661.638
0.3300.4130.4660.5330.6180.7220.8501.0061.1971.4281.708
0.4130.5170.5830.6680.7730.9041.0641.2591.4981.787
0.5160.6460.7290.8340.9661.1291.3291.5741.8712.233
0.6450.8080.9111.0431.2071.4111.6611.9672.339
0.8061.0101.1381.3031.5091.7632.0762.458
1.0081.2631.4231.6291.8872.2052.5963.074
1.261.5781.7792.0372.3592.7573.245
1.5751.9732.2242.5462.9483.446
1.9692.4662.7813.1833.6864.308
2.4613.0823.4753.9784.607
3.0763.8534.3444.972
3.8454.816
Disclaimer/Publisher’s Note: The statements, opinions and data contained in all publications are solely those of the individual author(s) and contributor(s) and not of MDPI and/or the editor(s). MDPI and/or the editor(s) disclaim responsibility for any injury to people or property resulting from any ideas, methods, instructions or products referred to in the content.