Article

Direct and Indirect Effects of Large-Scale Forest Restoration on Water Yield in China’s Large River Basins

Collaborative Innovation Center on Forecast and Evaluation of Meteorological Disasters (CIC-FEMD)/Key Laboratory of Ecosystem Carbon Source and Sink, China Meteorological Administration (ECSS-CMA), Nanjing University of Information Science and Technology, Nanjing 210044, China
*
Author to whom correspondence should be addressed.
Remote Sens. 2025, 17(9), 1581; https://doi.org/10.3390/rs17091581
Submission received: 5 March 2025 / Revised: 17 April 2025 / Accepted: 27 April 2025 / Published: 29 April 2025

Abstract

:
Emerging evidence indicates that large-scale forest restoration exhibits dual hydrological effects: direct reduction of local water availability through elevated evapotranspiration (ET) and indirect augmentation of water resources via enhanced atmospheric moisture recycling. However, the quantitative assessment of these counteracting effects remains challenging due to the limited observational constraints on moisture transport. Here, we integrate the Budyko model with the Lagrangian-based UTrack moisture-tracking dataset to disentangle the direct (via ET) and indirect (via precipitation) large-scale hydrological impacts of China’s four-decade forest restoration campaign across eight major river basins. Multisource validation datasets, including gauged runoff records, hydrological reanalysis products, and satellite-derived forest cover maps, were systematically incorporated to verify the Budyko model at the nested spatial scales. Our scenario analyses reveal that during 1980–2015, extensive afforestation individually reduced China’s terrestrial water yield by −28 ± 25 mm yr−1 through dominant ET increases. Crucially, atmospheric moisture recycling mechanisms attenuated this water loss by 12 ± 5 mm yr−1 nationally, with marked spatial heterogeneity across the basins. In some moisture-limited watersheds in the Yellow River Basin, the negative ET effect was compensated for to a certain extent by precipitation recycling, demonstrating net positive hydrological outcomes. We conclude that China’s forest expansion imposes local water stress (direct effect) by elevating ET, while the concomitant strengthening of continental-scale moisture recycling generates compensatory water gains (indirect effect). These findings advance the mechanistic understanding of the vegetation-climate-water nexus, providing quantitative references for optimizing forestation strategies under atmospheric water connectivity constraints.

Graphical Abstract

1. Introduction

China has implemented large-scale afforestation programs and conservation initiatives to reverse environmental deterioration over the past decades. Under systematic policies promoting ecological civilization construction, the national forest cover has increased significantly from 17% in the 1990s to approximately 24% today, with an ambitious target of 30% by 2050 [1]. Satellite observations have revealed a pronounced “greening” trend across mainland China since 2000 [2], accompanied by measurable improvements in ecosystem services, such as carbon sequestration and soil erosion control [3].
Large-scale forest restoration is widely recognized to play a vital role in sequestering atmospheric carbon [4], mitigating climate change [5], and enhancing soil-water conservation [6]. However, large-scale afforestation initiatives may trigger trade-offs among ecosystem services [7,8]. A prominent concern arises from the potential hydrological consequences of extensive forest expansion, particularly in water-scarce areas. A recent study indicated that ecosystems in China have become more sensitive to changes in water demand since 2001 [9]. Increased forest cover on the Loess Plateau has been associated with reduced river runoff and exacerbated soil desiccation [2]. Similarly, degraded stands within the Three-North Shelterbelt Forest Program—attributed to chronic soil moisture depletion—highlight the risks of mismatched vegetation-climate interactions [10]. These cases underscore the critical need to balance soil erosion control and carbon sequestration with hydrological sustainability in arid and semi-arid zones. However, there is still a knowledge gap regarding the impacts of large-scale afforestation on water resources in China, and there is an urgent need to clarify the intrinsic mechanisms behind the forest-water relationship at a fundamental level [6], which is of great significance for ecological restoration, industrial development, public awareness, and policy formulation.
The influence of forests on water yield is complex and uncertain [11,12,13,14]. Most of the knowledge about forest hydrology comes from small paired watershed experimental research conducted in developed countries [15]. Although there is a consensus on the basic understanding of forest-water relations that has been increasingly reached in the international forest hydrology community, the impacts of forests on regional climate and water resources are not well understood [16,17,18]. Forest harvesting and conversion of forest lands into grasslands or farmlands generally reduce basin evapotranspiration (ET), resulting in an increase in the total water yield and base flow in the basin. In contrast, afforestation on grasslands, especially planting of exotic species that are originally adapted to wetter climate areas, generally increases ET and thus reduces the total water yield [19]. The selection of tree species for afforestation in China over the past few decades has been oriented toward fast-growing species for economic reasons, which has led to ecological problems due to monoculture. Hua et al. [20] conducted an integrated analysis of paired studies of planted and locally restored forests globally and found that soil and water conservation capacity and forest-water yield declined by 61% and 13%, respectively, in planted forest areas compared to locally restored forests. The process of water evaporation and transpiration is the most important factor in predicting streamflow response to forest management [21,22].
Vegetation plays a crucial role in climate change by regulating key land-atmosphere processes, such as surface energy budgets and water fluxes, thereby influencing local, regional, and even global climates [23]. However, due to the inherent challenges in studying ET processes and the limited exploration of the ultimate fate of water infiltrating into the soil, previous studies have often overlooked the critical role of forest ET in recycling soil water back into the atmosphere [24]. Researchers have proposed that forest ET can enhance downwind precipitation, suggesting that the evaluation of forest-water resource impacts should adopt a more comprehensive perspective [18]. At the regional scale, large-scale vegetation changes in upwind areas within a precipitation shed can influence precipitation and runoff in downwind watersheds [18,23,24,25]. While vegetation greening can enhance surface ET, potentially reducing local water availability, the dissipated water vapor continues to participate in the hydrological cycle, compensating for local water loss through precipitation. Additionally, this water vapor can be transported atmospherically to downwind regions, where it contributes to precipitation, thereby exerting cross-regional impacts on surface water resources [26]. Vegetation restoration not only directly affects local runoff but also influences water yield across regions by modulating precipitation patterns. Therefore, when assessing the impact of vegetation on water availability, it is essential to consider its feedback effects on precipitation, which may compensate for water losses in other regions.
Recent evidence indicates that large-scale forest restoration exhibits dual hydrological effects: direct reduction of local water availability through elevated ET and indirect increase of precipitation and water availability through enhanced large-scale atmospheric water recycling. Cui et al. [27] found that in regions such as eastern China, Europe, western Siberia, and parts of western and southern Africa, the water availability loss due to the increase in ET results from vegetation greening was outweighed by the enhanced precipitation driven by greening in upwind moisture source regions, leading to a net increase in surface water availability. Similarly, Hoek van Dijke et al. [24] demonstrated that the combined effects of direct evaporation from forests and their indirect enhancement of precipitation create complex patterns of changes in water availability. In some areas, large-scale forest expansion can increase water yield by up to 6%, while in others, it may reduce water availability by as much as 38% [24]. Recent studies in China have investigated vegetation feedback on climate and demonstrated that moisture recycling is an important component of regional precipitation [1,28,29,30,31,32]. Overall, the impact of forest restoration on large-scale water availability has received extensive attention in current research on land-atmosphere processes [24,29,33,34,35]. However, few studies have quantified the direct and indirect effects on local and regional water yields due to the lack of reliable atmospheric moisture recycling datasets [24].
Generally, intensifying global climate change and human activities are causing increasing damage to forest ecosystems, making large-scale forest restoration a critical initiative for achieving sustainable development [5,28]. Assessing the effectiveness of afforestation efforts at the national or continental scale is a central task in addressing global ecological degradation, climate change, and sustainable development goals [5]. China’s afforestation projects, such as the “Three-North Shelter Forest Program” and the “Grain for Green Program,” cover vast areas with complex geographical environments (e.g., mountains, deserts, and plateaus) [29]. Traditional ground-based survey methods, such as periodic field monitoring, face significant limitations in coverage, timeliness, and cost-effectiveness [36], particularly in a country like China, with its vast territory and diverse terrain, making the systematic evaluation of restoration outcomes challenging. Remote sensing technology, with its advantages of large-scale coverage, high frequency, and low cost, has become an indispensable tool for China to assess the effectiveness of afforestation and implement adaptive management (dynamically adjusting afforestation strategies) to achieve a win-win scenario for ecological benefits and public well-being [37]. As remote sensing technology becomes increasingly intelligent, its role in monitoring ecological projects will become more pivotal [38].
This study quantified the direct and indirect effects of vegetation restoration on water availability in China’s major river basins over the past four decades using the Budyko model and the UTrack moisture recycling dataset without accounting for the impacts of anthropogenic disturbances (e.g., hydraulic engineering, inter-basin transfer, and water withdrawal for irrigation). Multiple sources of datasets, including long-term measured runoff and meteorological data, gridded runoff data, and remote sensing forest cover data, were used to assess the Budyko model at both grid and basin scales.

2. Materials and Methods
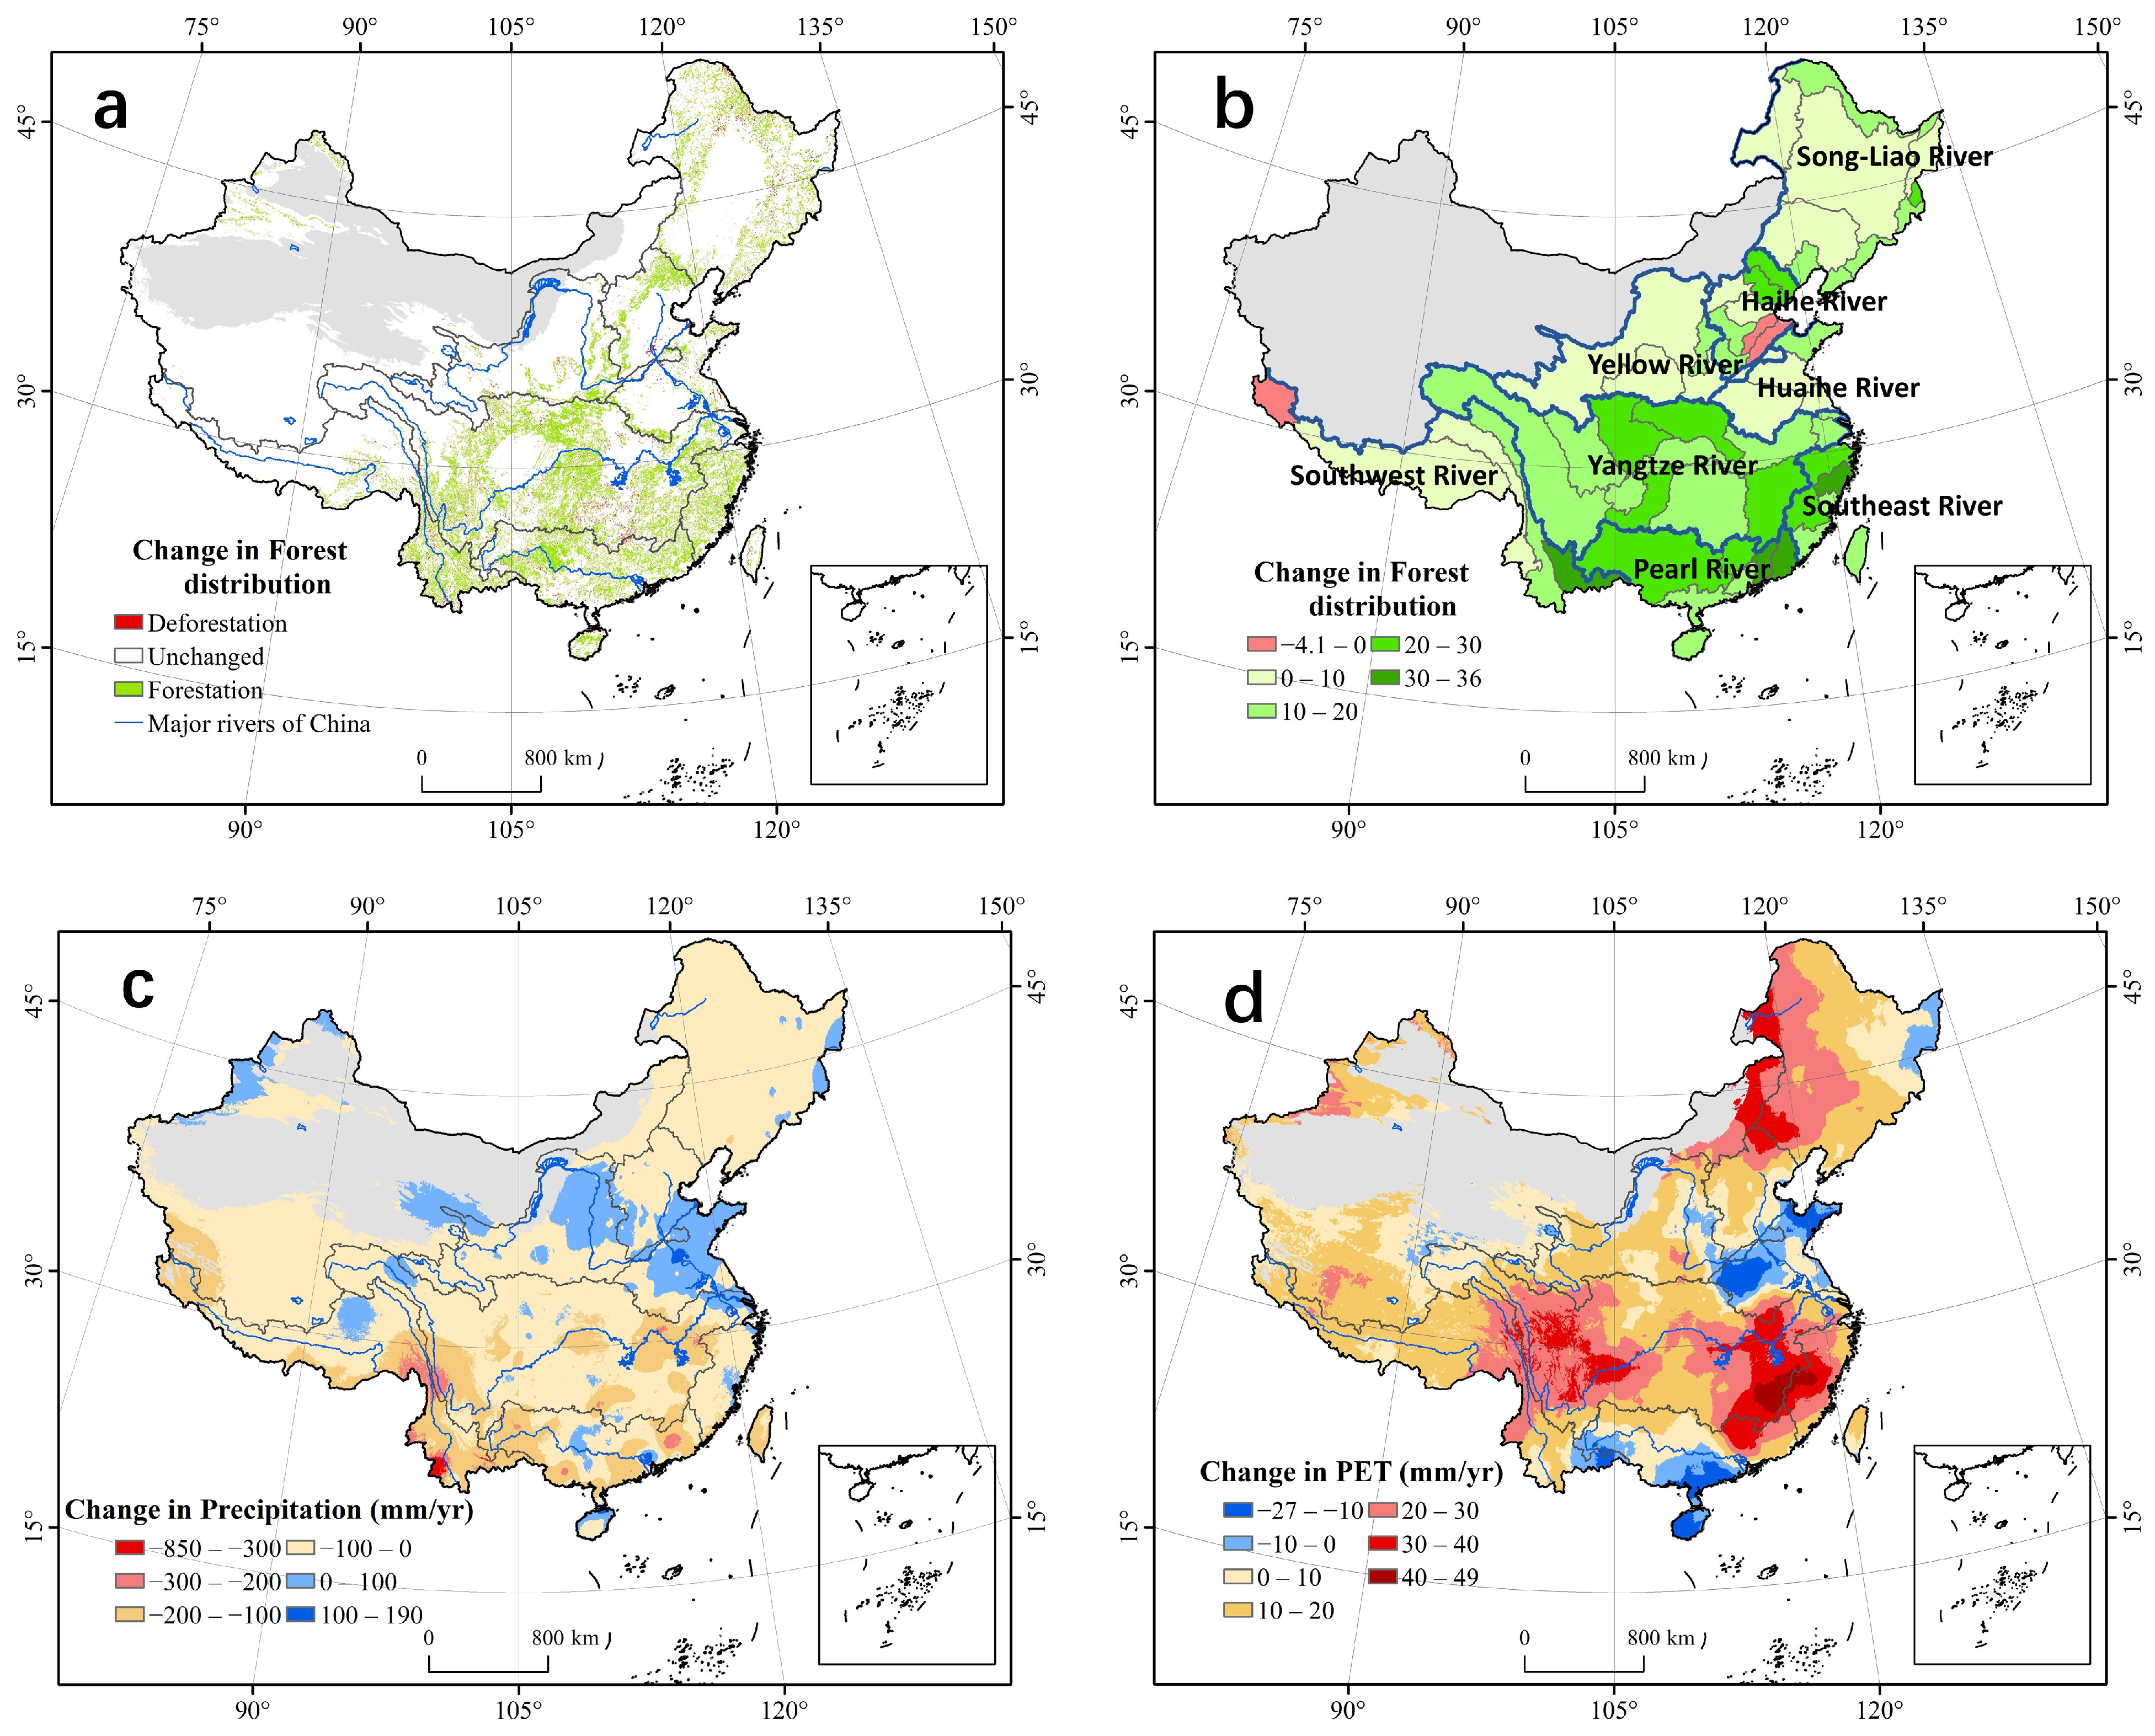
2.1. Study Area

The forest cover data obtained from http://www.nesdc.org.cn (accessed on 1 January 2025) [39] showed that, from 1980 to 2015, significant changes in vegetation cover were observed across China. With the exception of desert areas (where annual precipitation is less than 300 mm), notable increases in vegetation were detected from northeastern China to the southern and southwestern regions, as well as across major river basins, such as the Song-Liao, Yangtze, Pearl, and Southeast River basins [2]. Only a few areas experienced vegetation decline (Figure 1a) [34]. The spatial distribution of changes in the average forest coverage within secondary river basins from 1980 to 2015 indicates a substantial expansion of vegetation (14 ± 8%) in most regions of China, with vegetation recovery generally improving from north to south. A few basins, particularly the Haihe and Southwest River basins, showed vegetation loss, while the most significant vegetation gains occurred in the Pearl River Basin and Southeast River Basins (Figure 1b).
Over the past four decades, China has experienced a drying trend in most regions (Figure 1c,d). Figure 1d illustrates the changes in potential ET, showing an upward trend (15 ± 11 mm yr−1) in most regions of China. This increase was particularly pronounced in the Song-Liao and Yangtze River Basins. Meanwhile, precipitation exhibited a declining trend (−51 ± 54 mm yr−1) across much of the country, with pronounced reductions in southern and southwestern China (Figure 1c). In some areas, precipitation decreased by more than −300 mm/year, while only a few regions, such as parts of northern China, saw an increase in precipitation.

2.2. Dataset

The data needed for this study mainly include China’s forest cover remote sensing data, related meteorological data (annual precipitation and annual average potential ET data), annual average runoff gridded data, and watershed runoff measured data. Forest cover data were obtained from the 1980–2021 China forest cover dataset [39], published on the EcoNetwork Cloud Platform of the National Ecological Science Data Center (http://www.nesdc.org.cn, accessed on 1 January 2025), and the national forest cover data in 1980 and 2015 were selected. Precipitation data were obtained from a 1-km resolution monthly precipitation dataset (https://www.scidb.cn, accessed on 1 January 2025) for China from 1960 to 2020 [40]. Potential ET data were obtained from the 1990–2021 China 1-km month-by-month potential ET dataset calculated using the Hargreaves method [41], and runoff gridded data with a resolution of 0.25° × 0.25° were obtained from the 1960–2018 China natural runoff gridded dataset CNRD v1.0 [42], both published on the National Tibetan Plateau Science Data Centre (https://www.tpdc.ac.cn, accessed on 1 January 2025) (Tables S1 and S2).
The UTrack Atmospheric Moisture Cycle dataset (1980–2015) at 0.5° spatial resolution (https://doi.pangaea.de/10.1594/PANGAEA.912710) presents a global dataset of atmospheric moisture flows from evaporation to precipitation and was used to analyze the indirect effects of changes in vegetation cover on downwind water availability in this study [43]. This dataset is based on the Lagrangian water vapor tracking model UTrack, which uses ERA5 reanalysis data for 25 atmospheric layers, as well as hourly wind speed and direction data, to simulate water vapor flow between each pair of pixels over all land and oceans from 2008 to 2017, calculating an explicit relationship between ET and the location of precipitation, and providing its monthly climatological mean. Utrack simulates both the forward trajectories of moisture from evaporation to precipitation and the backward trajectories of precipitation source regions, enabling the construction of forward footprints (downwind areas receiving precipitation from evaporation in a given region) and backward footprints (upwind areas contributing evaporation to precipitation in a given region). Users can input precipitation data to estimate upwind ET sources (forward footprints) or input ET data to estimate downwind precipitation (backward footprints).
This study employs Budyko-modeled ET data under vegetation restoration scenarios to compute the resulting downwind precipitation, thereby analyzing the indirect effects of vegetation expansion on water availability. Budyko’s model generally ignores changes in watershed storage and can therefore only be applied to multiyear averaged time scales. To ensure temporal consistency between the ET data simulated by the Budyko model and the UTrack dataset (both at a monthly scale), this study aggregated the monthly average ET recycling volume from the UTrack dataset into an annual average ET recycling volume, resampled the data at a resolution of 1 km to 0.5°, and calculated the recycled precipitation generated by enhanced ET after tree restoration.

2.3. The Budyko Modeling Framework

The Budyko framework model has been widely used to quantify the coupled water-energy balance under mean conditions [44]. Models such as the Fu ET model [22,45,46] and the multi-scale Zhang ET model [47,48] can be readily used to quantify the role of vegetation in influencing the partitioning of precipitation into ET and runoff under changing environmental conditions [49,50,51,52].
This study estimated the mean annual water yield (Q) as the difference between precipitation (P) and ET, assuming that the change in soil-water storage is negligible for a 10-year period, 1980–1990 (pre-forestation) and 1991–2020 (post-forestation) [8,14]. This study adopted the Zhang model [14] (Equation (1)) among several commonly used Budyko framework models [24,53] based on initial evaluations.
E T = 1 + w PET P 1 + P PET + w PET P × P
where ET is the evapotranspiration, P is the precipitation, and PET is the potential evapotranspiration. w represents the calibrated ecosystem ET efficiency parameter. In this study, we derived this parameter for two types of land cover: forest land (w = 2.0) and other lands w = 0.5). These parameters appear to be reliable for the broad application of the model [45,54,55].
The direct effects of forestation on water yield (ΔQ) were expressed as differences in the change in P and ET between pre-forestation (land cover in 1980) and post-forestation (land cover in 2025):
Δ Q = Δ P Δ E T
where ΔQ, ΔP, and ΔET are the annual changes in water yield, precipitation, and evapotranspiration, respectively, between pre- and post-forestation.
We estimated ΔQ at a 1 km2 scale with single land cover and watershed level with mixed land covers. For a watershed with mixed land cover (forests and other land cover), the annual mean Q is calculated as the difference between P and weighted ET for forest and other land covers based on their proportions in the watershed:
Q = P E T = P ET forest × f for + ET other × 1 f for
where Q, P, and ET are the annual water yield, precipitation, and evapotranspiration, respectively, between pre- and post-forestation. ETforest is the actual ET for forest land estimated at the 1 km2 scale; ETother is the actual ET for the other land-use type; and ffor is the forest cover percentage.
To estimate Q in the eight large basins, the total actual ET across the study area was estimated as
ETtotal = ETforest × TC + ETother × (1 − TC)
where ETtotal is the total actual ET, TC is the forest cover percentage, 100% for forested land pixels, and 0 for other land cover pixels.

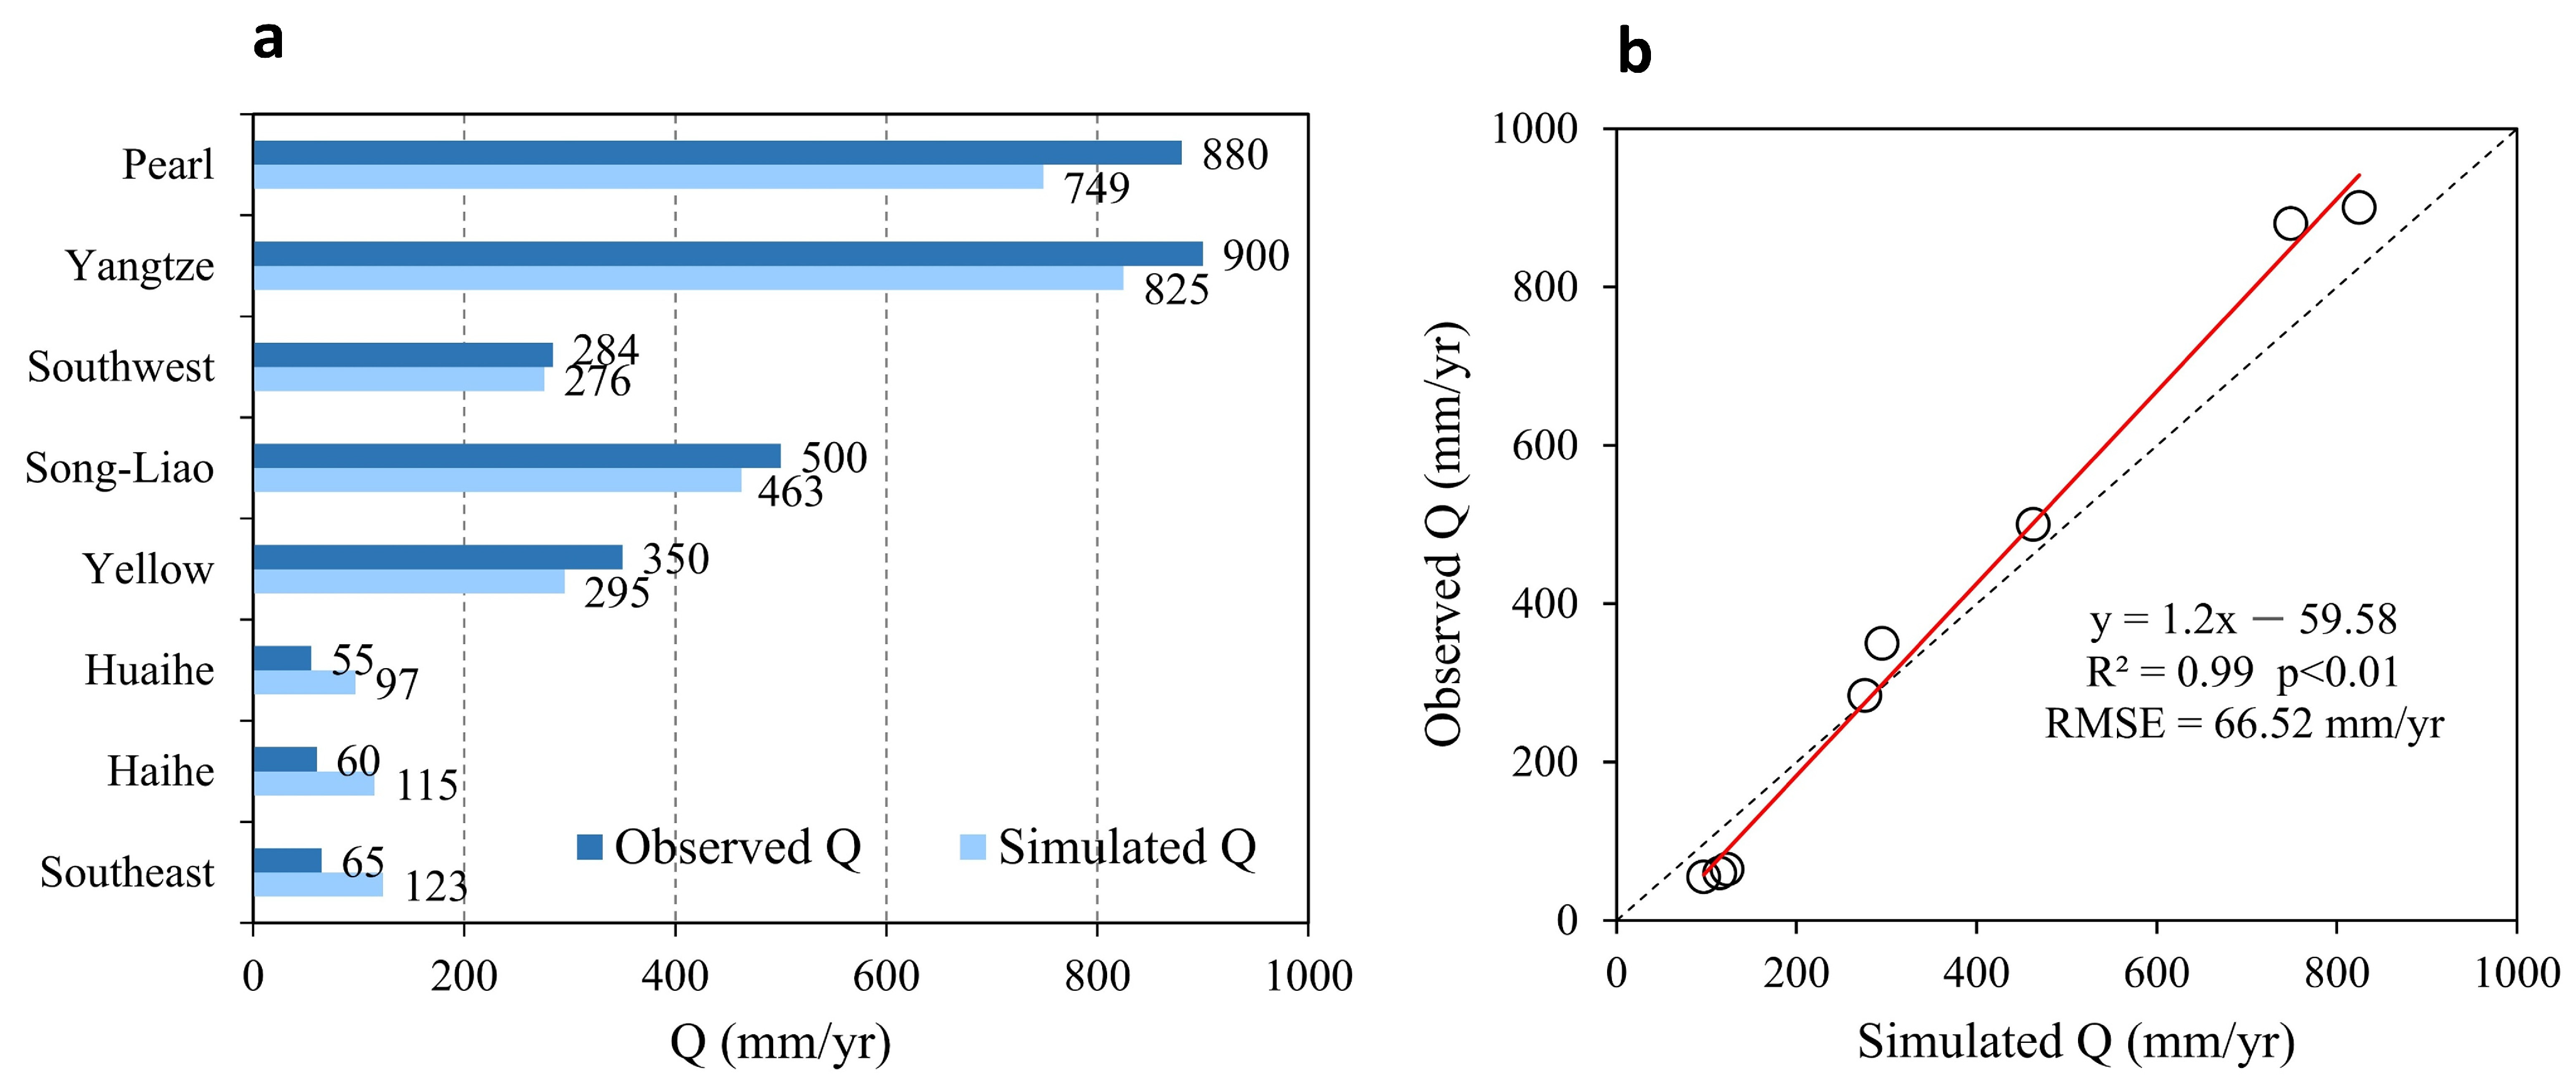
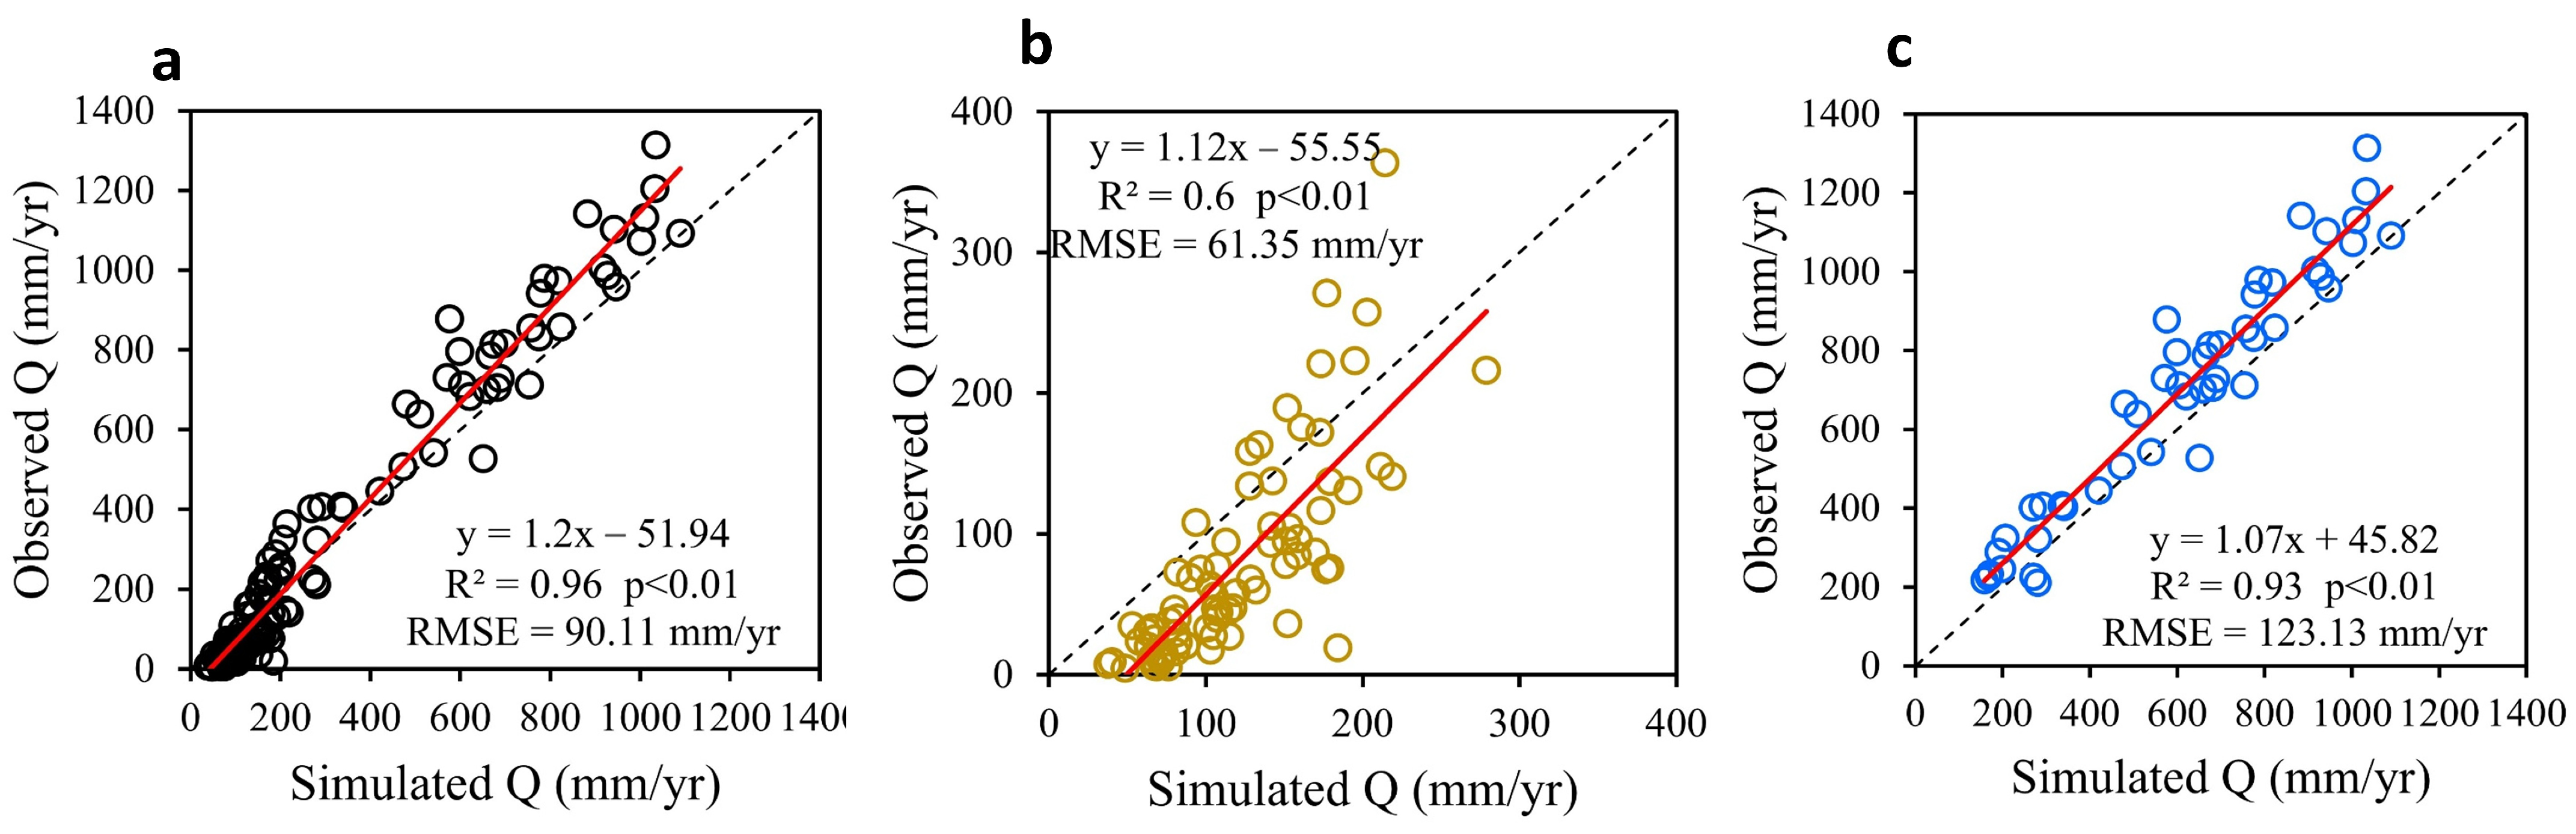
2.4. Model Validation Using Multiple Data Sources

The Budyko ET model [47] was validated with measured mean annual streamflow (Q) in watersheds across China by fitting measured and modeled Q separately for each of the two time periods to reflect the effects of forestation and human activities on the w parameter. We used the 800 mm precipitation line to categorize all small watersheds into two regions, i.e., humid and semi-humid watersheds and semi-arid watersheds (arid watersheds were not taken into account).
We tested the model’s fidelity in modeling the net direct effects of forestation (i.e., not considering the impact of human activities) on water yield using four runoff datasets. (1) The reconstructed China Natural Runoff Dataset version 1.0 (CNRD v1.0) (1980–2018) (gridded data) is based on the VIC model [42]. The VIC model is a general distributed hydrological model that has been extensively calibrated in China. (2) Water yield in eight major river basins (2001–2020) modeled using a process-based ecosystem model (BEPS) [56]. BEPS is a remote sensing data-driven model that evolves from a forest ecosystem model that simulates photosynthesis, energy balance, hydrological, and soil biochemical processes. (3) Annual runoff data for 123 small watersheds from 2001 to 2020 were obtained from the Hydrological Yearbook published by the Hydrological Bureau of the Ministry of Water Resources of China [56]. (4) Measured runoff data from 32 watersheds across different climate zones were obtained from the literature. (See Table S2).
The model simulation accuracy was assessed using a univariate linear regression model with a coefficient of determination (R2) and root mean square error (RMSE):
R 2 = 1 i = 1 n y i y ^ i 2 i = 1 n y i y - 2
R M S E = 1 n i = 1 n y i y ^ i 2 #    
where n is the number of samples, y i is the ith observation, y ^ i is the ith prediction, y - is the average of the observations. The closer R2 is to 1, the smaller the RMSE, indicating a higher accuracy of the model simulation.

2.5. Scenario Setting

To separate the individual and combined effects of vegetation change and climate change on water yield, three combination experiments were designed based on four scenarios. We first conducted four scenario simulations using forest cover data for 1980 and 2015 and climate data for two periods, 1980–1999 and 2000–2020, respectively (Table 1). Based on different combination experiments of these four scenarios, we estimated the combined (absolute and relative) effects of afforestation and climate change on water yield and then separated the individual forestation effects (absolute and relative) on water yield (Table 2). Experiment A has combined the effects of forestation and climate, Experiment B is the individual effect of forestation (from 1980 to 2015) with the same climate as the period from 1980 to 1999, Experiment C is the individual effect of forestation (from 1980 to 2015) with the same climate as the period from 2000 to 2020. We assessed the effects of forestation on water yield at multiple scales from three scales: 1 km2 pixel, 2nd-level watershed (48 watersheds), and eight large basins to illustrate the effects of watershed size on hydrologic responses.
In this study, the direct reduction of local water availability through elevated ET and the indirect augmentation of water availability via enhanced large-scale atmospheric moisture recycling across China were both assessed. We quantified this hydrological compensation by calculating the differential precipitation patterns derived from ET variations between Scenario A and Scenario C after accounting for moisture recycling processes. To align with the monthly resolution of the UTrack dataset, we processed the annual mean ET values from both scenarios into monthly averages prior to conducting the trajectory analysis.

3. Results

3.1. Model Validation Results

Compared to runoff data modeled by BEPS in eight large river basins, R2 reached 0.99, indicating that the Budyko model performs better at the large watershed scale (Figure 2). The runoff simulation results of the Budyko model were then validated using 123 small watersheds with measured runoff data. The scatter plots suggest that the hydrological model has high accuracy in estimating annual water yield (Figure 3a) (R2 = 0.96, RMSE = 90.1, p < 0.01). We found that among the 123 small watersheds (Figure 3a), the Budyko model fit better in the humid watersheds (R2 = 0.93) than in the semi-humid and semi-arid watersheds (R2 = 0.6), with higher RMSE (Figure 3b,c). This is mainly because humid watersheds generally have more runoff volume; therefore, the absolute error is often larger, but the relative error is smaller than that of semi-humid and semi-arid watersheds.
We further tested the model’s fidelity in modeling the net effects of forestation on water yield using published measured data from 32 watersheds across different climate zones (Figure 4). Validation using measured data from 32 watersheds showed that the Budyko model performed well for both periods (R2 = 0.97 and RMSE = 95.8 for 1980–1999, R2 = 0.98 and RMSE = 76.8 for 2000–2020, respectively) (Figure 4a,d). However, simulated runoff was significantly overpredicted in the semi-arid and semi-humid watersheds (Figure 4b,e) compared to the humid watersheds (Figure 4c,f).
The validation results for the 20 watersheds using CNRD v1.0 gridded data (Figure 5) showed that the model predicts better in the humid zone than in the other two climatic zones during both time periods, which was similar to the validation results in the 32 watersheds with measured runoff (Figure 4). A comparison of the validations for the two time periods revealed that in humid watersheds, the simulation during the period of 1980–1999 was better when validated with gridded data (Figure 5c,f), while the validation with measured runoff (Figure 4c,f) did not show much difference in simulation results between the two time periods.
Overall, the coefficient of determination R2 of all runoff datasets compared with Budyko simulated runoff results reached more than 0.95 (Figure 2, Figure 3, Figure 4 and Figure 5), indicating the credibility of the Budyko simulation results. The simulated streamflow in the humid watershed was validated much better than that in the semi-humid and semi-arid watersheds during both time periods. Although we found a significant correlation between measured and modeled annual streamflow, it appears that factors other than forestation and climate change, such as large anthropogenic disturbances (e.g., hydraulic engineering, inter-basin transfer, and water withdrawal for irrigation), could have altered the streamflow in these watersheds.

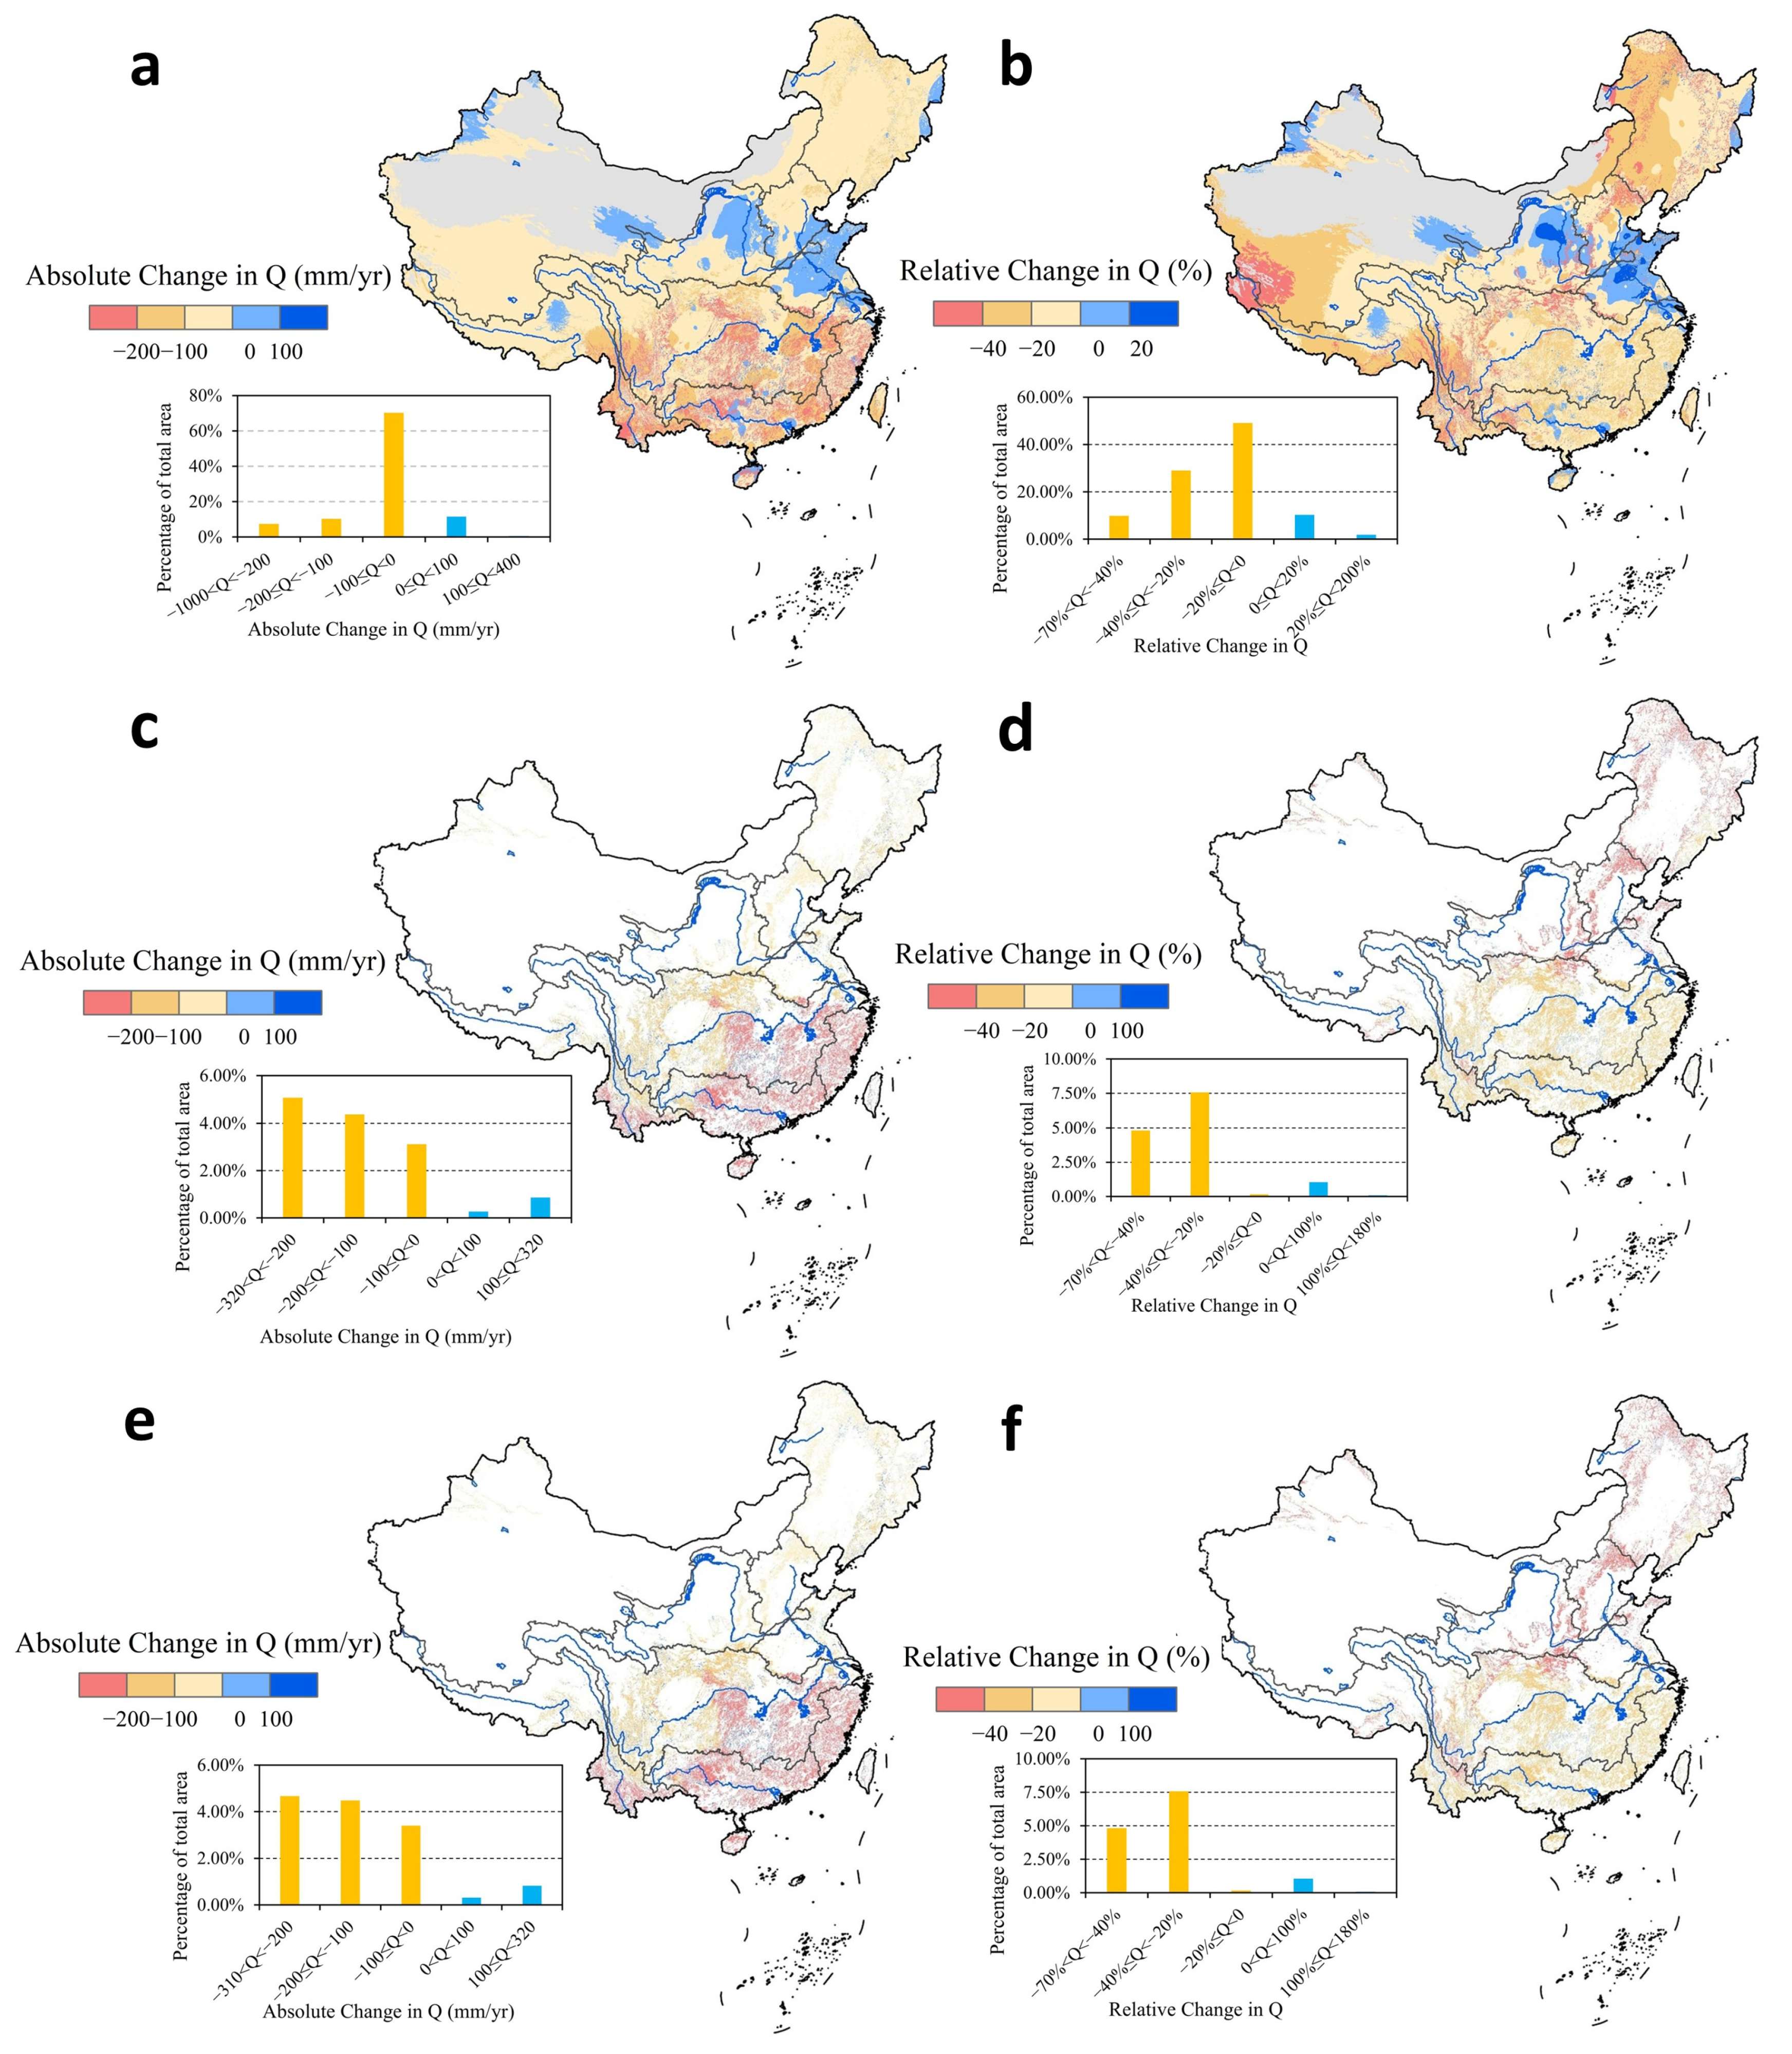
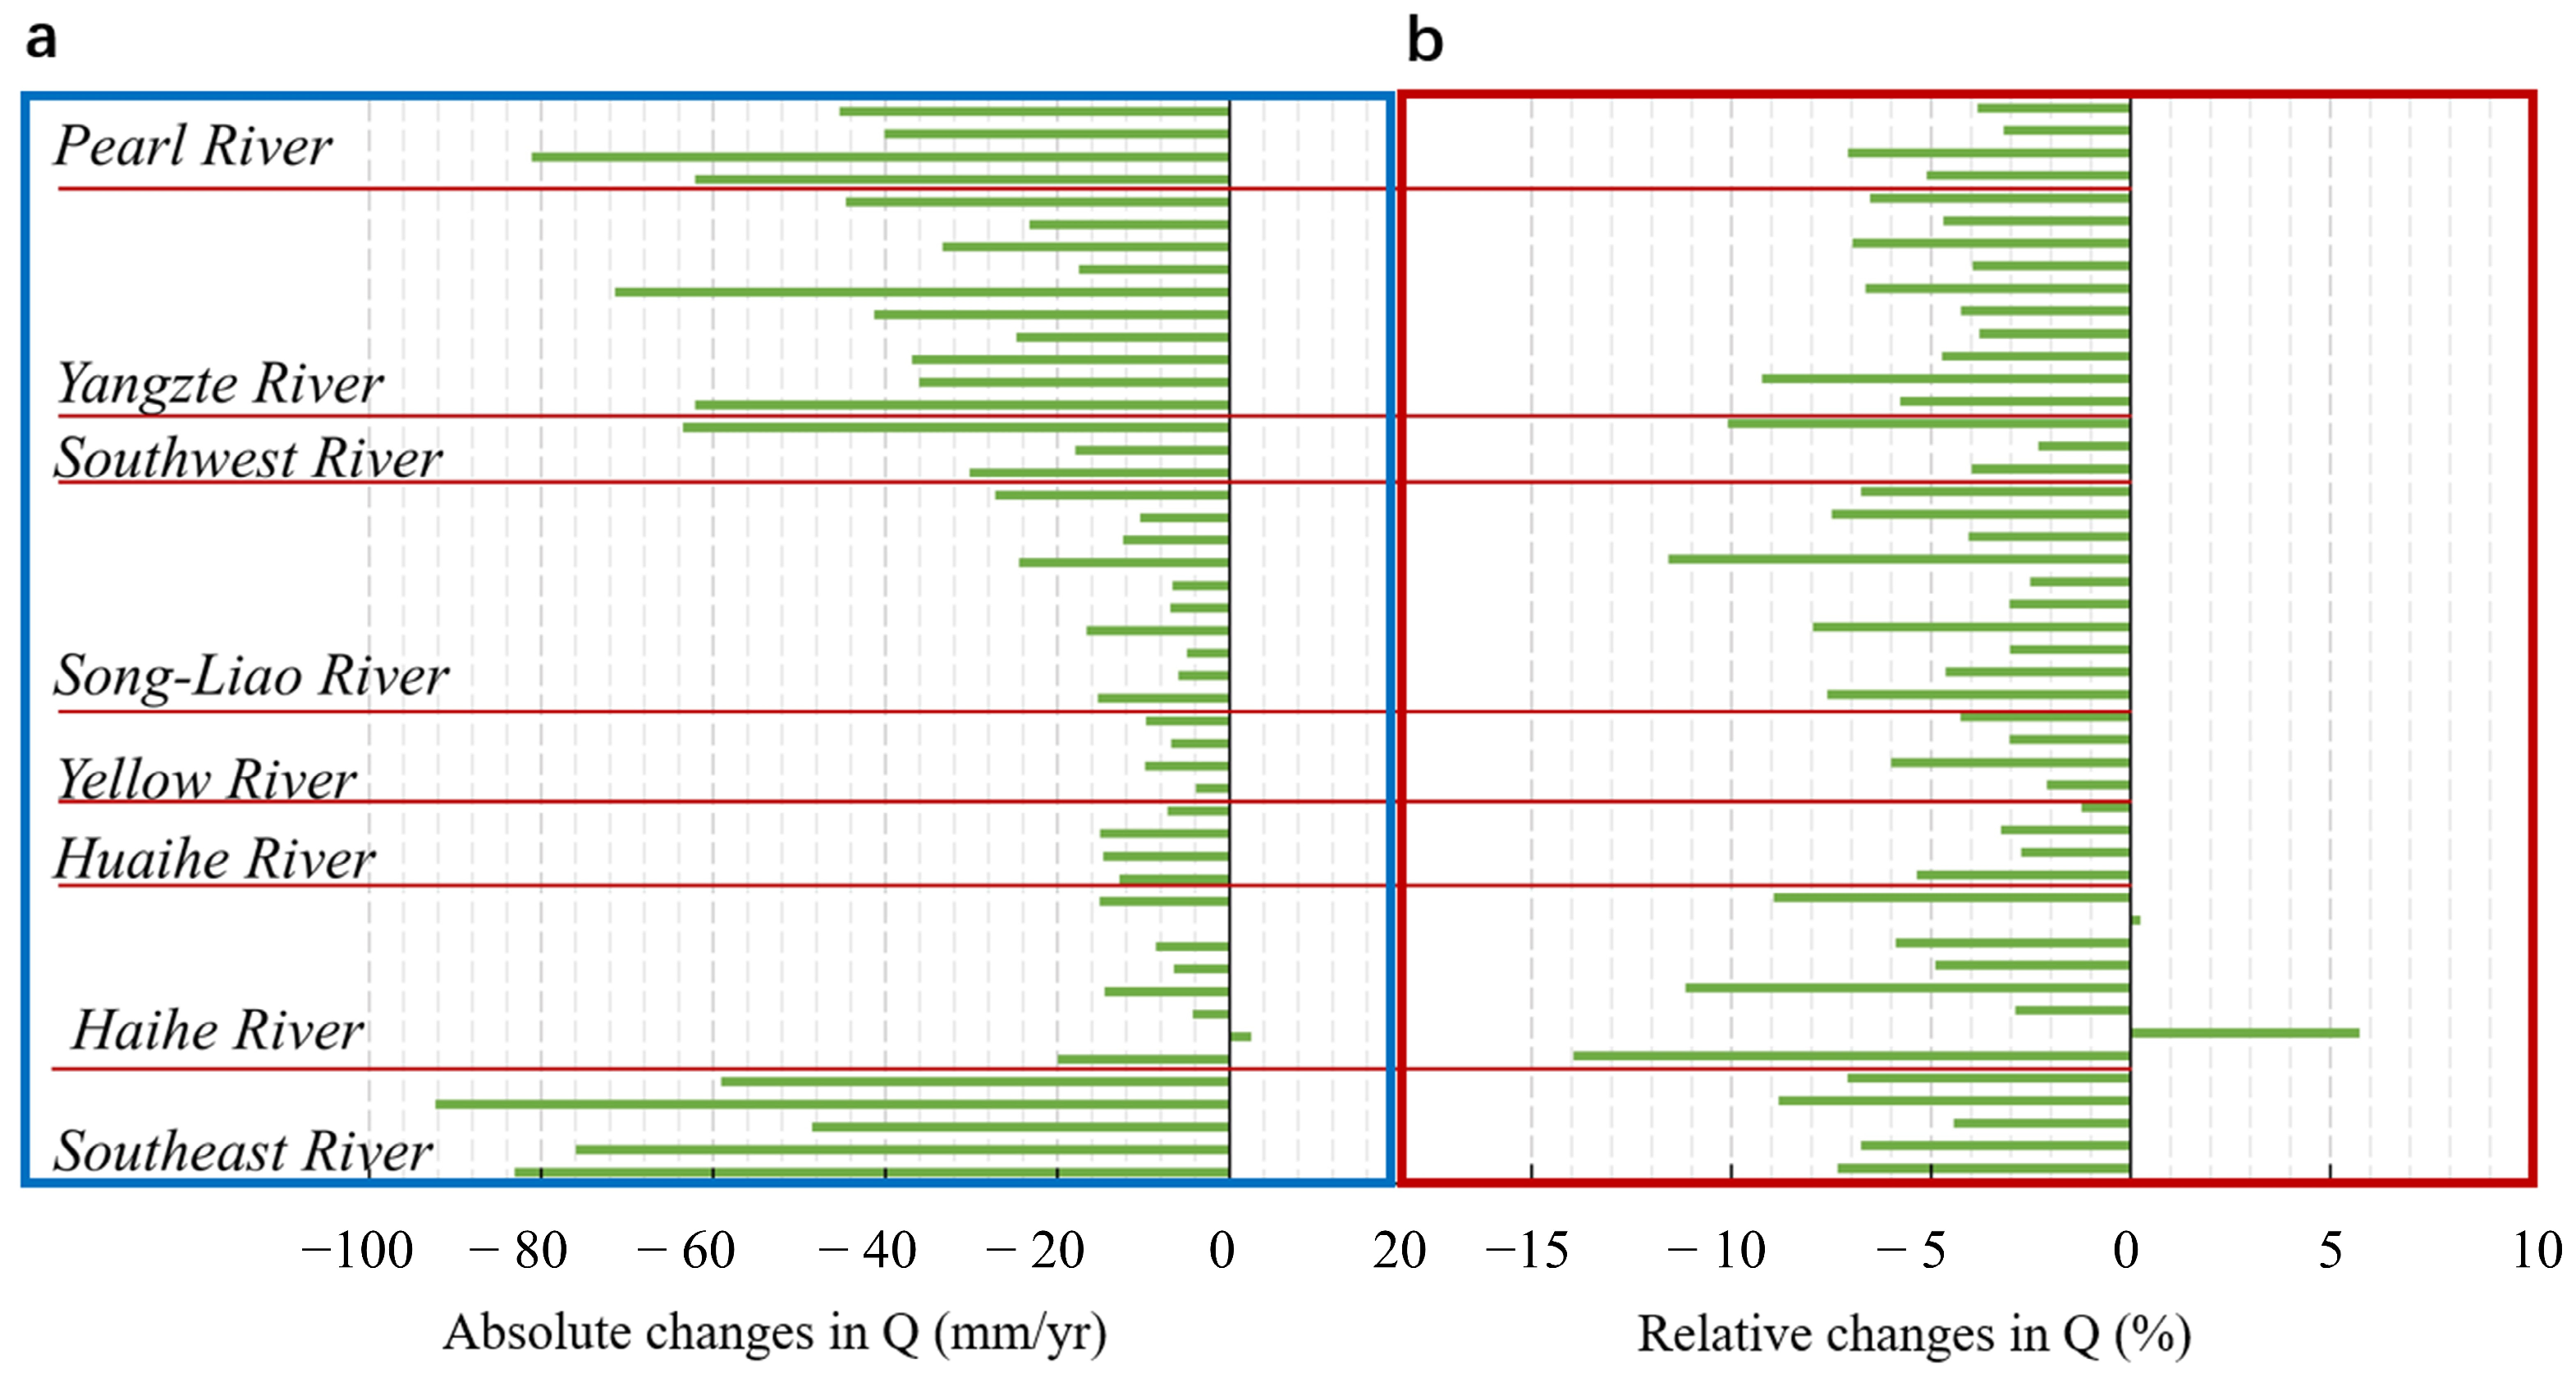
3.2. Absolute and Relative Changes in Water Yield at Gridded Scale

Figure 6 and Figure 7 present the spatial distributions and areal percentage histograms of the absolute/relative water yield changes simulated by the Budyko model. Our analysis reveals a dominant decreasing trend in China’s water yield (Figure 6a,b), with most regions showing absolute reductions of −100 to 0 mm/yr (Figure 6a) and relative declines of −20% to 0% (Figure 6b) over the study period. Limited areas exhibited water yield increases (0–100 mm/yr absolute, 0–20% relative), while severe depletion zones surpassed −200 mm/yr, demonstrating more pronounced hydrological impacts in decreasing regions than in increasing regions.
The vegetation attribution analysis (Figure 6c,e) reveals that although tree cover restoration areas constitute < 20% of the total territory, their hydrological impacts are disproportionately significant. Yangtze River Basin, Southeast River Basin, and Pearl River Basin in Southern China show extreme absolute reductions (>−200 mm/yr) due to tree cover restoration. Conversely, relative changes (Figure 6d,f) peak in water-stressed northern basins (Song-Liao and Haihe River Basins) with > 40% reductions. This suggests that in the northern arid region, the impact of vegetation restoration on absolute reductions in local runoff is not significant, but relative reductions in runoff are significant, which may further exacerbate existing water scarcity.

3.3. Direct Effects of Vegetation-Induced ET on Water Yield in Eight Large Basins

Our analysis reveals that 94% of the monitored secondary watersheds (48 total in eight large basins) exhibited runoff reduction (−217 to 0 mm/yr), with pronounced decreases in southeastern and southwestern China (Figure 7). While climate change dominated runoff variations in most basins, tree cover restoration also contributed to hydrological depletion, accounting for −28 ± 25 mm/yr nationally (Figure 7a). Notably, tree cover restoration reduced runoff in 94% of the basins (mean −30 ± 25 mm/yr). In the Huaihe River Basin, Yellow River Basin, and Song-Liao Basin in northern China, the contribution of tree cover restoration to runoff reduction in some secondary watersheds reaches or even exceeds 50%. These northern basins, despite moderate vegetation recovery, experienced exacerbated water stress due to increased ET in arid and warm conditions. In contrast, the vegetation-rich basins in southern China, such as the Southeast River Basin and the Pearl River Basin, showed intensive runoff reduction due to tree cover restoration exceeding −50 mm/yr, peaking at −92 mm/yr in the Hanjiang River system. In these humid regions, the hydrological impacts of vegetation are masked by concurrent climate-driven reductions.
Generally, the basins where vegetation has a relatively significant impact on the absolute water yield are primarily located in the southern regions, such as the Pearl River Basin, Yangtze River Basin, and southeastern basins (Figure 7a). In contrast to the absolute water yield, the basins where vegetation exerts a relatively greater influence on the relative water yield are mainly northern basins like the Song-liao River Basin and the Haihe River Basin (Figure 7b). This is primarily because the precipitation and water yield in northern basins are inherently lower than in the southern basins. As a result, even though the absolute changes in water yield may not be substantial, the relative changes are more pronounced. This is also why the impact of vegetation in arid and semi-arid regions should be taken more seriously. In addition, the relative water yield was also found in southwestern China, where severe droughts occurred during the study period.
Among the areas with large relative decreases in runoff, the Song-Liao River Basin is influenced by both climate and vegetation, with most of them dominated by climate, but a few basins are dominated by vegetation, such as the Ussuri River system, where vegetation changes contribute to more than 75% of the relative decrease in runoff, and the Suifen River Basin, where the decrease in runoff due to vegetation changes is much greater than the increase in runoff due to climate change. In the southwestern part of the country, where the relative decrease in runoff was also large, the significant relative decrease in runoff was mainly due to climatic effects. In the Haihe River Basin, forestation had a greater relative impact on water yield in the drier climate (Figure 1c,d). Over the last few decades, the significant increase in the leaf area index (LAI) in this basin has led to an increase in ET [57], which, together with the warm-drying climate, has resulted in a significant decrease in relative water yield.

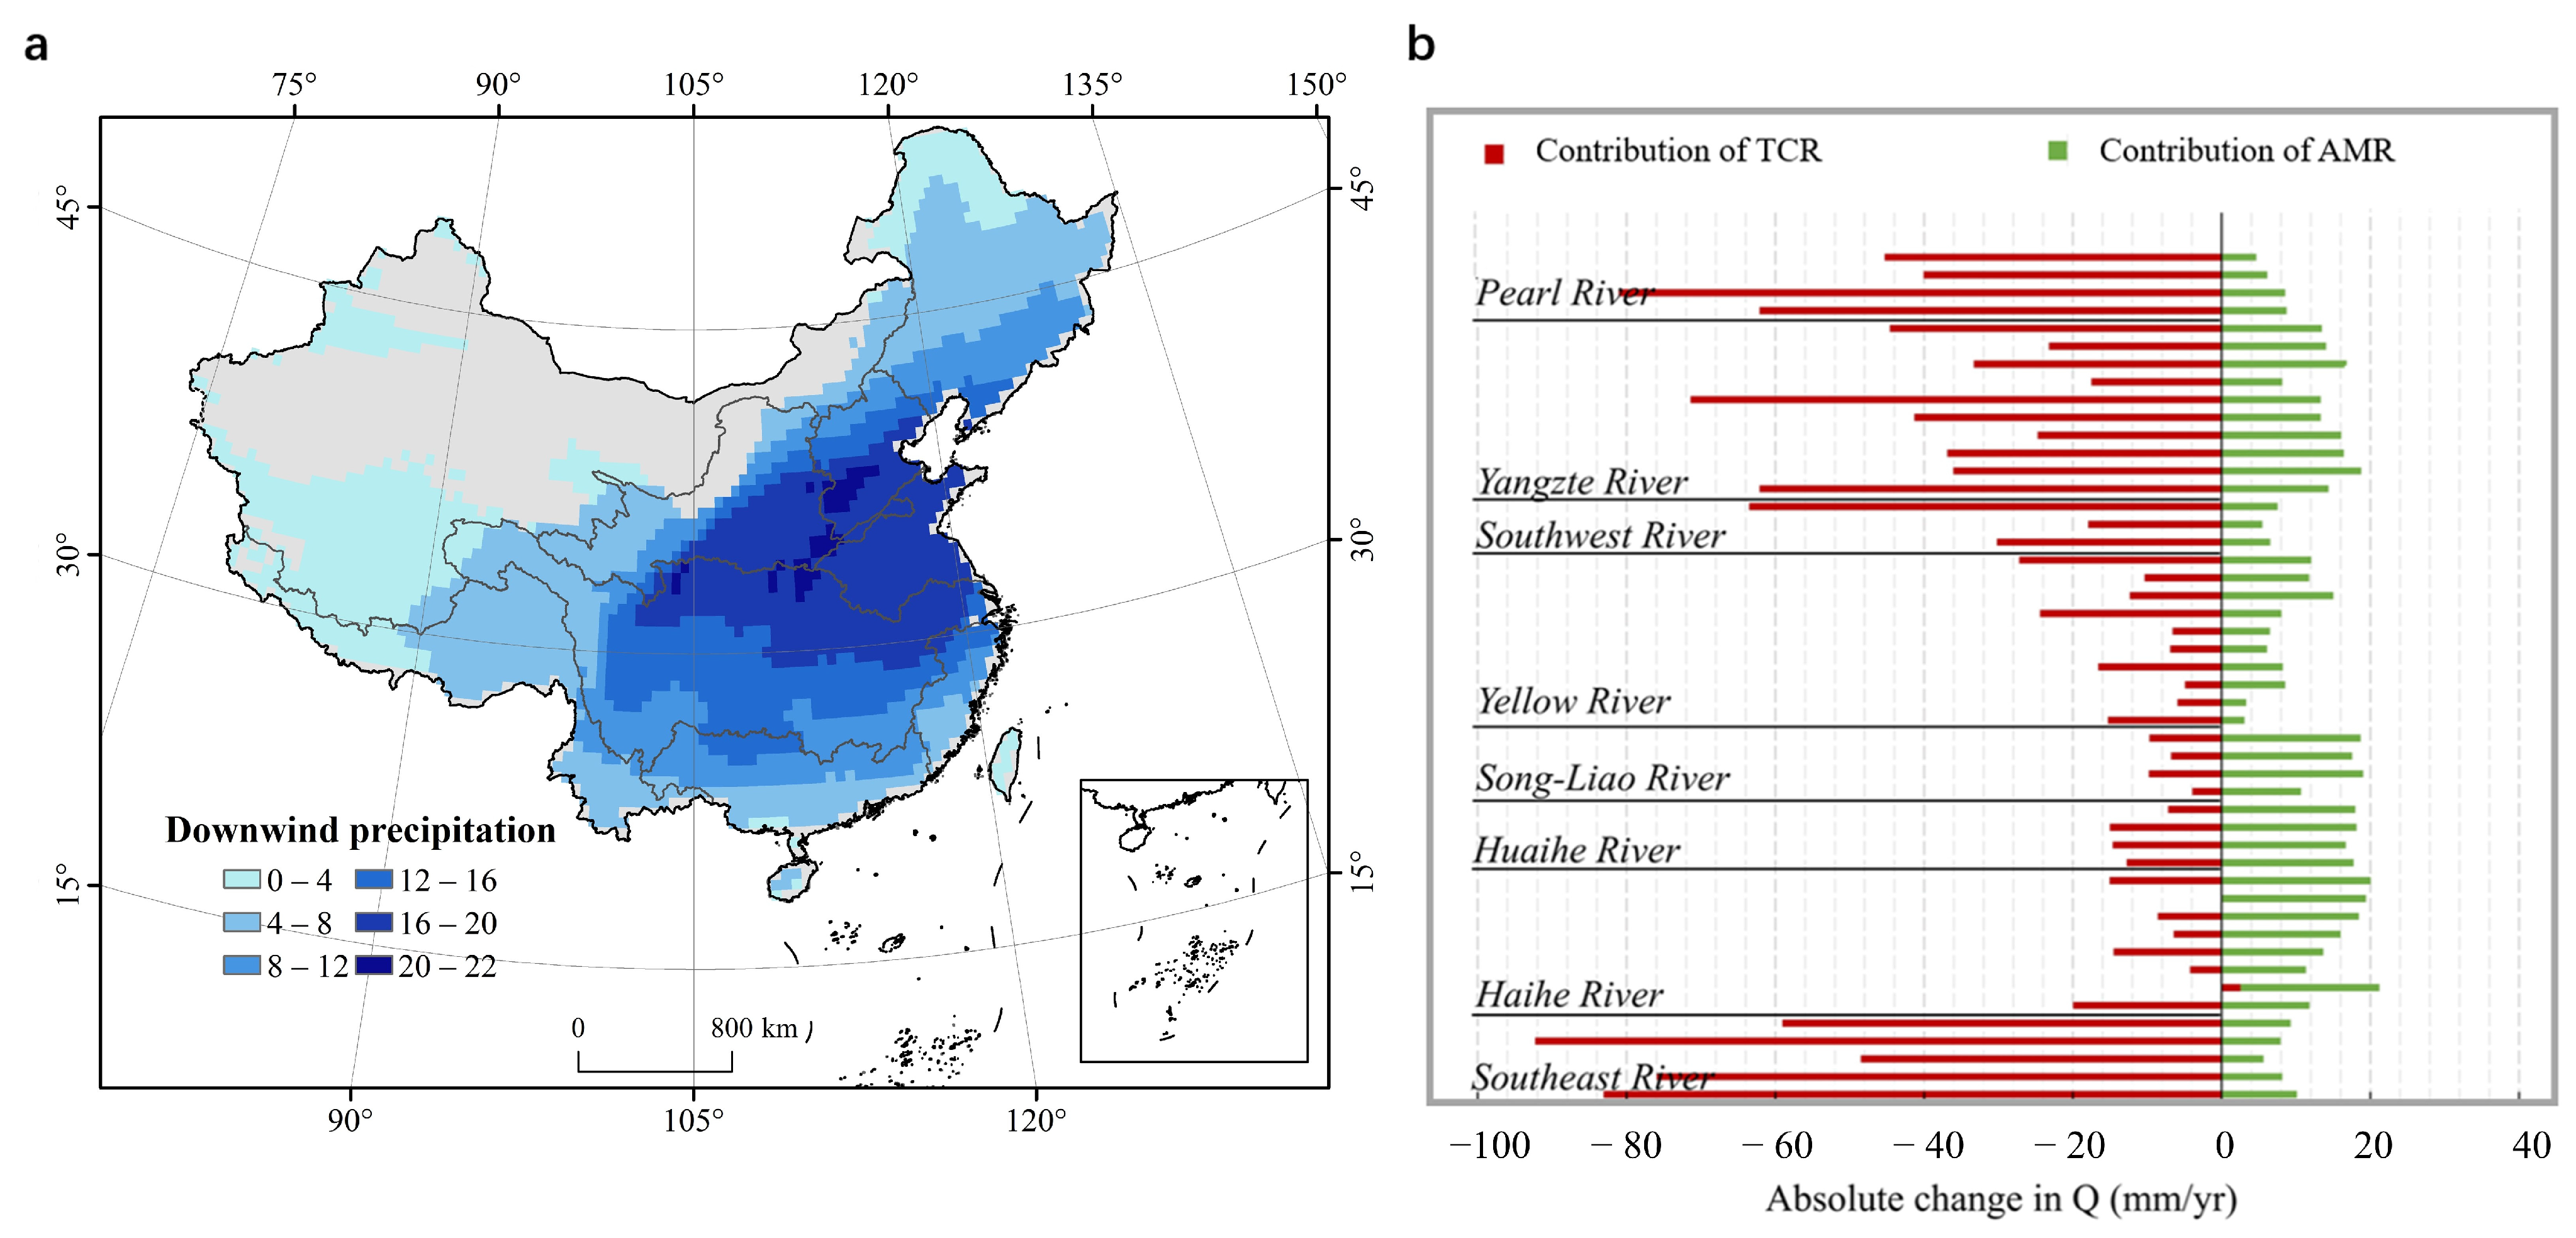
3.4. Indirect Effects of ET Recycling on Water Availability in Eight Large Basins

Figure 8a shows the spatial distribution of mean annual downwind re-precipitation generated by vegetation-enhanced ET. The analysis reveals significant re-precipitation effects across China’s Huai River Basin and major sections of the Haihe, Yellow River, and Yangtze River Basins, with peak values reaching 22 mm/yr (9 ± 6 mm/yr). Figure 8b compares vegetation-induced runoff reduction with hydrological compensation through atmospheric water recycling.
Our findings demonstrate that forest restoration changes from 1980 to 2015 individually caused an annual runoff reduction of −28 ± 25 mm/yr nationwide. However, when accounting for atmospheric moisture recycling from enhanced ET, this water availability depletion shows partial hydrological compensation averaging 12 ± 5 mm/yr (Figure 8b and Figure 9a), resulting in a net vegetation impact of −16 ± 26 mm/yr on water availability changes (Figure 8b and Figure 9a). Particularly notable positive effects are observed in the Huai River Basin and some areas of the Haihe, Yellow, and Yangtze River Basins (Figure 8a). When considering atmospheric moisture recycling, the percentage of secondary basins with negative vegetation contribution to water availability decreased from 94% to 65% (mean mitigation: −30 ± 26 mm/yr). Crucially, tree cover restoration transforms from a runoff-reducing factor to a positive contributor in multiple sub-basins of the Yellow, Huai, and Haihe River Basins through downwind precipitation mechanisms (Figure 8b), demonstrating the important role of atmospheric water cycling in mediating hydrological responses to ecological restoration.
By comparing the direct and indirect contributions of afforestation to changes in water yield (Q) in eight major river basins, we found that after considering atmospheric moisture recycling, the negative contribution of afforestation to runoff changes is significantly alleviated. In some basins, the contribution of afforestation even shifts to positive (Figure 9a), meaning that vegetation increases runoff changes; for example, the direct and indirect contributions are 9 ± 11 mm yr−1 in the Haihe Basin yr−1), 6 ± 7 mm yr−1 in the Yellow River Basin, and 3 ± 12 mm yr−1 in the Huaihe Basin. The afforestation’s contribution to the relative changes in water yield is particularly pronounced in the arid and semi-arid basins of northern China (Figure 9b).

4. Discussion

4.1. Uncertainties and Limitations of Budyko Model and Utrack Dataset

This study employed the Budyko model integrated with forest coverage data to quantify water yield variations across two distinct periods in China, with particular emphasis on isolating the hydrological impacts of the vegetation dynamics. Multiple sources of datasets, including long-term measured runoff and meteorological data, gridded runoff data, and remote sensing forest cover data, were used to drive and validate the Budyko model performance at both grid and basin scales. The validation results demonstrated the satisfactory reliability of the simulation outputs, particularly at larger basin scales, where the model assumptions aligned better with the actual hydrological processes. However, several methodological limitations warrant further attention.
Firstly, the current study mainly focused on the direct impacts of climatic elements and afforestation and has not yet systematically included the hydrological effects of human activities such as water abstraction, irrigation, and reservoir storage. This simplified treatment may affect the accuracy of the simulation results. Secondly, the current parameterization scheme retains static underlying surface parameters without temporal recalibration, potentially introducing uncertainties in long-term simulations. When applied to small watersheds characterized by complex land cover mosaics extending beyond forest-grassland systems and intensive anthropogenic disturbances, the model exhibited a reduced predictive capacity. These discrepancies across spatial scales and geographical regions may be attributed to inherent model structural constraints, suboptimal parameter selection strategies, and incomplete temporal coverage of the validation datasets.
In addition, the heterogeneity of vegetation types and densities is not sufficiently taken into account in the Budyko model parameter settings, and the adoption of a uniform vegetation parameterization scheme may lead to bias in the values of the characteristic parameter w, which may affect the accuracy of the simulation of the water balance. To enhance model robustness and practical applicability, future research directions should prioritize: (1) region-specific optimization of underlying surface parameters through advanced spatial clustering techniques; (2) incorporation of long time series high-resolution remote sensing-based land-use and land cover type into parameterization schemes; and (3) systematic investigation of vegetation-type-specific hydrological responses by combining ecohydrological ground-based observations with high-resolution remote sensing-based ET products, vegetation cover, and type products. Such methodological refinements could substantially improve the Budyko model’s capacity to disentangle coupled natural-anthropogenic drivers of water yield dynamics.
While the UTrack atmospheric water cycle dataset provides a valuable tool for studying atmospheric moisture transport [24], its application in analyzing vegetation cover changes and their impact on downwind water resource availability is subject to several limitations and uncertainties. These include resolution constraints, incomplete representation of vegetation-atmosphere interactions, data integration challenges, and uncertainties in future projections. Addressing these limitations will require enhanced parameterization of vegetation processes, improved data integration techniques, and scenario-based analyses to better capture the complex dynamics of vegetation-climate interactions. Future research should focus on validating the dataset with high-resolution observational data and incorporating advanced modeling approaches to reduce uncertainties and improve its applicability to regional and global studies.

4.2. Implications of Direct Hydrological Effects of Forest Restoration

This modeling study investigated the hydrological consequences of vegetation restoration in China in the context of climate change, revealing complex spatial patterns in water yield dynamics over the past four decades. Nationwide analysis indicates a predominant decline in water yield, with particularly significant reductions observed in southeastern China, where vegetation recovery has been most successful. While climate change emerges as the primary driver of water yield reduction at the national scale, regional assessments demonstrate that vegetation expansion is the dominant factor in decreasing water yield in specific areas, potentially exacerbating local water scarcity crises. These findings align with recent watershed management studies [6], highlighting the critical need for region-specific ecological planning that balances vegetation restoration and hydrological sustainability.
Our findings reveal that vegetation restoration significantly impacts hydrological regimes across both the water-rich south and arid north, although through different mechanisms. The synergistic effects of climate change and enhanced ET from vegetation restoration present critical challenges to conventional water resource management paradigms. In water-stressed regions, ecological restoration may inadvertently intensify water resource competition, suggesting the need for climate-informed vegetation management strategies.
In the context of global climate change and the increasing demand for clean water, forest resources, and other natural resources, it is important to understand and evaluate forest-water supply functions to guide regional afforestation and ecological restoration efforts [2,58,59]. Our study is consistent with previous research that indicated that in humid South China, water resources are relatively abundant, forest-induced water consumption is not a primary concern, and conflicts with human water use are low; thus, it is suitable for large-scale afforestation that can maximize forest carbon sequestration functions [22]. However, in arid Northwest China, where water is scarce, large-scale afforestation with high-density plantations may not be suitable, whereas shrub and grass vegetation types that require less water should be given full consideration [60].

4.3. Implications of Indirect Hydrological Effects of Tree Cover Restoration

When considering the role of atmospheric moisture recycling, the enhanced ET resulting from vegetation expansion can partially replenish the precipitation in downwind regions. This hydrological compensation mechanism effectively offsets the streamflow reduction effect induced by vegetation growth, thereby mitigating the negative impact of vegetation expansion on watershed runoff. Although increased ET associated with vegetation expansion generally reduces local water yields across most regions, the atmospheric recycling of this moisture generates downwind precipitation benefits. Our findings reveal a counterbalancing mechanism: vegetation expansion generates positive hydrological feedback in relatively arid basins through the redistribution of moisture. This teleconnection mechanism highlights the drought mitigation potential of ecological restoration, which is particularly evident in arid zones such as the Yellow River Basin. This dual effect underscores the necessity of spatially differentiated ecological restoration policies to ensure water resource sustainability [11,61]. Here, afforestation initiatives demonstrate the potential capacity to alleviate regional aridity through moisture redistribution, providing critical insights for evaluating the ecohydrological efficacy of large-scale greening programs.
It is worth noting that although our study found that the amount of water provided by the evaporative cycle may partially compensate for the water lost through vegetation ET, as our modeling studies have shown, the effect of large-scale afforestation on altering watershed water yield is significant. In some areas of large-scale forest restoration in southern China, where increased vegetation ET leads to a significant reduction in annual water yield, the increase in precipitation provided by the ET cycle may only partially offset the high rate of water loss in areas with high tree restoration; that is, the offset is limited. However, in arid Northwest China, where water shortages are prevalent, the offsetting effect may be more pronounced and important. In summary, the interactions between the vegetation-climate-water nexus are complex, and some of the effects are not included in our current model.

5. Conclusions

This study integrated the Budyko model and the UTrack moisture recycling dataset to quantify the direct and indirect effects of large-scale tree cover restoration on water yield in major river basins in China over the past 40 years. The presented scenario analyses suggest that while climate change dominated runoff variations in most basins, large-scale afforestation also contributed to hydrological depletion, accounting for −28 ± 25 mm/yr nationally. Notably, tree cover restoration reduced runoff in 94% of the basins. We confirmed that large-scale forest restoration in China has increased ET over the past four decades, thereby reducing local water resources and lowering streamflow (direct effect). In some areas already facing water scarcity, such reforestation programs may further reduce annual water supplies.
In contrast, we also found that the atmospheric moisture cycling mechanisms reduced water loss by 12 ± 5 mm yr−1 across the country, with significant spatial differences across river basins. In some moisture-constrained basins of the Yellow River Basin, the precipitation cycle compensated to some extent for the negative effect of ET, showing a net positive hydrological result. Evidence from this study suggests the existence of compensatory mechanisms, i.e., enhanced atmospheric water cycling (indirect effect) can produce precipitation feedback that partially mitigates the negative hydrological impacts of afforestation.
The findings of this study advance the mechanistic understanding of the vegetation-climate-water nexus, providing quantitative benchmarks for optimizing afforestation strategies under atmospheric water connectivity constraints, as well as a scientific basis for assessing the ecohydrological trade-off effects of afforestation and for guiding site-specific ecological restoration and water resource management.

Supplementary Materials

The following supporting information can be downloaded at: https://www.mdpi.com/article/10.3390/rs17091581/s1, Table S1: Meteorological data and land cover data used in this study; Table S2: Runoff dataset used in this study. All references in the supplementary file can be found at [29,39,40,41,42,43,56,62,63,64,65,66,67,68,69,70,71,72].

Author Contributions

Conceptualization, L.H.; Data curation, Y.Z.; Formal analysis, Y.Z.; Funding acquisition, L.H.; Methodology, Y.Z.; Project administration, L.H.; Software, Y.Z.; Supervision, L.H.; Validation, Y.Z.; Writing—original draft, Y.Z. and L.H.; Writing—review and editing, Y.Z. and L.H. All authors have read and agreed to the published version of the manuscript.

Funding

This research was supported by the National Natural Science Foundation of China (grants 42061144004 and 41877151; principal investigator: Lu Hao, NUIST).

Data Availability Statement

The original contributions presented in the study are included in the article/Supplementary Material, further inquiries can be directed to the corresponding author.

Conflicts of Interest

The authors declare that they have no known competing financial interests or personal relationships that could have influenced the work reported in this paper.

References

  1. Chen, S.; Tian, L.; Zhang, B.; Zhang, G.; Zhang, F.; Yang, K.; Wang, X.; Bai, Y.; Pan, B. Quantifying the Impact of Large-Scale Afforestation on the Atmospheric Water Cycle during Rainy Season over the Chinese Loess Plateau. J. Hydrol. 2023, 619, 129326. [Google Scholar] [CrossRef]
  2. Chen, C.; Park, T.; Wang, X.; Piao, S.; Xu, B.; Chaturvedi, R.K.; Fuchs, R.; Brovkin, V.; Ciais, P.; Fensholt, R.; et al. China and India Lead in Greening of the World through Land-Use Management. Nat. Sustain. 2019, 2, 122–129. [Google Scholar] [CrossRef]
  3. Bryan, B.A.; Gao, L.; Ye, Y.; Sun, X.; Connor, J.D.; Crossman, N.D.; Stafford-Smith, M.; Wu, J.; He, C.; Yu, D.; et al. China’s Response to a National Land-System Sustainability Emergency. Nature 2018, 559, 193–204. [Google Scholar] [CrossRef] [PubMed]
  4. Bastin, J.-F.; Finegold, Y.; Garcia, C.; Mollicone, D.; Rezende, M.; Routh, D.; Zohner, C.M.; Crowther, T.W. The Global Tree Restoration Potential. Science 2019, 365, 76–79. [Google Scholar] [CrossRef]
  5. Yu, Z.; Ciais, P.; Piao, S.; Houghton, R.A.; Lu, C.; Tian, H.; Agathokleous, E.; Kattel, G.R.; Sitch, S.; Goll, D.; et al. Forest Expansion Dominates China’s Land Carbon Sink since 1980. Nat. Commun. 2022, 13, 5374. [Google Scholar] [CrossRef] [PubMed]
  6. Sun, G.; Zhang, L.; Wang, Y. On accurately defining and quantifying the water retention services of forests. Acta Ecol. Sin. 2023, 43, 9–25. [Google Scholar]
  7. Feng, X.; Fu, B.; Piao, S.; Wang, S.; Ciais, P.; Zeng, Z.; Lü, Y.; Zeng, Y.; Li, Y.; Jiang, X.; et al. Revegetation in China’s Loess Plateau Is Approaching Sustainable Water Resource Limits. Nat. Clim. Change 2016, 6, 1019–1022. [Google Scholar] [CrossRef]
  8. Lü, Y.; Fu, B.; Feng, X.; Zeng, Y.; Liu, Y.; Chang, R.; Sun, G.; Wu, B. A Policy-Driven Large Scale Ecological Restoration: Quantifying Ecosystem Services Changes in the Loess Plateau of China. PLoS ONE 2012, 7, e31782. [Google Scholar] [CrossRef]
  9. Hu, Y.; Wei, F.; Fu, B.; Zhang, W.; Sun, C. Ecosystems in China Have Become More Sensitive to Changes in Water Demand since 2001. Commun. Earth Environ. 2023, 4, 444. [Google Scholar] [CrossRef]
  10. Liang, X.; Xin, Z.; Shen, H.; Yan, T. Deep Soil Water Deficit Causes Populus Simonii Carr Degradation in the Three North Shelterbelt Region of China. J. Hydrol. 2022, 612, 128201. [Google Scholar] [CrossRef]
  11. Andréassian, V. Waters and Forests: From Historical Controversy to Scientific Debate. J. Hydrol. 2004, 291, 1–27. [Google Scholar] [CrossRef]
  12. Calder, I.R.; Smyle, J.; Aylward, B. Debate over Flood-Proofing Effects of Planting Forests. Nature 2007, 450, 945. [Google Scholar] [CrossRef] [PubMed]
  13. Laurance, W.F. Forests and Floods. Nature 2007, 449, 409–410. [Google Scholar] [CrossRef]
  14. Sun, G.; Zhou, G.; Zhang, Z.; Wei, X.; McNulty, S.G.; Vose, J.M. Potential Water Yield Reduction Due to Forestation across China. J. Hydrol. 2006, 328, 548–558. [Google Scholar] [CrossRef]
  15. Wei, X.; Sun, G. Watershed Ecosystem Processes and Management; Higher Education Press: Beijing, China, 2009. [Google Scholar]
  16. Lawrence, D.; Vandecar, K. Erratum: Effects of Tropical Deforestation on Climate and Agriculture. Nat. Clim. Change 2015, 5, 174. [Google Scholar] [CrossRef]
  17. Spracklen, D.V.; Baker, J.C.A.; Garcia-Carreras, L.; Marsham, J.H.Y. The Effects of Tropical Vegetation on Rainfall. Annu. Rev. Environ. Resour. 2018, 43, 193–218. [Google Scholar] [CrossRef]
  18. Ellison, D.; Futter, M.N.; Bishop, K.H. On the Forest Cover–Water Yield Debate: From Demand- to Supply-Side Thinking. Glob. Change Biol. 2012, 18, 806–820. [Google Scholar] [CrossRef]
  19. Brown, A.E.; Zhang, L.; McMahon, T.A.; Western, A.W.; Vertessy, R.A. A Review of Paired Catchment Studies for Determining Changes in Water Yield Resulting from Alterations in Vegetation. J. Hydrol. 2005, 310, 28–61. [Google Scholar] [CrossRef]
  20. Hua, F.Y.; Bruijnzeel, L.A.; Meli, P.; Martin, P.A.; Zhang, J.; Nakagawa, S.; Miao, X.; Wang, W.; McEvoy, C.; Pena-Arancibia, J.L.; et al. The biodiversity and ecosystem service contributions and trade-offs of forest restoration approaches. Science 2022, 376, 839–844. [Google Scholar] [CrossRef]
  21. Sun, G.; Alstad, K.P.; Chen, J.; Chen, S.; Ford, C.R.F.R.; Lin, G.; Liu, C.; Lu, N.; McNulty, S.G.; Miao, H.-T.; et al. A General Predictive Model for Estimating Monthly Ecosystem Evapotranspiration. Ecohydrology 2011, 4, 245–255. [Google Scholar] [CrossRef]
  22. Zhou, G.; Wei, X.; Chen, X.; Zhou, P.; Liu, X.; Xiao, Y.; Sun, G.; Scott, D.F.; Zhou, S.; Han, L.; et al. Global Pattern for the Effect of Climate and Land Cover on Water Yield. Nat. Commun. 2015, 6, 5918. [Google Scholar] [CrossRef] [PubMed]
  23. Creed, I.F.; van Noordwijk, M. Forest and Water on a Changing Planet: Vulnerability, Adaptation and Governance Opportunities: A Global Assessment Report; International Union of Forest Research Organizations (IUFRO): Vienna, Austria, 2018. [Google Scholar]
  24. Hoek van Dijke, A.J.; Herold, M.; Mallick, K.; Benedict, I.; Machwitz, M.; Schlerf, M.; Pranindita, A.; Theeuwen, J.J.E.; Bastin, J.-F.; Teuling, A.J. Shifts in Regional Water Availability Due to Global Tree Restoration. Nat. Geosci. 2022, 15, 363–368. [Google Scholar] [CrossRef]
  25. Ellison, D.; Morris, C.E.; Locatelli, B.; Sheil, D.; Cohen, J.; Murdiyarso, D.; Gutierrez, V.; van Noordwijk, M.; Creed, I.F.; Pokorny, J.; et al. Trees, Forests and Water: Cool Insights for a Hot World. Glob. Environ. Change 2017, 43, 51–61. [Google Scholar] [CrossRef]
  26. Zhao, D.; Wang, K.; Cui, Y. Feedback mechanisms and regulatory effects of vegetation change on climate. Acta Ecologica Sinica 2023, 43, 7830–7840. [Google Scholar] [CrossRef]
  27. Cui, J.; Lian, X.; Huntingford, C.; Gimeno, L.; Wang, T.; Ding, J.; He, M.; Xu, H.; Chen, A.; Gentine, P.; et al. Global Water Availability Boosted by Vegetation-Driven Changes in Atmospheric Moisture Transport. Nat. Geosci. 2022, 15, 982–988. [Google Scholar] [CrossRef]
  28. Li, Y.; Xu, R.; Yang, K.; Liu, Y.; Wang, S.; Zhou, S.; Yang, Z.; Feng, X.; He, C.; Xu, Z.; et al. Contribution of Tibetan Plateau Ecosystems to Local and Remote Precipitation through Moisture Recycling. Glob. Change Biol. 2023, 29, 702–718. [Google Scholar] [CrossRef]
  29. Li, Y.; Piao, S.; Li, L.Z.X.; Chen, A.; Wang, X.; Ciais, P.; Huang, L.; Lian, X.; Peng, S.; Zeng, Z.; et al. Divergent Hydrological Response to Large-Scale Afforestation and Vegetation Greening in China. Sci. Adv. 2018, 4, eaar4182. [Google Scholar] [CrossRef]
  30. Ma, S.; Zhou, S.; Yu, B.; Song, J. Deforestation-Induced Runoff Changes Dominated by Forest-Climate Feedbacks. Sci. Adv. 2024, 10, eadp3964. [Google Scholar] [CrossRef]
  31. Tian, L.; Zhang, B.; Chen, S.; Wang, X.; Ma, X.; Pan, B. Large-Scale Afforestation Enhances Precipitation by Intensifying the Atmospheric Water Cycle Over the Chinese Loess Plateau. J. Geophys. Res. Atmos. 2022, 127, e2022JD036738. [Google Scholar] [CrossRef]
  32. Wang, Y.; Liu, X.; Zhang, D.; Bai, P. Tracking Moisture Sources of Precipitation Over China. J. Geophys. Res. Atmos. 2023, 128, e2023JD039106. [Google Scholar] [CrossRef]
  33. Peng, S.-S.; Piao, S.; Zeng, Z.; Ciais, P.; Zhou, L.; Li, L.Z.X.; Myneni, R.B.; Yin, Y.; Zeng, H. Afforestation in China Cools Local Land Surface Temperature. Proc. Natl. Acad. Sci. USA 2014, 111, 2915–2919. [Google Scholar] [CrossRef] [PubMed]
  34. Li, Y.; Piao, S.; Chen, A.; Ciais, P.; Li, L.Z.X. Local and Teleconnected Temperature Effects of Afforestation and Vegetation Greening in China. Natl. Sci. Rev. 2019, 7, 897–912. [Google Scholar] [CrossRef] [PubMed]
  35. Teo, H.C.; Raghavan, S.V.; He, X.; Zeng, Z.; Cheng, Y.; Luo, X.; Lechner, A.M.; Ashfold, M.J.; Lamba, A.; Rachakonda, S.; et al. Large-scale Reforestation Can Increase Water Yield and Reduce Drought Risk for Water-insecure Regions in the Asia-Pacific. Glob. Change Biol. 2022, 28, 6385–6403. [Google Scholar] [CrossRef]
  36. Suratman, M.N.; Abd Latiff, Z.; Tengku Hashim, T.M.Z.; Mohsin, A.F.; Asari, N.; Mohd Zaki, N.A. Remote Sensing for Forest Inventory and Resource Assessment. In Concepts and Applications of Remote Sensing in Forestry; Suratman, M.N., Ed.; Springer: Singapore, 2022. [Google Scholar] [CrossRef]
  37. Xiao, J. Satellite evidence for significant biophysical consequences of the “Grain for Green” Program on the Loess Plateau in China. J. Geophys. Res. Biogeosci. 2014, 119, 2261–2275. [Google Scholar] [CrossRef]
  38. Zhang, B.; Wu, Y.F.; Zhao, B.Y.; Chanussotm, J.; Hong, D.; Yao, J.; Gao, L. Progress and Challenges in Intelligent Remote Sensing Satellite Systems. IEEE J. Sel. Top. Appl. Earth Obs. Remote Sens. 2022, 15, 1814–1822. [Google Scholar] [CrossRef]
  39. Xia, X.; Xia, J.; Chen, X.; Fan, L.; Liu, S.; Qin, Y.; Qin, Z.; Xiao, X.; Xu, W.; Yue, C.; et al. Reconstructing Long-Term Forest Cover in China by Fusing National Forest Inventory and 20 Land Use and Land Cover Data Sets. J. Geophys. Res. Biogeosci. 2023, 128, e2022JG007101. [Google Scholar] [CrossRef]
  40. Lisha, Q.; Qiuan, Z.; Chaofan, Z.; Jiang, Z. Monthly Precipitation Data Set with 1 km Resolution in China from 1960 to 2020 2022. Available online: https://cstr.cn/31253.11.sciencedb.01607 (accessed on 1 January 2025).
  41. Peng, S. 1-km Monthly Potential Evapotranspiration Dataset for China (1901-2023). National Tibetan Plateau Data Center. 2024. Available online: https://www.tpdc.ac.cn/zh-hans/data/8b11da09-1a40-4014-bd3d-2b86e6dccad4 (accessed on 1 January 2025).
  42. Gou, J.; Miao, C.; Samaniego, L.; Xiao, M.; Wu, J.; Guo, X. CNRD v1.0: A High-Quality Natural Runoff Dataset for Hydrological and Climate Studies in China. Bull. Am. Meteorol. Soc. 2021, 102, E929–E947. [Google Scholar] [CrossRef]
  43. Tuinenburg, O.A.; Theeuwen, J.J.E.; Staal, A. High-Resolution Global Atmospheric Moisture Connections from Evaporation to Precipitation. Earth Syst. Sci. Data 2020, 12, 3177–3188. [Google Scholar] [CrossRef]
  44. Budyko, M.I. Climate and Life, Xvii; Academic Press: New York, NY, USA, 1974. [Google Scholar]
  45. Zhang, L.; Hickel, K.; Dawes, W.R.; Chiew, F.H.S.; Western, A.W.; Briggs, P.R. A Rational Function Approach for Estimating Mean Annual Evapotranspiration. Water Resour. Res. 2004, 40, W02502. [Google Scholar] [CrossRef]
  46. Zhou, G.; Xia, J.; Zhou, P.; Shi, T.; Li, L. Not Vegetation Itself but Mis-Revegetation Reduces Water Resources. Sci. China Earth Sci. 2021, 64, 404–411. [Google Scholar] [CrossRef]
  47. Zhang, L.; Dawes, W.R.; Walker, G.R. Response of Mean Annual Evapotranspiration to Vegetation Changes at Catchment Scale. Water Resour. Res. 2001, 37, 701–708. [Google Scholar] [CrossRef]
  48. Zhang, L.; Potter, N.; Hickel, K.; Zhang, Y.; Shao, Q. Water Balance Modeling over Variable Time Scales Based on the Budyko Framework—Model Development and Testing. J. Hydrol. 2008, 360, 117–131. [Google Scholar] [CrossRef]
  49. Gan, G.; Liu, Y.; Sun, G. Understanding Interactions among Climate, Water, and Vegetation with the Budyko Framework. Earth-Sci. Rev. 2021, 212, 103451. [Google Scholar] [CrossRef]
  50. Liu, J.; You, Y.; Zhang, Q.; Gu, X. Attribution of Streamflow Changes across the Globe Based on the Budyko Framework. Sci. Total Environ. 2021, 794, 148662. [Google Scholar] [CrossRef]
  51. Xu, X.; Yang, D.; Yang, H.; Lei, H. Attribution Analysis Based on the Budyko Hypothesis for Detecting the Dominant Cause of Runoff Decline in Haihe Basin. J. Hydrol. 2014, 510, 530–540. [Google Scholar] [CrossRef]
  52. Shen, Q.; Cong, Z.; Lei, H. Evaluating the Impact of Climate and Underlying Surface Change on Runoff within the Budyko Framework: A Study across 224 Catchments in China. J. Hydrol. 2017, 554, 251–262. [Google Scholar] [CrossRef]
  53. Engel, F.; van Dijke, A.J.H.; Roebroek, C.T.J.; Benedict, I. Can Large-Scale Tree Cover Change Negate Climate Change Impacts on Future Water Availability? EGUsphere 2024, 2024, 313. [Google Scholar] [CrossRef]
  54. Yang, H.; Yang, D.; Lei, Z.; Sun, F. New analytical derivation of the mean annual water-energy balance equation. Water Resour. Res. 2008, 44, W03410. [Google Scholar] [CrossRef]
  55. Donohue, R.J.; Roderick, M.L.; McVicar, T.R. Roots, storms and soil pores: Incorporating key ecohydrological processes into Budyko’s hydrological model. J. Hydrol. 2012, 436–437, 35–50. [Google Scholar] [CrossRef]
  56. Sun, S.; Liu, Y.; Chen, H.; Ju, W.; Xu, C.-Y.; Liu, Y.; Zhou, B.; Zhou, Y.; Zhou, Y.; Yu, M. Causes for the Increases in Both Evapotranspiration and Water Yield over Vegetated Mainland China during the Last Two Decades. Agric. For. Meteorol. 2022, 324, 109118. [Google Scholar] [CrossRef]
  57. Ma, T.; Wang, T.H.; Yang, D.W.; Yang, S.Y. Impacts of vegetation restoration on water resources and carbon sequestration in the mountainous area of Haihe River basin, China. Sci. Total Environ. 2023, 869, 161724. [Google Scholar] [CrossRef]
  58. Palmer, M.A.; Liu, J.; Matthews, J.H.; Mumba, M.; D’Odorico, P. Manage Water in a Green Way. Science 2015, 349, 584–585. [Google Scholar] [CrossRef]
  59. Sun, G.; Vose, J.M. Forest Management Challenges for Sustaining Water Resources in the Anthropocene. Forests 2016, 7, 68. [Google Scholar] [CrossRef]
  60. Sun, G.; Hallema, D.W.; Asbjornsen, H. Ecohydrological Processes and Ecosystem Services in the Anthropocene: A Review. Ecol. Process. 2017, 6, 35. [Google Scholar] [CrossRef]
  61. Wei, X.; Sun, G.; Liu, S.; Jiang, H.; Zhou, G.; Dai, L. The Forest-Streamflow Relationship in China: A 40-Year Retrospect1. JAWRA J. Am. Water Resour. Assoc. 2008, 44, 1076–1085. [Google Scholar] [CrossRef]
  62. Miao, C.; Gou, J.; Fu, B.; Tang, Q.; Duan, Q.; Chen, Z.; Lei, H.; Chen, J.; Guo, J.; Borthwick, A.G.L.; et al. High-Quality Reconstruction of China’s Natural Streamflow. Sci. Bull. 2022, 67, 547–556. [Google Scholar] [CrossRef] [PubMed]
  63. Tan, X.; Jia, Y.; Yang, D.; Niu, C.; Hao, C. Impact Ways and Their Contributions to Vegetation-Induced Runoff Changes in the Loess Plateau. J. Hydrol. Reg. Stud. 2024, 51, 101630. [Google Scholar] [CrossRef]
  64. Cai, L.; Chen, X.; Huang, R.; Smettem, K. Runoff Change Induced by Vegetation Recovery and Climate Change over Carbonate and Non-Carbonate Areas in the Karst Region of South-West China. J. Hydrol. 2022, 604, 127231. [Google Scholar] [CrossRef]
  65. Zhang, Y.; You, Q.; Chen, C.; Ge, J. Impacts of Climate Change on Streamflows under RCP Scenarios: A Case Study in Xin River Basin, China. Atmos. Res. 2016, 178–179, 521–534. [Google Scholar] [CrossRef]
  66. Ye, X.; Xu, C.-Y.; Zhang, Z. Comprehensive Analysis on the Evolution Characteristics and Causes of River Runoff and Sediment Load in a Mountainous Basin of China’s Subtropical Plateau. J. Hydrol. 2020, 591, 125597. [Google Scholar] [CrossRef]
  67. Song, W.; Jiang, Y.; Lei, X.; Wang, H.; Shu, D. Annual Runoff and Flood Regime Trend Analysis and the Relation with Reservoirs in the Sanchahe River Basin, China. Quat. Int. 2015, 380–381, 197–206. [Google Scholar] [CrossRef]
  68. Huang, X.; Qiu, L. Analysis of Runoff Variation and Driving Mechanism in Huangfuchuan River Basin in the Middle Reaches of the Yellow River, China. Appl. Water Sci. 2022, 12, 234. [Google Scholar] [CrossRef]
  69. Bo, H.; Dong, X.; Li, Z.; Hu, X.; Reta, G.; Wei, C.; Su, B. Impacts of Climate Change and Human Activities on Runoff Variation of the Intensive Phosphate Mined Huangbaihe River Basin, China. Water 2019, 11, 2039. [Google Scholar] [CrossRef]
  70. Zhao, L.; He, Y.; Liu, W. Attribution of Runoff Changes in the Danjiang River Basin in the Qinba Mountains, China. Front. For. Glob. Change 2023, 6, 1187515. [Google Scholar] [CrossRef]
  71. Mo, C.; Lai, S.; Yang, Q.; Huang, K.; Lei, X.; Yang, L.; Yan, Z.; Jiang, C. A Comprehensive Assessment of Runoff Dynamics in Response to Climate Change and Human Activities in a Typical Karst Watershed, Southwest China. J. Environ. Manag. 2023, 332, 117380. [Google Scholar] [CrossRef]
  72. Wang, H.; Lv, X.; Zhang, M. Sensitivity and Attribution Analysis Based on the Budyko Hypothesis for Streamflow Change in the Baiyangdian Catchment, China. Ecol. Indic. 2021, 121, 107221. [Google Scholar] [CrossRef]
Figure 1. Spatial distribution of climate and vegetation cover changes in China (a) Changes in forest cover from 1980 to 2015, (b) Changes in forest cover percentage in eight major watersheds, (c) Changes in precipitation (P) during 1980–2020 (d) Changes in potential evapotranspiration (PET) during 1990–2020. The data sources are listed in Table S1.
Remotesensing 17 01581 g001
Figure 2. Comparison of simulated mean annual water yield (2001–2020) using the Budyko model and BEPS for eight major river basins. (a) Comparison between the Budyko model and BEPS, and (b) Scatterplot of Budyko model vs. BEPS. In (b), the black dashed line represents the 1:1 line, while the red solid line denotes the fitted line.
Remotesensing 17 01581 g002
Figure 3. Scatterplot of Budyko model simulated mean annual runoff (2000–2020) vs. 123 measured runoff (2001–2010) for (a) all watersheds, (b) semi-arid and semi-humid watersheds, and (c) humid watersheds. The black dashed line represents the 1:1 line, while the red solid line denotes the fitted line.
Remotesensing 17 01581 g003
Figure 4. Scatterplot of Budyko model simulated mean annual runoff versus 32 measured runoff data for (a,d) all watersheds, (b,e) semi-arid and semi-humid watersheds, and (c,f) humid watersheds for the periods of 1980–1999 and 2000–2020, respectively. The black dashed line represents the 1:1 line, while the red solid line denotes the fitted line.
Remotesensing 17 01581 g004
Figure 5. Scatterplot of Budyko model simulated mean annual runoff versus gridded runoff data for (a,d) all watersheds, (b,e) semi-arid and semi-humid watersheds, and (c,f) humid watersheds for the periods of 1980–1999 and 2000–2020, respectively. The gridded runoff data is reconstructed from the Chinese natural runoff gridded dataset, CNRD v1.0. The black dashed line represents the 1:1 line, while the red solid line denotes the fitted line.
Remotesensing 17 01581 g005
Figure 6. Spatial distribution and areal percentage histograms of absolute (a,c,e) and relative (b,d,f) water yield changes simulated by the Budyko model for different scenarios. (a,b) Experiment A, (c,d) Experiment B, and (e,f) Experiment C. Experiment A is the combined (absolute and relative) direct effects of afforestation and climate change, and Experiments B and C are the individual forestation direct effects (absolute and relative) under different climate contexts (See Tables S1 and S2).
Remotesensing 17 01581 g006
Figure 7. Histograms of the direct (a) absolute contribution and (b) relative contributions of vegetation to runoff changes under Scenario B, simulated by the Budyko model for 48 secondary watersheds. The green bars are contributions and the red lines are used to delineate the eight large basins.
Remotesensing 17 01581 g007
Figure 8. Indirect effects of tree cover restoration on annual re-precipitation and runoff considering atmospheric moisture recycling. (a) Spatial distribution of downwind re-precipitation when considering atmospheric moisture recycling; (b) Comparison of the direct contribution of tree cover restoration to annual runoff (TCR, red bars) and the indirect contribution of atmospheric moisture recycling (AMR, green bars) to annual re-precipitation in secondary watersheds.
Remotesensing 17 01581 g008
Figure 9. Comparison of direct and indirect effects of afforestation on changes in water yield (Q) in eight major river basins. (a) Absolute changes (mm yr−1) and (b) relative changes (%). Q values were simulated using the Budyko model.
Remotesensing 17 01581 g009
Table 1. Simulation Scenarios for examining the effects of forestation on climate change.
ScenariosS1S2S3S4
Forest cover1980198020152015
Climate1980–19992000–20201980–19992000–2020
Table 2. Combination experiment designed to separate the individual and combined effects of vegetation change on water yield.
Simulation ExperimentsBoth EffectsForest Cover Effects
ABC
Absolute water yield change (mm yr−1)S4 − S1S3 − S1S4 − S2
Relative water yield change (%)(S4 − S1)/S1(S3 − S1)/S1(S4 − S2)/S2
Note: Experiment A combined the effects of forestation and climate change, Experiment B is the individual effect of forestation (from 1980 to 2015) with the same climate as the period from 1980 to 1999, and Experiment C is the individual effect of forestation (from 1980 to 2015) with the same climate as the period from 2000 to 2020.
Disclaimer/Publisher’s Note: The statements, opinions and data contained in all publications are solely those of the individual author(s) and contributor(s) and not of MDPI and/or the editor(s). MDPI and/or the editor(s) disclaim responsibility for any injury to people or property resulting from any ideas, methods, instructions or products referred to in the content.

