
Evolutionary History of the Large-Scale Scarp in Jules Verne Crater, Moon

 , , , and
Abstract
1. Introduction
2. Materials and Methods
2.1. Data
2.2. Method
3. Results
3.1. Geological Units and Structural Features in Jules Verne Crater
3.2. Age of Jules Verne Crater
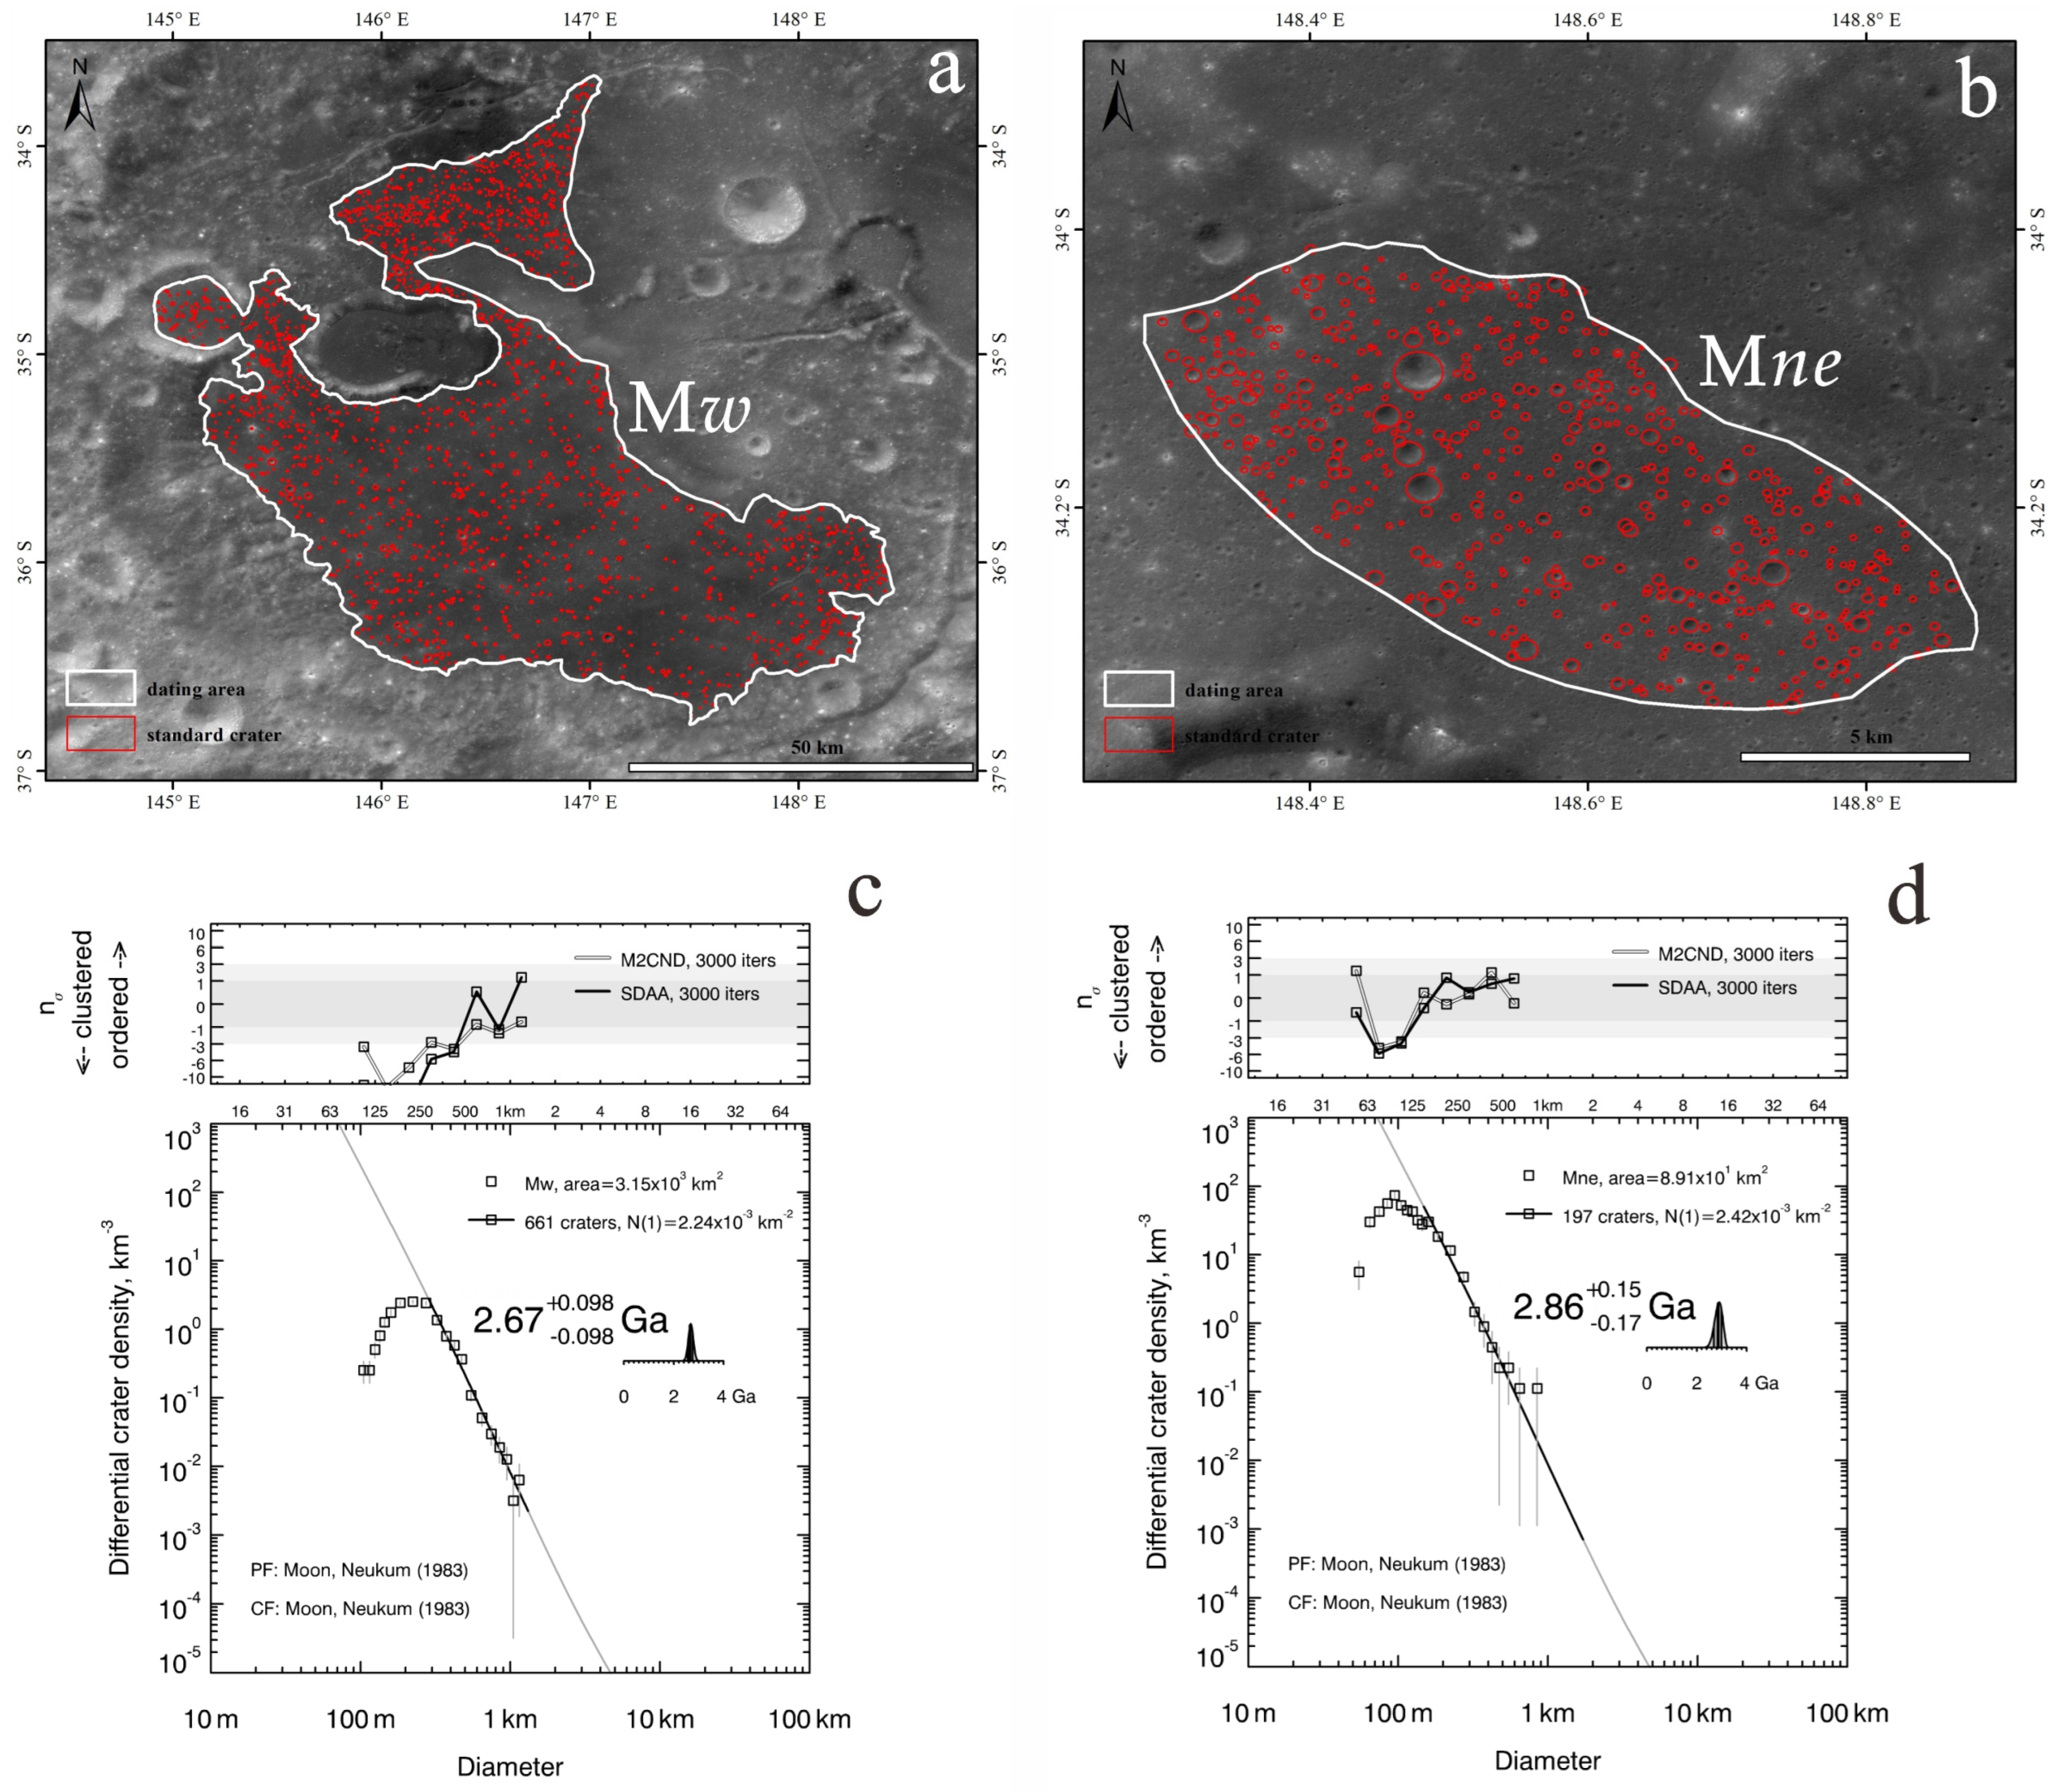
3.3. Mare Unit
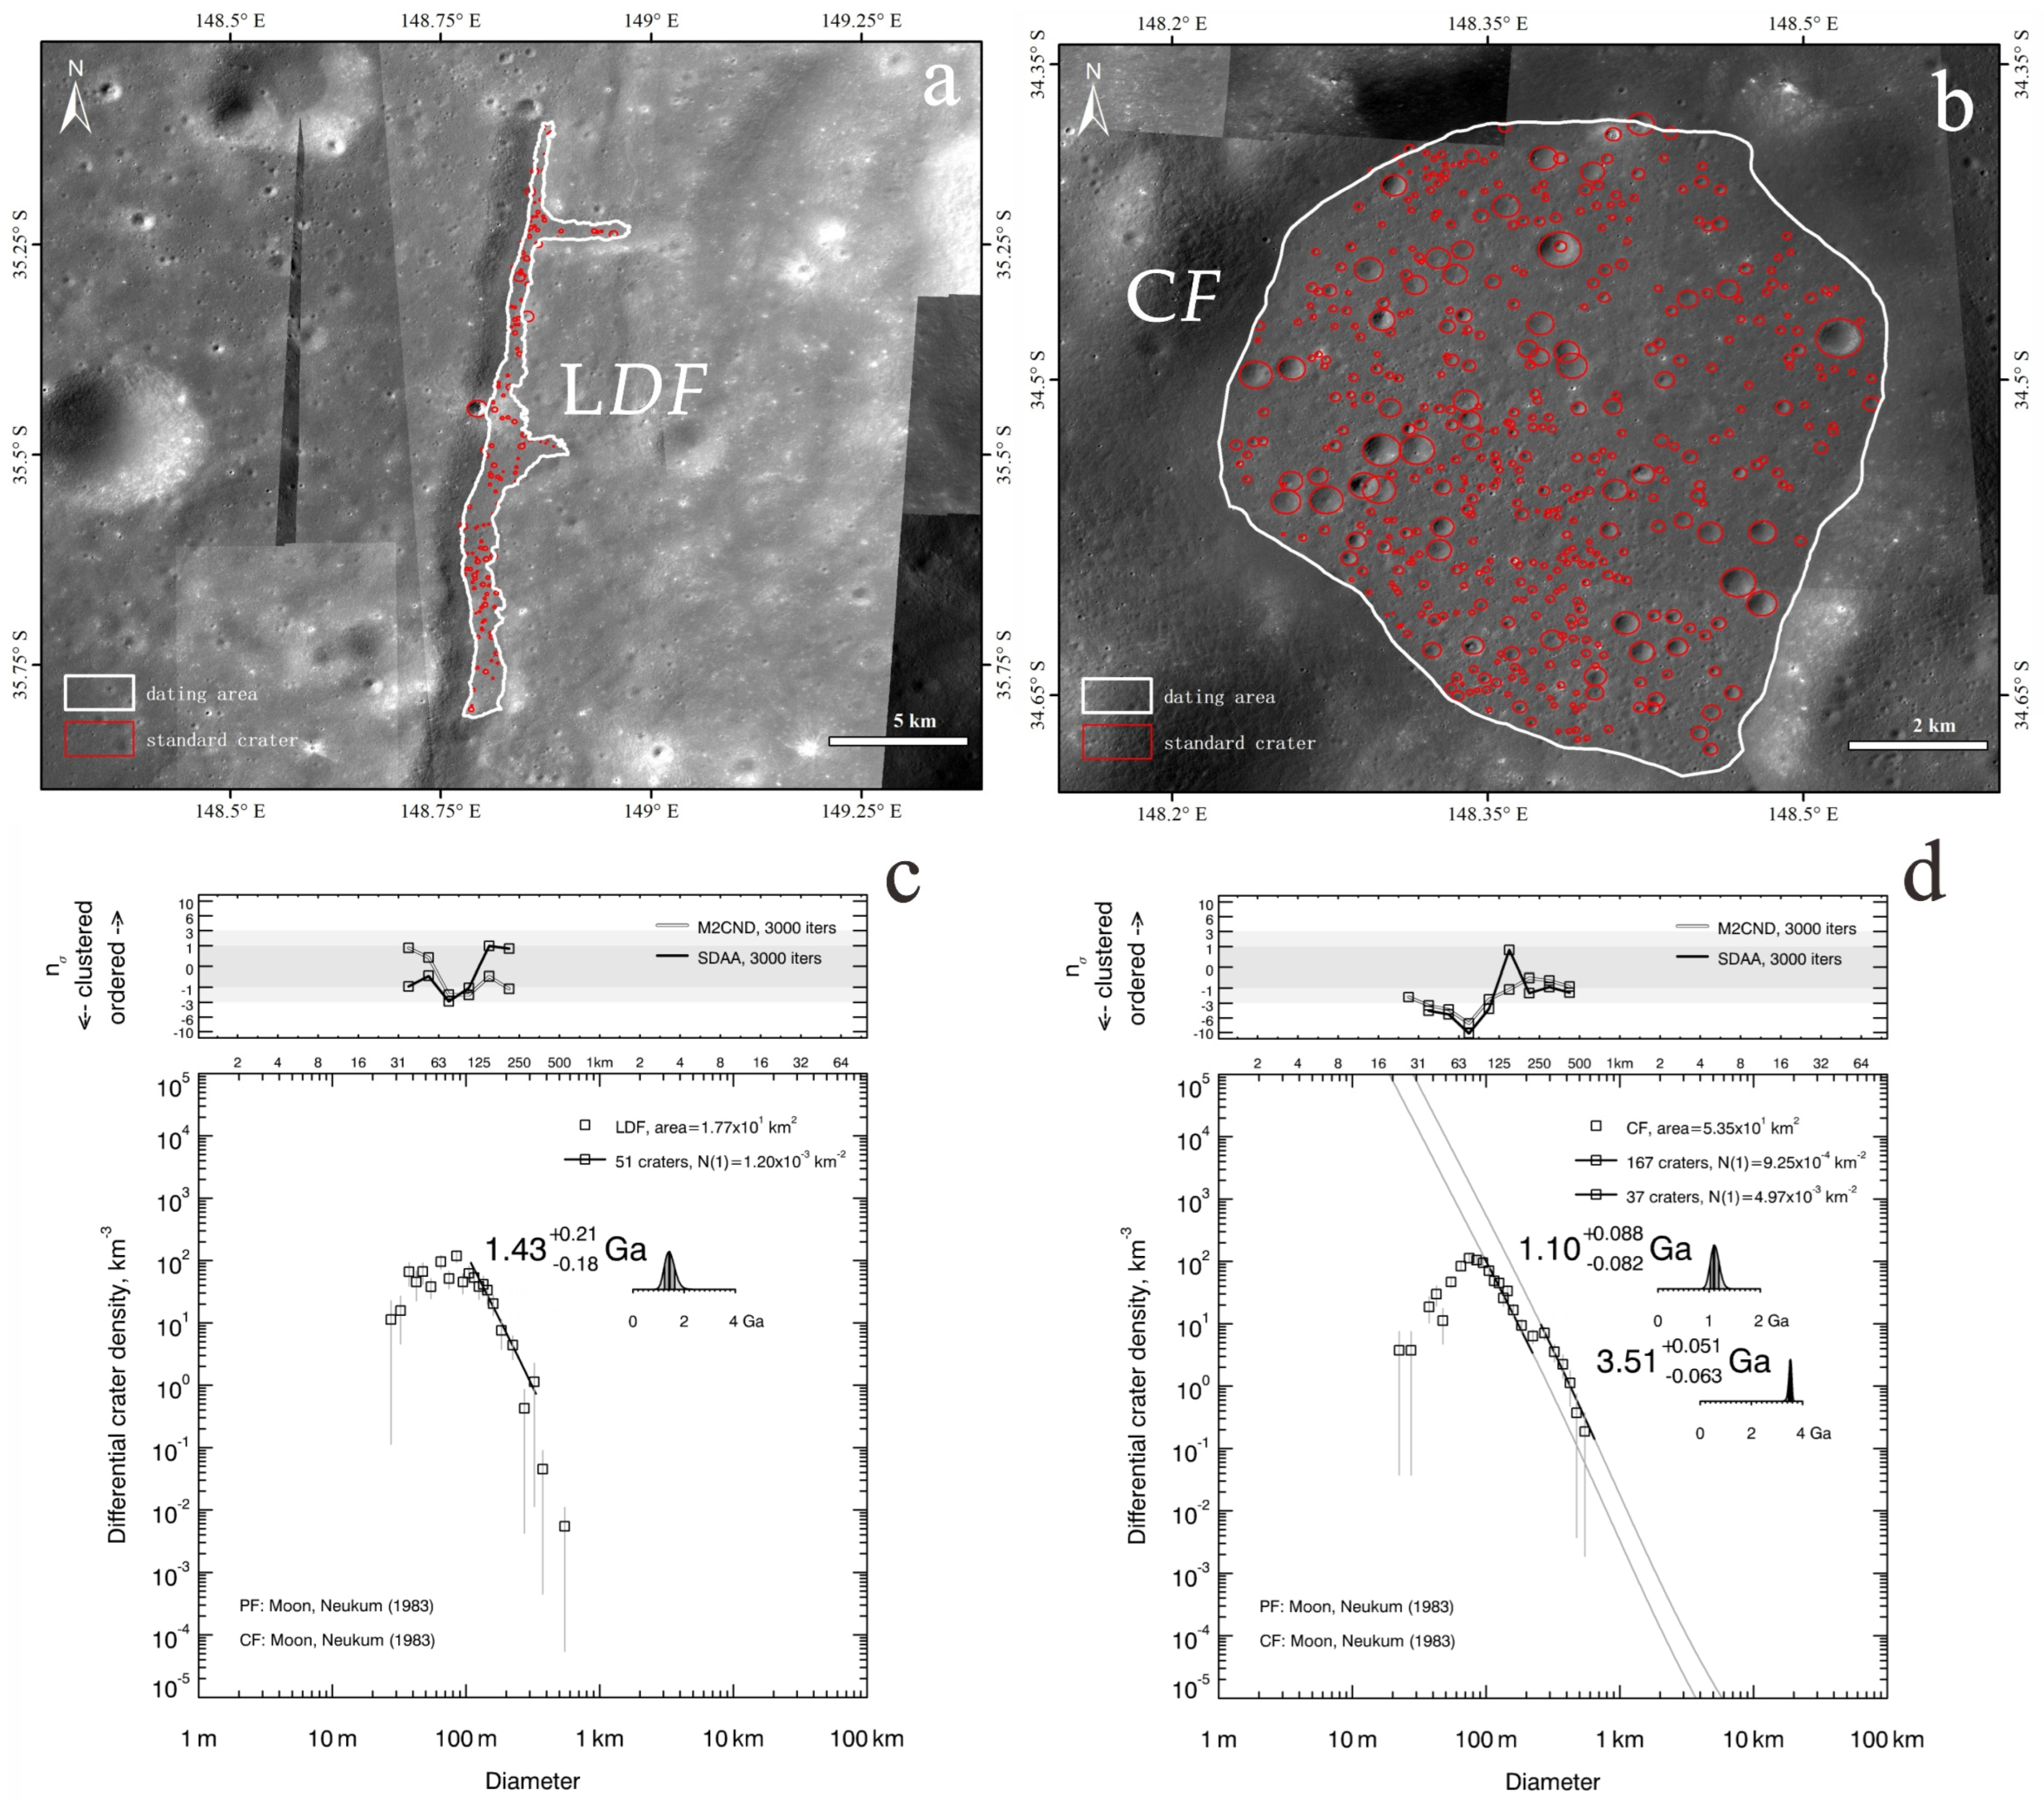
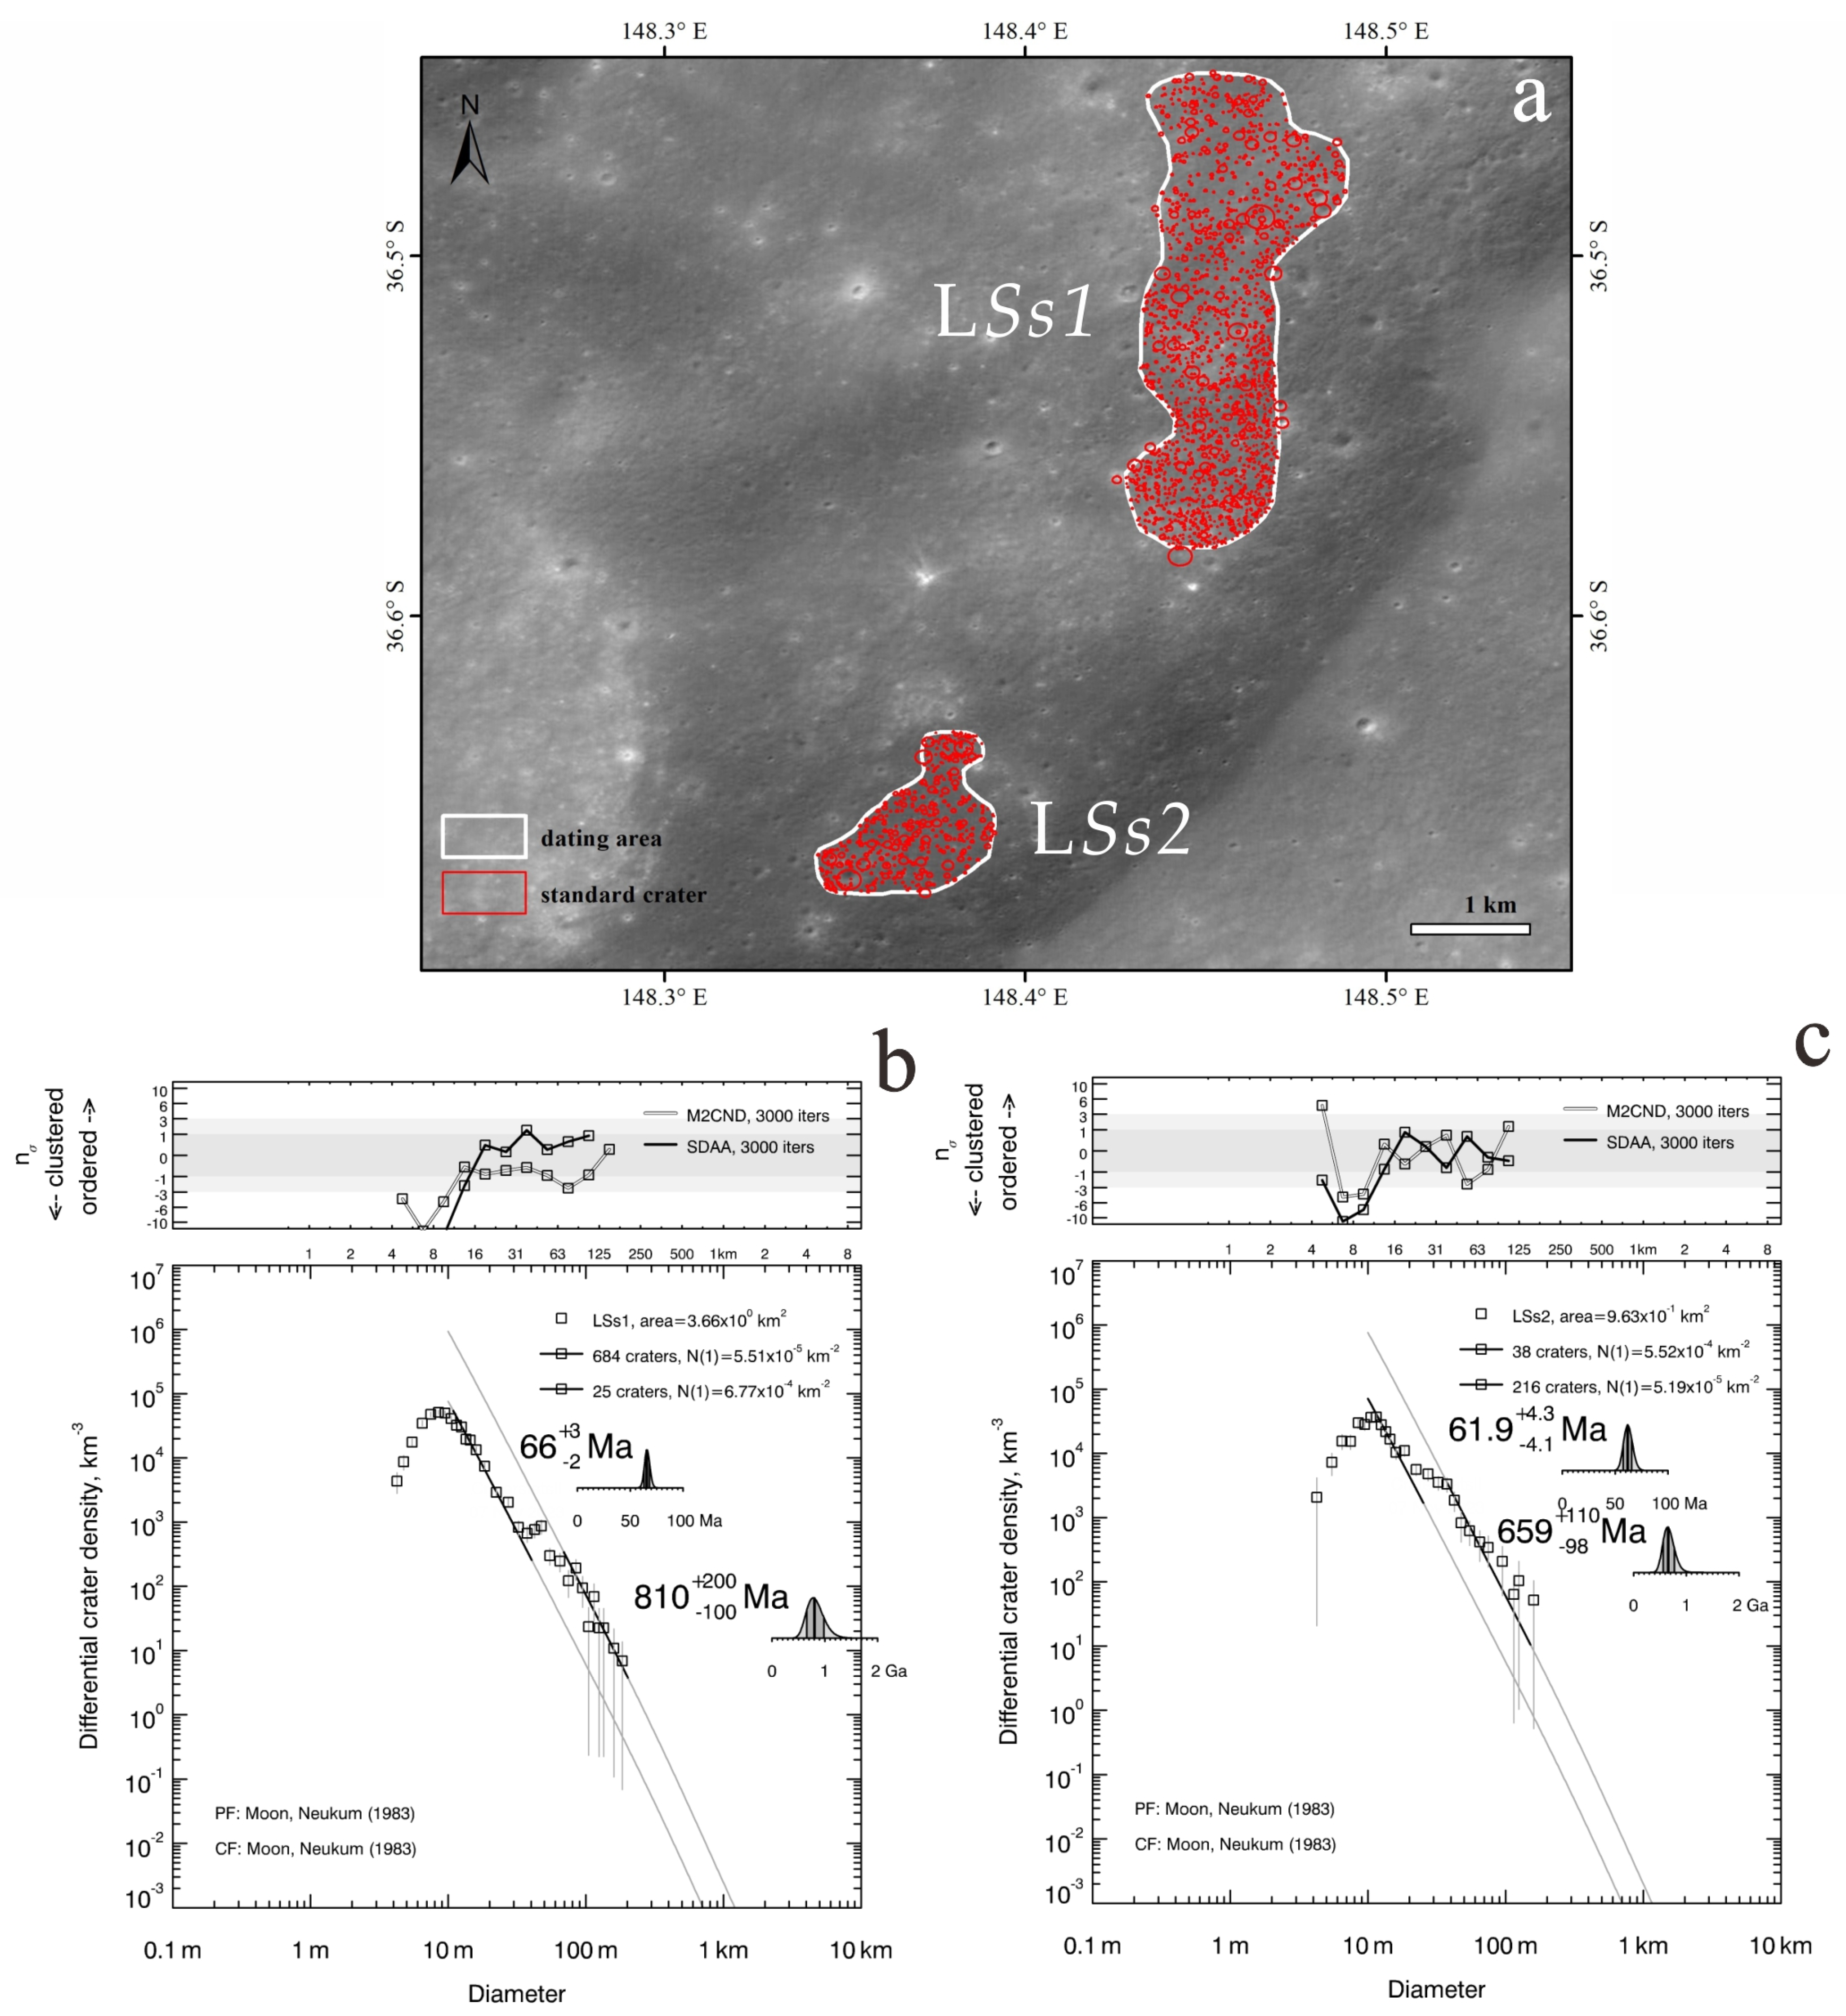
3.4. Linear Structure Affinity
4. Discussion
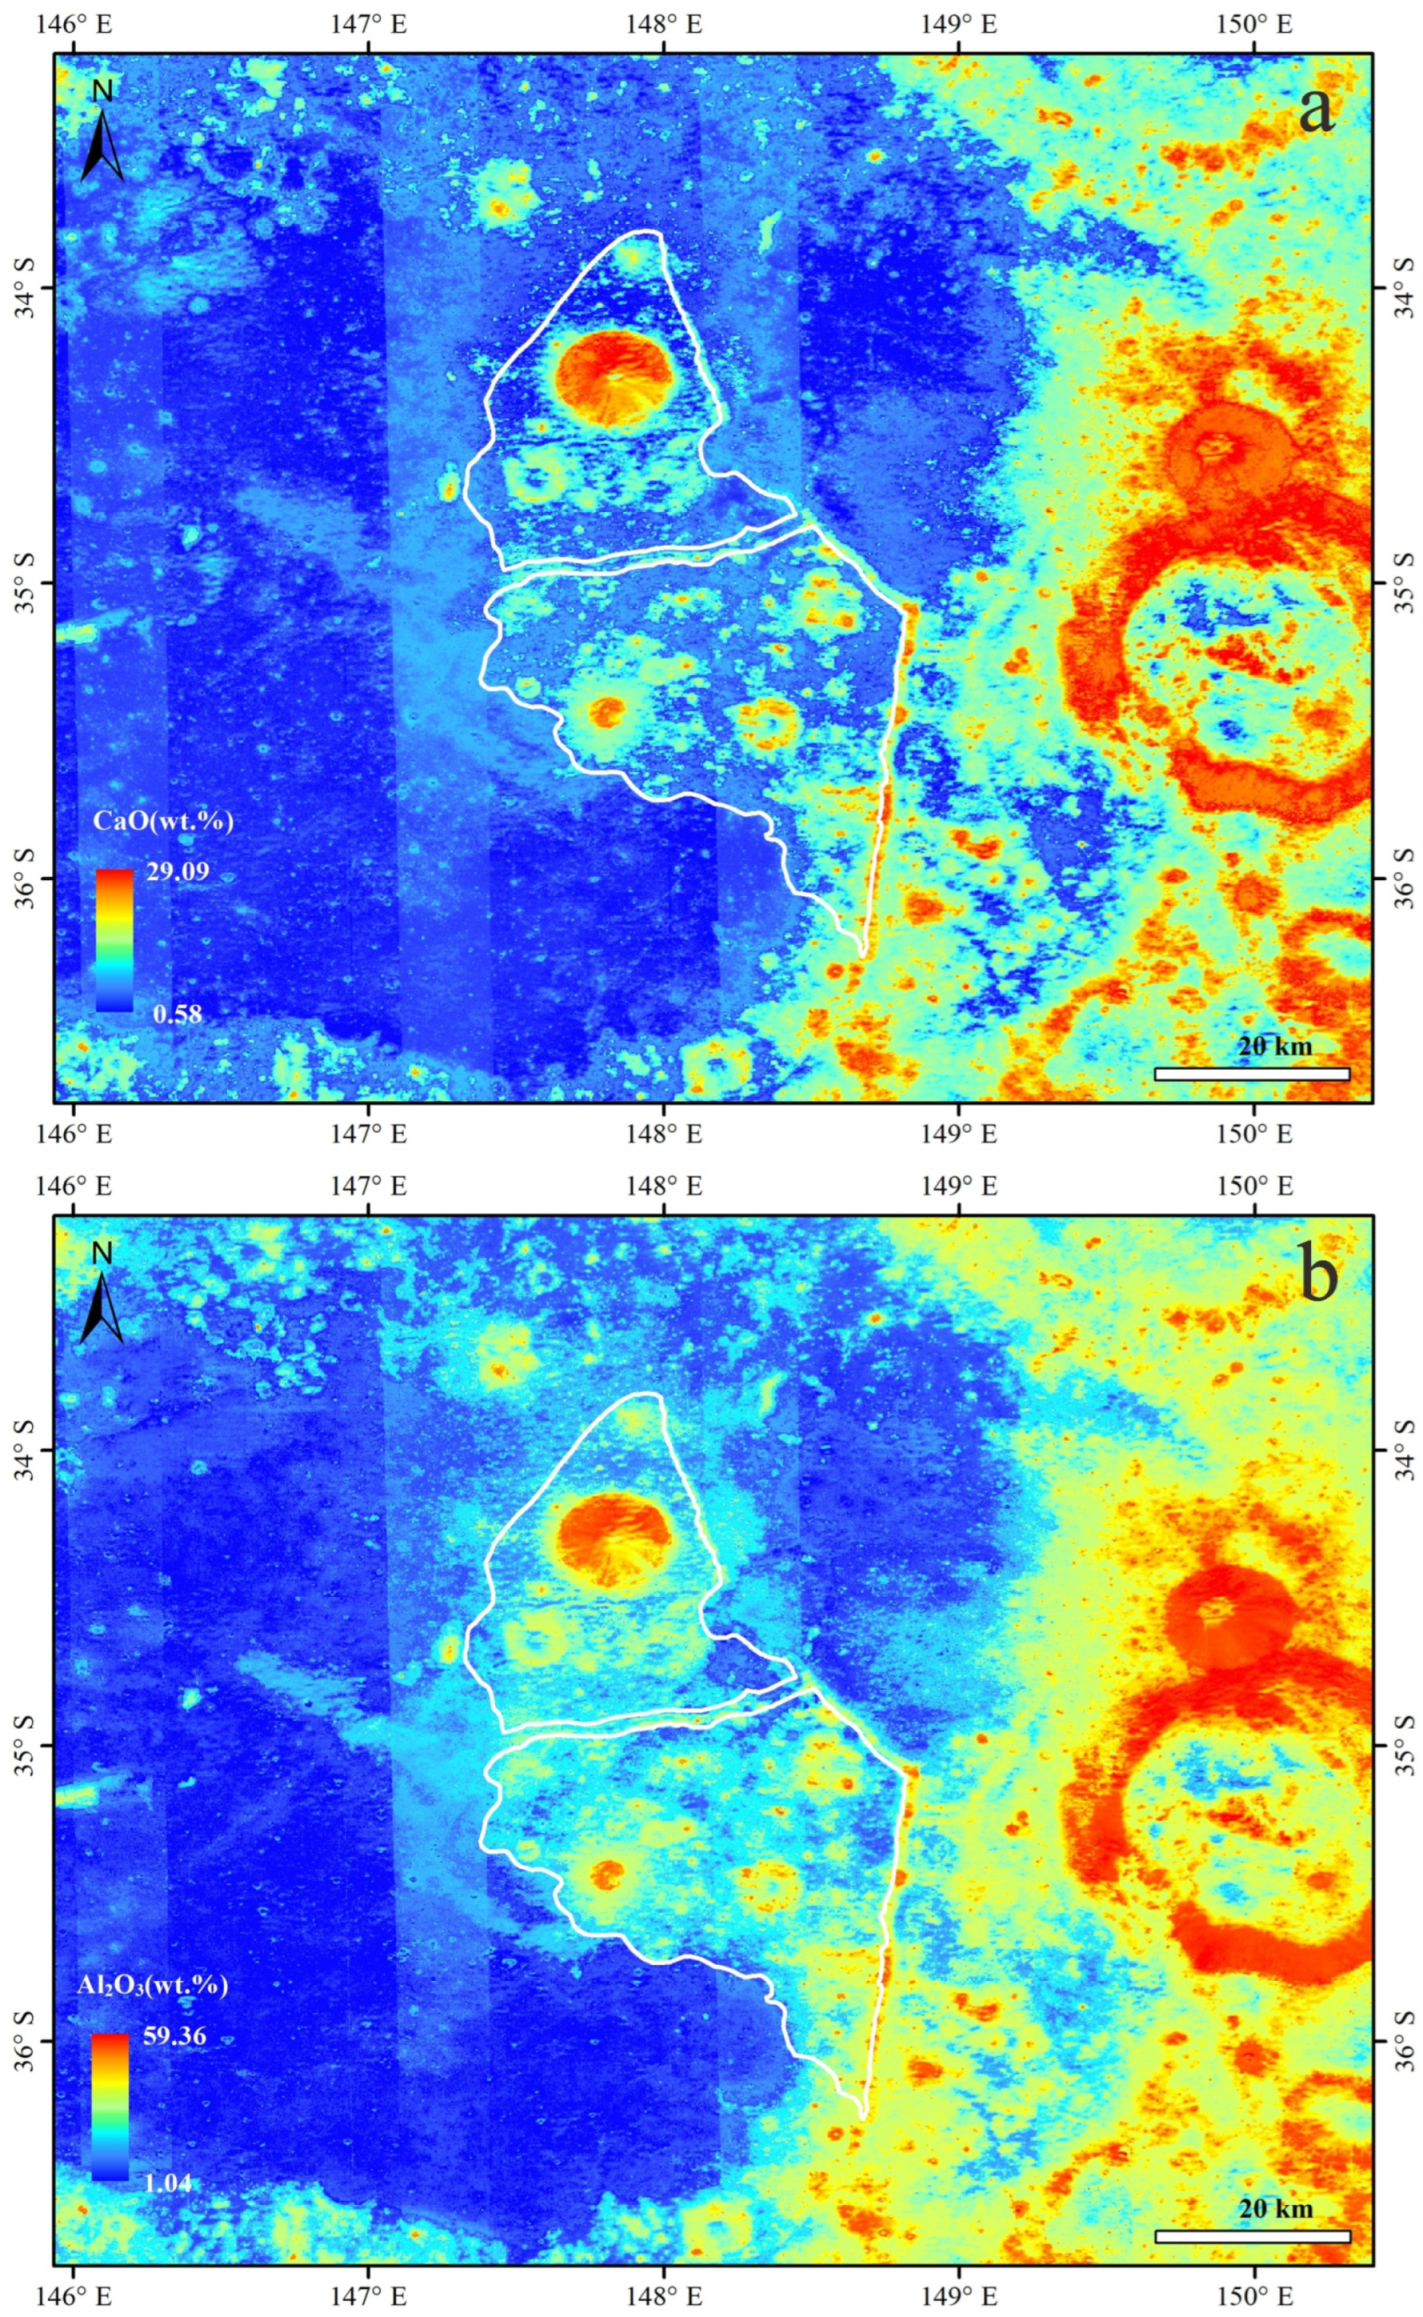
4.1. Magmatic Activity
4.2. Morphology and Dating Result of the Jules Verne Scarp
4.3. Evolution History of Jules Verne Scarp
5. Conclusions
Author Contributions
Funding
Data Availability Statement
Acknowledgments
Conflicts of Interest
Appendix A
| Direction of Illumination | INCIDENCE Angle (°) | Employed NAC Images | |
 | From east to west | >80 | M1109676757RE/LE, M1170923660RE/LE, M1170916537RE/LE, M1306164047RE/LE |
| 55~80 | M1245030675RE/LE, M161332996LE/RE, M161339777RE/LE, M1245044742RE/LE, M1122622635RE/LE, M176663890RE/LE, M1122615532RE/LE, M1153239008RE/LE, M1245037709RE/LE, M1199166693RE/LE, M1137950246RE/LE, M1290914130RE/LE, M1168571349RE/LE, M1137957356RE, M1303816834RE/M1303816834LE | ||
| 40~55 | M189628783RE/LE, M143650134RE/LE, M1150882595RE/LE, M1212094957RE/LE, M1181499900RE/LE, M1166218921RE/LE, M1196817690RE/LE, M125956762RE/LE | ||
| 0~40 | M125956762LE/RE, M156617495RE/LE, M156624304LE/RE, M110622357LE/RE, M1240325648LE/RE, M1148533700RE/LE | ||
 | From west to east | >80 | M1156789111RE/LE, M1126169115RE/LE, M1218007757RE/LE, M1217993691RE/LE, M180193241RE/LE |
| 55~80 | M149546857RE/LE, M1263844300LE/RE, M1324964452RE/LE, M134219181RE/LE, M1368464784RE/LE, M1279154768LE, M103539841RE/LE, M1143818386RE/LE, M1174429306RE/LE, M1220356884RE/LE, M1340269147RE/LE, M1235627737RE/LE, M182544976RE/LE, M1340276136RE/LE, M167234652RE/LE, M1250936528RE/LE | ||
| 40~55 | M136580477RE/LE, M1312075991RE/LE, M1130884072RE/LE, M1146179020RE/LE, M1100238883RE/LE, M184903825RE/LE, M1207389985RE/LE, M1357854690LE/RE | ||
| 0~40 | M1283864587RE/LE, M187269906LE, M1299113400LE/RE, M108265116LE/RE, M1344971054LE/RE, M1102603360LE/RE |
References
- Binder, A.B.; Gunga, H.-C. Young thrust-fault scarps in the highlands: Evidence for an initially totally molten moon. Icarus 1985, 63, 421–441. [Google Scholar] [CrossRef]
- Watters, T.R.; Robinson, M.S.; Beyer, R.A.; Banks, M.E.; Bell, J.F.; Pritchard, M.E.; Hiesinger, H.; van der Bogert, C.H.; Thomas, P.C.; Turtle, E.P.; et al. Evidence of Recent Thrust Faulting on the Moon Revealed by the Lunar Reconnaissance Orbiter Camera. Science 2010, 329, 936–940. [Google Scholar] [CrossRef]
- van der Bogert, C.H.; Clark, J.D.; Hiesinger, H.; Banks, M.E.; Watters, T.R.; Robinson, M.S. How old are lunar lobate scarps? 1. Seismic resetting of crater size-frequency distributions. Icarus 2018, 306, 225–242. [Google Scholar] [CrossRef]
- Kumar, P.S.; Sruthu, I.; Lakshmi, K.J.P.; Menon, R.; Amitabh Krishna, B.G.; Kring, D.A.; Head, J.W.; Goswami, J.N.; Kumar, A.S.K. Recent shallow moonquake and impact-triggered boulder falls on the Moon: New insights from the Schrödinger basin. J. Geophys. Res. Planets 2016, 121, 147–179. [Google Scholar] [CrossRef]
- Clark, J.D.; van der Bogert, C.H.; Hiesinger, H. How old are lunar lobate scarps? 2. Distribution in space and time. Earth Planet. Sci. Lett. 2024, 633, 118636. [Google Scholar] [CrossRef]
- Watters, T.R.; Schultz, R.A. Planetary Tectonics; Cambridge University Press: Cambridge, UK, 2010. [Google Scholar]
- Banks, M.E.; Watters, T.R.; Robinson, M.S.; Tornabene, L.L.; Tran, T.; Ojha, L.; Williams, N.R. Morphometric analysis of small-scale lobate scarps on the Moon using data from the Lunar Reconnaissance Orbiter. J. Geophys. Res. 2012, 117, E00H11. [Google Scholar] [CrossRef]
- Watters, T.R. Thrust faults along the dichotomy boundary in the eastern hemisphere of Mars. J. Geophys. Res. 2003, 108, 1934. [Google Scholar] [CrossRef]
- Watters, T.R.; Weber, R.C.; Collins, G.C.; Howley, I.J.; Schmerr, N.C.; Johnson, C.L. Shallow seismic activity and young thrust faults on the Moon. Nat. Geosci. 2019, 12, 411–417. [Google Scholar] [CrossRef]
- Binder, A.B. Post-imbrian global lunar tectonism: Evidence for an initially totally molten Moon. Earth Moon Planets 1982, 26, 117–133. [Google Scholar] [CrossRef]
- Mahanti, P.; Robinson, M.; Thompson, T.; Henriksen, M. Small lunar craters at the Apollo 16 and 17 landing sites—Morphology and degradation. Icarus 2018, 299, 475–501. [Google Scholar] [CrossRef]
- Tao, S.; Shi, Y.L.; Zhu, B.J. Preliminary analysis of the relationship between the thermal stress of the Moon in cooling process and moonquake mechanisms. Chin. J. Geophys. 2023, 66, 3730–3746. (In Chinese) [Google Scholar]
- Trask, N.J. Geologic Comparison of Mare Materials in the Lunar Equatorial Belt, Including Apollo 11 and Apollo 12 Landing Sites; U.S. Geological Survey: Reston, VA, USA, 1971; pp. D138–D144.
- Moore, H.J.; Boyge, J.M.; Schaber, G.G.; Sgott, D.H. Lunar Remote Sensing and Measurements, in Apollo 15–17 Orbital Investigations; Professional Paper; U.S. Geological Survey: Reston, VA, USA, 1980.
- Mishra, A.; Kumar, P.S. Spatial and Temporal Distribution of Lobate Scarps in the Lunar South Polar Region: Evidence for Latitudinal Variation of Scarp Geometry, Kinematics and Formation Ages, Neo-Tectonic Activity and Sources of Potential Seismic Risks at the Artemis Candidate Landing Regions. Geophys. Res. Lett. 2022, 49, e2022GL098505. [Google Scholar] [CrossRef]
- Fortezzo, C.; Spudis, P.; Harrel, S. Release of the digital unified global geologic map of the moon at 1:5,000,000. In Proceedings of the 51st Lunar and Planetary Science Conference, Lunar and Planetary Institute, Houston, TX, USA, 16–20 March 2020. [Google Scholar]
- Stuart-Alexander, D.E. Geologic Map of the Central Far Side of the Moon; U.S. Geological Survey: Reston, VA, USA, 1978. [CrossRef]
- Robinson, M.S.; Brylow, S.M.; Tschimmel, M.; Humm, D.; Lawrence, S.J.; Thomas, P.C.; Denevi, B.W.; Bowman-Cisneros, E.; Zerr, J.; Ravine, M.A.; et al. Lunar Reconnaissance Orbiter Camera (LROC) Instrument Overview. Space Sci. Rev. 2010, 150, 81–124. [Google Scholar] [CrossRef]
- Haruyama, J.; Ohtake, M.; Matsunaga, T.; Morota, T.; Yokota, Y.; Honda, C.; Hirata, N.; Demura, H.; Iwasaki, A.; Nakamura, R.; et al. Planned radiometrically calibrated and geometrically corrected products of lunar high-resolution Terrain Camera on SELENE. Adv. Space Res. 2008, 42, 310–316. [Google Scholar] [CrossRef]
- Anderson, J.A.; Sides, S.C.; Soltesz, D.L.; Sucharski, T.L.; Becker, K.J. Modernization of the Integrated Software for Imagers and Spectrometers. In Proceedings of the Lunar and Planetary Science Conference, League City, TX, USA, 15–19 March 2004. [Google Scholar]
- Haruyama, J.; Hara, S.; Hioki, K.; Iwasaki, A.; Morota, T.; Ohtake, M.; Matsunaga, T.; Araki, H.; Matsumoto, K.; Ishihara, Y.; et al. Lunar Global Digital Terrain Model Dataset Produced from SELENE (Kaguya) Terrain Camera Stereo Observations. In Proceedings of the 43rd Lunar and Planetary Science Conference, Woodlands, TX, USA, 19–23 March 2012. [Google Scholar]
- Barker, M.K.; Mazarico, E.M.; Neumann, G.A.; Smith, D.E.; Zuber, M.T. Merging Digital Elevation Models from the Lunar Orbiter Laser Altimeter and Kaguya Terrain Camera. In Proceedings of the 45th Lunar & Planetary Science Conference, Woodlands, TX, USA, 17–21 March 2014. [Google Scholar]
- Barker, M.; Mazarico, E.; Neumann, G.; Zuber, M.; Haruyama, J.; Smith, D. A new lunar digital elevation model from the Lunar Orbiter Laser Altimeter and SELENE Terrain Camera. Icarus 2016, 273, 346–355. [Google Scholar] [CrossRef]
- Sato, H.; Robinson, M.S.; Lawrence, S.J.; Denevi, B.W.; Hapke, B.; Jolliff, B.L.; Hiesinger, H. Lunar mare TiO2 abundances estimated from UV/Vis reflectance. Icarus 2017, 296, 216–238. [Google Scholar] [CrossRef]
- Haruyama, J.; Matsunaga, T.; Ohtake, M.; Morota, T.; Honda, C.; Yokota, Y.; Torii, M.; Ogawa, Y.; LISM Working Group. Global lunar-surface mapping experiment using the Lunar Imager/Spectrometer on SELENE. Earth Planets Space 2008, 60, 243–255. [Google Scholar] [CrossRef]
- Lemelin, M.; Lucey, P.G.; Song, E.; Taylor, G.J. Lunar central peak mineralogy and iron content using the Kaguya Multiband Imager: Reassessment of the compositional structure of the lunar crust. J. Geophys. Res. Planets 2015, 120, 869–887. [Google Scholar] [CrossRef]
- Zhang, L.; Zhang, X.; Yang, M.; Xiao, X.; Qiu, D.; Yan, J.; Xiao, L.; Huang, J. New maps of major oxides and Mg # of the lunar surface from additional geochemical data of Chang’E-5 samples and KAGUYA multiband imager data. Icarus 2023, 397, 115505. [Google Scholar] [CrossRef]
- Basilevskii, A.T. On the evolution rate of small lunar craters. In Proceedings of the Lunar and Planetary Science Conference Proceedings, Houston, TX, USA, 15–19 March 1976. [Google Scholar]
- Meyer, H.M.; Mahanti, P.; Robinson, M.S.; Boyd, A. Quantifying the Effect of Slope on Crater Density: A Preliminary Overview. In Proceedings of the 47th Lunar and Planetary Science Conference, Woodlands, TX, USA, 21–25 March 2016. [Google Scholar]
- Neukum, G. Meteorite Bombardment and Dating of Planetary Surfaces; Ludwig-Maximilians University: Munich, Germany, 1983. [Google Scholar]
- Michael, G.; Platz, T.; Kneissl, T.; Schmedemann, N. Planetary surface dating from crater size–frequency distribution measurements: Spatial randomness and clustering. Icarus 2012, 218, 169–177. [Google Scholar] [CrossRef]
- Kneissl, T.; van Gasselt, S.; Neukum, G. Map-projection-independent crater size-frequency determination in GIS environments—New software tool for ArcGIS. Planet. Space Sci. 2011, 59, 1243–1254. [Google Scholar] [CrossRef]
- Kneissl, T.; Schmedemann, N.; Neesemann, A.; Raymond, C.A.; Russell, C.T. Crater Counting on Small Bodies—The Influence of Topography-Related Distortions. In Proceedings of the 45th Lunar & Planetary Science Conference, Woodlands, TX, USA, 17–21 March 2014. [Google Scholar]
- Kneissl, T.; Michael, G.; Platz, T.; Walter, S. Age determination of linear surface features using the Buffered Crater Counting approach—Case studies of the Sirenum and Fortuna Fossae graben systems on Mars. Icarus 2015, 250, 384–394. [Google Scholar] [CrossRef]
- Heyer, T.; Iqbal, W.; Oetting, A.; Hiesinger, H.; van der Bogert, C.; Schmedemann, N. A comparative analysis of global lunar crater catalogs using OpenCraterTool—An open source tool to determine and compare crater size-frequency measurements. Planet. Space Sci. 2023, 231, 105687. [Google Scholar] [CrossRef]
- Michael, G.; Yue, Z.; Gou, S.; Di, K. Dating individual several-km lunar impact craters from the rim annulus in region of planned Chang’E-5 landing: Poisson age-likelihood calculation for a buffered crater counting area. Earth Planet. Sci. Lett. 2021, 568, 117031. [Google Scholar] [CrossRef]
- Michael, G.; Kneissl, T.; Neesemann, A. Planetary surface dating from crater size-frequency distribution measurements: Poisson timing analysis. Icarus 2016, 277, 279–285. [Google Scholar] [CrossRef]
- Williams, N.R.; Watters, T.R.; Pritchard, M.E.; Banks, M.E.; Bell, J.F. Fault dislocation modeled structure of lobate scarps from Lunar Reconnaissance Orbiter Camera digital terrain models. J. Geophys. Res. Planets 2013, 118, 224–233. [Google Scholar] [CrossRef]
- Yingst, R.A.; Head, J.W. Geology of mare deposits in South Pole-Aitken basin as seen by Clementine UV/VIS data. J. Geophys. Res. 1999, 104, 18957–18979. [Google Scholar] [CrossRef]
- Haruyama, J.; Ohtake, M.; Matsunaga, T.; Morota, T.; Honda, C.; Yokota, Y.; Abe, M.; Ogawa, Y.; Miyamoto, H.; Iwasaki, A.; et al. Long-Lived Volcanism on the Lunar Farside Revealed by SELENE Terrain Camera. Science 2009, 323, 905–908. [Google Scholar] [CrossRef]
- Pasckert, J.H.; Hiesinger, H.; van der Bogert, C.H. Lunar farside volcanism in and around the South Pole–Aitken basin. Icarus 2018, 299, 538–562. [Google Scholar] [CrossRef]
- Solomon, S.C.; Head, J.W. Vertical movement in mare basins: Relation to mare emplacement, basin tectonics, and lunar thermal history. J. Geophys. Res. 1979, 84, 1667–1682. [Google Scholar] [CrossRef]
- Hurwitz, D.M.; Head, J.W.; Wilson, L.; Hiesinger, H. Origin of lunar sinuous rilles: Modeling effects of gravity, surface slope, and lava composition on erosion rates during the formation of Rima Prinz. J. Geophys. Res. 2012, 117, E00H14. [Google Scholar] [CrossRef]
- Jozwiak, L.M.; Head, J.W.; Wilson, L. Lunar floor-fractured craters as magmatic intrusions: Geometry, modes of emplacement, associated tectonic and volcanic features, and implications for gravity anomalies. Icarus 2015, 248, 424–447. [Google Scholar] [CrossRef]
- Matthews, S.J.; Gardeweg, M.C.; Sparks, R.S.J. The 1984 to 1996 cyclic activity of Lascar Volcano, northern Chile: Cycles of dome growth, dome subsidence, degassing and explosive eruptions. Bull. Volcanol. 1997, 59, 72–82. [Google Scholar] [CrossRef]
- Watters, T.R.; Robinson, M.S.; Collins, G.C.; Banks, M.E.; Daud, K.; Williams, N.R.; Selvans, M.M. Global thrust faulting on the Moon and the influence of tidal stresses. Geology 2015, 43, 851–854. [Google Scholar] [CrossRef]


| Dating Units | Age | N (1) | Area (km2) | Dia Meter Range |
|---|---|---|---|---|
| LSs2 | Ma | 5.19 × 10⁻⁵ km−2 | 0.963 | 11 m, 40 m |
| Ma | 5.45 × 10⁻⁴ km−2 | 70 m, 200 m | ||
| LSs1 | Ma | 5.51 × 10⁻⁵ km−2 | 3.66 | 10 m, 25 m |
| Ma | 6.77 × 10⁻⁴ km−2 | 38 m, 97 m | ||
| Ss | Ga | 1.16 × 10⁻³ km−2 | 835 | 210 m, 440 m |
| Ga | 3.12 × 10⁻³ km−2 | 420 m, 660 m | ||
| Ga | 2.14 × 10⁻² km−2 | 930 m, 7.4 km | ||
| Ln | Ga | 1.18 × 10⁻³ km−2 | 537 | 260 m, 490 m |
| Ga | 3.86 × 10⁻³ km−2 | 510 m, 800 m | ||
| Ga | 4.51 × 10⁻² km−2 | 1.2 km, 10 km | ||
| CF | Ga | 9.25 × 10⁻⁴ km−2 | 53.5 | 98 m, 220 m |
| Ga | 4.97 × 10⁻³ km−2 | 260 m, 640 m | ||
| LDF | Ga | 1.20 × 10⁻³ km−2 | 17.7 | 110 m, 330 m |
| Mne | Ga | 2.42 × 10⁻³ km−2 | 89.1 | 150 m, 1.7 km |
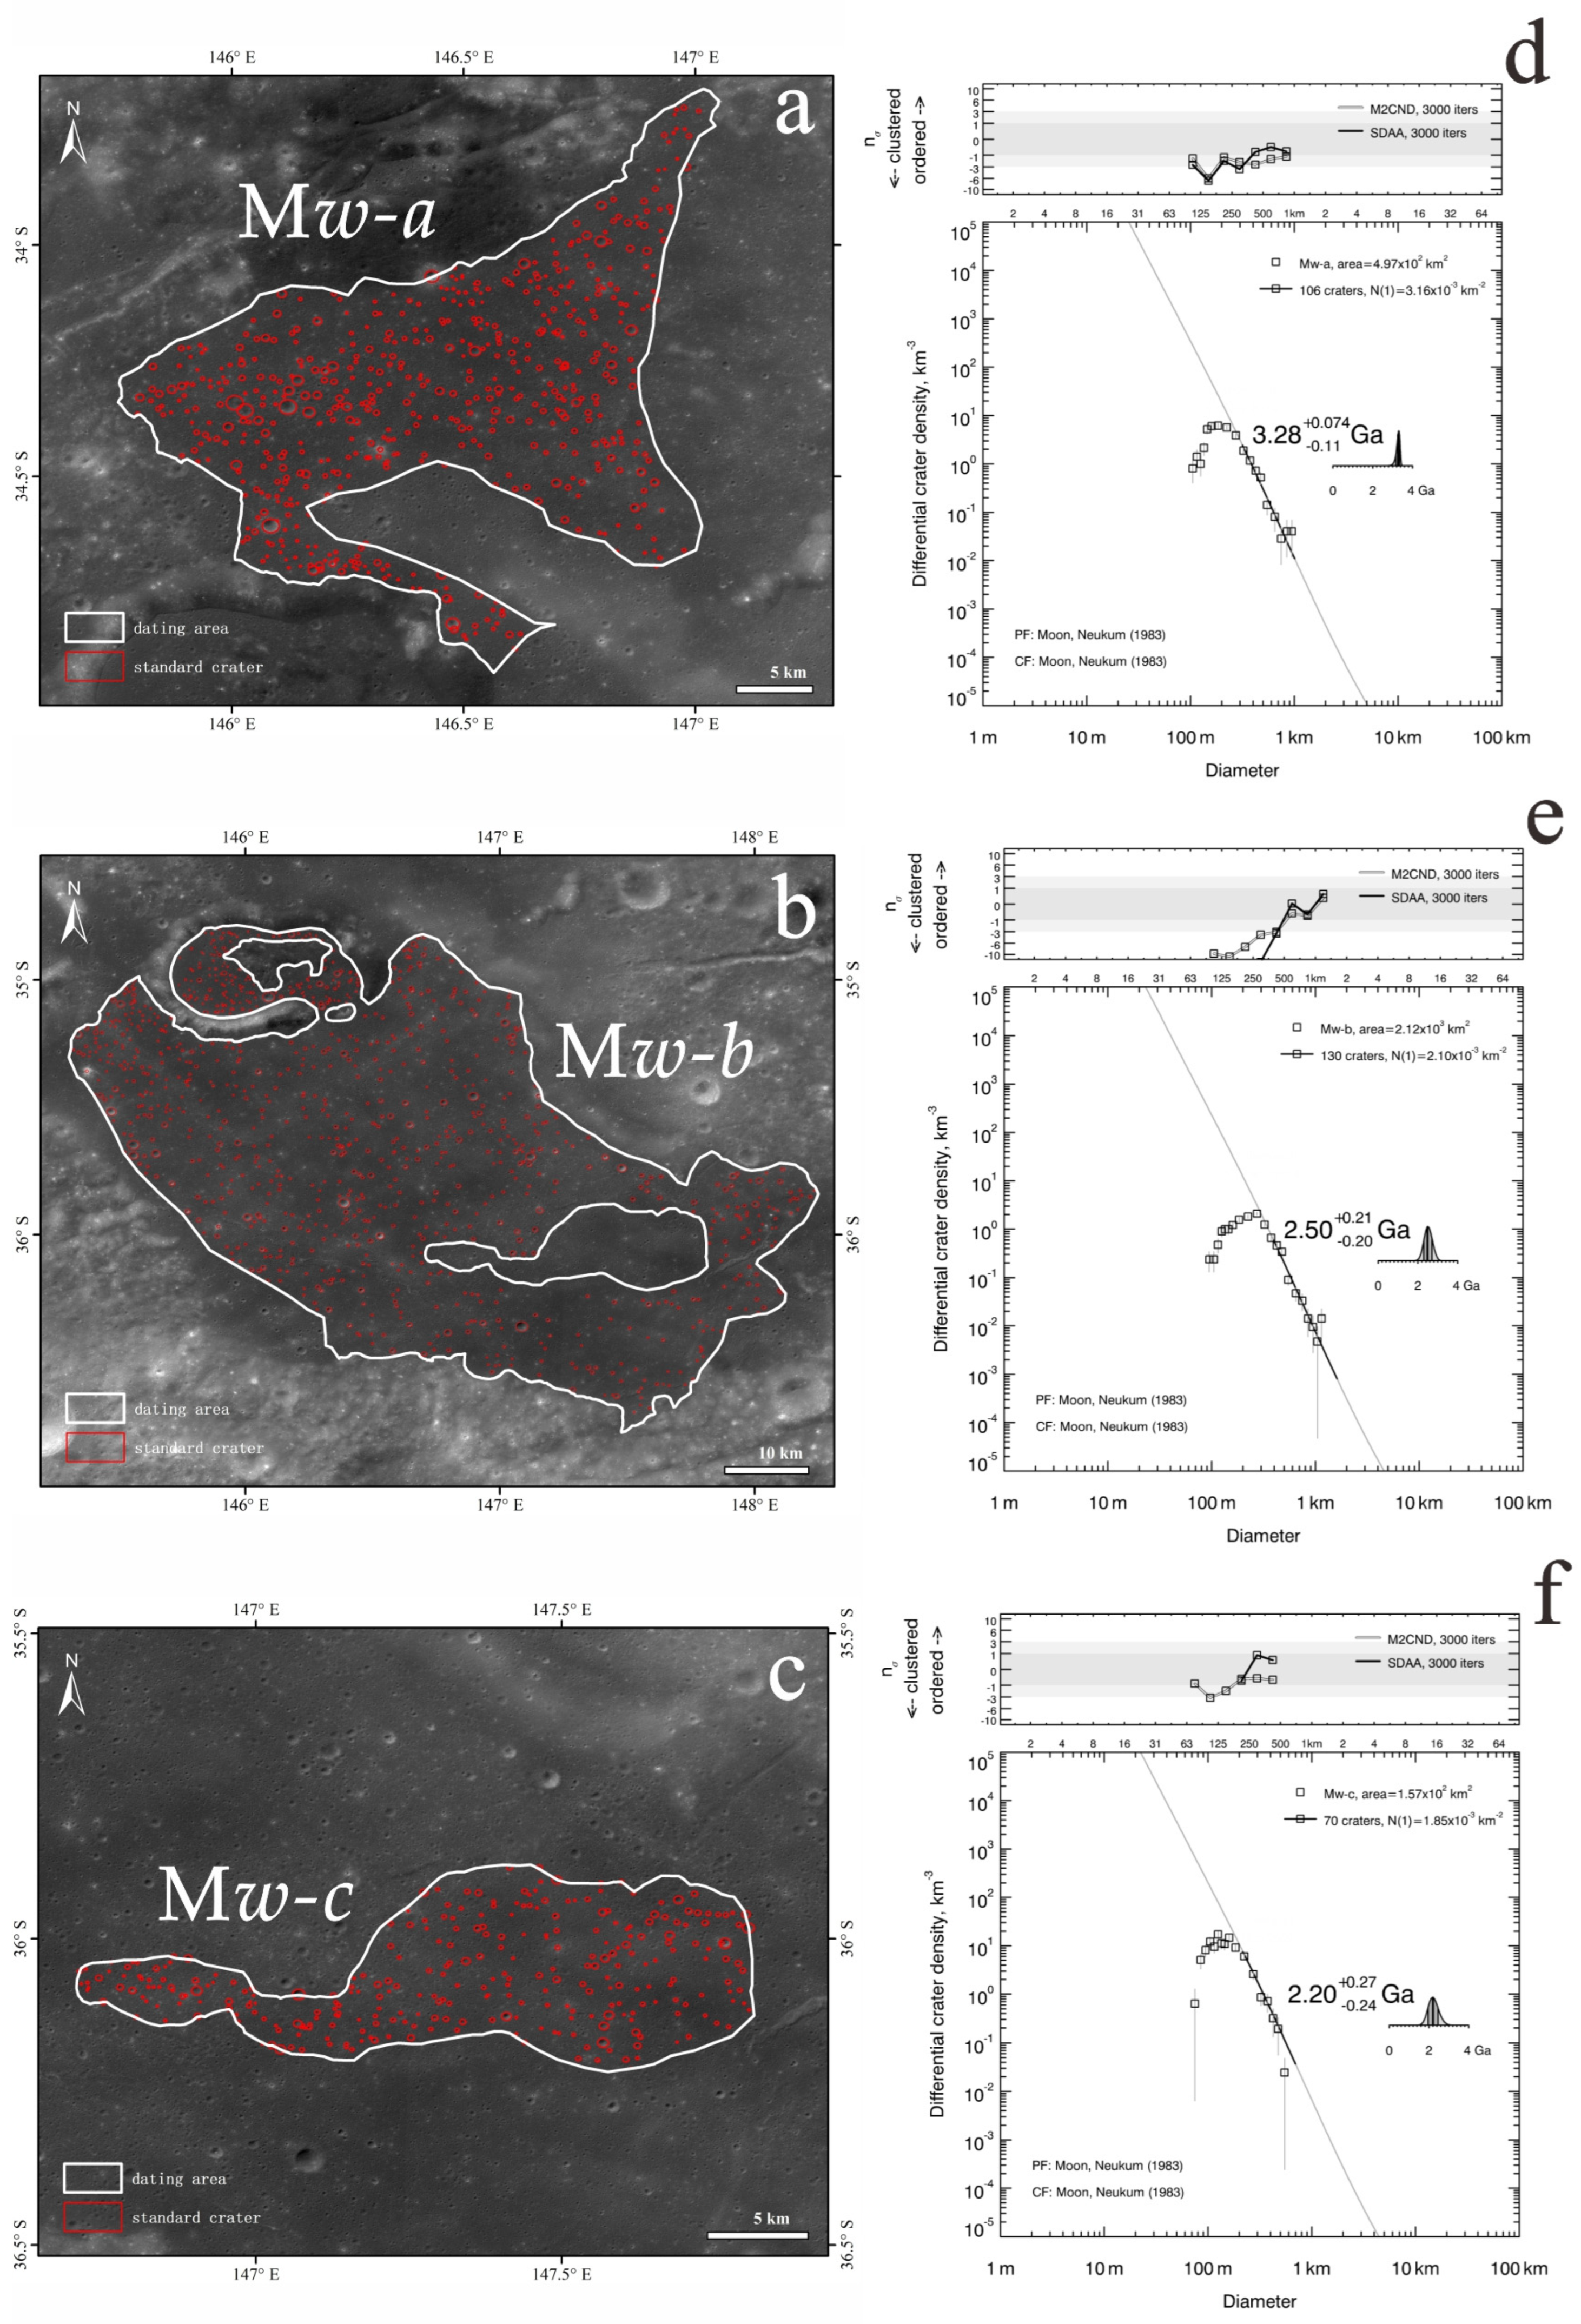
| Mw-c | Ga | 1.85 × 10⁻³ km−2 | 157 | 220 m, 690 m |
| Mw-b | Ga | 2.10 × 10⁻³ km−2 | 2120 | 400 m, 1.6 km |
| Mw-a | Ga | 3.16 × 10⁻³ km−2 | 497 | 320 m, 1 km |
| Mw | Ga | 2.24 × 10⁻³ km−2 | 3150 | 290 m, 1.3 km |
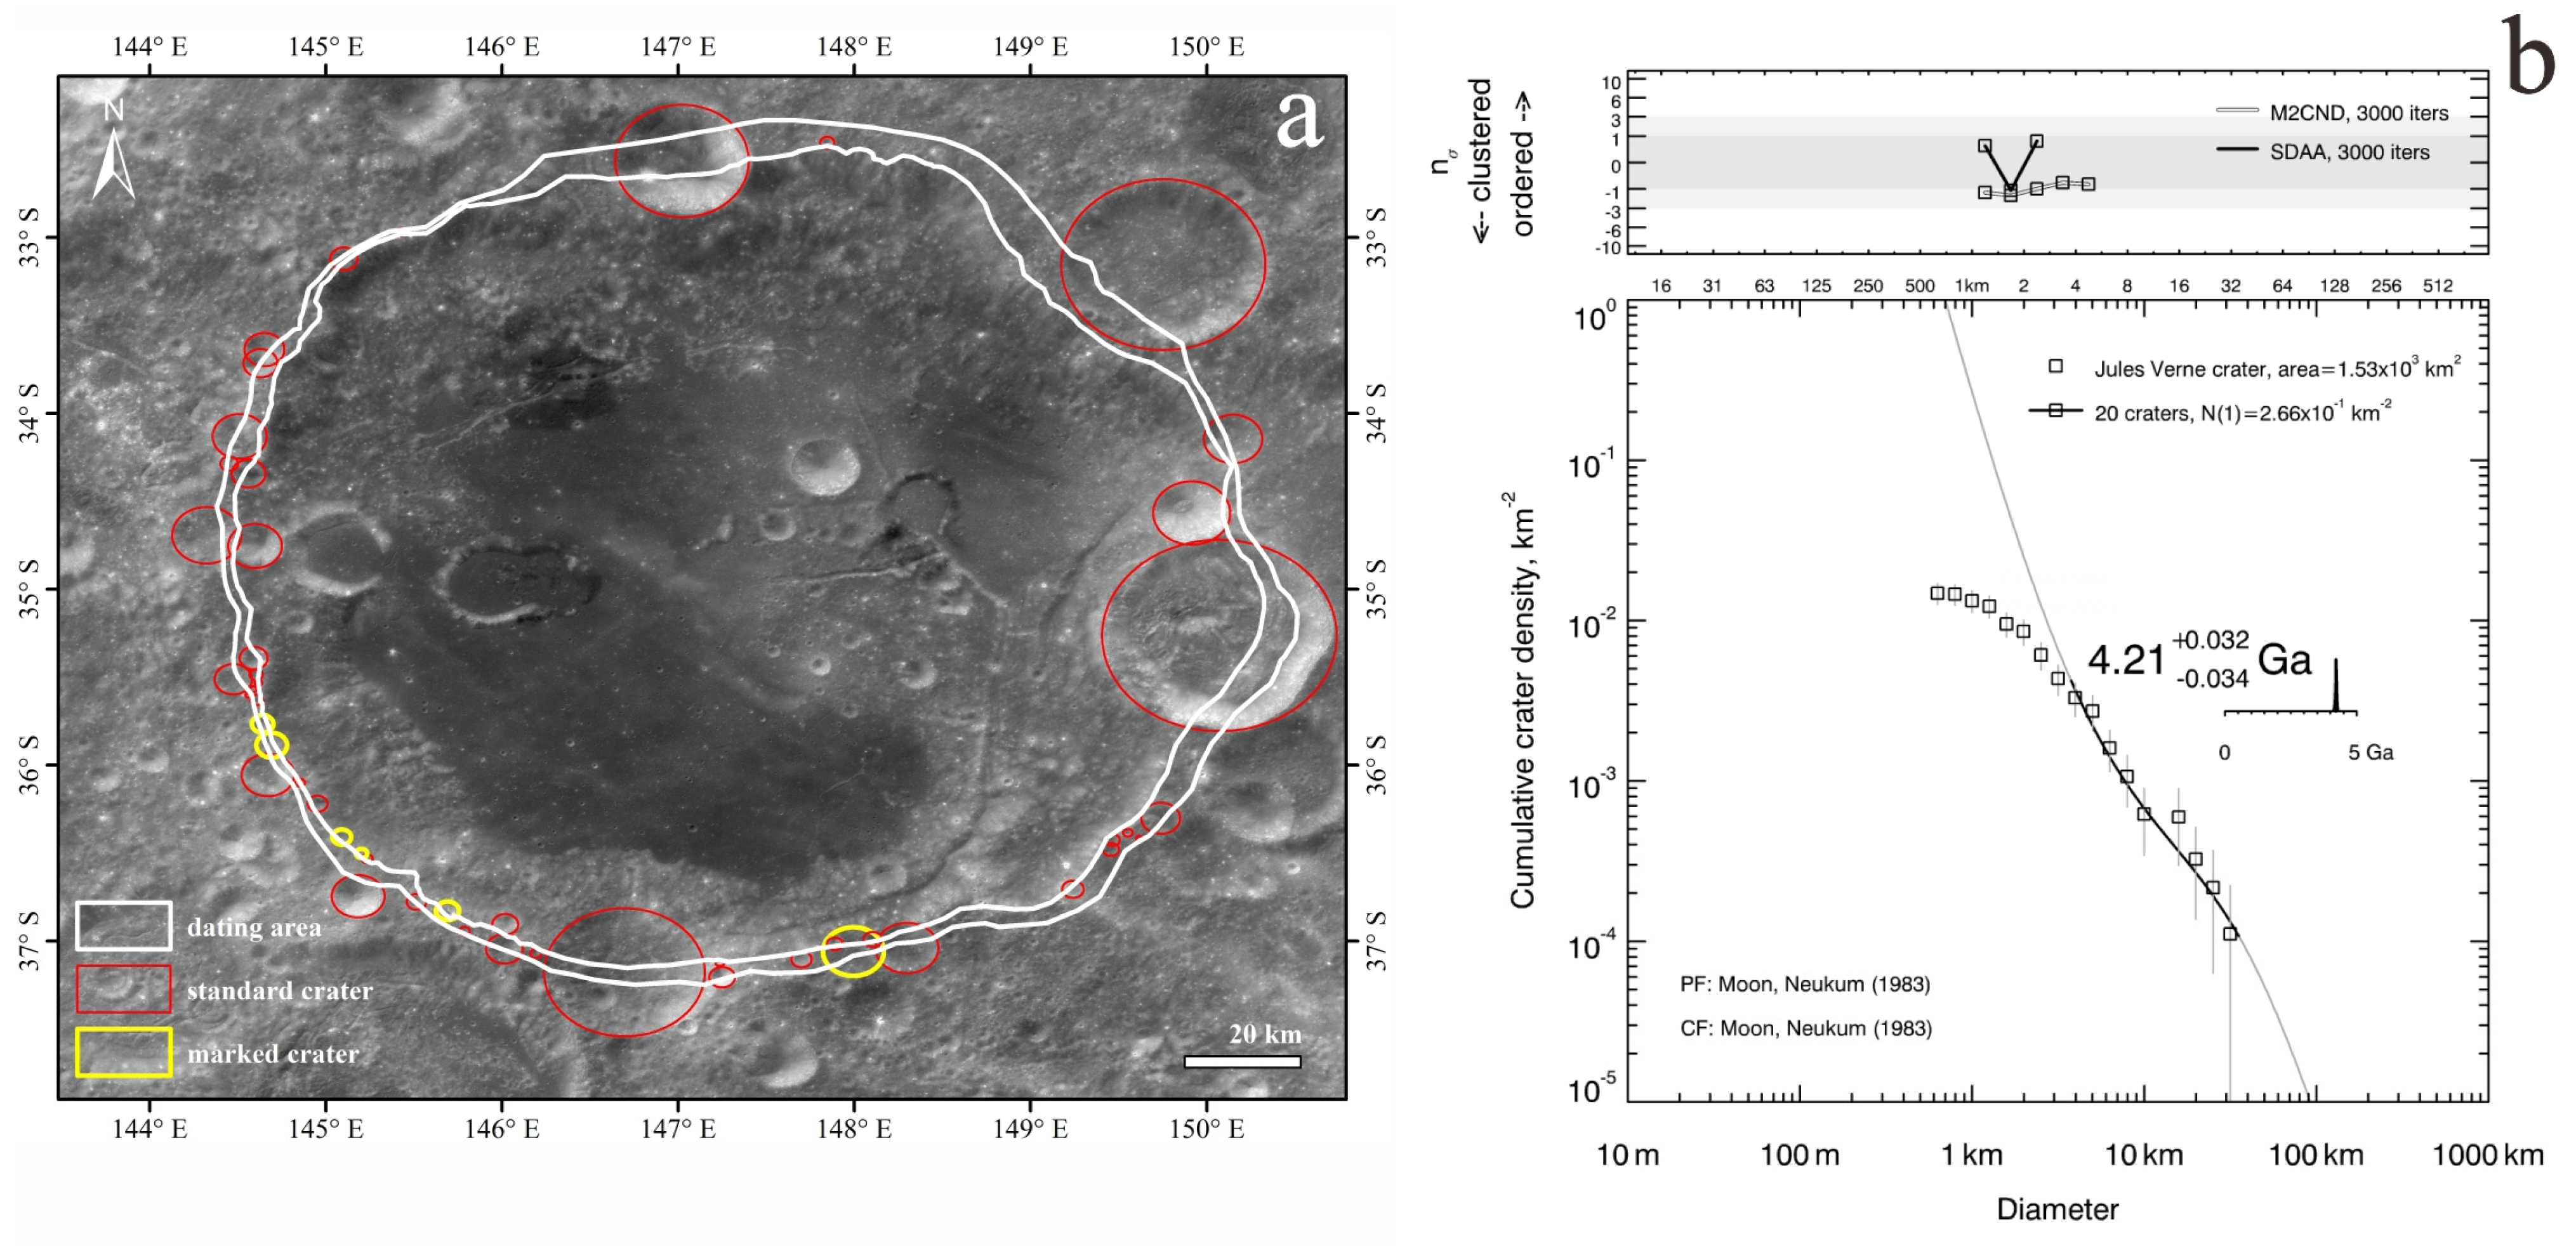
| Jules Verne crater | Ga | 2.66 × 10⁻¹ km−2 | 1530 | 3.8 km, 35 km |
Disclaimer/Publisher’s Note: The statements, opinions and data contained in all publications are solely those of the individual author(s) and contributor(s) and not of MDPI and/or the editor(s). MDPI and/or the editor(s) disclaim responsibility for any injury to people or property resulting from any ideas, methods, instructions or products referred to in the content. |
© 2025 by the authors. Licensee MDPI, Basel, Switzerland. This article is an open access article distributed under the terms and conditions of the Creative Commons Attribution (CC BY) license (https://creativecommons.org/licenses/by/4.0/).
Share and Cite
Wu, C.; Liu, J.; Michael, G.; Hiesinger, H.; van der Bogert, C.H.; Iqbal, W.; Zhu, K.; Liu, J. Evolutionary History of the Large-Scale Scarp in Jules Verne Crater, Moon. Remote Sens. 2025, 17, 1582. https://doi.org/10.3390/rs17091582
Wu C, Liu J, Michael G, Hiesinger H, van der Bogert CH, Iqbal W, Zhu K, Liu J. Evolutionary History of the Large-Scale Scarp in Jules Verne Crater, Moon. Remote Sensing. 2025; 17(9):1582. https://doi.org/10.3390/rs17091582
Chicago/Turabian StyleWu, Congzhe, Jianzhong Liu, Gregory Michael, Harald Hiesinger, Carolyn H. van der Bogert, Wajiha Iqbal, Kai Zhu, and Jingwen Liu. 2025. "Evolutionary History of the Large-Scale Scarp in Jules Verne Crater, Moon" Remote Sensing 17, no. 9: 1582. https://doi.org/10.3390/rs17091582
APA StyleWu, C., Liu, J., Michael, G., Hiesinger, H., van der Bogert, C. H., Iqbal, W., Zhu, K., & Liu, J. (2025). Evolutionary History of the Large-Scale Scarp in Jules Verne Crater, Moon. Remote Sensing, 17(9), 1582. https://doi.org/10.3390/rs17091582