
Glacier Area and Surface Flow Velocity Variations for 2016–2024 in the West Kunlun Mountains Based on Time-Series Sentinel-2 Images
Abstract
1. Introduction
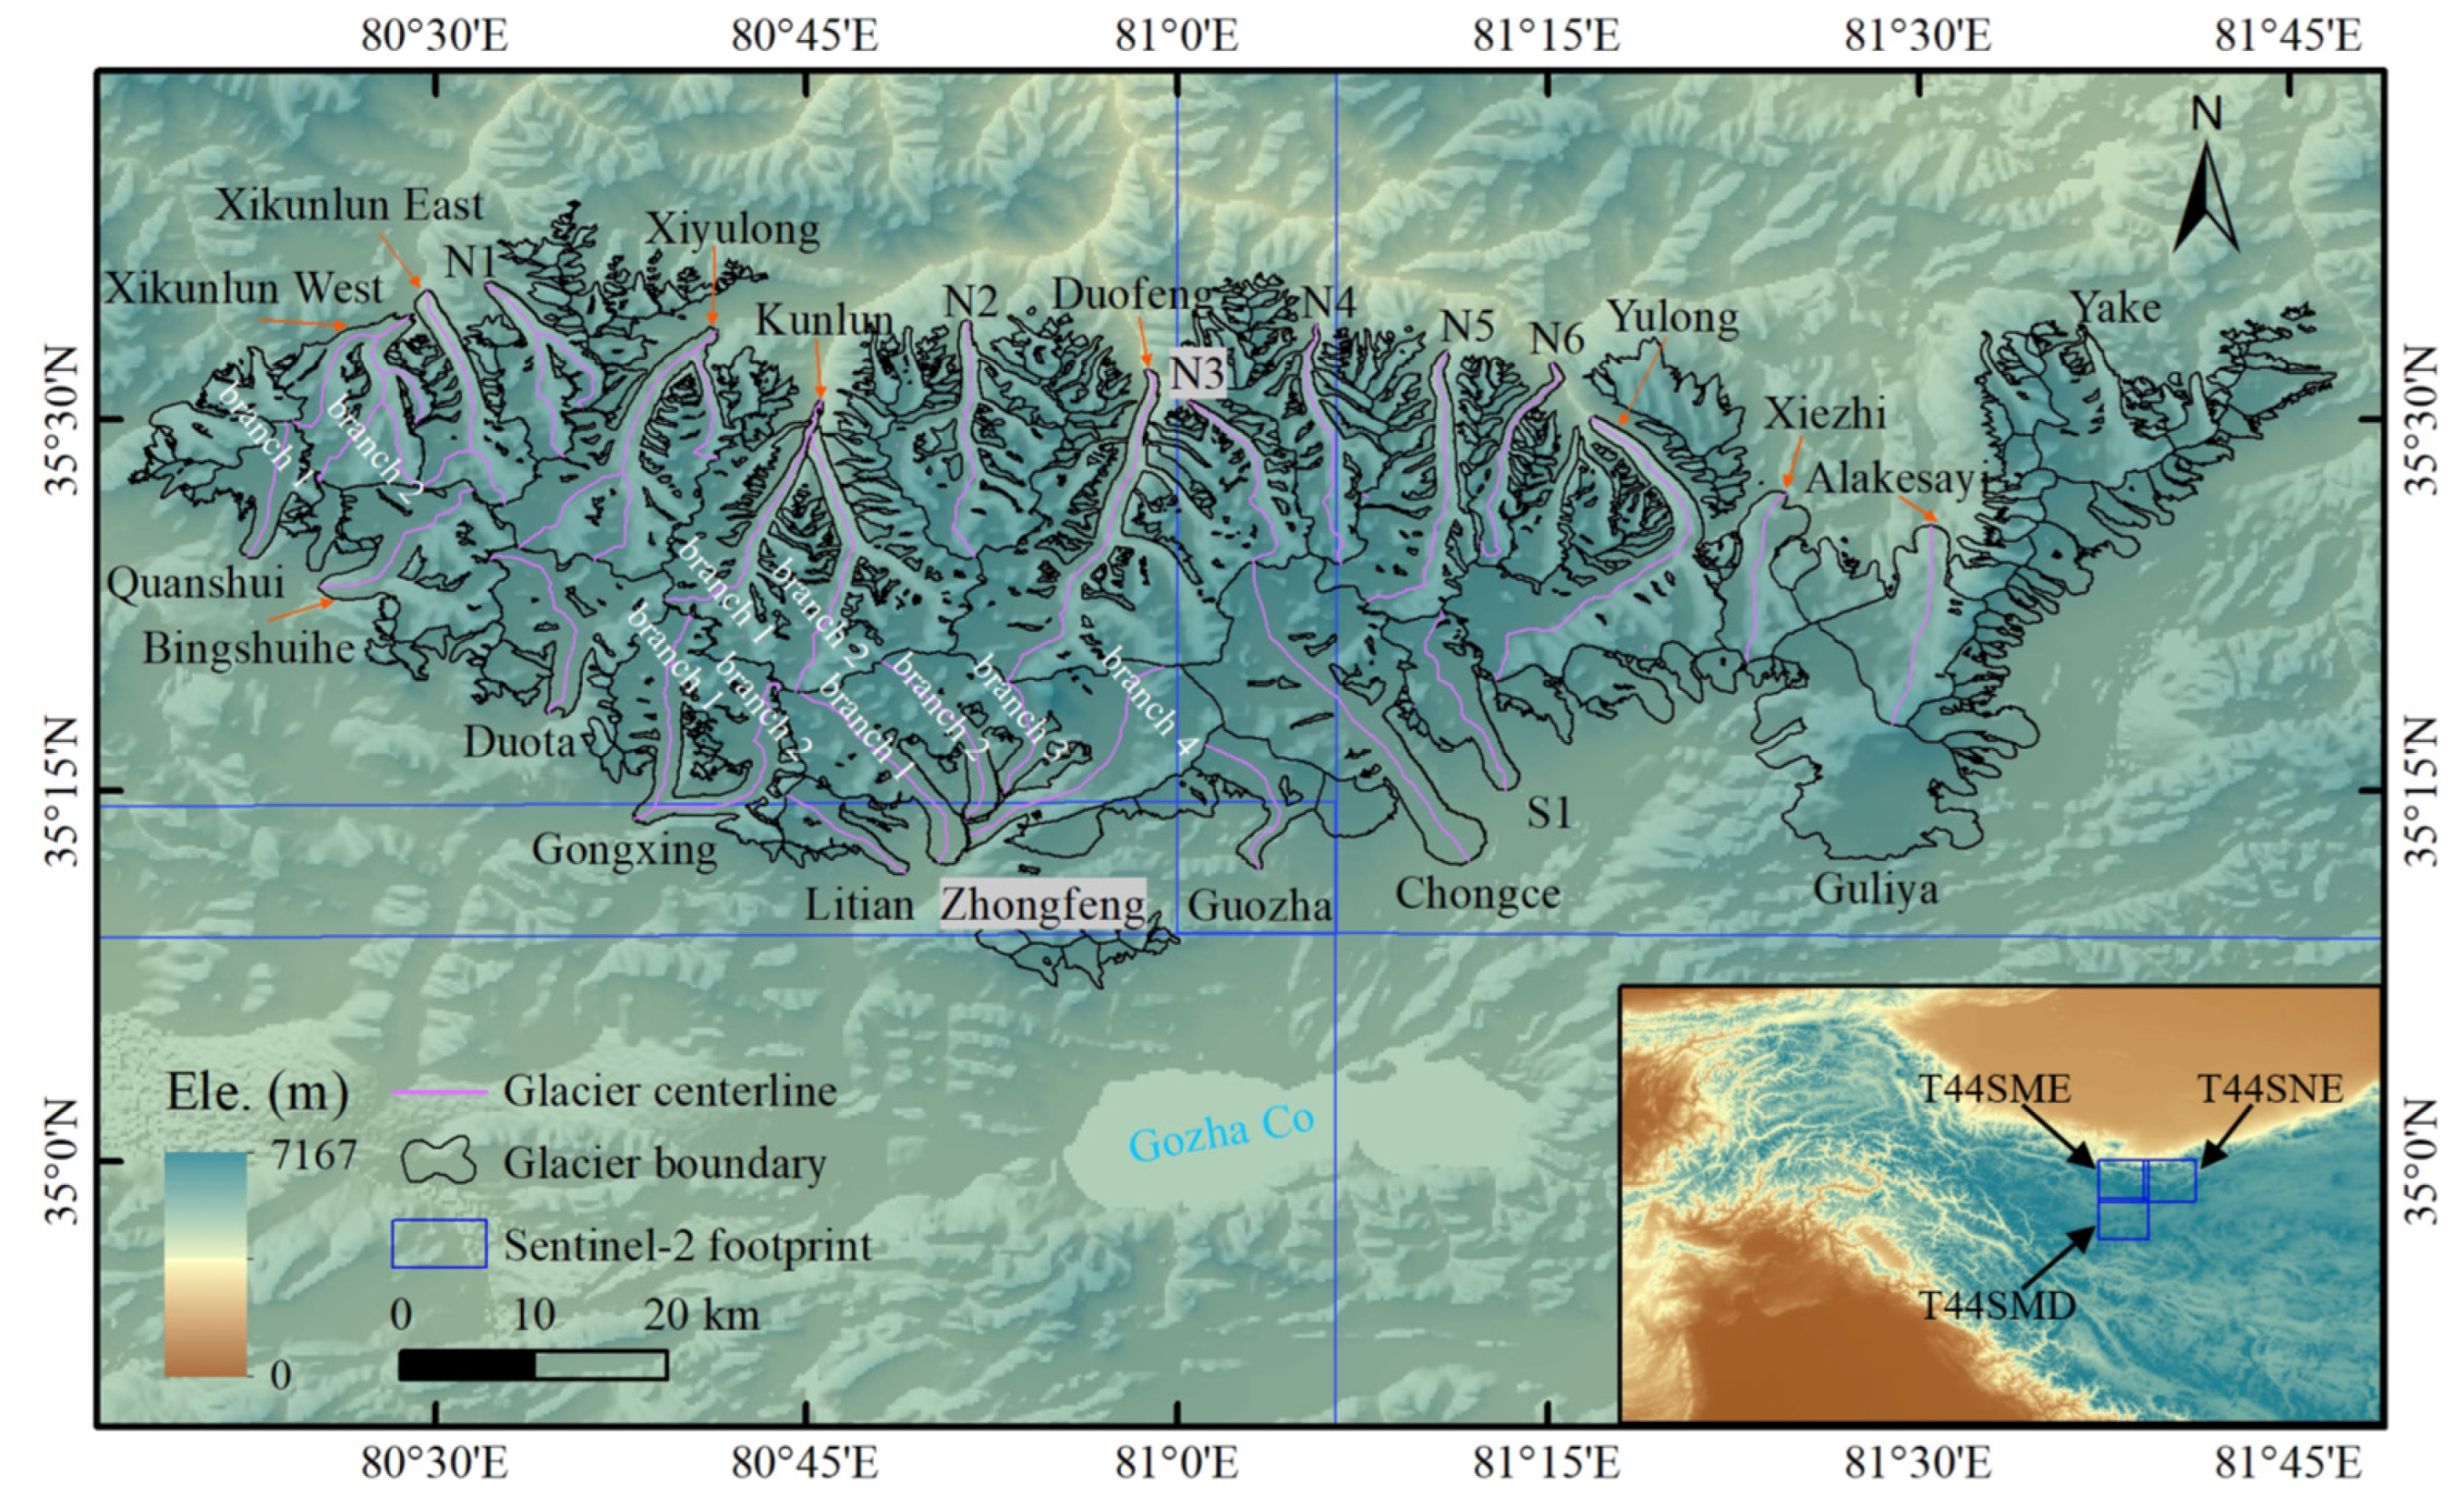
2. Study Area
3. Data and Methods
3.1. Data
3.1.1. Sentinel-2
3.1.2. SRTM DEM
3.1.3. ERA5-Land Data
3.2. Methods
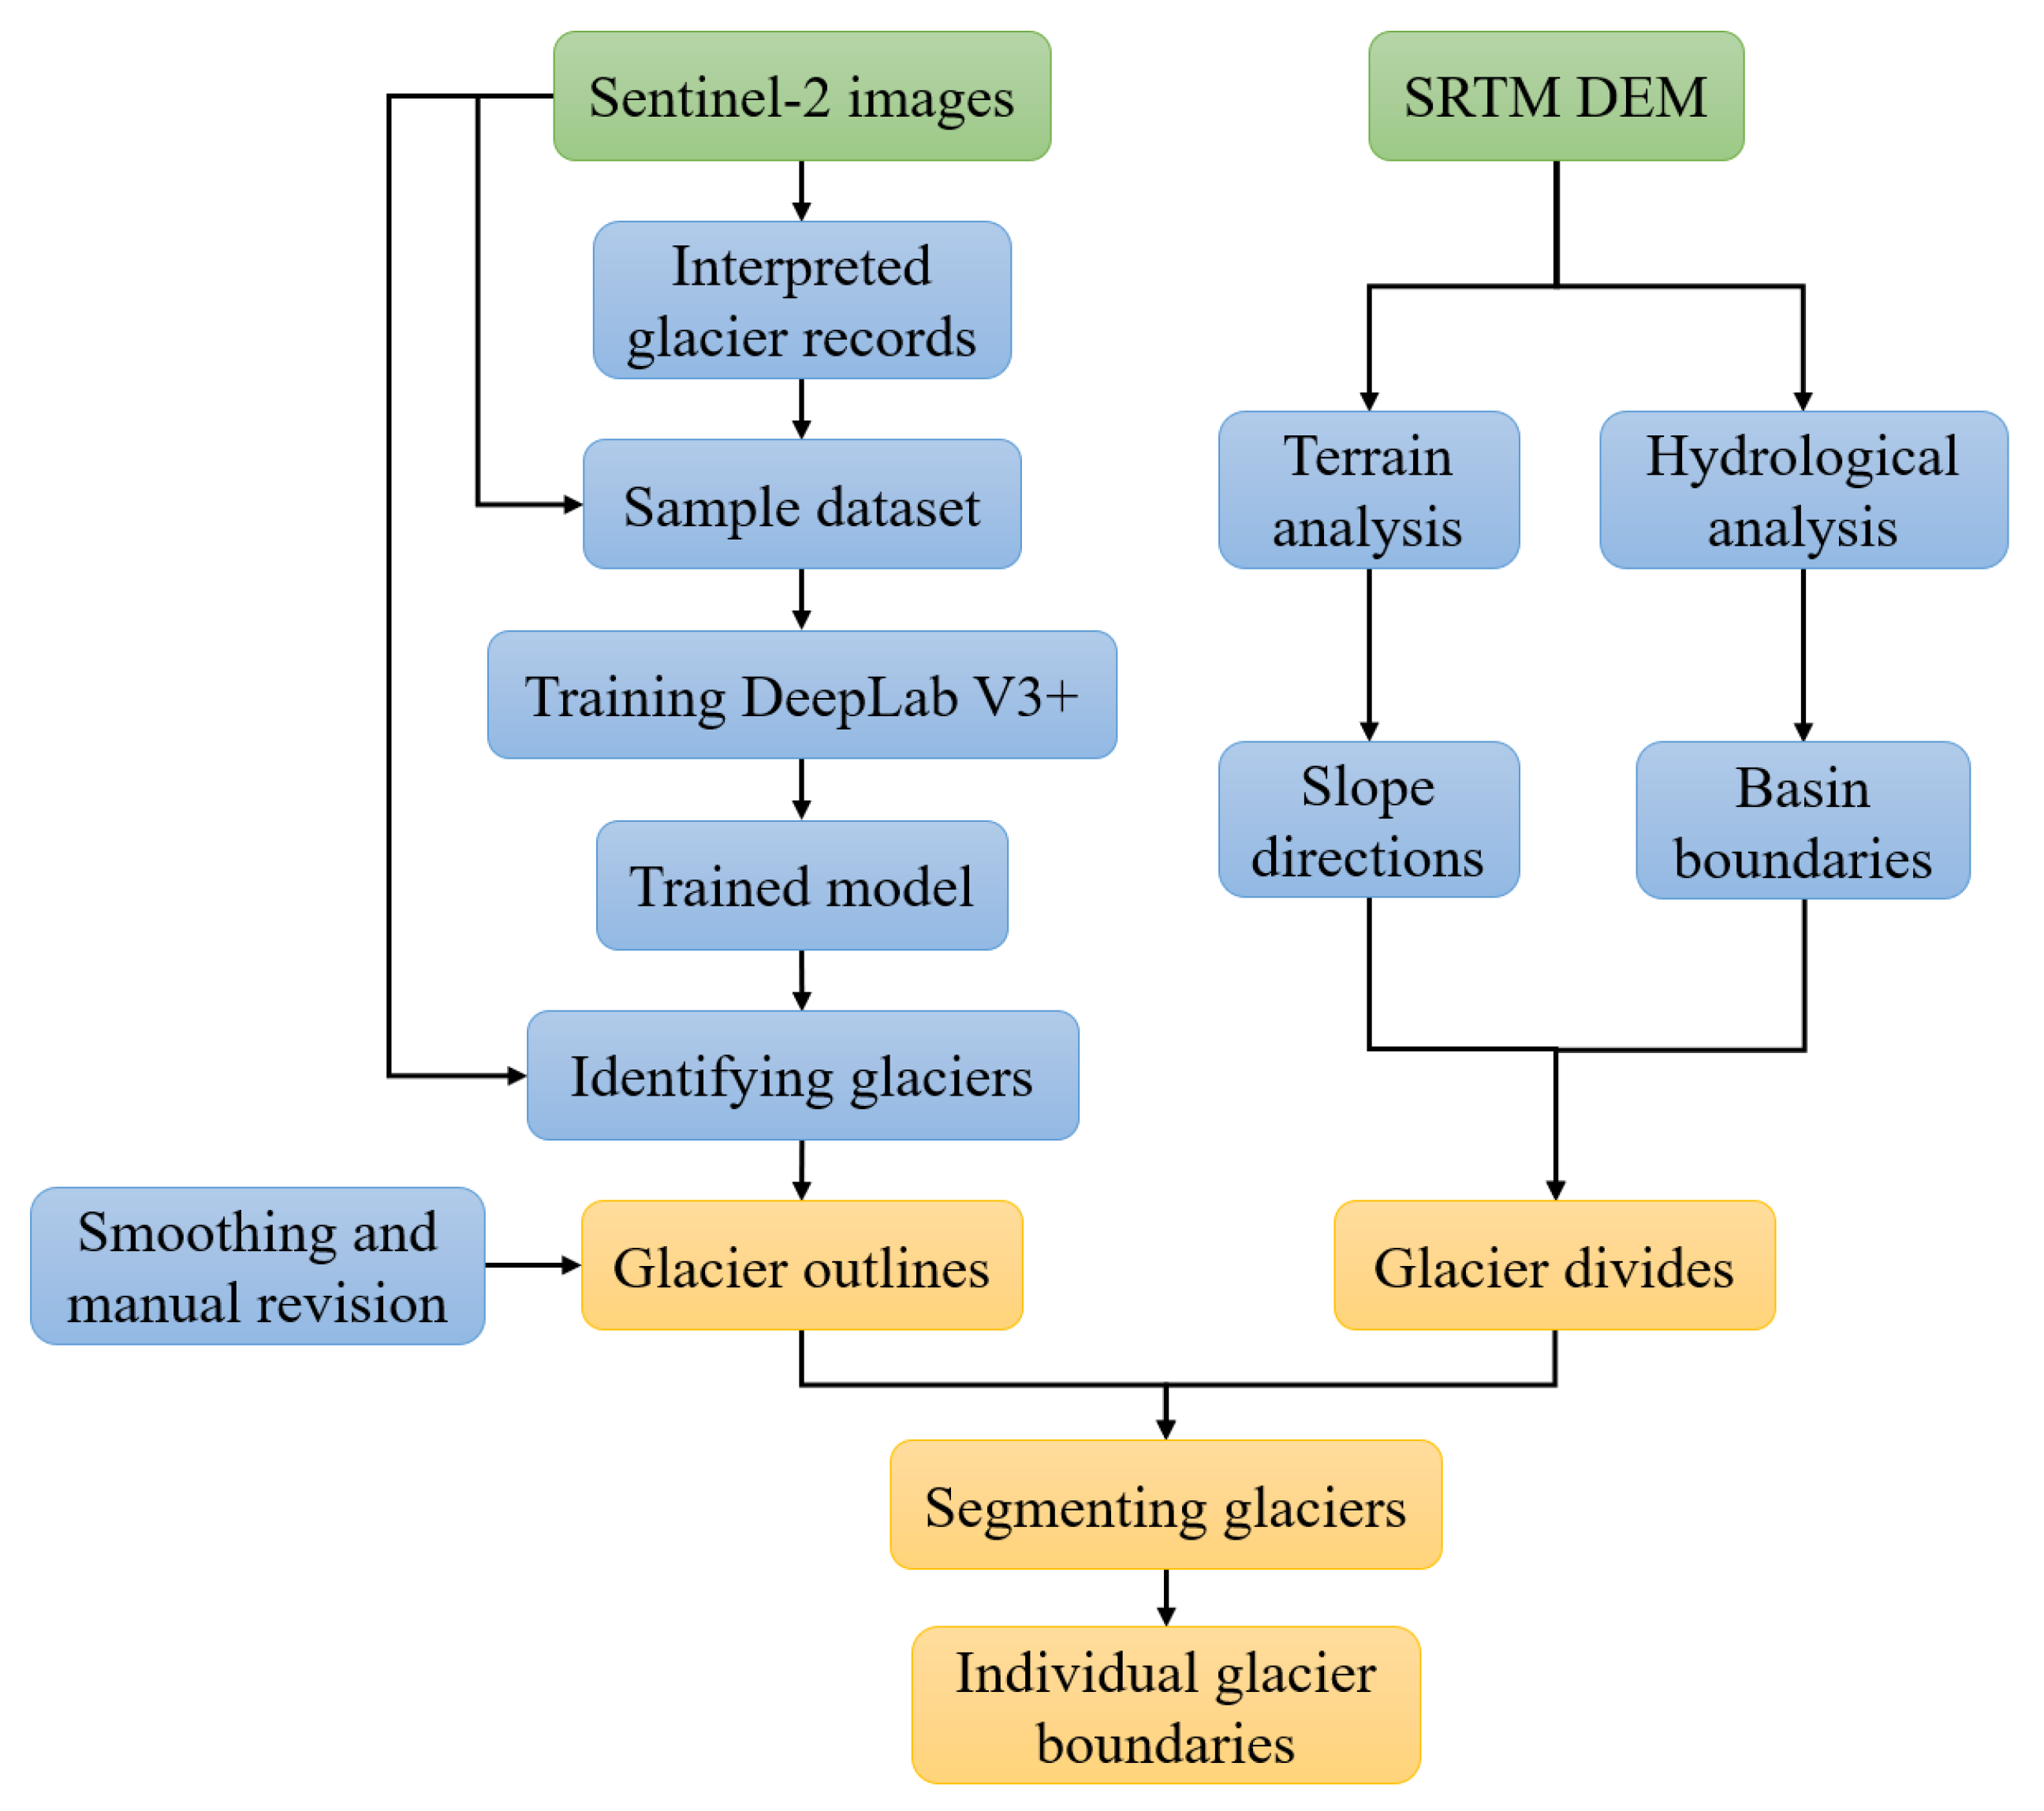
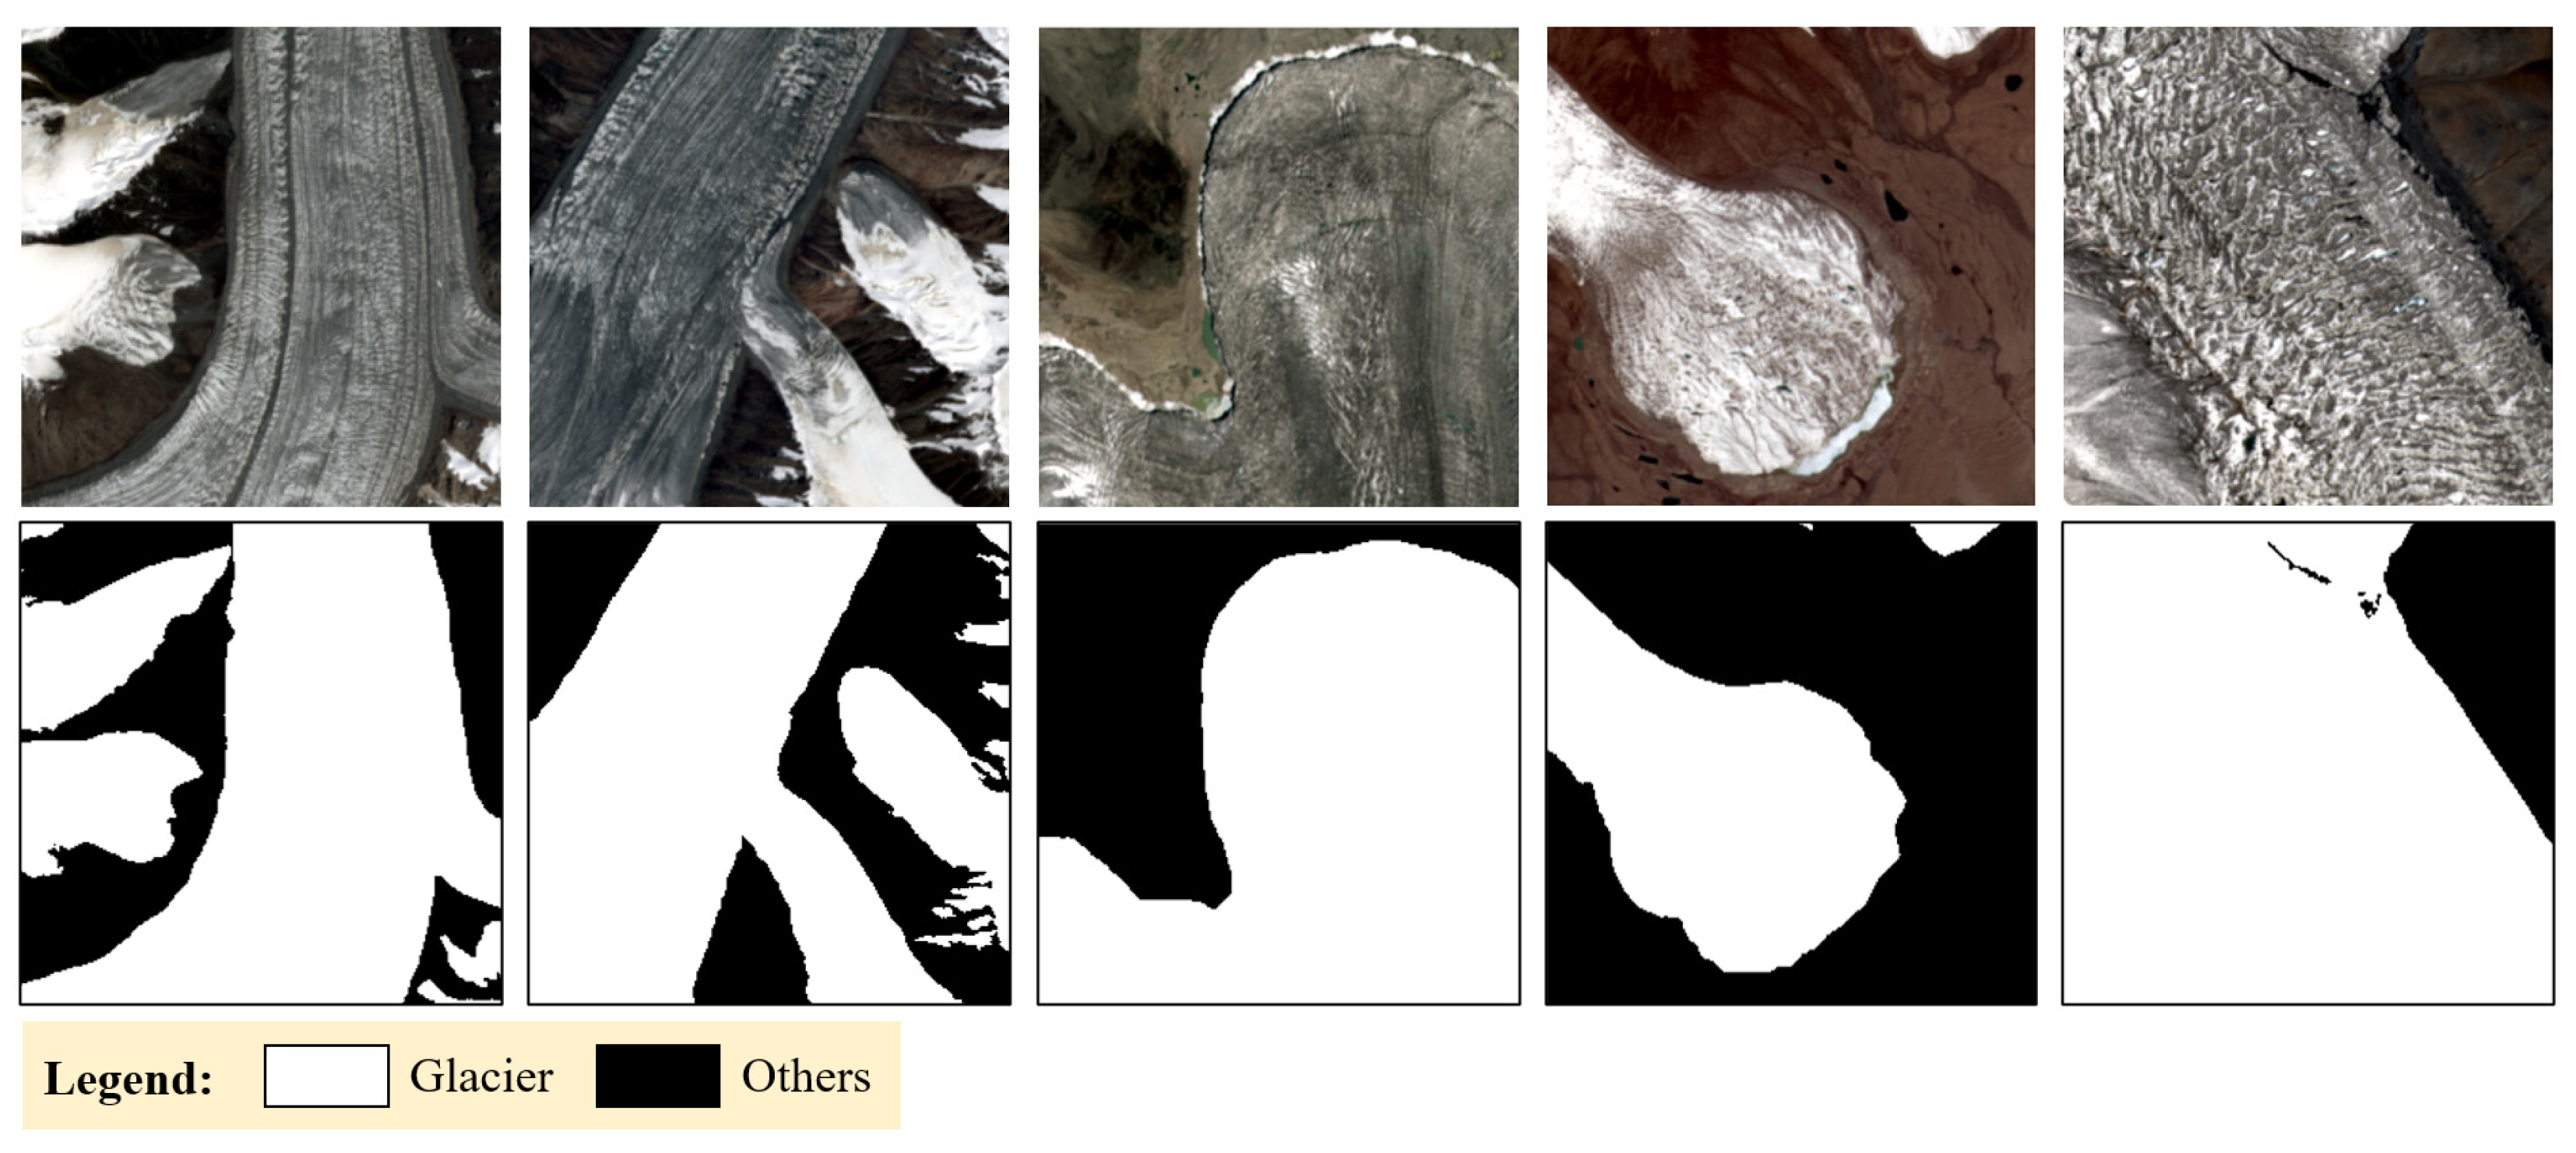
3.2.1. Glacier Boundary Delineation
3.2.2. Glacier Velocity Estimation
3.2.3. Uncertainty Assessment
4. Results
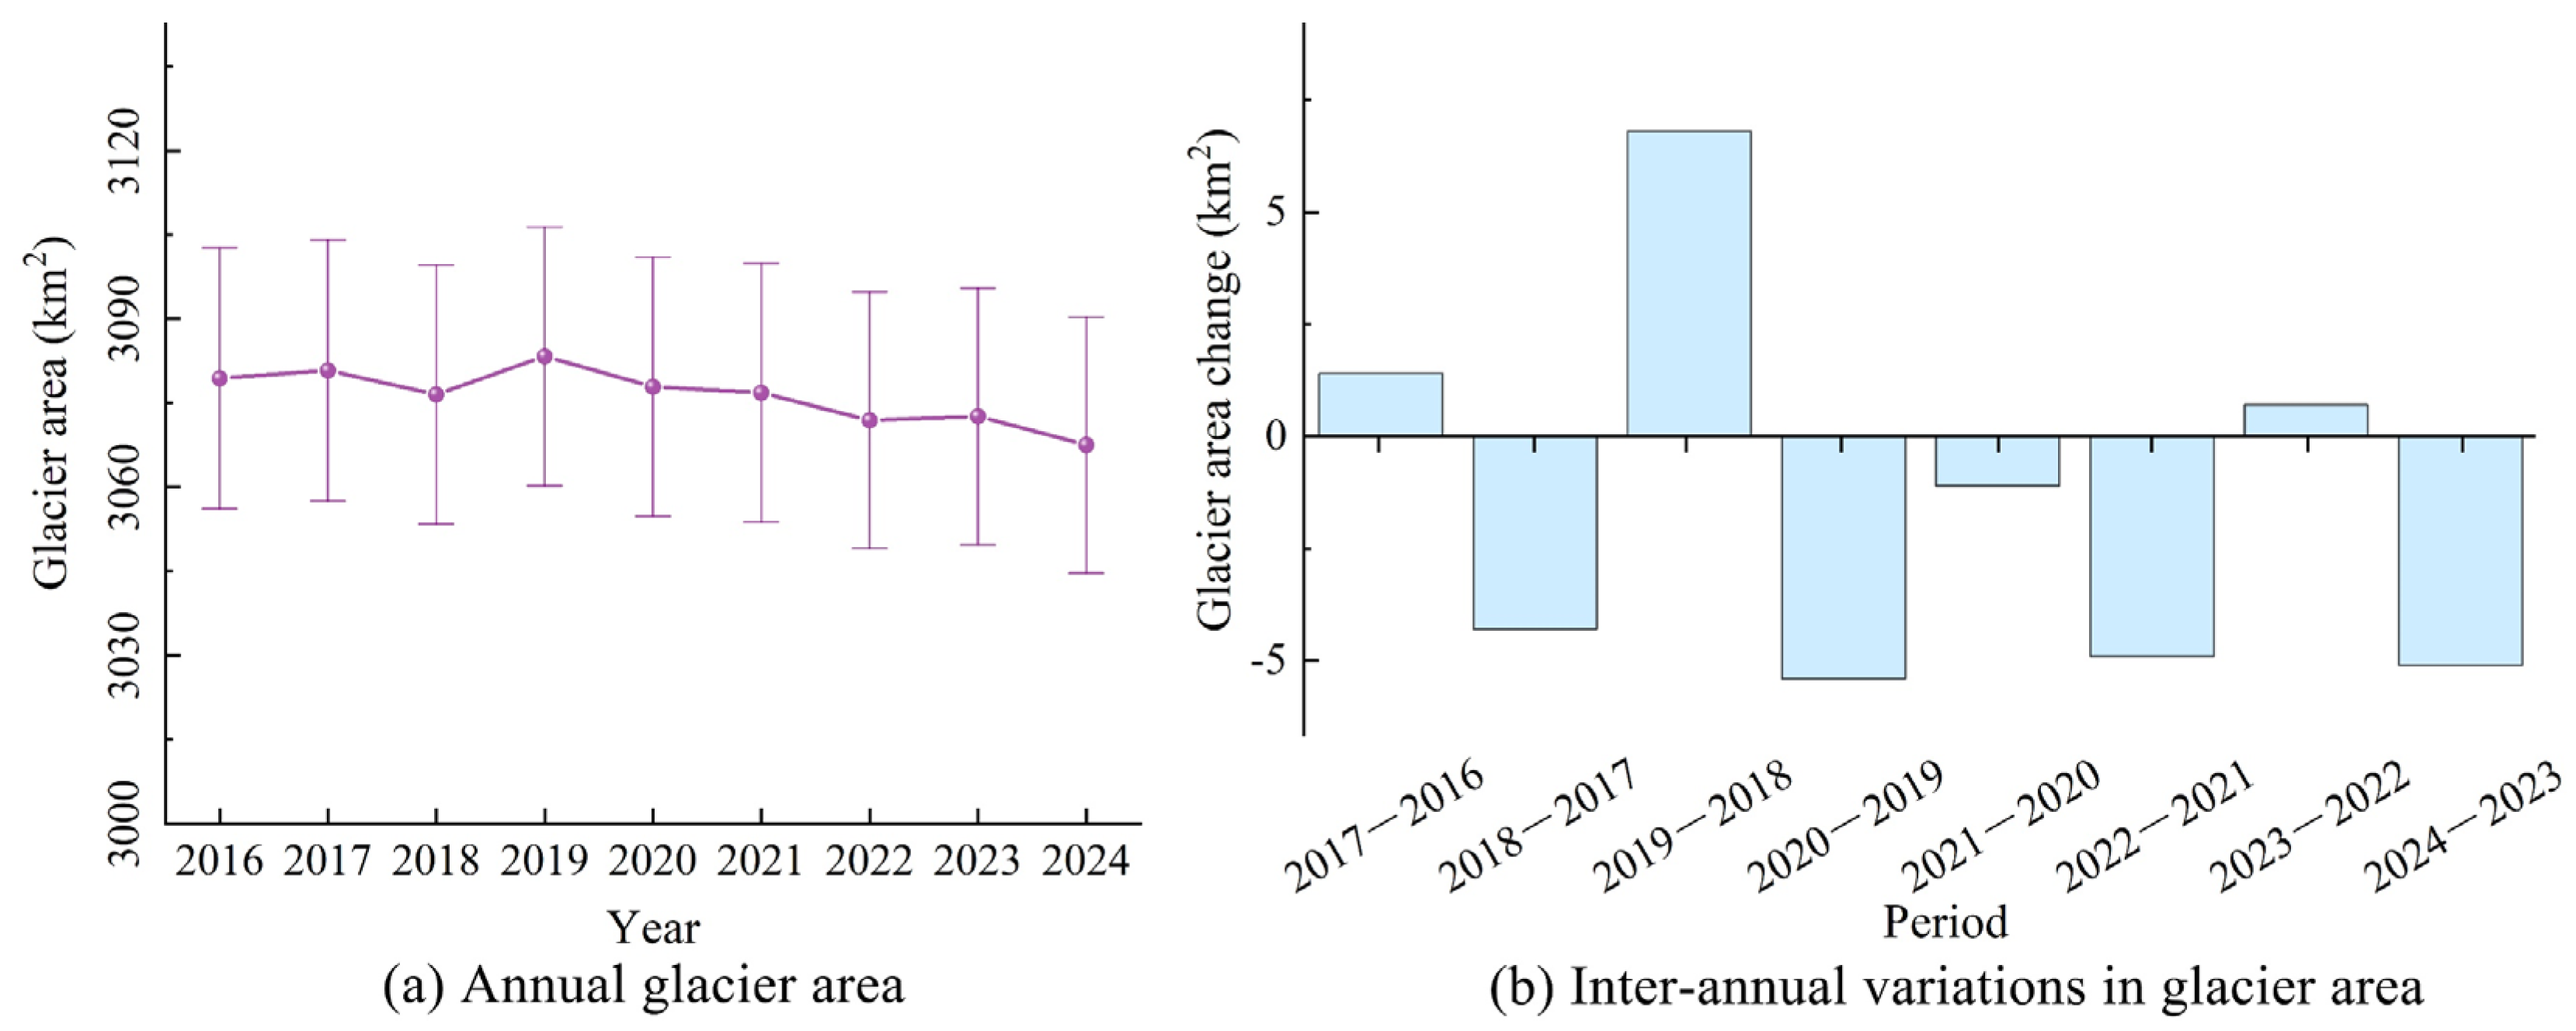
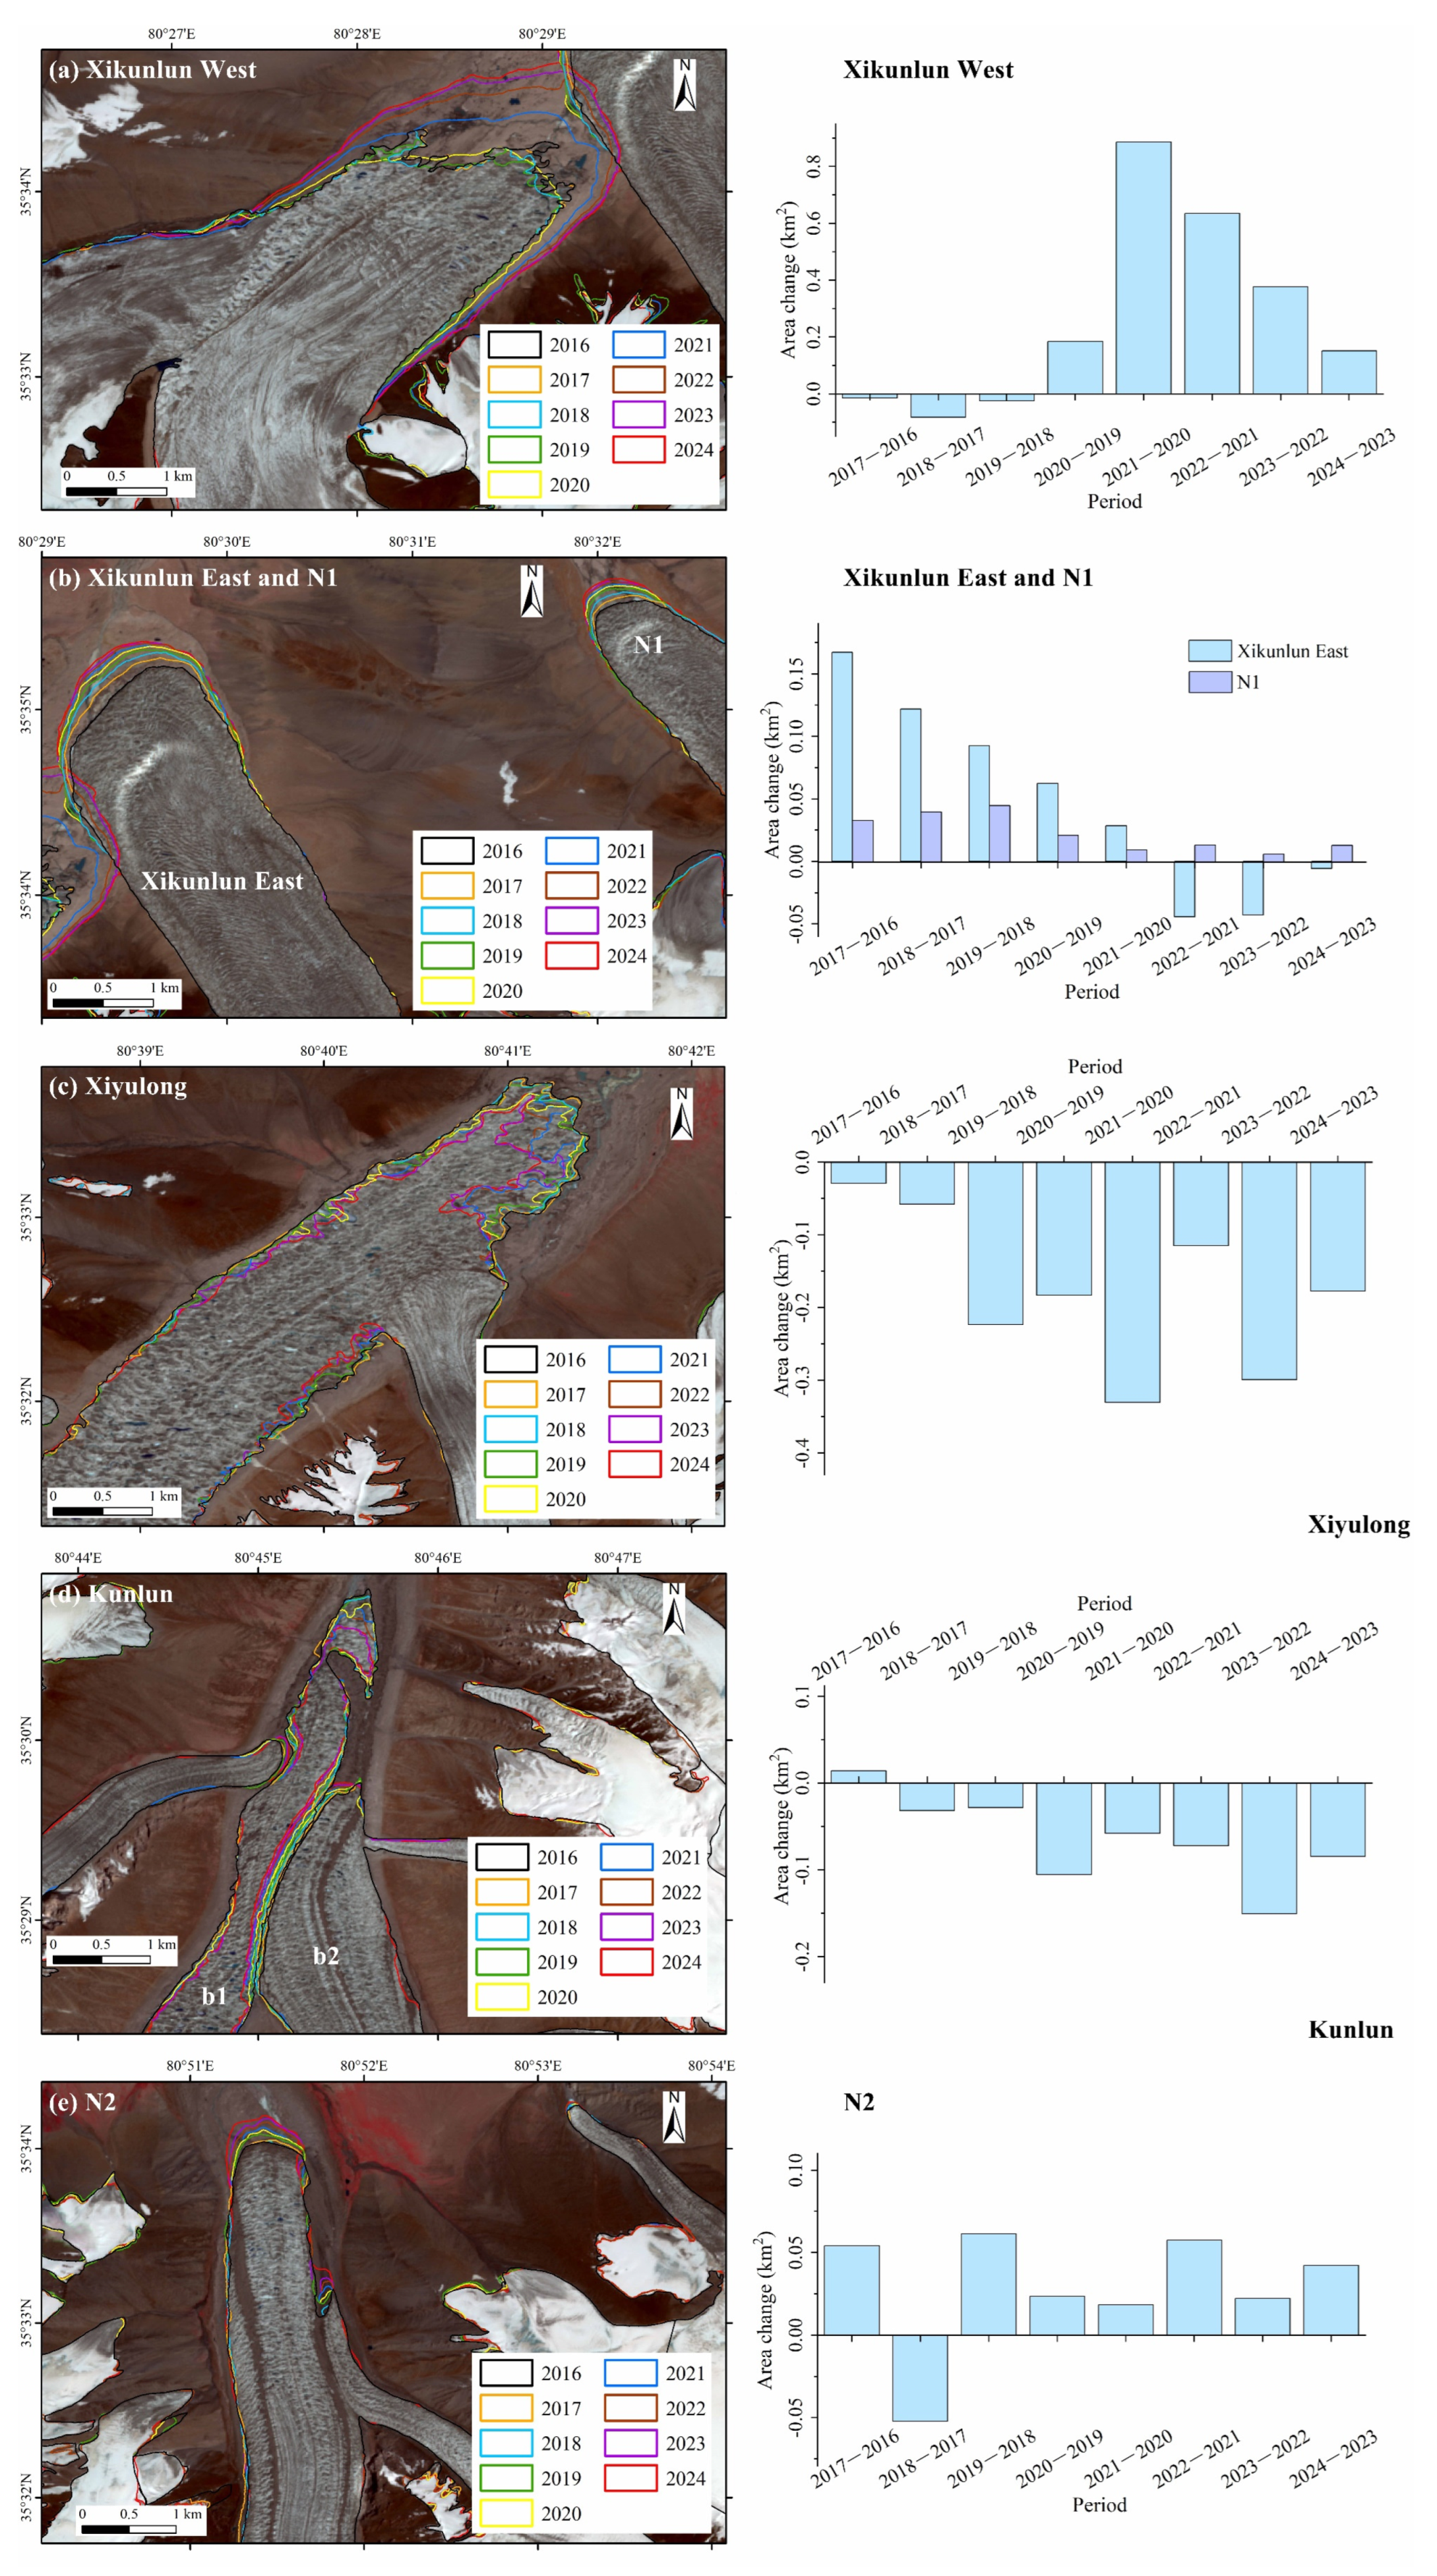
4.1. Characteristics of Glacier Area Change
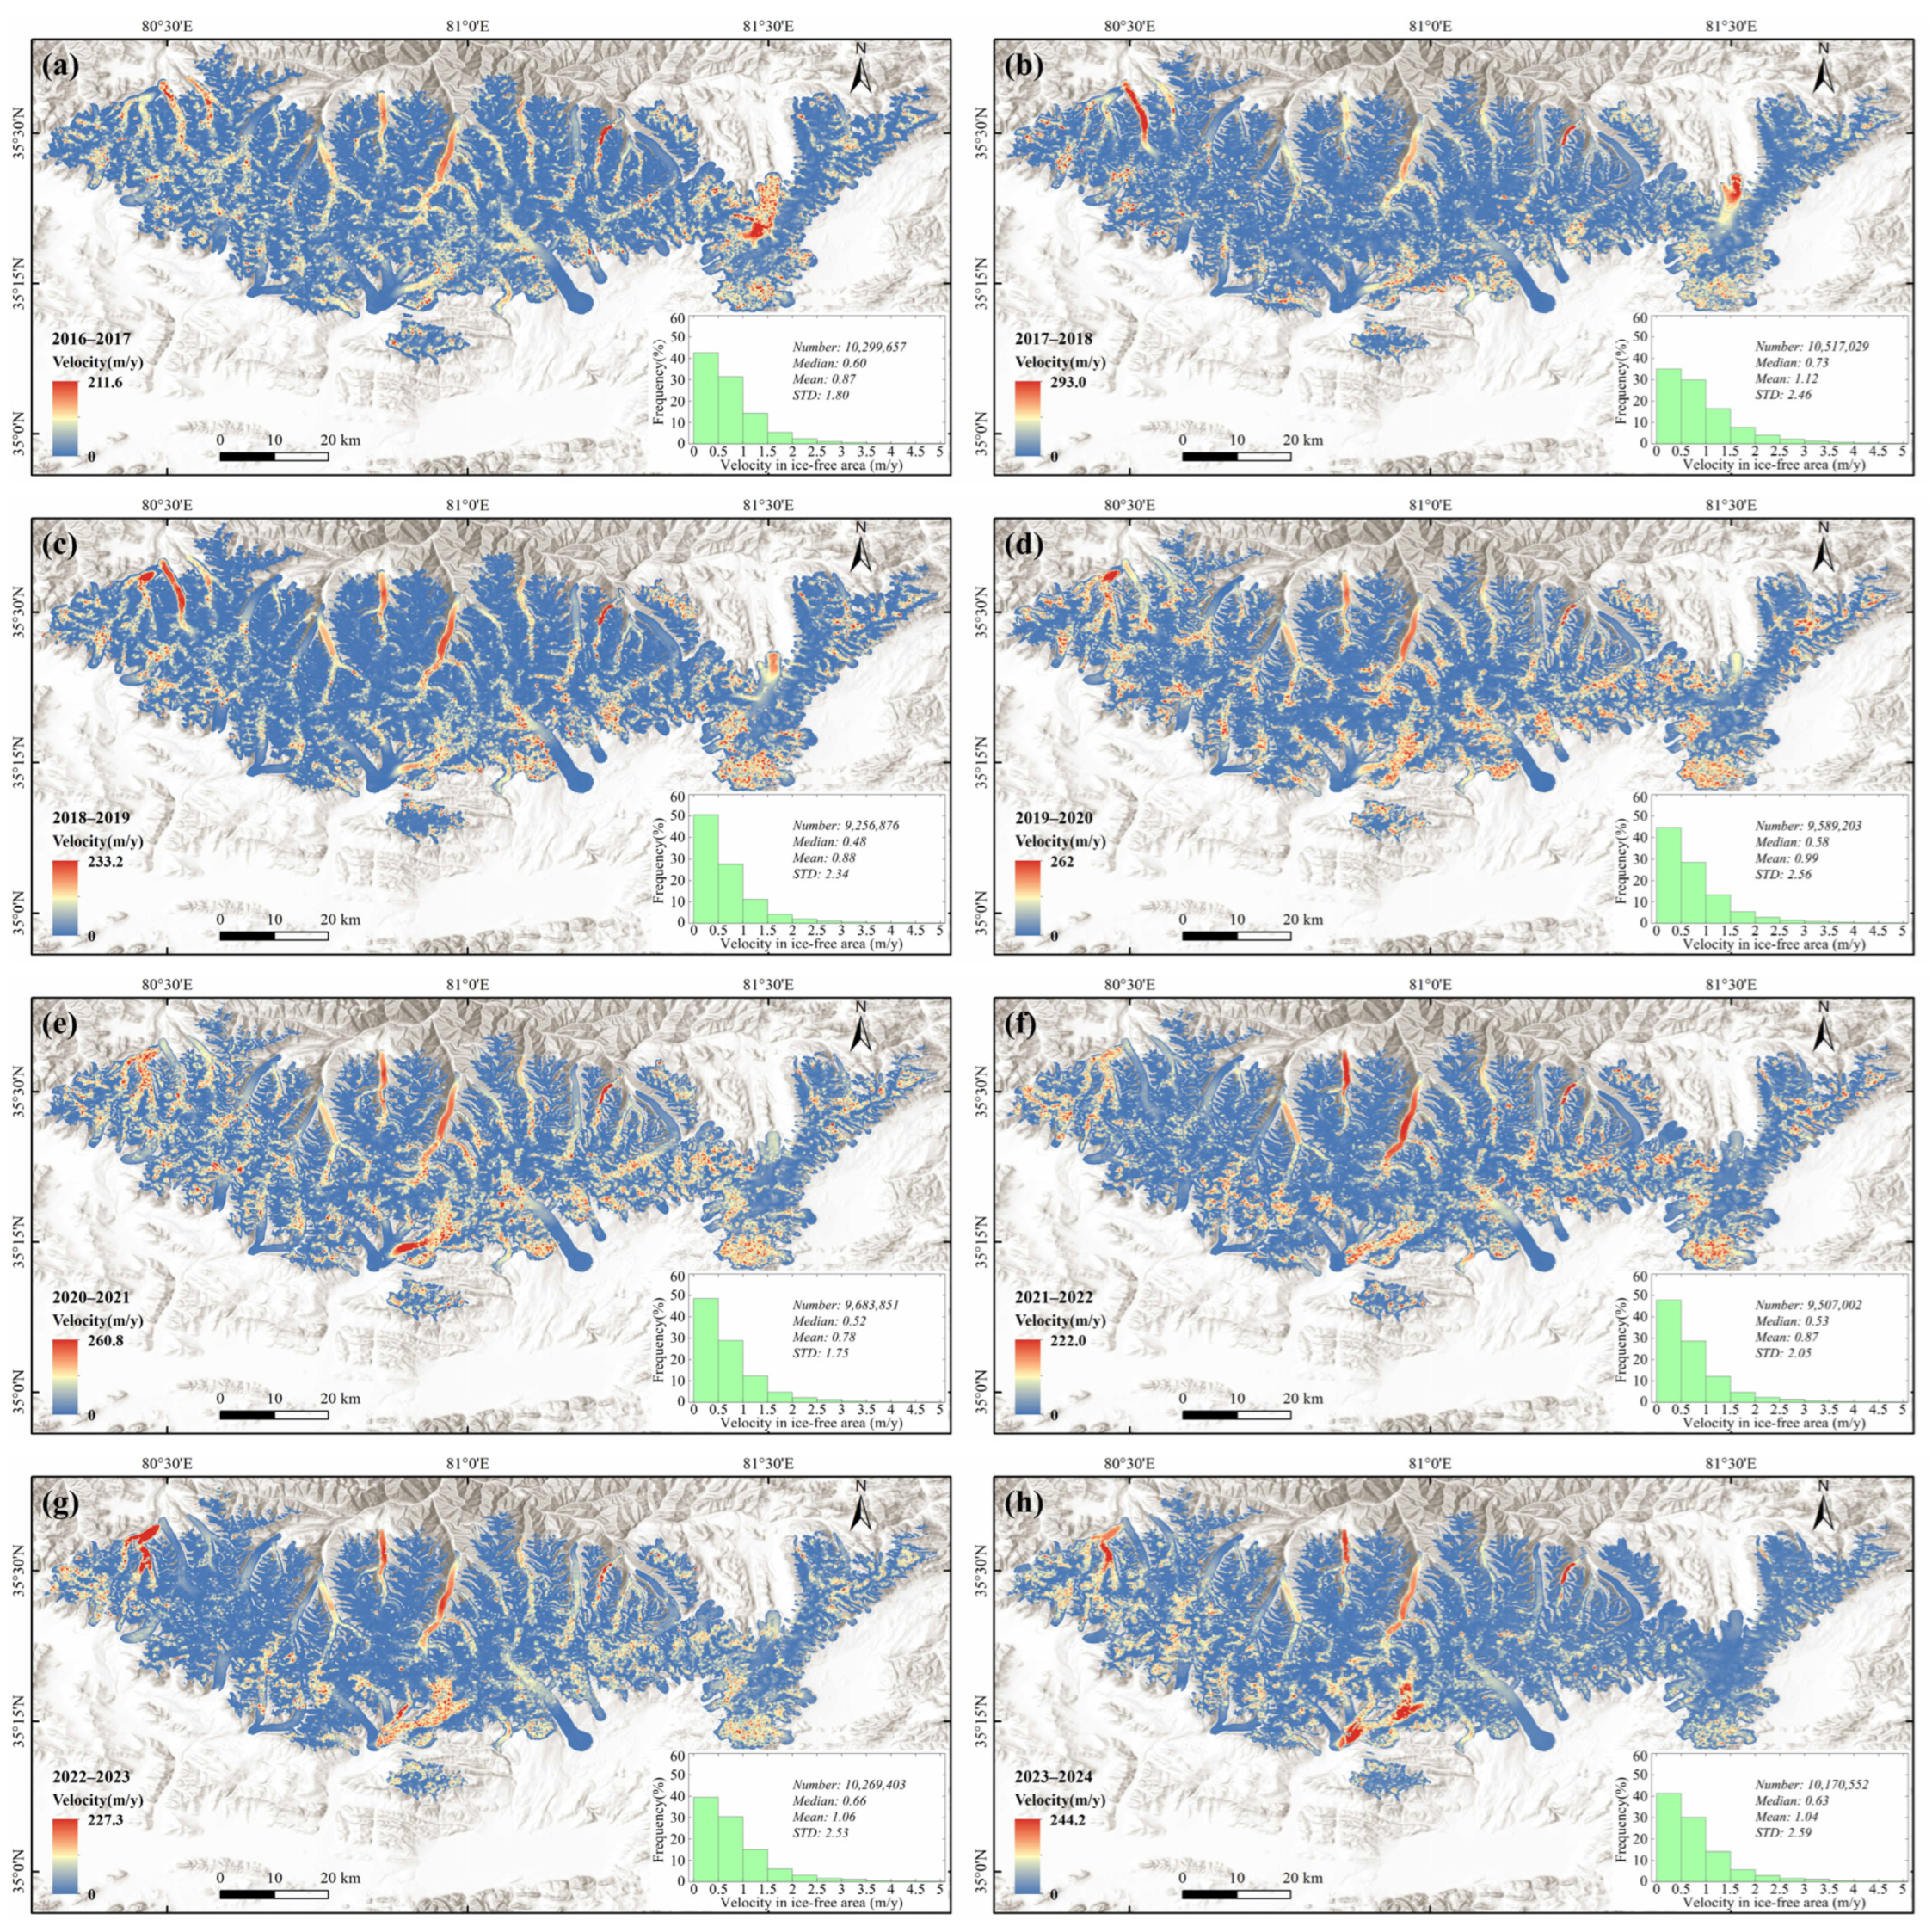
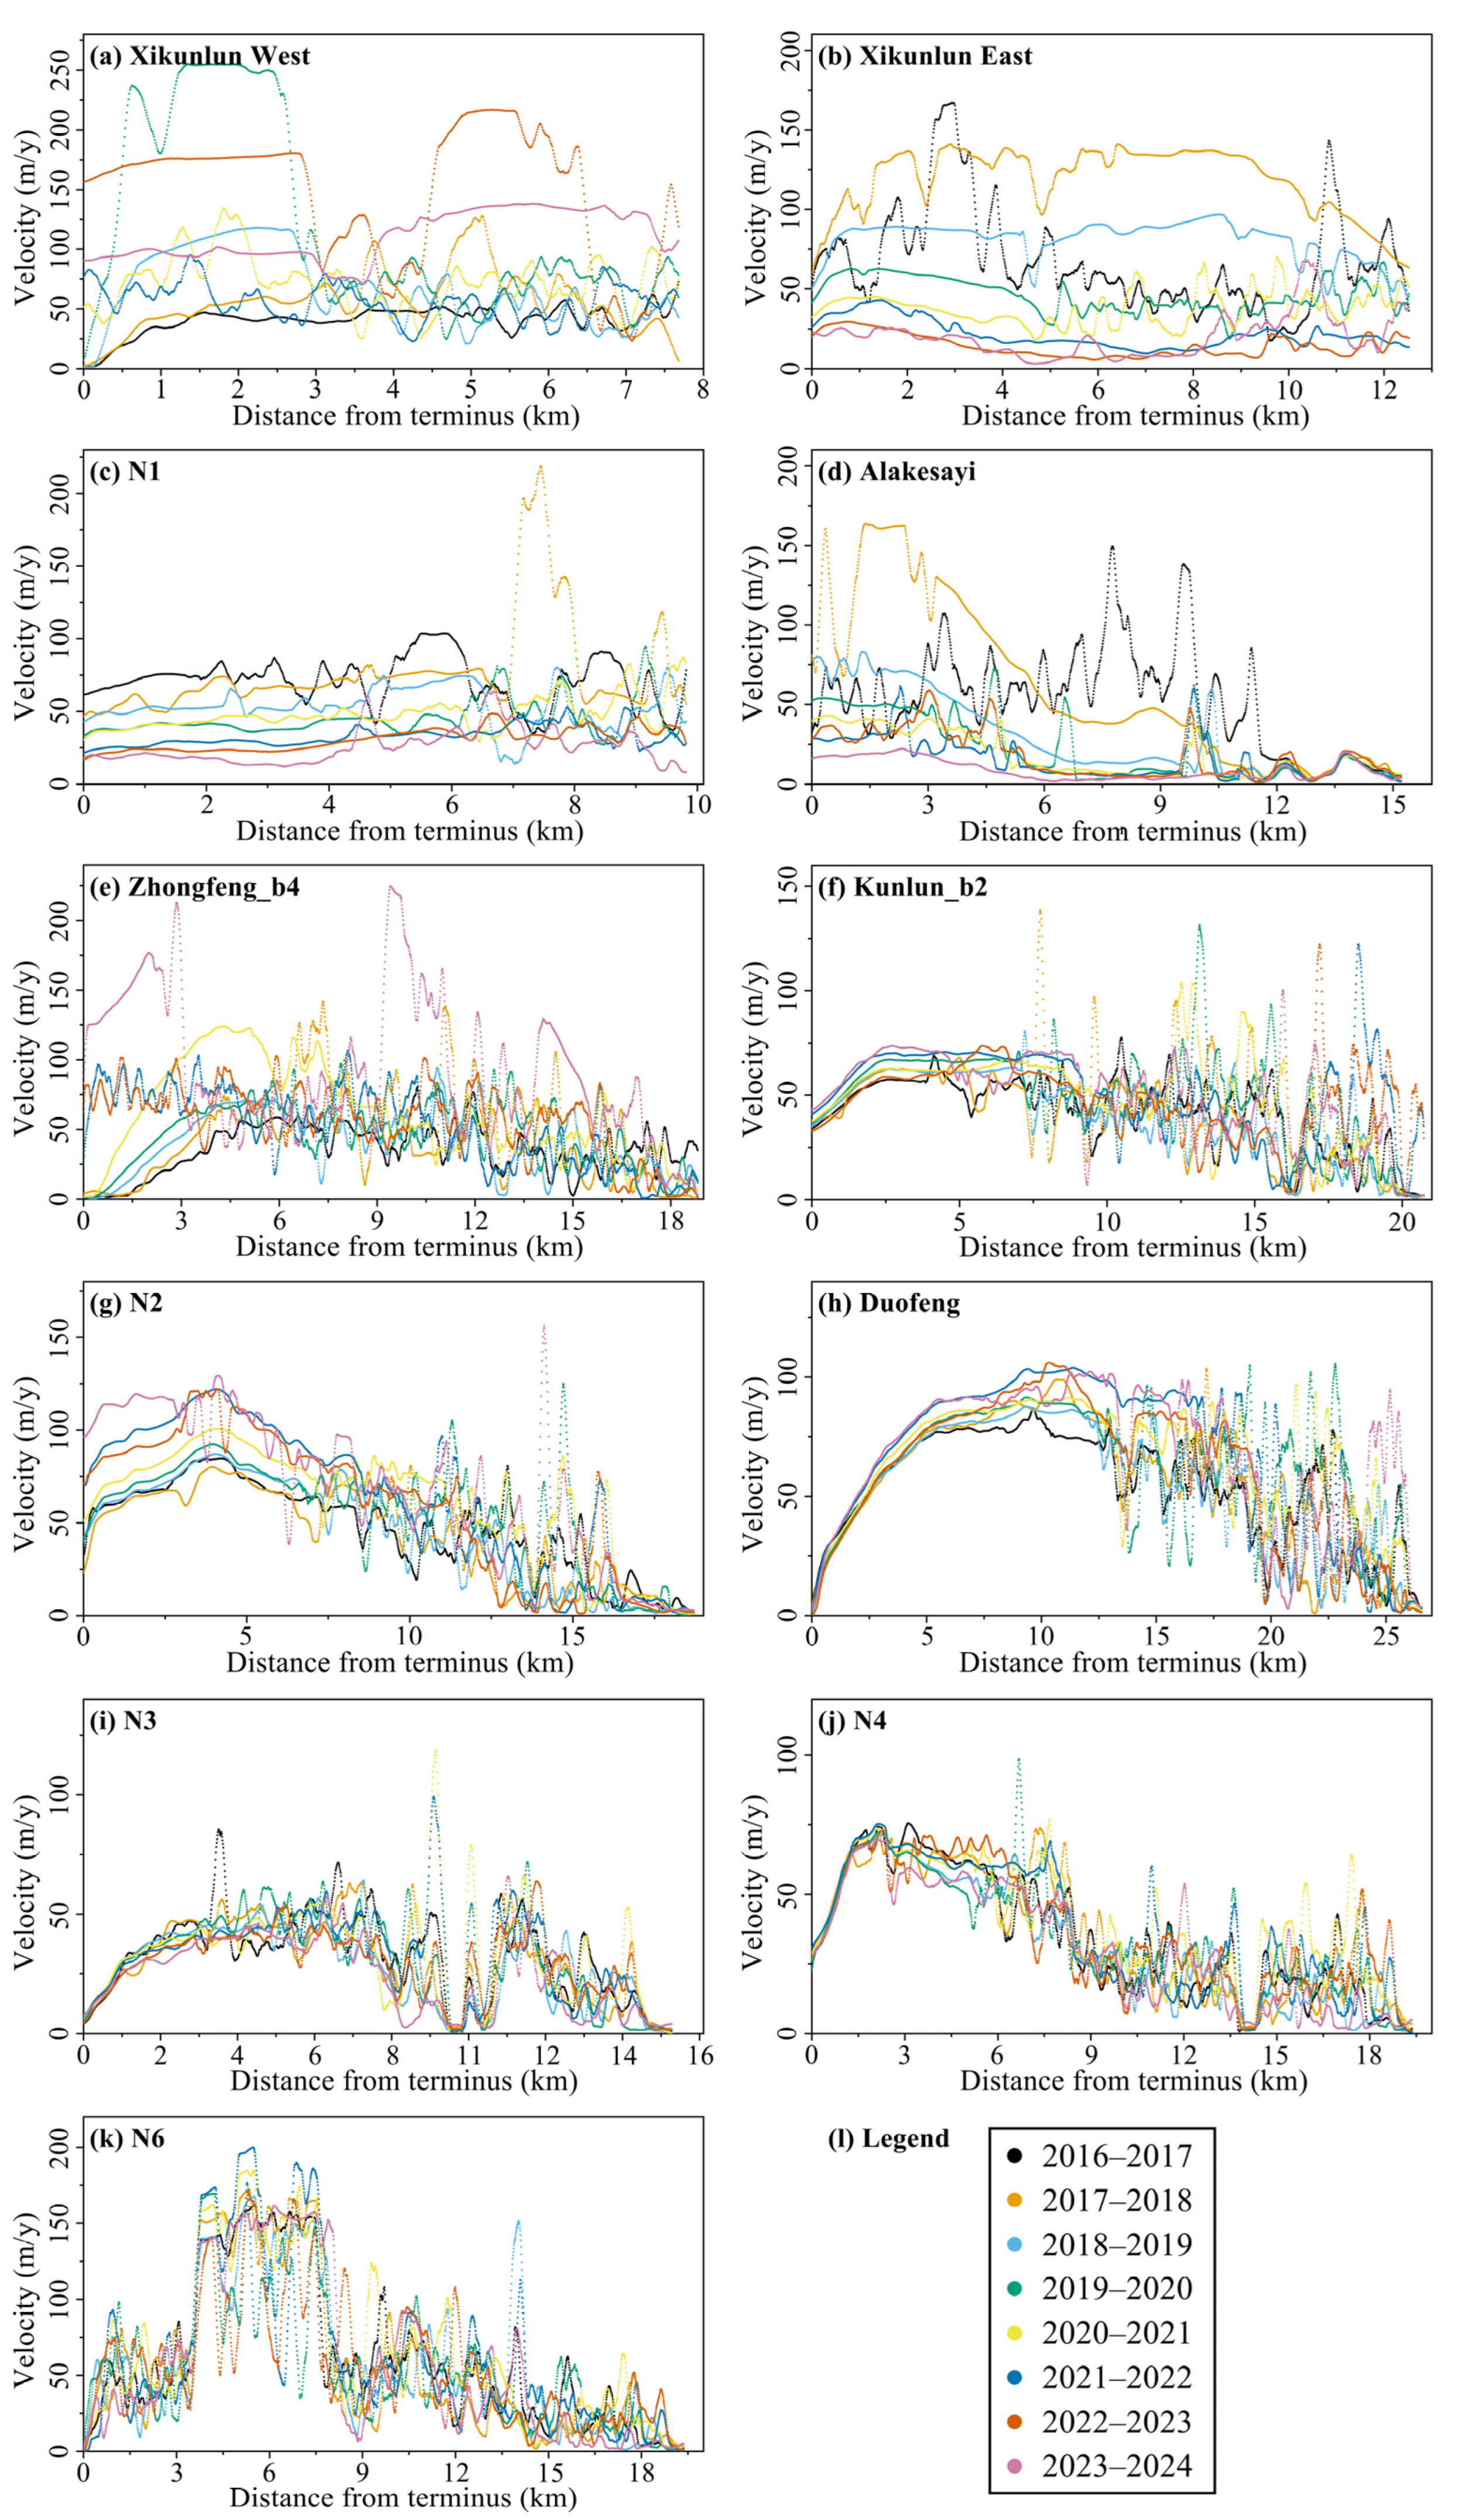
4.2. Characteristics of Glacier Velocity Change
4.3. Glacier Terminus Change
5. Discussion
5.1. A Comparison with Previous Glacier Area and Velocity Studies
5.2. Surge Glaciers During the Study Period
5.3. The Relationship Between Climate Change and Glacier Dynamics
6. Conclusions
Author Contributions
Funding
Data Availability Statement
Acknowledgments
Conflicts of Interest
References
- Zhang, C.; Yao, X.; Li, S.; Liu, L.; Sha, T.; Zhang, Y. Glacier Change in the West Kunlun Main Peak Area from 2000 to 2020. Remote Sens. 2023, 15, 4236. [Google Scholar] [CrossRef]
- Zhou, Y.; Li, Z.; Li, J.; Zhao, R.; Ding, X. Glacier mass balance in the Qinghai–Tibet Plateau and its surroundings from the mid-1970s to 2000 based on Hexagon KH-9 and SRTM DEMs. Remote Sens. Environ. 2018, 210, 96–112. [Google Scholar] [CrossRef]
- Wang, Y.; Li, J.; Wu, L.; Guo, L.; Hu, J.; Zhang, X. Estimating the changes in glaciers and glacial lakes in the xixabangma massif, central himalayas, between 1974 and 2018 from multisource remote sensing data. Remote Sens. 2021, 13, 3903. [Google Scholar] [CrossRef]
- Bolch, T.; Kulkarni, A.; Kääb, A.; Huggel, C.; Paul, F.; Cogley, J.G.; Frey, H.; Kargel, J.S.; Fujita, K.; Scheel, M. The state and fate of Himalayan glaciers. Science 2012, 336, 310–314. [Google Scholar] [CrossRef]
- Zhu, Y.; Liu, S.; Wei, J.; Wu, K.; Bolch, T.; Xu, J.; Guo, W.; Jiang, Z.; Xie, F.; Yi, Y. Glacier-level and gridded mass change in the rivers’ sources in the eastern Tibetan Plateau (ETPR) from 1970s to 2000. Earth Syst. Sci. Data Discuss. 2024, 2024, 1–28. [Google Scholar]
- Yao, T.; Thompson, L.; Yang, W.; Yu, W.; Gao, Y.; Guo, X.; Yang, X.; Duan, K.; Zhao, H.; Xu, B. Different glacier status with atmospheric circulations in Tibetan Plateau and surroundings. Nat. Clim. Chang. 2012, 2, 663–667. [Google Scholar] [CrossRef]
- Ren, W.; Zhu, Z.; Wang, Y.; Su, J.; Zeng, R.; Zheng, D.; Li, X. Comparison of Machine Learning Models in Simulating Glacier Mass Balance: Insights from Maritime and Continental Glaciers in High Mountain Asia. Remote Sens. 2024, 16, 956. [Google Scholar] [CrossRef]
- Zhang, L.; Guo, H.; Ji, P.; Chen, J. A research of glacier change in west kunlun through remote sensing. In Proceedings of the 2012 IEEE International Geoscience and Remote Sensing Symposium, Munich, Germany, 22–27 July 2012; IEEE: Piscataway, NJ, USA; pp. 4430–4433. [Google Scholar]
- Wang, Z.; Gao, T.; Kang, Y.; Guo, W.; Jiang, Z. Glacier Surface Velocity Variations in the West Kunlun Mts. with Sentinel-1A Image Feature-Tracking (2014–2023). Remote Sens. 2023, 16, 63. [Google Scholar] [CrossRef]
- Guan, W.; Cao, B.; Pan, B.; Chen, R.; Shi, M.; Li, K.; Zhao, X.; Sun, X. Updated surge-type glacier inventory in the West Kunlun Mountains, Tibetan Plateau, and implications for glacier change. J. Geophys. Res. Earth Surf. 2022, 127, e2021JF006369. [Google Scholar] [CrossRef]
- Wang, Y.; Hou, S.; Huai, B.; An, W.; Pang, H.; Liu, Y. Glacier anomaly over the western Kunlun Mountains, Northwestern Tibetan Plateau, since the 1970s. J. Glaciol. 2018, 64, 624–636. [Google Scholar] [CrossRef]
- Luo, J.; Ke, C.-Q.; Seehaus, T. The West Kunlun glacier anomaly and its response to climate forcing during 2002–2020. Remote Sens. 2022, 14, 3465. [Google Scholar] [CrossRef]
- Gao, H.; Li, H.; Duan, Z.; Ren, Z.; Meng, X.; Pan, X. Modelling glacier variation and its impact on water resource in the Urumqi Glacier No. 1 in Central Asia. Sci. Total Environ. 2018, 644, 1160–1170. [Google Scholar]
- Shan, Z.; Li, Z.; Dong, X. Impact of glacier changes in the Himalayan Plateau disaster. Ecol. Inform. 2021, 63, 101316. [Google Scholar]
- Ren, S.; Li, X.; Wang, Y.; Zheng, D.; Jiang, D.; Nian, Y.; Zhou, Y. Multitemporal glacier mass balance and area changes in the Puruogangri Ice Field during 1975–2021 based on multisource satellite observations. Remote Sens. 2022, 14, 4078. [Google Scholar] [CrossRef]
- Yan, L.; Wang, J. Study of extracting glacier information from remote sensing. J. Glaciol. Geocryol. 2013, 35, 110–118. [Google Scholar]
- Chen, L.-C.; Zhu, Y.; Papandreou, G.; Schroff, F.; Adam, H. Encoder-decoder with atrous separable convolution for semantic image segmentation. In Proceedings of the European Conference on Computer Vision (ECCV), Munich, Germany, 8–14 September 2018; pp. 801–818. [Google Scholar]
- Huang, L.; Luo, J.; Lin, Z.; Niu, F.; Liu, L. Using deep learning to map retrogressive thaw slumps in the Beiluhe region (Tibetan Plateau) from CubeSat images. Remote Sens. Environ. 2020, 237, 111534. [Google Scholar]
- Xia, Z.; Huang, L.; Fan, C.; Jia, S.; Lin, Z.; Liu, L.; Luo, J.; Niu, F.; Zhang, T. Retrogressive thaw slumps along the Qinghai-Tibet Engineering Corridor: A comprehensive inventory and their distribution characteristics. Earth Syst. Sci. Data Discuss. 2022, 2022, 1–19. [Google Scholar]
- Wang, Z.; Jiang, Z.; Wu, K.; Liu, S.; Zhang, Y.; Wang, X.; Zhang, Z.; Wei, J. Characteristics of Glaciers Surging in the Western Pamirs. Remote Sens. 2023, 15, 1319. [Google Scholar] [CrossRef]
- Wu, K.; Liu, S.; Zhu, Y.; Liu, Q.; Jiang, Z. Dynamics of glacier surface velocity and ice thickness for maritime glaciers in the southeastern Tibetan Plateau. J. Hydrol. 2020, 590, 125527. [Google Scholar]
- Sánchez-Gámez, P.; Navarro, F.J. Glacier surface velocity retrieval using D-InSAR and offset tracking techniques applied to ascending and descending passes of Sentinel-1 data for southern Ellesmere ice caps, Canadian Arctic. Remote Sens. 2017, 9, 442. [Google Scholar] [CrossRef]
- Feng, X.; Chen, Z.; Li, G.; Ju, Q.; Yang, Z.; Cheng, X. Improving the capability of D-InSAR combined with offset-tracking for monitoring glacier velocity. Remote Sens. Environ. 2023, 285, 113394. [Google Scholar]
- Chen, Q.; Zhang, H.; Xu, B.; Liu, Z.; Mao, W. Accessing the Time-Series Two-Dimensional Displacements around a Reservoir Using Multi-Orbit SAR Datasets: A Case Study of Xiluodu Hydropower Station. Remote Sens. 2022, 15, 168. [Google Scholar] [CrossRef]
- Wu, K.; Liu, S.; Jiang, Z.; Zhu, Y.; Xie, F.; Gao, Y.; Yi, Y.; Tahir, A.A.; Muhammad, S. Surging dynamics of glaciers in the Hunza Valley under an equilibrium mass state since 1990. Remote Sens. 2020, 12, 2922. [Google Scholar] [CrossRef]
- Nagy, T.; Andreassen, L.M. Glacier surface velocity mapping with Sentinel-2 imagery in Norway. Rapp. Engelsknr. 2019, 37, pp.1–35. [Google Scholar]
- Millan, R.; Mouginot, J.; Rabatel, A.; Jeong, S.; Cusicanqui, D.; Derkacheva, A.; Chekki, M. Mapping surface flow velocity of glaciers at regional scale using a multiple sensors approach. Remote Sens. 2019, 11, 2498. [Google Scholar] [CrossRef]
- Zhou, Y.; Chen, J.; Cheng, X. Glacier velocity changes in the Himalayas in relation to ice mass balance. Remote Sens. 2021, 13, 3825. [Google Scholar] [CrossRef]
- Mouginot, J.; Rabatel, A.; Ducasse, E.; Millan, R. Optimization of cross correlation algorithm for annual mapping of alpine glacier flow velocities; application to Sentinel-2. IEEE Trans. Geosci. Remote Sens. 2023, 61, 1–12. [Google Scholar]
- Li, G.; Chen, Z.; Mao, Y.; Yang, Z.; Chen, X.; Cheng, X. Different glacier surge patterns revealed by Sentinel-2 imagery derived quasi-monthly flow velocity at west Kunlun Shan, Karakoram, Hindu Kush and Pamir. Remote Sens. Environ. 2024, 311, 114298. [Google Scholar]
- Troilo, F.; Dematteis, N.; Zucca, F.; Funk, M.; Giordan, D. Monthly velocity and seasonal variations of the Mont Blanc glaciers derived from Sentinel-2 between 2016 and 2024. Cryosphere 2024, 18, 3891–3909. [Google Scholar]
- Ke, L.; Ding, X.; Song, C. Heterogeneous changes of glaciers over the western Kunlun Mountains based on ICESat and Landsat-8 derived glacier inventory. Remote Sens. Environ. 2015, 168, 13–23. [Google Scholar]
- Zhang, W.; An, R.; Yang, H.; Jiao, K. Conditions of glacier development and some glacial features in the West Kunlun Mountains. Bull. Glaciol. Res. 1989, 7, 49. [Google Scholar]
- Yasuda, T.; Furuya, M. Dynamics of surge-type glaciers in West Kunlun Shan, northwestern Tibet. J. Geophys. Res. Earth Surf. 2015, 120, 2393–2405. [Google Scholar] [CrossRef]
- Lijia, H.; Guangcai, F.; Zhixiong, F.; Hua, G. Coseismic displacements of 2016 MW7. 8 Kaikoura, New Zealand earthquake, using Sentinel-2 optical images. Acta Geod. Et. Cartogr. Sin. 2019, 48, 339. [Google Scholar]
- Rabus, B.; Eineder, M.; Roth, A.; Bamler, R. The shuttle radar topography mission—A new class of digital elevation models acquired by spaceborne radar. ISPRS J. Photogramm. Remote Sens. 2003, 57, 241–262. [Google Scholar]
- Farr, T.G.; Rosen, P.A.; Caro, E.; Crippen, R.; Duren, R.; Hensley, S.; Kobrick, M.; Paller, M.; Rodriguez, E.; Roth, L. The shuttle radar topography mission. Rev. Geophys. 2007, 45, 1–33. [Google Scholar] [CrossRef]
- Zhou, Y.; Duan, M. A Batch Post-Processing Method Based on an Adaptive Data Partitioning Strategy for DEM Differencing From Global Data Products. IEEE Geosci. Remote Sens. Lett. 2024, 21, 1–5. [Google Scholar]
- Muñoz-Sabater, J.; Dutra, E.; Agustí-Panareda, A.; Albergel, C.; Arduini, G.; Balsamo, G.; Boussetta, S.; Choulga, M.; Harrigan, S.; Hersbach, H. ERA5-Land: A state-of-the-art global reanalysis dataset for land applications. Earth Syst. Sci. Data 2021, 13, 4349–4383. [Google Scholar] [CrossRef]
- Wang, Y.; Zheng, D.; Zhou, Y.; Nian, Y.; Ren, S.; Ren, W.; Zhu, Z.; Tang, Z.; Li, X. Glacier mass change and evolution of Petrov Lake in the Ak-Shyirak massif, central Tien Shan, from 1973 to 2023 using multisource satellite data. Remote Sens. Environ. 2024, 315, 114437. [Google Scholar] [CrossRef]
- Chu, X.; Yao, X.; Duan, H.; Chen, C.; Li, J.; Pang, W. Glacier extraction based on high-spatial-resolution remote-sensing images using a deep-learning approach with attention mechanism. Cryosphere 2022, 16, 4273–4289. [Google Scholar]
- Guo, W.-Q.; Liu, S.-Y.; Yu, P.-C.; Xu, J.-L. Automatic extraction of ridgelines using on drainage boundaries and aspect difference. Sci. Surv. Mapp. 2011, 36. [Google Scholar]
- Ayoub, F.; Leprince, S.; Avouac, J. User’s Guide to Cosi-Corr; California Institute of Technology: Pasadena, CA, USA, 2015. [Google Scholar]
- Baird, T.; Bristow, C.S.; Vermeesch, P. Measuring sand dune migration rates with COSI-Corr and Landsat: Opportunities and challenges. Remote Sens. 2019, 11, 2423. [Google Scholar] [CrossRef]
- Das, S. Glacier surface velocities in the Chandrabhaga Massif, Western Himalaya (India) derived using COSI-Corr from landsat images. 2021. [Google Scholar] [CrossRef]
- Zhang, J.; He, P.; Hu, X.; Liu, Z. The spatio-temporal patterns of glacier activities in the eastern Pamir Plateau investigated by time series sub-pixel offsets from Sentinel-2 optical images. IEEE J. Sel. Top. Appl. Earth Obs. Remote Sens. 2023, 16, 1256–1268. [Google Scholar]
- Lv, M.; Guo, H.; Lu, X.; Liu, G.; Yan, S.; Ruan, Z.; Ding, Y.; Quincey, D.J. Characterizing the behaviour of surge-and non-surge-type glaciers in the Kingata Mountains, eastern Pamir, from 1999 to 2016. Cryosphere 2019, 13, 219–236. [Google Scholar]
- Strozzi, T.; Luckman, A.; Murray, T.; Wegmuller, U.; Werner, C.L. Glacier motion estimation using SAR offset-tracking procedures. IEEE Trans. Geosci. Remote Sens. 2002, 40, 2384–2391. [Google Scholar]
- Koblet, T.; Gärtner-Roer, I.; Zemp, M.; Jansson, P.; Thee, P.; Haeberli, W.; Holmlund, P. Reanalysis of multi-temporal aerial images of Storglaciären, Sweden (1959–1999)–Part 1: Determination of length, area, and volume changes. Cryosphere 2010, 4, 333–343. [Google Scholar]
- Guo, L.; Li, J.; Dehecq, A.; Li, Z.; Li, X.; Zhu, J. A new inventory of High Mountain Asia surge-type glaciers derived from multiple elevation datasets since the 1970s. Earth Syst. Sci. Data Discuss. 2022, 2022, 2841–2861. [Google Scholar]
- Brun, F.; Berthier, E.; Wagnon, P.; Kääb, A.; Treichler, D. A spatially resolved estimate of High Mountain Asia glacier mass balances from 2000 to 2016. Nat. Geosci. 2017, 10, 668–673. [Google Scholar]
- Neckel, N.; Kropáček, J.; Bolch, T.; Hochschild, V. Glacier mass changes on the Tibetan Plateau 2003–2009 derived from ICESat laser altimetry measurements. Environ. Res. Lett. 2014, 9, 014009. [Google Scholar]
- Gardner, A.S.; Moholdt, G.; Cogley, J.G.; Wouters, B.; Arendt, A.A.; Wahr, J.; Berthier, E.; Hock, R.; Pfeffer, W.T.; Kaser, G. A reconciled estimate of glacier contributions to sea level rise: 2003 to 2009. Science 2013, 340, 852–857. [Google Scholar]
- Zhou, M.; Yu, Z.; Gu, H.; Ju, Q.; Gao, Y.; Wen, L.; Huang, T.; Wang, W. Evaluation and projections of surface air temperature over the Tibetan Plateau from CMIP6 and CMIP5: Warming trend and uncertainty. Clim. Dyn. 2023, 60, 3863–3883. [Google Scholar] [CrossRef]
- Lun, Y.; Liu, L.; Cheng, L.; Li, X.; Li, H.; Xu, Z. Assessment of GCMs simulation performance for precipitation and temperature from CMIP5 to CMIP6 over the Tibetan Plateau. Int. J. Climatol. 2021, 41, 3994–4018. [Google Scholar] [CrossRef]


| Year | Main Images (Tile Id-YYYYMMDD) | Auxiliary Images (Tile Id-YYYYMMDD) |
|---|---|---|
| 2016 | T44SME-20160721, T44SNE-20160721, T44SMD-20160721 | T44SME-20160919, T44SNE-20160919, T44SNE-20160522, T44SMD-20160522 |
| 2017 | T44SME-20171009, T44SNE-20170815, T44SMD-20171009 | T44SME-20170815, T44SME-20170919, T44SNE-20171009, T44SMD-20170815 |
| 2018 | T44SME-20180711, T44SNE-20180830, T44SMD-20180830 | T44SME-20180919, T44SME-20181004, T44SNE-20180711, T44SMD-20180522 |
| 2019 | T44SME-20190904, T44SNE-20190904, T44SMD-20190904 | T44SME-20190706, T44SME-20190909, T44SME-20190919, T44SNE-20190914, T44SNE-20190919, T44SMD-20190909 |
| 2020 | T44SME-20200903, T44SNE-20200903, T44SMD-20200903 | T44SME-20200630, T44SME-20200824, T44SNE-20200814, T44SNE-20200824, T44SMD-20200814, T44SMD-20200630 |
| 2021 | T44SME-20210819, T44SNE-20210819, T44SMD-20210819 | T44SME-20210710, T44SME-20210908, T44SNE-20210908, T44SMD-20210908 |
| 2022 | T44SME-20220913, T44SNE-20220804, T44SMD-20220804 | T44SME-20220625, T44SME-20220705, T44SNE-20220819, T44SMD-20220725, T44SMD-20220819, T44SMD-20220913 |
| 2023 | T44SME-20230913, T44SNE-20230913, T44SMD-20230913 | T44SME-20230625, T44SME-20230715, T44SME-20230903, T44SNE-20230903, T44SMD-20230903, T44SMD-20230715 |
| 2024 | T44SME-20240917, T44SNE-20240907, T44SMD-20240907 | T44SME-20240922, T44SNE-20240813, T44SMD-20240729, T44SMD-20240719 |
| Glacier Velocity | Pre-Phase Images (Tile Id-YYYYMMDD) | Post-Phase Images (Tile Id-YYYYMMDD) |
|---|---|---|
| 2016–2017 | T44SME-20160721 T44SNE-20160721 T44SMD-20160721 | T44SME-20171009 T44SNE-20170815 T44SMD-20171009 |
| 2017–2018 | T44SME-20171009 T44SNE-20170815 T44SMD-20171009 | T44SME-20180711 T44SNE-20180830 T44SMD-20180830 |
| 2018–2019 | T44SME-20180711 T44SNE-20180830 T44SMD-20180830 | T44SME-20190904 T44SNE-20190904 T44SMD-20190904 |
| 2019–2020 | T44SME-20190904 T44SNE-20190904 T44SMD-20190904 | T44SME-20200903 T44SNE-20200903 T44SMD-20200903 |
| 2020–2021 | T44SME-20200903 T44SNE-20200903 T44SMD-20200903 | T44SME-20210819 T44SNE-20210819 T44SMD-20210819 |
| 2021–2022 | T44SME-20210819 T44SNE-20210819 T44SMD-20210819 | T44SME-20220913 T44SNE-20220804 T44SMD-20220804 |
| 2022–2023 | T44SME-20220913 T44SNE-20220804 T44SMD-20220804 | T44SME-20230913 T44SNE-20230913 T44SMD-20230913 |
| 2023–2024 | T44SME-20230913 T44SNE-20230913 T44SMD-20230913 | T44SME-20240917 T44SNE-20240907 T44SMD-20240907 |
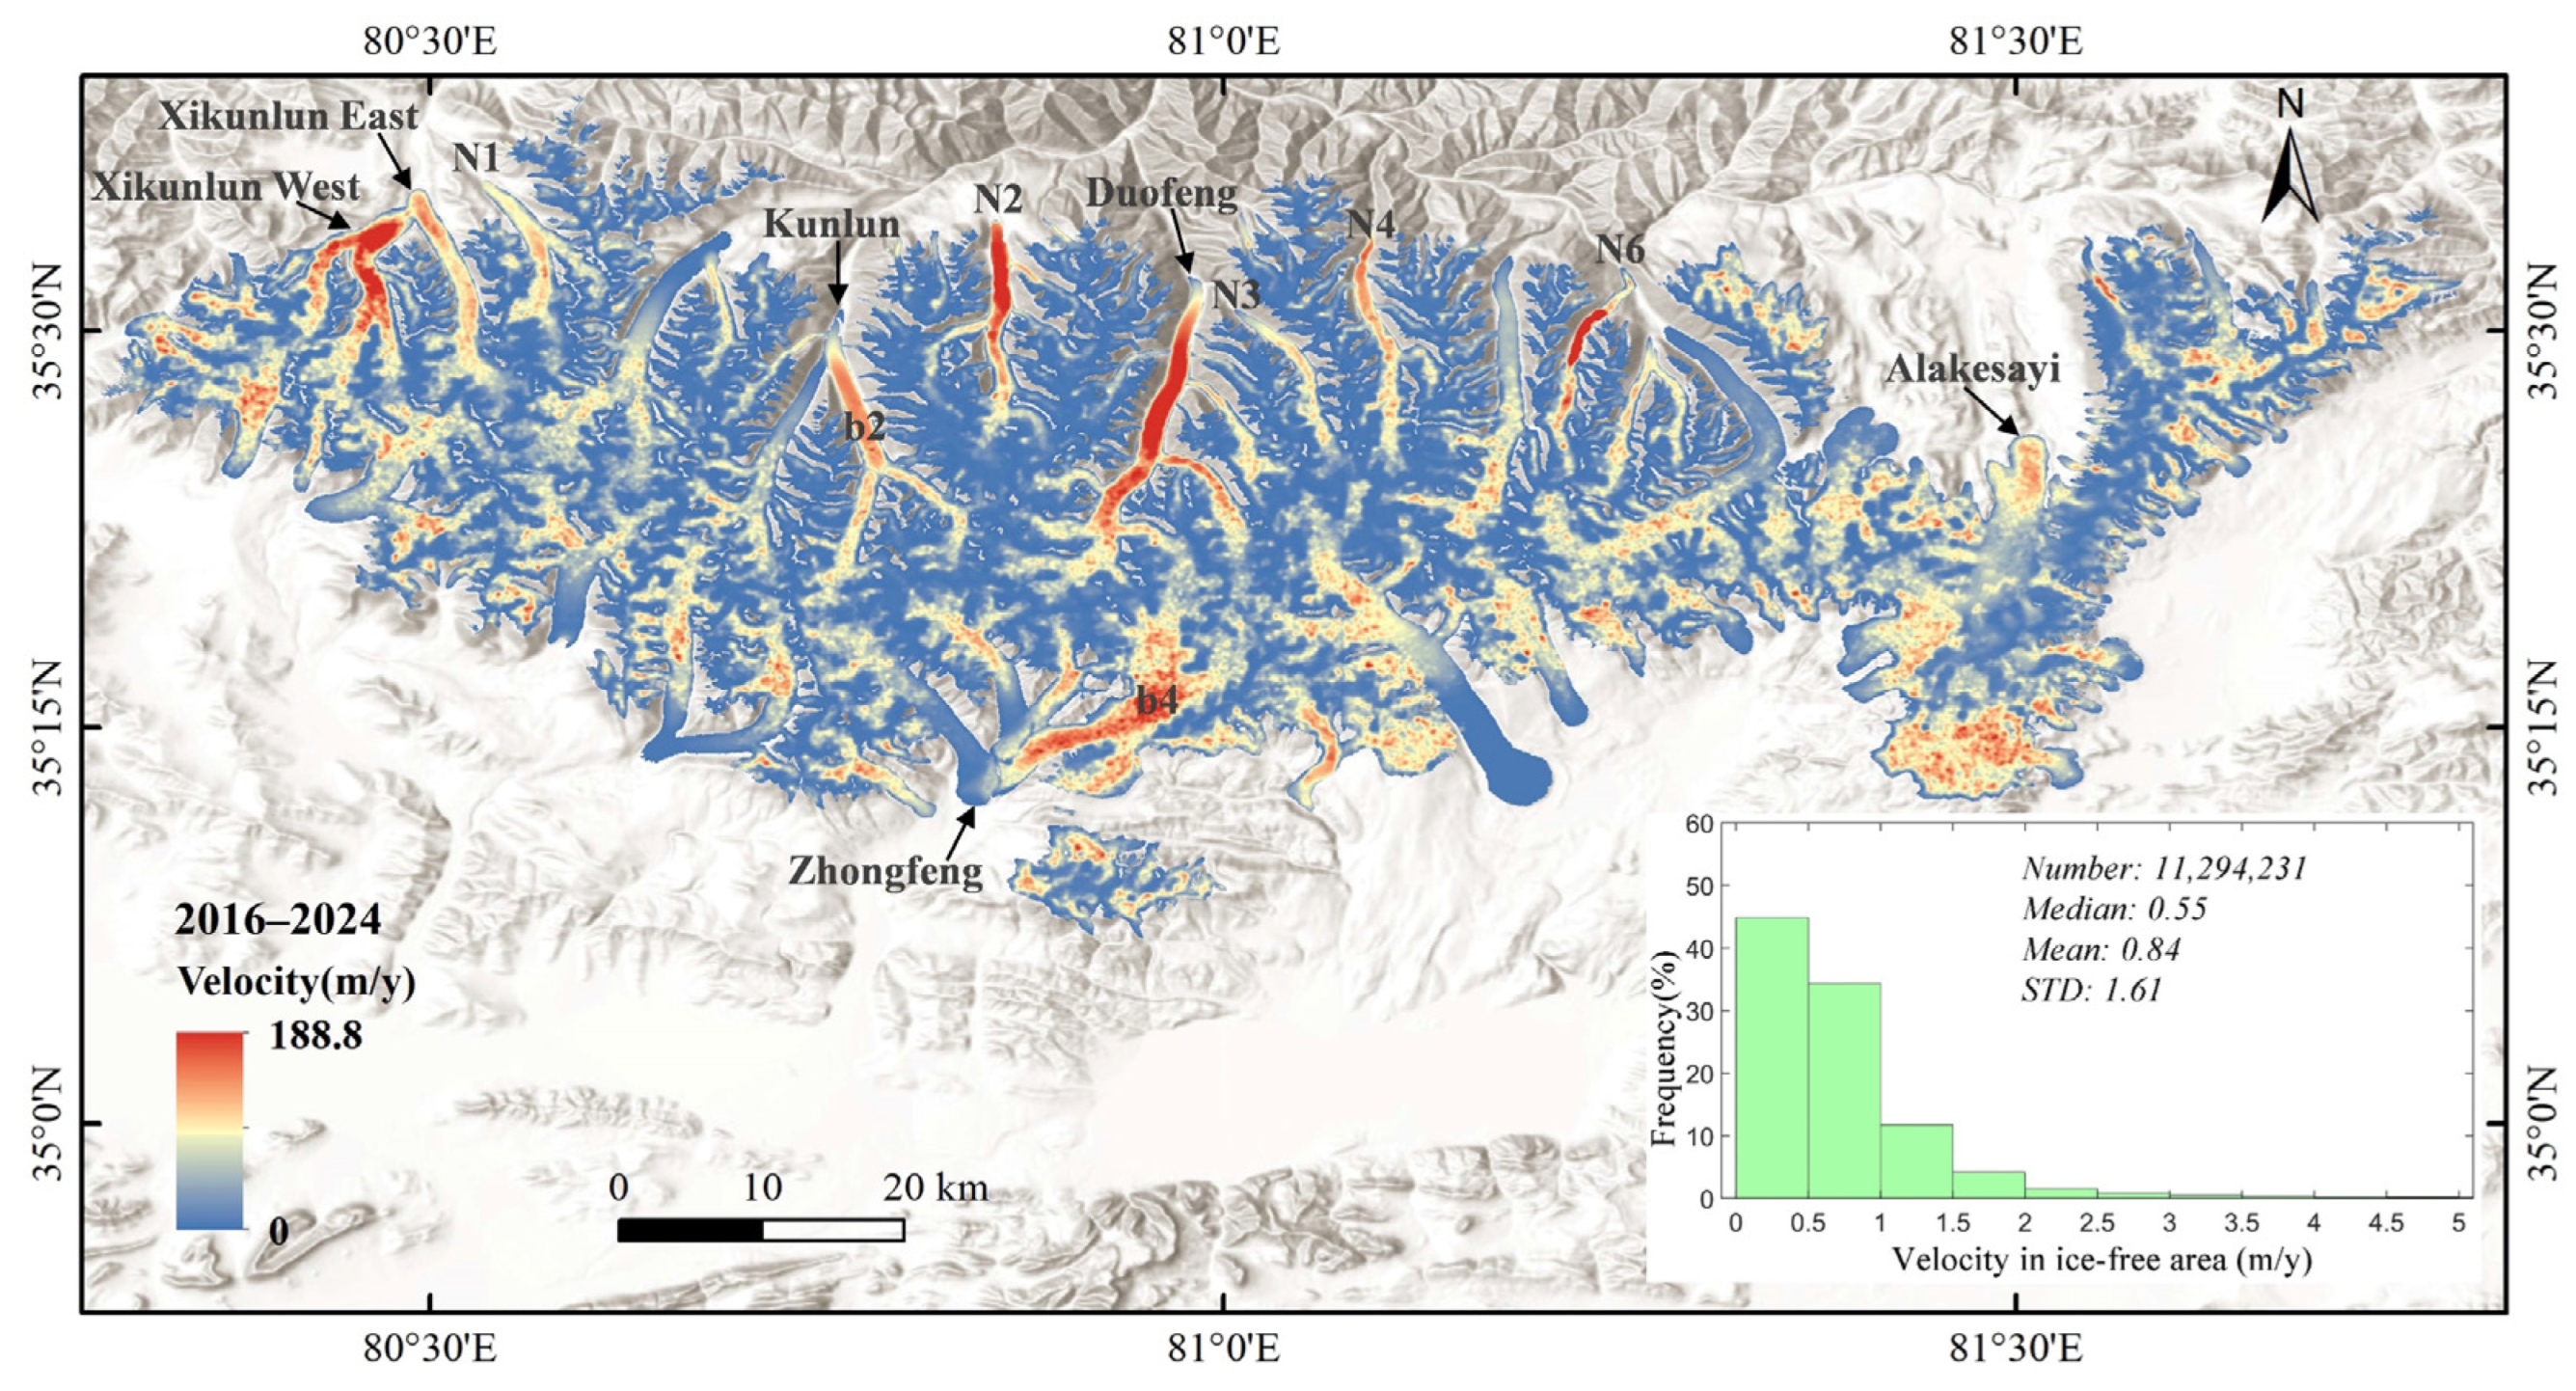
| Glacier Name | Surface Flow Velocity (m/y) | Glacier Name | Surface Flow Velocity (m/y) |
|---|---|---|---|
| Xikunlun West Glacier | 115.2 | Xikunlun East Glacier | 69.1 |
| N1 Glacier | 72.4 | The b2 (branch 2) of the Kunlun Glacier | 75.2 |
| N2 Glacier | 101.8 | Duofeng Glacier | 92.4 |
| N3 Glacier | 57.5 | N4 Glacier | 72.4 |
| N6 Glacier | 188.8 | Alakesayi Glacier | 63.6 |
| The b4 of the Zhongfeng Glacier | 92.4 |
| Aspect | This Study (2016–2024) | Previous Studies | Similarities | Differences |
|---|---|---|---|---|
| Area/terminus | Derived from Sentinel-2 optical images (2016–2024) | Zhang et al. [1]: derived from Landsat series optical images (2015–2020) | Gongxing Glacier, Xiyulong Glacier, Yulong Glacier, Chongce Glacier, Kunlun Glacier, b1 of the Zhongfeng Glacier, Duofeng Glacier | N5 Glacier, S1 Glacier, Duota Glacier |
| Velocity | Derived from Sentinel-2 optical images (2016–2024) | Wang et al. [9]: derived from Sentinel-1 SAR images (2014–2023) | Alakesayi Glacier, b4 of the Zhongfeng Glacier, Xikunlun West Glacier, N2 Glacier, Duofeng Glacier, b2 of the Kunlun Glacier | Void regions in SAR-based velocity maps |
Disclaimer/Publisher’s Note: The statements, opinions and data contained in all publications are solely those of the individual author(s) and contributor(s) and not of MDPI and/or the editor(s). MDPI and/or the editor(s) disclaim responsibility for any injury to people or property resulting from any ideas, methods, instructions or products referred to in the content. |
© 2025 by the authors. Licensee MDPI, Basel, Switzerland. This article is an open access article distributed under the terms and conditions of the Creative Commons Attribution (CC BY) license (https://creativecommons.org/licenses/by/4.0/).
Share and Cite
Jiang, D.; Wang, S.; Zhu, B.; Lv, Z.; Zhang, G.; Zhao, D.; Li, T. Glacier Area and Surface Flow Velocity Variations for 2016–2024 in the West Kunlun Mountains Based on Time-Series Sentinel-2 Images. Remote Sens. 2025, 17, 1290. https://doi.org/10.3390/rs17071290
Jiang D, Wang S, Zhu B, Lv Z, Zhang G, Zhao D, Li T. Glacier Area and Surface Flow Velocity Variations for 2016–2024 in the West Kunlun Mountains Based on Time-Series Sentinel-2 Images. Remote Sensing. 2025; 17(7):1290. https://doi.org/10.3390/rs17071290
Chicago/Turabian StyleJiang, Decai, Shanshan Wang, Bin Zhu, Zhuoyu Lv, Gaoqiang Zhang, Dan Zhao, and Tianqi Li. 2025. "Glacier Area and Surface Flow Velocity Variations for 2016–2024 in the West Kunlun Mountains Based on Time-Series Sentinel-2 Images" Remote Sensing 17, no. 7: 1290. https://doi.org/10.3390/rs17071290
APA StyleJiang, D., Wang, S., Zhu, B., Lv, Z., Zhang, G., Zhao, D., & Li, T. (2025). Glacier Area and Surface Flow Velocity Variations for 2016–2024 in the West Kunlun Mountains Based on Time-Series Sentinel-2 Images. Remote Sensing, 17(7), 1290. https://doi.org/10.3390/rs17071290