Article

How Urban Expansion and Climatic Regimes Affect Groundwater Storage in China’s Major River Basins: A Comparative Analysis of the Humid Yangtze and Semi-Arid Yellow River Basins

Collaborative Innovation Center on Forecast and Evaluation of Meteorological Disasters (CIC-FEMD)/Key Laboratory of Ecosystem Carbon Source and Sink, China Meteorological Administration (ECSS-CMA), Nanjing University of Information Science and Technology, Nanjing 210044, China
*
Author to whom correspondence should be addressed.
Remote Sens. 2025, 17(7), 1292; https://doi.org/10.3390/rs17071292
Submission received: 17 March 2025 / Revised: 1 April 2025 / Accepted: 3 April 2025 / Published: 4 April 2025

Abstract

:
This study investigated and compared the spatiotemporal evolution and driving factors of groundwater storage anomalies (GWSAs) under the dual pressures of climate change and urban expansion in two contrasting river basins of China. Integrating GRACE and GLDAS data with multi-source remote sensing data and using attribution analysis, we reveal divergent urban GWSA dynamics between the humid Yangtze River Basin (YZB) and semi-arid Yellow River Basin (YRB). The GWSAs in YZB urban grids showed a marked increasing trend at 3.47 mm/yr (p < 0.05) during 2002–2020, aligning with the upward patterns observed in agricultural land types including dryland and paddy fields, rather than exhibiting the anticipated decline. Conversely, GWSAs in YRB urban grids experienced a pronounced decline (−5.59 mm/yr, p < 0.05), exceeding those observed in adjacent dryland regions (−5.00 mm/yr). The contrasting climatic regimes form the fundamental drivers. YZB’s humid climate (1074 mm/yr mean precipitation) with balanced seasonality amplified groundwater recharge through enhanced surface runoff (+6.1%) driven by precipitation increases (+7.4 mm/yr). In contrast, semi-arid YRB’s water deficit intensified, despite marginal precipitation gains (+3.5 mm/yr), as amplified evapotranspiration (+4.1 mm/yr) exacerbated moisture scarcity. Human interventions further differentiated trajectories: YZB’s urban clusters demonstrated GWSA growth across all city types, highlighting the synergistic effects of urban expansion under humid climates through optimized drainage infrastructure and reduced evapotranspiration from impervious surfaces. Conversely, YRB’s over-exploitation due to rapid urbanization coupled with irrigation intensification drove cross-sector GWSA depletion. Quantitative attribution revealed climate change dominated YZB’s GWSA dynamics (86% contribution), while anthropogenic pressures accounted for 72% of YRB’s depletion. These findings provide critical insights for developing basin-specific management strategies, emphasizing climate-adaptive urban planning in water-rich regions versus demand-side controls in water-stressed basins.

1. Introduction

Groundwater constitutes a vital component of Earth’s hydrological system, wielding profound influence on socioeconomic development and human survival. As a crucial freshwater reserve, it sustains drinking water supplies, industrial operations, and agricultural irrigation while playing an irreplaceable role in maintaining ecological equilibrium and preserving groundwater-dependent ecosystems [1]. Particularly in arid and semi-arid regions, groundwater frequently serves as the sole lifeline supporting both ecological integrity and human activities. Recent research findings indicate that between 2016 and 2021, 180 cities in China (approximately half of the prefecture-level and above cities) faced at least one type of pressure related to groundwater quantity or quality. Among these, 40 cities experienced dual pressures on both groundwater quantity and quality, and these cities were primarily located in northeastern China and the middle and lower reaches of the Yellow River [2].
Climate change (e.g., decreasing precipitation and increasing potential evapotranspiration) and land use change (e.g., urbanization) are the two external factors driving changes in hydrologic processes. Urban land use and cover change, as an important component of global change, has significant impacts on many aspects of urbanized watersheds, including surface water dynamics, groundwater recharge, fluvial geomorphology, climate, biogeochemical cycling and river ecosystems [3].
The urbanization–groundwater nexus manifests through dual pathways: The first, is anthropogenic groundwater over-extraction driven by escalating urban demands. Rapid urbanization intensifies water requirements for domestic and industrial purposes, frequently leading to unsustainable aquifer exploitation and consequent storage depletion [4]. Second, urbanization-induced surface modifications reconfigure ecohydrological processes. The proliferation of impervious surfaces (e.g., pavements and infrastructure), coupled with vegetation cover reduction (e.g., deforestation and wetland loss), directly and indirectly impacts hydrological systems across multiple spatial scales [5,6,7]. These transformations fundamentally alter natural water infiltration patterns while disrupting the delicate balance between surface and subsurface hydrological cycles.
Emerging from the Qinghai-Tibet Plateau as China’s principal fluvial arteries, the Yangtze and Yellow Rivers exhibit stark hydrological contrasts shaped by distinct climatic regimes, water resource distributions, and land use patterns. These fundamental disparities may lead to divergent groundwater evolution patterns during their respective urbanization processes. The Yangtze Basin, commanding 36% of China’s total river discharge (twenty-fold greater than the Yellow River’s contribution), epitomizes water abundance. However, over the past half-century, accelerated global warming and rampant urbanization in the Yangtze River Delta have precipitated soaring water demands, with agricultural irrigation, industrial operations, and domestic consumption collectively exceeding surface water capacities. Recent studies have revealed the spatial and temporal variation patterns of water storage in the Yangtze River Basin and explored the driving mechanisms behind them. Nie et al. [8] reconstructed the monthly terrestrial water storage changes in the Yangtze River Basin by using the SWAT hydrological model, and further distinguished the impacts of climate change and human activities (e.g., reservoir storage and land use change) on water storage, finding that climate change is the main driving factor. Xiong et al. [9], using a combination of GRACE satellite data and hydrological models, found that changes in the basin’s terrestrial water storage were mainly affected by precipitation, while human activities caused significant changes in local areas. Based on GRACE and GRACE-FO satellite data, Dong [10] found that mega-drought events are usually accompanied by significant decreases in land water storage. This imbalance jeopardizes the basin’s hydrological sustainability, revealing the fragility of even well-endowed systems under anthropogenic pressures [11].
Conversely, the Yellow River Basin, located in arid and semi-arid zones, faces acute vulnerability to groundwater depletion threats [12]. Its inherent hydrological constraints, amplified by climate variability and competing water demands, position this watershed as a critical frontier for groundwater conservation strategies. Its per capita water availability is merely one-third of the global average. Escalating economic development and intensifying climate change impacts have synergistically amplified hydrological stresses across this arid region. Recent analyses reveal urbanization as one of principal drivers of aquifer depletion [13], with groundwater over-extraction in critical zones [14] triggering precipitous water table declines in this basin. These anthropogenic disturbances manifest through cascading environmental crises imposing critical constraints on the basin’s sustainable socioeconomic development [15,16]. Since 1999, the basin’s Grain-for-Green Program has transformed 28 million hectares through reforestation and grassland restoration. While ecologically beneficial, this continental-scale intervention may have accelerated regional evapotranspiration processes [17,18] while diminishing surface runoff [19] and groundwater storage [18]. Such hydrological regime shifts present dual challenges: they fundamentally reconfigure water partitioning mechanisms while potentially destabilizing both groundwater recharge patterns and ecosystem resilience.
In general, previous research has predominantly focused on employing hydrological models and remote sensing techniques to investigate the spatiotemporal dynamics of groundwater storage, with particular emphasis on elucidating the impacts of climate change (including extreme weather events) on aquifer systems [19,20]. Regarding anthropogenic influences, scholarly attention has primarily centered on conspicuous factors such as reservoir regulation and land use alterations. Notably, while urban ecohydrological studies have made progress in characterizing surface water processes [21], there remains a significant knowledge gap concerning the intricate mechanisms through which urbanization affects groundwater resources [22]. Groundwater abstraction is projected to further increase in the future with climate change [23]. Consequently, conducting systematic investigations into the coupled interactions between urban expansion and groundwater dynamics under climate change scenarios proves imperative. Such research will not only establish a crucial foundation for evaluating watershed ecosystem services, but also provides scientific underpinnings for optimizing urbanized basin management frameworks and advancing sustainable water resource governance [24].
The Gravity Recovery and Climate Experiment (GRACE) satellite mission has revolutionized the quantification of terrestrial water storage (TWS) dynamics through its unprecedentedly precise gravity field measurements [25,26]. By integrating GRACE-derived TWS variations with independent hydrological parameters, including soil moisture, snowpack accumulation, and surface reservoir fluxes, this innovative approach has emerged as a powerful methodology for assessing groundwater storage evolution and has been successfully used in different regions over the world [20].
This study integrated GRACE and GLDAS data with multi-source remote sensing data, using attribution analysis to conduct a comparative analysis in the humid Yangtze River Basin and semi-arid Yellow River Basin. We aimed to investigate the spatiotemporal evolution and driving factors of groundwater storage anomalies (GWSAs) under the dual pressures of climate change and urban expansion in two contrasting river basins of China.

2. Materials and Methods
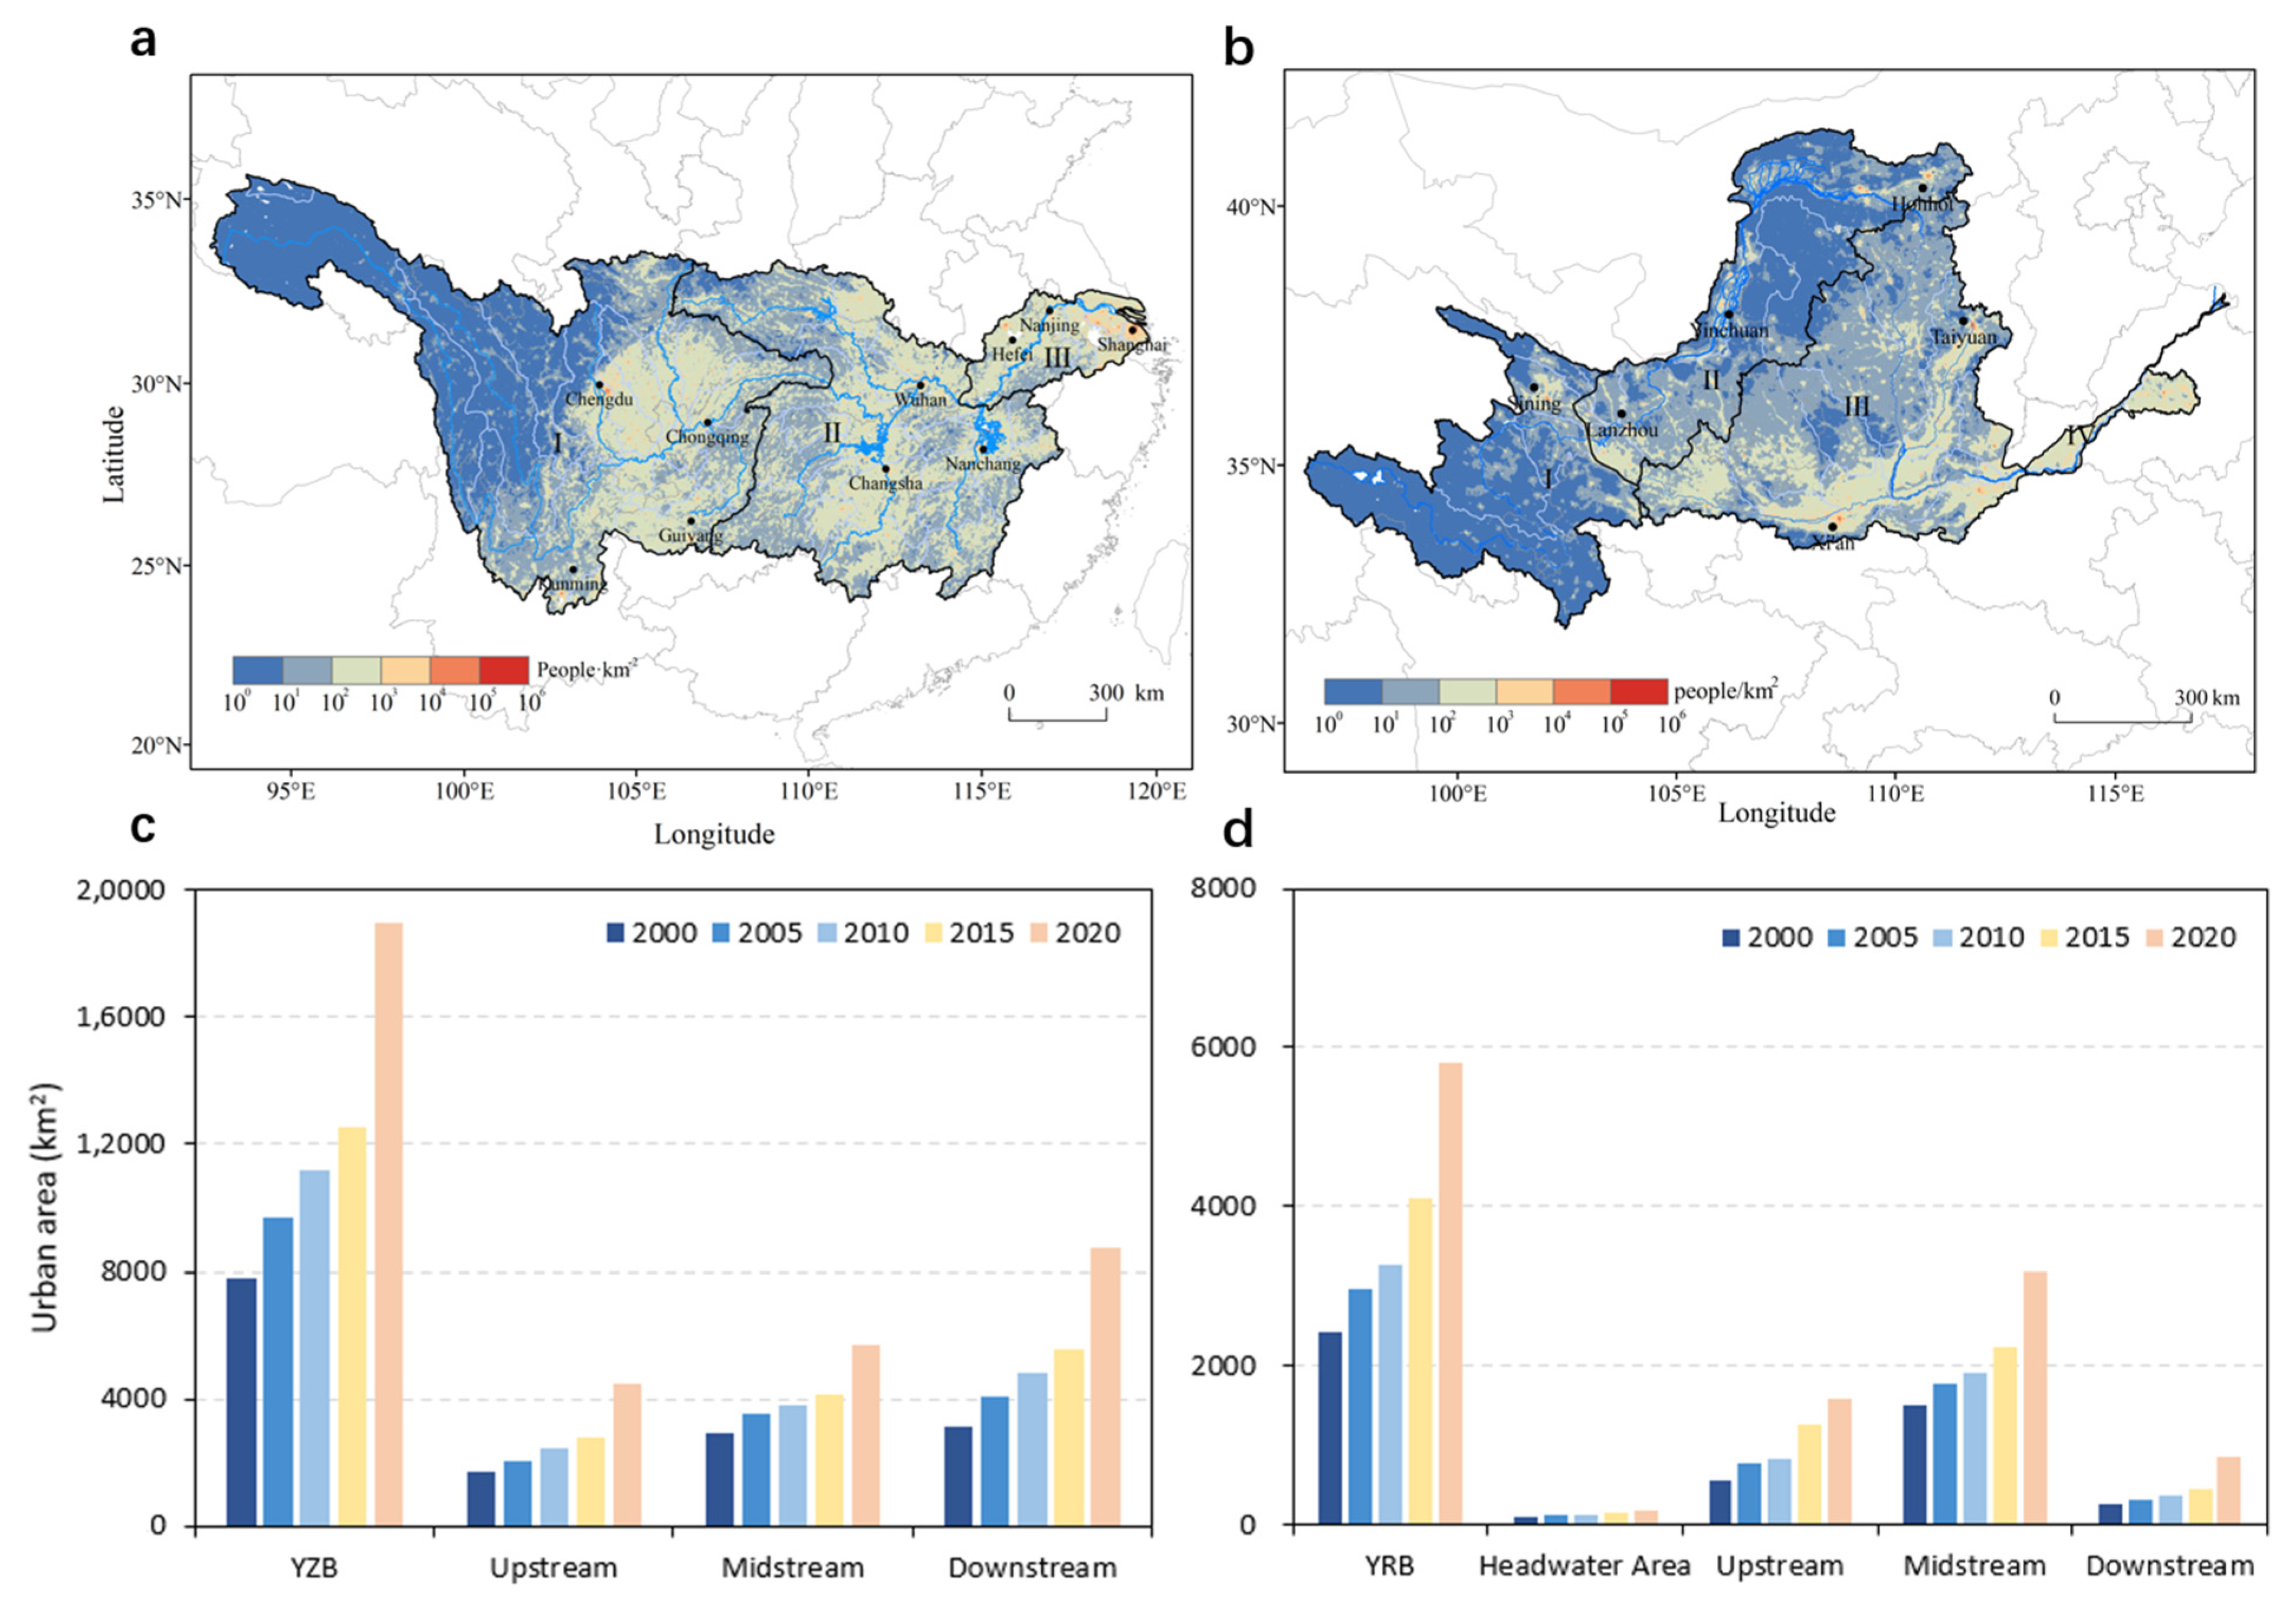
2.1. Study Area

The Yangtze River Basin (Figure 1a), situated in a subtropical monsoon climate zone, holds China’s largest water resource volume at 12,863 × 10⁸ m³ (2020, China Water Resources Bulletin). Its climate displays marked seasonal and regional variations, with temperature patterns characterized by “higher in the east, lower in the west; warmer in the south, colder in the north,” yielding an annual average of 16–18 °C in the middle–lower reaches [8]. Annual precipitation averages 1074 mm, increasing spatially from upper to downstream regions. As the nation’s agricultural core, the basin sustains 25% of China’s cultivated land, feeds a population of 459 million (33% of the national total), and has a 49% urbanization rate alongside robust grain productivity. In contrast, the Yellow River Basin (Figure 1b), spanning warm temperate, mid-temperate, and plateau climate zones, contains 824 × 10⁸ m³ of water resources (2020, Yellow River Water Resources Bulletin), with pronounced spatiotemporal precipitation heterogeneity: 70% of rainfall concentrates in summer–autumn, spatially ranging from 115 to 900 mm, while arid conditions prevail with scarce spring–winter precipitation [12].
Land use/cover analyses reveal distinct patterns: In the Yangtze Basin (Figure S1a), the upper reaches are dominated by grasslands and drylands supporting agriculture, while the middle reaches feature dense forest coverage (woodlands exceeding 60%), with minimal urban land (<1%). The lower reaches exhibit a unique landscape where paddy fields dominate due to favorable climatic and agricultural conditions, coupled with rapid urbanization—urban areas expanded from 2.6% (2000) to 7.2% (2020), a near-triple increase, whereas other land types (farmland, water bodies) remained relatively stable. The Yellow River Basin (Figure S1b) shows contrasting regional dynamics: Its source region is grassland-dominated (>70% coverage), while the upper–middle reaches blend grasslands and drylands, with urban land below 3%. The lower reaches emerge as an agricultural hotspot with 63% dryland coverage, while urbanization has surged dramatically—urban areas grew 236% from 1.1% (2000) to 3.8% (2020), reflecting intensified human activity. The urban areas in the two basins increased rapidly during the past two decades, from 7794 km2 to 18,952 km2 in YZB, and from 2439 km2 to 5814 km2 in YRB (Figure 1c,d).

2.2. Dataset

2.2.1. Groundwater Storage Data

This study utilized two complementary datasets to analyze GWSA dynamics: (1) GRACE (Gravity Recovery and Climate Experiment) satellite observations [25,26,27]; and (2) GLDAS (Global Land Data Assimilation System) model outputs [28]. The terrestrial water storage anomalies (TWSAs) data were derived from the GRACE mission and its follow-on GRACE-FO mission, and were processed and distributed by the Center for Space Research (CSR) as RL06.2 Mascons product (http://download.csr.utexas.edu/outgoing/grace/RL0602_mascons/, accessed on 5 May 2023). This dataset provides monthly measurements at 0.25° × 0.25° spatial resolution covering April 2002 to December 2020.
While the GRACE-derived TWSA data encompass both surface water and groundwater storage variations (i.e., GWSAs), the mission’s measurements inherently represent vertically integrated water storage changes without component separation. To isolate groundwater signals, we employed the GLDAS Noah land surface model (version 2.1) outputs (https://search.earthdata.nasa.gov/, accessed on 10 May 2023) driven by GLDAS-v2.1 forcing data [29]. This reanalysis product synergistically integrates satellite observations, in situ measurements, and model simulations [30], maintaining temporal (April 2002–December 2020) and spatial (0.25° × 0.25°) consistency with the GRACE dataset. Through this integration, we quantitatively partitioned the total water storage anomalies into surface and subsurface components to derive GWSA estimates.

2.2.2. Climate and Hydrological Data

Monthly potential evapotranspiration data with a spatial resolution of 1 km were obtained from the National Tibetan Plateau Science Data Center (https://data.tpdc.ac.cn/zh-hans/, accessed on 8 June 2024). This dataset was calculated by the Hargreaves potential evapotranspiration formula based on the 1 km monthly mean, minimum, and maximum temperature datasets in China [31,32]. The monthly temperature and precipitation data with a spatial resolution of 1 km and period of 2000–2020 were obtained from the National Science and Technology Basic Conditions Platform, National Earth System Science Data Center (https://www.geodata.cn, accessed on 12 June 2023) [31]. Runoff depth (2000–2020) observation data of the Yangtze River Basin [33] and the Yellow River (http://yrcc.gov.cn/gzfw/szygb/index.html, accessed on 12 October 2024) were used to analysis the impact factors on GWSA dynamics. Considering that the original MODIS ET product (MOD16A2) lacks evapotranspiration estimates for urban areas, this study uses an evapotranspiration remote sensing product (Operational Simplified Surface Energy Balance, SSEBop) [34] (https://edcintl.cr.usgs.gov/downloads/sciweb1/shared//fews/web/global/monthly/, accessed on 2 July 2024) to compare seasonal ET with five different land cover types.

2.2.3. Land Use Data and Population Data

The population density data (2000–2020) with a spatial resolution of 1 km × 1 km used in this study come from the World Population Dataset [35], produced by the University of Southampton. The land use and land cover data, with a spatial resolution of 1 km × 1 km, for 5 years (2000, 2005, 2010, 2015, and 2020) were from the China Multi-Period Land Use Remote Sensing Monitoring dataset (CNLUCC) (https://www.resdc.cn/DOI/DOI.aspx?DOIID=54, accessed on 3 May 2023) [36].

2.3. Methodology

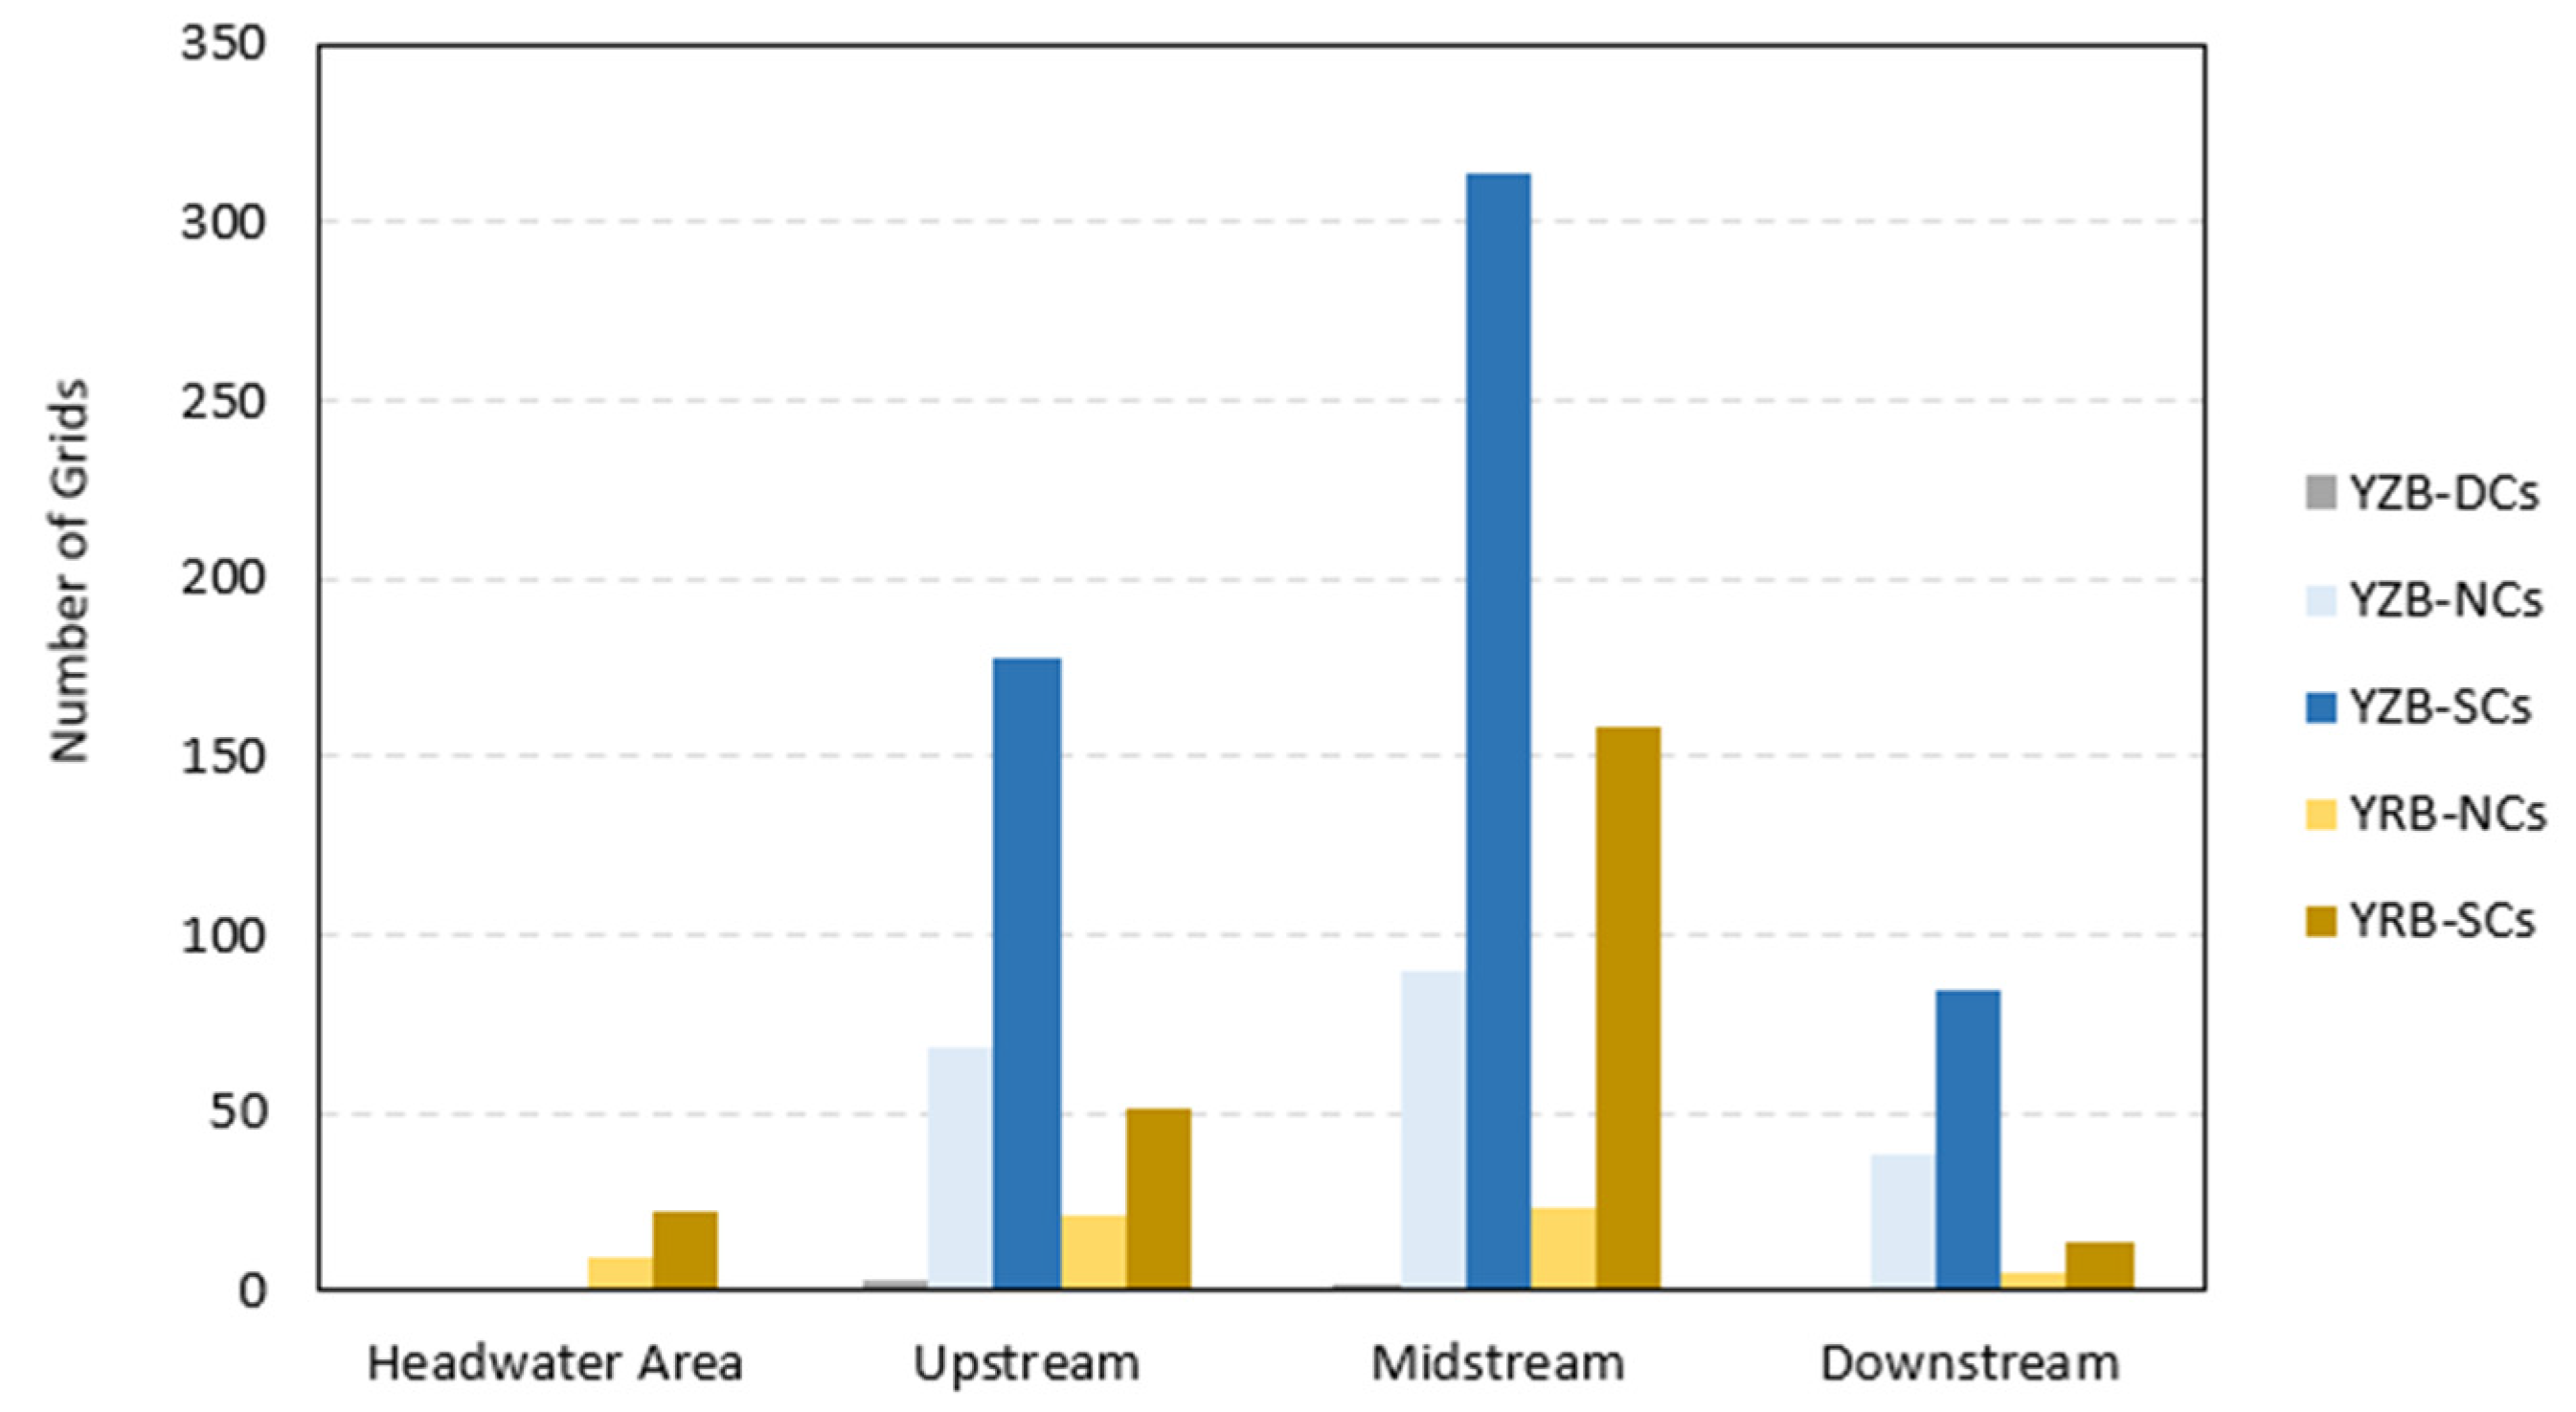
2.3.1. Classification of Three Types of Cities

This study established a dynamic urban evolution classification system using urban spatial data from 2000, 2005, 2010, 2015, and 2020, categorizing spatial units into three distinctive city types: Disappearing Cities (DCs), New Cities (NCs), and Stable Cities (SCs) [12]. Specifically, DCs represent spatial grids classified as urban in 2000 but non-urban in all subsequent timepoints (2005, 2010, 2015, 2020); NCs denote grids transitioning from non-urban (2000) to urban status in at least one timepoint after 2010 (2010, 2015, 2020); and SCs refer to grids consistently maintaining urban attributes across all timepoints (2000, 2005, 2010, 2015, 2020) without interruption.
In this study, marginal cases were excluded due to limited quantity. Marginal cases refer to grids that did not strictly conform to the continuity criteria above. These cases constituted a minor proportion and exhibited inconsistent urbanization trajectories, which could obscure the distinct characteristics of DCs, NCs, and SCs. To prioritize clear and dominant urbanization/deurbanization trends, we retained only grids with unambiguous continuity. Such grids were excluded prior to calculating the proportions of DCs, NCs, and SCs, ensuring that dominant city types were determined solely based on stable, representative patterns. Building on this classification, we quantified the distribution of these city types within GWSA grids (0.25° × 0.25° units). For each GWSA grid, we first counted the number of 1 km × 1 km grids corresponding to each city type. Subsequently, we calculated their relative proportions using Equation 1. The dominant city type within each GWSA grid was then determined by selecting the category with the highest percentage.

2.3.2. Groundwater Storage Variation Calculation

Monthly GWSAs were derived using the GRACE and GLDAS datasets. The GWSA was calculated by subtracting GLDAS-based surface water storage changes from GRACE-derived total terrestrial water storage changes, following the equation from Wang et al. [37]:
GWSA = TWSA − SWEA − SMSA − CWSA − SWSA
where TWSA, SWEA, SMSA, CWSA, and SWSA denote the storage anomalies of terrestrial water, snow water equivalent, soil moisture, canopy water, and surface water, respectively. The GWSAs calculated via Equation (1) represent deviations from the long-term mean groundwater storage, i.e., the groundwater storage anomaly. To address the data gap between the GRACE and GRACE-FO missions, linear interpolation was applied to ensure temporal continuity.

2.3.3. Climate and Human Contribution

We employed multivariate regression residual analysis to quantify the relative contributions of climatic and anthropogenic factors to groundwater storage dynamics. This methodology involves establishing climate-driven variable time series through climate data regression, with the residuals between observed and modeled variables being attributed to anthropogenic influences [38,39]. Specifically, we developed a multiple regression model using GWSAs, along with climatic variables (precipitation and temperature). Precipitation and temperature were selected as the primary climatic drivers since they can effectively reconstruct most climate-induced water storage variations [40].
The multiple regression model was calibrated to fit monthly GWSA observations using corresponding precipitation and temperature anomalies. The model outputs (reconstructed monthly GWSAs) were identified as climate-driven GWSA variations. Anthropogenic-induced GWSA changes were subsequently derived by subtracting the climate-driven GWSA from the original GWSA (Equation (1)). Finally, linear trends of the original, climate-driven, and anthropogenic-driven GWSA change time series were computed to determine their respective contribution rates. The analytical framework is formalized as follows:
G W S A c c = a × P + b × T + c
G W S A a c = G W S A G W S A c c
where following abbreviations are used:
  • GWSAcc = Climate-driven groundwater storage anomaly;
  • GWSAac = Anthropogenic-driven groundwater storage anomaly;
  • GWSA = Original groundwater storage anomaly;
  • P = Monthly precipitation anomaly;
  • T = Monthly temperature anomaly;
  • a, b, c = Regression coefficients estimated at grid scale.

3. Results

3.1. Distribution of Three Types of Cities in YZB and YRB

In the YZB, distinct spatial distribution patterns emerge among the three city categories (Figure S2a–c). DCs exhibit a dispersed configuration across the upper and middle reaches, while NCs demonstrate concentrated clustering predominantly in the middle reach regions. SCs maintain relatively dense distributions throughout both the upper and middle basin sections (Figure S2a–c and Figure 2). The city grids distribution across sub-basins revealed that the middle reach contains the highest grid counts. This is particularly evident in the NCs (90 grids) and SCs (314 grids), which both peak in this section. The downstream area shows reduced grids, a phenomenon attributable to its comparatively limited spatial extent and advanced urbanization levels. Notably, certain downstream regions have transitioned from rapid urbanization phases to mature developmental stages. Across all sub-basins, the SCs maintain numerical dominance, followed sequentially by NCs and DCs, respectively.
The spatial distribution of different urban typologies in the YRB manifests distinct regional characteristics (Figure S2d–f and Figure 2). DCs exhibit scattered-point patterns, predominantly in the midstream region, while SCs demonstrate the most extensive spatial coverage across four major zones—from the headwater regions to upper, middle, and lower reaches. Notably, the midstream basin hosts the highest concentration of SCs, forming a prominent clustered zone. NCs primarily aggregate in the upper and midstream areas, regions characterized by later-stage urbanization processes that present substantial developmental potential. The midstream region has the highest number of the four types of city grids, containing 23 NCs and 158 SCs—figures significantly surpassing those of other regions. In contrast, the downstream area, constrained by limited area and advanced urbanization, shows comparatively fewer NCs. SCs have absolute numerical superiority across all sub-basins, followed by NCs, with DCs constituting the smallest cohort. This spatial configuration not only reflects the phased nature of urbanization processes but also underscores the significant regional disparities in development trajectories within the Yellow River Basin’s complex ecosystem.

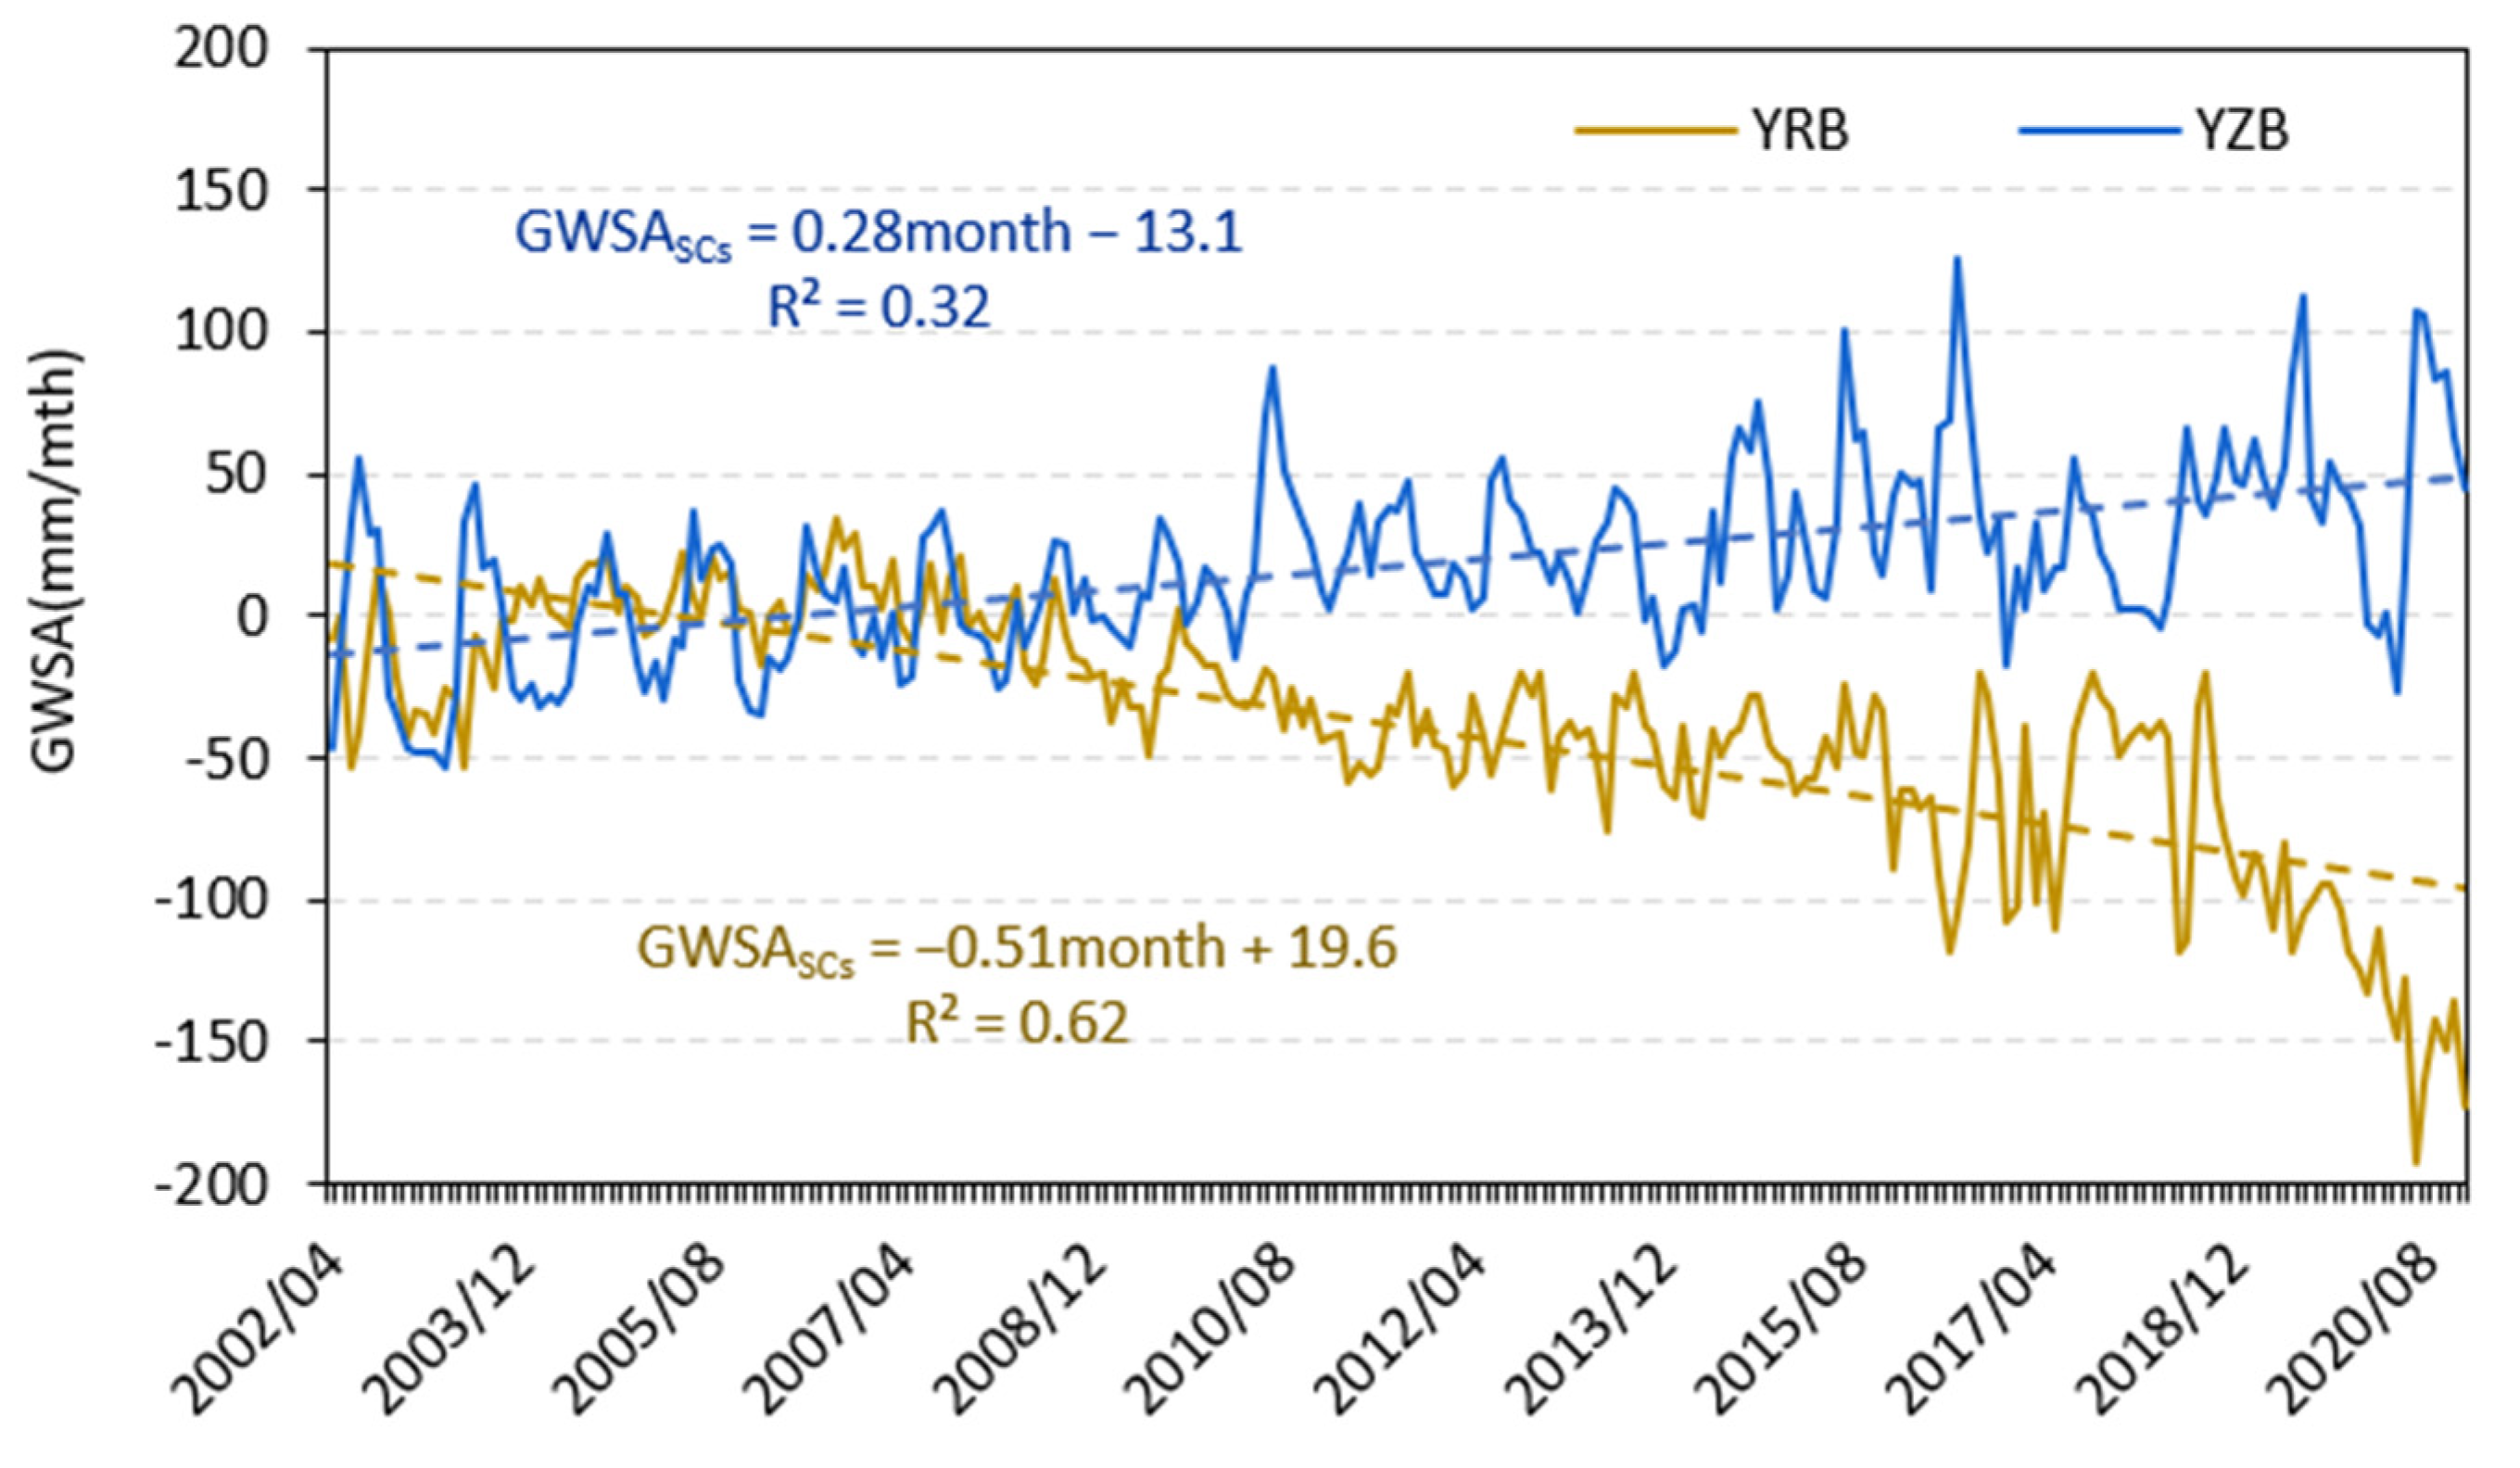
3.2. GWSA Variations in Three Types of Cities

Through comparative analysis of GWSA trends across five land use categories—DCs, SCs, NCs (original paddy-dominated grids), drylands, and paddy fields—in the Yangtze River Basin and its three sub-basins over two decades, the GWSAs were found to show a continuous increase for all land use types, with average annual increases ranging from 1.73 to 6.14 mm/yr (Table 1). Notably, GWSA variability showed no statistically significant discrepancies across the five land use types. GWSAs in YZB urban grids showed a marked increasing trend at 3.47 mm/yr (p < 0.05) during 2002–2020, aligning with the upward patterns observed in agricultural land types, including dryland and paddy fields, rather than exhibiting the anticipated decline (Table 1). The hydrological resilience observed in this region implies complex synergistic effects of urban expansion through optimized drainage infrastructure and reduced evapotranspiration due to impervious surfaces.
A parallel investigation of GWSA trends across four land use categories in the Yellow River Basin—DCs, SCs, NCs (converted from former drylands), and persistent drylands—revealed a universal depletion pattern over the past two decades. All categories exhibited persistent depletion with annualized rates ranging from −1.60 to −9.09 mm/yr (Table 1). Although there are non-significant disparities in decline magnitudes among these four types of land use, NCs demonstrated notably intensified depletion (−6.16 mm/yr), exceeding both drylands and other urban categories.
The spatial gradient characteristics of GWSAs (Table 1, Figure 3) showed that in the humid YZB, GWSA growth rates exhibit a stepwise attenuation from upstream to middle–lower reaches (Table 1, Figure 3a,b), highlighting longitudinal disparities in hydrological conditions across the basin, while in the semi-arid YRB, GWSA depletion rates display a headwater-amplified depletion pattern (Table 1, Figure 3c,d), progressively intensifying from source regions through upper, middle, and lower reaches—a gradient trend opposite to that of the Yangtze. This divergent gradient pattern aligns with distinct hydrogeographic contexts. Notably, human activities dominate the downstream zones of both basins. High population density and accelerated urbanization in the lower reaches drive surging water demands, particularly groundwater overdraft, which spatially correlates with GWSA variations. The pronounced downstream depletion acceleration in the semi-arid YRB reflects a cumulative anthropogenic impact along the river’s flow direction, underscoring the interplay between human pressure and groundwater dynamics.
Monthly GWSA changes in cities (for example, SCs) in the YZB and YRB during the past two decades showed opposite trends, i.e., a significant increase in the YZB and a significant decrease in the Yellow River Basin (Figure 4).

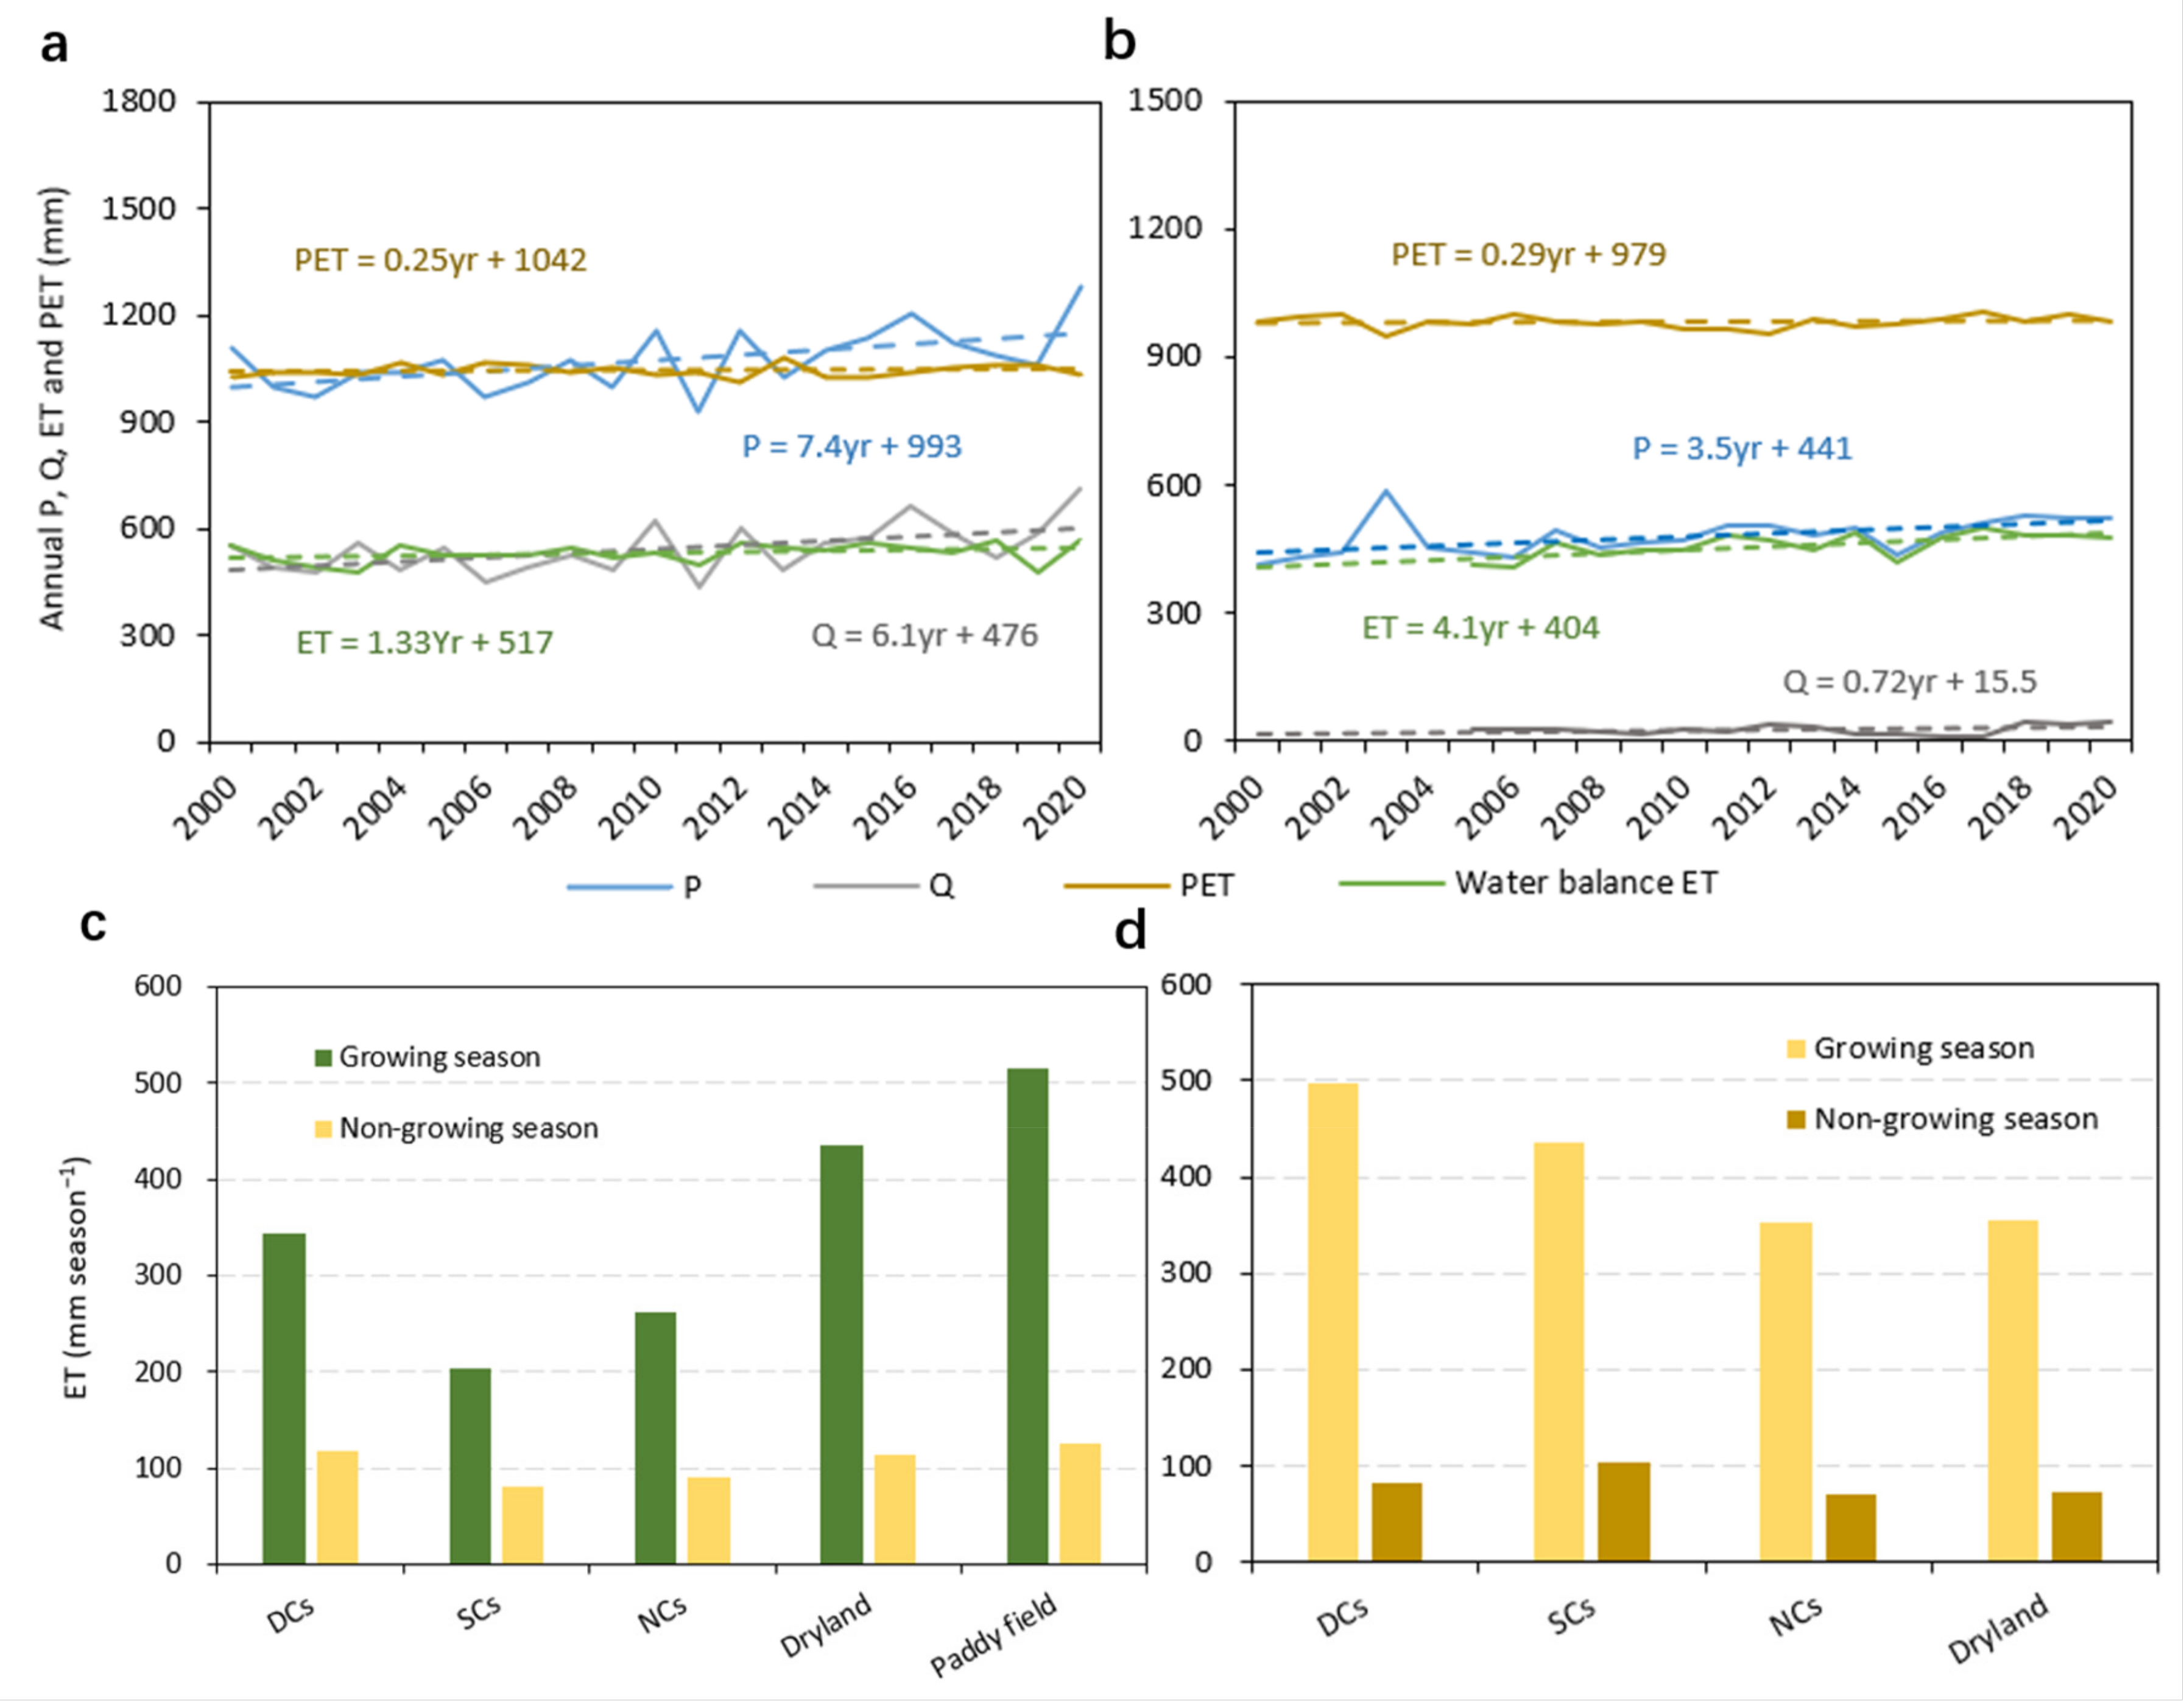
3.3. Climatic Regimes in YZB and YRB

Through a comparative analysis of hydrological dynamics in the Yangtze River Basin (YZB) and Yellow River Basin (YRB) over two decades (Figure 5), distinct hydroclimatic responses emerged. In the humid YZB, annual precipitation exhibited a significant increasing trend (7.4 mm yr⁻1), while PET remained virtually stable (0.25 mm yr⁻1), with only marginal growth in ET (1.33 mm yr⁻1). Notably, this precipitation surplus manifested as a substantial runoff depth increment (6.1 mm yr⁻1), strongly suggesting that enhanced atmospheric water input serves as the primary driver for the observed GWSA amplification in this basin (Figure 5a). In contrast, the semi-arid YRB demonstrated divergent behavior despite comparable precipitation gains (3.5 mm yr⁻1). While maintaining stable PET levels (0.29 mm yr⁻1), this basin experienced pronounced ET intensification (4.1 mm yr⁻1), effectively counterbalancing precipitation increases and resulting in hydrologically insignificant runoff variations (0.72 mm yr⁻1) (Figure 5b).
The pronounced seasonal variability in GWSAs underscores vegetation transpiration as an important modulator of groundwater storage dynamics (Figure 5c,d). In the YZB, our analysis reveals substantially diminished evapotranspiration (ET) rates in urban zones compared to adjacent dryland and paddy ecosystems during the growing season (Figure 5c), creating favorable conditions for enhanced groundwater recharge through reduced evapotranspirative losses. Conversely, the non-growing season exhibits remarkable GWSA convergence across all land cover types (Figure 5c), suggesting diminished vegetation-mediated regulation during dormancy periods.
The semi-arid YRB presents a countervailing pattern, with urban areas demonstrating elevated ET fluxes surpassing those of dryland regions during peak vegetation activity (Figure 5d)—a phenomenon likely attributable to intensive urban greening initiatives. This anthropogenic enhancement of ET appears to constrain groundwater replenishment potential, contrasting sharply with the hydrological regime observed in YZB.

3.4. Contributions of Climate and Human Activities to Urban GWSAs

Over the past two decades, climate variability dominated GWSA intensification in the humid YZB, explaining 86% of spatial-temporal variations in cities (Figure 6a,c). Anthropogenic factors contributed marginally (14%), with 41% of urban grids showing minimal human influence (0–10%) and near-total climate control (90–100%, Figure 7a). Spatially, midstream areas exhibited climate-dominated GWSA dynamics (blue grids, Figure 6a,c), contrasting sharply with downstream areas where anthropogenic activities superseded climatic drivers (blue grids, Figure 6b,d). This inversion was particularly pronounced in SCs (Figure 6a,c), reflecting intensified groundwater–urbanization linkages in highly developed cities.
Conversely, anthropogenic impacts prevailed in the semi-arid YRB, accounting for 72% of GWSA variations (Figure 6b,d), versus 28% from climate. Thirty-seven percent of urban grids displayed negligible climate contributions (0–20%) coupled with overwhelming anthropogenic dominance (80–100%, Figure 7b). Human activities exerted maximal influence across the central/northern headwaters, mid-river zones, and downstream areas (Figure 6b,d), while climate effects peaked in the western/southern headwaters.
The annual water balances at the basin scale (Table 2, Figure 5a,b) support the above quantitative attributions (Figure 6 and Figure 7) and further confirm that the increasing annual precipitation was the dominant influencing factor for the rise in annual groundwater storage in the humid YZB, while divergent behavior was observed, despite comparable precipitation gains, in the semi-arid YRB.

4. Discussion

4.1. Implications of Dual Impacts of Urbanization on Groundwater Storage

Urbanization manifests dual hydrologic effects on groundwater systems. Firstly, the depletion of urban groundwater storage primarily stems from surging water demands for production and domestic use, coupled with over-extraction [41]. Another critical driver is urbanization-triggered expansion of impervious surfaces [42] and land cover alterations [43], which indirectly impact groundwater through multiscale ecohydrological processes [5,6,7]. Studies demonstrate that impervious surfaces reduce wet-season infiltration recharge [44] and diminish baseflow replenishment via amplified surface runoff [45,46]. These cascading effects profoundly reconfigure urban hydrological cycles.
While the aforementioned mechanisms predominantly drive groundwater depletion trends, they may conversely trigger compensatory recharge processes under specific conditions. Urbanization may paradoxically enhance groundwater storage under specific conditions. Wastewater treatment effluent can boost baseflow [47] or groundwater storage [48] in large basins. While impervious surfaces typically disrupt surface–groundwater connectivity and amplify runoff [21,42]; they simultaneously reduce evapotranspiration—a dual mechanism demonstrated in Western Australia’s Swan coastal plain where decreased vegetation water loss and enhanced infiltration and elevated recharge rates [49]. This phenomenon intensifies in humid regions: urban conversion of woodlands/wetlands diminishes their “biological drainage” capacity, increasing soil moisture and shallow groundwater [21]. Strategic stormwater management in arid zones like the U.S. southwest further illustrates artificial recharge potential [22].
The results of this study are consistent with previous findings investigating the climate change and anthropogenic impacts on GWSAs in the humid YZB [8,9,10]. However, this study highlighted the important role of urbanization. Contrary to initial assumptions, GWSAs in YZB urban grids showed a marked increasing trend at 3.47 mm/year (p < 0.05) during 2002–2020, aligning with the upward patterns observed in agricultural land types, including dryland and paddy fields, rather than exhibiting the anticipated decline (Table 1). This means that, although impervious surfaces lead to a decline in groundwater storage in cities through reducing rainfall infiltration recharge, a large decline in vegetation transpiration in cities during the growing season can lead to increases in GWSAs in a basin, especially in a humid basin. In general, the hydrological outcome depends on the balance between infiltration constraints and evapotranspiration reduction—when vegetation water consumption decreases substantially, groundwater reserves may paradoxically rise despite surface hardening.
Compared with the YZB, the YRB exhibits substantial divergence in climatic patterns, water resource availability, and land use/land cover changes due to reforestation and grassland restoration. Our findings in the YRB align with United Nations [11] warnings about the heightened vulnerability of dryland basins to groundwater exhaustion. In arid regions, urban greening can mitigate heat through evapotranspiration [7,50], but achieving these benefits requires a careful tradeoff between sustaining vegetation coverage and addressing its adverse impacts on local water resources.

4.2. Impacts of Contrasting Climatic Regimes on Groundwater Storage

Climate factors significantly influence groundwater storage through the interplay of precipitation and temperature. Precipitation serves as the primary source of groundwater recharge, with its intensity, frequency, and seasonal distribution determining the efficiency and volume of water infiltration. Temperature indirectly regulates recharge by modulating evapotranspiration rates and snowmelt processes.
In humid regions, high annual precipitation and sustained rainfall generally promote stable, long-term groundwater replenishment. However, elevated temperatures enhance surface evaporation and vegetation transpiration, partially offsetting infiltration gains. Intense short-term rainfall events may also increase surface runoff, reducing effective percolation. In arid regions, precipitation is scarce and often concentrated in brief heavy storms. Dry soils, surface crusting, and low water-retention capacity lead to rapid runoff, limiting infiltration. Coupled with high temperatures that intensify evaporation, groundwater recharge becomes minimal and highly dependent on episodic rainfall or intermittent snowmelt, resulting in fragile and highly variable groundwater reserves. This contrasting hydrological behavior underscores the critical role of climatic variables in mediating hydrological responses to environmental changes, resulting in differences in water partitioning mechanisms between humid and semi-arid systems and forming the fundamental drivers of GWSAs.
This study revealed divergent urban GWSA dynamics between the humid Yangtze River Basin (YZB) and semi-arid Yellow River Basin (YRB) during 2002–2020. The humid YZB city grids exhibited a significant upward trend in GWSAs, while the semi-arid YRB city grids experienced a pronounced decline, particularly in downstream alluvial plains where depletion rates were triple those of mountainous headwaters. The contrasting climatic regimes form the fundamental drivers: YZB’s humid climate (1074 mm/yr mean precipitation) amplified groundwater recharge through enhanced surface runoff (+6.1%) driven by precipitation increases (+7.4 mm/yr). In contrast, semi-arid YRB’s water deficit intensified despite marginal precipitation gains (+3.5 mm/yr), as amplified evapotranspiration (+4.1 mm/yr) exacerbated moisture scarcity. Our findings are consistent with previous statements that vegetation restoration in the middle reaches of the YRB consumed a significant amount of rainfall infiltration through evapotranspiration, which is a key factor contributing to the significant decline in groundwater storage [17,51], but our study also highlights the effects of climate and human activities on groundwater storage in the urbanized region.

4.3. Limitations and Uncertainties

The primary uncertainty inherent in GRACE satellite data stems from the dataset’s intrinsic spatial resolution constraints. When monitoring terrestrial water storage changes at small, regional or medium-sized watershed scales, computational results frequently exhibit substantial deviations from the actual conditions, resulting in the current research focus on large watershed applications. Particularly in assessing urbanization impacts, GRACE’s resolution proves inadequate for discerning fine-grained spatial variations, potentially introducing significant uncertainties in evaluations. To overcome this limitation, we propose a grid-integration analytical approach: First, we quantify the distribution of three urban characteristic subgrids (1 km × 1 km) within each 0.25° × 0.25° GWSA macro-grid. We then compute the proportional representation of each urban type relative to the total urbanized subgrids, ultimately defining the dominant urban type through majority representation within each macro-grid.
The selection of GLDAS Noah was based on three key considerations: (1) Its 0.25° spatial resolution enables fine-scale characterization of regional hydrological processes. (2) The model integrates multi-source observations (satellite/ground data) and has been rigorously validated in prior studies. (3) Its temporal resolution and data format are highly compatible with GRACE-derived TWS datasets, ensuring consistency in long-term trend analysis. While process-based models (e.g., CLM and VIC) offer unique strengths in specific contexts (e.g., ecological processes or runoff modeling), Noah provides a balanced framework for large-scale TWS partitioning due to its computational efficiency and robust physical parameterization. Nevertheless, we acknowledge that potential uncertainties remain due to the exceptional complexity of the groundwater system dynamics.
The residual analysis in this study showed that the combined contribution rates of climate and human activities might not sum to 100% at a local (grid-cell) scale but sum to 100% at the regional level. The key to these errors lies in the issue of scale: models prioritize explanatory completeness at larger scales, masking local uncertainties, whereas finer scales reveal heterogeneity but introduce statistical noise. Generally, although the residual analysis offers a straightforward and intuitive approach to disentangle climate and human impacts, its reliability heavily depends on the validity of model assumptions and the clarity of the data structure. In this study, we applied both water balance analysis and the residual analysis to detect the contribution of the climate and human activities. The water balance analysis results support our findings on the contributions results.
Future investigations should develop integrated methodological frameworks that synergize (1) high-resolution remote sensing for capturing surface micro-variations, (2) coupled surface–subsurface process-based models to decipher hydrological interactions, and (3) multi-basin-scale hydroecological modeling architectures. Such multi-dimensional integration will enable systematic elucidation of feedback mechanisms governing surface water, groundwater, and vegetation systems.

5. Conclusions

This study reveals distinct groundwater dynamics between China’s major river basins driven by contrasting hydroclimatic and urbanization patterns. The Yangtze River Basin exhibits a humid climate with 1074 mm annual precipitation and a balanced seasonal distribution. Under progressive urbanization with well-developed urban infrastructure, its groundwater storage demonstrates a climate-dominated growth mechanism (86% contribution). Enhanced precipitation–runoff–recharge feedbacks drive significant groundwater accumulation at 2.99 mm/yr in the whole basin. Notably, synergistic urban-ecological development has resulted in an increase (3.47 mm/yr) in groundwater storage in the city rather than a decrease compared to other land use types (e.g., dryland vs. paddy field).
In contrast, the Yellow River Basin exhibits an annual precipitation regime of 479 mm characterized by marked interannual fluctuations. When combined with intensive irrigation practices and significant anthropogenic groundwater reliance, this hydrological pattern has triggered substantial depletion of groundwater storage across the basin. Over recent decades, urbanization within the basin has manifested as rapid, unregulated urban sprawl. This development pattern, marked by excessive urban water extraction and the impediment of natural infiltration processes by impervious surfaces, has resulted in disproportionately severe groundwater depletion in urbanized areas relative to other land use categories (e.g., dryland). Notably, New Cities (NCs) demonstrate particularly acute depletion rates, reaching −6.2 mm/yr, exceeding those observed in adjacent dryland regions (−5.0 mm/yr). Comprehensive analysis reveals that anthropogenic forcing constitutes the principal driver (72% contribution) of urban groundwater storage variations within the basin, manifesting as water resource over-exploitation within climatically constrained systems.
This study fills a critical knowledge gap in understanding the dual effects of large-scale urbanization on groundwater storage. The juxtaposition of these two basins underscores how geographic determinism and anthropogenic forces interact to shape distinct water security challenges across China’s hydrological spectrum. This comparative analysis highlights how precipitation redundancy in humid zones buffers urbanization impacts through natural recharge amplification, whereas arid-region cities face compounded stresses from climatic vulnerability and water resource over-exploitation.

Supplementary Materials

The following supporting information can be downloaded at: https://www.mdpi.com/article/10.3390/rs17071292/s1, Figure S1: Comparison of the percentage of land cover types in different reaches in (a) Yangtze River Basin and (b) Yellow River Basin, respectively (the inner circle is for the year 2000, the outer circle 2020, percentages less than 3% are not shown). Figure S2: Proportions of three types of cities (a,d) disappearing cities (DCs), (b,e) new cities (NCs), and (c,f) stable cities (SCs), where different colors represent the proportions of city grids, and the calculated method is referred to Equation (2). (a–c) is Yangtze River Basin, (d–f) is Yellow River Basin.

Author Contributions

Conceptualization, L.H.; Data curation, W.Z.; Formal analysis, W.Z.; Funding acquisition, L.H.; Methodology, W.Z.; Project administration, L.H.; Software, W.Z.; Supervision, L.H.; Validation, W.Z.; Writing—original draft, W.Z. and L.H.; Writing—review and editing, W.Z. and L.H. All authors have read and agreed to the published version of the manuscript.

Funding

This research was supported by the National Natural Science Foundation of China-United Nations Environment Programme (NSFC-UNEP) International Joint Research Project (42061144004; principal investigator: Lu Hao, NUIST).

Data Availability Statement

The data that support the findings of this study are available upon reasonable request from the authors.

Acknowledgments

The monthly terrestrial water storage anomalies (TWSAs) dataset released by CSR (Center for Space Research) (GRACE/GRACE-FO RL06.2 Mascons, https://www2.csr.utexas.edu/grace/RL06_mascons.html, accessed on 5 May 2023) and the Global Land Data Assimilation System (GLDAS) (GLDAS-NOAHv2.1) driven by GLDAS-v2.1 are available online (https://search.earthdata.nasa.gov/, accessed on 10 May 2023). The land use and land cover data were from the China Multi-Period Land Use Remote Sensing Monitoring dataset (CNLUCC) (https://www.resdc.cn/DOI/DOI.aspx?DOIID=54, accessed on 3 May 2023). Monthly potential evapotranspiration data with a spatial resolution of 1 km were from the National Tibetan Plateau Science Data Center (https://data.tpdc.ac.cn/zh-hans/, accessed on 8 June 2024). The monthly precipitation and temperature data with a spatial resolution of 1 km and period of 2000–2020 were obtained from the Science Data Bank (https://www.scidb.cn/en/cstr/31253.11.sciencedb.01607, accessed on 12 June 2023) and National Tibetan Plateau Data Center (https://data.tpdc.ac.cn/zh-hans/data/71ab4677-b66c-4fd1-a004-b2a541c4d5bf, accessed on 12 June 2023), respectively. The evapotranspiration remote sensing product (Operational Simplified Surface Energy Balance, SSEBop) is available online (https://edcintl.cr.usgs.gov/downloads/sciweb1/shared//fews/web/global/monthly/, accessed on 2 July 2024).

Conflicts of Interest

The authors declare that they have no known competing financial interests or personal relationships that could have appeared to influence the work reported in this paper.

References

  1. Wada, Y. Modeling Groundwater Depletion at Regional and Global Scales: Present State and Future Prospects. Surv. Geophys. 2016, 37, 419–451. [Google Scholar] [CrossRef]
  2. Sun, S.; Liu, H.; Konar, M.; Fu, G.; Fang, C.; Huang, Z.; Li, G.; Qi, W.; Tang, Q. Urban groundwater supplies facing dual pressures of depletion and contamination in China. Proc. Natl. Acad. Sci. USA 2025, 22, e2412338122. [Google Scholar] [CrossRef] [PubMed]
  3. O’Driscoll, M.; Clinton, S.; Jefferson, A.; Manda, A.; McMillan, S. Urbanization effects on watershed hydrology and in-stream processes in the southern United States. Water 2010, 2, 605–648. [Google Scholar] [CrossRef]
  4. Zaryab, A.; Nassery, H.R.; Alijani, F. The effects of urbanization on the groundwater system of the Kabul shallow aquifers, Afghanistan. Hydrogeol. J. 2022, 30, 429–443. [Google Scholar]
  5. Li, C.; Sun, G.; Caldwell, P.V.; Cohen, E.; Fang, Y.; Zhang, Y.; Oudin, L.; Sanchez, G.M.; Meentemeyer, R.K. Impacts of urbanization on watershed water balances across the conterminous United States. Water Resour. Res. 2020, 56, e2019WR026574. [Google Scholar]
  6. Li, C.; Sun, G.; Cohen, E.; Zhang, Y.; Xiao, J.; McNulty, S.G.; Meentemeyer, R.K. Modeling the impacts of urbanization on watershed-scale gross primary productivity and tradeoffs with water yield across the conterminous United States. J. Hydrol. 2020, 583, 124581. [Google Scholar]
  7. Sun, G.; Hao, L. Research progress on the interaction between evapotranspiration processes and service functions in ecosystems. In Lecture on Modern Ecology (X): Core Topics, Research Progress and Future Challenges; Wu, J.K., Ed.; Higher Education Press: Beijing, China, 2023. [Google Scholar]
  8. Nie, N.; Zhang, W.C.; Chen, H.; Zhao, D.; Liu, M. Temporal variation characteristics and attribution analysis of water storage changes in the Yangtze River Basin. Adv. Water Sci. 2021, 32, 396–407. [Google Scholar]
  9. Xiong, J.H.; Guo, S.L.; Wang, J.; Yin, J.; Li, N. Change and attribution of land water reserves in the Yangtze River Basin. J. Wuhan Univ. (Inf. Sci. Ed.) 2024, 49, 2241–2248. [Google Scholar]
  10. Dong, G.Q. Study on Drought Monitoring in the Yangtze River Basin Using Gravity Satellites GRACE and GRACE-FO. Master’s Thesis, Xiangtan University, Xiangtan, China, 2023. [Google Scholar]
  11. United Nations. The United Nations World Water Development Report 2022. Groundwater: Making the Invisible Visible; UNESCO: Paris, France, 2022. [Google Scholar]
  12. Guan, X.D.; Shen, X.H.; Li, M.Y.; Huang, J.P.; Wei, Z.M.; Ma, Y.L. Impact of urbanization on groundwater in the Yellow River Basin. Chin. J. Atmos. Sci. 2023, 46, 9–17. [Google Scholar]
  13. Yao, D.; Zhang, Z.W.; Han, W.W. Differentiating the different components of water storage changes in the Yellow River Basin caused by climate change and human activities. Arid. Reg. Geogr. 2025, 48, 190–201. [Google Scholar]
  14. Yin, Y.; Tang, Q.; Liu, X.; Zhang, X. Water scarcity under various Socio-economic pathways and its potential effects on food production in the Yellow River Basin. Hydrol. Earth Syst. Sci. 2017, 21, 791–804. [Google Scholar]
  15. Xie, J.; Xu, Y.P.; Wang, Y.; Gu, H.; Wang, F.; Pan, S. Influences of climatic variability and human activities on terrestrial water storage variations across the Yellow River basin in the recent decade. J. Hydrol. 2019, 579, 124218. [Google Scholar] [CrossRef]
  16. Zhang, B.Q.; Shao, R.; Zhao, X.N.; Wu, P. Effects of large-scale vegetation restoration on ecohydrological processes in the Loess Plateau. Chin. J. Appl. Basic Eng. Sci. 2020, 28, 594–606. [Google Scholar]
  17. Liu, J.H.; Zhou, M.L.; Shao, W.W. Spatial and temporal evolution characteristics and influencing factors of groundwater reserves in the Yellow River Basin. People’s Yellow River 2024, 46, 67–73. [Google Scholar]
  18. Zhang, X.P.; Zhang, L.; Wang, Y.; Mu, X.M. Spatiotemporal response of annual runoff to land use change in the middle Yellow River. Sci. Soil Water Conserv. China 2009, 7, 19–26. [Google Scholar]
  19. Green, T.R.; Taniguchi, M.; Kooi, H.; Gurdak, J.J.; Allen, D.M.; Hiscock, K.M.; Treidel, H.; Aureli, A. Beneath the surface of global change: Impacts of climate change on groundwater. J. Hydrol. 2011, 405, 532–560. [Google Scholar] [CrossRef]
  20. Chen, J.; Famigliett, J.S.; Scanlon, B.R.; Rodell, M. Groundwater Storage Changes: Present Status from GRACE Observations. Surv. Geophys. 2016, 37, 397–417. [Google Scholar] [CrossRef]
  21. Hao, L.; Sun, G.; Liu, Y.; Wan, J.; Qin, M.; Qian, H.; Liu, C.; Zheng, J.; John, R.; Fan, P.; et al. Urbanization dramatically altered the water balances of a paddy field-dominated basin in southern China. Hydrol. Earth Syst. Sci. 2015, 19, 3319–3331. [Google Scholar] [CrossRef]
  22. Carlson, M.A.; Lohse, K.A.; Mcintosh, J.C.; McLain, J.E. Impacts of urbanization on groundwater quality and recharge in a semi-arid alluvial basin. J. Hydrol. 2011, 409, 196–211. [Google Scholar] [CrossRef]
  23. IPCC. Climate Change 2023: Synthesis Report. Contribution of Working Groups I, II and III to the Sixth Assessment Report of the Intergovernmental Panel on Climate Change; Core Writing Team, Lee, H., Romero, J., Eds.; IPCC: Geneva, Switzerland, 2023; pp. 35–115. [Google Scholar]
  24. Wei, X.H.; Sun, G. Watershed Ecosystem Processes and Management, 2nd ed.; Higher Education Press: Beijing, China, 2023. [Google Scholar]
  25. Tapley, B.D.; Bettadpur, S.; Watkins, M.M.; Reigber, C. The Gravity recovery and climate experiment: Mission overview and early results. Geophys. Res. Lett. 2004, 31, L09607. [Google Scholar] [CrossRef]
  26. Tapley, B.D.; Bettapur, S.; Ries, J.; Thompson, P.F.; Watkins, M.M. GRACE measurements of mass variability in the earth system. Science 2004, 305, 503–505. [Google Scholar] [CrossRef] [PubMed]
  27. Wahr, J.; Swenson, S.; Zlotnicki, V.; Velicogna, I. Time-variable gravity from GRACE: First results. Geophys. Res. Lett. 2004, 31, L11501. [Google Scholar] [CrossRef]
  28. Rodell, M.; Houser, P.; Jambor, U.; Gottschalck, J.; Mitchell, K.; Meng, C.; Arsenault, K.; Cosgrove, B.; Radakovich, J.; Bosilovich, M. The global land data assimilation system. Bull. Am. Meteorol. Soc. 2004, 85, 381–394. [Google Scholar]
  29. Hiroko, B.; Rodell, M.; Huang, J. GLDAS Noah Land Surface Model L4 monthly 0.25 × 0.25 degree V2.1; Goddard Earth Sciences Data and Information Services Center (GES DISC): Greenbelt, MD, USA, 2016. [Google Scholar]
  30. Yin, W.J.; Hu, L.T.; Wang, J.R. Changes of groundwater storage variation based on GRACE data at the Beishan area, Gansu Province. Hydrogeol. Eng. Geol. 2015, 42, 29–34. [Google Scholar]
  31. Peng, S.Z.; Ding, Y.X.; Liu, W.Z.; Li, Z. 1 km monthly temperature and precipitation dataset for China from 1901 to 2017. Earth Syst. Sci. Data 2019, 11, 1931–1946. [Google Scholar]
  32. Peng, S.Z.; Ding, Y.X.; Wen, Z.M.; Chen, Y.M.; Cao, Y.; Ren, J.Y. Spatiotemporal change and trend analysis of potential evapotranspiration over the Loess Plateau of China during 2011–2100. Agric. For. Meteorol. 2017, 233, 183–194. [Google Scholar]
  33. Huang, C.S.; Zhou, Y.; Zhang, S.N.; Wang, J.T.; Liu, F.M.; Gong, C.; Yi, C.Y.; Li, L.; Zhou, H.; Wei, L.S.; et al. Groundwater resources in the Yangtze River Basin and its current development and utilization. Geol. China 2021, 48, 979–1000. [Google Scholar]
  34. Senay, G.B.; Bohms, S.; Singh, R.K.; Gowda, P.H.; Velpuri, N.M.; Alemu, H.; Verdin, J.P. Operational Evapotranspiration Mapping Using Remote Sensing and Weather Data Sets: A New Parameterization for the SSEBOP Approach. J. Am. Water Resour. Assoc. 2013, 49, 577–591. [Google Scholar] [CrossRef]
  35. WorldPop; CIESIN (Center for International Earth Science Information Network). Global High Resolution Population Denominators Project-Funded by the Bill and Melinda Gates Foundation (OPP1134076) [EB/OL]. 2018. Available online: https://www.worldpop.org/ (accessed on 2 May 2023).
  36. Xu, X.L.; Liu, J.Y.; Zhang, S.W.; Li, R.; Yan, C.; Wu, S. Multiperiod Land Use Remote Sensing Monitoring Dataset in China (CNLUCC) [EB/OL]; Resource and Environmental Science Data Registration and Publication System; Institute of Geographic Sciences and Resources, Chinese Academy of Sciences: Beijing, China, 2018; Available online: https://www.resdc.cn/DOI/DOI.aspx?DOIID=54 (accessed on 3 May 2023). [CrossRef]
  37. Wang, F.; Lai, H.X.; Li, Y.B.; Feng, K.; Tian, Q.Q.; Guo, W.X.; Qu, Y.P.; Yang, H.B. Spatio-temporal evolution and teleconnection factor analysis of groundwater drought based on the GRACE mascon model in the Yellow River Basin. J. Hydrol. 2023, 626, 130349. [Google Scholar]
  38. Humphrey, V.; Gudmundsson, L.; Seneviratne, S.I. A global reconstruction of climate-driven subdecadal water storage variability. Geophys. Res. Lett. 2017, 44, 2300–2309. [Google Scholar]
  39. Liu, B.; Zou, X.; Yi, S.; Sneeuw, N.; Cai, J.; Li, J. Identifying and separating climate and human driven water storage anomalies using GRACE satellite data. Remote Sens. Environ. 2021, 263, 112559. [Google Scholar] [CrossRef]
  40. Liu, M.Z.; Pe, H.W.; Shen, Y.J. Evaluating dynamics of GRACE groundwater and its drought potential in Taihang Mountain Region, China. J. Hydrol. 2022, 612, 128156. [Google Scholar] [CrossRef]
  41. Zhang, S.L.; Feng, P. Change of groundwater resources in Haihe River Basin and its impact on ecological environment. Water Resour. Hydropower Technol. 2003, 34, 47–49. [Google Scholar]
  42. Suriya, S.; Mudgal, B.V. Impact of urbanization on flooding: The Thirusoolam sub watershed—A case study. J. Hydrol. 2012, 412–413, 210–219. [Google Scholar] [CrossRef]
  43. Foley, J.A.; DeFries, R.; Asner, G.P.; Barford, C.; Bonan, G.; Carpenter, S.R.; Chapin, F.S.; Coe, M.T.; Daily, G.C.; Gibbs, H.K.; et al. Global consequences of land use. Science 2005, 309, 570–574. [Google Scholar] [CrossRef]
  44. Luong, V.V. Effects of urbanization on groundwater level in aquifers of Binh Duong Province, Vietnam. J. Groundw. Sci. Eng. 2021, 9, 20–36. [Google Scholar]
  45. Barringer, T.H.; Reiser, R.G.; Price, C.V. Potential effects of development on flow characteristics of two New Jersey streams. J. Am. Water Resour. Assoc. 1994, 30, 283–295. [Google Scholar] [CrossRef]
  46. Forman, R.T.T. Urban Ecology—Science of Cities; Cambridge University Press: New York, NY, USA, 2014. [Google Scholar]
  47. Paul, M.J.; Meyer, J.L. Streams in the urban landscape. Annu. Rev. Ecol. Syst. 2001, 32, 333–365. [Google Scholar] [CrossRef]
  48. Zhu, L.; Sun, J.C.; Liu, J.T.; Liu, J.; Lv, X.L. Study on the impact of urbanization on groundwater system in Lanzhou City. J. Water Resour. Water Eng. 2014, 25, 111–115. [Google Scholar]
  49. Barron, O.V.; Barr, A.D.; Dom, M.J. Effect of urbanisation on the water balance of a catchment with shallow groundwater. J. Hydrol. 2013, 485, 162–176. [Google Scholar] [CrossRef]
  50. Ellison, D.; Pokorný, J.; Wild, M. Even cooler insights: On the power of forests to (water the Earth and) cool the planet. Glob. Chang. Biol. 2024, 30, e17195. [Google Scholar] [CrossRef]
  51. Wang, X.D. Changes of Groundwater Reserves in the Yellow River Basin Based on GRACE Products and Its Influencing Factors; Northwest A&F University: Xianyang, China, 2023. [Google Scholar]
Figure 1. Population density and urban area in 2000, 2005, 2010, 2015, and 2020 in (a,c) Yangtze River Basin and (b,d) Yellow River Basin. In (a), I is the upstream area, II is the midstream area, and III is the downstream area. In (b), I is the headwater area, II is the upstream area, III is the midstream area, and IV is the downstream area.
Remotesensing 17 01292 g001
Figure 2. Grid numbers of three types of cities in sub-basins in YZB and YRB, respectively.
Remotesensing 17 01292 g002
Figure 3. Distribution of GWSA trends in three types of cities. (a,b) show the MK and slope trend, respectively, in the Yangtze River Basin. (c,d) show values for the Yellow River Basin. In (a,b), I is the upstream area, II is the midstream area, and III is the downstream area. In (c,d), I is the headwater area, II is the upstream area, III is the midstream area, and IV is the downstream area.
Remotesensing 17 01292 g003
Figure 4. Monthly GWSA changes (units are mm of equivalent water height) in Stable Cities (SCs) in the Yangtze River Basin (YZB) and the Yellow River Basin (YRB) from April 2002 to December 2020.
Remotesensing 17 01292 g004
Figure 5. Annual changes in precipitation (P), runoff depth (Q), evapotranspiration (ET), and potential evapotranspiration (PET) (2000–2020) in (a) YZB and (b) YRB. The annual P and Q data were sourced from the Water Resources Bulletin (2000–2020). Annual ET in (a,b) was calculated based on annual water balance, and PET was from the 1 km monthly PET dataset in China (2000–2020). Seasonal ET in (c,d) was from the remote sensing product SSEBop (2003–2020).
Remotesensing 17 01292 g005
Figure 6. Relative contributions of climate and human activities to GWSA changes (2002–2020) in cities (showing the Stable Cities (SCs) as an example) in the YZB (left) and YRB (right). (a,b) are climate contributions, (c,d) are human contributions. In (a,c), I is the upstream area, II is the midstream area, and III is the downstream area. In (b,d), I is the headwater area, II is the upstream area, III is the midstream area, and IV is the downstream area.
Remotesensing 17 01292 g006
Figure 7. Proportions of (a) climate and (b) human activities contribution grids to total contribution (climate and human) grids for different city types (NCs and SCs) in the YZB and YRB.
Remotesensing 17 01292 g007
Table 1. Trends in GWSAs (mm/yr) for Disappearing Cities (DCs), New Cities (NCs), Stable Cities (SCs), and dryland and paddy fields in the Yangtze River Basin and Yellow River Basin from 2002 to 2020.
Trend (mm/yr)DCsNCsSCsDrylandPaddy
Yangtze River Basin6.143.583.364.173.28
Upstream6.144.784.424.524.43
Midstream6.134.134.113.224.56
Downstream--2.041.73--1.95
Yellow River Basin−6.12−6.16−5.01−5.00--
Headwater Area--−2.17−3.05−1.60--
Upstream--−4.14−3.91−3.20--
Midstream−6.12−6.26−5.56−5.33--
Downstream--−9.09−8.87−9.06--
Note: The omitted values (marked as “--”) indicate the absence of the land use type, e.g., no Disappearing Cities (DCs) in downstream area. All results passed the 99% significance test. The original land cover type of NCs in the Yangtze River Basin/Yellow River Basin is paddy field/dryland.
Table 2. Annual magnitude and annual trends in precipitation (P), water yield (Q), evapotranspiration (ET), and urban GWSAs (average value of SCs and NCs), as well as contributions of climate (C) and human activities (H), in the Yangtze River Basin and Yellow River Basin from 2002 to 2020.
Magnitude (mm)/Trend (mm/yr)P/PTQ/QTET/ETTPET/PETTGWSATC/H
YZB1074/7.4543/6.1531/1.31045/0.253.4786%/14%
YRB479/3.525/0.7459/4.1981/0.29−5.5928%/72%
Note: Annual ET was calculated based on annual water balance (P-Q), and PET was from the 1 km monthly PET dataset in China (2000–2020).
Disclaimer/Publisher’s Note: The statements, opinions and data contained in all publications are solely those of the individual author(s) and contributor(s) and not of MDPI and/or the editor(s). MDPI and/or the editor(s) disclaim responsibility for any injury to people or property resulting from any ideas, methods, instructions or products referred to in the content.

