Article

Map of Arctic and Antarctic Polynyas 2013–2022 Using Sea Ice Concentration

1
National Key Laboratory of Earth System Numerical Modeling and Application, College of Earth and Planetary Sciences, University of Chinese Academy of Sciences, Beijing 100049, China
2
State Key Laboratory of Resources and Environmental Information System, Institute of Geographic Sciences and Natural Resources Research, Chinese Academy of Sciences, Beijing 100101, China
3
School of Mathematics and Maxwell Institute for Mathematical Sciences, The University of Edinburgh, Edinburgh EH1 2LE, UK
*
Author to whom correspondence should be addressed.
Remote Sens. 2025, 17(7), 1213; https://doi.org/10.3390/rs17071213
Submission received: 24 February 2025 / Revised: 26 March 2025 / Accepted: 27 March 2025 / Published: 28 March 2025
(This article belongs to the Special Issue SAR Monitoring of Marine and Coastal Environments)

Abstract

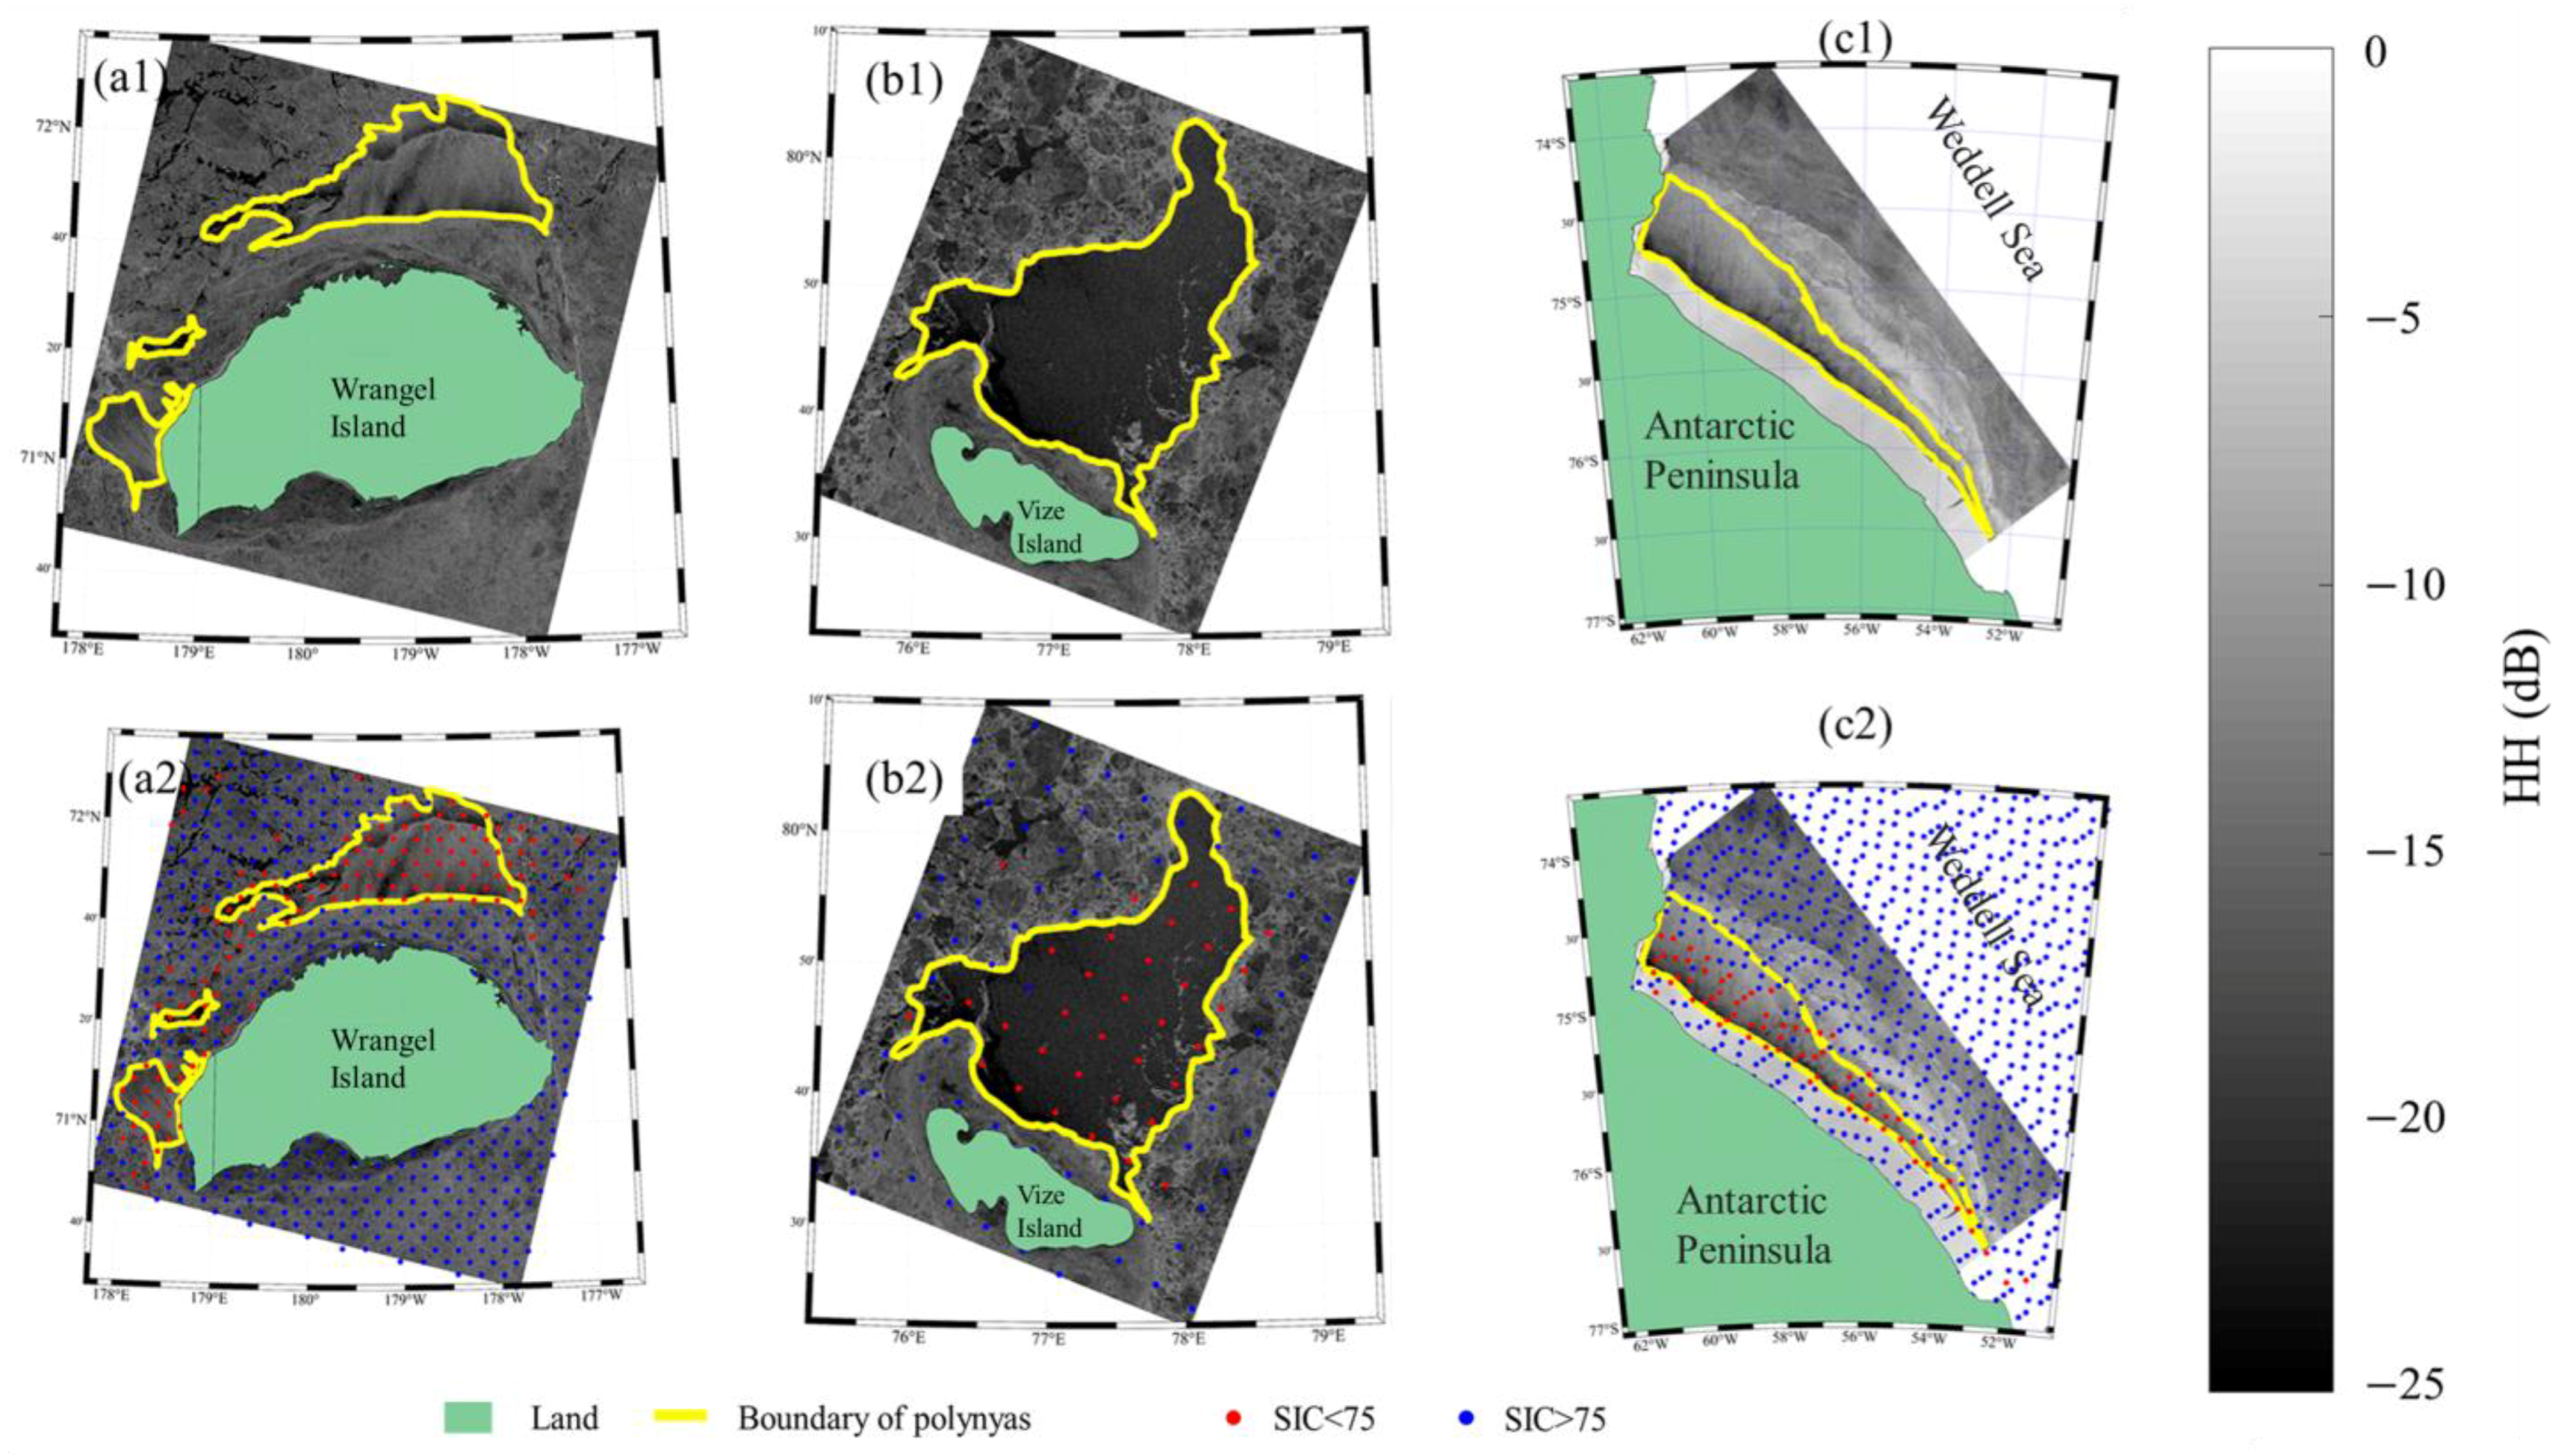
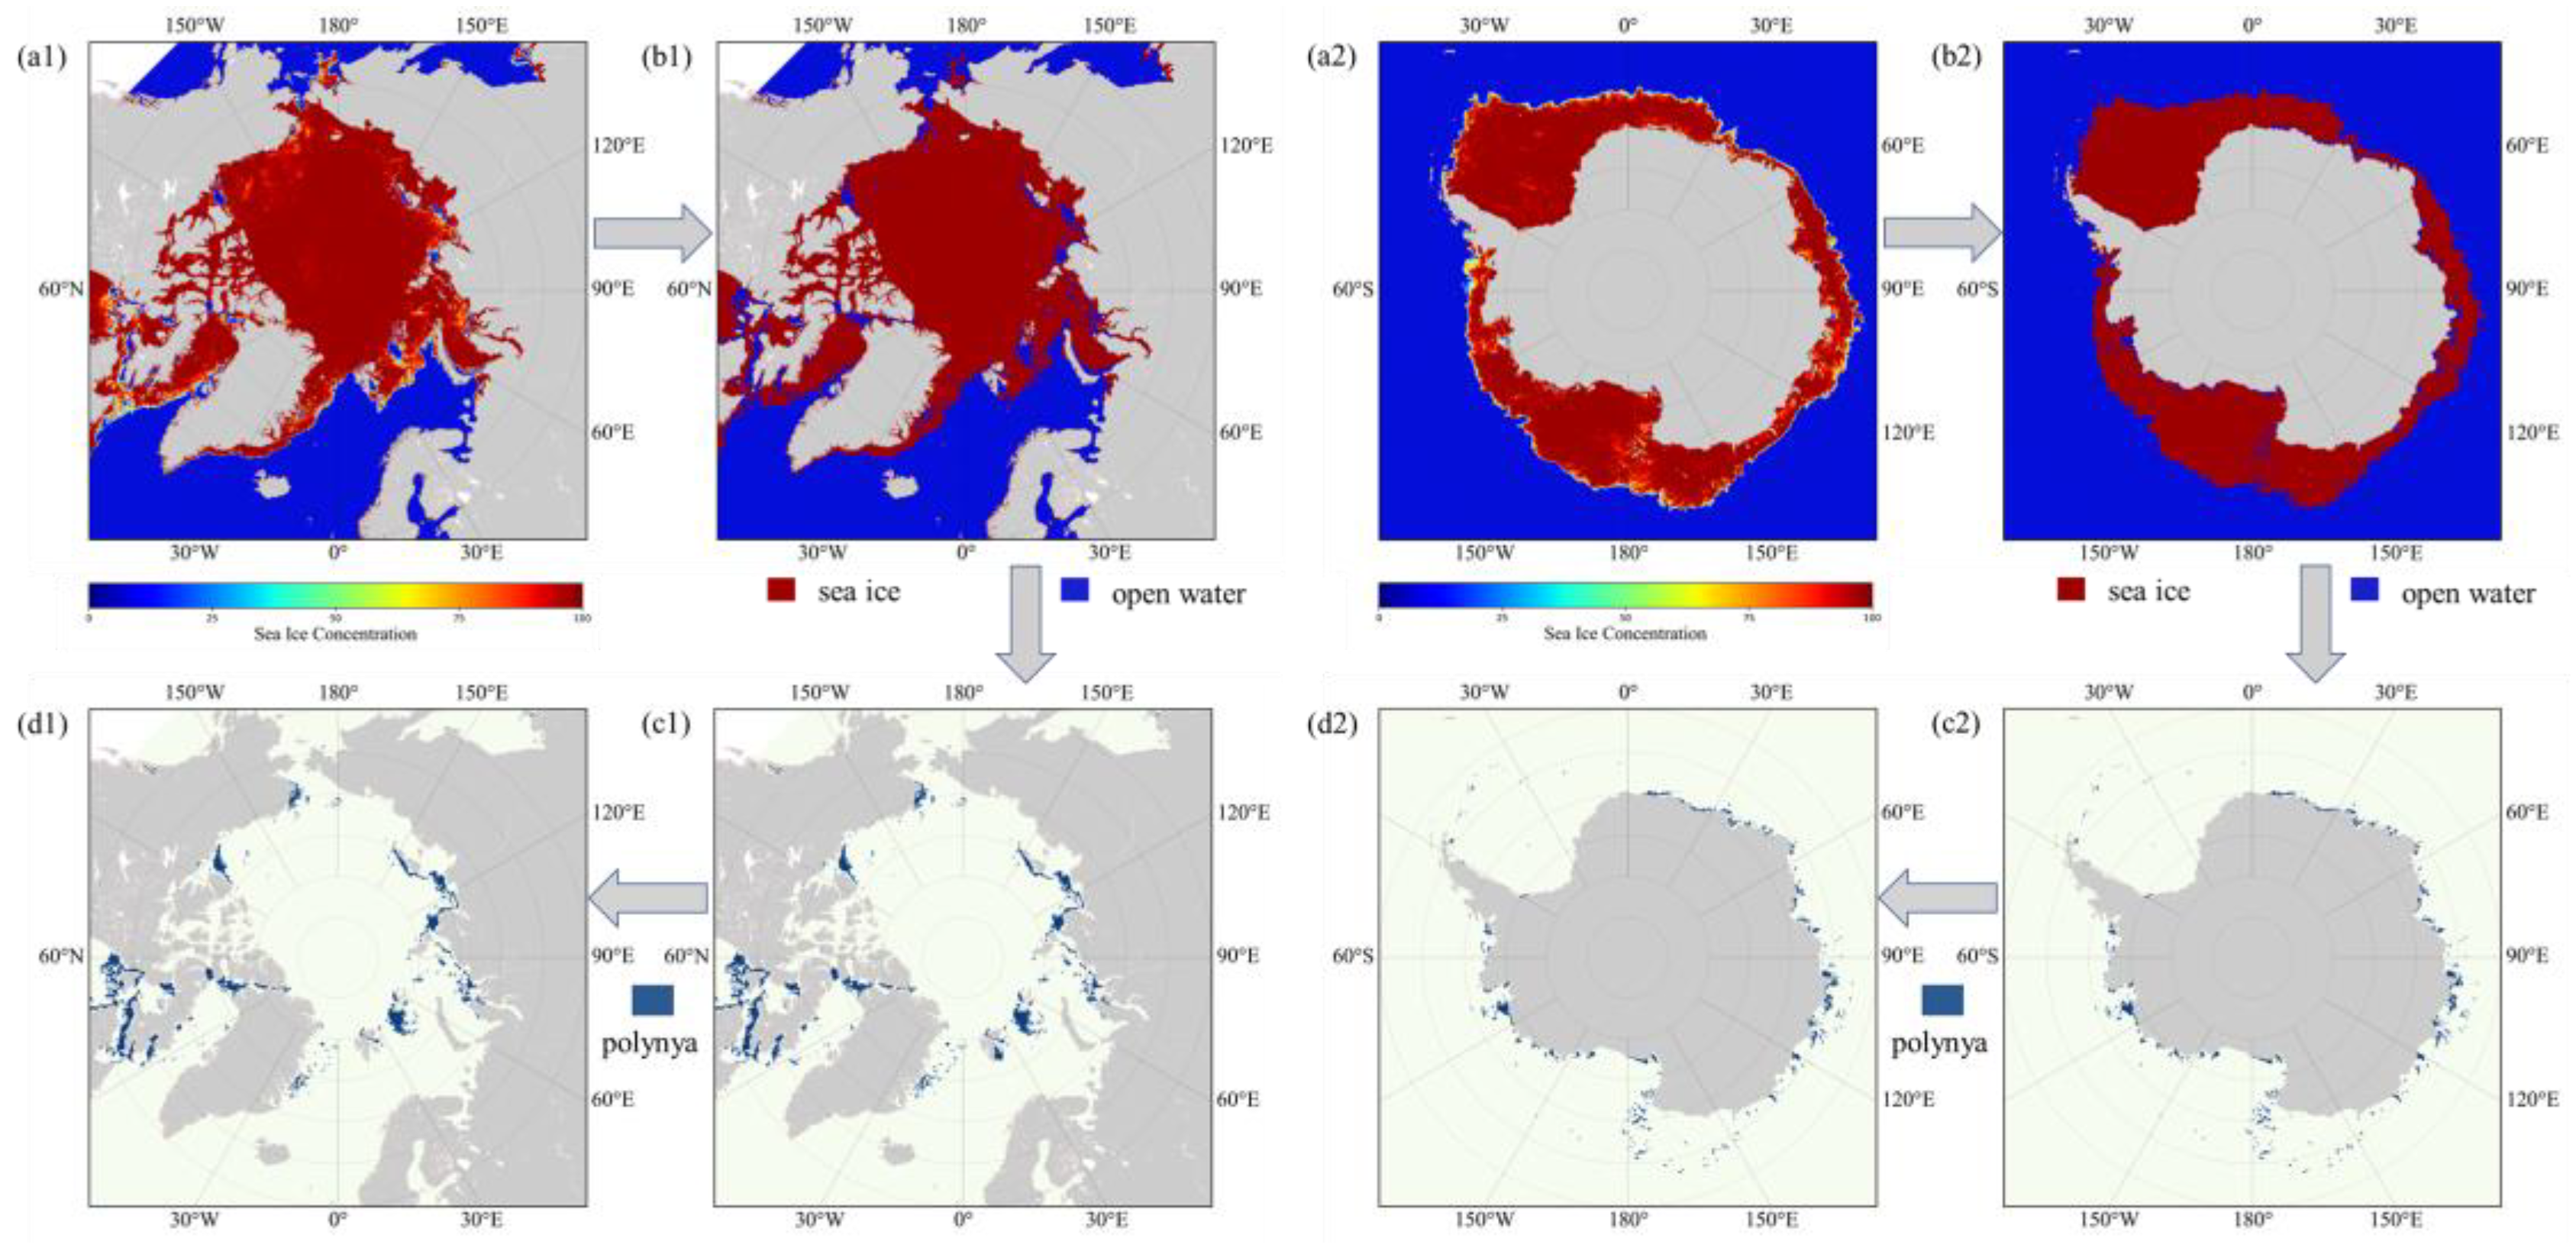
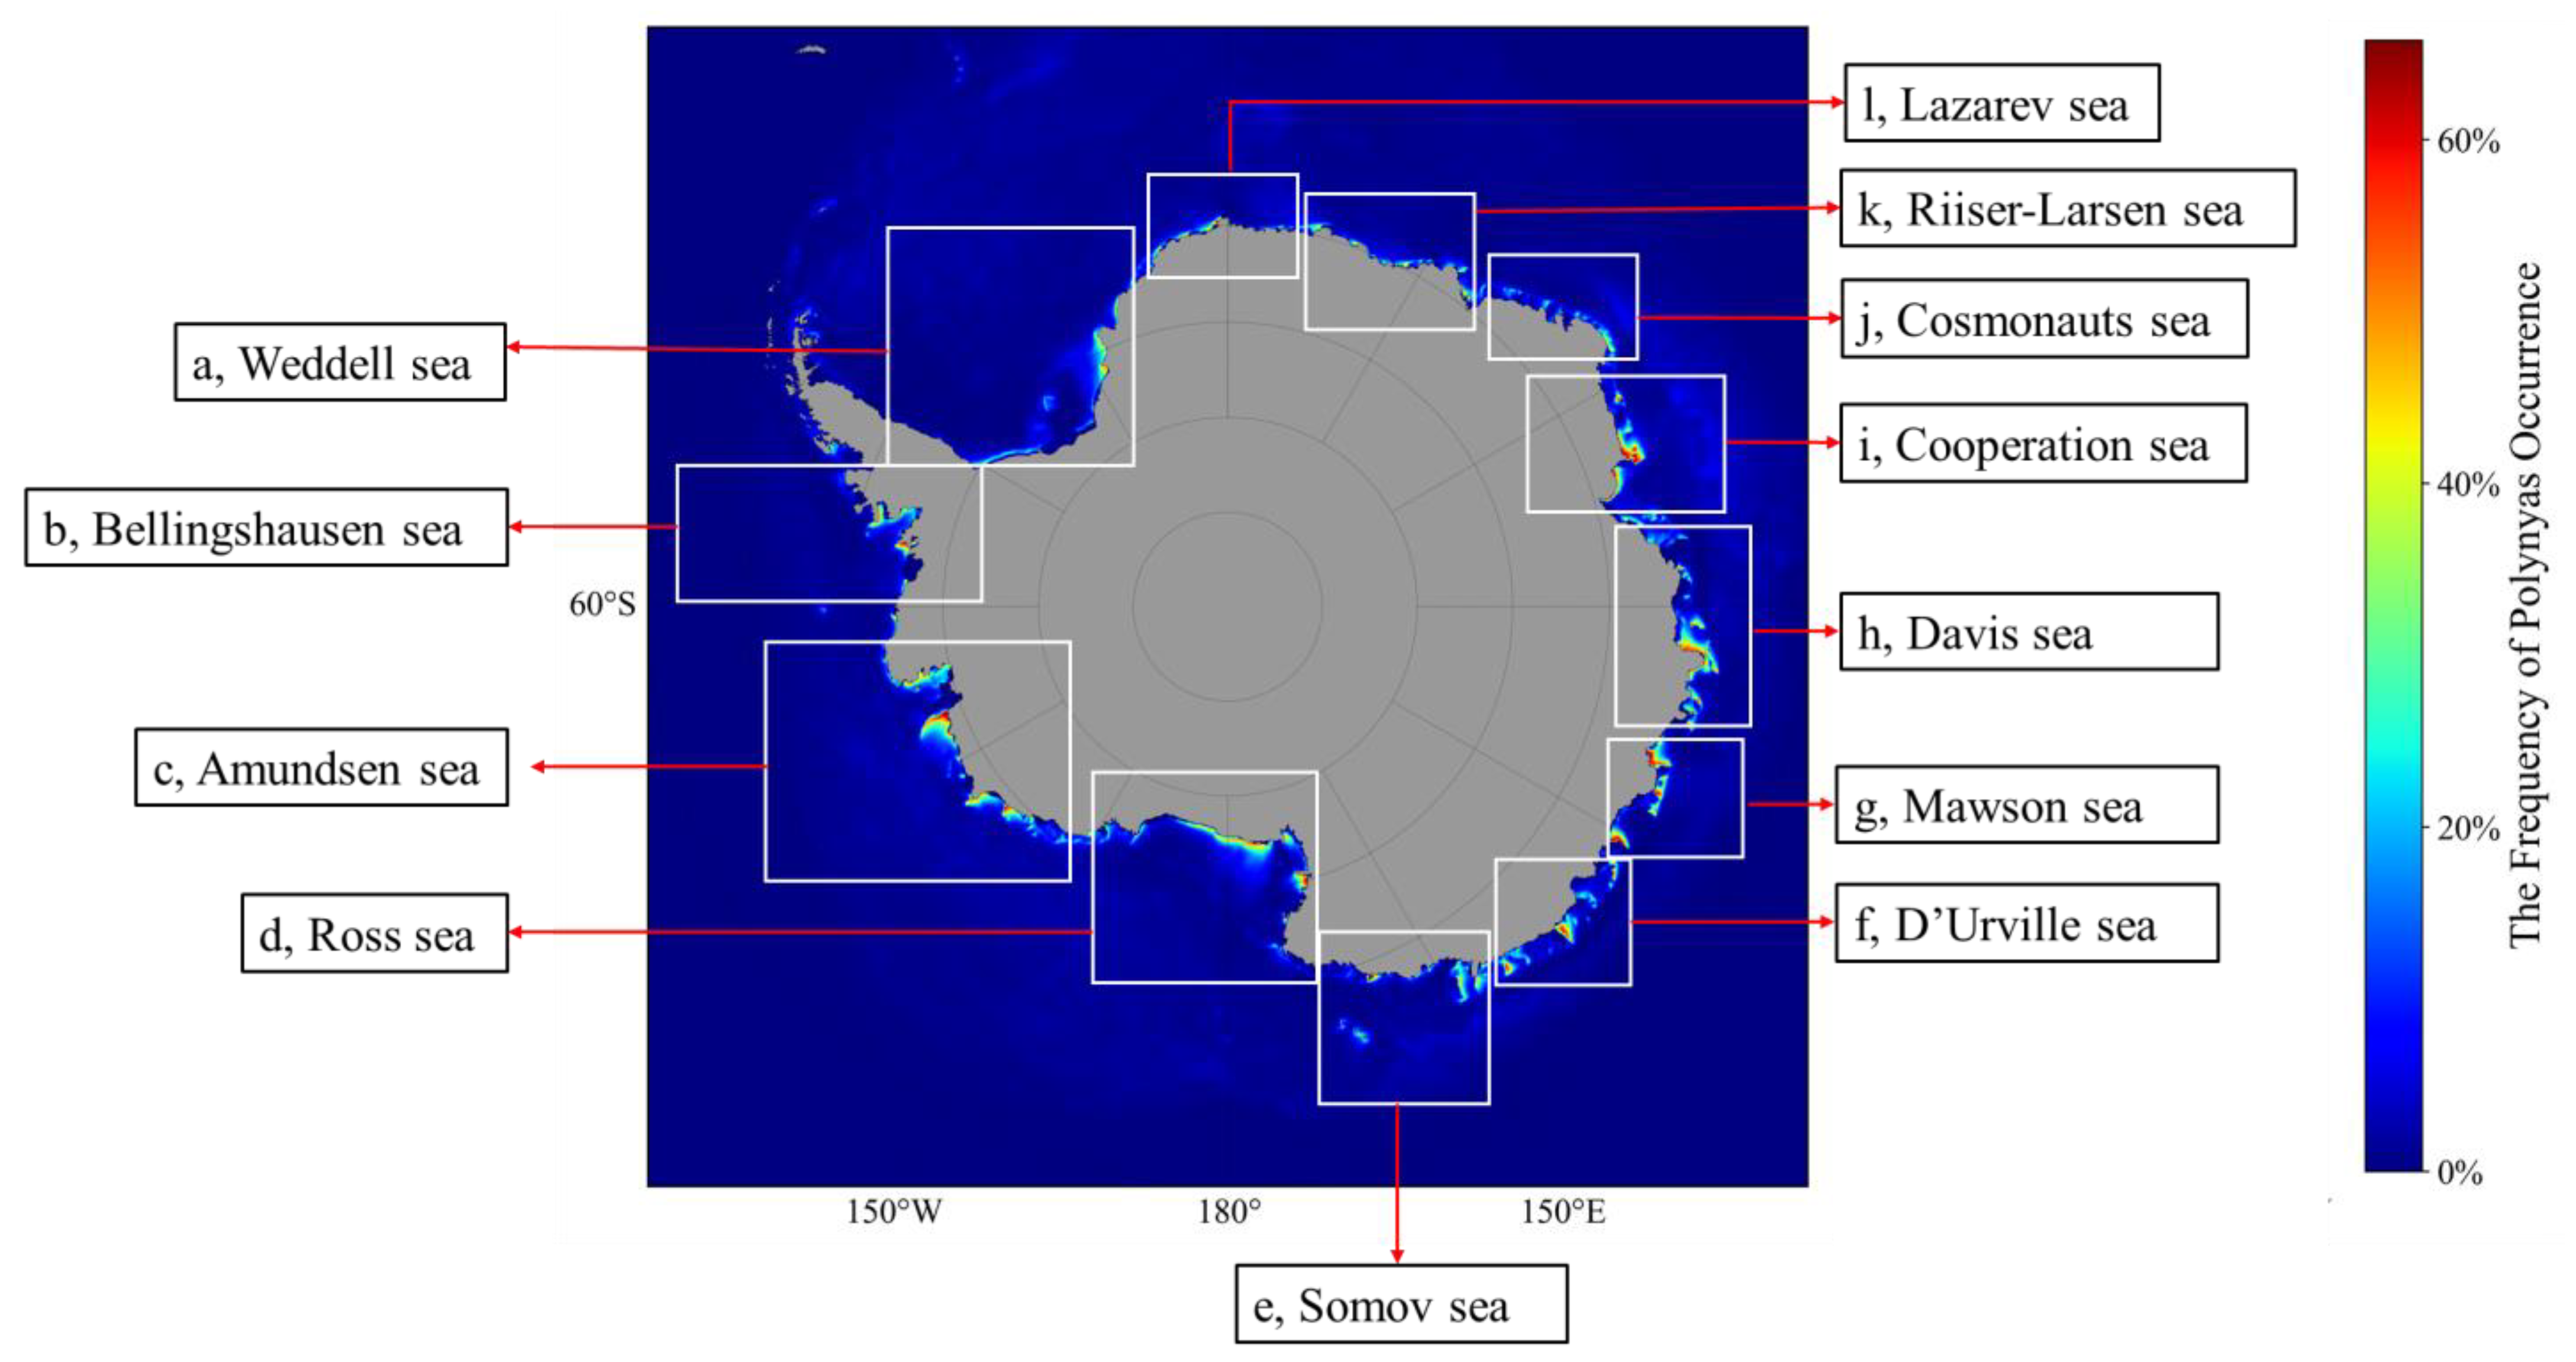
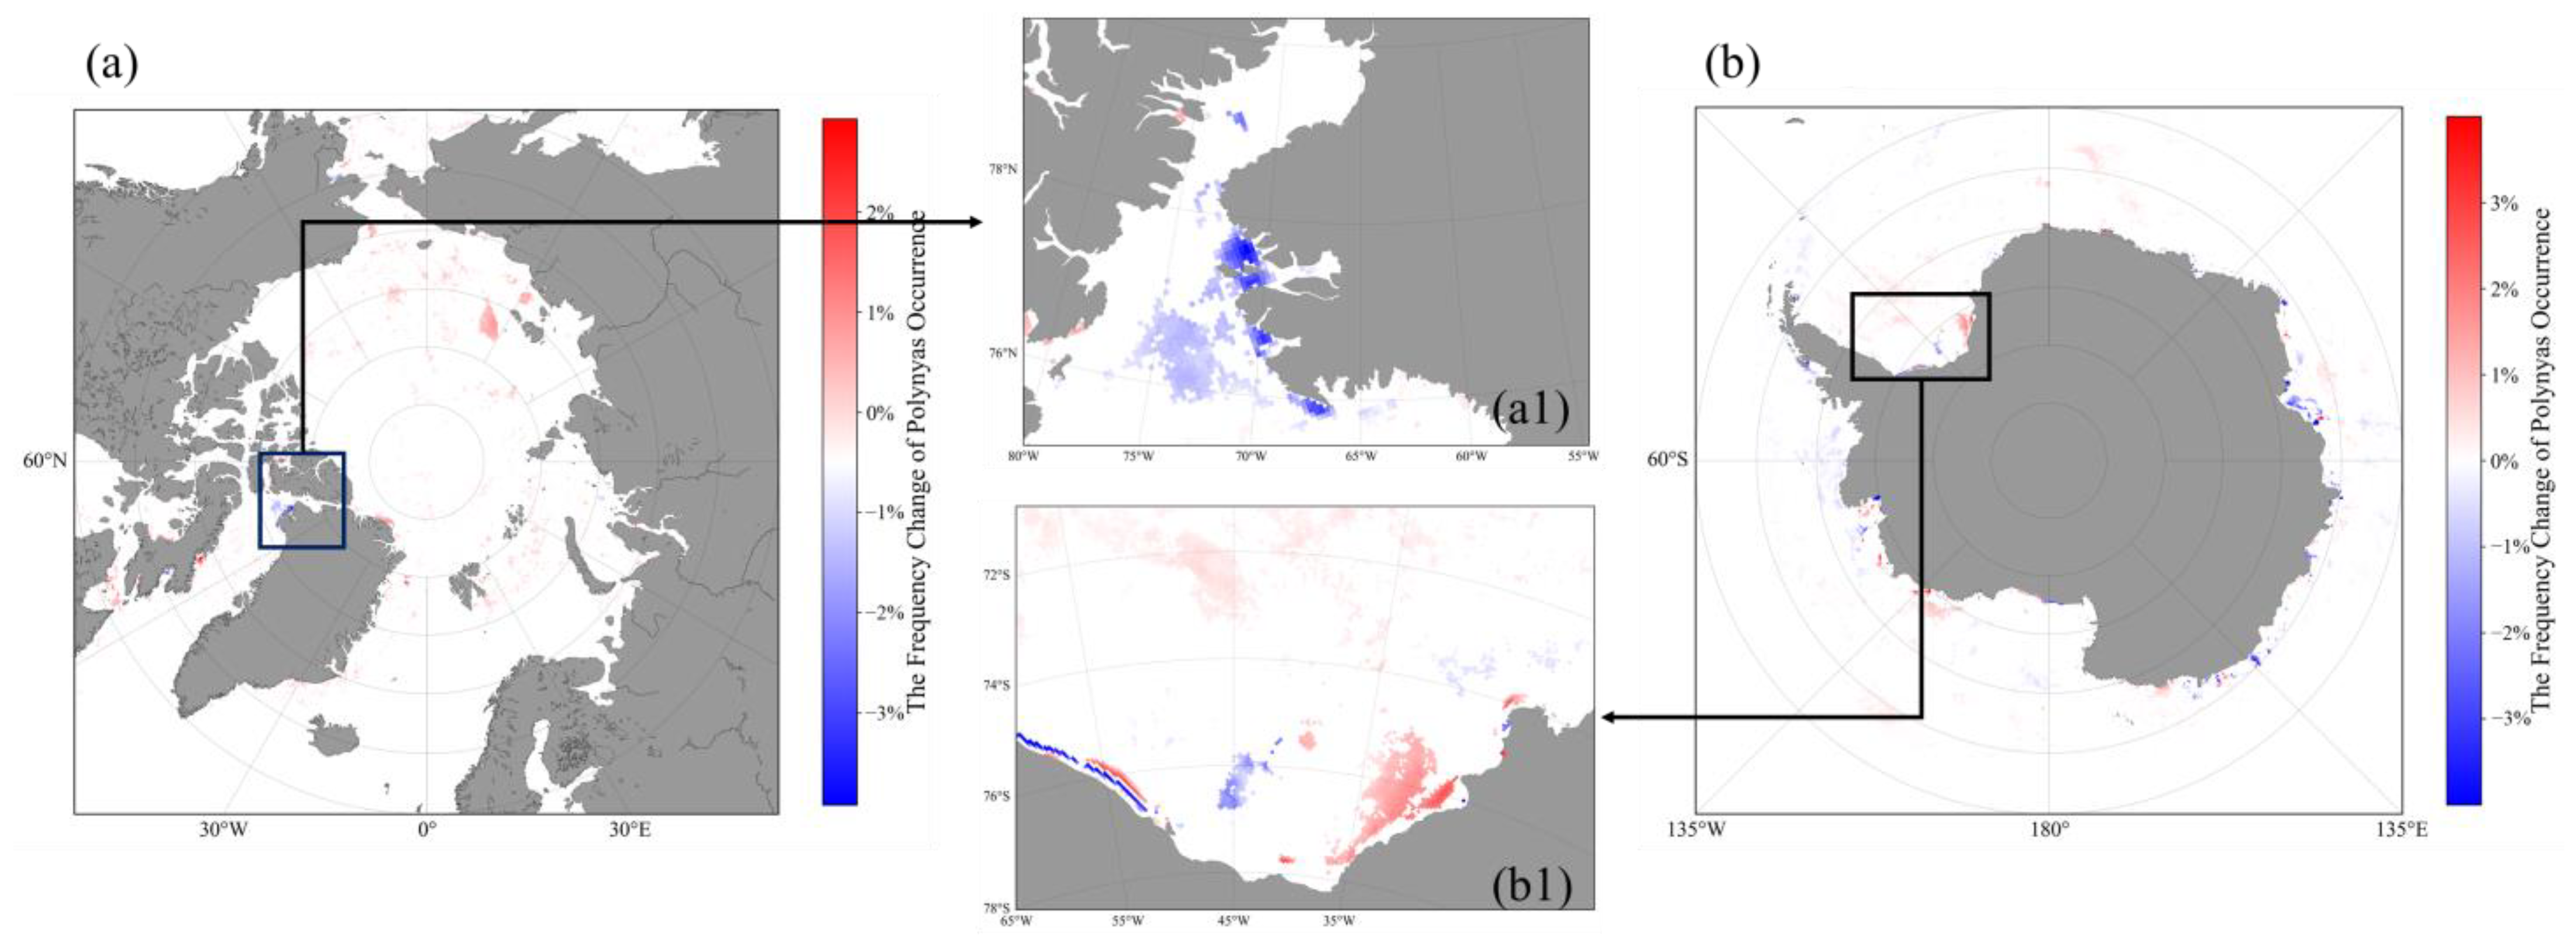
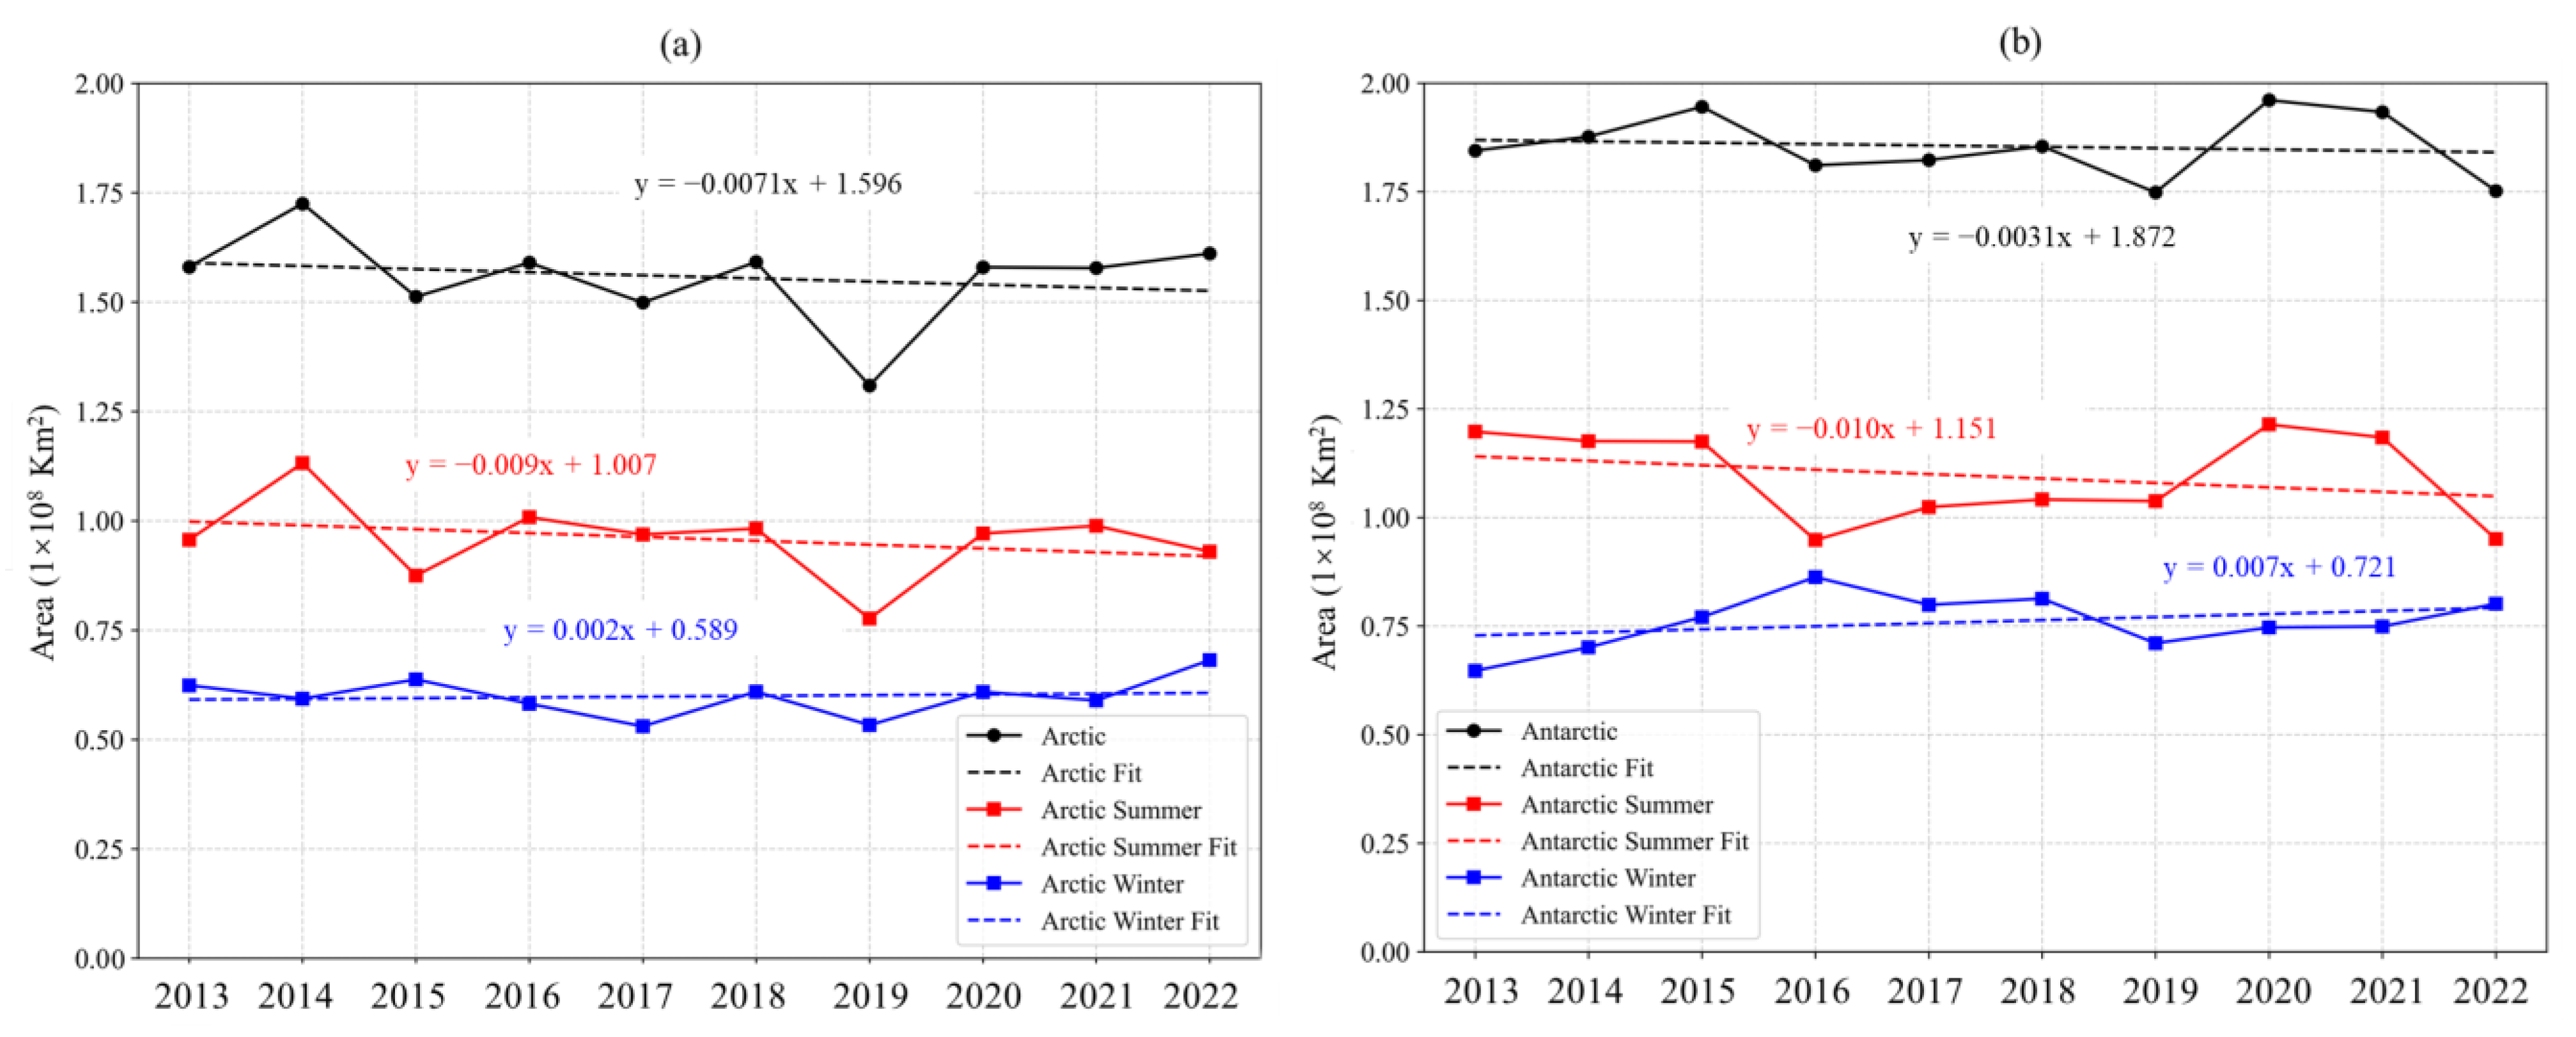
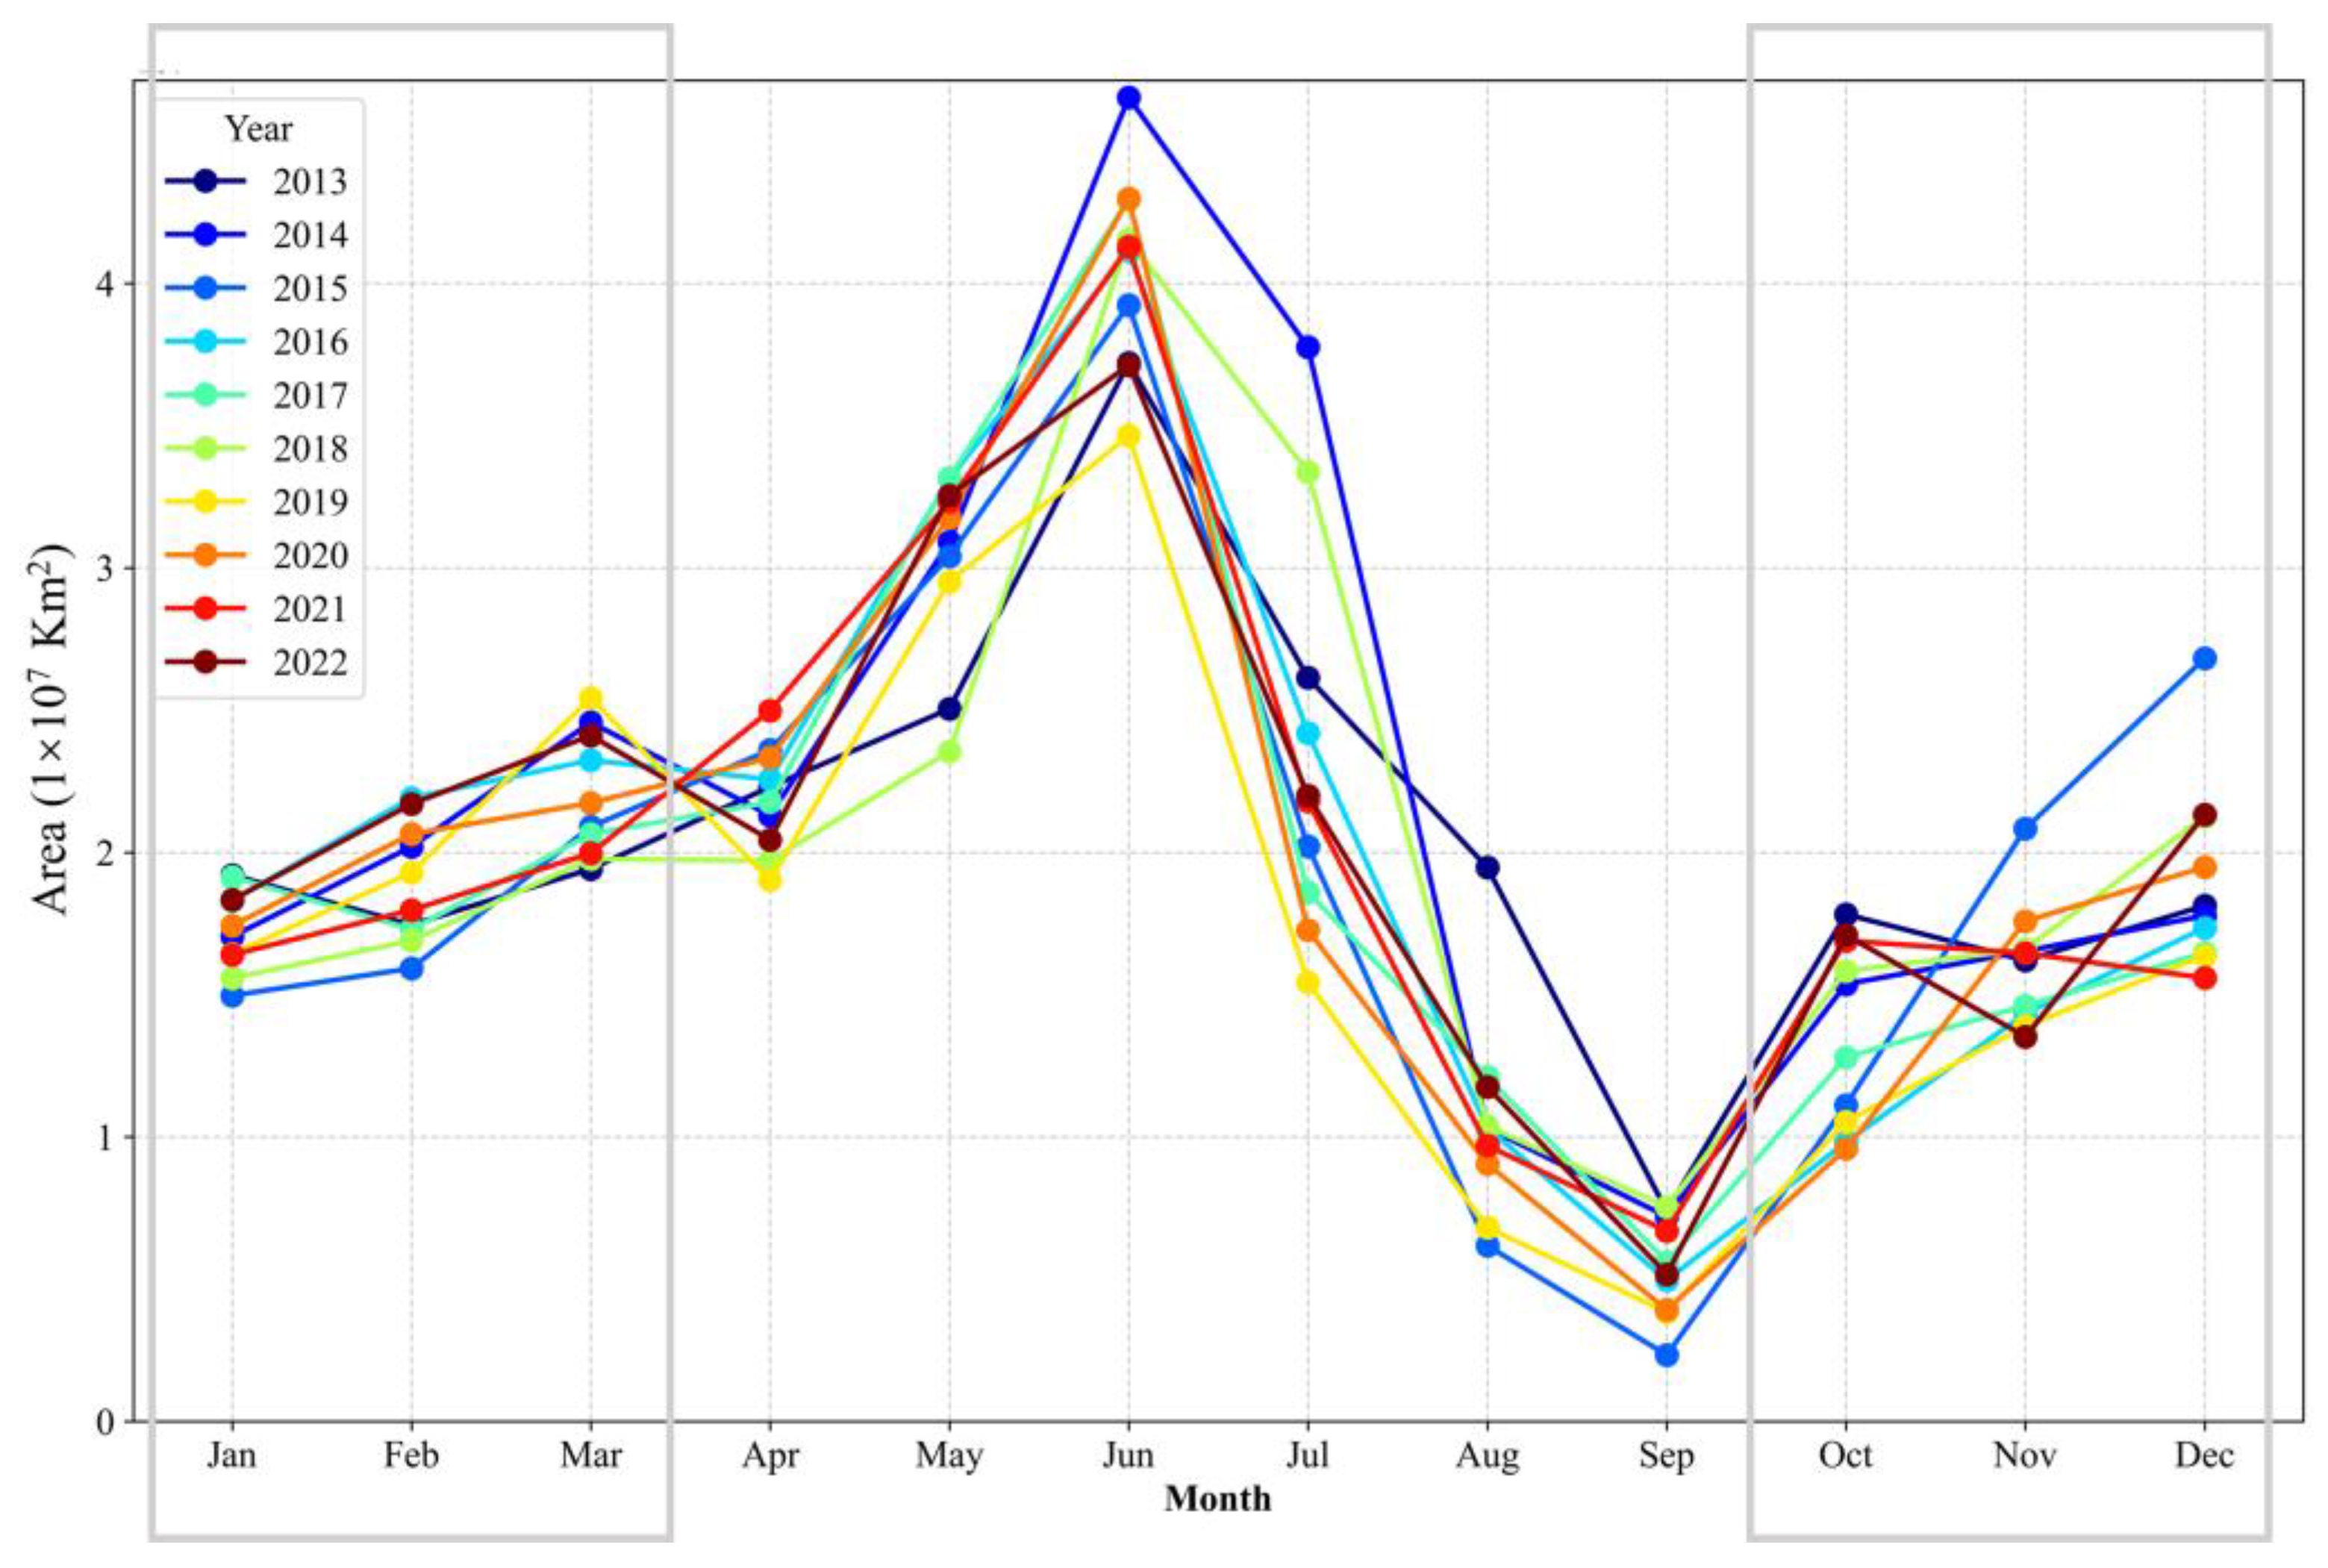
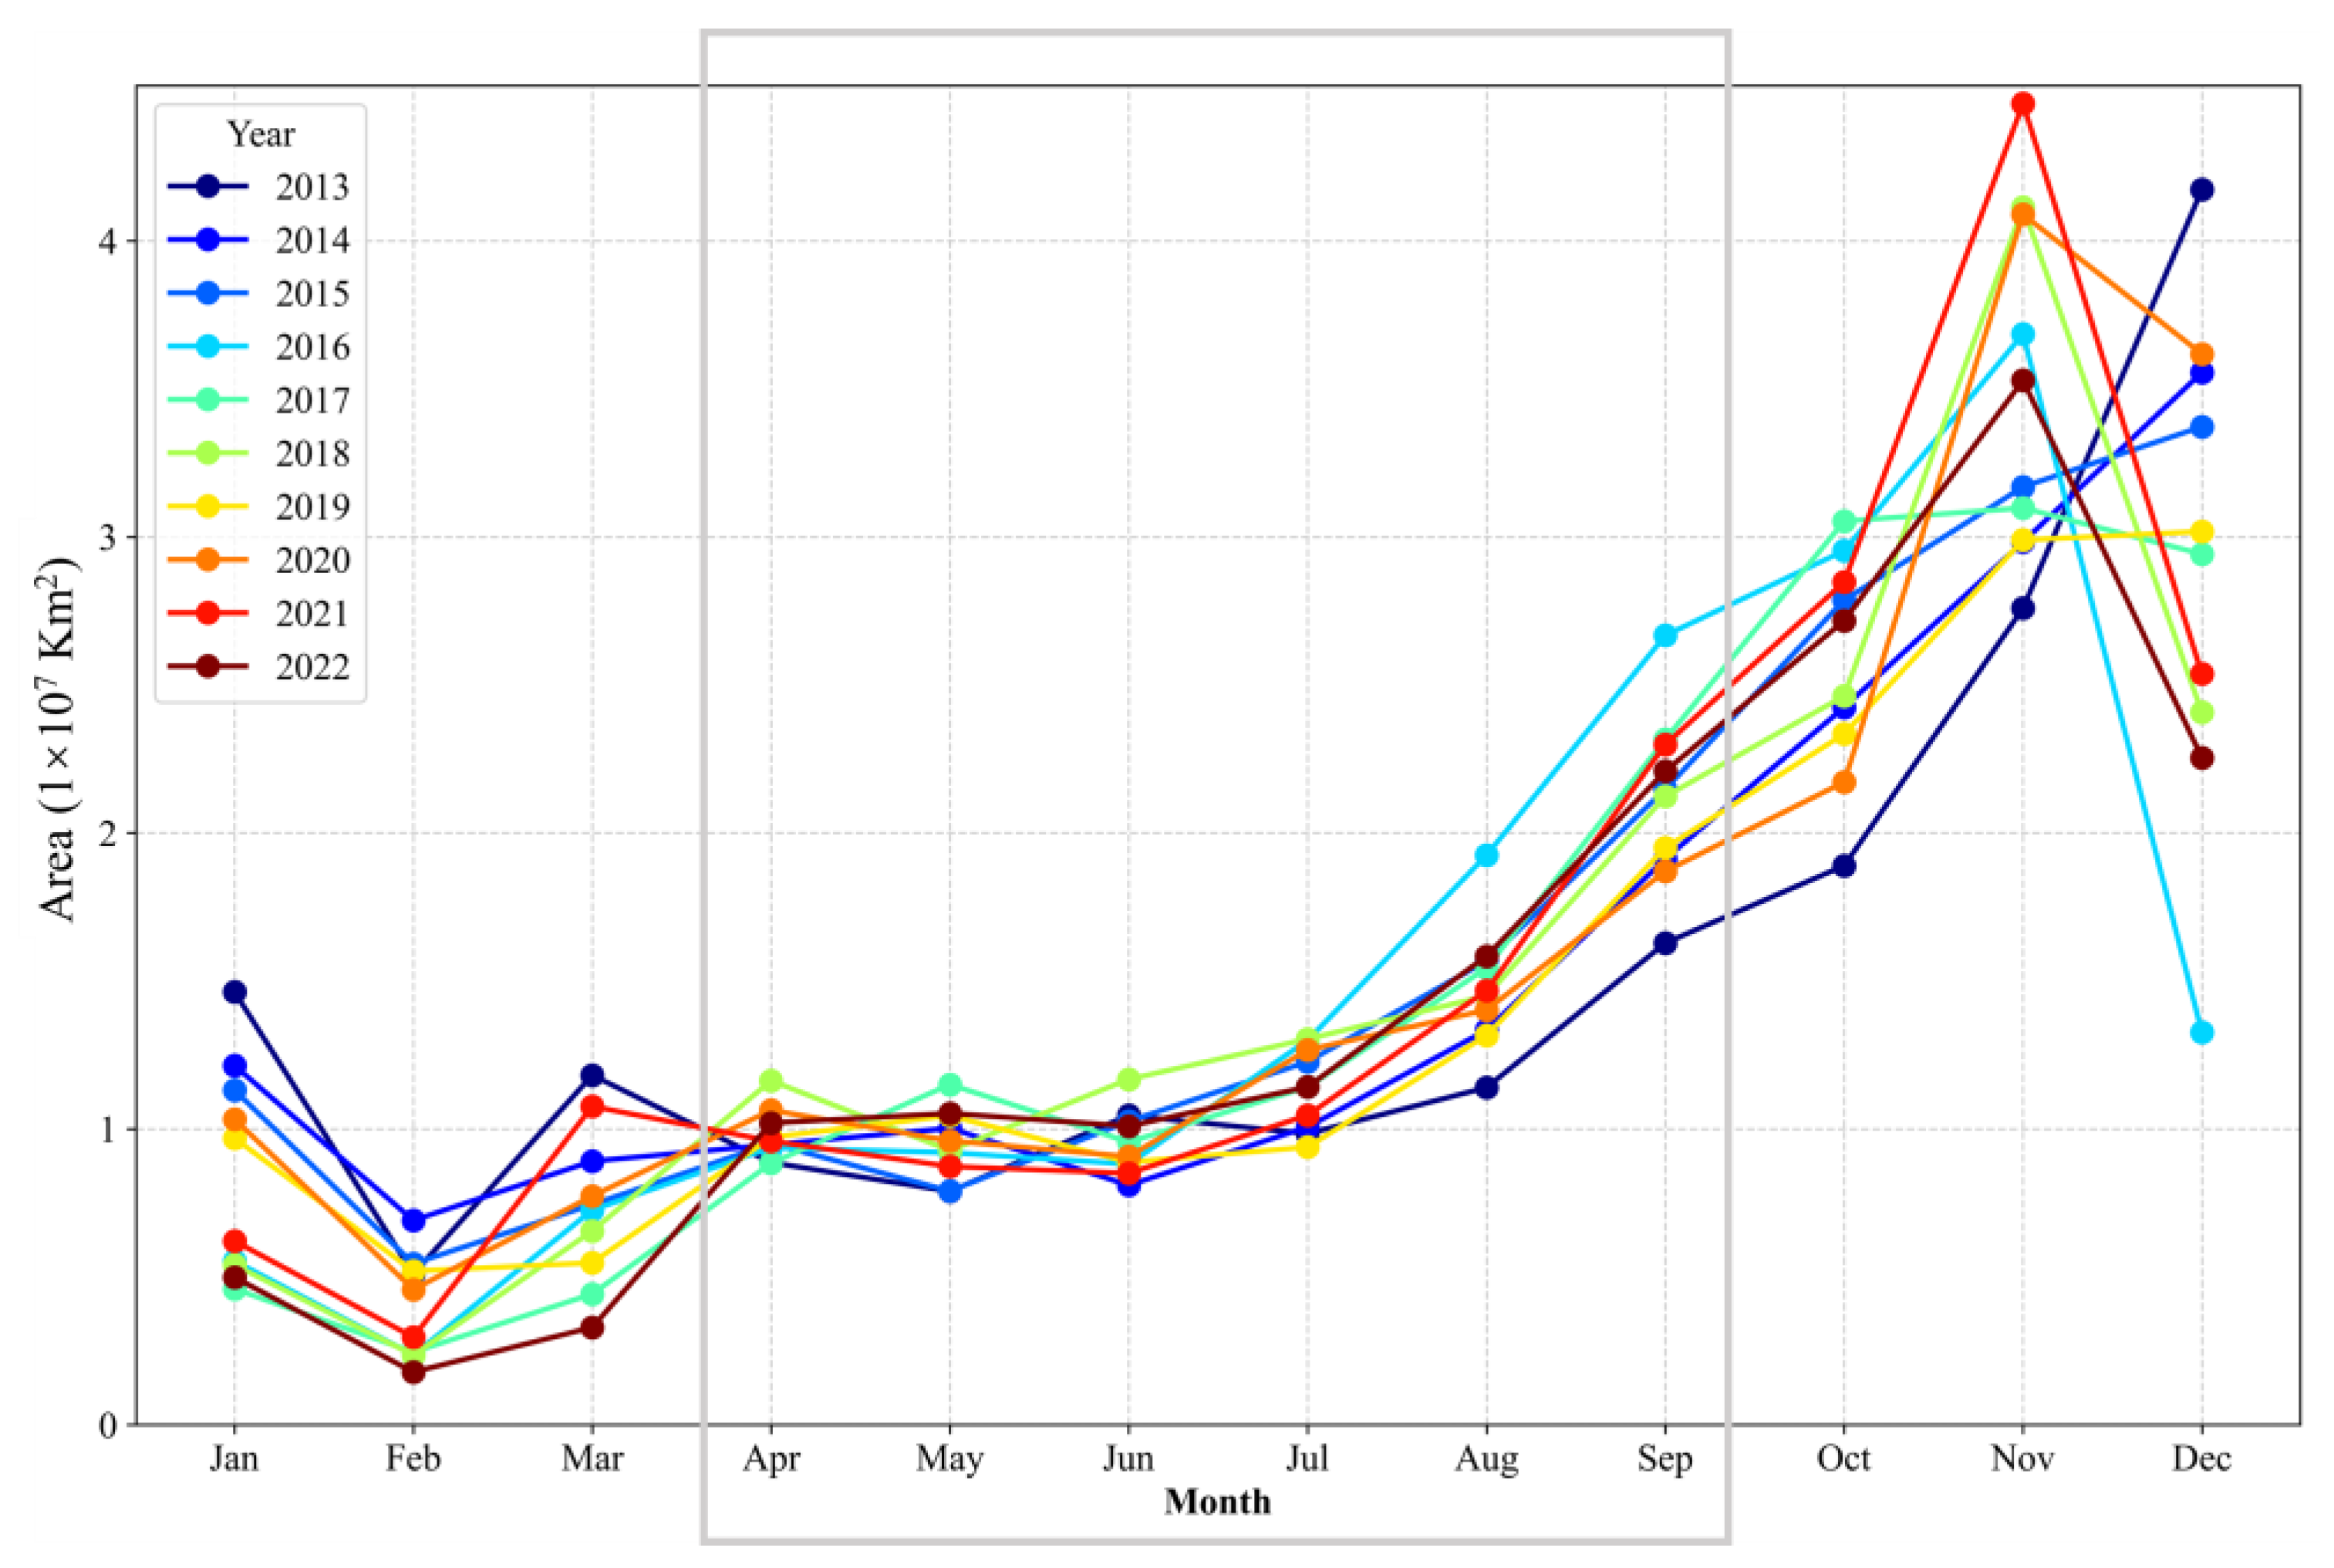
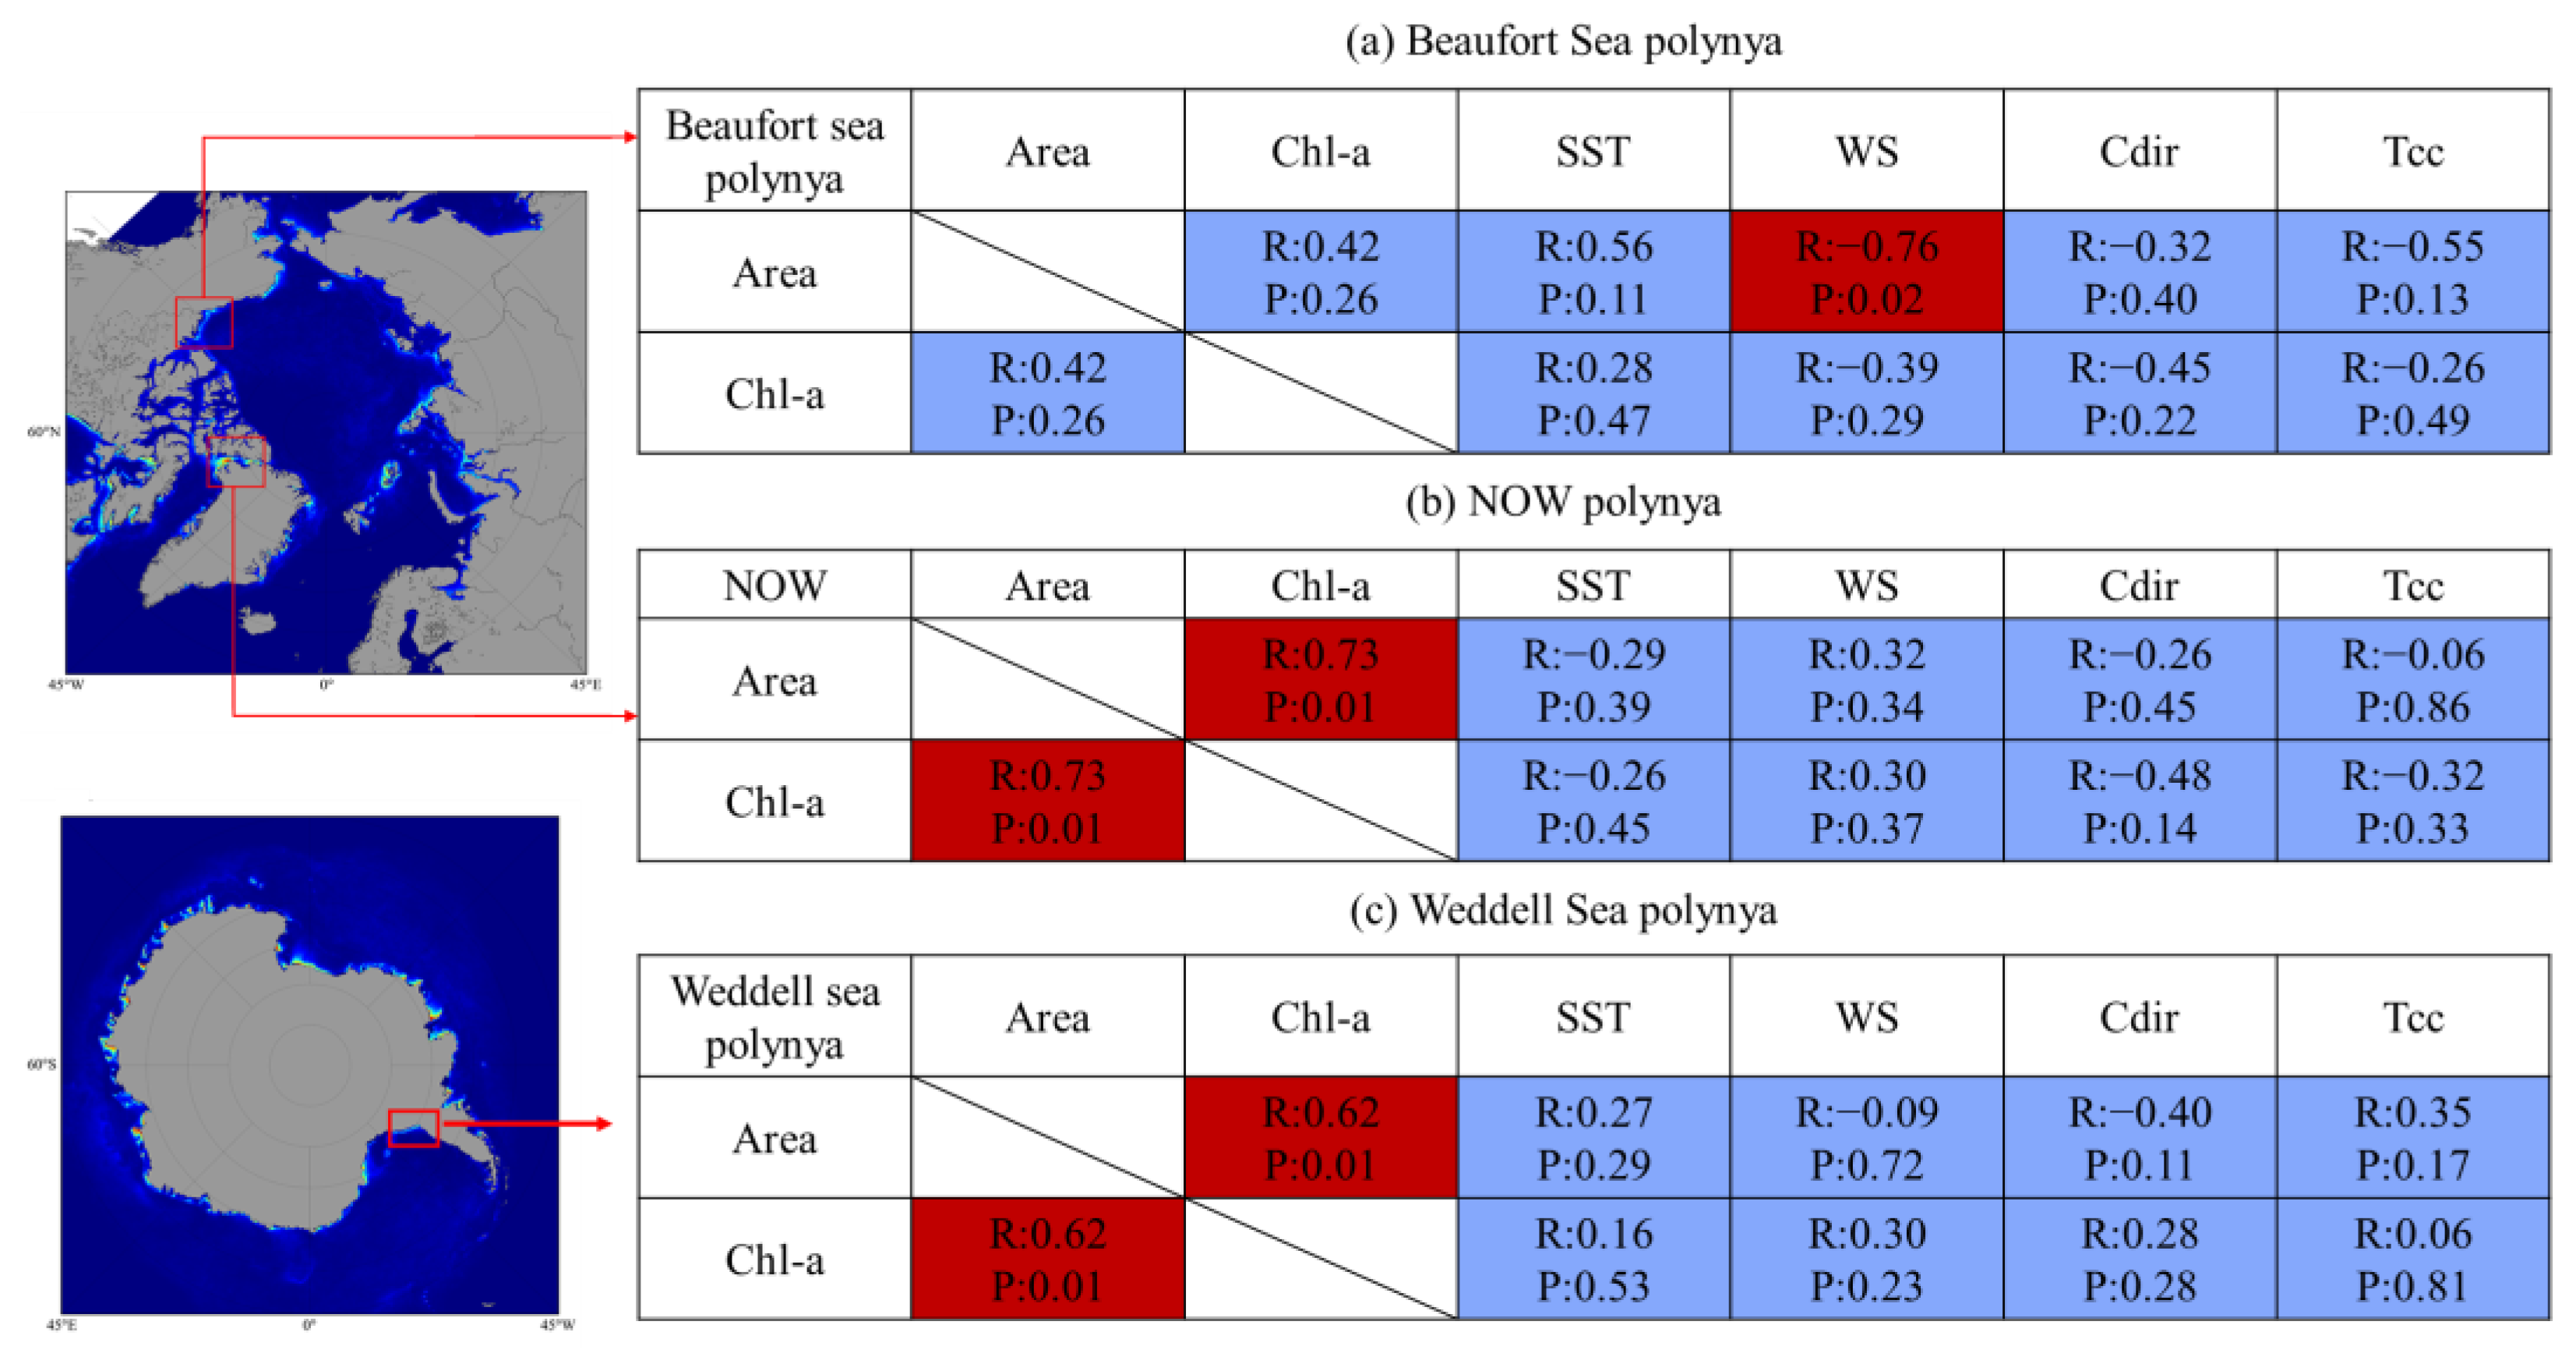
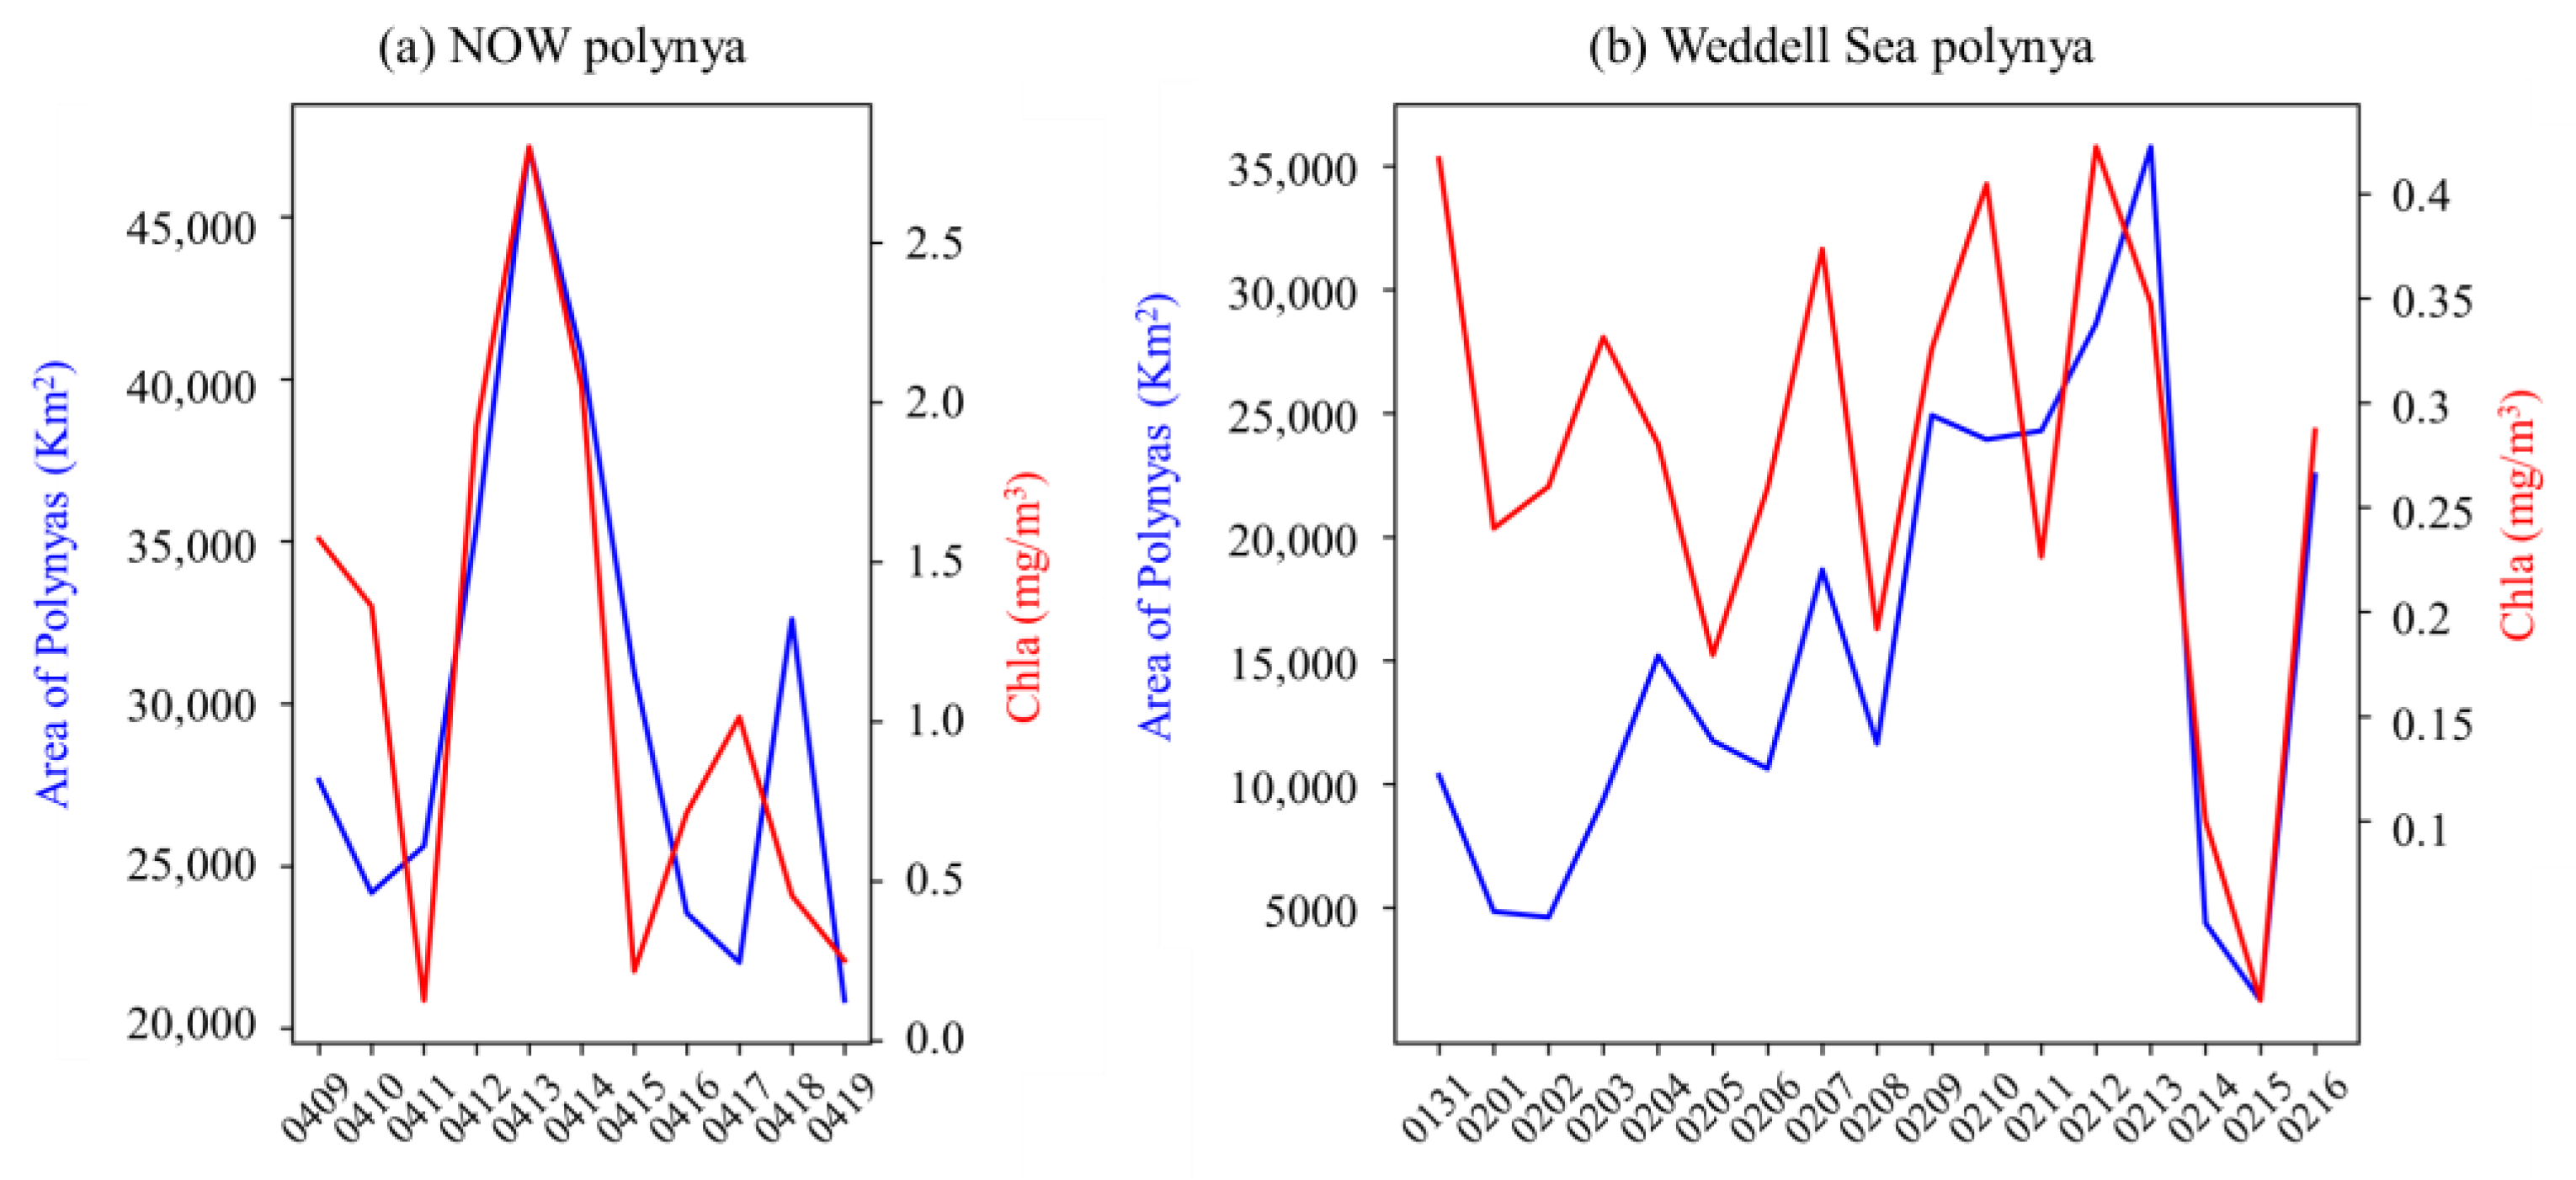
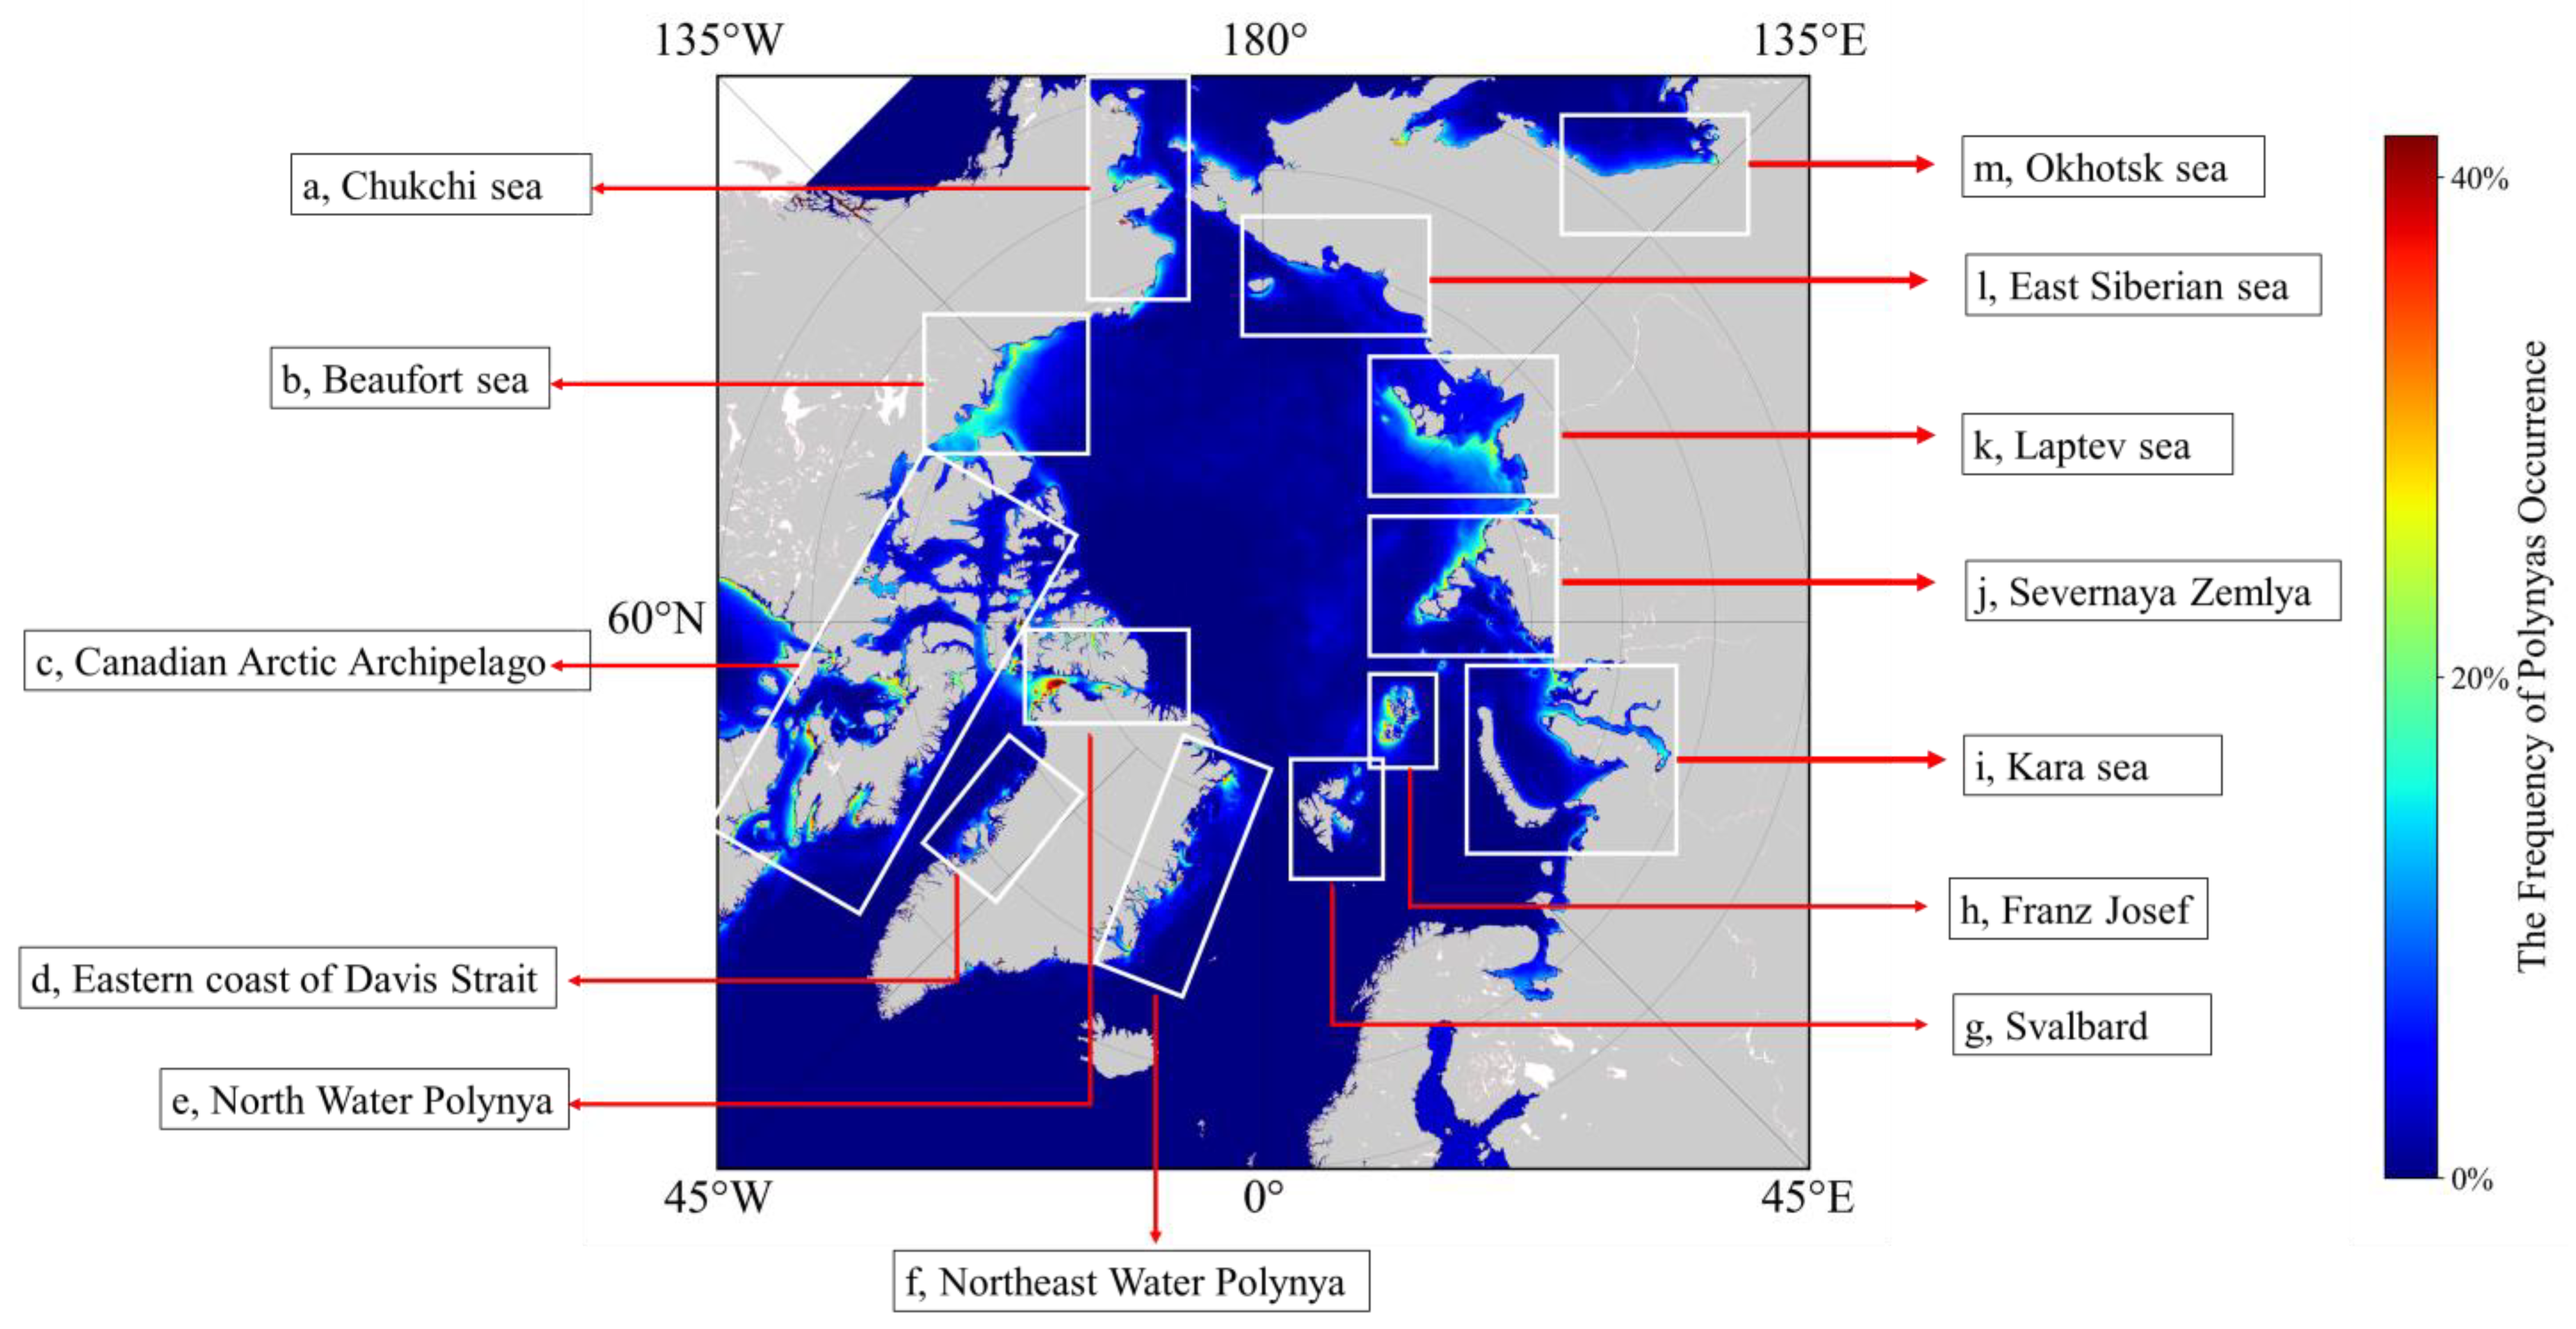
Polynyas play a crucial role in polar ecosystems, influencing biodiversity, climate regulation, and oceanic processes. This study employs Synthetic Aperture Radar (SAR) data to determine the optimal sea ice concentration threshold for polynya identification, which is established at 75%. We present a dataset of daily polynya distribution in the Arctic and Antarctic from 2013 to 2022, analyzing their spatial patterns, interannual variability, and seasonal dynamics. Our results indicate that coastal polynyas, primarily located near landmasses, dominate both polar regions. The total polynya area in the Antarctic remained relatively stable, averaging approximately 1.86 × 10⁸ km2 per year, with an interannual fluctuation of −3.1 × 10⁵ km2 per year. In the Arctic, the average polynya area is around 1.59 × 10⁸ km2 per year, with an interannual fluctuation of −7.1 × 10⁵ km2 per year. Both regions exhibit distinct seasonal cycles: Arctic polynyas peak in May and reach their minimum in September, whereas Antarctic polynyas expand in November and contract to their smallest extent in February. The polynya formation and development result from a complex interplay of multiple factors, with no single variable fully explaining variations in polynyas’ extent. Additionally, the polynya area in the NOW, and Weddell Sea polynyas, exhibit consistent trends with chlorophyll-a concentration, highlighting their role as critical habitats for primary productivity in polar regions. These findings provide key insights into polynya dynamics and their broader implications for climate and ecological processes in polar regions.
Keywords: polynyas; SAR; sea ice concentration; chlorophyll-a polynyas; SAR; sea ice concentration; chlorophyll-a