Article

Comparison of UAV-Based LiDAR and Photogrammetric Point Cloud for Individual Tree Species Classification of Urban Areas

1
College of Geography and Environment, Shandong Normal University, Jinan 250014, China
2
Jinan Environmental Research Institute, Jinan 250098, China
3
Remote Sensing and Earth Science Research Institute, Hangzhou Normal University, Hangzhou 311121, China
4
Department of Geography and the Environment, University of North Texas, Denton, TX 76203, USA
5
Shandong Provincial Institute of Land Surveying and Mapping, Jinan 250100, China
*
Author to whom correspondence should be addressed.
Remote Sens. 2025, 17(7), 1212; https://doi.org/10.3390/rs17071212
Submission received: 27 January 2025 / Revised: 19 March 2025 / Accepted: 26 March 2025 / Published: 28 March 2025

Abstract

:
UAV LiDAR and digital aerial photogrammetry (DAP) have shown great performance in forest inventory due to their advantage in three-dimensional information extraction. Many studies have compared their performance in individual tree segmentation and structural parameters extraction (e.g. tree height). However, few studies have compared their performance in tree species classification. Therefore, we have compared the performance of UAV LiDAR and DAP-based point clouds in individual tree species classification with the following steps: (1) Point cloud data processing: Denoising, smoothing, and normalization were conducted on LiDAR and DAP-based point cloud data separately. (2) Feature extraction: Spectral, structural, and texture features were extracted from the pre-processed LiDAR and DAP-based point cloud data. (3) Individual tree segmentation: The marked watershed algorithm was used to segment individual trees on canopy height models (CHM) derived from LiDAR and DAP data, respectively. (4) Pixel-based tree species classification: The random forest classifier (RF) was used to classify urban tree species with features derived from LiDAR and DAP data separately. (5) Individual tree species classification: Based on the segmented individual tree boundaries and pixel-based classification results, the majority filtering method was implemented to obtain the final individual tree species classification results. (6) Fused with hyperspectral data: LiDAR-hyperspectral and DAP-hyperspectral fused data were used to conduct individual tree species classification. (7) Accuracy assessment and comparison: The accuracy of the above results were assessed and compared. The results indicate that LiDAR outperformed DAP in individual tree segmentation (F-score 0.83 vs. 0.79), while DAP achieved higher pixel-level classification accuracy (73.83% vs. 57.32%) due to spectral-textural features. Fusion with hyperspectral data narrowed the gap, with LiDAR reaching 95.98% accuracy in individual tree classification. Our findings suggest that DAP offers a cost-effective alternative for urban forest management, balancing accuracy and operational costs.

1. Introduction

The accurate classification of tree species is essential for biodiversity monitoring and intelligent management of urban forests [1]. However, the precise classification of individual tree species in urban areas presents three challenges: (1) complex vertical structures of urban trees requiring the integration of 3D technology; (2) complex composition of urban tree species requiring high spatial resolution data; and (3) high standard requirements of urban tree species mapping requiring high accuracy and scale. However, traditional manual methods are time-consuming, labor-intensive, and difficult to update [2]. Remote sensing technology has provided a much more cost-effective method [3,4], whereas satellite remote sensing is easily affected by cloud cover, making it difficult to obtain high-quality remote sensing data with high spatial resolution. With the development of drones and remote sensing technology, we can quickly, conveniently, and cost-effectively obtain multi-sensor remote sensing data with high spatial resolution or rich three-dimensional information, which can provide new opportunities for forestry inventory investigation, biodiversity monitoring, and intelligent management of urban forests [5,6].
Among various UAV remote sensing technologies, UAV-LiDAR has gained widespread application in individual tree segmentation and parameter extraction owing to its exceptional capacity to provide precise three-dimensional structural information. Chen et al. [7] demonstrated the effectiveness of leaf-off and leaf-on UAV-LiDAR data in segmenting individual deciduous trees and estimating tree height in dense deciduous forests. However, regarding tree species classification, LiDAR-based studies have primarily focused on areas with limited species diversity due to insufficient spectral information [8,9,10,11,12]. To address the challenge of accurately classifying multiple tree species simultaneously, multimodal data fusion has emerged as a promising solution. Substantial evidence from previous studies confirms that combining spectral and structural information significantly enhances tree species classification accuracy [13,14,15,16]. For instance, Wang et al. [17] achieved 71.00% overall accuracy in classifying five tree species through the fusion of UAV-LiDAR and hyperspectral data in a forest plantation. Although LiDAR demonstrates superior performance in both individual tree delineation and multi-sensor fusion applications, its high operational costs continue to impede large-scale implementation [18]. This limitation underscores the critical need for developing more cost-effective alternative methodologies.
The advancement of remote sensing technology has positioned UAV-based photogrammetry as a cost-effective alternative, particularly due to its dual capacity to capture spectral information and generate 3D point clouds through structure from motion (SFM) and multi-view stereo (MVS) processing of high-resolution RGB imagery [19,20]. This technique has demonstrated significant utility in individual tree segmentation [21], structural parameter extraction, and tree species classification [7]. For instance, Nevalainen et al. [19] processed high resolution photogrammetry images into point cloud data using an image matching algorithm and then segmented the individual trees with accuracy from 40% to 95%. Similarly, Fawcett et al. [20] reported 98.20% accuracy in oil palm height estimation using SFM-derived point clouds, while Karpina et al. [22] attained an average vertical accuracy of 5 cm for Scots pine height measurements in plantation settings. These successes underscore the efficiency of UAV-based photogrammetry in homogeneous environments with limited species diversity. However, its application to urban tree species classification remains unexplored, particularly in areas with high species heterogeneity.
The integration of UAV-based photogrammetry with hyperspectral sensors has emerged as a promising approach for improving tree species classification accuracy. Xu et al. [23] fused multi-spectral images and UAV-DAP point cloud data to classify eight natural tree species in subtropical areas. The results have indicated that the fused features of spectral, texture, and point cloud with advanced multi-resolution segmentation methods are the best. Nevalainen et al. [19] also fused UAV-DAP point cloud data and hyperspectral data to classify four tree species using three machine learning methods. Sothe et al. [24,25] classified 12 tree species in subtropical forest with fused hyperspectral and UAV-based photogrammetry. Tuominen et al. [26] have even classified 26 tree species with fused UAV-DAP and hyperspectral data. All the above studies have proved the effectiveness of fused spectral and structural information in tree species classification. Compared with UAV-based LiDAR, UAV-based photogrammetry demonstrates superior cost-effectiveness and operational practicality. However, the performance difference between the two in forest applications is not yet clear. Therefore, it is necessary to further explore the performance differences between the two.
Recently, several studies have systematically evaluated their performance in individual tree segmentation, structure parameters extraction [27] and tree species classification [28,29,30,31,32]. In individual tree segmentation, Iqbal et al. [33] demonstrated comparable accuracy between photogrammetric point clouds and Airborne Laser Scanning (ALS) in pine plantations. Liu et al. [31] revealed superior performance of UAV-LiDAR over UAV-based photogrammetry across three segmentation methods, and the maximum difference is 0.13 in F value. Regarding structural parameter extraction, tree height estimation dominates current research [34,35,36]. Guerra-Hernández et al. [6] have extracted the average tree height of a eucalyptus plantation with UAV LiDAR and UAV-DAP point clouds data, and the RMSEs of them are 2.80 m and 2.84 m, respectively. So have Wallace et al. [37], the RMSEs of which are 0.92 m and 1.30 m, respectively. Mielcarek et al. [38] also estimated tree height with the canopy height model (CHM) derived from DAP and ALS data, and the results have underestimated the tree height by 1.26 m and 0.88 m, respectively. Besides tree height estimation, Moe et al. [39] also extracted tree location and diameter at breast height (DBH) by UAV-DAP and LiDAR data in northern Japanese mixed-wood forest. The results have confirmed that UAV-based photogrammetry can be comparable to LiDAR data. Guerra-Hernández et al. [40] estimated tree volume at a eucalyptus plantation using LiDAR and DAP data, the RMSEs of which were 0.026 m3 and 0.030 m3, respectively. You et al. [30] compared the performance of UAV LiDAR and high-resolution RGB images in extracting individual tree structural parameters for different tree species. The results show that the performance of UAV-based LiDAR and UAV-based photogrammetry data are almost the same in the extraction of individual tree crown width and height when all tree species are considered. Although existing research has systematically investigated the comparative efficacy of UAV-based LiDAR and UAV-based photogrammetry data in individual tree segmentation and structural parameter extraction, few studies have explored their performance comparison in individual tree species classification of urban areas with high spatial heterogeneity and diverse tree species, and their performance comparison in individual tree species classification fused with UAV hyperspectral data. It is necessary to establish a quantitative comparison framework between LiDAR and Digital Aerial Photogrammetry (DAP) to provide an economical technical solution for urban forests.
To address these limitations, this study plans to (1) compare the performance of UAV-DAP and UAV-based LiDAR data in individual tree segmentation, (2) compare the performance of DAP and LiDAR data in pixel-based and individual-based tree species classification, and (3) compare the improvement of UAV-DAP and UAV-based LiDAR data in individual tree species classification when they were fused with UAV hyperspectral data. The remainder of this paper is organized as follows: Section 2 describes the study area and data source; Section 3 describes the methodology; Section 4 presents the results and discussion; and Section 5 draws the conclusions.

2. Study Area and Data Source

2.1. Study Area

The study area is located in the Changqing Campus of Shandong Normal University, Jinan, China. And the 15 dominant tree species of the study area were shown in Table 1.

2.2. Data Source

2.2.1. UAV LiDAR Data

UAV LiDAR data were acquired on 26 May 2023, using an SZT-R250 mounted on a DJI 600 Pro six-rotor aircraft. The SRT-R250 LiDAR system is equipped with an inertial navigation system, GNSS antenna, and laser scanner, which can obtain real-time position information of point clouds, and the average point density of LiDAR points cloud is 140/m2. In order to better utilize the LiDAR data, the following processing is conducted. Firstly, point cloud denoising was conducted on the raw point cloud data to remove noise points. Secondly, the Improved Progressive TIN Densification algorithm in LiDAR 360 5.2.2.0 software was used to separate ground points from non-ground points. Thirdly, the ground point and the surface point cloud data were interpolated into a Digital Elevation Model (DEM) and Digital Surface Model (DSM), respectively. Finally, the normalized Digital Surface Model (nDSM) was generated by subtracting DEM from DSM. According to the pre-processed point cloud data, the corresponding intensity and height features were also extracted using LiDAR 360 software. And the spatial resolution of them is the same which was 0.1 m.

2.2.2. UAV-Based Photogrammetry Data

The UAV high-resolution RGB stereo images were acquired on 3 July 2023. A 12-megapixel Hasselblad camera equipped with a DJI Mavic 2 was used to capture RGB imagery. Besides that, a high-precision GPS system was also equipped, which could record the exact position during the flight. To ensure the quality of the data, the flight altitude was set to 100 m, while the longitudinal overlap and the side overlap were both set to 80%. This overlap setting can provide strong support for subsequent 3D reconstruction and data analysis.
Firstly, Pix4D Mapper 4.4.12 software was used to check the original aerial images and remove images with poor quality. Secondly, the Structure from Motion (SfM) algorithm was used to find feature points in the overlapping regions of the raw pictures. Thirdly, the position and orientation of the camera were determined utilizing this information. Ultimately, an ortho-mosaic image and DAP point clouds were generated, and the spatial resolution and point cloud density of them were 0.1 m and 144.32 pts/m2, respectively. Based on the ortho-mosaic image, vegetation indexes (Table 2) and texture features were derived. Here, texture features were generated by conducting a Gray-Level Co-occurrence Matrix. To do this, RGB imagery was conducted on HSV transformation first. Then, the generated hue, saturation, and value of HSV transformation were used to generate GLCM. The generated GLCM features include Mean, Variance, Homogeneity, Contrast, Dissimilarity, Entropy, Second Moment, and Correlation. Among the derived GLCM parameters, the Mean, Contrast, Entropy, and Correlation derived from Saturation were chosen to display the difference in GLCM (Figure 1). Based on DAP point cloud data, the LiDAR 360 software was used to denoise and normalize the point cloud. Finally, based on the processed point cloud data, height features were also extracted [41]. The UAV-based LiDAR and UAV-based photogrammetry are shown in Figure 2.

2.2.3. UAV Hyperspectral Data

UAV hyperspectral data were acquired on 21 August 2023, by a Pika-L sensor mounted on a DJI 600 Pro six-rotor aircraft. The flying height was set to 100 m, and the weather was sunny and cloudless. To reduce the effect of shadows, 10:00~14:00 was selected to implement the flight plan. The UAV hyperspectral data consisted of 123 spectral channels ranging from 406~924 nm, with a channel width of 4 nm. The spatial resolution of hyperspectral images was also resampled to 0.1 m. Then, geometric correction on the high-resolution RGB imagery, LiDAR data, and hyperspectral data was conducted, and then atmospheric correction and nine vegetation indexes were conducted and extracted from UAV hyperspectral data, respectively (Table 3).

2.2.4. Field Data

In this study, plant ecologists used an RTK-GPS to conduct fieldwork in July 2023 to acquire the following information: geographic coordinates and tree species of individual trees. Then, the training and validation samples for the tree species classification were determined based on the field datasets. Regions of interest in circles were chosen randomly in each tree species crowns as samples. Samples were divided into train and validation samples with a ratio of 8:2. The training and validation samples were non-overlapped and distributed randomly in the whole study area. Based on the samples, the height of urban trees was summarized (Figure 3) to show the height difference among different tree species.

2.2.5. The Point Cloud Characteristic of UAV-DAP and UAV-Based LiDAR Data
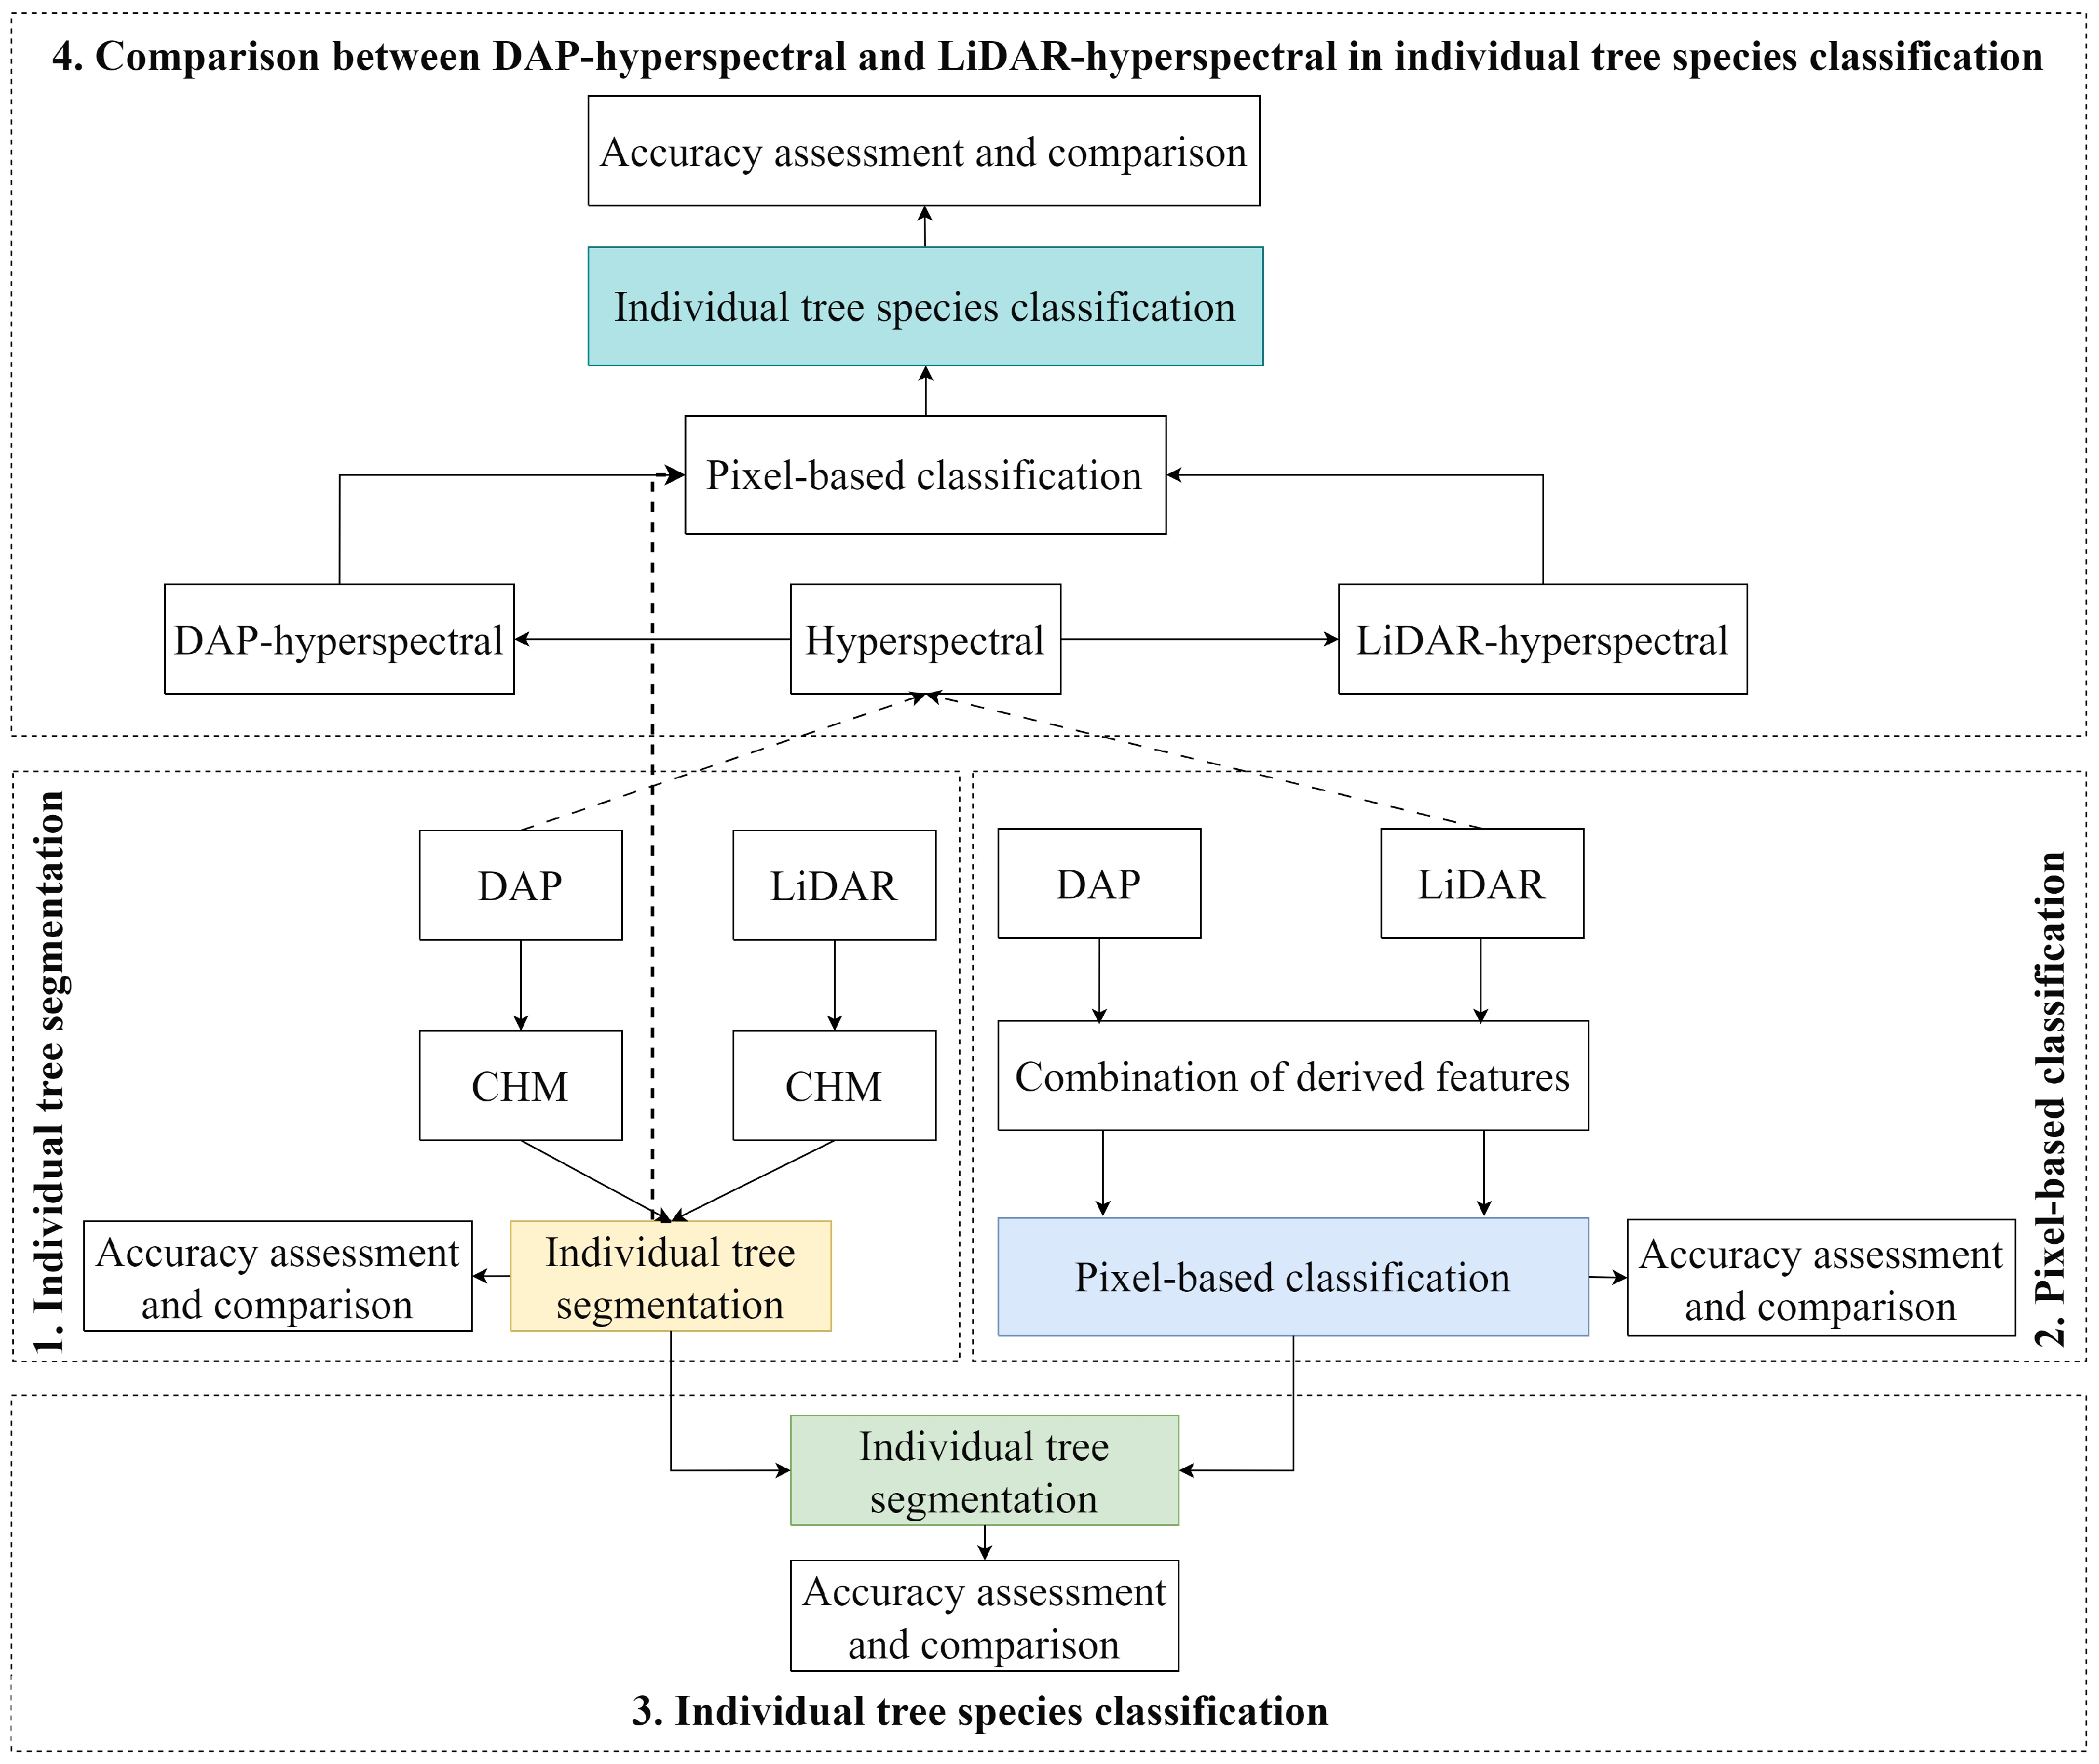
The principles of UAV-DAP and UAV-based LiDAR are different, with point cloud data being obtained through stereo image calculation and laser pulse echoes, respectively. For UAV-based photogrammetry, the SFM algorithm is used to generate 3D pointing cloud data from stereo images. It is unable to capture the complete point cloud data for the middle and lower parts of trees from various angles. Therefore, UAV-DAP can acquire many canopy points but few ground points [57,58], which makes it disadvantageous for describing details and understory features of trees. Therefore, for tree species with complex understory morphology or tall and thin structures (such as CO), DAP point clouds may even fail to construct the entire tree model (Figure 4 and Figure 5).

3. Methodology

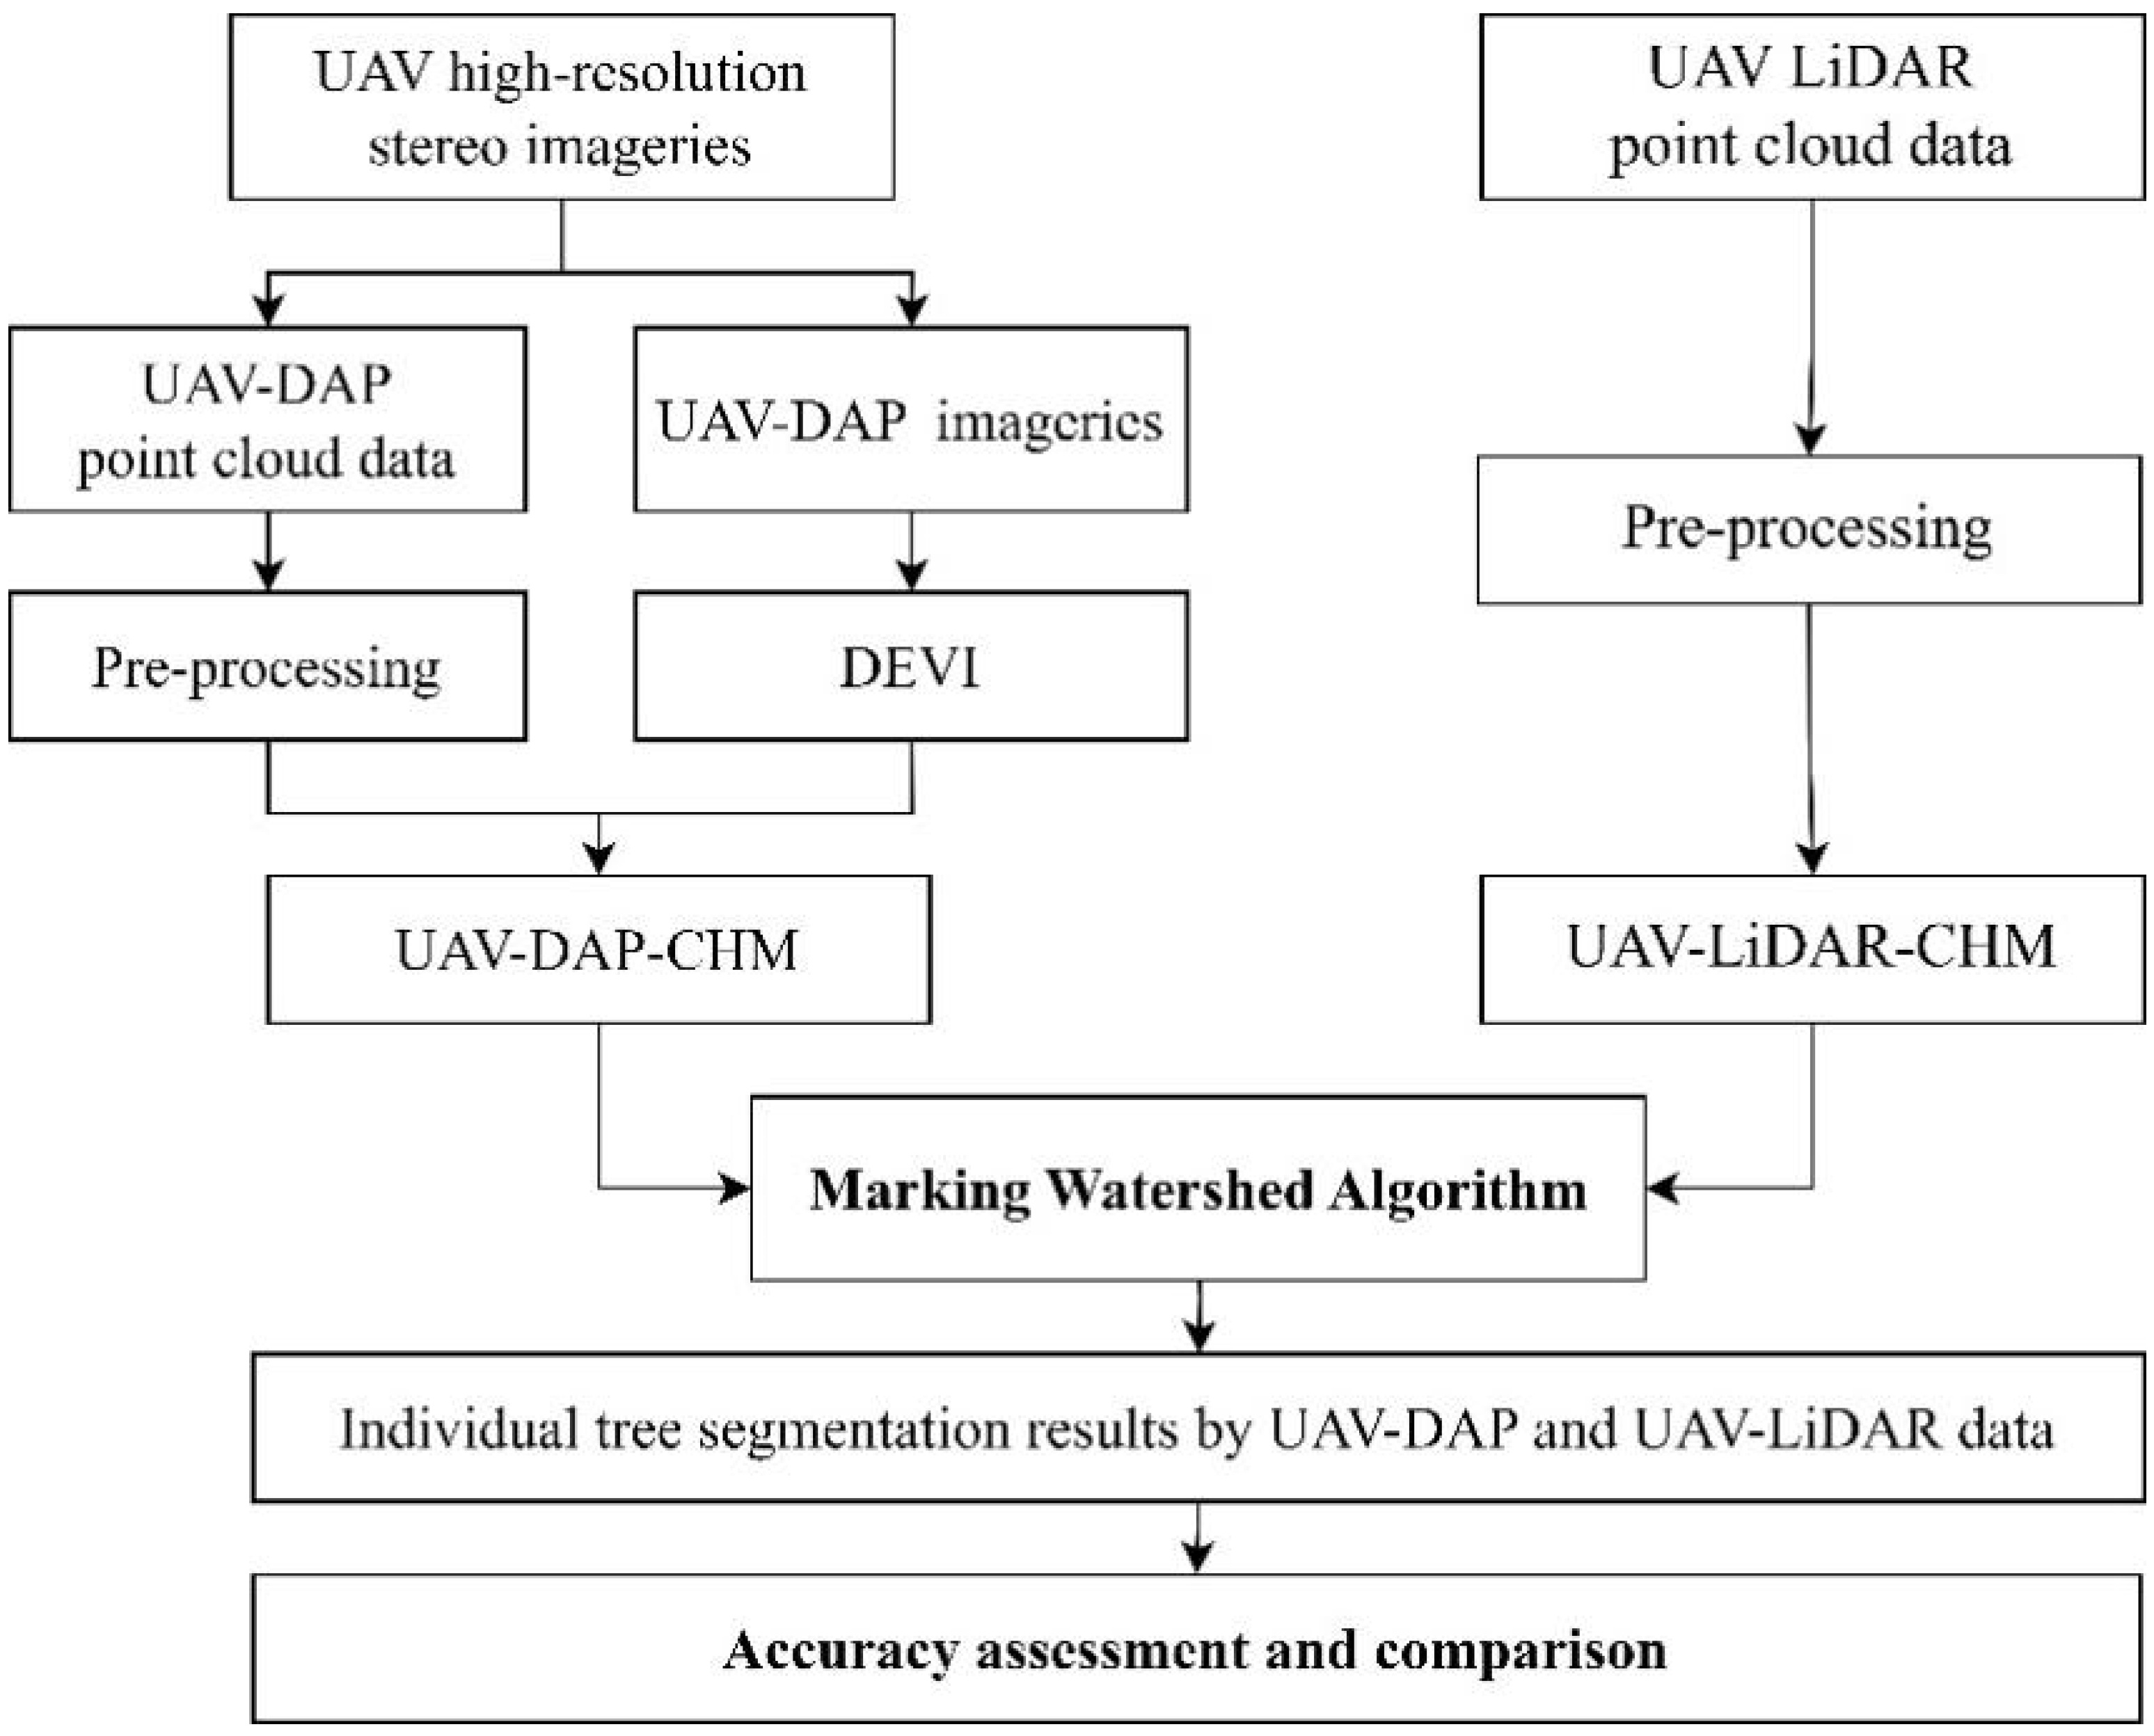
3.1. Two-Dimensional Boundary of Urban Trees Extraction

To classify individual tree species of urban areas, the first step was to separate the trees from other urban objects, such as roads, grass, buildings, and so on. Here, for high-resolution RGB imagery, DEVI > 0.5 and nDSM > 1.5 m were used to separate trees from other urban objects. Then, the extracted urban tree boundaries were used as a mask for the following parts. As for UAV-based LiDAR datasets, pre-processed point cloud data were classified as buildings, trees, and others. All the tree points were interpolated to a canopy height model (CHM), and the resolution of CHM is also 0.1 m. The following steps are shown in Figure 6 specifically.

3.2. Individual Tree Segmentation and Accuracy Assessment

To compare the performance of UAV-DAP and UAV-based LiDAR data in urban forests, individual tree segmentation is the first step. The flow chart for this part is shown in Figure 7. Although the principles of the two data collection methods are different, the individual tree segmentation methods of UAV-based LiDAR data can also be used for UAV-based photogrammetry. Therefore, in this paper, the watershed segmentation algorithm based on topological theory was utilized to extract individual trees in urban areas from both UAV-DAP and UAV-based LiDAR point cloud data, respectively [59,60]. The watershed algorithm treats CHM images as terrain surfaces, with high grayscale areas representing mountain peaks and low grayscale areas representing valleys. Firstly, local extreme points from CHM were extracted as tree crown vertices, and these points were used as initial marker points. Then, starting from the marked point, its influence range was expanded through regional growth until the “watershed” was completely filled. Finally, the watershed algorithm was used to divide overlapping regions and generate independent single tree segmentation results. Compared with traditional watershed algorithms, the marked watershed algorithm dynamically adjusted the window size and segmentation strategy to adapt to the crown width characteristics of different tree species, effectively alleviating the problem of over segmentation caused by noise.
During the individual tree segmentation process, the following parameters were determined: (1) The maximum and minimum tree height were set to 80 m and 2 m, respectively. (2) Buffer size was set to 150 pixels. (3) Through multiple experiments, the sigma parameter of Gaussian smoothing was set to 6.5, and the smoothing window radius was set to 85 pixels. Here, the smoothing window radius should be an odd number and normally be set according to the average crown diameter size. The segmentation results are vector polygons that can describe the boundaries of the segmented individual trees. In our study, the location of trees collected by RTK was used for the validation of individual tree segmentation. By comparing the measured points of individual trees with the segmented individual tree boundaries, the accuracy of individual tree segmentation was determined. If one measured tree point was located in one segmented individual tree boundary, it was correct segmentation; if more than one measured tree points were located in one segmented individual tree boundary, it was under-segmentation. Otherwise, it was over-segmentation. Finally, to conduct accuracy assessment, the segmentation results were mainly compared to field individual tree location with the following parameters, including recall, precision, and F-score. The equations of the above parameters are shown as follows [61,62,63,64].
r e c a l l = T P T P + F N
p r e c i s i o n = T P T P + F P
F - s c o r e = 2 × r × p r + p
Here, TP means the number of trees detected in the sample plot, FN means the number of trees missed by the watershed algorithm, and FP refers to the number of trees that do not exist in the sample plot but are detected incorrectly. r represents recall (Equation (1)) and p represents precision (Equation (2)).

3.3. Random Forest Classification Method

Random forest classifier (RF) is an ensemble learning algorithm based on decision tree classifiers. By combining and voting multiple classification trees, the overall model results could achieve high accuracy and generalization performance. It has been proven to be much more accurate than other classification classifiers [65].
In this paper, the detailed information of features derived from UAV-based LiDAR, UAV-DAP, and hyperspectral data were shown in Table 4. Then, seven combinations were generated according to different purposes. Finally, different feature combinations were input into a random forest classifier to compare their performance in tree species classification. Table 5 shows the detailed information of the seven combinations of derived features. The combinations of DAP features in Table 5 include Spectral, Texture, Spectral + Texture, and Spectral + Texture + Structure. The main goals of this combination are to (1) explore the performance of DAP-derived spectral, texture, and structural features in tree species classification individually and in combination and (2) to explore the performance of one vegetation index or all vegetation indexes in urban tree species classification. The combinations of UAV-based LiDAR-derived features in Table 5 include interval percentage and cumulative percentage height/intensity features. The main goal of this combination is to explore the performance of interval and cumulative height/intensity features in urban tree species classification. Finally, by comparison, the best feature combinations were determined for the following classification fused with hyperspectral data. The flowchart is shown in Figure 8.

3.4. Individual Tree Species Classification

The individual tree boundaries extracted above were overlaid on the tree species classification maps derived from random forest classifier. Then, the individual tree species were determined by the tree species with the highest percentage in one individual tree boundary through ArcGIS 10.8 software in our study. Therefore, individual tree boundaries derived from UAV-DAP and UAV-based LiDAR data were overlaid on the random forest classification maps with UAV-DAP derived parameters and UAV-based LiDAR derived parameters, respectively. The flowchart of this part is shown in Figure 9.

3.5. Accuracy Assessment

Confusion matrix was conducted to process the accuracy assessment of the urban tree species maps. The kappa coefficient, overall accuracy (OA), producer accuracy (PA), user accuracy (UA), and F1-score were used to assess the tree species classification accuracy quantitatively [66]. The equation of the F1 score is listed as Equation (4):
F 1 - s c o r e = 2 × U A × P A U A + P A

4. Results

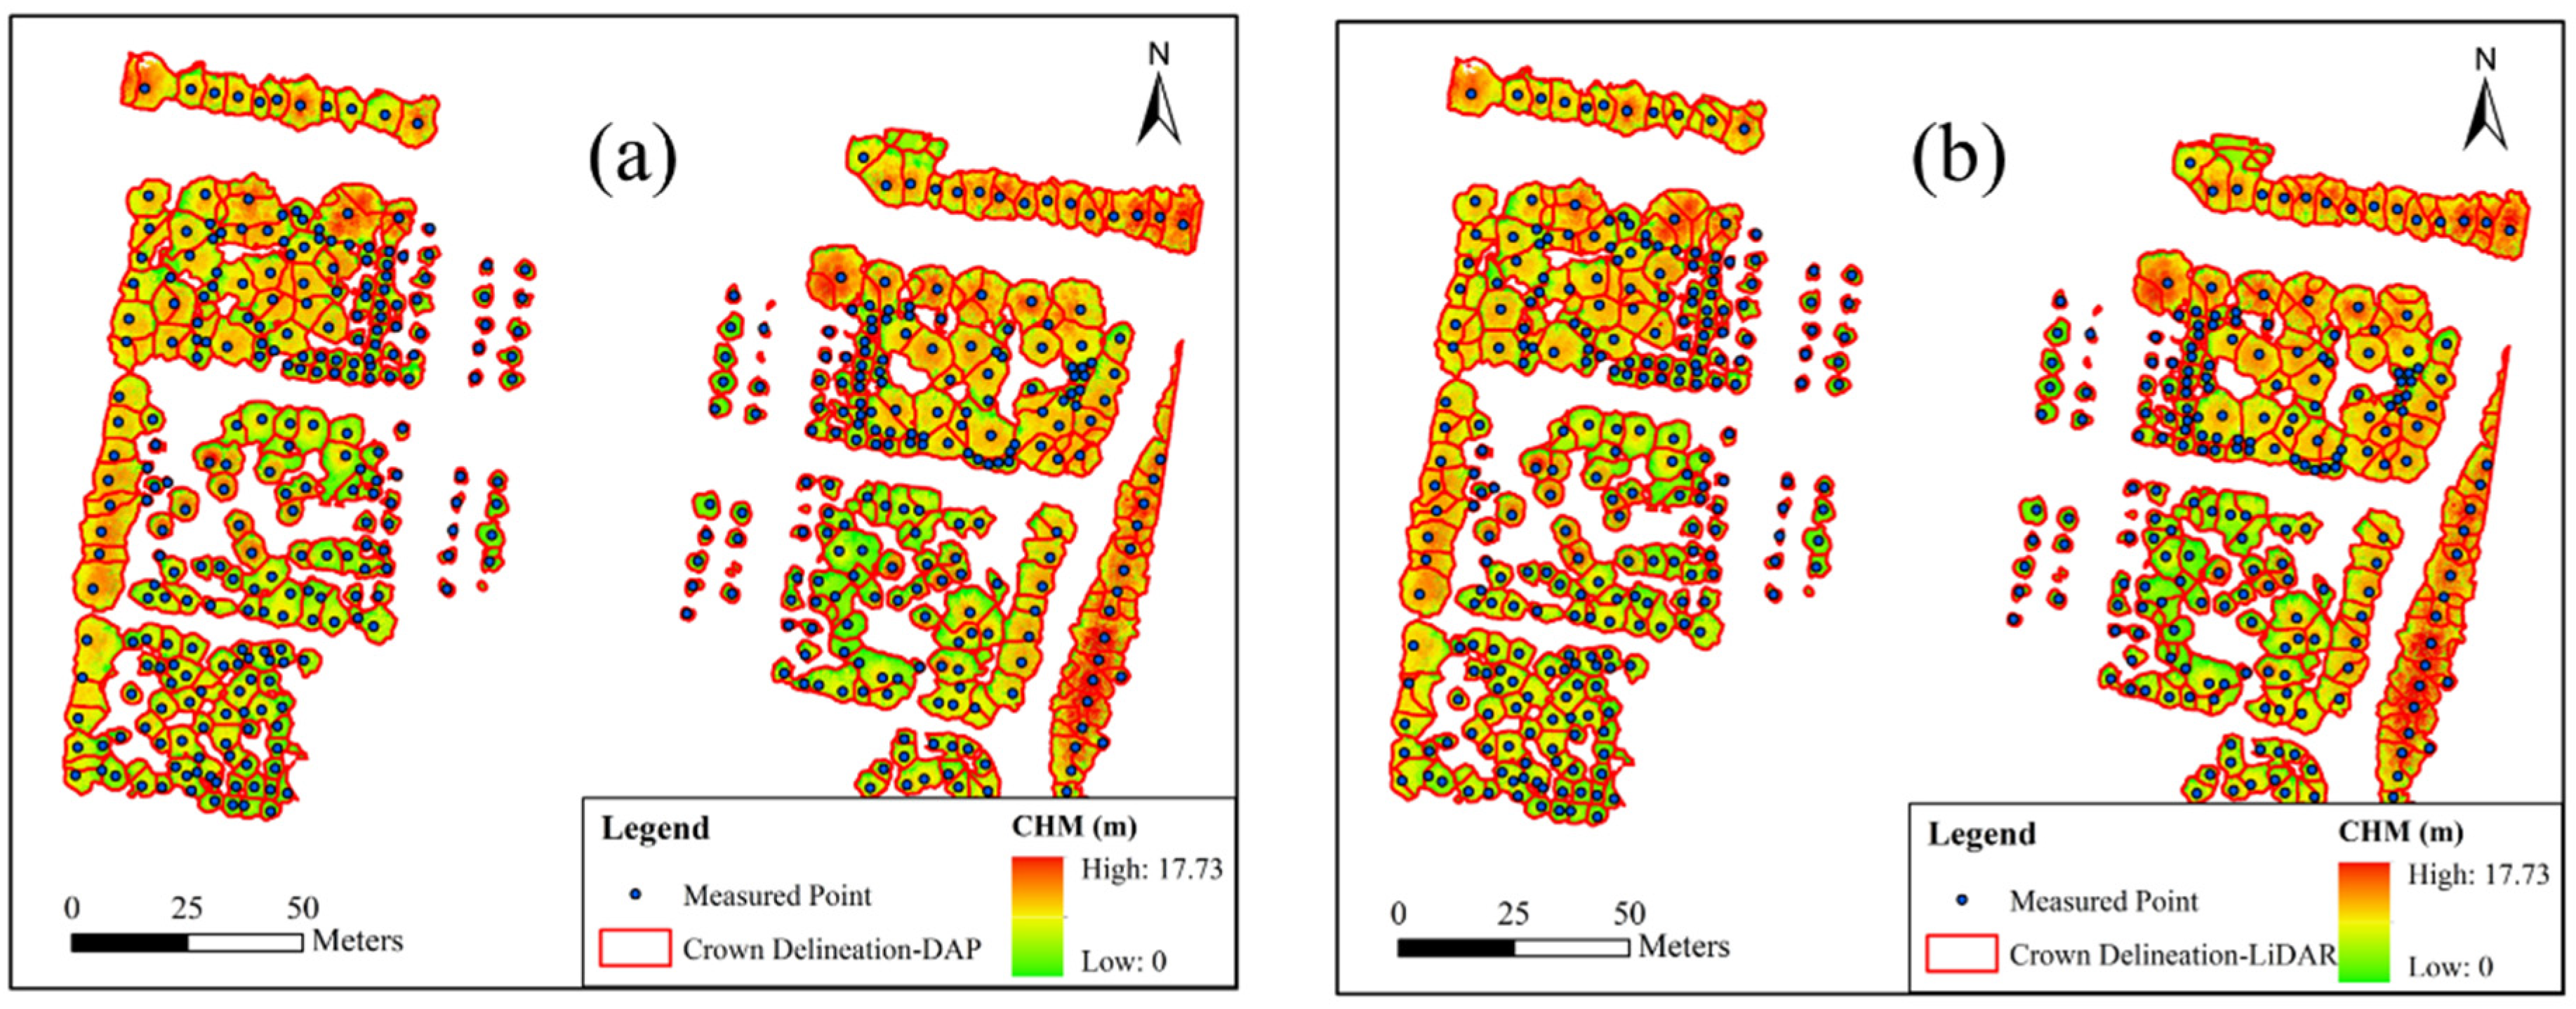
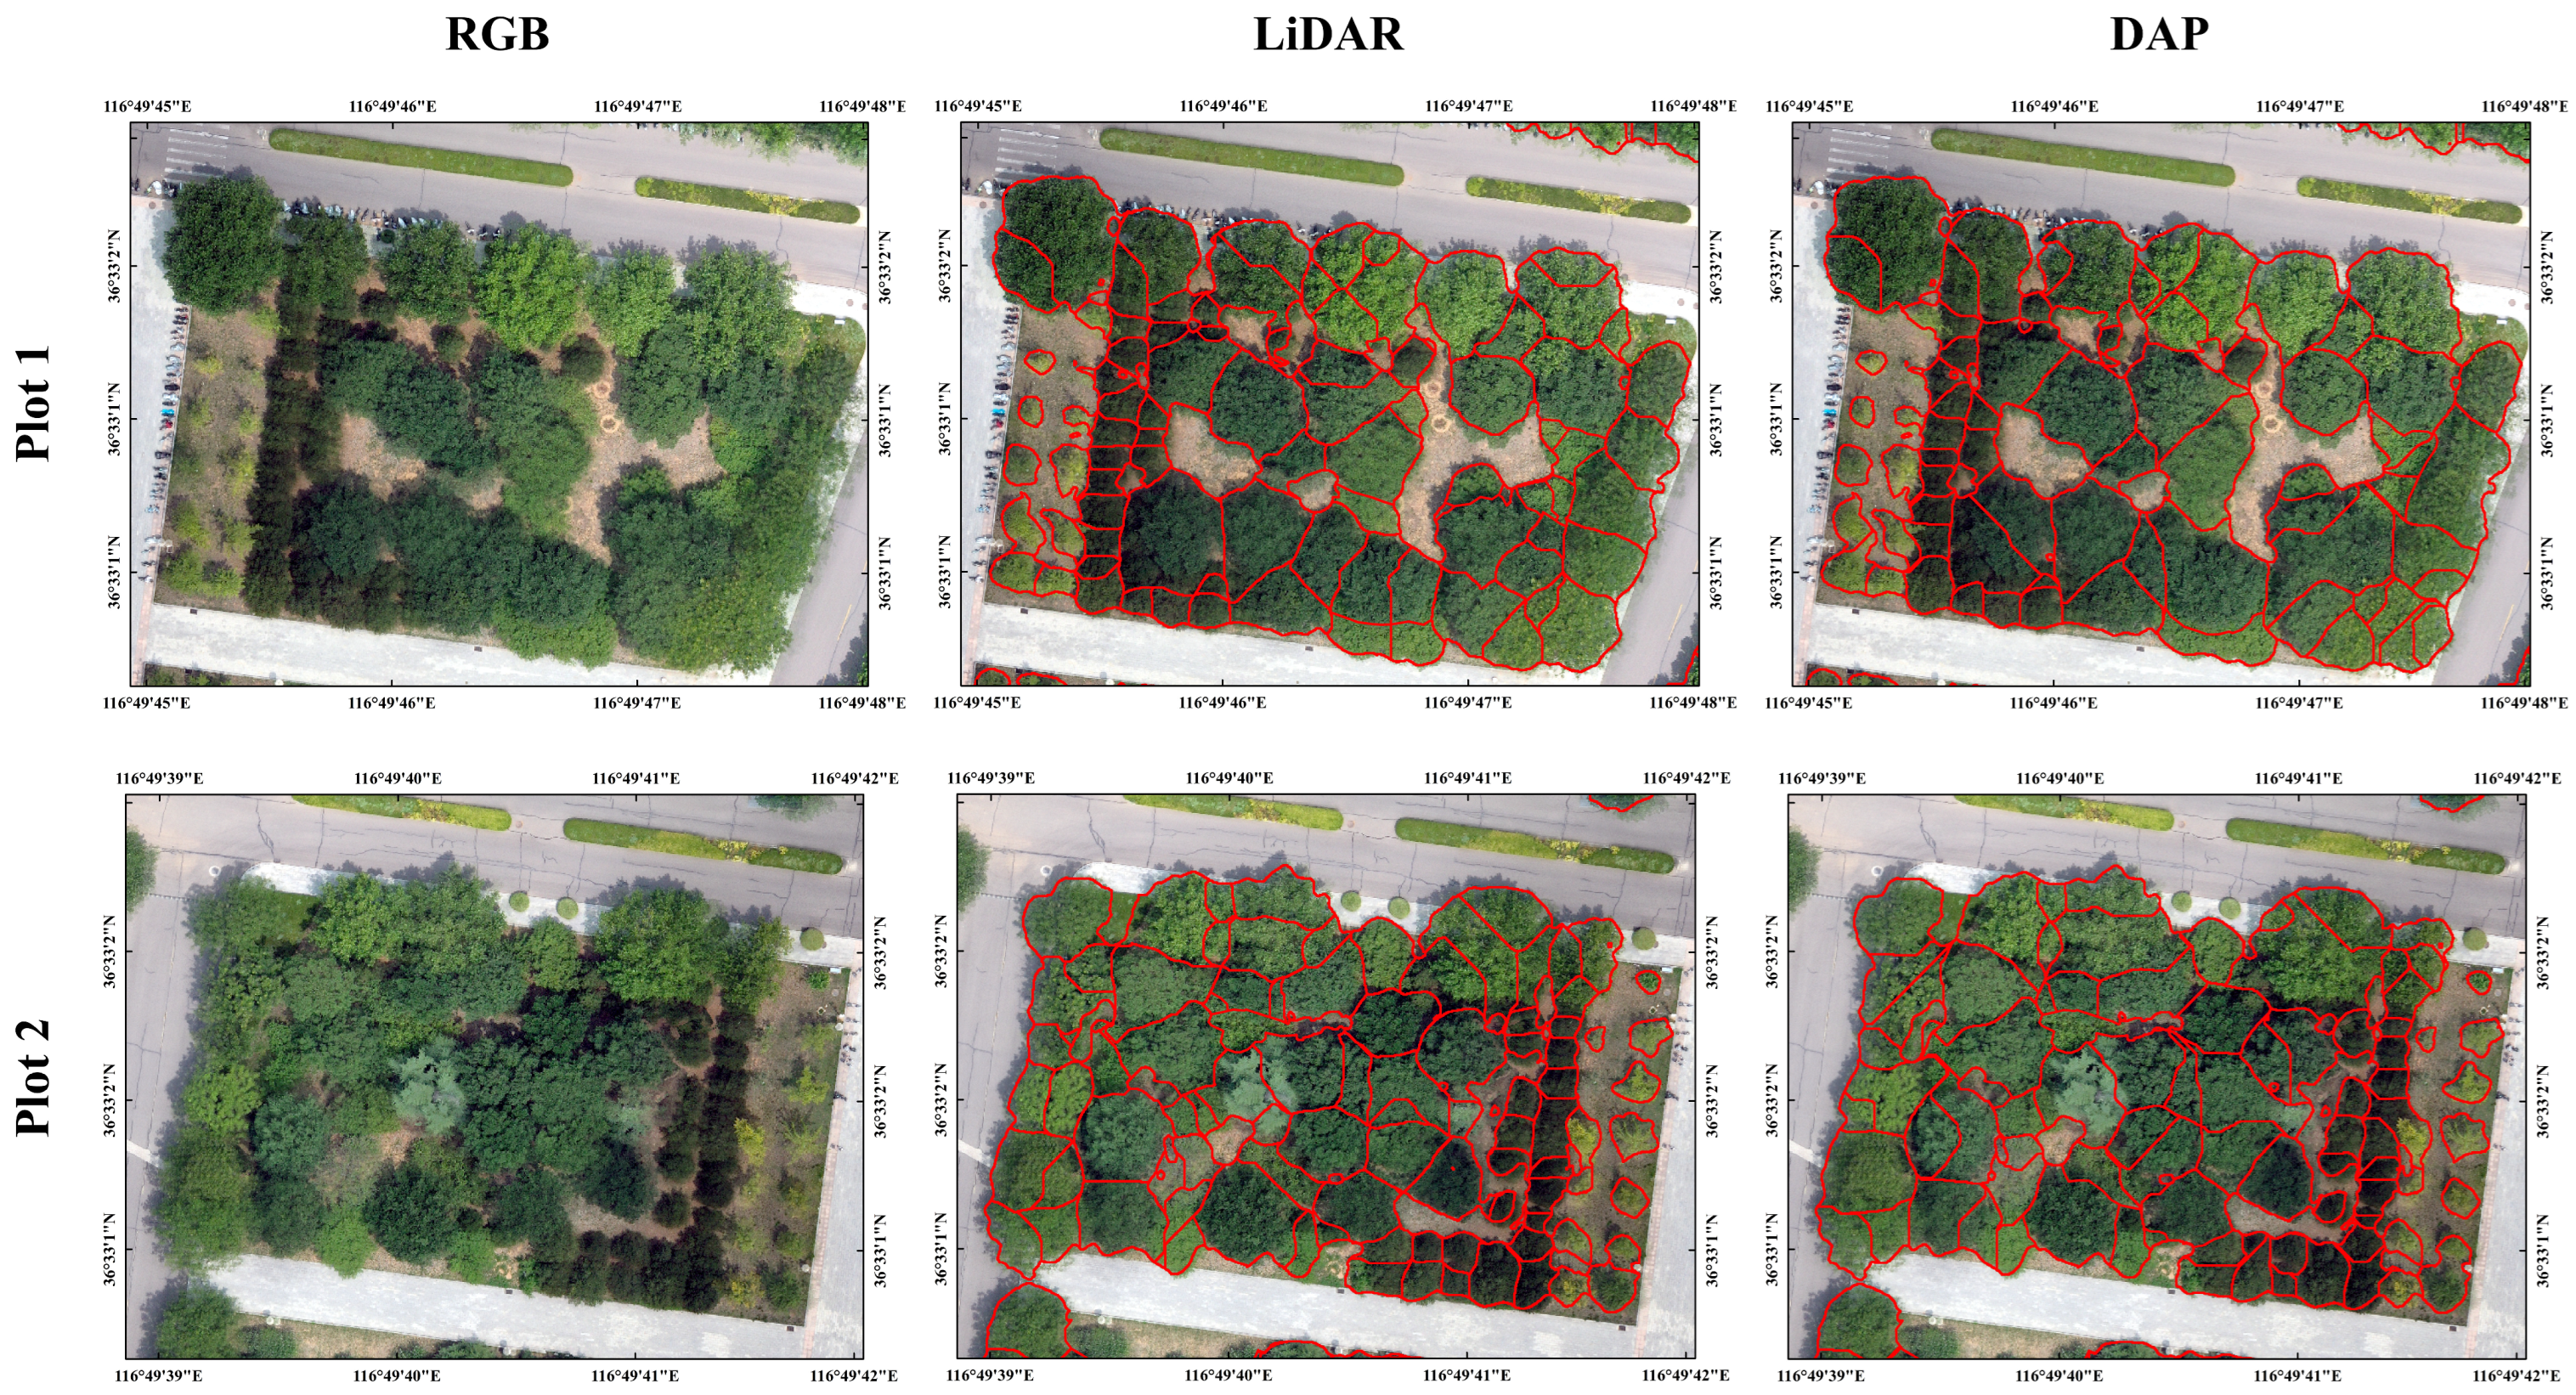
4.1. Accuracy Assessment of UAV-DAP-Based and UAV-Based LiDAR-Based Individual Tree Segmentation

The segmentation results are shown in Table 6. In addition,, Figure 10 and Figure 11 compare the individual tree segmentation results by UAV-DAP and UAV-based LiDAR data in both global and local perspectives. The results demonstrate that there is not significant difference in the overall performance of the two in individual tree segmentation. However, their performance varies with the specific tree species, which makes UAV-based LiDAR data slightly better than UAV-based photogrammetry. As for the segmentation of low trees growing next to the high trees, the performance of UAV-based LiDAR data is much better than that of UAV-based photogrammetry. Although both data cause over-segmentation in large tree segmentation, the over-segmentation situation of UAV-based photogrammetry is much lower than that of UAV-based LiDAR data due to the detailed information of LiDAR data and the relatively smooth surface of UAV-based photogrammetry.
As for the accuracy assessment, the F-score and recall rate of UAV-based LiDAR data are much higher than that of UAV-based photogrammetry, which indicates that the performance of UAV-based LiDAR data in individual tree segmentation is better as it can capture low and obstructed trees in complex forest canopies. However, the precision of UAV-based photogrammetry is 0.01 higher than that of UAV-based LiDAR data, which indicates that the segmentation with UAV-DAP point cloud data has fewer misjudgments and is slightly better for segmentation in areas with dense crowns.

4.2. Accuracy Assessment of Urban Tree Species Classification in Different Conditions

4.2.1. Feature Importance

The accuracy of tree species classification with different feature combinations derived from DAP and LiDAR data are listed in Table 7. For UAV-based photogrammetry, (1) by comparing experiment 1 and experiment 2, the contribution of single DEVI is much more significant than that of multiple vegetation indexes. (2) By comparing experiment 1 and experiment 3, the addition of height features has increased the overall accuracy of tree species classification by 20.38%. (3) By comparing experiment 4 and experiment 5, the overall accuracy of textural features alone is 21.34% higher than that of spectral features alone. For UAV-based LiDAR data, the results indicate that the performance of height and intensity features at a cumulative percentage are much better than that of the interval percentage. In summary, the textural features of UAV-based photogrammetry and the height features of the two datasets are much more efficient in urban tree species classification.

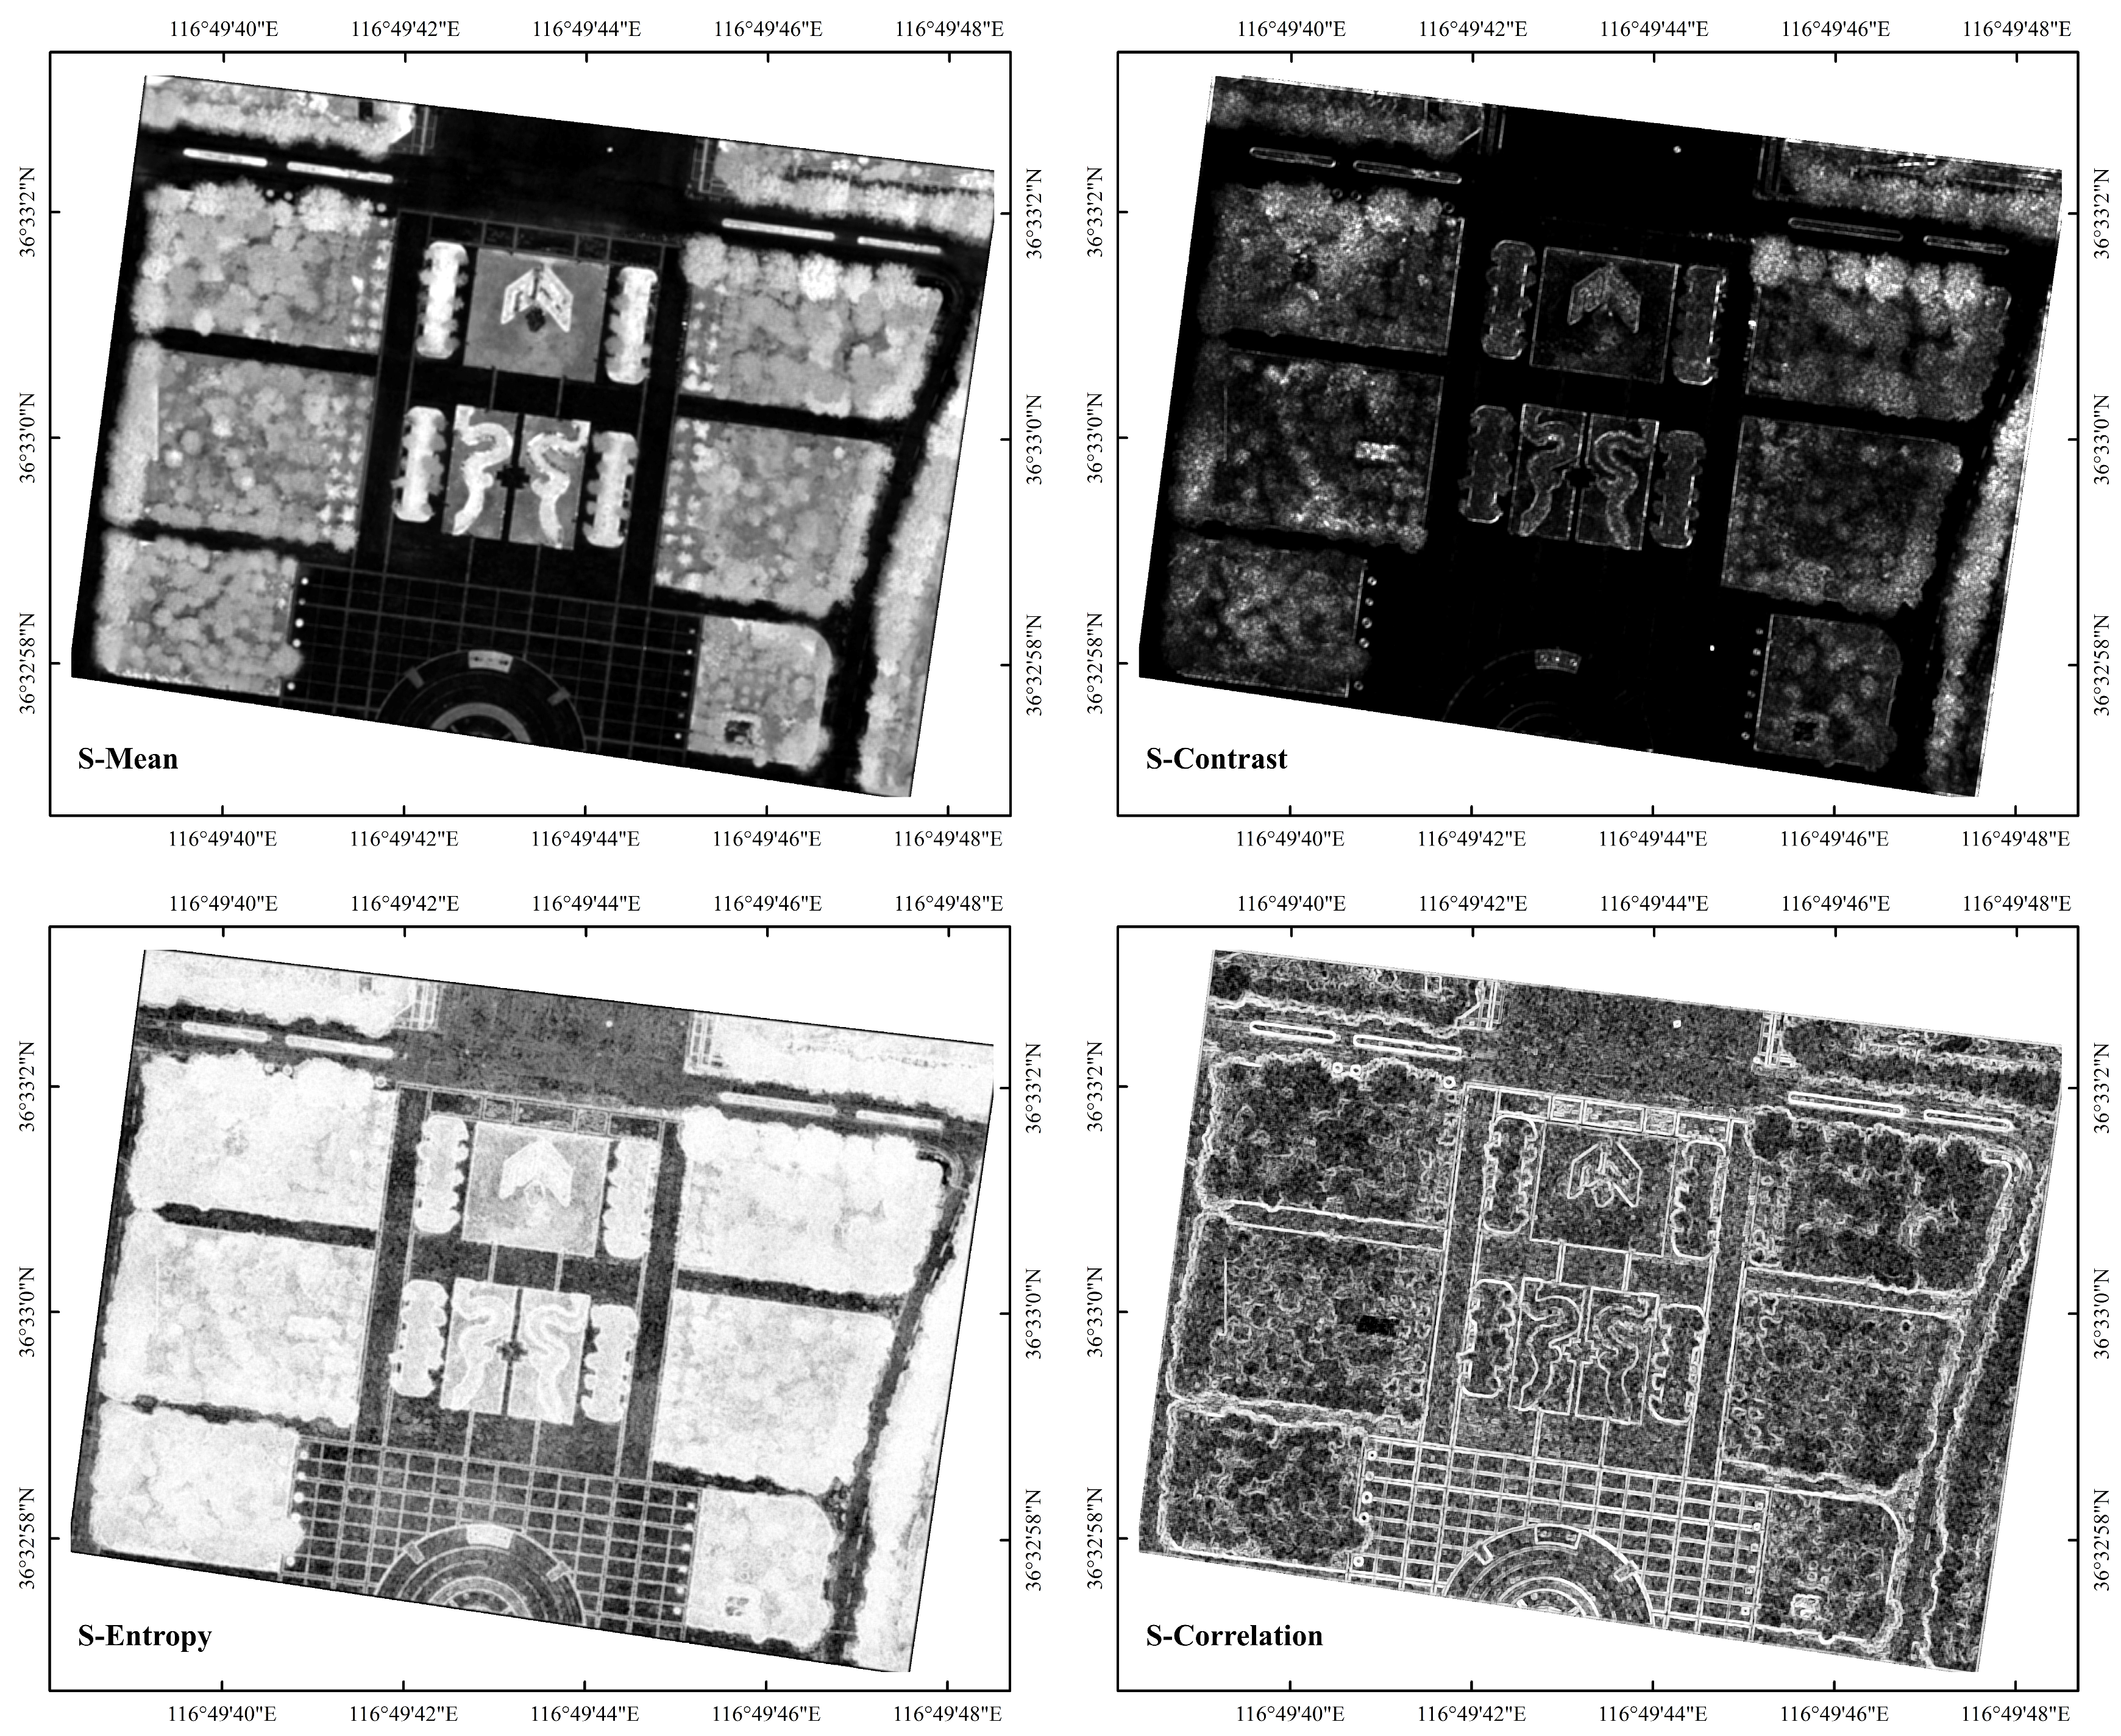
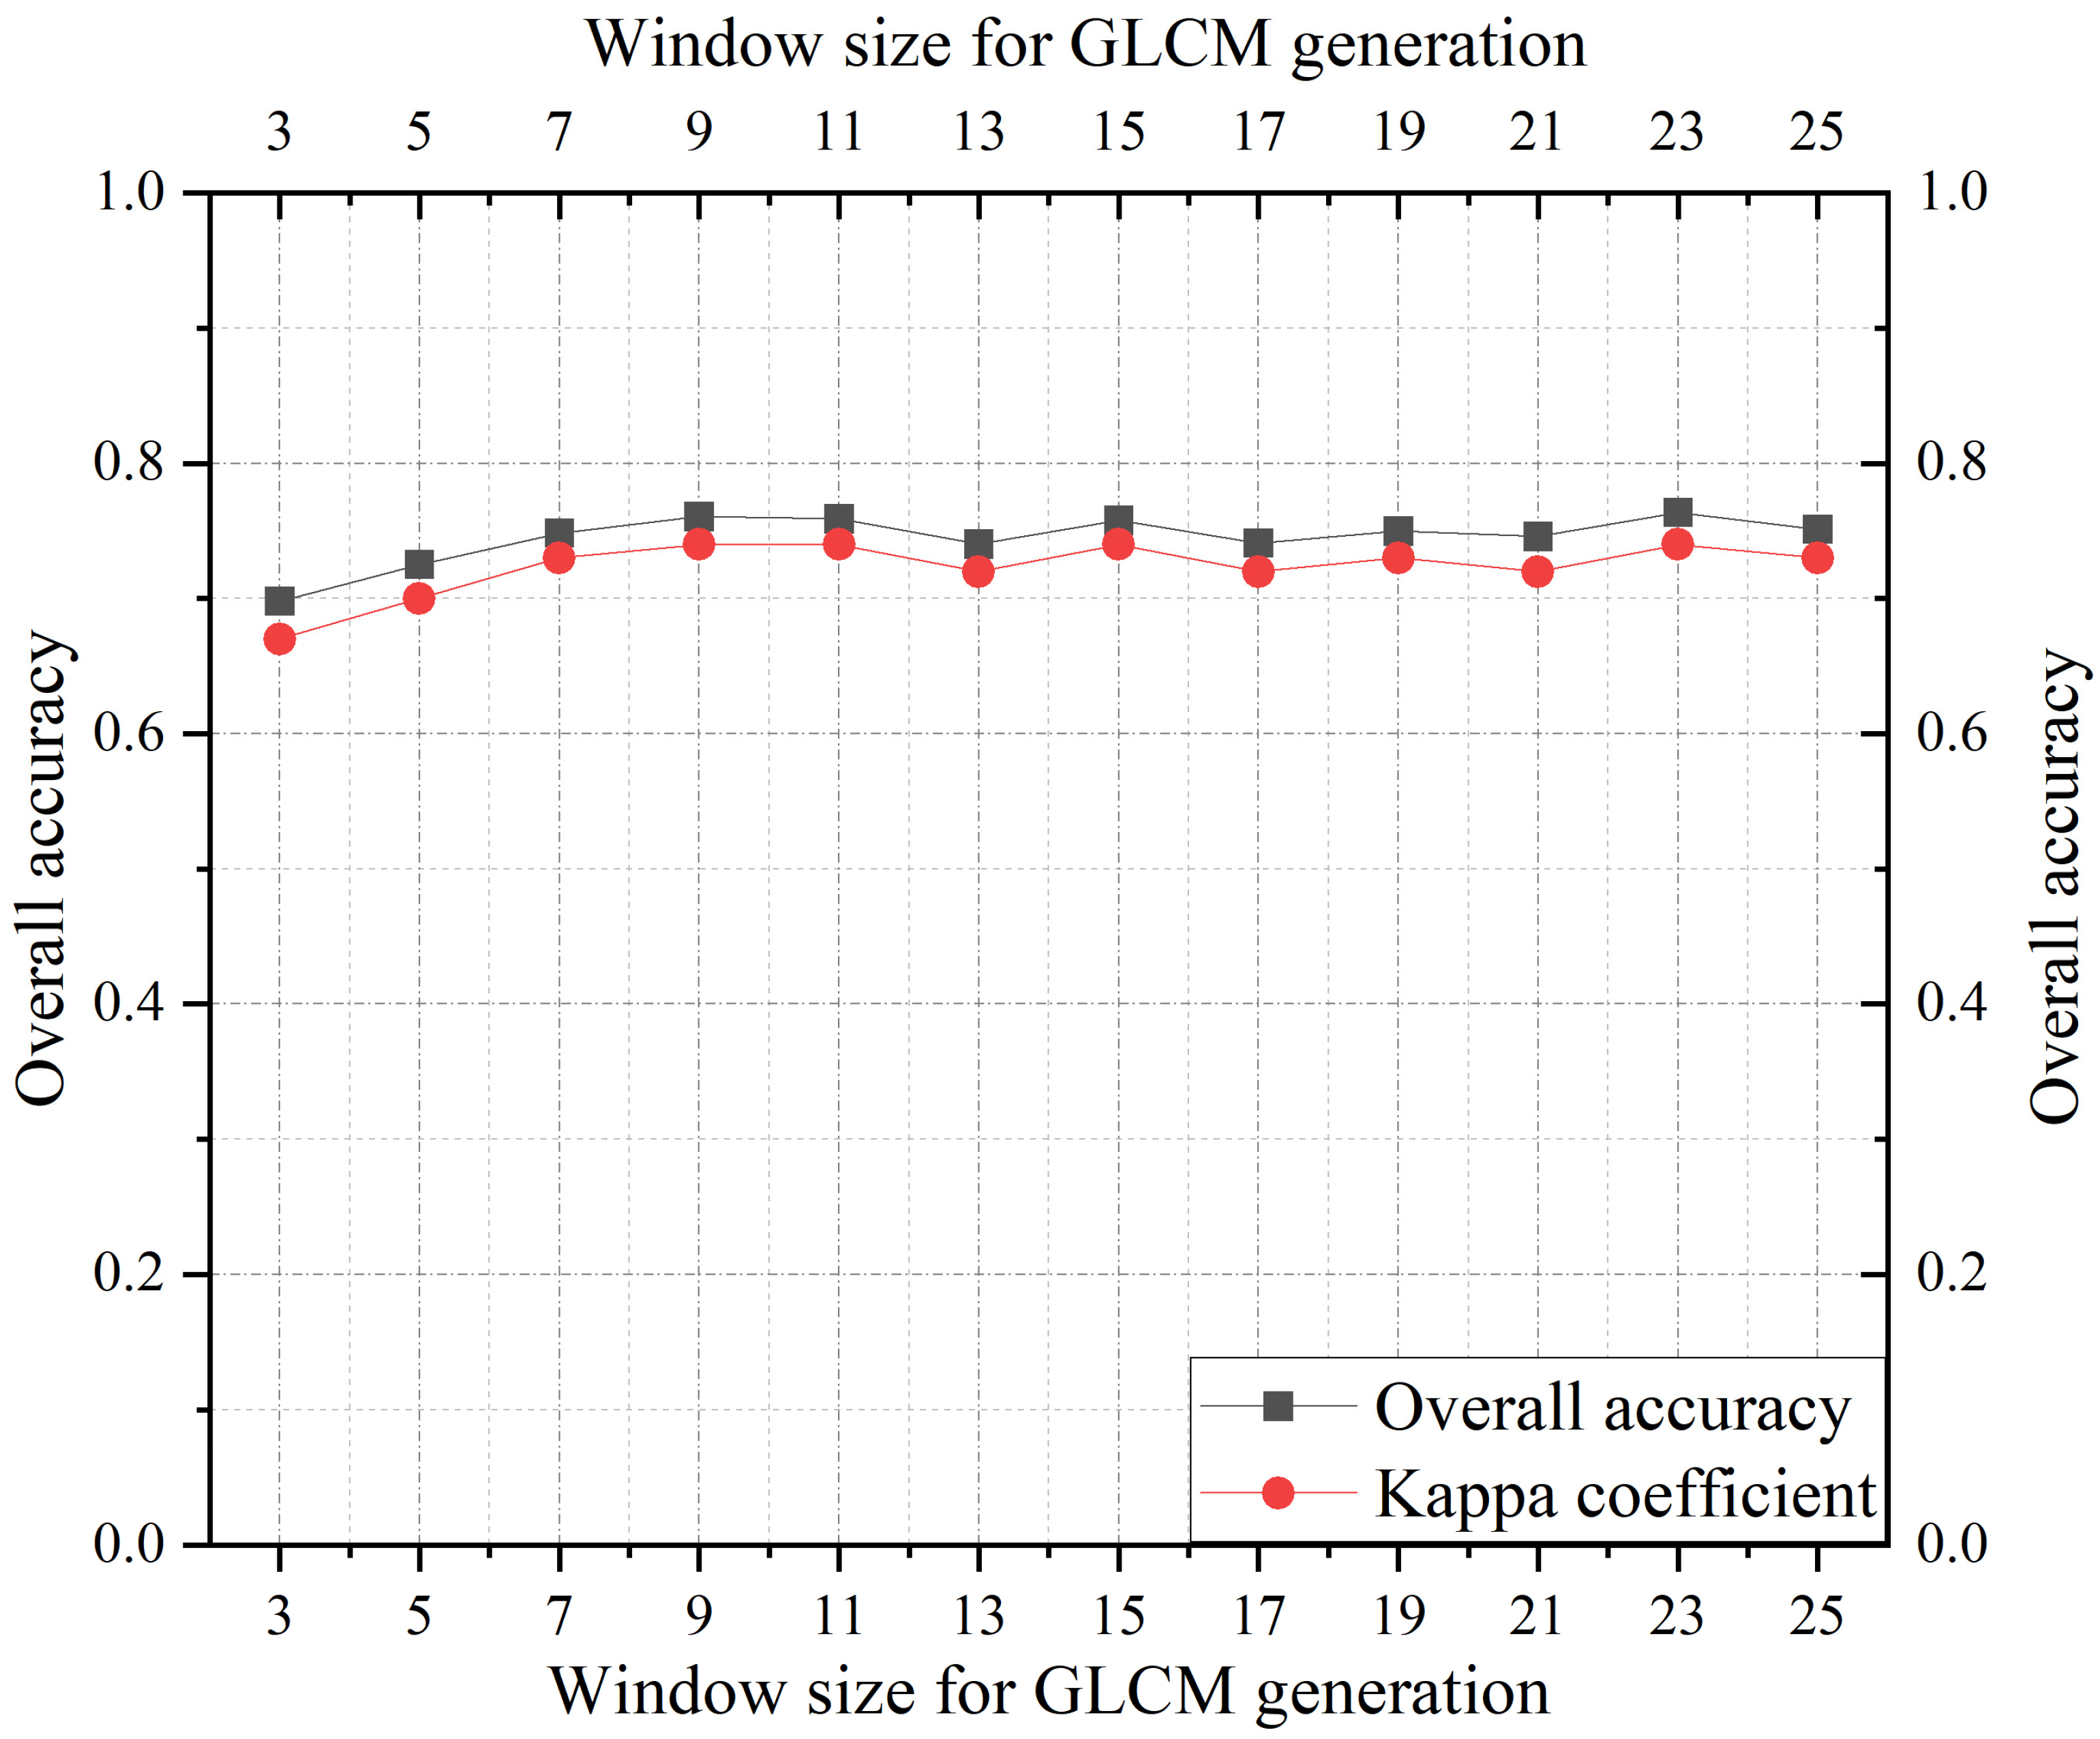
4.2.2. Effects of Texture Extraction Window Size

As textural features have shown their excellent performance in tree species classification using UAV-based photogrammetry, it is necessary to explore the optimal window size for texture generation. Therefore, in this paper, textural features extracted based on different window sizes were combined with other spectral and structural features for urban tree species classification. In our study, the second-order probability statistical filtering tool of ENVI 5.6 software was used in GLCM generation by setting different window sizes. Figure 12 shows the trend of tree species classification accuracy under different textural generation window sizes. When the window size is less than 10, the classification accuracy greatly improves with the increasing of the window size while, when the window size is greater than 10, the classification accuracy slightly decreases in fluctuations. Therefore, 9 × 9 is chosen as the optimal window size for texture generation. As the spatial resolution is 0.1 m, the 9 × 9 window size is 0.9 m × 0.9 m.

4.2.3. Effects of LiDAR Feature Cell Size

For UAV LiDAR data, cumulative percentage height and intensity are the most important features for urban tree species classification. Therefore, the spatial resolution of the above features will affect the classification accuracy of tree species. To explore this, several experiments with different cell sizes were conducted, and the results are shown in Table 8. The results indicate that as the cell size increases, the classification accuracy significantly improves. However, considering the balance between accuracy and resolution, the cell sizes greater than 1 m were no longer considered in this study with small area. Finally, the feature combination based on the optimal window size of texture generation and cell size (1 m) was used for the subsequent urban tree species classification.

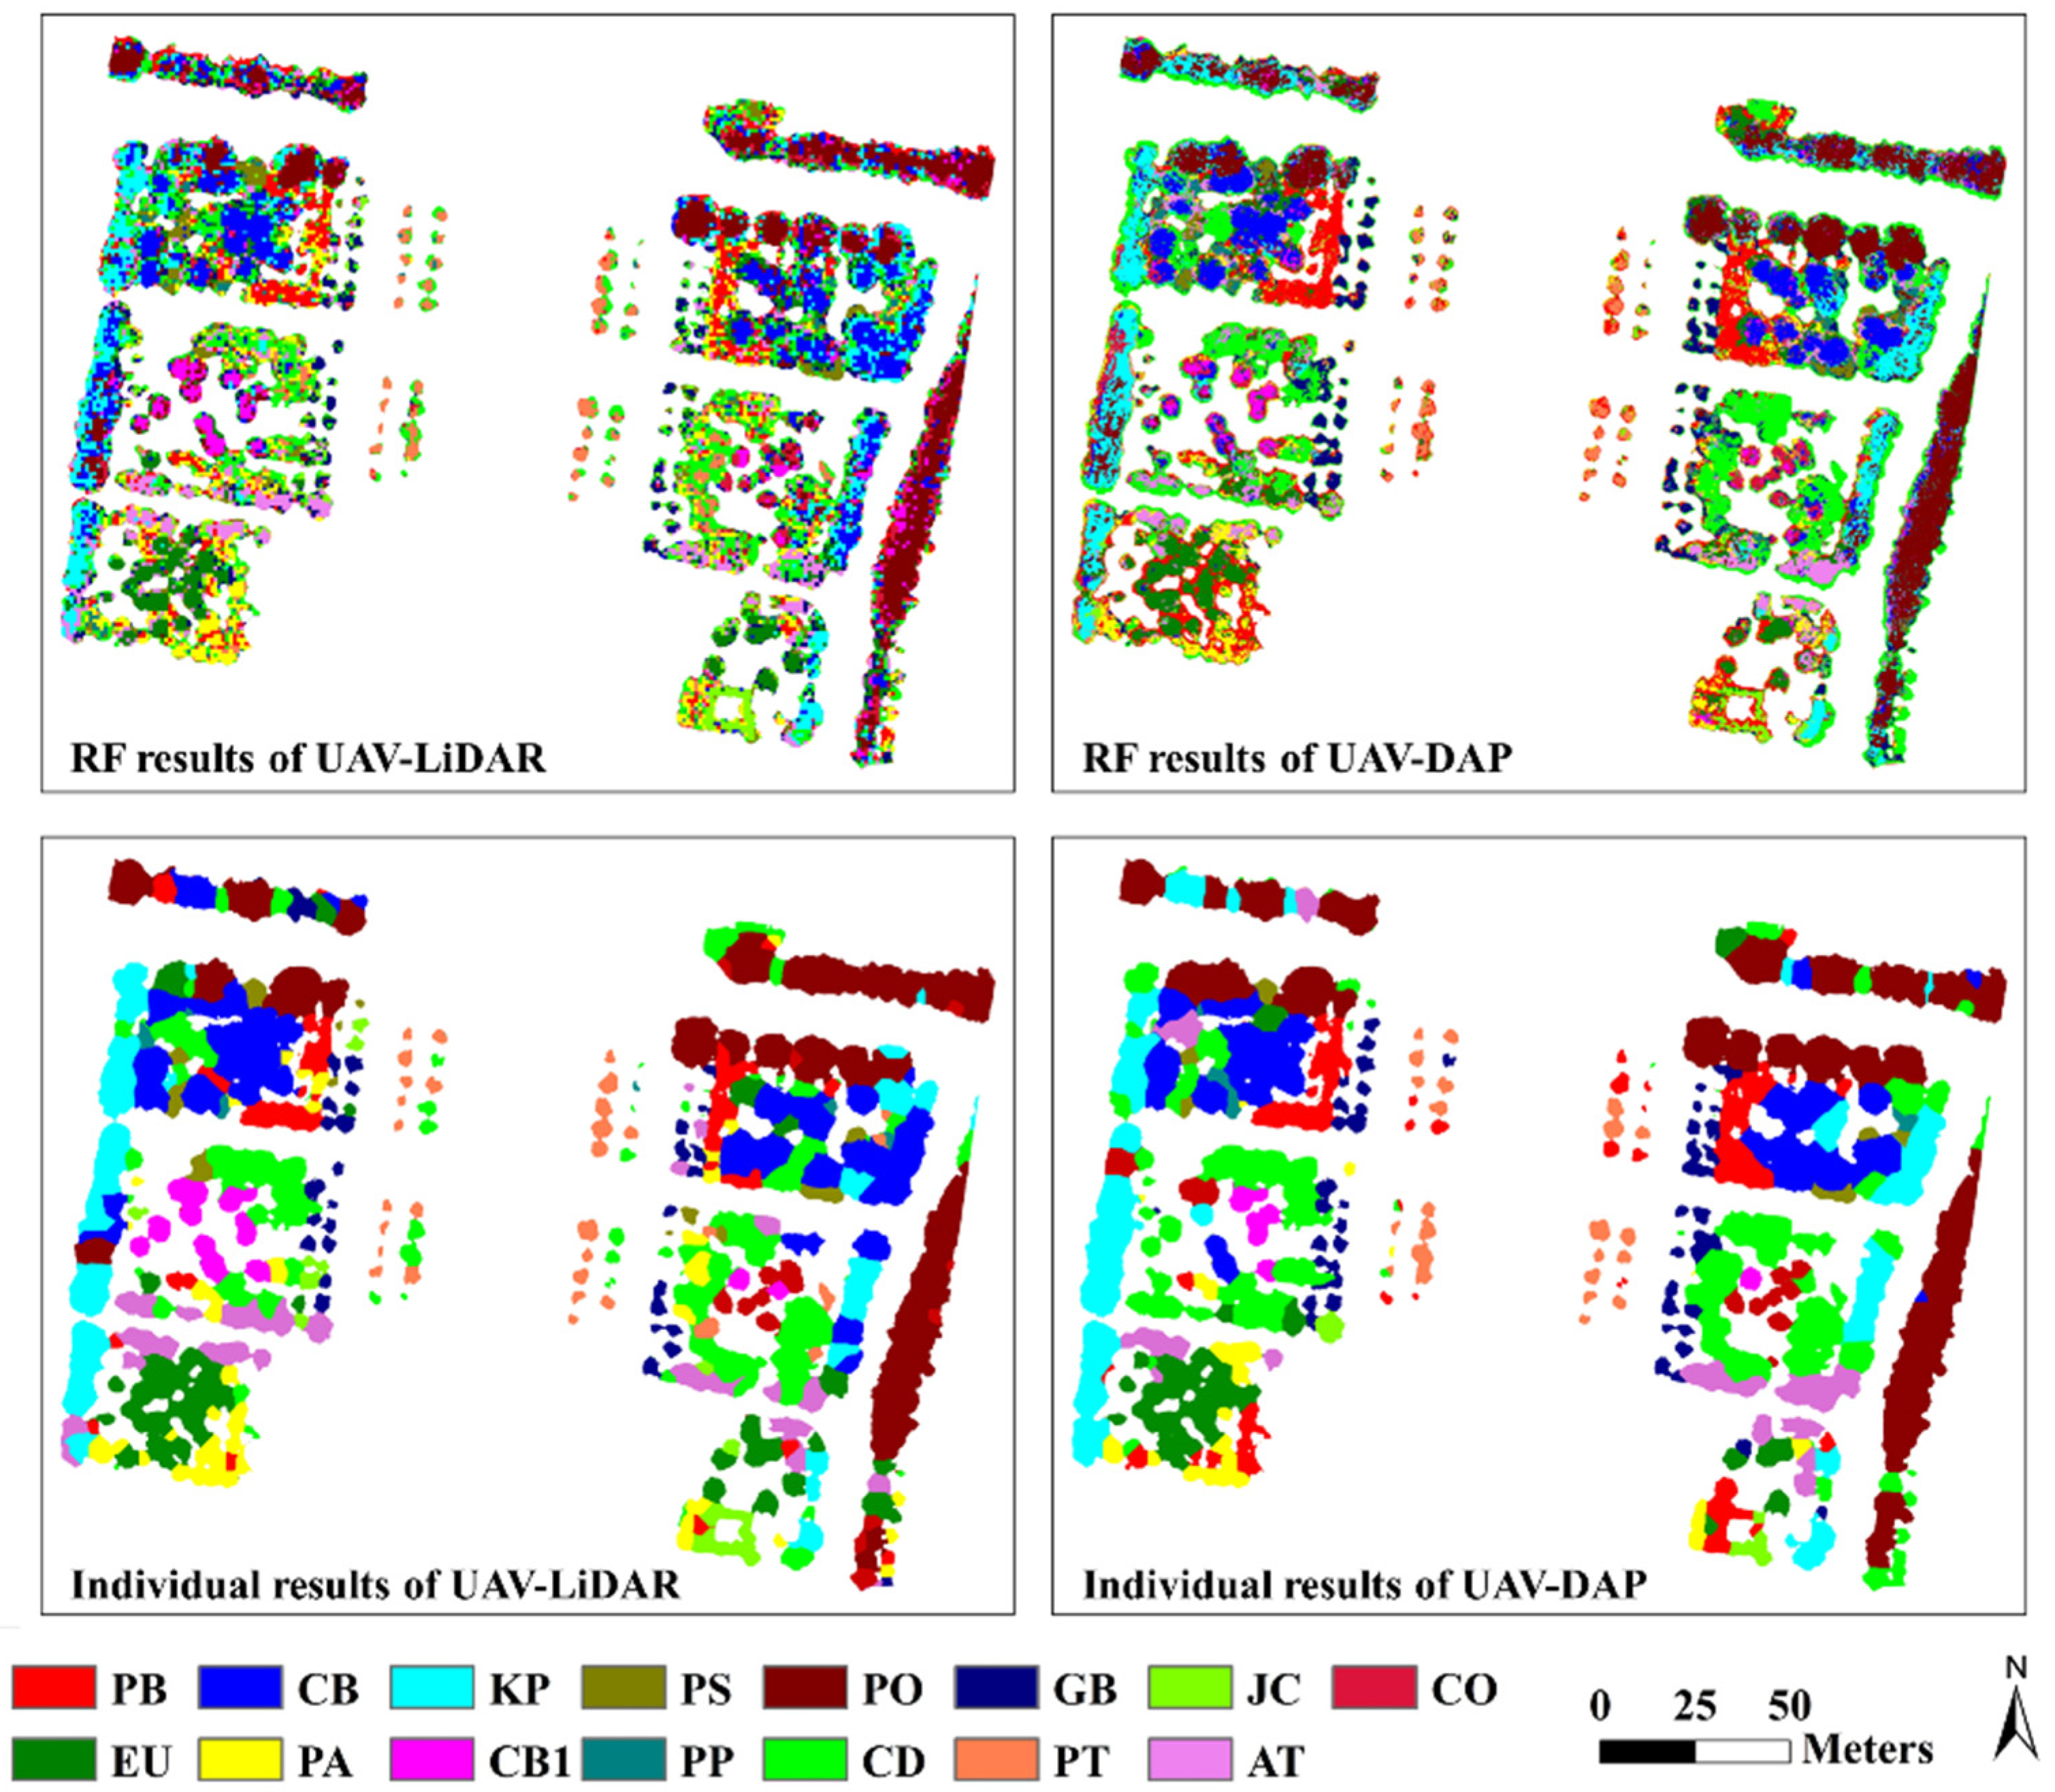
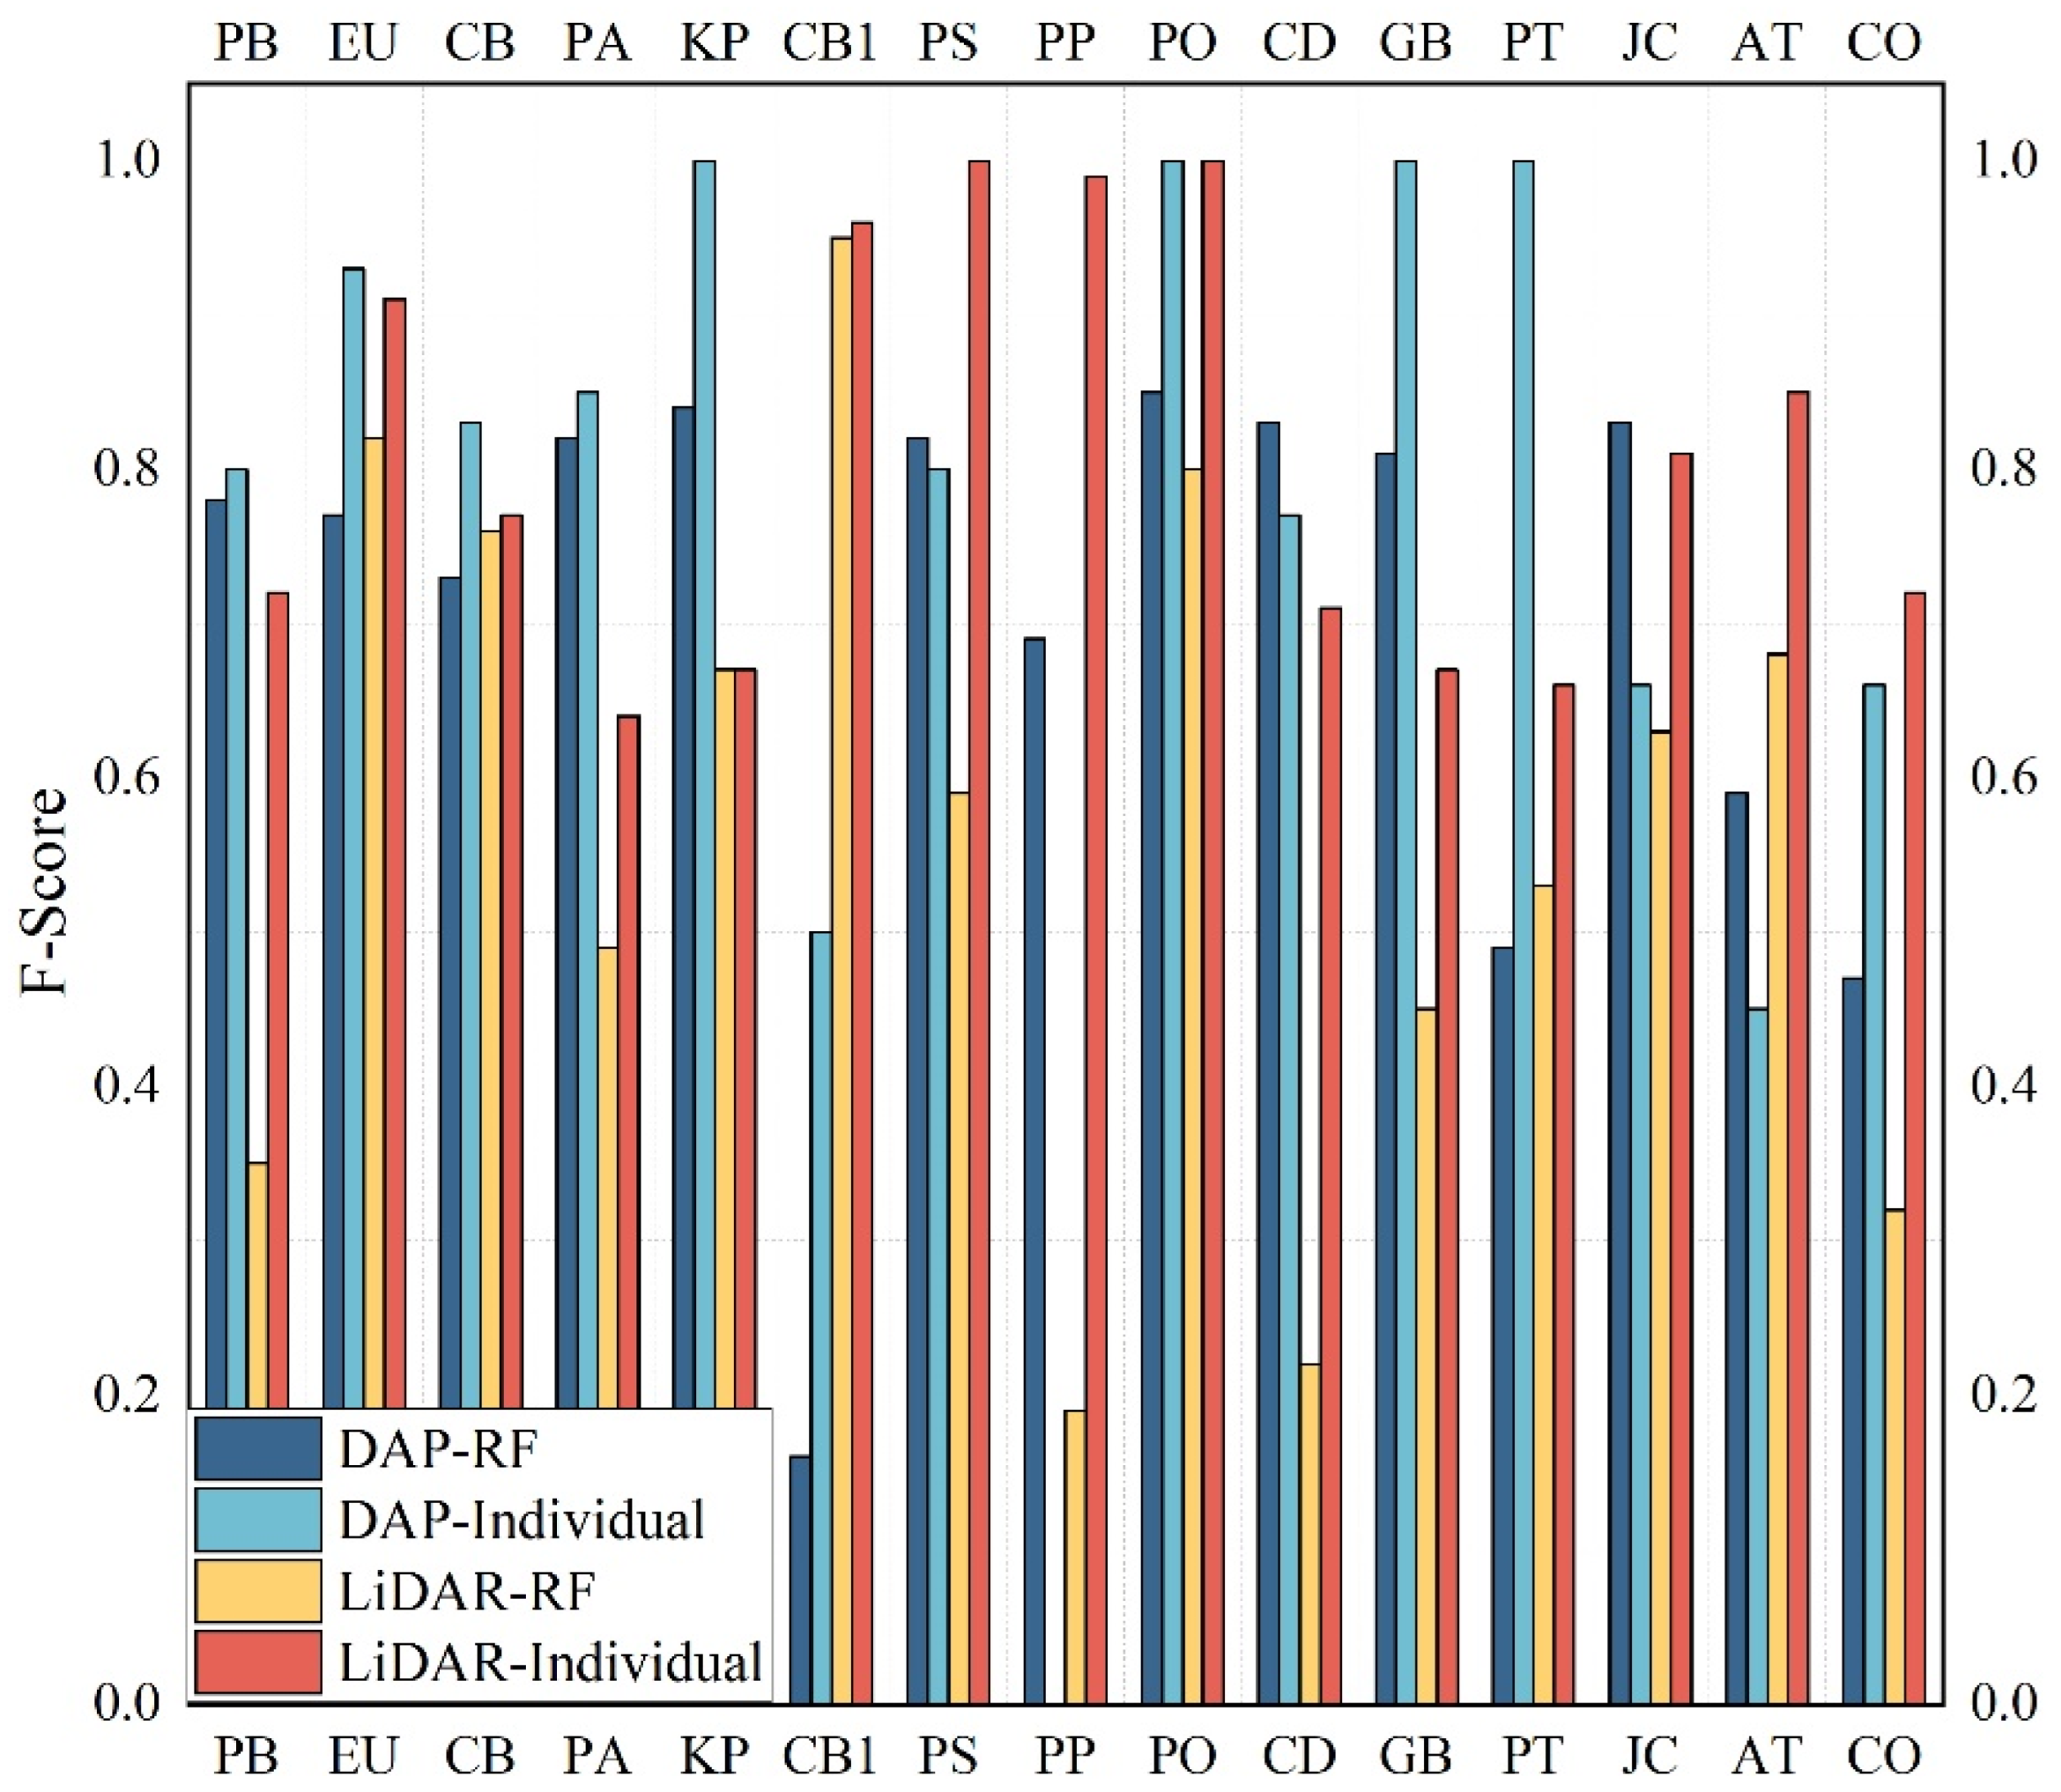
4.2.4. Accuracy Assessment of Individual Tree Species Classification

According to the above experiments, the optimal feature combinations generated based on the optimal parameters are input into the random forest classifier to classify urban tree species first. Then, the individual tree boundaries extracted by DAP and LIDAR data are overlaid onto their respective RF classification results. Finally, using the majority filtering method, the tree species within the range of an individual tree boundary are determined by the type with the highest proportion. Figure 13 shows the tree species classification map of UAV-DAP and UAV-based LiDAR data in pixel-level and individual-level, respectively.
Compared with the RF classification results, the overall accuracy of tree species classification with DAP and LiDAR data in individual tree level has been increased by 6.52% and 22.52% (Table 9), respectively. The results indicate that in terms of pixel-level and individual-level, despite visual inspection and accuracy assessment, the performance of individual tree species classification is much better than that of pixel-based tree species classification. In terms of the used data source, DAP performs much better than LiDAR data in pixel level tree species classification (Table 9), while its performance is comparable to LiDAR in individual tree species classification. The differences between DAP and LiDAR data has decreased from 16.51% in pixel-level to 0.51% in individual-tree level. However, their performance varies depending on various tree species (Figure 14).
For some tree species, whether DAP or LiDAR data are used, the classification accuracy is high, such as KP, PO, and GB. On other certain tree species, there is a significant difference in individual tree species classification between UAV-DAP and UAV-based LiDAR data. For example, the accuracy of PP has been increased significantly in individual tree species classification with UAV-based LiDAR data, whereas that of PP has decreased notably with UAV-based photogrammetry.

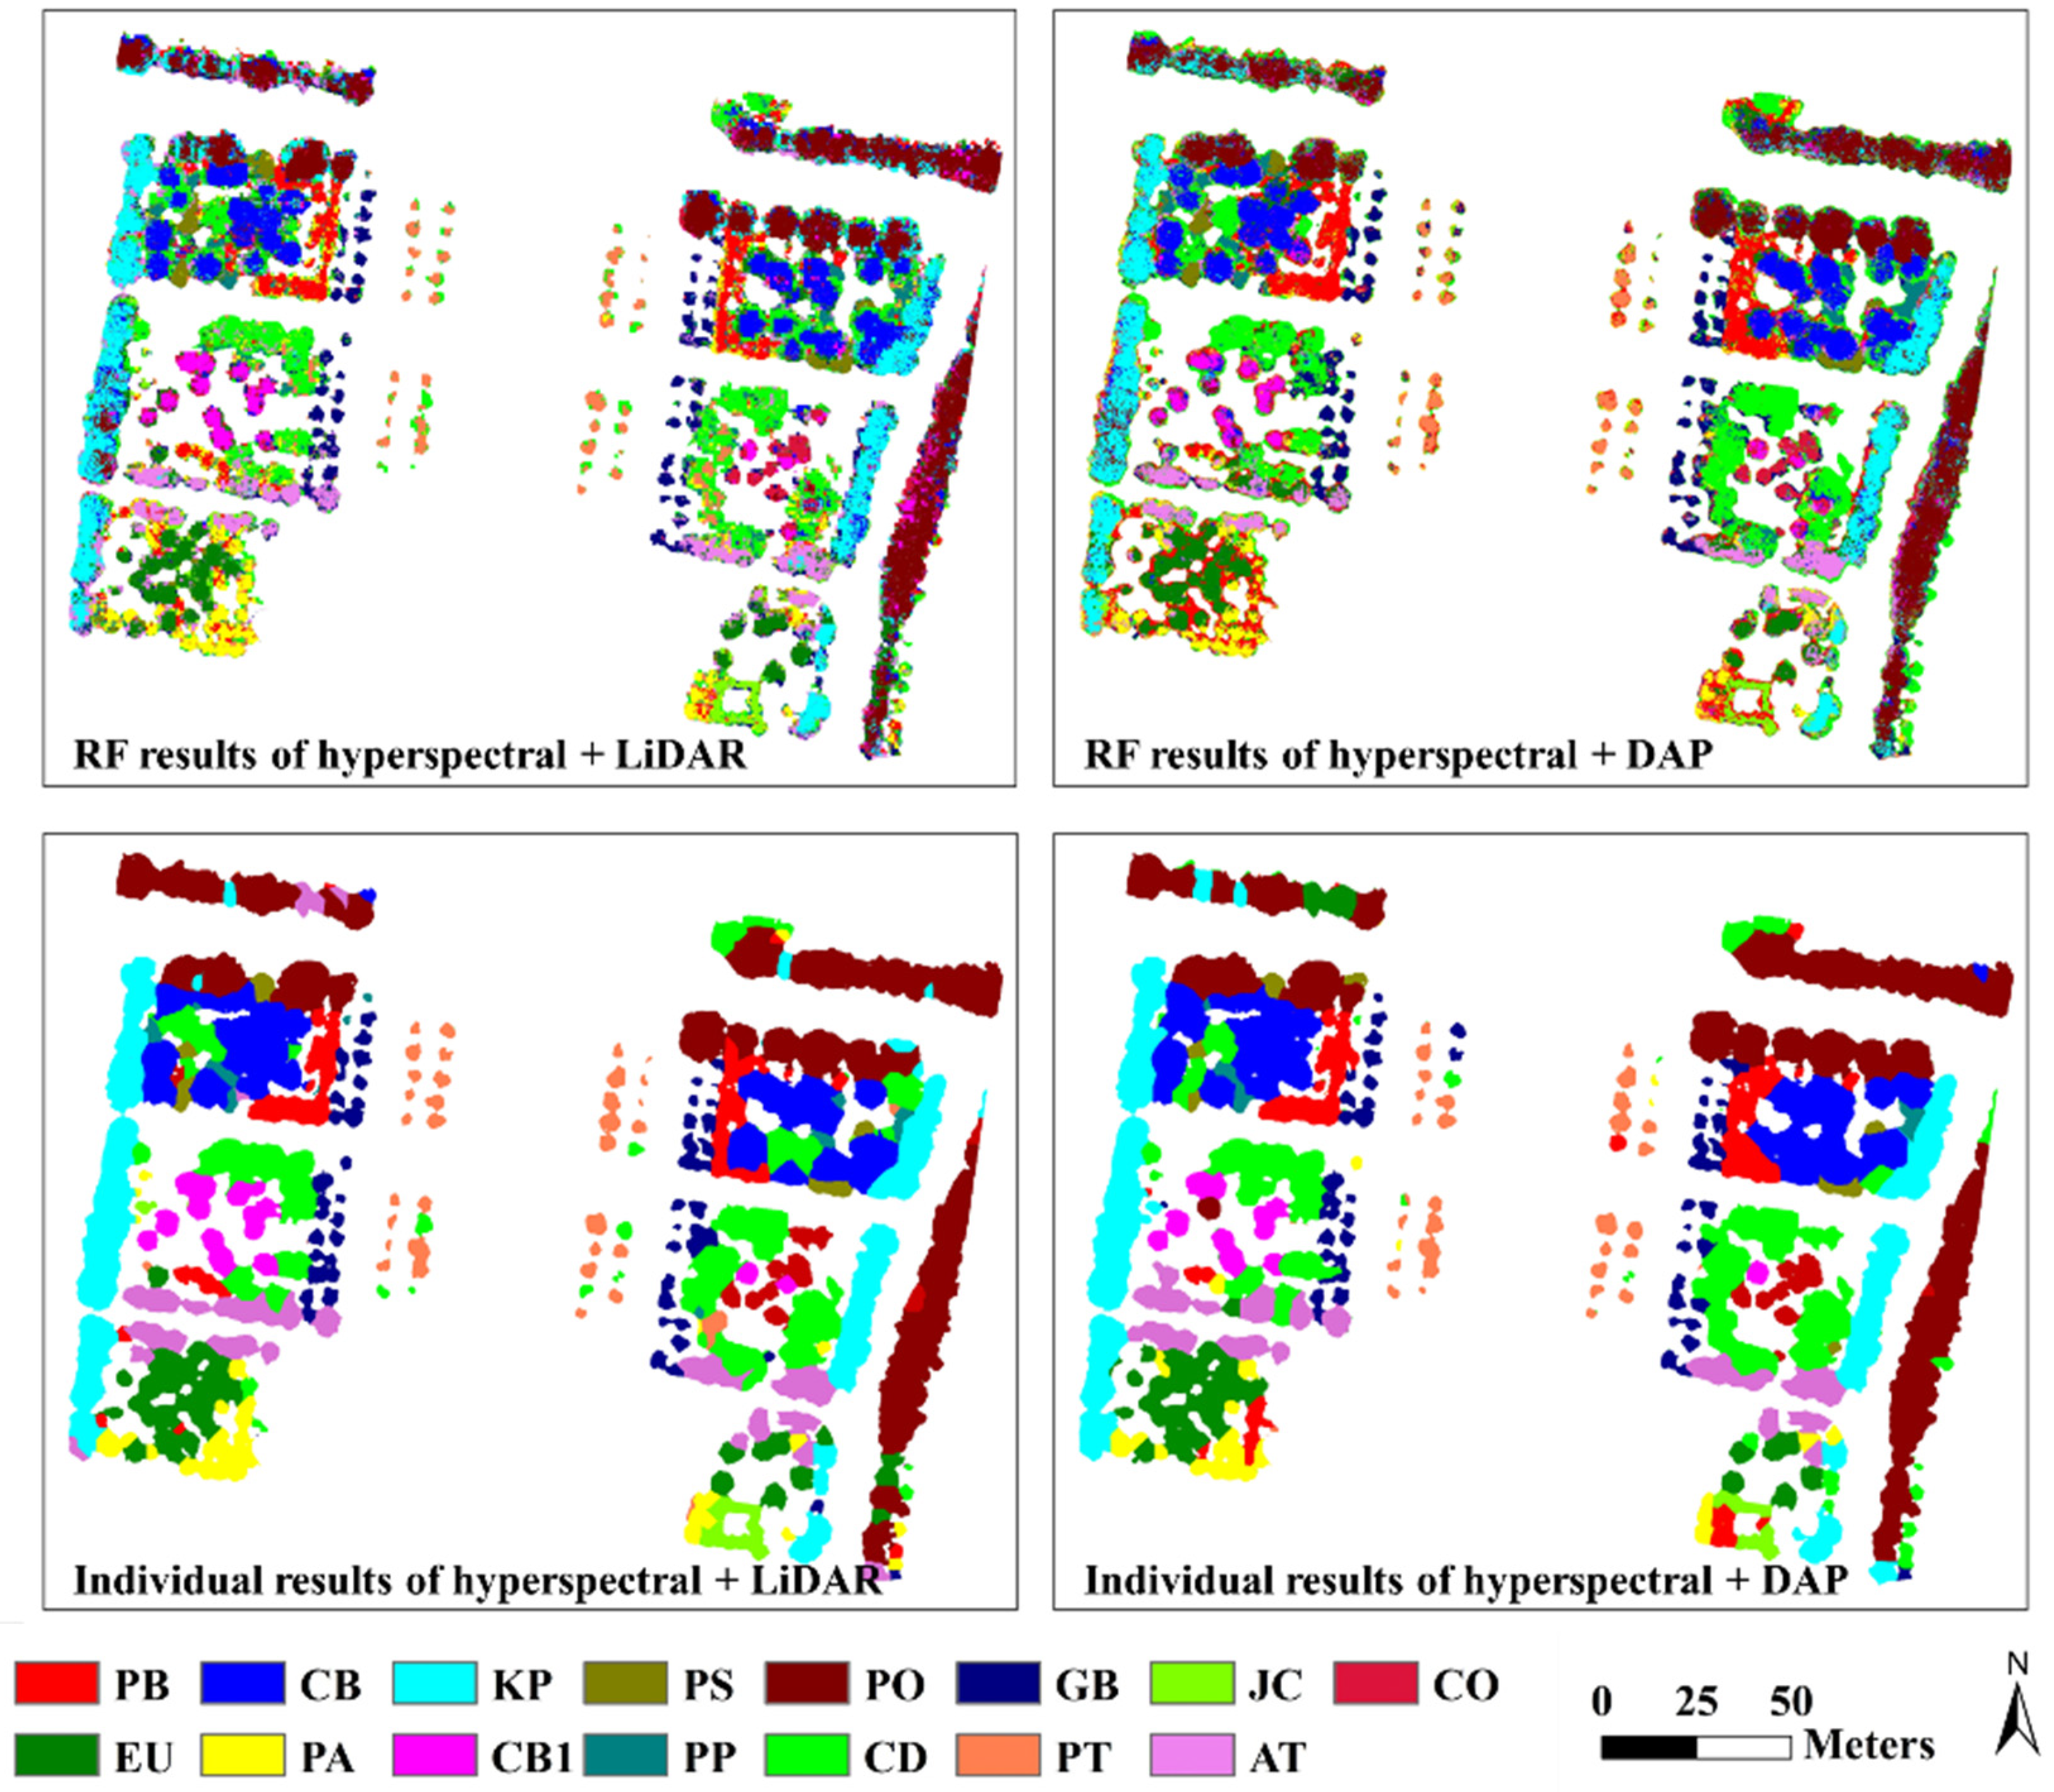
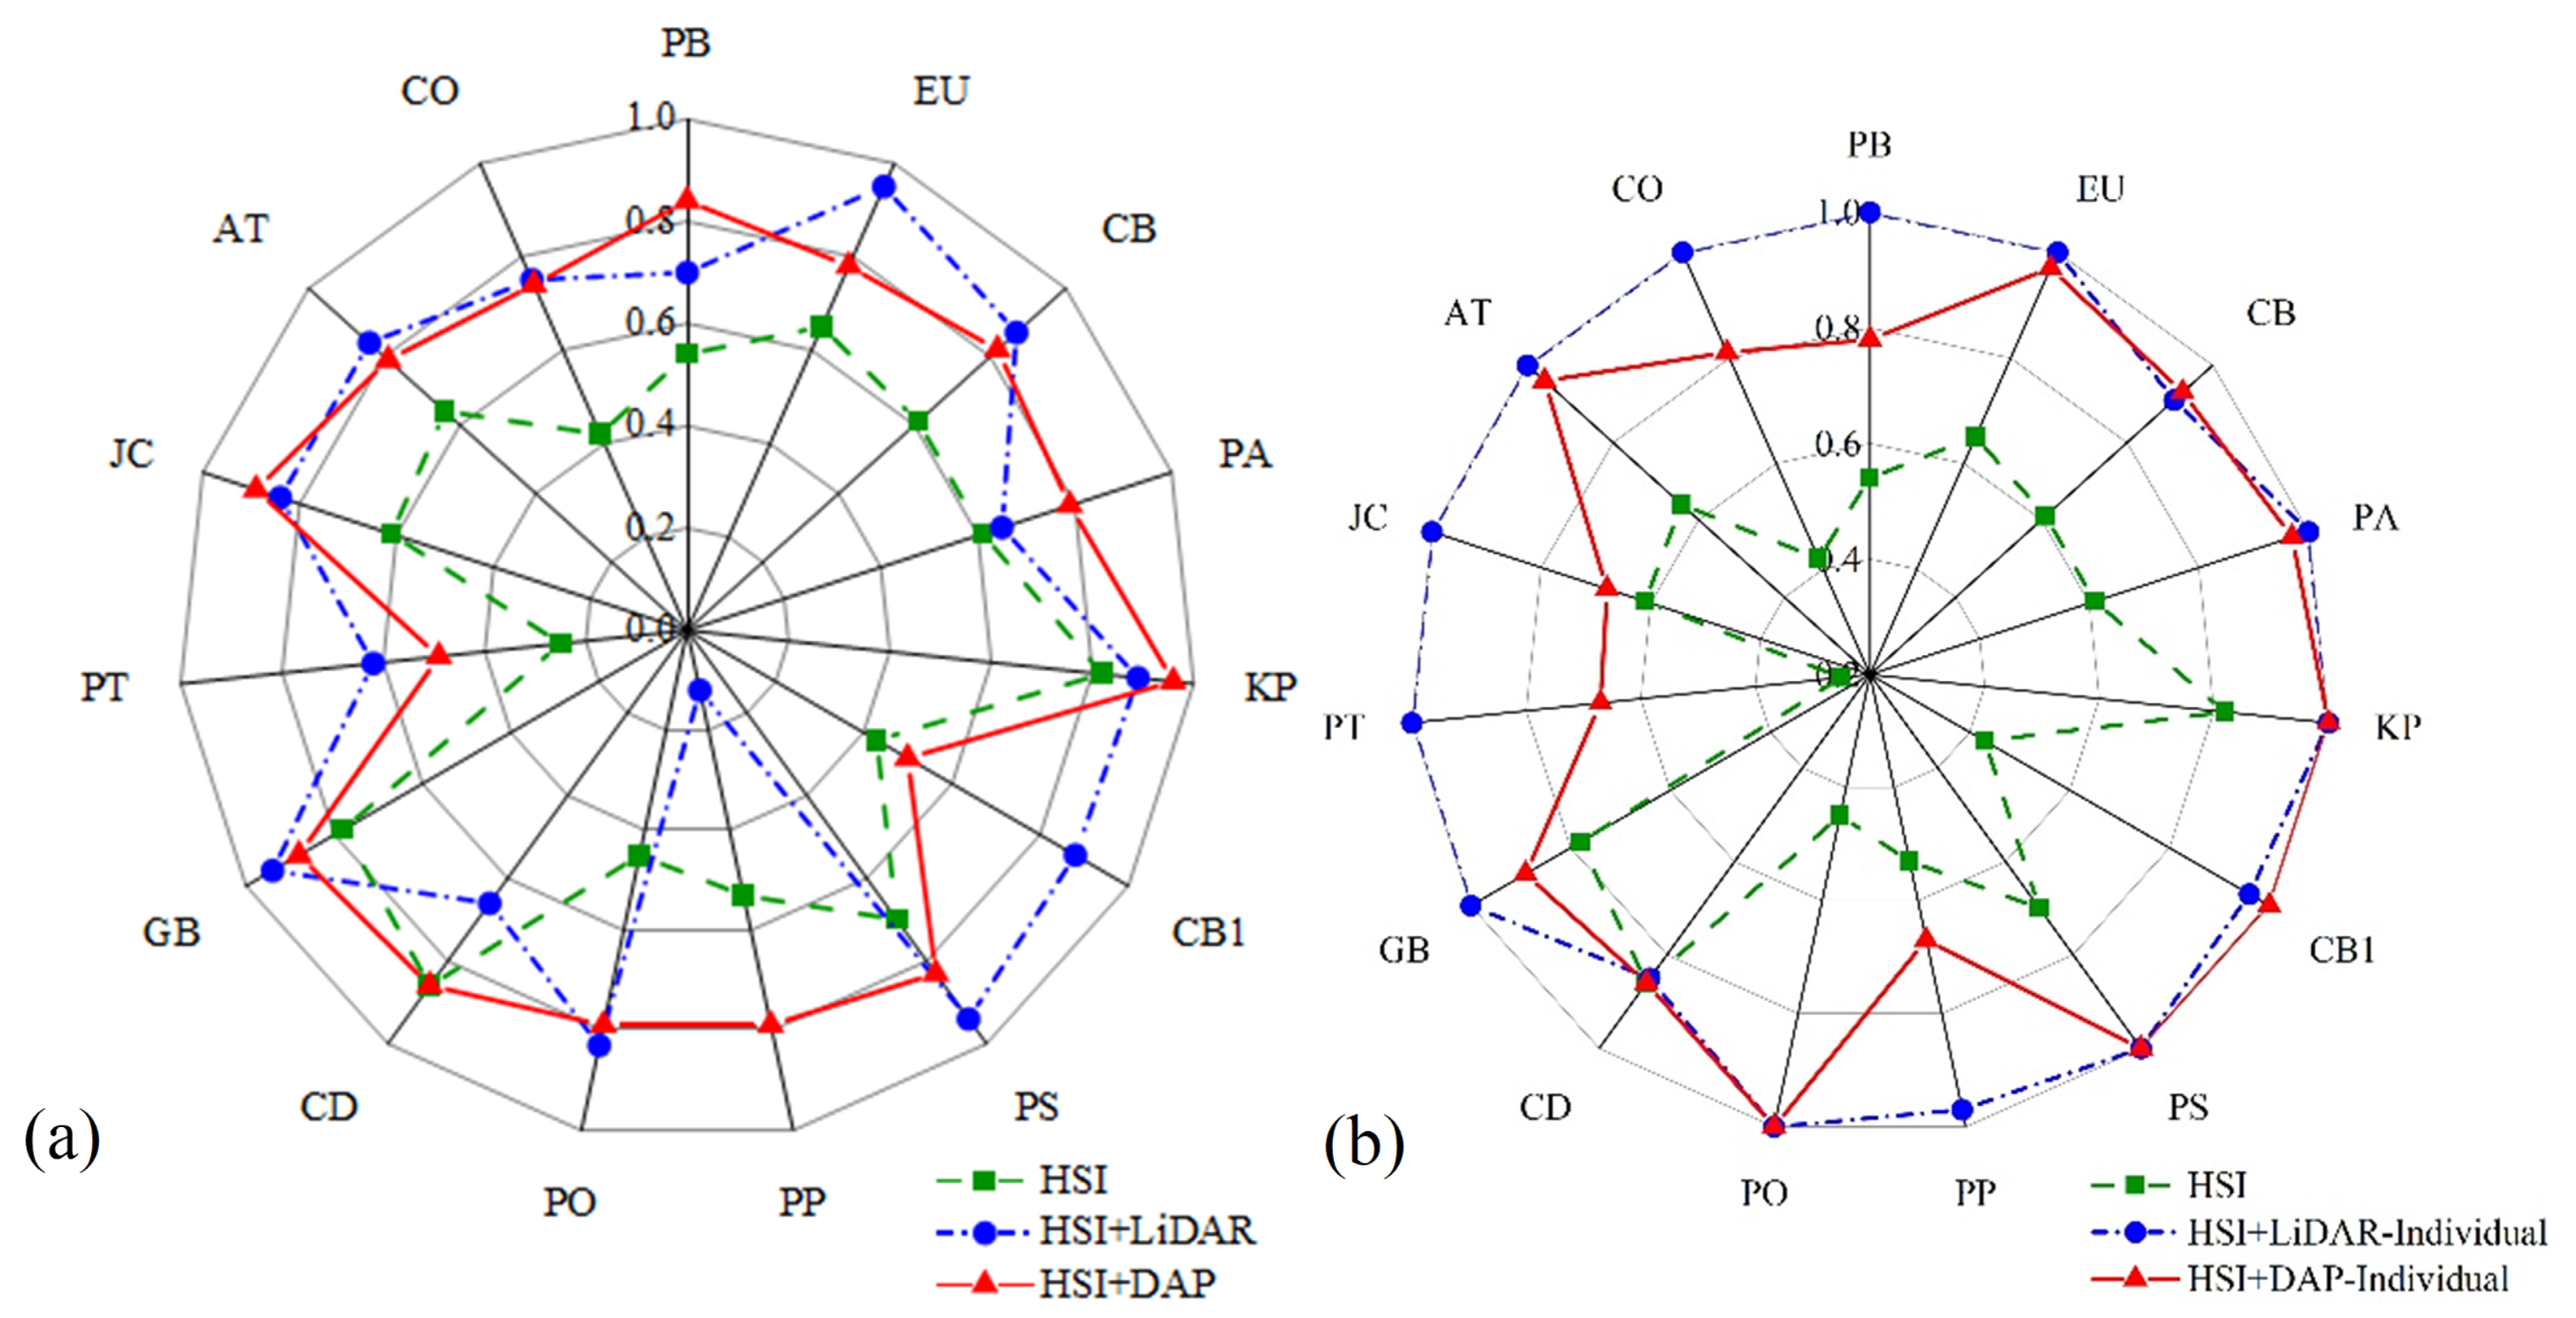
4.3. Improvement of UAV-DAP and UAV-Based LiDAR Data in Individual Tree Species Classification Fused with Hyperspectral Data

Compared with hyperspectral data alone, the fusion with DAP and LiDAR data has increased the overall accuracy of tree species classification at both pixel-level and individual tree level, but the gap between the performance of DAP and LiDAR data in tree species classification has been reduced. Figure 15 shows the improvement of UAV-based LiDAR and UAV-based photogrammetry in urban tree species classification fused with UAV hyperspectral data vividly. In terms of pixel-based classification, the overall accuracy of fused hyperspectral and DAP data is 80.61%, whereas that of fused hyperspectral and LiDAR data is 79.06%, the results are almost the same. However, in terms of individual tree species classification, the overall accuracy of fused hyperspectral and DAP data is 90.53%, whereas that of hyperspectral and LiDAR data is 95.98%, showing that LiDAR is much better than that of DAP when fused with hyperspectral data.
In terms of class-specific accuracy, compared with hyperspectral data alone, both the hyperspectral and DAP and hyperspectral and LiDAR data have increased the accuracy of all tree species at both pixel-level and individual tree level. In pixel-level classification, the combination of LiDAR and hyperspectral data performs much better in dealing with the following tree species: EU, CB1, PT, and PS, while hyperspectral + DAP data performs much better in tree species with significant spectral and texture differences, such as PB, PA, and PP (Figure 16a). At the individual tree level, the classification accuracy of hyperspectral and LiDAR data is generally much higher than that of hyperspectral and DAP data, especially for tree species with complex structures and significant differences in canopy morphology (Figure 16b). The F-score of multiple tree species in individual tree level has reached 1.00, such as EU, CB, GB, PT, and JC, which has also indicated the excellent performance of fused height and spectral information in tree species classification.

5. Discussion

5.1. Performance Comparison Between UAV-DAP and UAV-Based LiDAR Data in Individual Tree Segmentation

UAV-based LiDAR and UAV-DAP point cloud data have shown their excellent performance and been widely used in individual tree segmentation [7,19,20,21]. However, few have compared their performance in individual tree segmentation of urban areas. In this paper, the performance of UAV-based LiDAR data in individual tree segmentation is better than that of UAV-based photogrammetry, and the difference in F values between the two is 0.04. This is mainly because of the different characteristics of these two data. From Figure 4 and Figure 5, we can see that UAV-based LiDAR data have high point-cloud density, which can capture the detailed information of trees, especially the vertical structure and the crown boundary information, whereas UAV-based photogrammetry generates point clouds by high-resolution RGB stereo images, which cannot capture detailed information of urban trees as accurately as UAV-based LiDAR data. So, the CHM generated by UAV-based LiDAR data can capture the subtle boundaries between tree crowns much more clearly, thereby making individual tree segmentation much more accurate. On the contrary, UAV-based photogrammetry may fail to capture the detailed information of some tree crowns, which makes its performance not as good as that of UAV-based LiDAR data. The results are consistent with current research [31]. Liu et al. [31] have utilized three methods to segment individual trees, and the F value of individual tree segmentation with UAV-based LiDAR data is 0.13 higher than that of UAV-based photogrammetry. This is mainly because the UAV-based LiDAR data can not only provide detailed information of the trees’ surface but can also capture low and obstructed information of trees in complex forest canopies. However, many references have also indicated that the performance of UAV-DAP point cloud data is as robust as UAV-based LiDAR data in individual tree segmentation [33]. Iqbal et al. [33] have compared ALS and DAP point cloud data in individual tree detection of pine plantations, and the results indicate that UAV-based photogrammetry is as robust as UAV-based LiDAR data in individual tree segmentation. Goodbody et al. [67] have also pointed out that in the future, UAV-DAP can be an alternative technology in individual tree segmentations for UAV-based LiDAR due to its advantages of being cheap and efficient, and possessing high-precision, especially in the areas with high crown density. In conclusion, considering the cost factor, UAV-DAP is an optimal choice.

5.2. Performance Comparison Between UAV-DAP and UAV-Based LiDAR in Individual Tree Species Classification

As for tree species classification, many factors can affect the overall accuracy, such as the derived features, selected samples, and classification methods. Therefore, to compare the performance of UAV-DAP and UAV-based LiDAR data in urban tree species classification, the same samples and classification methods were used in this paper. Firstly, to explore the importance of derived features, many feature combinations were input into the random forest classifier with the same training samples. Then, based on the validation samples, the accuracy of the classification results was verified. For UAV-based photogrammetry, the performance of one vegetation index alone is much better than that of multiple vegetation indexes. This is mainly due to the lack of spectral information in RGB imagery. Besides this, the results have also indicated that the performance of texture features in tree species classification is much more excellent than that of spectral features. This is consistent with Qin et al. [68] and Liu [69]. Qin et al. [68] have proved that texture features are much more efficient in tree species classification than that of spectral, especially the features of variance and mean derived from the red band of RGB imagery. Liu [69] has also illustrated that the classification accuracy obtained with texture features is much higher than that of the spectral bands and DSMs. As for the height information, lots of references have proved its excellent performance in tree species classification. Mao et al. [10] have found that canopy height from LiDAR data is the most important factor in vascular plant species classification. Carbonell-Rivera et al. [70] have proved that the 3D information of UAV-DAP points clouds can provide accurate results in tree species classification. So, our study results have illustrated that the height information from DAP data is as robust as LiDAR data in tree species classification. However, due to the lack of spectral information, the classification accuracy of LiDAR data is much lower than that of DAP data in our study.
The optimal window size for texture generation is 9 × 9, mainly due to reasons such as the fact that the derived texture features can be affected by many factors, such as shadows and gaps among leaves. If the texture generation window size is too small, the obtained texture features might be unstable. Then, with the increasing of the texture window size, the impact caused by the above factors will weaken gradually, which can further capture much more comprehensive and stable texture information. When the texture window size reaches 9 × 9, we can capture both local and whole texture information about the tree crown simultaneously. Therefore, the tree species classification accuracy is the highest. However, as the window size continues to increase, local details may be excessively smoothed, resulting in the loss of local texture features. Meanwhile, the excessively large window size might include multiple tree species, leading to a decrease in classification accuracy. These results can be compared with Liu [69]. Liu [69] has pointed that texture extraction window size can significantly influence the classification accuracy. Therefore, an appropriate texture extraction window size is very important in urban tree species classification. When the texture extraction window size is too small, the classification accuracy is low, while with the increasing of texture extraction window size, the classification accuracy can increase to 91.52%, but it will decline on the contrary when the texture extraction window is too large. Gini et al. [4] have generated texture features using Gray Level Co-occurrence Matrix with different window sizes to determine the optimal window size. The results have proved that the use of texture features can improve the overall accuracy significantly, and the window size of 21 and 27 is chosen for the following study. Feng et al. [71] have also proved that there is an inverted U relationship between the overall accuracy and the texture generation window size. Our results are also compared with Rösch et al. [72], who have compared PlanetScope and sentinel-2 imagery for mapping mountain pines with different texture generation window size. The results indicate that the overall accuracy has been significantly improved with the increasing texture window size but decreased in wave when the texture window size is larger than 87 m. Although the optimal window size for texture generation is not the same as our study and the data sources are not the same too, the trend of the overall accuracy with the increasing window size is almost the same. This is mainly because the spatial resolution and study area are not the same, which has affected the chosen window size.
As for the cell size of LiDAR features, when the cell size is too small, it probably includes noise and sparsity, which is prone to having more invalid values inside the crown, thereby affecting the classification accuracy. Additionally, it is also difficult to capture the characteristic information of the whole tree crown. Therefore, the accuracy of tree species classification is significantly improved with the increasing of the cell size. However, considering the best balance between the effectiveness and stability of feature extraction, the 1 m×1 m cell size is chosen for the following experiment, as it can better integrate the internal and external features of urban trees, which can further improve the classification accuracy.
As for the DAP or LiDAR data, many studies have illustrated their excellent performance in forest inventory [69,70,73,74]. However, most of them are mainly focused on individual tree segmentation and structural parameters extraction. Few studies have conducted their comparative experiment on individual tree species classification in areas with lots of tree species, especially the urban areas. In this paper, the results have illustrated that the performance of DAP is better than that of LiDAR data. DAP data can not only provide height information, but can also provide spectral information, which has made it much more efficient than LiDAR in tree species classification. However, until now, many studies have explored the performance of LiDAR data alone in tree species classification [73,74,75]; few studies have explored the performance of DAP in tree species classification [70,76], not to mention the comparison of the two in tree species classification. Therefore, it is worth conducting this study to compare their performance in urban tree species classification of urban areas.

5.3. The Improvement of UAV-DAP and UAV-Based LiDAR Data in Individual Tree Species Classification Fused with UAV Hyperspectral Data

The fusion of spectral and structural information is very efficient in tree species classification. Until now, most studies mainly focused on the fusion of UAV hyperspectral and UAV LiDAR data, and few studies have been conducted on the fusion of UAV hyperspectral and UAV-based photogrammetry. As for the fusion of UAV hyperspectral and LiDAR data, this paper has fused them in urban tree species classification with an overall accuracy of 95.98%, which has been improved by 33.28% when compared with UAV hyperspectral data alone. These results are consistent with Ma et al. [77] and Wang et al. [17]. Ma et al. [77] fused UAV hyperspectral and LiDAR data in tree species classification of natural secondary forests with an overall accuracy of 84.00%. Wang et al. [17] fused them to classify five tree species in a forest with an overall accuracy of 78.81%. Compared with hyperspectral data alone, their fusion has improved the overall accuracy by 15.00% and 5.03%, respectively. As for the fusion of UAV hyperspectral and DAP data, this paper has fused them in urban tree species classification with an overall accuracy of 90.53%, which has been improved by 27.83% when compared with UAV hyperspectral data alone. These results are consistent with Nevalainen et al. [19], Tuominen et al. [26], and Sothe et al. [24]. They have all fused hyperspectral and DAP data to classify tree species with a high overall accuracy. In summary, both UAV-based LiDAR and UAV-based photogrammetry could provide structural information and, therefore, can improve the overall accuracy of tree species classification. Although no studies have been conducted on this comparison, the results are consisted with our previous conclusion that UAV-based photogrammetry is as robust as UAV-based LiDAR data no matter the individual tree segmentation or tree species classification. Therefore, the UAV high-resolution image method is recommended on individual tree species classification in the future, which can greatly save on costs while still ensuring accuracy.

5.4. Limitations and Future Work

Although we have compared the performance of UAV-DAP and UAV-based LiDAR data in tree species classification and their improvement when fused with hyperspectral data, there are still following limitations: (1) The LiDAR features have not been fully explored. In our study, only the elevation and intensity features were used in tree species classification. However, other features that may help improve classification accuracy have not been fully explored, such as skewness and kurtosis. Therefore, future research can further improve classification accuracy by introducing more LiDAR features and feature importance analysis. (2) Although this study demonstrated the advantages of LiDAR and DAP data in individual tree species classification, only the two-dimensional classification was performed, ignoring the three-dimensional information of point clouds. However, in urban environments, the distinct three-dimensional characteristics of canopy morphology and spatial distribution are very important, while the three-dimensional point cloud data may provide much richer spatial information. Therefore, future research should consider tree species classification in three-dimensional space to improve the classification accuracy and robustness. (3) The study area is relatively small, which to some extent limits the widespread application of the research results. Future research can be extended to much larger areas to verify applicability in different environments, especially in areas with high ecological and tree species diversity. (4) Although the fusion of hyperspectral data with LiDAR and DAP data was also conducted in our study, there is still much room for further improvement in data fusion. In the future, more fusion strategies should be considered, such as multi-temporal data fusion, to further improve the accuracy and stability of tree species classification. (5) There is relatively little discussion on the cost–benefit analysis. We just compared the costs of data acquisition and processing between UAV-based photogrammetry and UAV-based LiDAR subjectively, including the expenses that related to equipment procurement, flight operations, and data processing. Overall, DAP is much more convenient and cost-effective than LiDAR. With the development of unmanned aerial vehicles and remote sensing technology, the data processing strategies and the spectral information will be further optimized in the future to make them more suitable for diverse urban forest monitoring needs.

6. Conclusions

This study systematically evaluates the performance of UAV-based photogrammetry and UAV-based LiDAR data in three critical aspects of urban forest inventory: individual tree segmentation, individual tree species classification, and their fusion with hyperspectral data. The findings provide actionable insights to advance precision forestry and biodiversity monitoring with the following key conclusions:
(1)
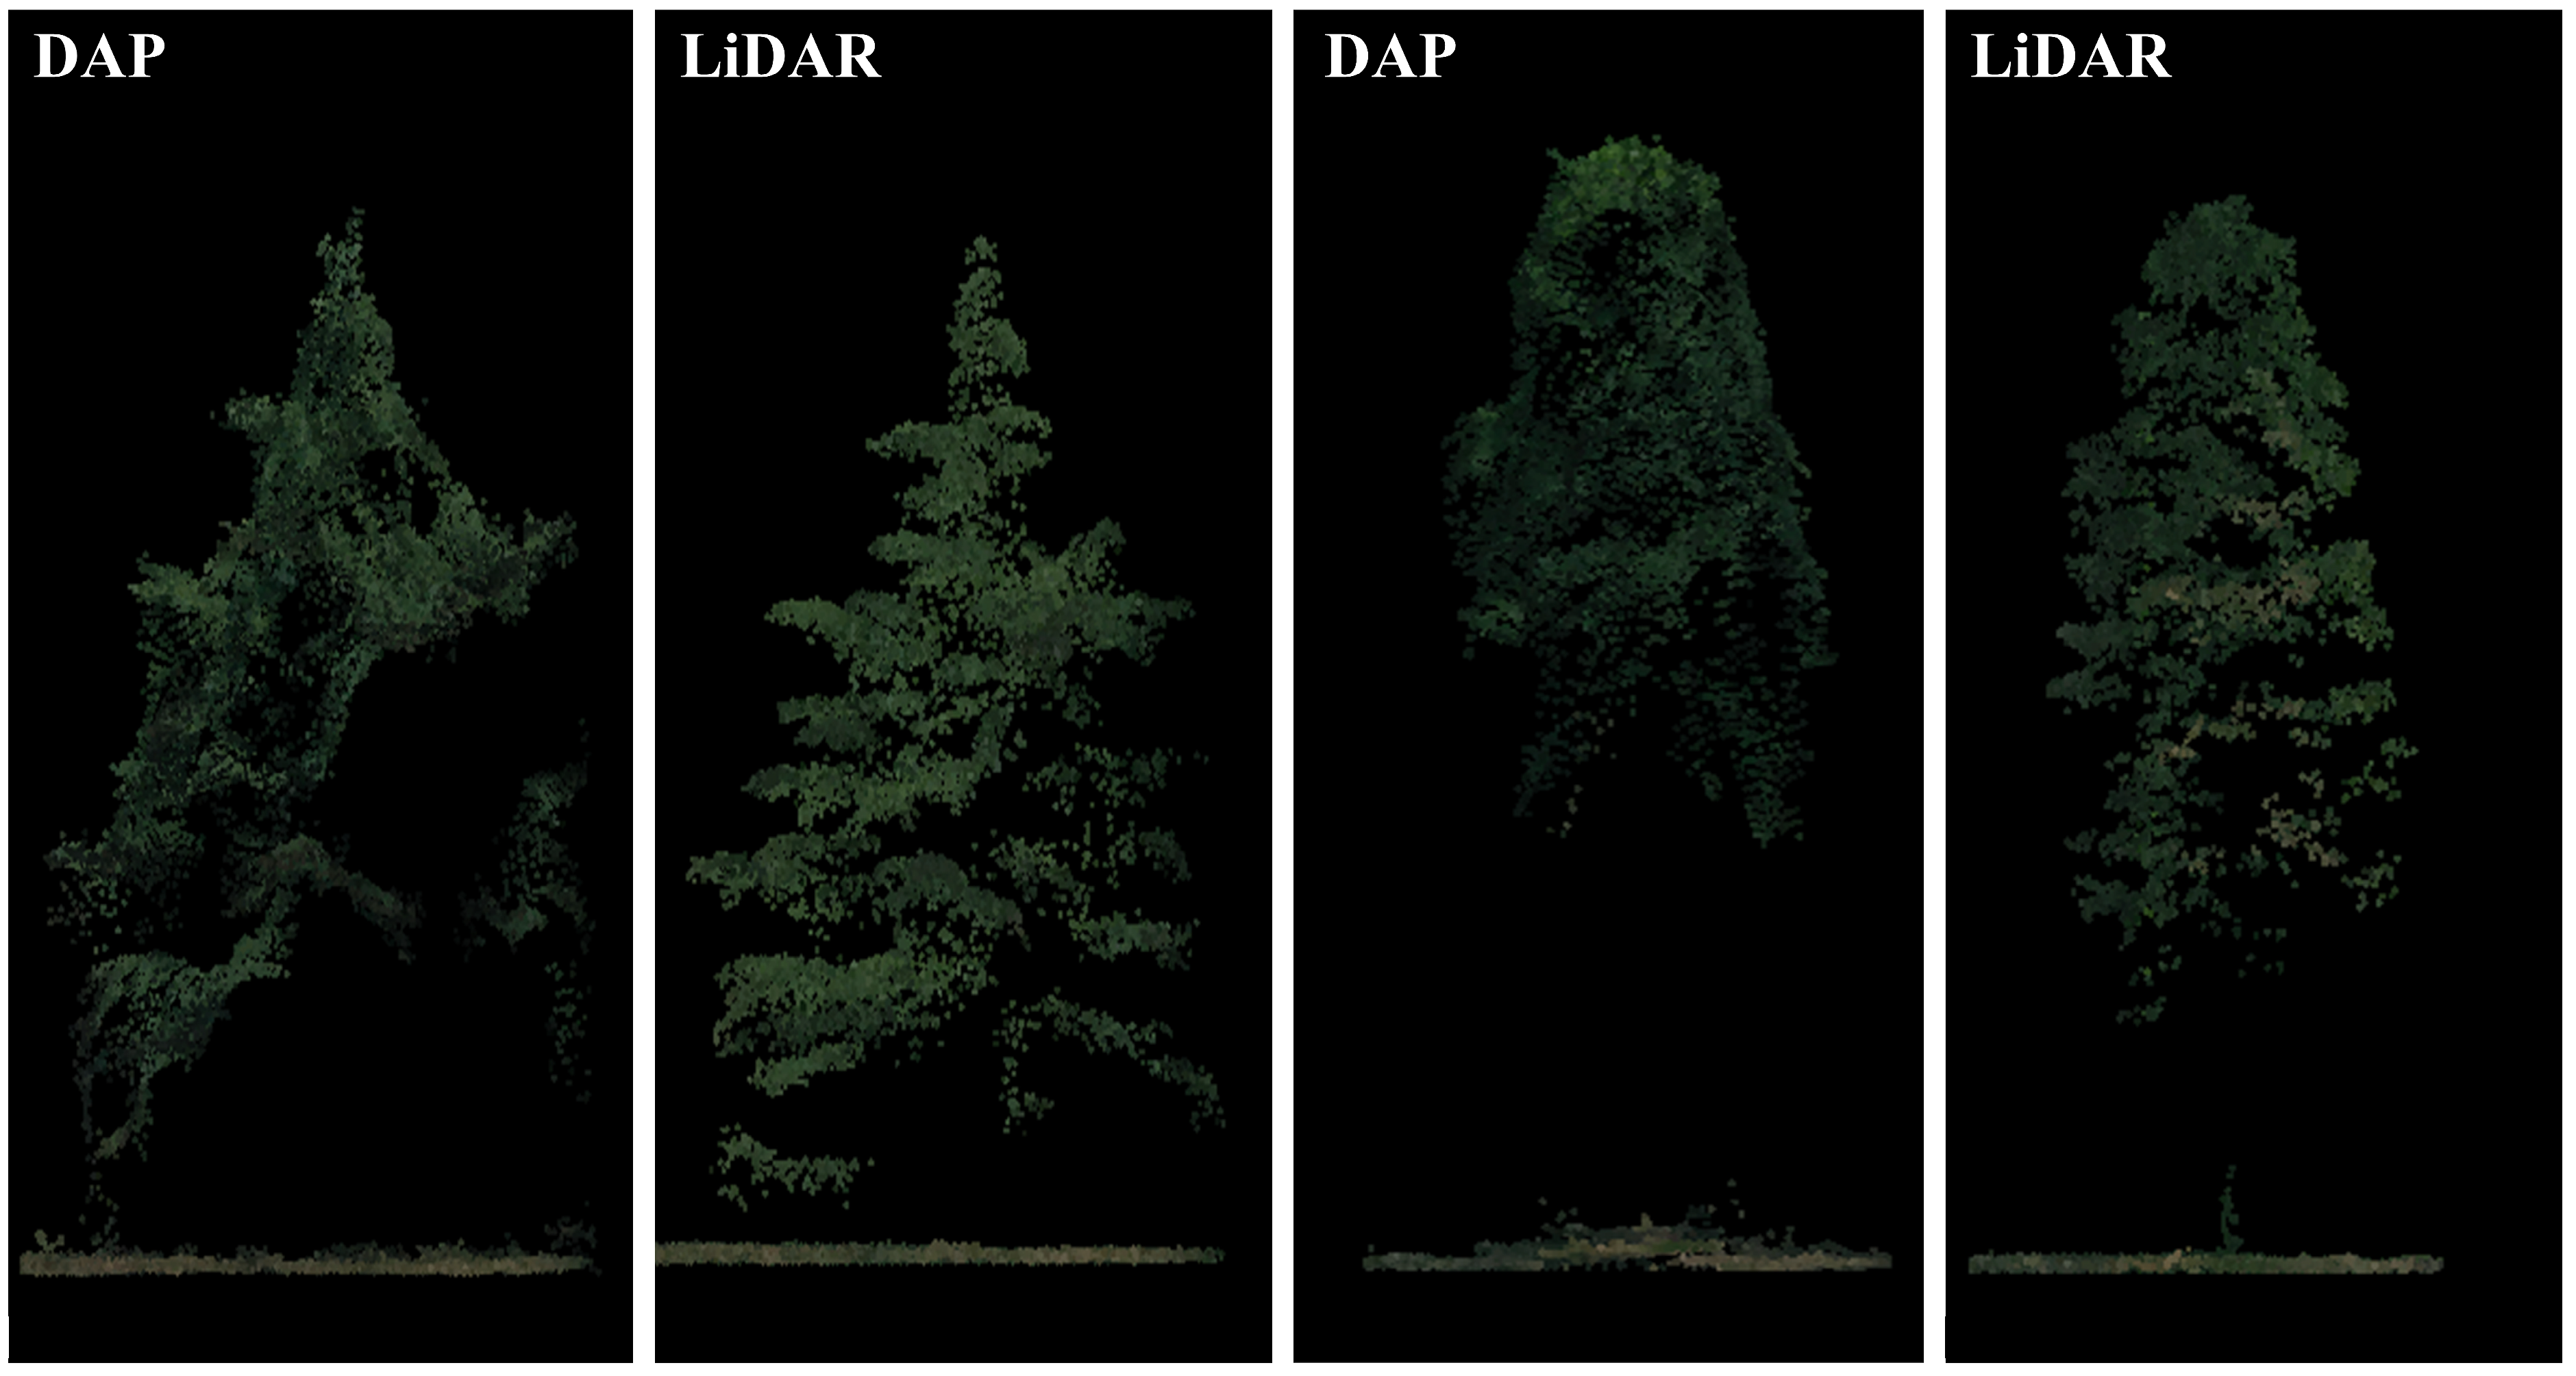
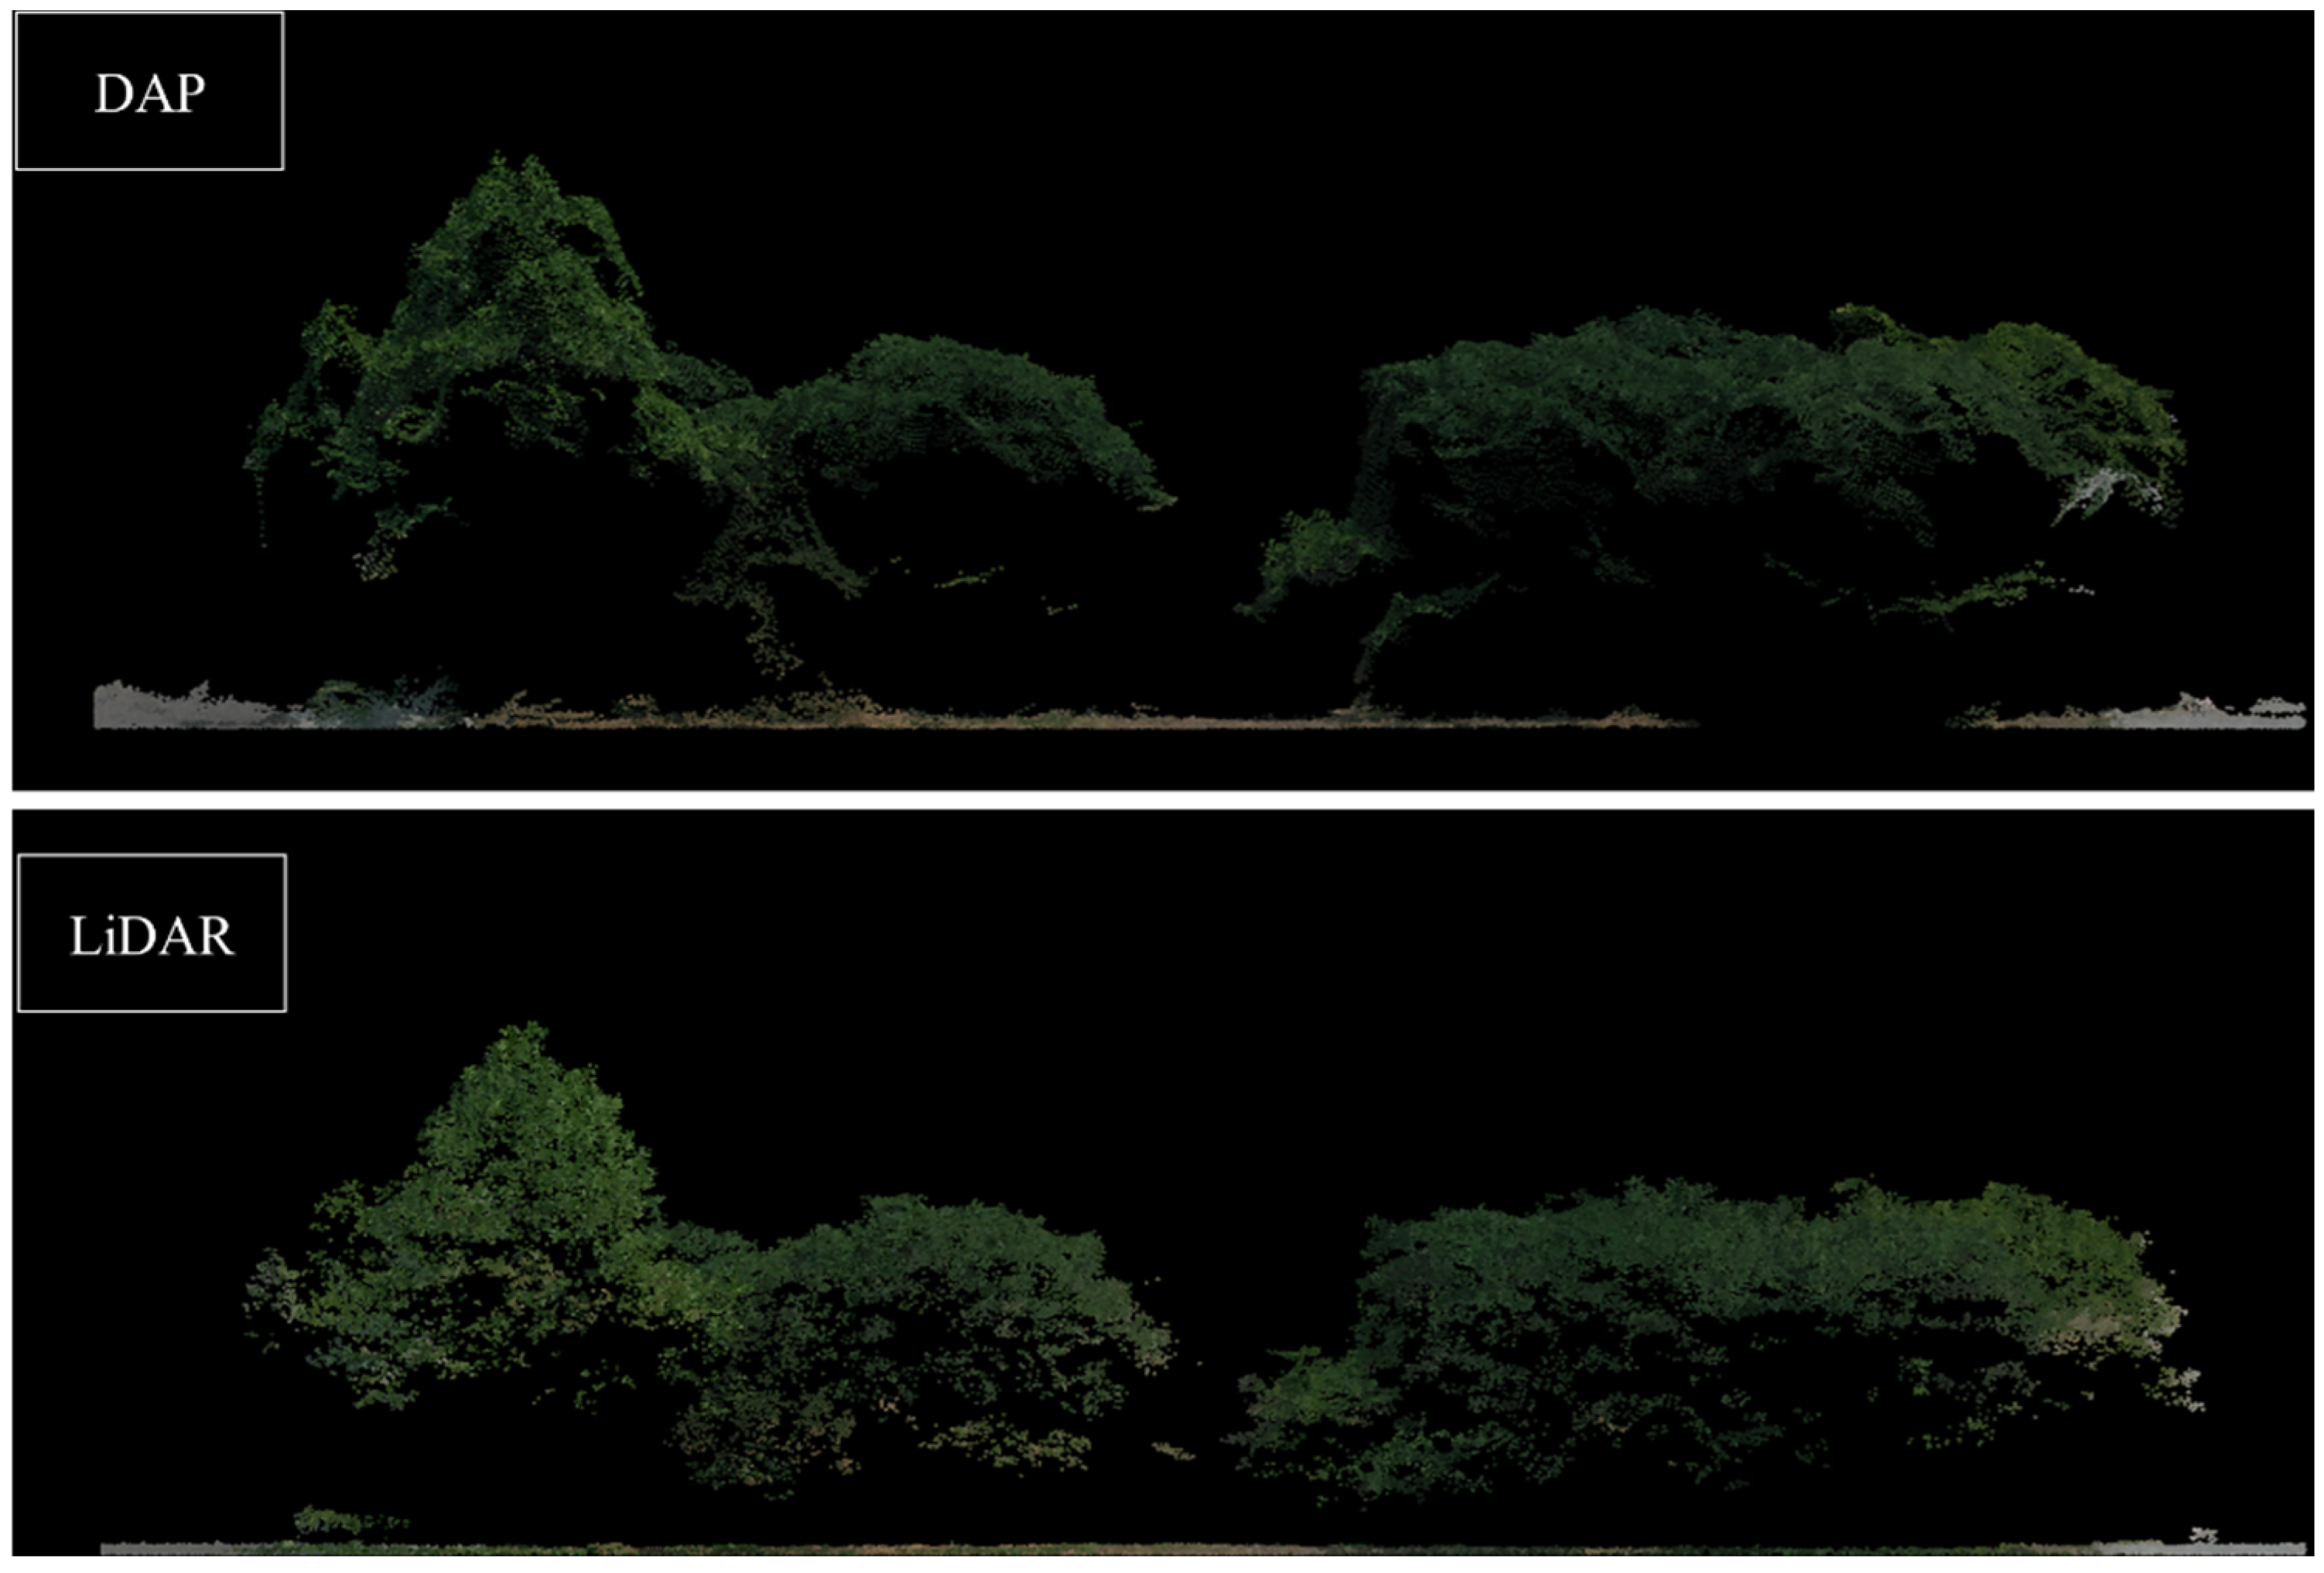
Structural Superiority of UAV-based LiDAR: UAV-based LiDAR data outperformed UAV-based photogrammetry in individual tree segmentation (F-score 0.83 vs. 0.79) due to its ability to penetrate dense canopies and reconstruct understory morphology (e.g., low trees growing adjacent to taller trees). This demonstrates LiDAR’s unique advantage in capturing three-dimensional architectural details within complex urban forest environments.
(2)
Spectral-Textural Advantage of UAV-based Photogrammetry: The overall accuracy of DAP in pixel-level tree species classification is 16.5% higher than that of LiDAR by integrating RGB-derived spectral indices (e.g., DEVI) and optimized texture features (9×9 GLCM window). This highlights its cost-effectiveness for spectral-driven tasks in urban forest inventory.
(3)
Multi-Sensor Fusion Breakthrough: Hyperspectral-LiDAR fusion achieved superior individual tree classification accuracy (95.98%) compared to hyperspectral DAP (90.53%), demonstrating the synergistic value of combining LiDAR’s structural precision with hyperspectral richness. This approach is particularly effective for species with subtle spectral variations but distinct three-dimensional morphology.
(4)
Suggestions: LiDAR should prioritize applications requiring vertical structural fidelity (e.g., carbon stock estimation), while DAP suits large-scale spectral-textural mapping tasks (e.g., biodiversity surveys). DAP should also be adopted as a cost-effective alternative in budget-constrained programs, balancing its high precision with operational affordability. As for budget-constrained urban forestry programs, UAV-DAP can be a cost-effective alternative by balancing its high precision with operational affordability.
(5)
Future Directions: Expanded validation finds should be conducted in urban areas with higher species diversity and complex understory conditions to assess the generality of these conclusions.

Author Contributions

Conceptualization, Q.M.; methodology, Q.M. and H.L.; software, J.W. and C.L.; validation, J.W. and C.L.; formal analysis, B.Z., X.Y. and Q.Y.; investigation, P.D., B.Z. and X.Y.; resources, Q.M.; data curation, Q.M., B.Z. and X.Y.; writing—original draft preparation, Q.M.; writing—review and editing, Q.M., P.D., B.Z., X.Y., H.L., C.H., C.Z. and Z.T.; visualization, J.W.; supervision, Q.M. and P.D.; project administration, Q.M. and funding acquisition, Q.M. All authors have read and agreed to the published version of the manuscript.

Funding

This work was funded by the National Natural Science Foundation of China (No. 42101337), National Key R&D Program of China (No. 2022YFC3800700), the Shandong Provincial Natural Science Foundation (Nos. ZR2020QD019, ZR2020MD019), and Jinan City-School Integration Project (JNSX2023036).

Data Availability Statement

The DAP datasets is available at: https://pan.baidu.com/s/1ERJPgXASx8usH3-IDiu4eQ?pwd=9dec (accessed on 13 July 2023); The LiDAR datasets is available at: https://pan.baidu.com/s/1F0h5AnyjAqBTI7-_5bU0Zw?pwd=w19j (accessed on 26 May 2023).

Conflicts of Interest

The authors declare no conflicts of interest. The funding sponsors had no role in the design of the study; in the collection, analyses, or interpretation of data; in the writing of the manuscript, and in the decision to publish the results.

References

  1. Piiroinen, R.; Fassnacht, F.E.; Heiskanen, J.; Maeda, E.; Mack, B.; Pellikka, P. Invasive tree species detection in the eastern arc mountains biodiversity hotspot using one class classification. Remote Sens. Environ. 2018, 218, 119–131. [Google Scholar] [CrossRef]
  2. Fassnacht, F.E.; Latifi, H.; Stereńczak, K.; Modzelewska, A.; Lefsky, M.; Waser, L.T.; Straub, C.; Ghosh, A. Review of studies on tree species classification from remotely sensed data. Remote Sens. Environ. 2016, 186, 64–87. [Google Scholar] [CrossRef]
  3. Axelsson, A.; Lindberg, E.; Olsson, H. Exploring multispectral ALS data for tree species classification. Remote Sens. 2018, 10, 183. [Google Scholar] [CrossRef]
  4. Gini, R.; Sona, G.; Ronchetti, G.; Passoni, D.; Pinto, L. Improving tree species classification using UAS multispectral images and texture measures. ISPRS Int. J. Geo-Inf. 2018, 7, 315. [Google Scholar] [CrossRef]
  5. Wallace, L.; Lucieer, A.; Watson, C.S. Evaluating tree detection and segmentation routines on very high resolution UAV LiDAR data. IEEE Trans. Geosci. Remote Sens. 2014, 52, 7619–7628. [Google Scholar] [CrossRef]
  6. Guerra-Hernández, J.; Cosenza, D.N.; Rodriguez, L.C.E.; Silva, M.; Tomé, M.; Díaz-Varela, R.A.; González-Ferreiro, E. Comparison of ALS- and UAV(SfM)-derived high-density point clouds for individual tree detection in Eucalyptus plantations. Int. J. Remote Sens. 2018, 39, 5211–5235. [Google Scholar] [CrossRef]
  7. Chen, Q.; Gao, T.; Zhu, J.; Wu, F.; Li, X.; Lu, D.; Yu, F. Individual tree segmentation and tree height estimation using leaf-off and leaf-on UAV-LiDAR data in dense deciduous forests. Remote Sens. 2022, 14, 2787. [Google Scholar] [CrossRef]
  8. Simonson, W.D.; Allen, H.D.; Coomes, D.A. Use of an airborne Lidar system to model plant species composition and diversity of mediterranean oak forests. Conserv. Biol. 2012, 26, 840–850. [Google Scholar] [CrossRef]
  9. Vaglio Laurin, G.; Puletti, N.; Chen, Q.; Corona, P.; Papale, D.; Valentini, R. Above ground biomass and tree species richness estimation with airborne lidar in tropical Ghana forests. Int. J. Appl. Earth Obs. Geoinf. 2016, 52, 371–379. [Google Scholar] [CrossRef]
  10. Mao, L.; Dennett, J.; Bater, C.W.; Tompalski, P.; Coops, N.C.; Farr, D.; Kohler, M.; White, B.; Stadt, J.J.; Nielsen, S.E. Using airborne laser scanning to predict plant species richness and assess conservation threats in the oil sands region of Alberta’s boreal forest. For. Ecol. Manag. 2018, 409, 29–37. [Google Scholar] [CrossRef]
  11. Korpela, I.; Ørka, H.; Maltamo, M.; Tokola, T.; Hyyppä, J. Tree species classification using airborne LiDAR—Effects of stand and tree parameters, downsizing of training set, intensity normalization, and sensor type. Silva Fenn. 2010, 44, 319–339. [Google Scholar]
  12. Hovi, A.; Korhonen, L.; Vauhkonen, J.; Korpela, I. LiDAR waveform features for tree species classification and their sensitivity to tree- and acquisition related parameters. Remote Sens. Environ. 2016, 173, 224–237. [Google Scholar]
  13. Holmgren, J.; Persson, Å.; Soderman, U. Species identification of individual trees by combining high resolution LiDAR data with multi-spectral images. Int. J. Remote Sens. 2008, 29, 1537–1552. [Google Scholar]
  14. Heinzel, J.; Koch, B. Investigating multiple data sources for tree species classification in temperate forest and use for single tree delineation. Int. J. Appl. Earth Obs. Geoinf. 2012, 18, 101–110. [Google Scholar]
  15. Cho, M.A.; Mathieu, R.; Asner, G.P.; Naidoo, L.; van Aardt, J.; Ramoelo, A.; Debba, P.; Wessels, K.; Main, R.; Smit, I.P.J.; et al. Mapping tree species composition in South African savannas using an integrated airborne spectral and LiDAR system. Remote Sens. Environ. 2012, 125, 214–226. [Google Scholar]
  16. Sedliak, M.; Sačkov, I.; Kulla, L. Classification of tree species composition using a combination of multispectral imagery and airborne laser scanning data. Cent. Eur. For. J. 2017, 63, 1–9. [Google Scholar]
  17. Wang, B.; Liu, J.; Li, J.; Li, M. UAV LiDAR and hyperspectral data synergy for tree species classification in the maoershan forest farm region. Remote Sens. 2023, 15, 1000. [Google Scholar] [CrossRef]
  18. Isibue, E.W.; Pingel, T.J. Unmanned aerial vehicle based measurement of urban forests. Urban For. Urban Green. 2020, 48, 126574. [Google Scholar]
  19. Nevalainen, O.; Honkavaara, E.; Tuominen, S.; Viljanen, N.; Hakala, T.; Yu, X.; Hyyppä, J.; Saari, H.; Pölönen, I.; Imai, N.; et al. Individual tree detection and classification with UAV-Based photogrammetric point clouds and hyperspectral imaging. Remote Sens. 2017, 9, 185. [Google Scholar] [CrossRef]
  20. Fawcett, D.; Azlan, B.; Hill, T.C.; Kho, L.K.; Bennie, J.; Anderson, K. Unmanned aerial vehicle (UAV) derived structure-from-motion photogrammetry point clouds for oil palm (Elaeis guineensis) canopy segmentation and height estimation. Int. J. Remote Sens. 2019, 40, 7538–7560. [Google Scholar]
  21. Nuijten, R.J.G.; Coops, N.C.; Goodbody, T.R.H.; Pelletier, G. Examining the multi-seasonal consistency of individual tree segmentation on deciduous stands using digital aerial photogrammetry (DAP) and unmanned aerial systems (UAS). Remote Sens. 2019, 11, 739. [Google Scholar] [CrossRef]
  22. Karpina, M.; Jarząbek-Rychard, M.; Tymków, P.; Borkowski, A. UAV-Based automatic tree growth measurement for biomass estimation. ISPRS Int. Arch. Photogramm. Remote Sens. Spatial Inf. Sci. 2016, 41, 685–688. [Google Scholar]
  23. Xu, Z.; Shen, X.; Cao, L.; Coops, N.C.; Goodbody, T.R.H.; Zhong, T.; Zhao, W.; Sun, Q.; Ba, S.; Zhang, Z.; et al. Tree species classification using UAS-based digital aerial photogrammetry point clouds and multispectral imageries in subtropical natural forests. Int. J. Appl. Earth Obs. Geoinf. 2020, 92, 102173. [Google Scholar] [CrossRef]
  24. Sothe, C.; Dalponte, M.; Almeida, C.M.D.; Schimalski, M.B.; Lima, C.L.; Liesenberg, V.; Miyoshi, G.T.; Tommaselli, A.M.G. Tree species classification in a highly diverse subtropical forest integrating UAV-Based photogrammetric point cloud and hyperspectral data. Remote Sens. 2019, 11, 1338. [Google Scholar] [CrossRef]
  25. Sothe, C.; De Almeida, C.M.; Schimalski, M.B.; La Rosa, L.E.C.; Castro, J.D.B.; Feitosa, R.Q.; Dalponte, M.; Lima, C.L.; Liesenberg, V.; Miyoshi, G.T.; et al. Comparative performance of convolutional neural network, weighted and conventional support vector machine and random forest for classifying tree species using hyperspectral and photogrammetric data. GISci. Remote Sens. 2020, 57, 369–394. [Google Scholar] [CrossRef]
  26. Tuominen, S.; Näsi, R.; Honkavaara, E.; Balazs, A.; Hakala, T.; Viljanen, N.; Pölönen, I.; Saari, H.; Ojanen, H. Assessment of classifiers and remote sensing features of hyperspectral imagery and stereo-photogrammetric point clouds for recognition of tree species in a forest area of high species diversity. Remote Sens. 2018, 10, 714. [Google Scholar] [CrossRef]
  27. Ganz, S.; Käber, Y.; Adler, P. Measuring tree height with remote sensing—A comparison of photogrammetric and LiDAR data with different field measurements. Forests 2019, 10, 694. [Google Scholar] [CrossRef]
  28. Cao, L.; Liu, H.; Fu, X.; Zhang, Z.; Shen, X.; Ruan, H. Comparison of UAV LiDAR and digital aerial photogrammetry point clouds for estimating forest structural attributes in subtropical planted forests. Forests 2019, 10, 145. [Google Scholar] [CrossRef]
  29. Li, M.; Li, Z.; Liu, Q.; Chen, E. Comparison of coniferous plantation heights using unmanned aerial vehicle (UAV) laser scanning and stereo photogrammetry. Remote Sens. 2021, 13, 2885. [Google Scholar] [CrossRef]
  30. You, H.; Tang, X.; You, Q.; Liu, Y.; Chen, J.; Wang, F. Study on the differences between the extraction results of the structural parameters of individual trees for different tree species based on UAV LiDAR and high-resolution RGB images. Drones 2023, 7, 317. [Google Scholar] [CrossRef]
  31. Liu, Y.; You, H.; Tang, X.; You, Q.; Huang, Y.; Chen, J. Study on individual tree segmentation of different tree species using different segmentation algorithms based on 3D UAV data. Forests 2023, 14, 1327. [Google Scholar] [CrossRef]
  32. Gan, Y.; Wang, Q.; Song, G. Non-destructive estimation of deciduous forest metrics: Comparisons between UAV-LiDAR, UAV-DAP, and terrestrial LiDAR leaf-off point clouds using two QSMs. Remote Sens. 2024, 16, 697. [Google Scholar] [CrossRef]
  33. Iqbal, I.A.; Osborn, J.; Stone, C.; Lucieer, A. A comparison of ALS and dense photogrammetric point clouds for individual tree detection in radiata pine plantations. Remote Sens. 2021, 13, 3536. [Google Scholar] [CrossRef]
  34. Järnstedt, J.; Pekkarinen, A.; Tuominen, S.; Ginzler, C.; Holopainen, M.; Viitala, R. Forest variable estimation using a high-resolution digital surface model. ISPRS-J. Photogramm. Remote Sens. 2012, 74, 78–84. [Google Scholar] [CrossRef]
  35. Surový, P.; Almeida Ribeiro, N.; Panagiotidis, D. Estimation of positions and heights from UAV-sensed imagery in tree plantations in agrosilvopastoral systems. Int. J. Remote Sens. 2018, 39, 4786–4800. [Google Scholar]
  36. Næsset, E.; Gobakken, T.; Jutras-Perreault, M.; Ramtvedt, E.N. Comparing 3D point cloud data from laser scanning and digital aerial photogrammetry for height estimation of small trees and other vegetation in a boreal–alpine ecotone. Remote Sens. 2021, 13, 2469. [Google Scholar] [CrossRef]
  37. Wallace, L.; Lucieer, A.; Malenovský, Z.; Turner, D.; Vopěnka, P. Assessment of forest structure using two UAV techniques: A comparison of airborne laser scanning and structure from motion (SfM) point clouds. Forests 2016, 7, 62. [Google Scholar] [CrossRef]
  38. Mielcarek, M.; Kamińska, A.; Stereńczak, K. Digital aerial photogrammetry (DAP) and airborne laser scanning (ALS) as sources of information about tree height: Comparisons of the accuracy of remote sensing methods for tree height estimation. Remote Sens. 2020, 12, 1808. [Google Scholar] [CrossRef]
  39. Moe, K.T.; Owari, T.; Furuya, N.; Hiroshima, T.; Morimoto, J. Application of UAV photogrammetry with LiDAR data to facilitate the estimation of tree locations and DBH values for high-value timber species in northern japanese mixed-wood forests. Remote Sens. 2020, 12, 2865. [Google Scholar] [CrossRef]
  40. Guerra-Hernández, J.; Cosenza, D.N.; Cardil, A.; Silva, C.A.; Botequim, B.; Soares, P.; Silva, M.; González-Ferreiro, E.; Díaz-Varela, R.A. Predicting growing stock volume of eucalyptus plantations using 3-D point clouds derived from UAV imagery and ALS data. Forests 2019, 10, 905. [Google Scholar] [CrossRef]
  41. Zhao, X.; Guo, Q.; Su, Y.; Xue, B. Improved progressive TIN densification filtering algorithm for airborne LiDAR data in forested areas. ISPRS J. Photogramm. Remote Sens. 2016, 117, 79–91. [Google Scholar]
  42. Smith, A.R. Color gamut transform pairs. ACM SIGGRAPH Comput. Graph. 1978, 12, 12–19. [Google Scholar] [CrossRef]
  43. Bendig, J.; Yu, K.; Aasen, H.; Bolten, A.; Bennertz, S.; Broscheit, J.; Gnyp, M.L.; Bareth, G. Combining UAV-based plant height from crop surface models, visible, and near infrared vegetation indices for biomass monitoring in barley. Int. J. Appl. Earth Obs. Geoinf. 2015, 39, 79–87. [Google Scholar]
  44. Gao, Y.; Lin, Y.; Wen, X.; Jian, W.; Gong, Y. Vegetation information recognition in visible band based on UAV images. Trans. Chin. Soc. Agric. Eng. 2020, 36, 178–189. [Google Scholar]
  45. Louhaichi, M.; Borman, M.M.; Johnson, D.E. Spatially Located Platform and Aerial Photography for Documentation of Grazing Impacts on Wheat. Geocarto Int. 2008, 16, 65–70. [Google Scholar]
  46. Woebbecke, D.M.; Meyer, G.E.; Von Bargen, K.; Mortensen, D.A. Color indices for weed identification under various soil, residue, and lighting conditions. Trans. ASAE 1995, 38, 259–269. [Google Scholar]
  47. Meyer, G.E.; Hindman, T.W.; Koppolu, L. Machine vision detection parameters for plant species identification. Proc. SPIE Int. Soc. Opt. Eng. 1999, 3543, 327–335. [Google Scholar]
  48. Gitelson, A.A.; Stark, R.; Grits, U.; Rundquist, D.; Kaufman, Y.; Derry, D. Vegetation and soil lines in visible spectral space: A concept and technique for remote estimation of vegetation fraction. Int. J. Remote Sens. 2010, 23, 2537–2562. [Google Scholar]
  49. Merton, R. Monitoring community hysteresis using spectral shift analysis and the red-edge vegetation stress index. In Proceedings of the Seventh Annual JPL Airborne Geoscience Workshop. NASA, Jet Propulsion Laboratory, Pasadena, CA, USA., 12–16 January 1998.
  50. Huang, J.; Wang, Y.; Wang, F.; Liu, Z. Red edge characteristics and leaf area index estimation model using hyperspectral data for rape. Trans. CSAE 2006, 22, 22–26. [Google Scholar]
  51. Vogelmann, J.E.; Rock, B.N.; Moss, D.M. Red edge spectral measurements from sugar maple leaves. Int. J. Remote Sens. 2007, 14, 1563–1575. [Google Scholar]
  52. Wang, Z.J.; Wang, J.H.; Liu, L.Y.; Huang, W.J.; Zhao, C.J.; Wang, C.Z. Prediction of grain protein content in winter wheat (Triticum aestivum L.) using plant pigment ratio (PPR). Field Crops Res. 2004, 90, 311–321. [Google Scholar] [CrossRef]
  53. Dawson, T.P.; Curran, P.J. A new technique for interpolating the reflectance red edge position. Int. J. Remote Sens. 2010, 19, 2133–2139. [Google Scholar] [CrossRef]
  54. Rouse, J.W., Jr.; Haas, R.H.; Schell, J.A.; Deering, D.W. Monitoring vegetation systems in the great plains with ERTS. Environ. Sci. 1974, 48–62. [Google Scholar]
  55. Gamon, J.A.; Surfus, J.S. Assessing leaf pigment content and activity with a reflectometer. New Phytol. 1999, 143, 105–117. [Google Scholar] [CrossRef]
  56. Richardson, A.J.; Wiegand, C.L. Distinguishing Vegetation from Soil Background Information. Photogramm. Eng. Remote Sens. 1977, 43, 1541–1552. [Google Scholar]
  57. Alonzo, M.; Andersen, H.; Morton, D.; Cook, B. Quantifying boreal forest structure and composition using UAV structure from motion. Forests 2018, 9, 119. [Google Scholar] [CrossRef]
  58. White, J.C.; Tompalski, P.; Coops, N.C.; Wulder, M.A. Comparison of airborne laser scanning and digital stereo imagery for characterizing forest canopy gaps in coastal temperate rainforests. Remote Sens. Environ. 2018, 208, 1–14. [Google Scholar] [CrossRef]
  59. Wu, X.; Shen, X.; Cao, L.; Wang, G.; Cao, F. Assessment of individual tree detection and canopy cover estimation using unmanned aerial vehicle based light detection and ranging (UAV-LiDAR) data in planted forests. Remote Sens. 2019, 11, 908. [Google Scholar] [CrossRef]
  60. Man, Q.; Dong, P.; Yang, X.; Wu, Q.; Han, R. Automatic extraction of grasses and individual trees in urban areas based on airborne hyperspectral and LiDAR data. Remote Sens. 2020, 12, 2725. [Google Scholar] [CrossRef]
  61. Goutte, C.; Gaussier, E. A Probabilistic interpretation of precision, recall and F-score, with implication for evaluation. In European Conference on Information Retrieval; Springer: Berlin/Heidelberg, Germany, 2005; pp. 345–359. [Google Scholar]
  62. Sokolova, M.; Japkowicz, N.; Szpakowicz, S. Beyond accuracy, F-Score and ROC: A family of discriminant measures for performance evaluation. In AI 2006: Advances in Artificial Intelligence; Sattar, A., Kang, B., Eds.; Lecture Notes in Computer Science; Springer: Berlin/Heidelberg, Germany, 2006; Volume 4304, pp. 1015–1021. ISBN 978-3-540-49787-5. [Google Scholar]
  63. Liu, K.; Shen, X.; Cao, L.; Wang, G.; Cao, F. Estimating forest structural attributes using UAV-LiDAR data in Ginkgo plantations. ISPRS-J. Photogramm. Remote Sens. 2018, 146, 465–482. [Google Scholar] [CrossRef]
  64. Yun, T.; Jiang, K.; Li, G.; Eichhorn, M.P.; Fan, J.; Liu, F.; Chen, B.; An, F.; Cao, L. Individual tree crown segmentation from airborne LiDAR data using a novel Gaussian filter and energy function minimization-based approach. Remote Sens. Environ. 2021, 256, 112307. [Google Scholar]
  65. Shih, H.; Stow, D.A.; Chang, K.; Roberts, D.A.; Goulias, K.G. From land cover to land use: Applying random forest classifier to Landsat imagery for urban land-use change mapping. Geocarto Int. 2022, 37, 5523–5546. [Google Scholar] [CrossRef]
  66. Puertas, O.L.; Brenning, A.; Meza, F.J. Balancing misclassification errors of land cover classification maps using support vector machines and Landsat imagery in the Maipo river basin (Central Chile, 1975–2010). Remote Sens. Environ. 2013, 137, 112–123. [Google Scholar]
  67. Goodbody, T.R.H.; Coops, N.C.; Marshall, P.L.; Tompalski, P.; Crawford, P. Unmanned aerial systems for precision forest inventory purposes: A review and case study. For. Chron. 2017, 93, 71–81. [Google Scholar] [CrossRef]
  68. Qin, H.; Zhou, W.; Yao, Y.; Wang, W. Individual tree segmentation and tree species classification in subtropical broadleaf forests using UAV-based LiDAR, hyperspectral, and ultrahigh-resolution RGB data. Remote Sens. Environ. 2022, 280, 113143. [Google Scholar] [CrossRef]
  69. Liu, H. Classification of urban tree species using multi-features derived from four-season RedEdge-MX data. Comput. Electron. Agric. 2022, 194, 106794. [Google Scholar]
  70. Carbonell-Rivera, J.P.; Torralba, J.; Estornell, J.; Ruiz, L.Á.; Crespo-Peremarch, P. Classification of mediterranean shrub species from UAV point clouds. Remote Sens. 2022, 14, 199. [Google Scholar] [CrossRef]
  71. Feng, Q.; Liu, J.; Gong, J. UAV remote sensing for urban vegetation mapping using random forest and texture analysis. Remote Sens. 2015, 7, 1074–1094. [Google Scholar] [CrossRef]
  72. Rösch, M.; Sonnenschein, R.; Buchelt, S.; Ullmann, T. Comparing planet scope and sentinel-2 imagery for mapping mountain pines in the Sarntal Alps, Italy. Remote Sens. 2022, 14, 3190. [Google Scholar] [CrossRef]
  73. Michałowska, M.; Rapiński, J. A review of tree species classification based on airborne LiDAR data and applied classifiers. Remote Sens. 2021, 13, 353. [Google Scholar] [CrossRef]
  74. Chen, J.; Chen, Y.; Liu, Z. Classification of typical tree species in laser point cloud based on deep learning. Remote Sens. 2021, 13, 4750. [Google Scholar] [CrossRef]
  75. Liu, M.; Han, Z.; Chen, Y.; Liu, Z.; Han, Y. Tree species classification of LiDAR data based on 3D deep learning. Measurement 2021, 177, 109301. [Google Scholar]
  76. Moe, K.; Owari, T.; Furuya, N.; Hiroshima, T. Comparing individual tree height information derived from field surveys, LiDAR and UAV-DAP for high-value timber species in northern Japan. Forests 2020, 11, 223. [Google Scholar] [CrossRef]
  77. Ma, Y.; Zhao, Y.; Im, J.; Zhao, Y.; Zhen, Z. A deep-learning-based tree species classification for natural secondary forests using unmanned aerial vehicle hyperspectral images and LiDAR. Ecol. Indic. 2024, 159, 111608. [Google Scholar]
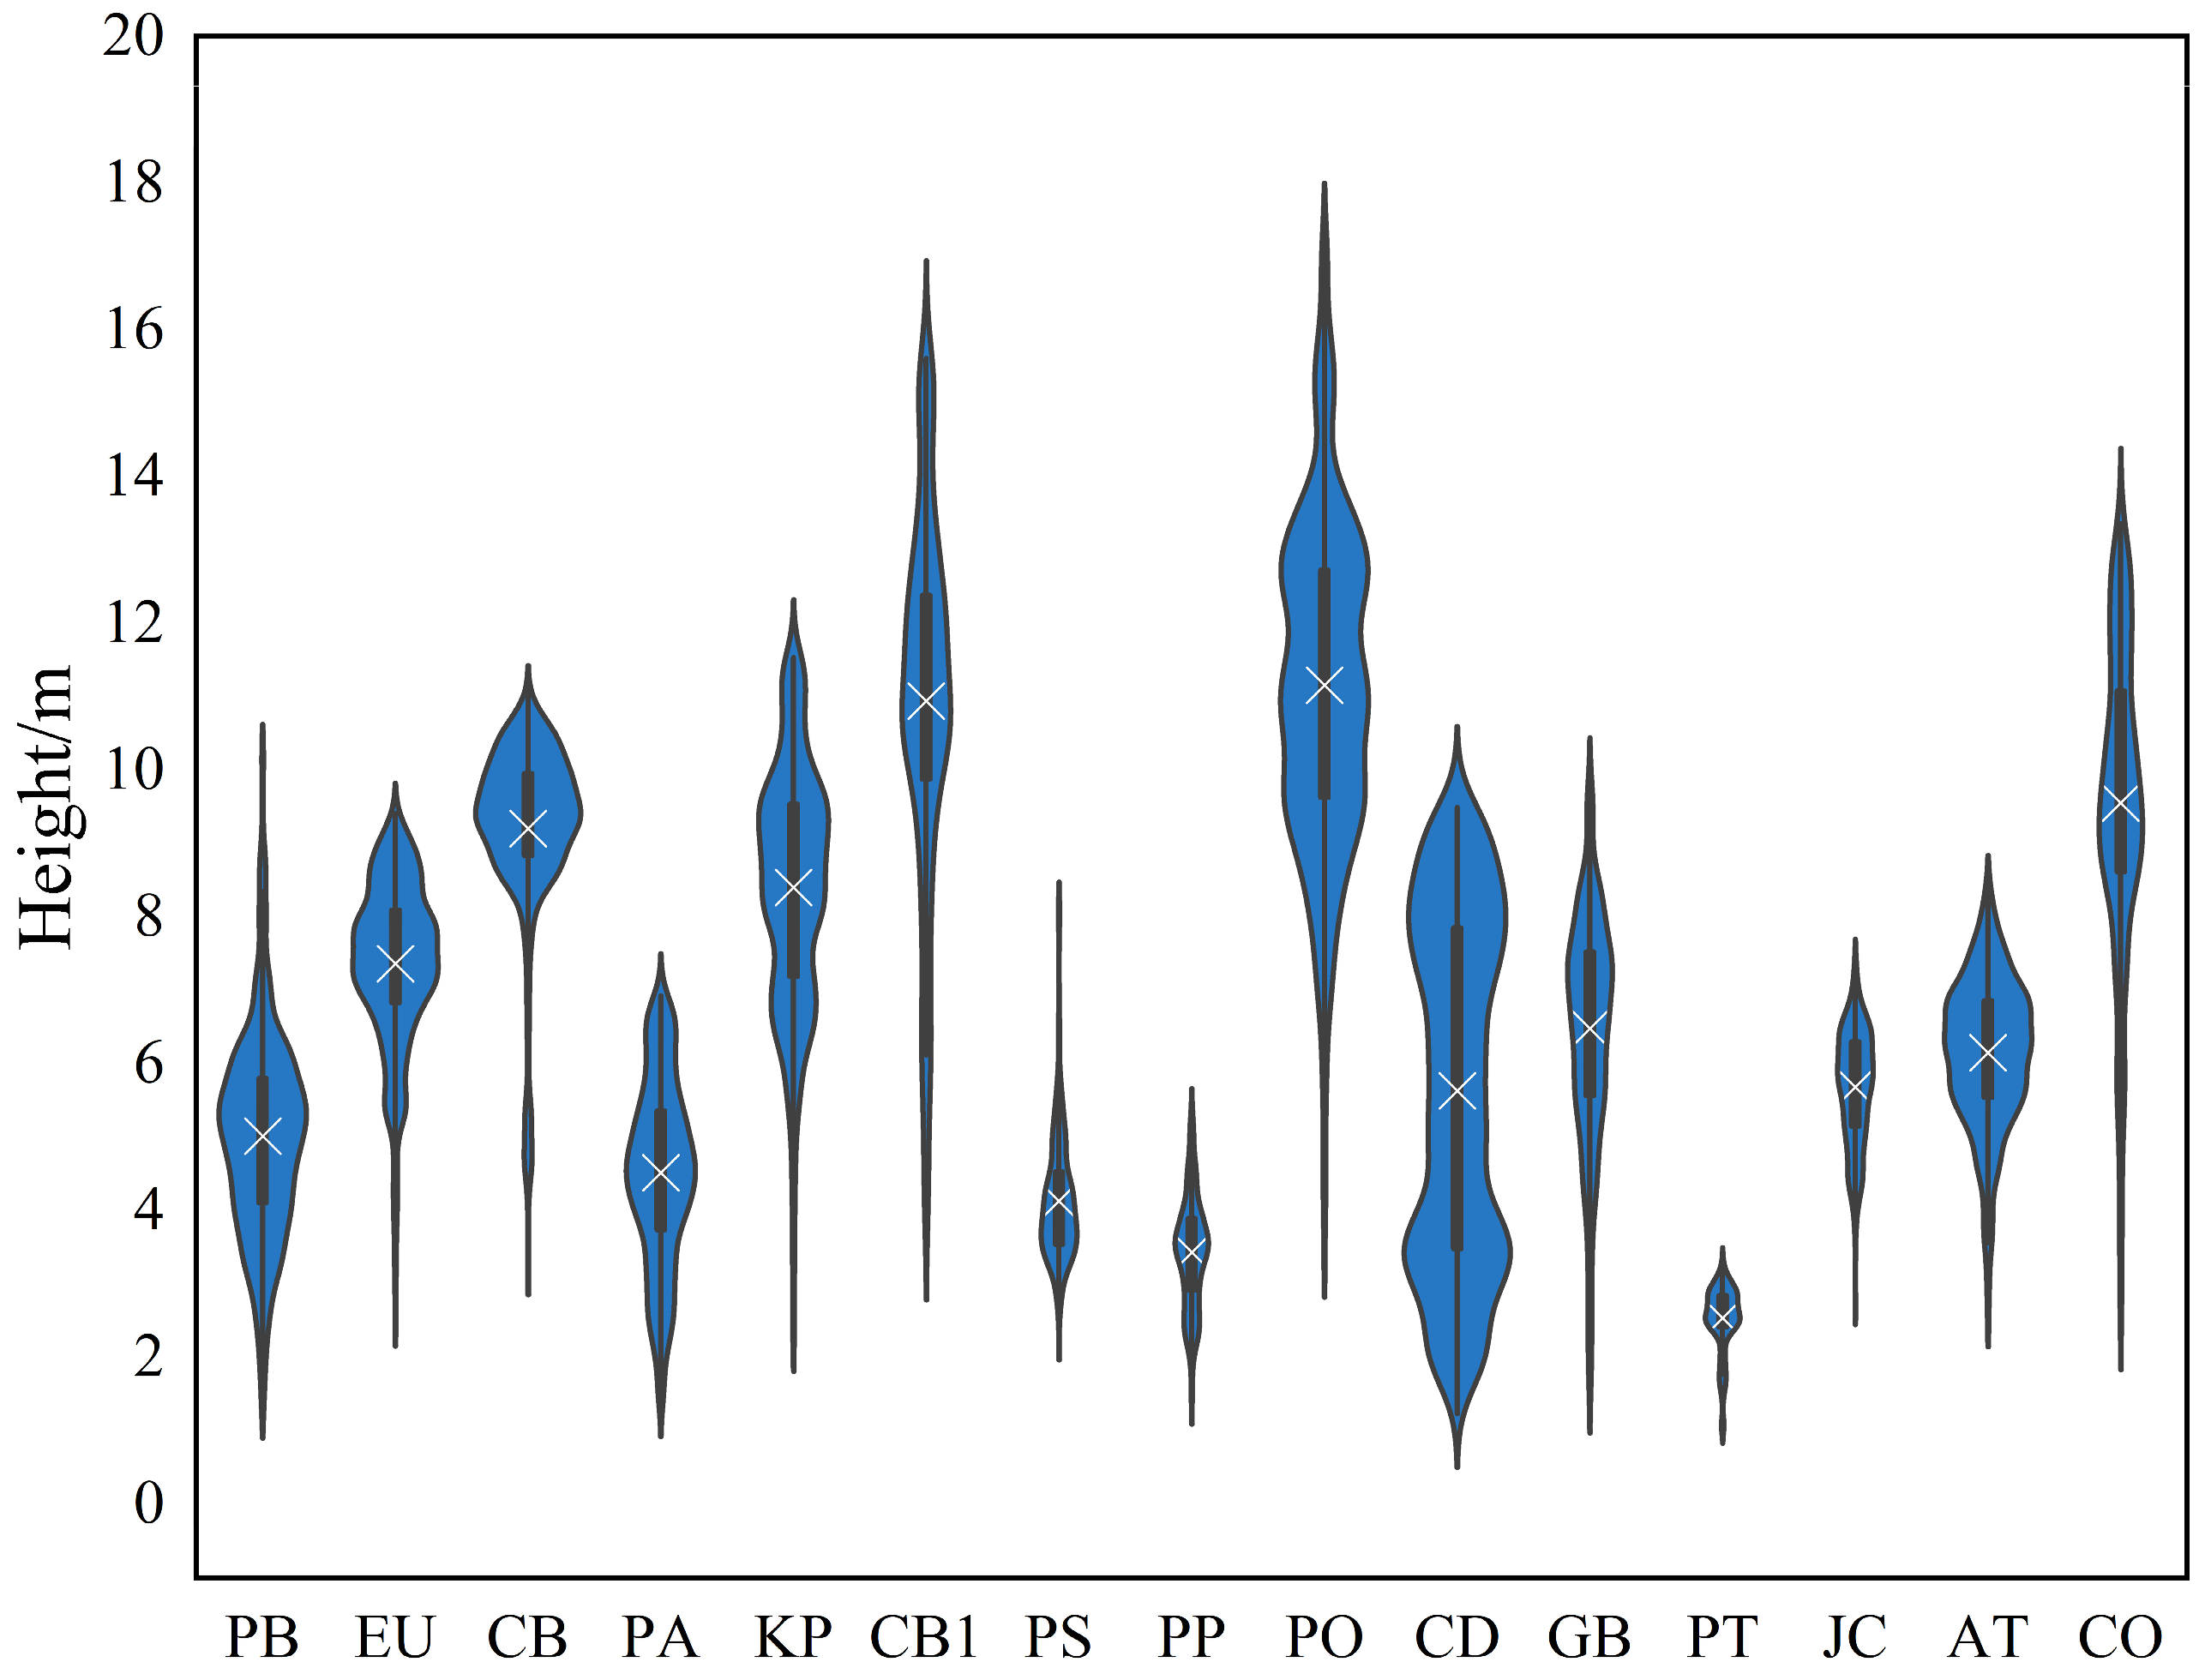
Figure 1. GLCM parameters derived from visible image.
Remotesensing 17 01212 g001
Figure 2. UAV-DAP and UAV-based LiDAR point cloud data of the study area.
Remotesensing 17 01212 g002
Figure 3. Violin plots of the height distribution for different species. Note: The species codes are shown in Table 1.
Remotesensing 17 01212 g003
Figure 4. Comparison of UAV-DAP and UAV-based LiDAR point cloud data in description of individual trees.
Remotesensing 17 01212 g004
Figure 5. The three-dimensional profile of urban trees in UAV-based LiDAR and UAV-DAP point cloud data.
Remotesensing 17 01212 g005
Figure 6. The overall flowchart of the methodology.
Remotesensing 17 01212 g006
Figure 7. Flow chart of individual tree segmentation based on UAV-DAP and UAV-based LiDAR data separately.
Remotesensing 17 01212 g007
Figure 8. Performance comparison of UAV-DAP and UAV-based LiDAR data for individual tree species classification.
Remotesensing 17 01212 g008
Figure 9. Improvement comparison between UAV-DAP and UAV-based LiDAR with hyperspectral data.
Remotesensing 17 01212 g009
Figure 10. Individual tree segmentation results: (a) results based on the CHM generated from UAV-DAP point cloud data; (b) results based on the CHM generated from UAV-based LiDAR point cloud data.
Remotesensing 17 01212 g010
Figure 11. The individual tree segmentation results of UAV-DAP and UAV-based LiDAR data in two small areas.
Remotesensing 17 01212 g011
Figure 12. The curve of tree species classification accuracy with different texture generation window sizes.
Remotesensing 17 01212 g012
Figure 13. The RF and the individual tree species classification results of UAV-based LiDAR and UAV-based photogrammetry.
Remotesensing 17 01212 g013
Figure 14. Accuracy of tree species classification in pixel-level and individual tree level using UAV-DAP and UAV-based LiDAR data. Note. The horizontal axis represents the type of tree species (Table 1).
Remotesensing 17 01212 g014
Figure 15. The improvement of UAV-based LiDAR and UAV-based photogrammetry in urban tree species classification fused with UAV hyperspectral data.
Remotesensing 17 01212 g015
Figure 16. F1 score of 15 tree species with hyperspectral DAP data and hyperspectral LiDAR data in pixel-level (a) and individual tree level (b). Here: HSI represents high spectral resolution image.
Remotesensing 17 01212 g016
Table 1. Name of 15 dominant tree species and their abbreviation.
Tree SpeciesAbbreviationNumber of Sample Trees
Pinus bungeanaPB25
Eucommia ulmoidesEU25
Celtis bungeanaCB30
Pinus armandiPA20
Koelreuteria paniculataKP20
Catalpa bungeiCB115
Prunus serrulata var. lannesianaPS10
Prunus persicaPP10
Platanus orientalisPO25
Cedrus deodaraCD30
Ginkgo bilobaGB15
Pinus tabuliformisPT10
Juniperus chinensisJC10
Acer truncatumAT25
Catalpa ovataCO15
Table 2. Vegetation indexes derived from UAV high-resolution RGB imagery.
Vegetation IndicesFormulation
Difference Enhanced Vegetation Index (DEVI) [42] DEVI = G 3 × G + R 3 × G + B 3 × G
Red-Green-Blue Vegetation Index (RGBVI) [43] RGBVI = G 2 B × R G 2 + B × R
Excess Green-Red-Blue Difference Index (EGRBDI) [44] EGRBDI = 2 G 2 B × R 2 G 2 + B × R
Green Leaf Index (GLI) [45] GLI = 2 G B R 2 G + B + R
Excess Green Index (EXG) [46]EXG = 2GRB
Excess Red Index (EXR) [47]EXR = 1.4RG
Visible Atmospherically Resistant Index (VARI) [48] VARI = G R G + R B
Note: G represents green, R represents red, and B represents blue.
Table 3. Vegetation indexes derived from UAV hyperspectral imagery.
Vegetation IndicesFormulation
Vogelman Red edge Index 1 (Vog1) [49] V o g 1 = ρ 740 / ρ 720
Modified Red Edge Simple Ratio Index (MRENDVI) [50] M R E N D V I = ( ρ 746 ρ 700 ) / ( ρ 746 + ρ 700 2 × ρ 466 ) 1
Vogelman Red Edge Index (Vog) [51] V O G = ρ 746 / ρ 716
Plant pigment ratio (PPR) [52] P P R = ( ρ 550 ρ 450 ) / ( ρ 550 + ρ 450 )
Slope of red edge (SL) [53] S L = ( ρ 740 ρ 690 ) / 50
Normalized Difference Red Edge (NDRE) [54] N D R E = ( ρ 750 ρ 710 ) / ( ρ 750 + ρ 710 )
Modified Red Edge Simple Ratio Index (mSR705) [55] m S R 705 = ( ρ 750 ρ 445 ) / ( ρ 750 + ρ 445 )
Normalized Vegetation Index (NDVI) [54] N D V I = ( ρ 923 ρ 700 ) / ( ρ 923 + ρ 700
Difference Vegetation Index (DVI) [56] D V I = ρ 923 ρ 700
Table 4. The features derived from UAV-DAP, UAV hyperspectral, and UAV-based LiDAR data.
DataFeaturesDescriptionType
UAV-DAPRGB (3)RGB imagerySpectral
HSV (3)Hue, Saturation, ValueSpectral
DEVI (1)Difference Enhanced Vegetation Index derived from UAV-based photogrammetrySpectral
VIsVIs derived from RGB imagery (Table 2)Spectral
GLCM (8);Gray-level Co-occurrence MatrixTexture
HSVGLCM (24)GLCM features derived from HSVTexture
DAP-CHM (1)Canopy height model derived from UAV-based photogrammetryStructure
UAV HyperspectralMNF20;The first 20 bands of hyperspectral data after minimum noise fraction rotationSpectral
VOG1; MRESRIVOG; PPR;
SL; NDRE; mSR705; NDVI;DVI
VIs derived from hyperspectral data (Table 3)Spectral
UAV-based LiDARCHM-LiDAR;Canopy height model derived from UAV-based LiDAR dataStructure
H1%; H25%; H50%; H75%; H99%;Cumulative height at 1%, 25%, 50%, 75%, and 99%Structure
Imean;Intensity derived from UAV-based LiDAR dataSpectral
I1%; I25%; I50%; I75%; I99%;Cumulative intensity at 1%, 25%, 50%, 75%, and 99%Spectral
Table 5. Parameter combinations of UAV-DAP and UAV-based LiDAR data.
DataFeaturesCombination of Different Parameters
UAV-DAPSpectralRGB + VIs + HSV
TextureGLCM + HSVGLCM
Spectral + TextureRGB + DEVI + GLCM + HSV
+ HSVGLCM
Spectral + Texture + StructureRGB + DEVI + GLCM + HSV
+ HSVGLCM + CHM-DAP
Spectral + Texture + StructureRGB + VIs + GLCM + HSV
+ HSVGLCM + CHM-DAP
UAV-based LiDARHeight and intensity at cumulative percentageCHM + LI + INT + ELEV
Height and intensity at interval percentageCHM + LI + INT + ELEV
Table 6. Accuracy of individual tree segmentation with UAV-DAP and UAV-based LiDAR data.
Data TyperecallprecisionF-Score
UAV-DAP0.770.820.79
UAV-based LiDAR0.860.810.83
Table 7. Accuracy of tree species classification with feature combination derived from UAV-DAP and UAV-based LiDAR data.
Experiment No.Feature CombinationOverall Accuracy
1RGB + DEVI + GLCM + HSV + HSVGLCM + CHM-DAP69.80%
2RGB + VIs + GLCM + HSV + HSVGLCM + CHM-DAP63.17%
3RGB + DEVI + GLCM + HSV + HSVGLCM49.42%
4GLCM + HSVGLCM48.12%
5RGB + VIs + HSV26.78%
6CHM + LI + INT + ELEV (at cumulative percentage)57.32%
7CHM + LI + INT + ELEV (at interval percentage)50.44%
Table 8. Accuracy assessment of tree species classification with different cell sizes.
Cell SizesOverall AccuracyKappa
0.3 m39.40%0.34
0.5 m42.51%0.38
0.7 m49.22%0.45
1.0 m57.32%0.54
Table 9. Accuracy assessment of individual tree species classification with UAV-DAP and UAV-based LiDAR data.
Classification ResultsUAV-Based PhotogrammetryUAV-Based LiDAR Data
Overall AccuracyKappa CoefficientOverall AccuracyKappa Coefficient
RF classification73.83%0.7257.32%0.54
Individual tree species classification80.35%0.7979.84%0.78
Disclaimer/Publisher’s Note: The statements, opinions and data contained in all publications are solely those of the individual author(s) and contributor(s) and not of MDPI and/or the editor(s). MDPI and/or the editor(s) disclaim responsibility for any injury to people or property resulting from any ideas, methods, instructions or products referred to in the content.

