

Spatiotemporal Dynamics of Marine Heatwaves and Ocean Acidification Affecting Coral Environments in the Philippines


Abstract
1. Introduction
2. Data and Methods
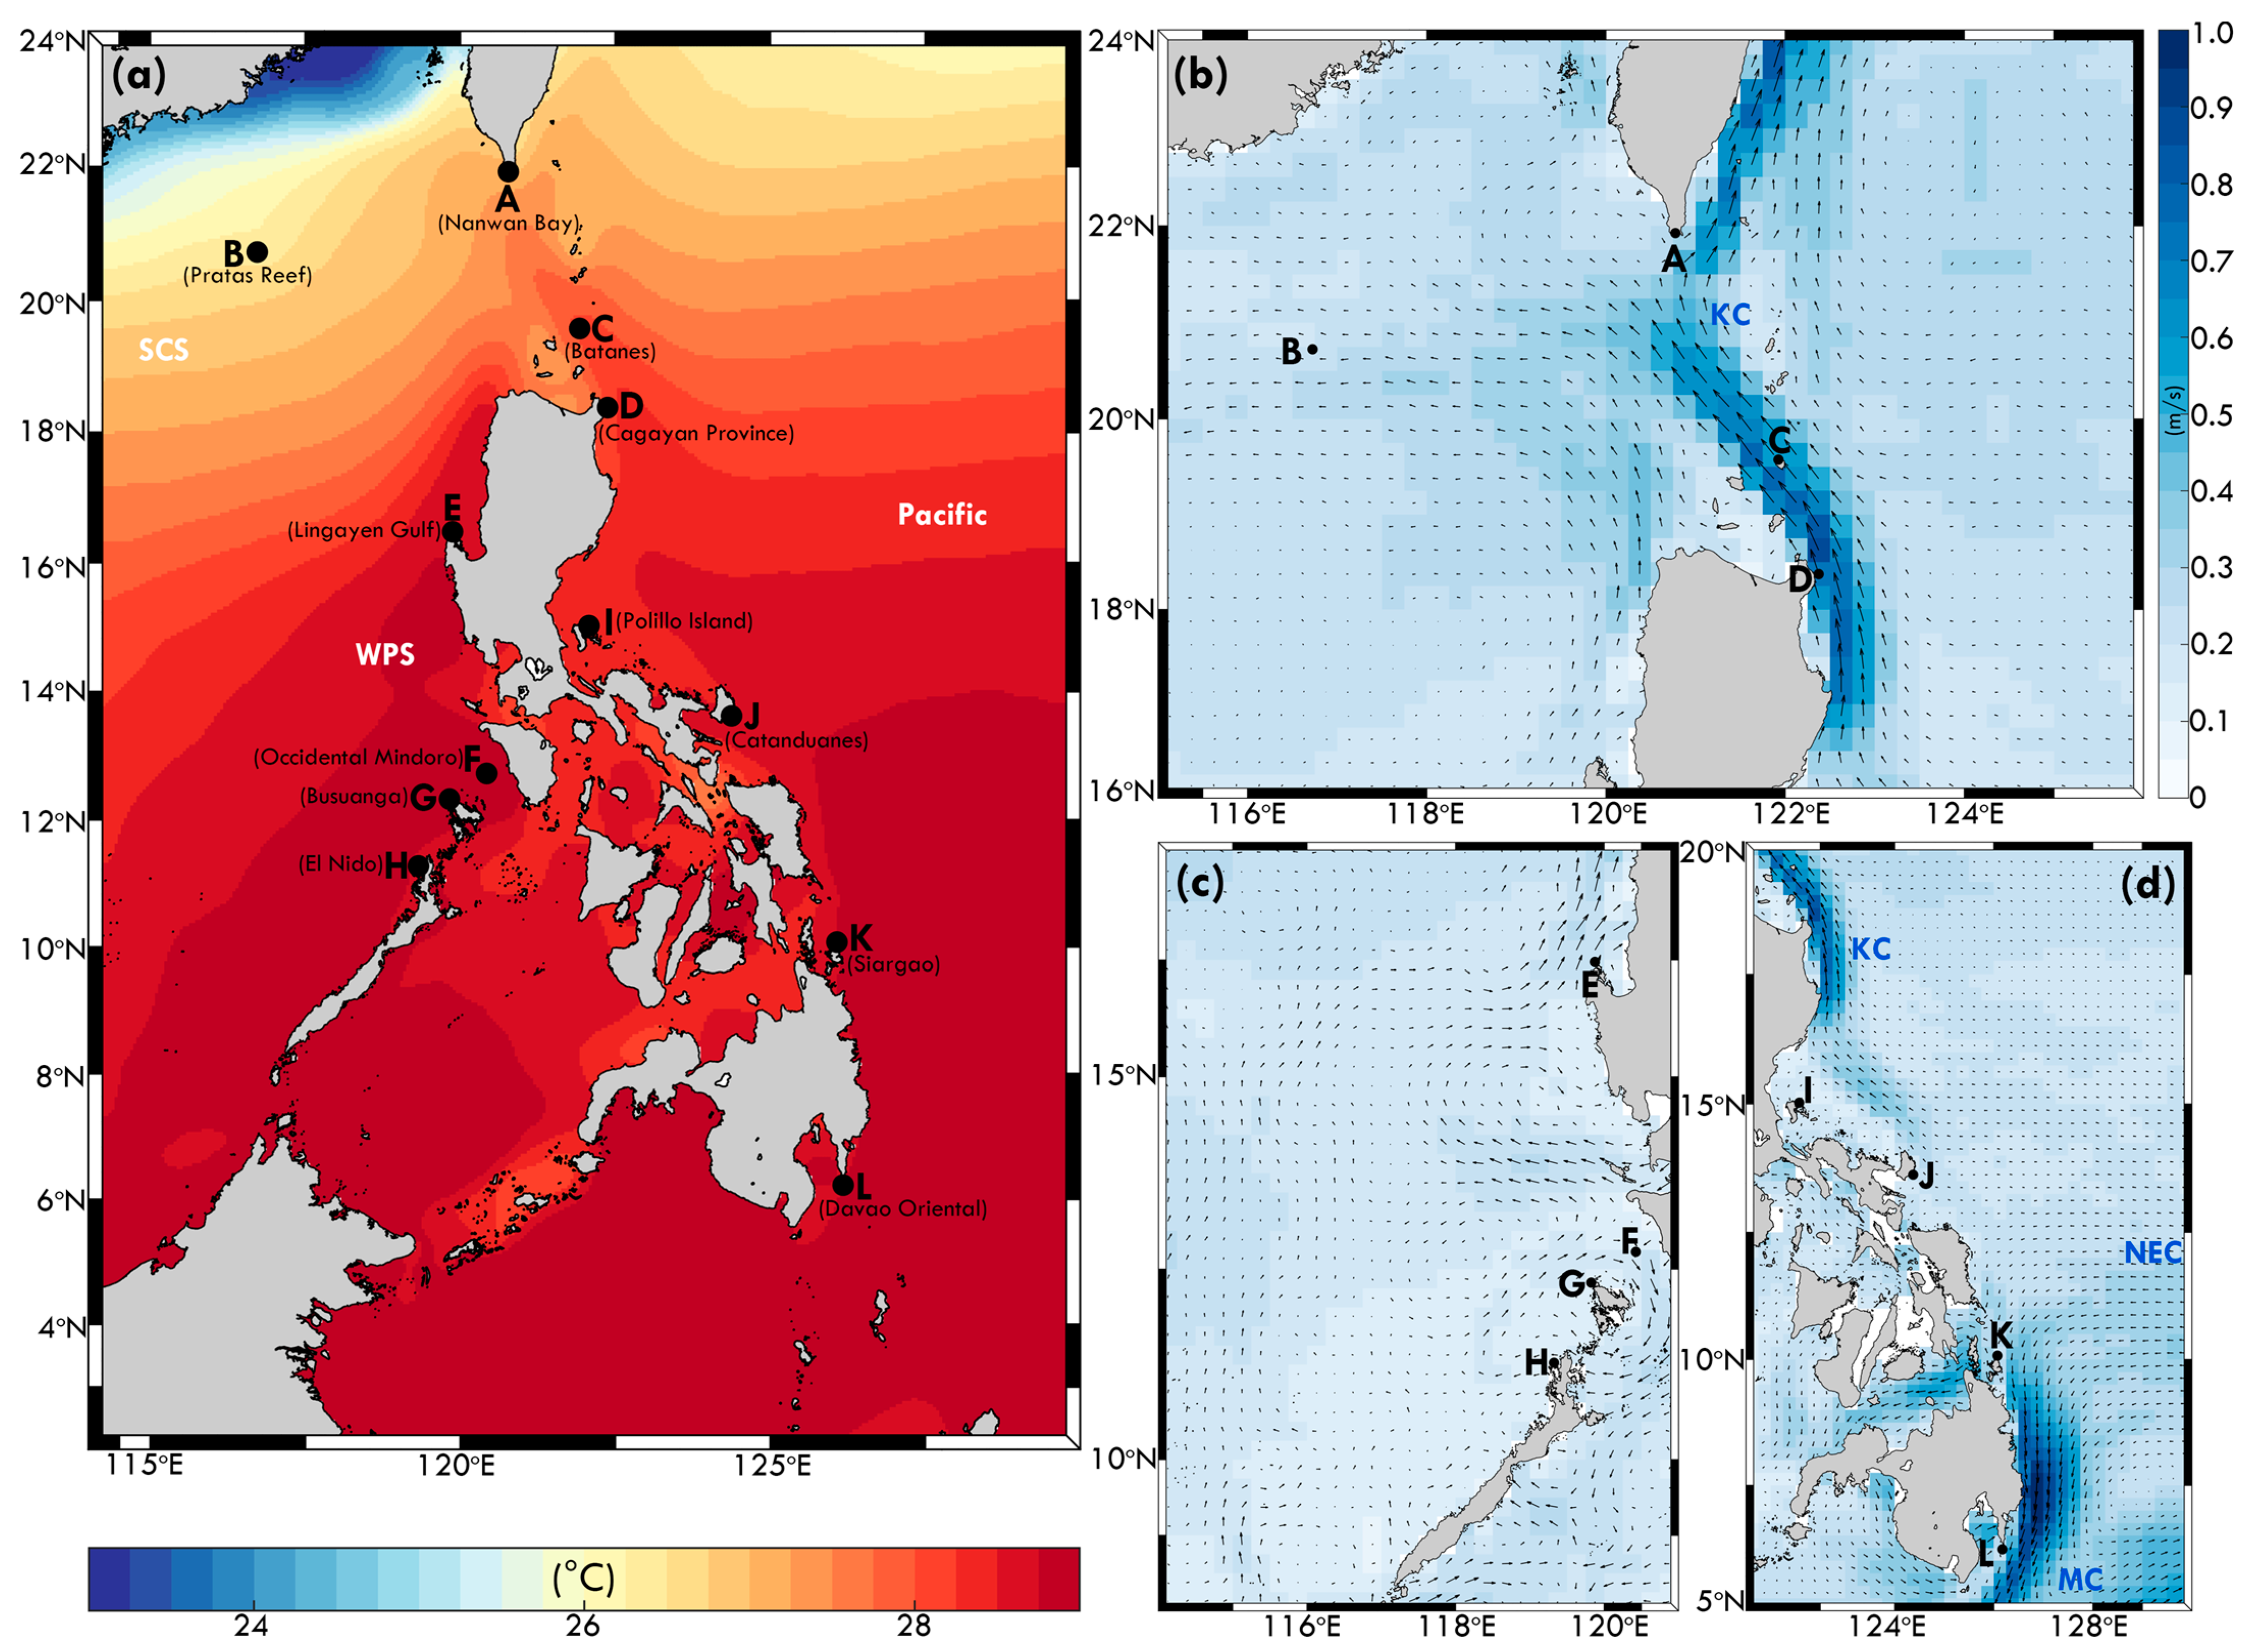
2.1. Study Area
2.2. Ocean Thermal Data
2.2.1. Sea Surface Temperature
2.2.2. Degree Heating Weeks and Marine Heatwave Indices
2.3. Ocean Current
2.4. Biogeochemistry Dataset
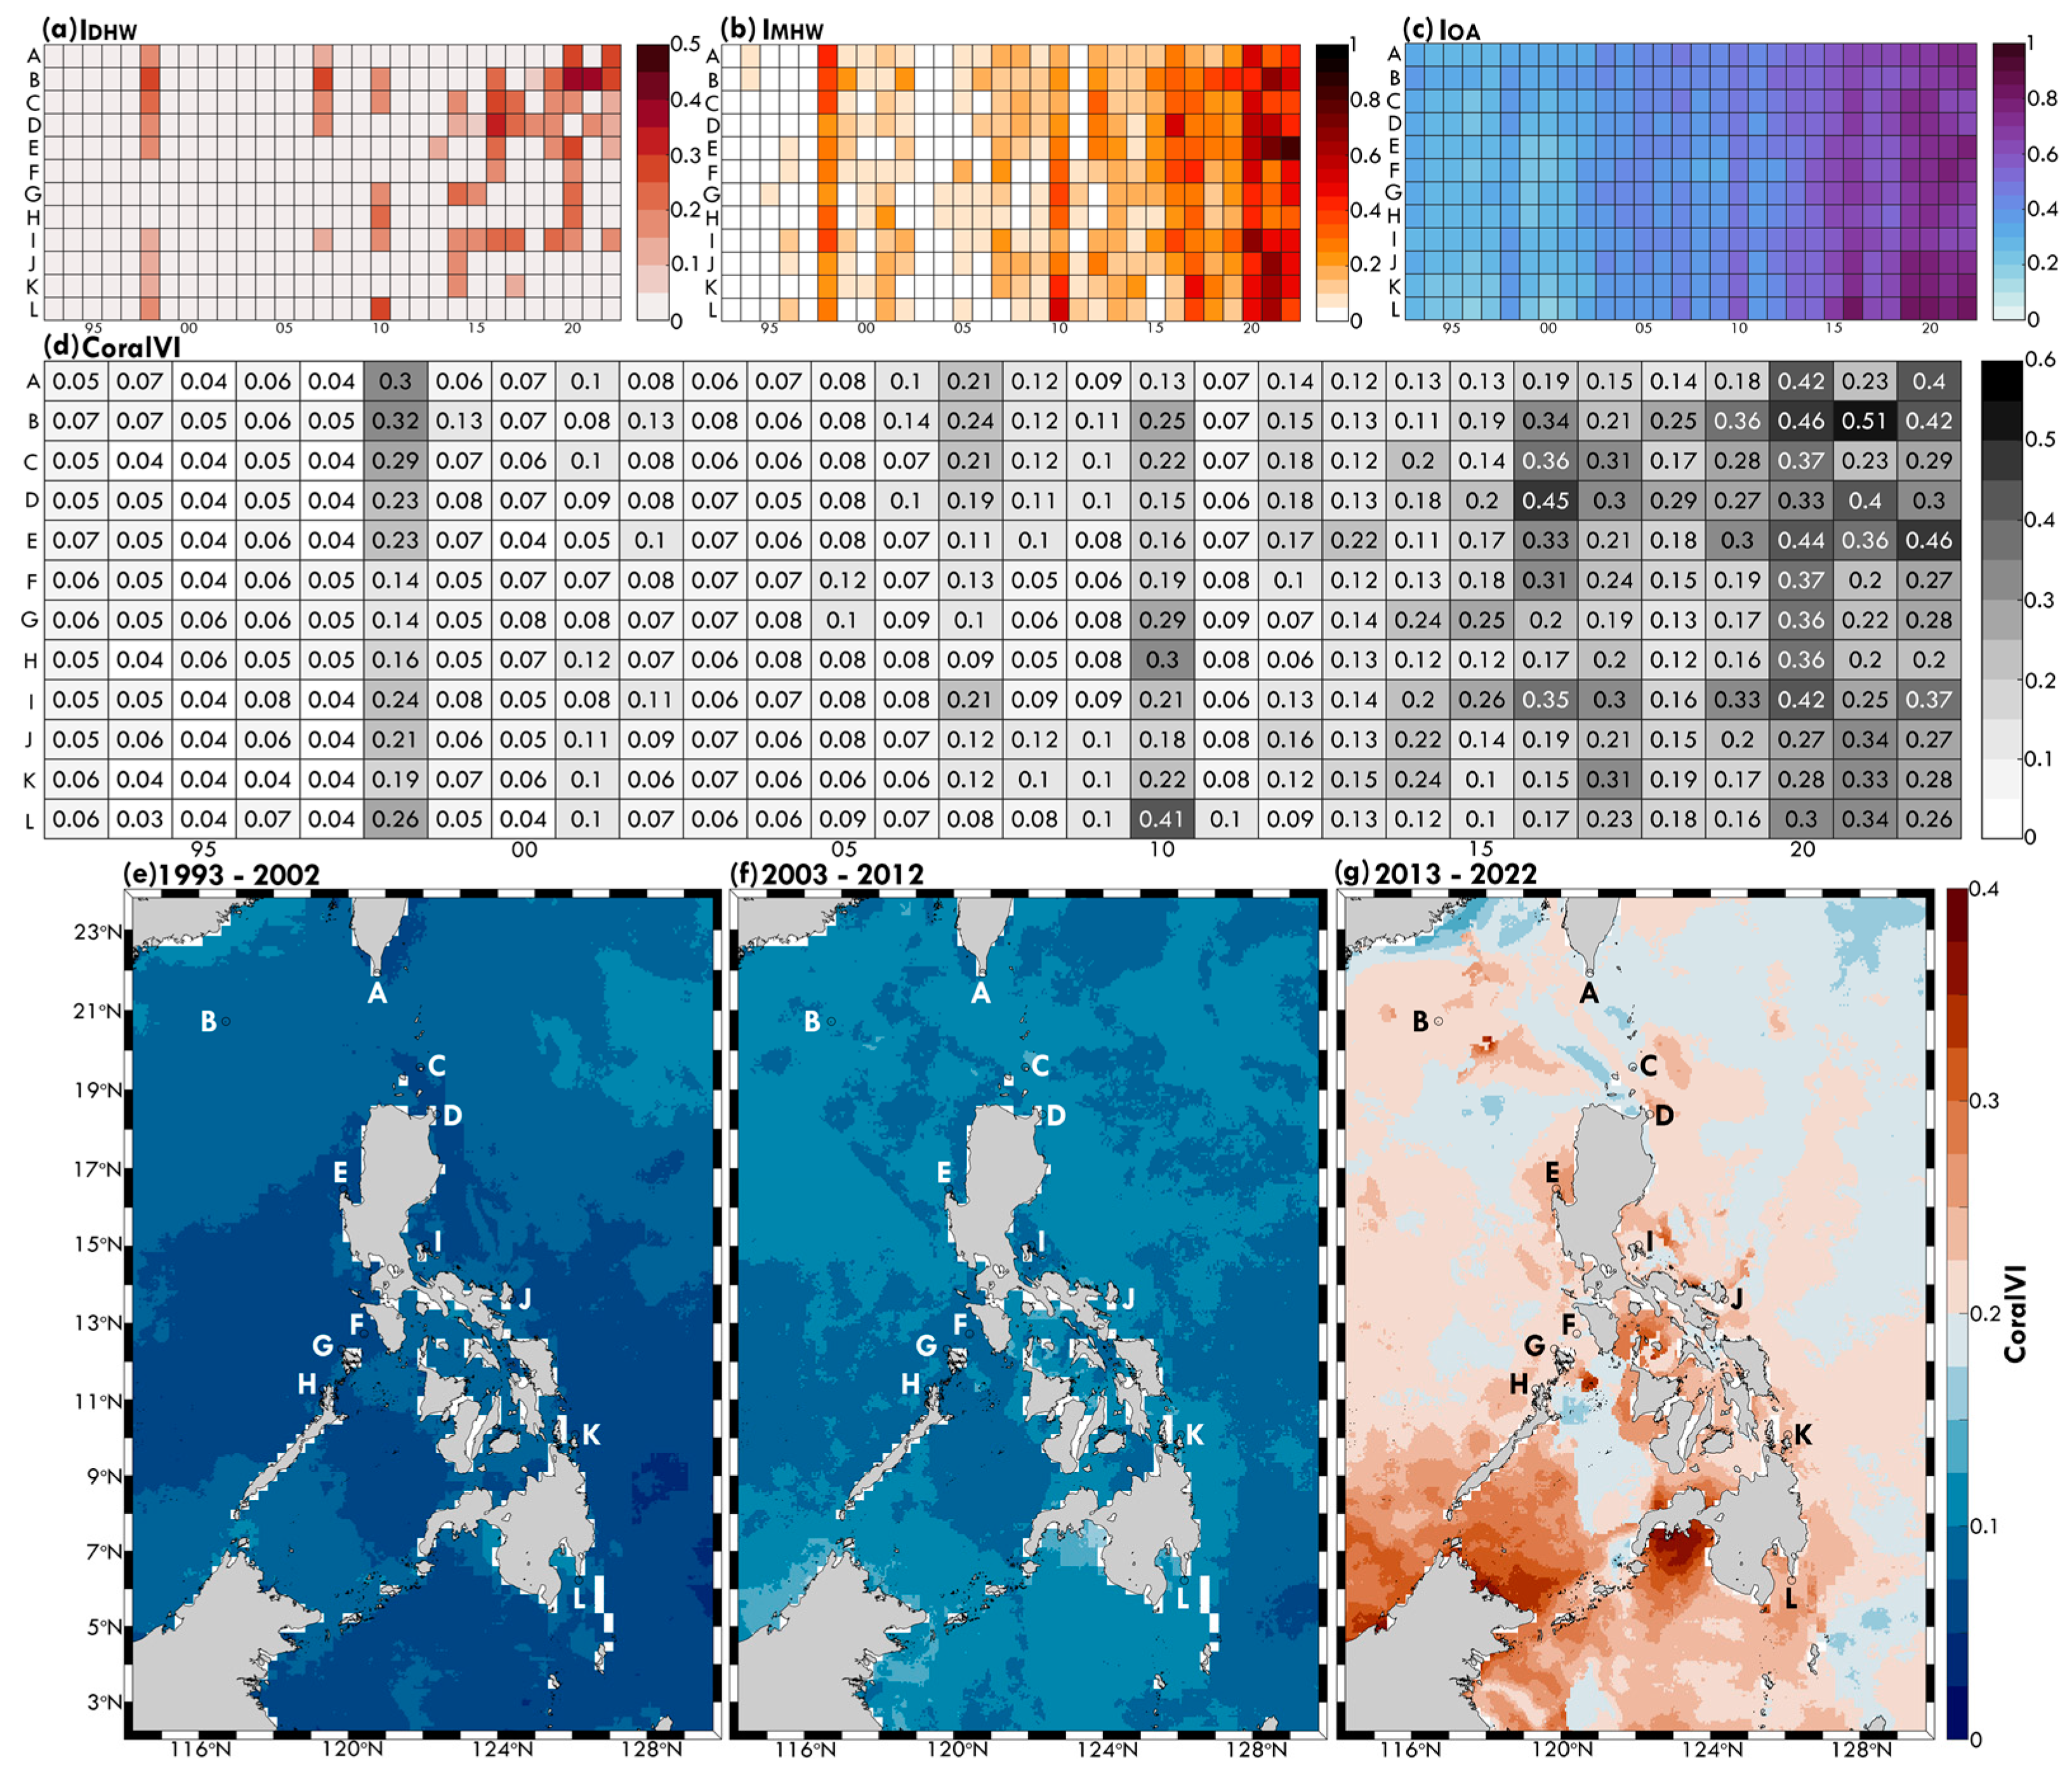
2.5. Coral Marine Environmental Vulnerability
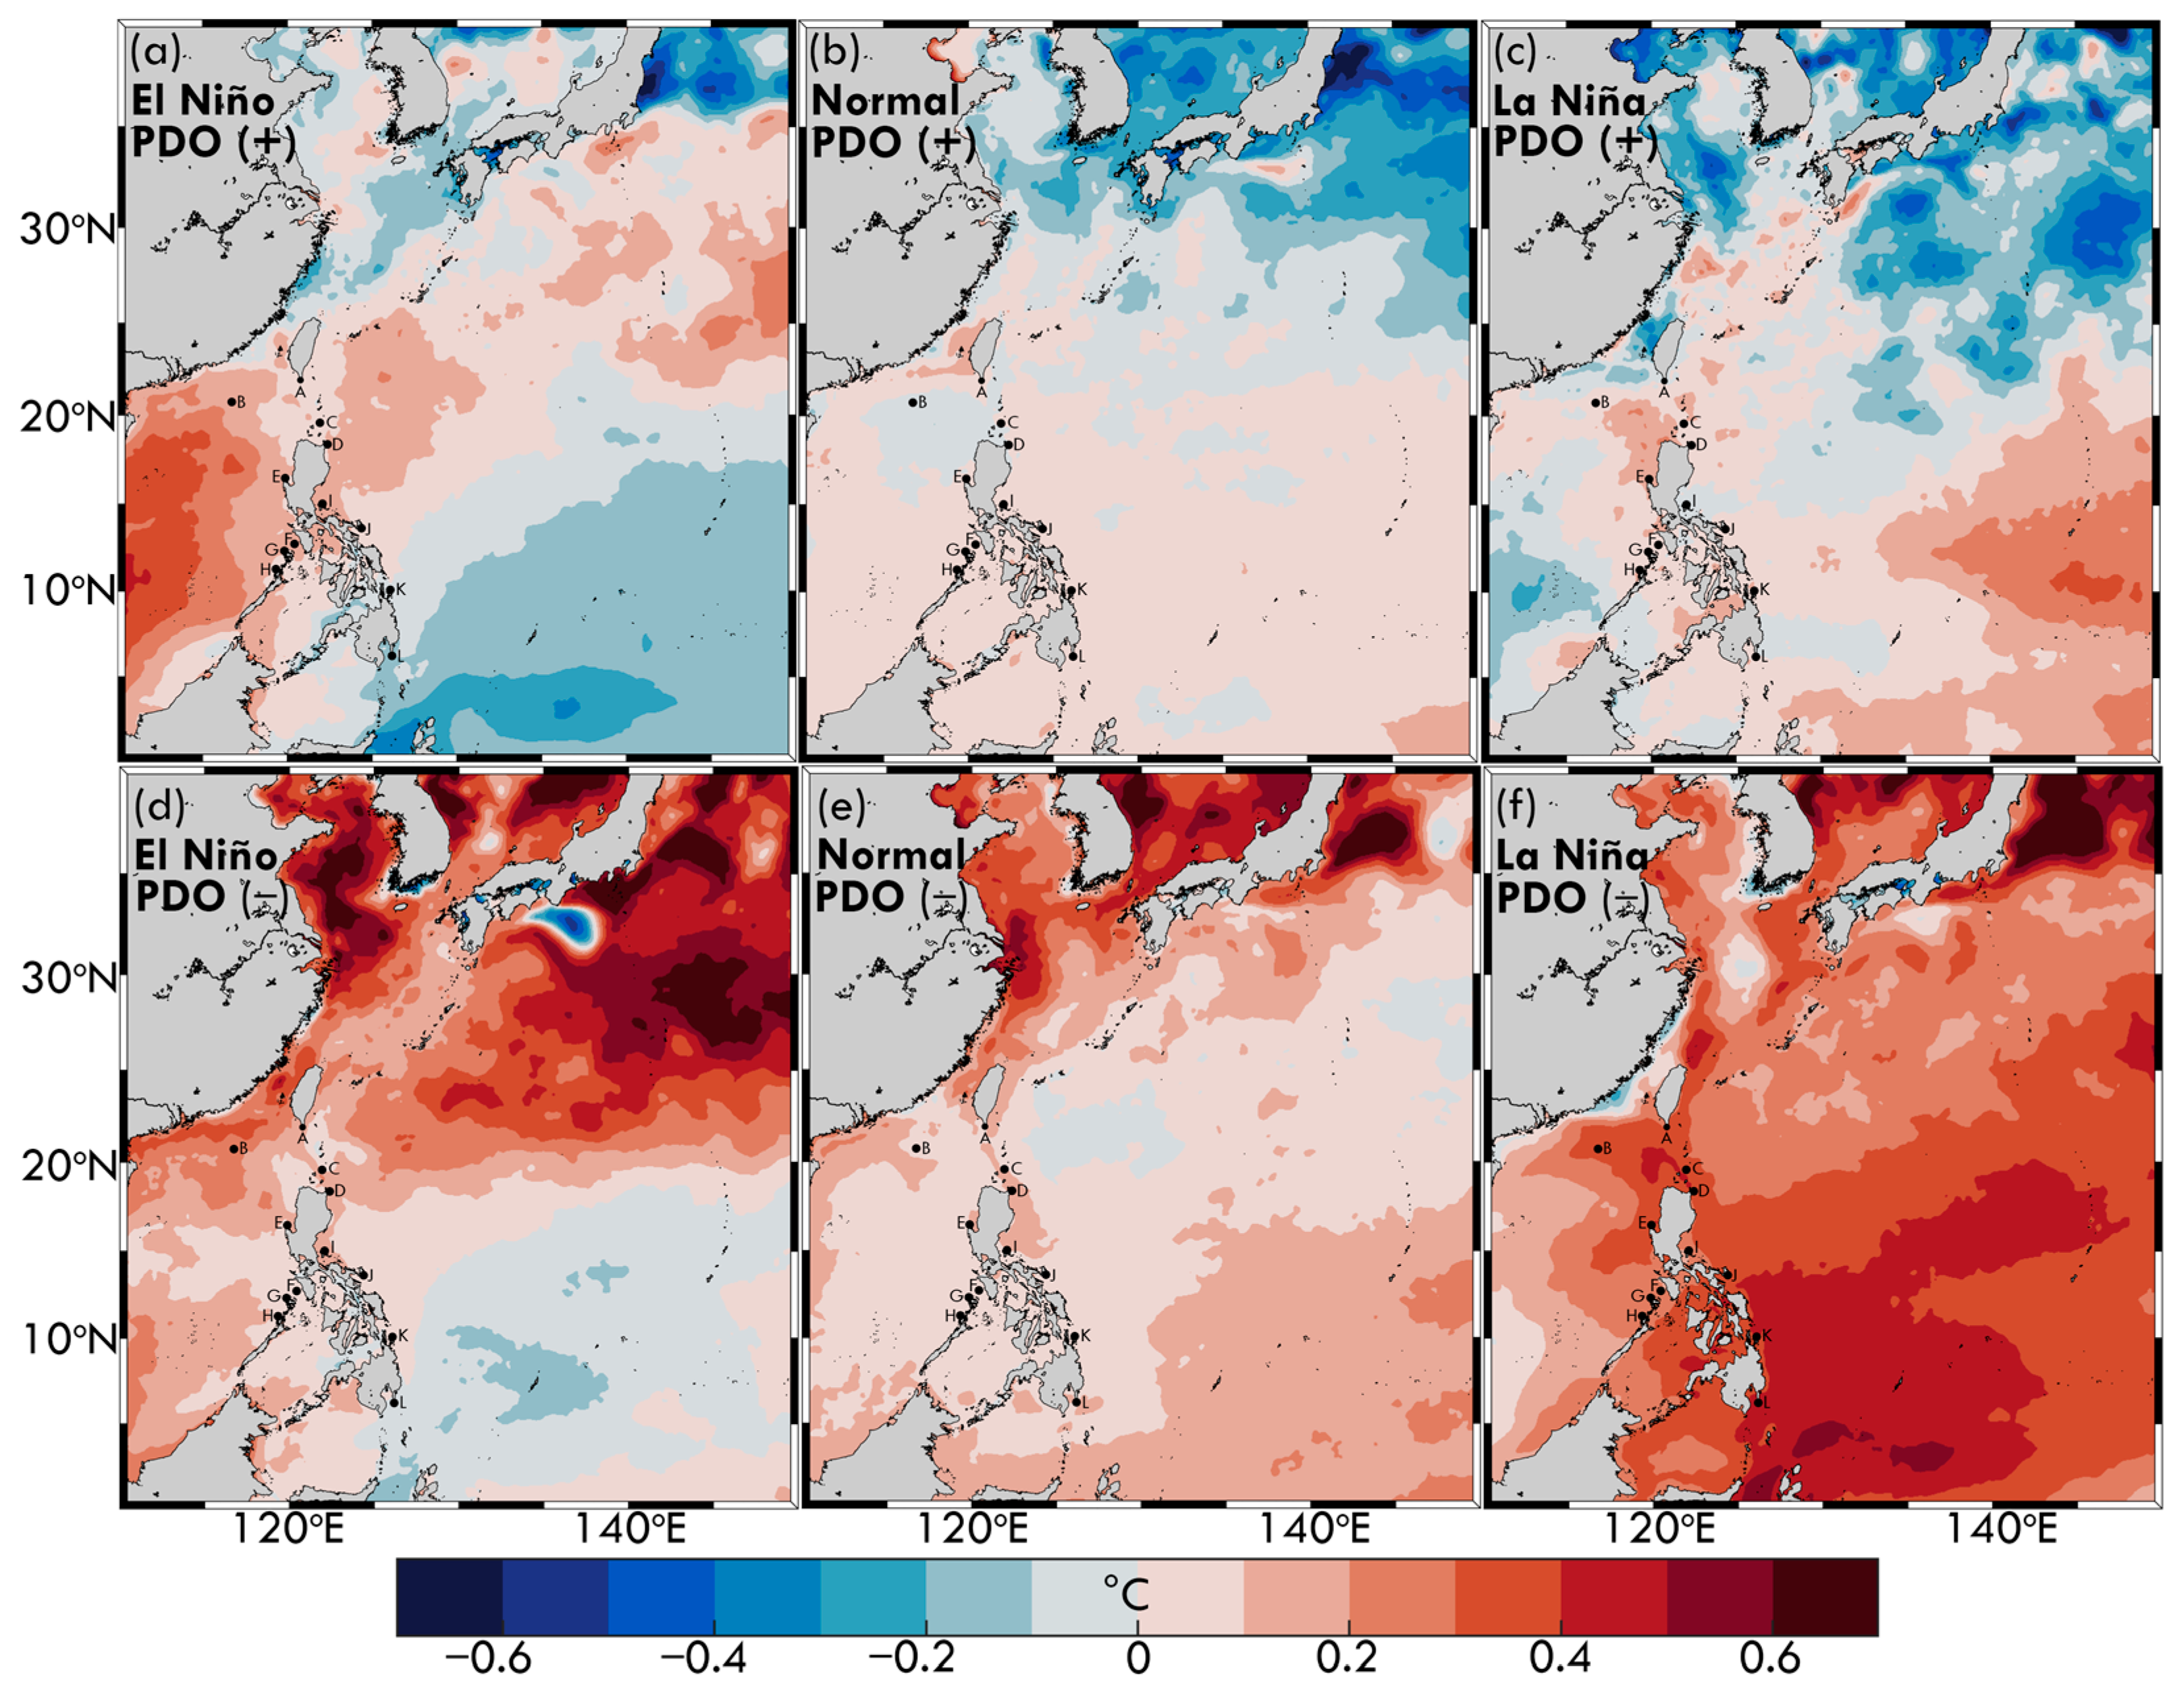
2.6. Climate Patterns
3. Results
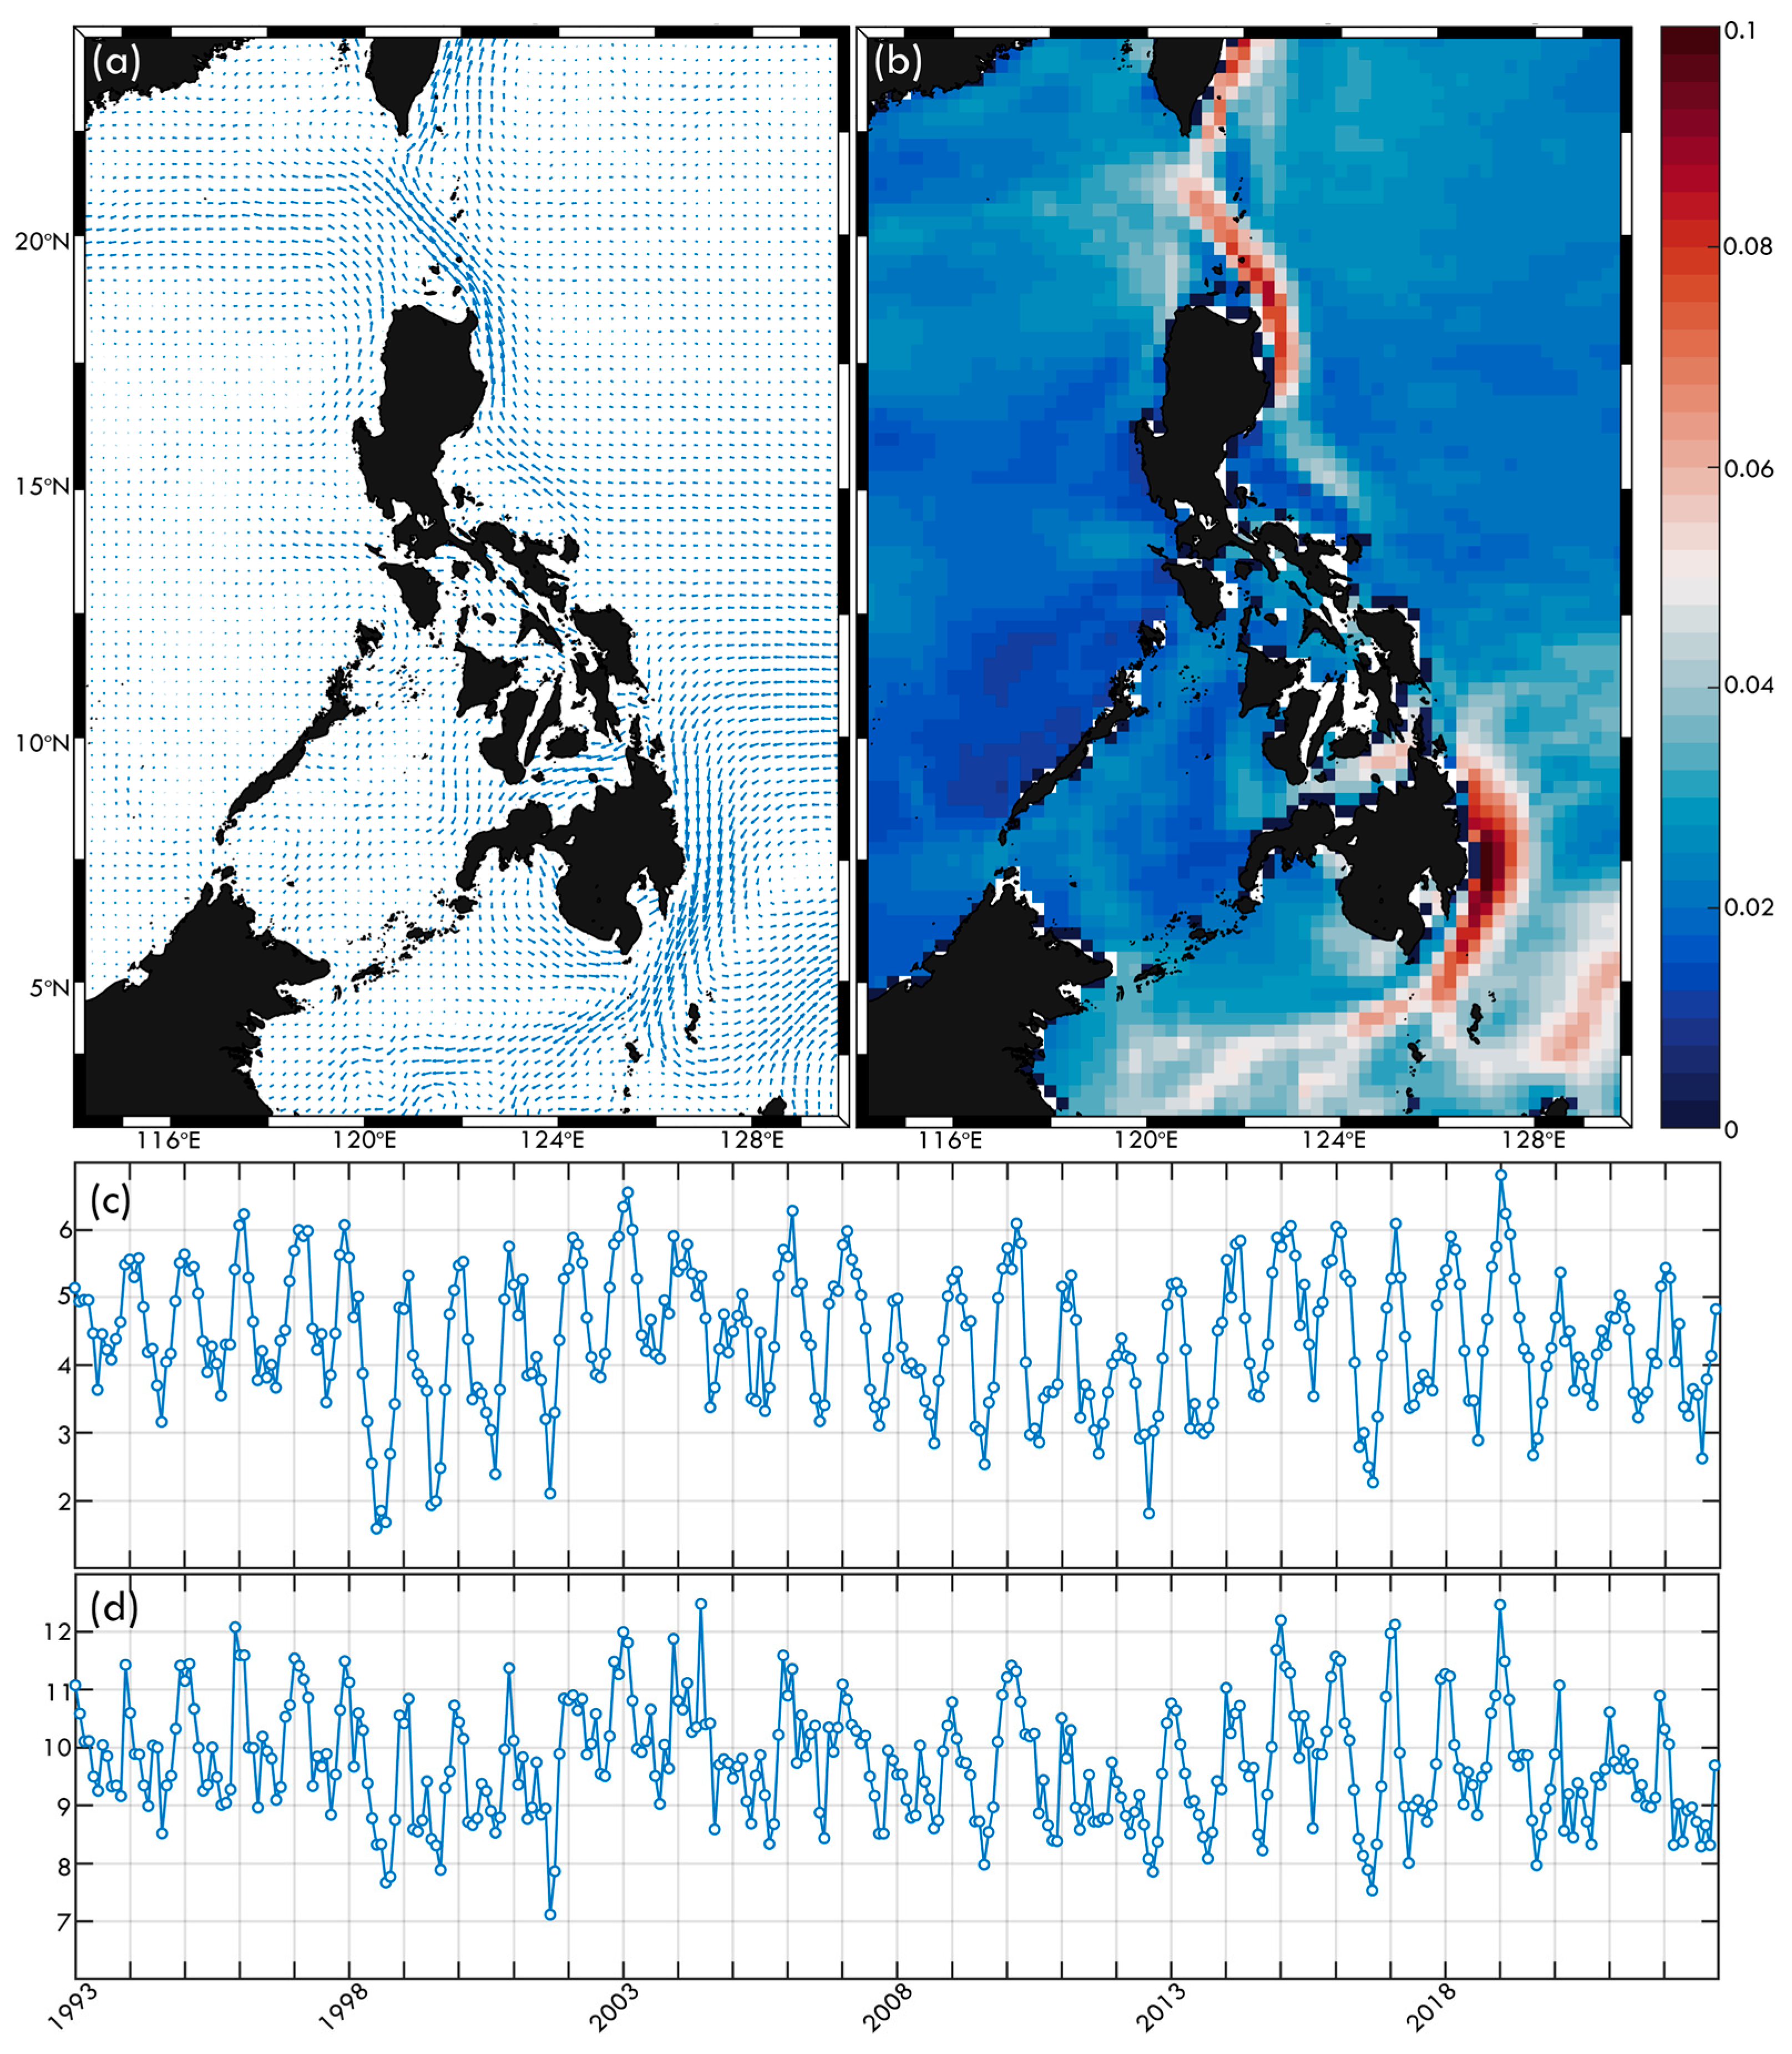
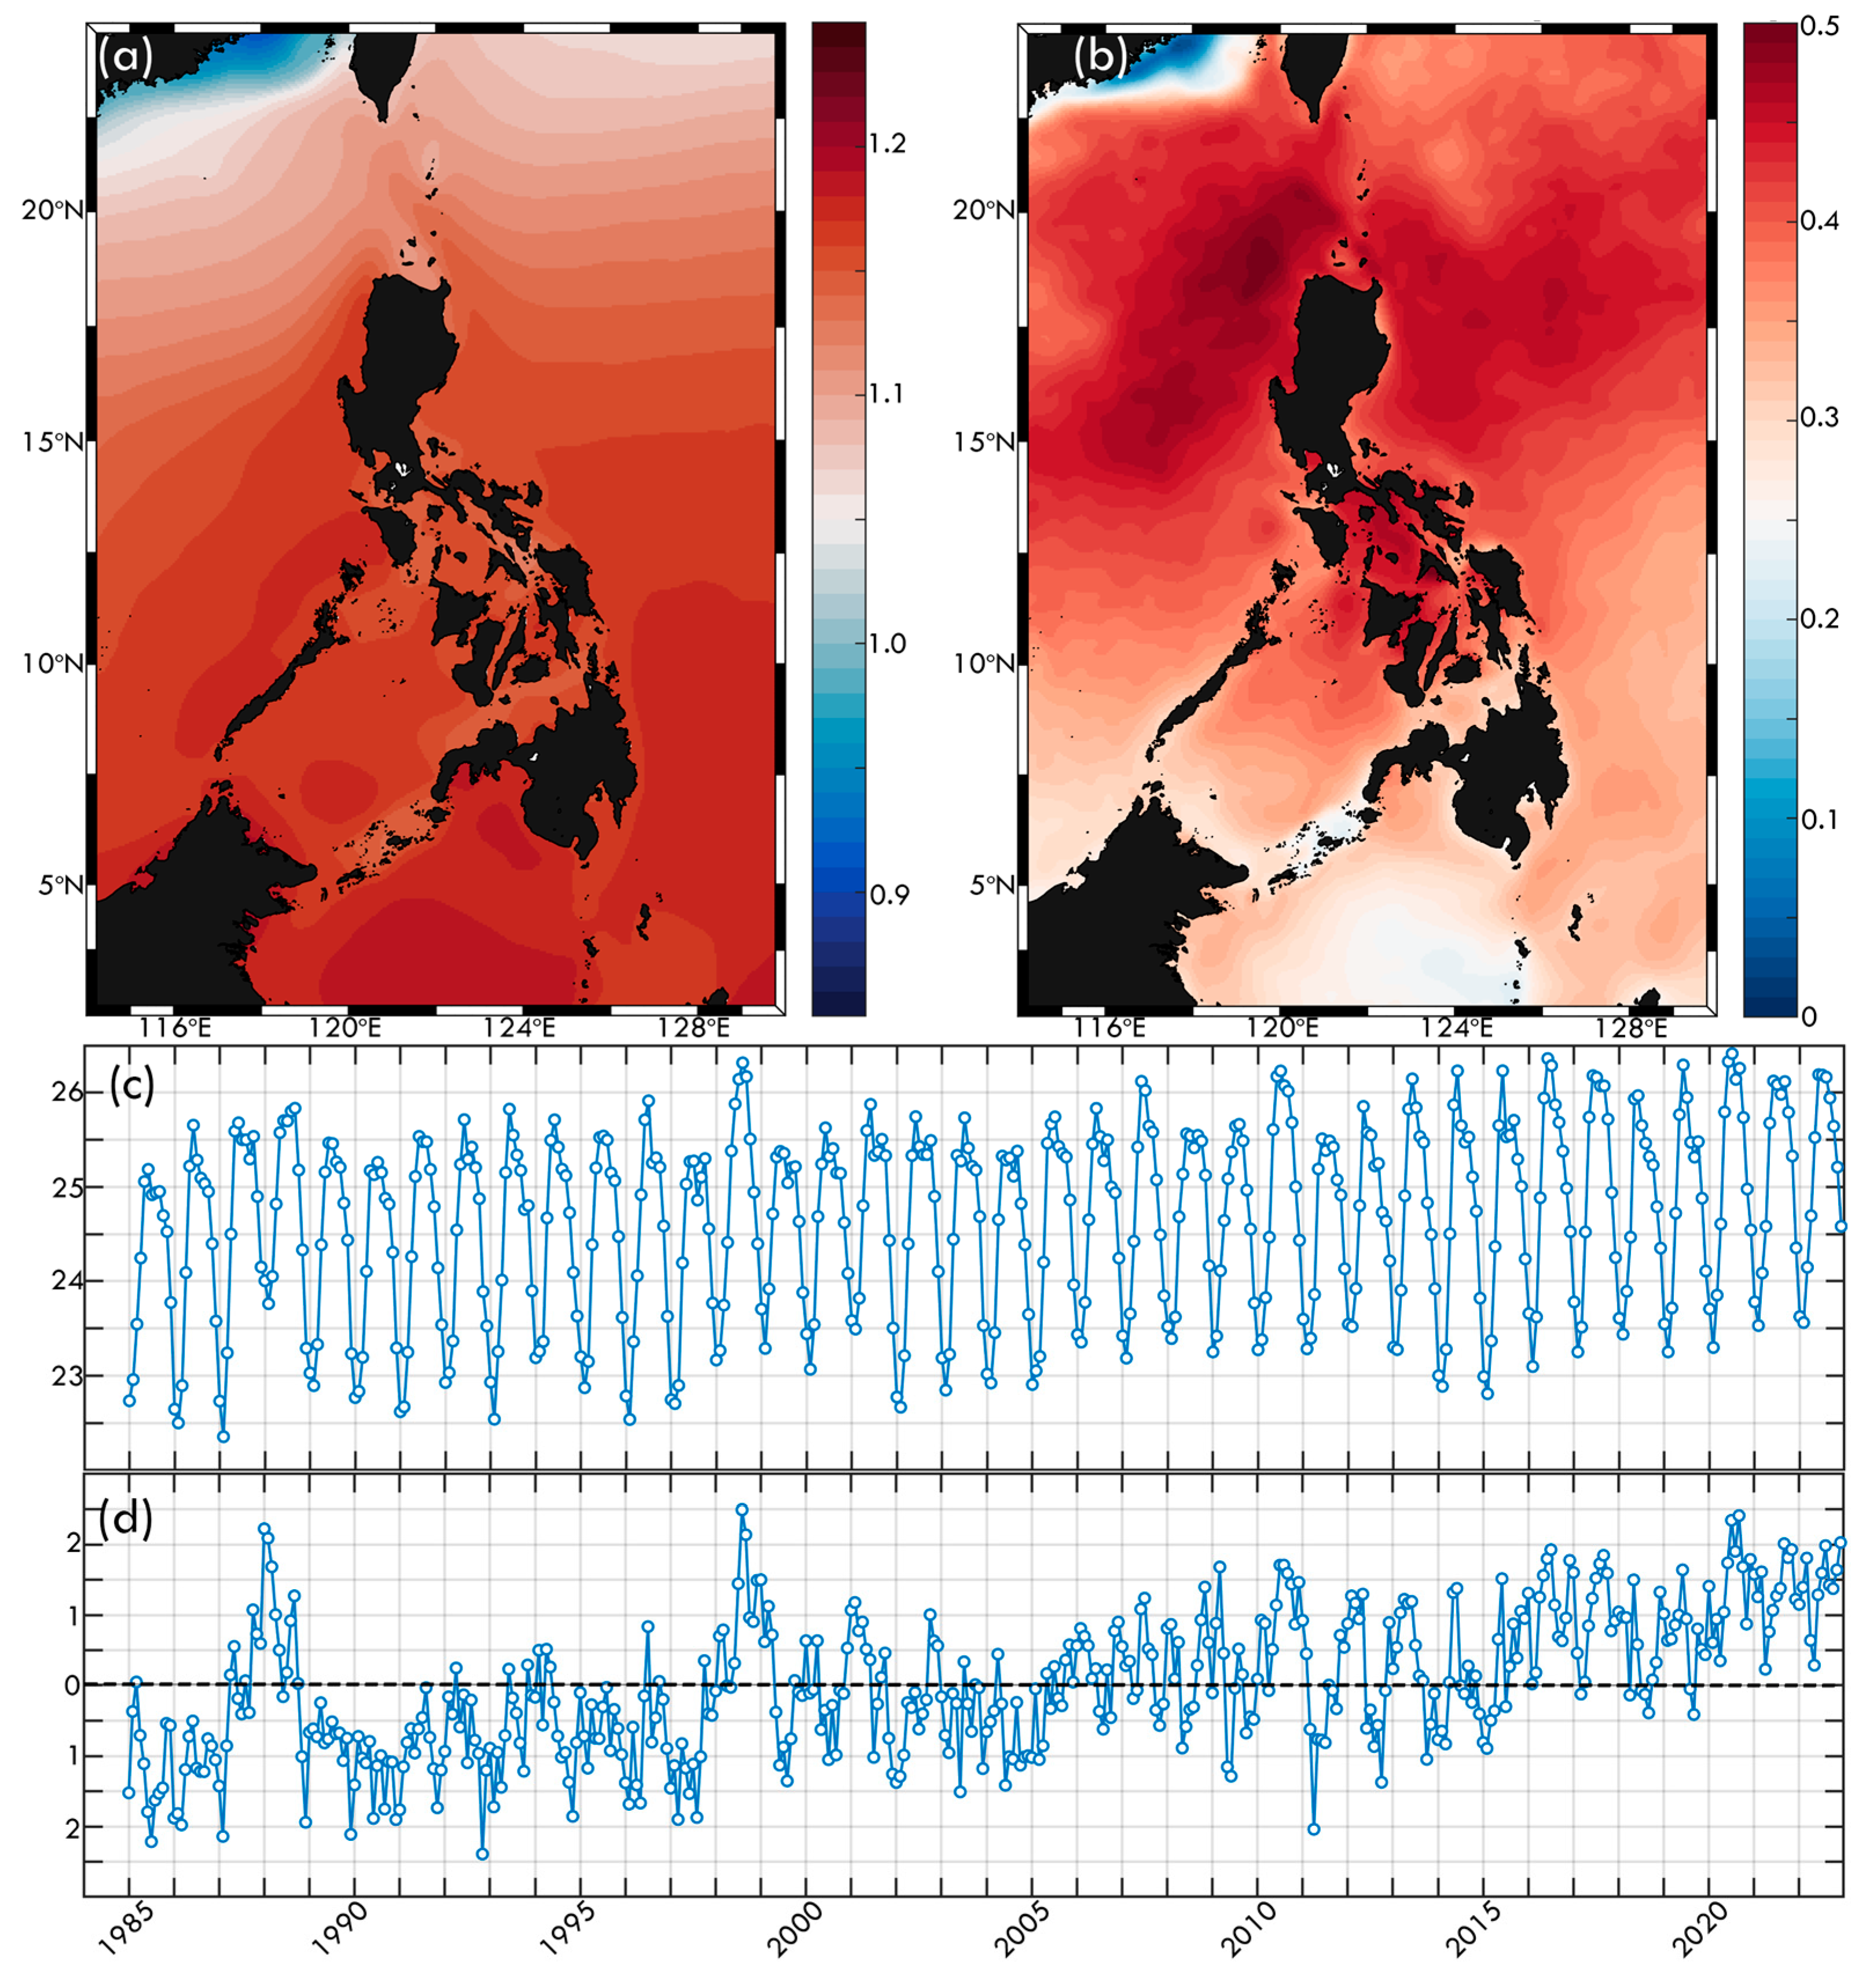
3.1. Spatiotemporal Variation Characteristics of Ocean Currents and SST
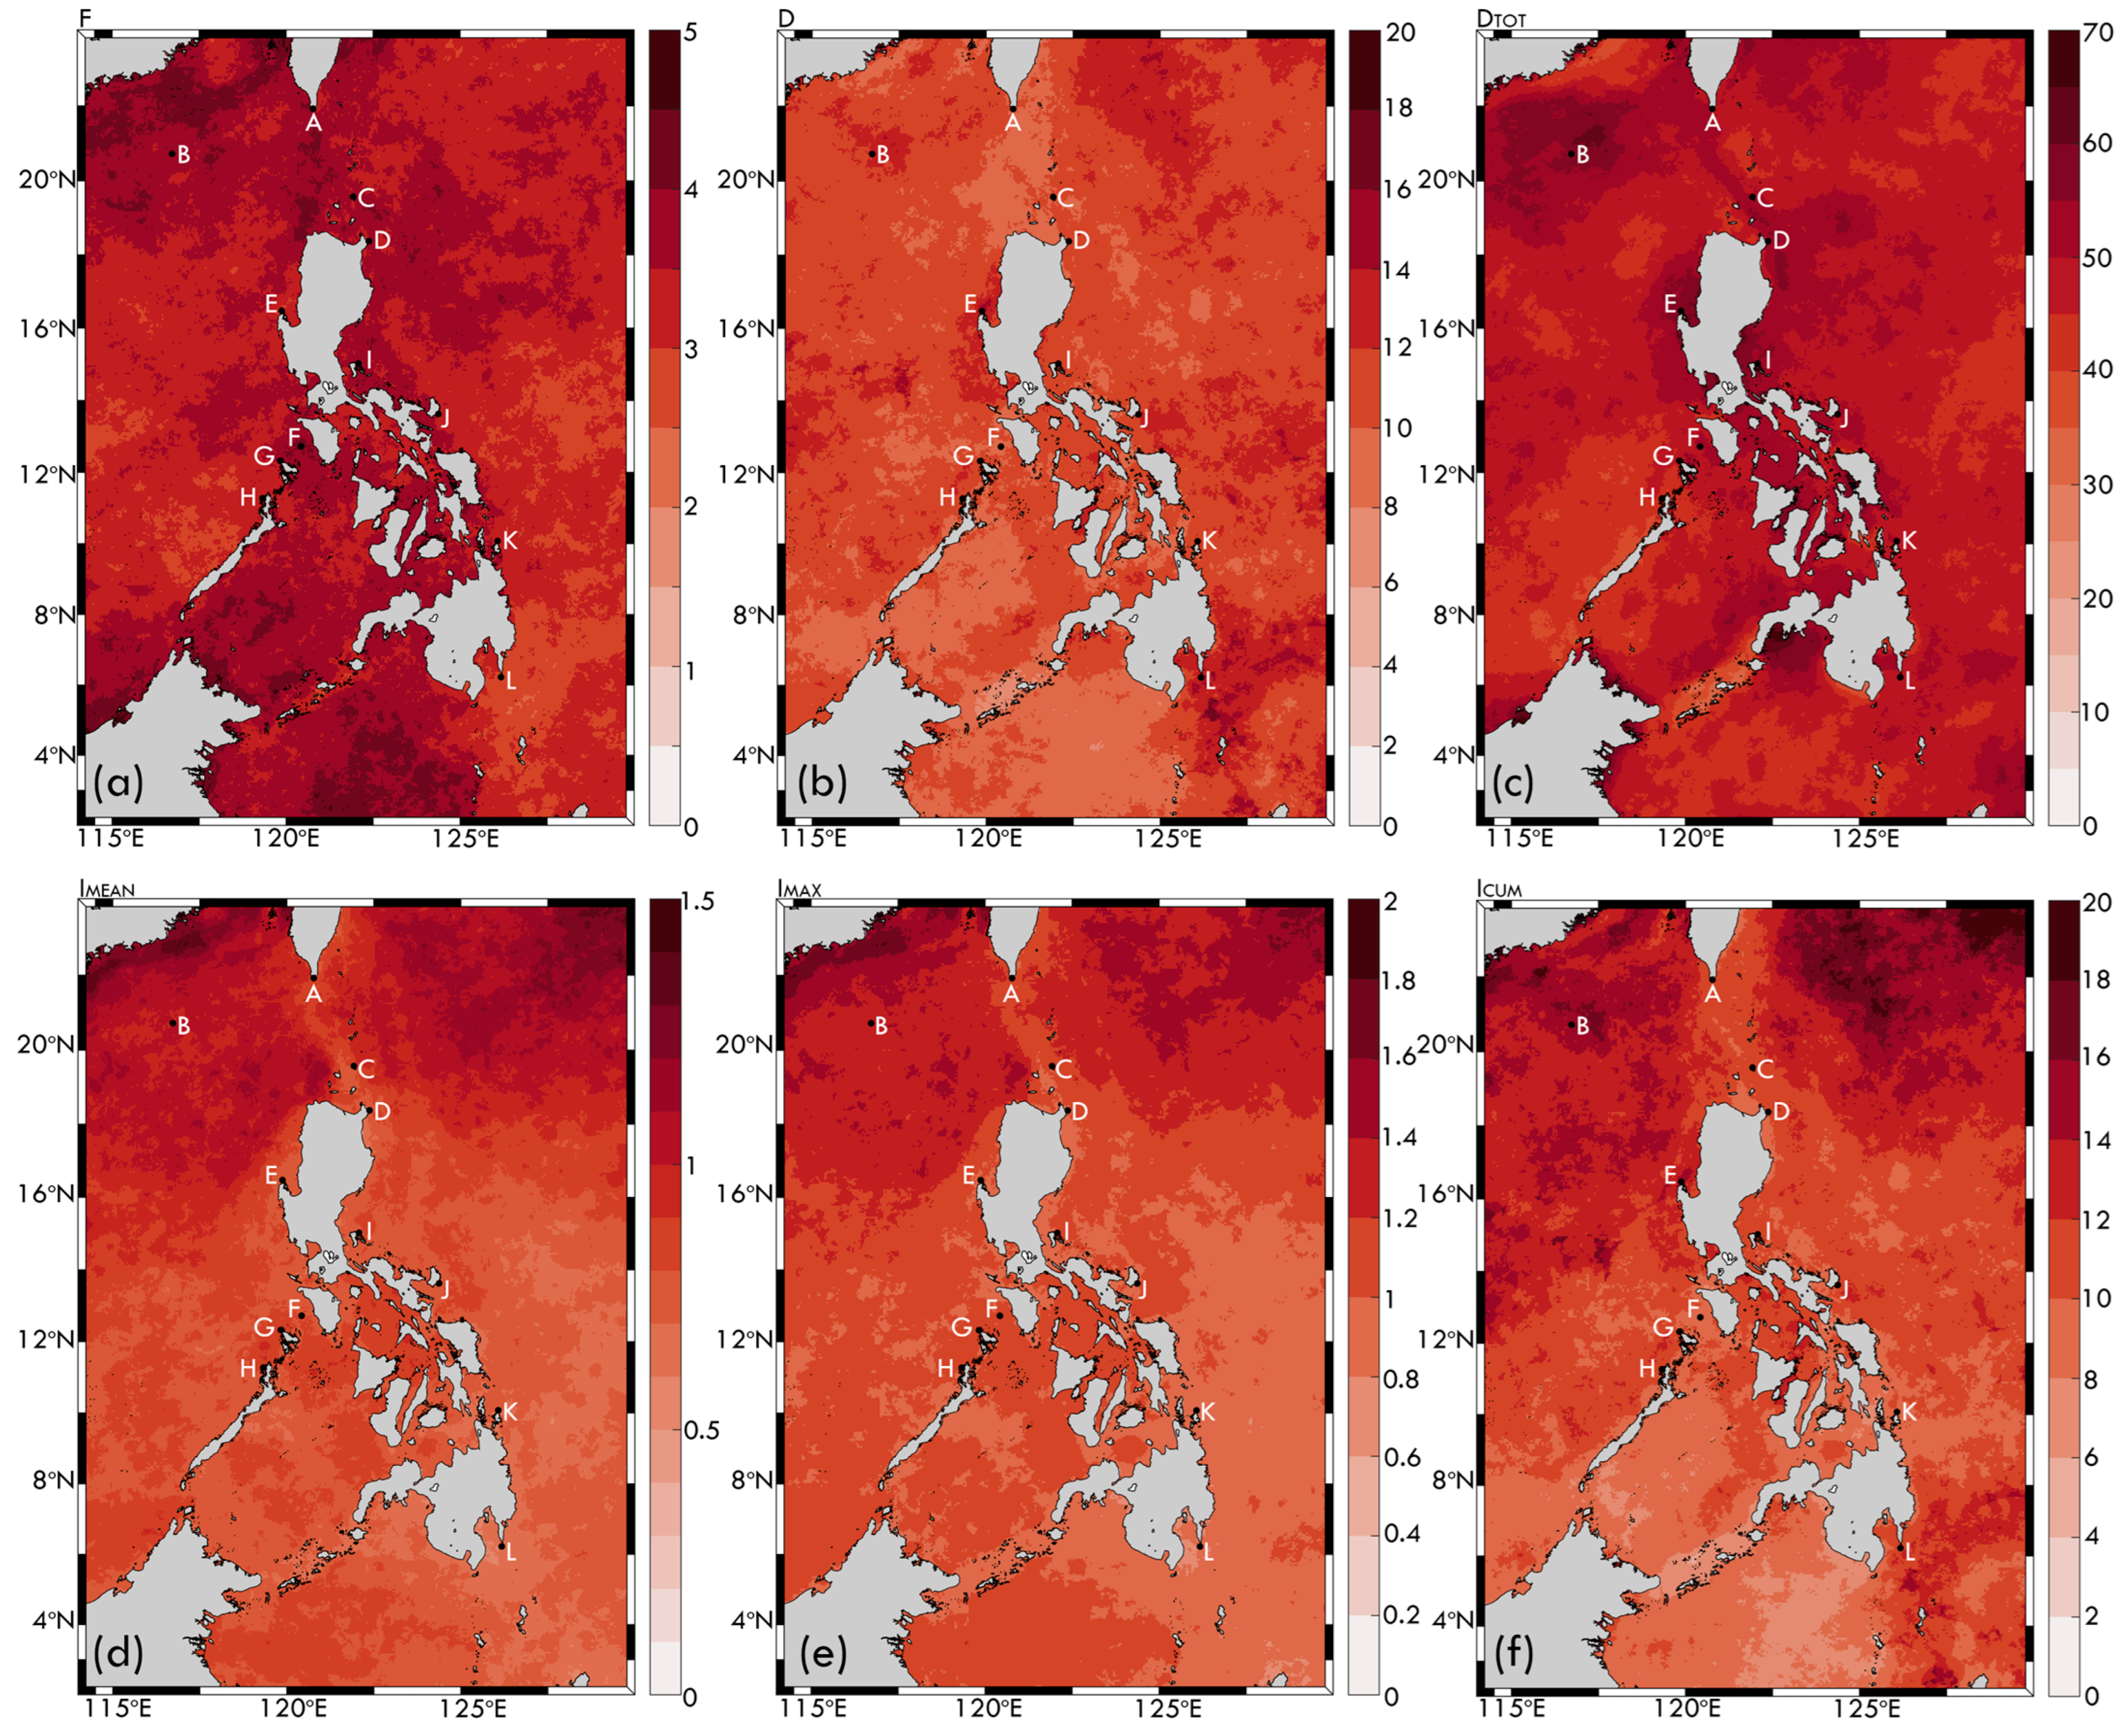
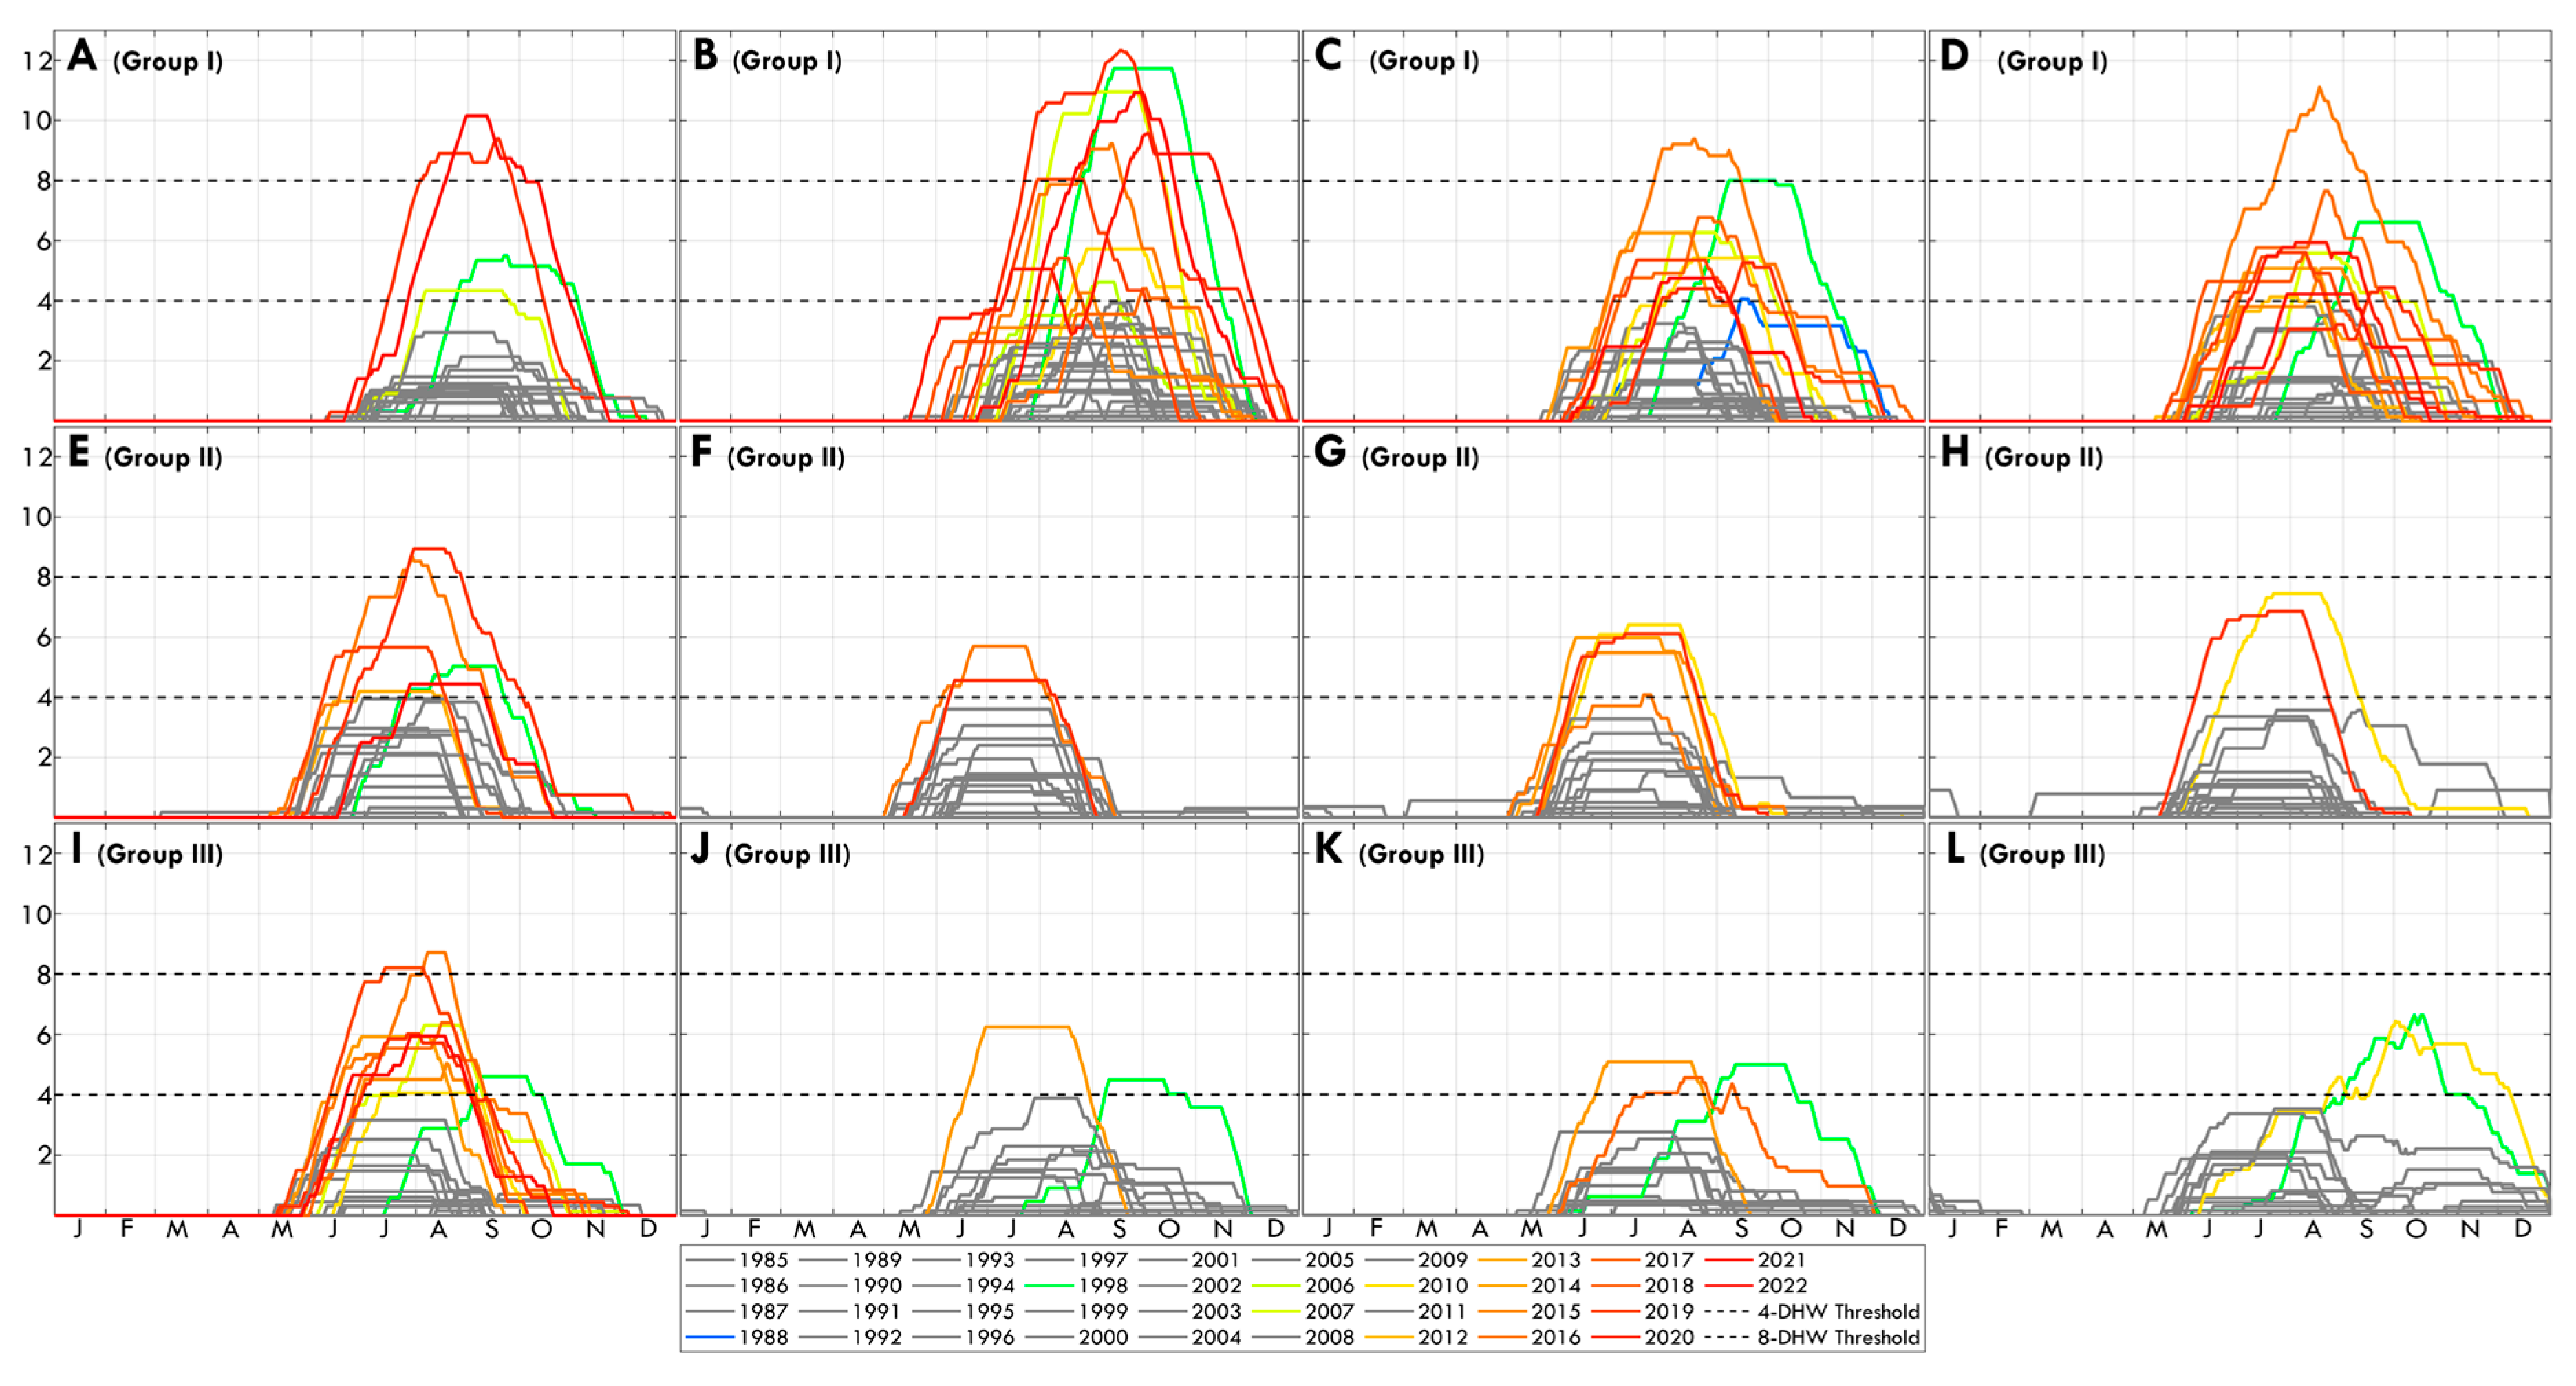
3.2. The Spatiotemporal Characteristics of MHWs Experienced by Coral Habitats
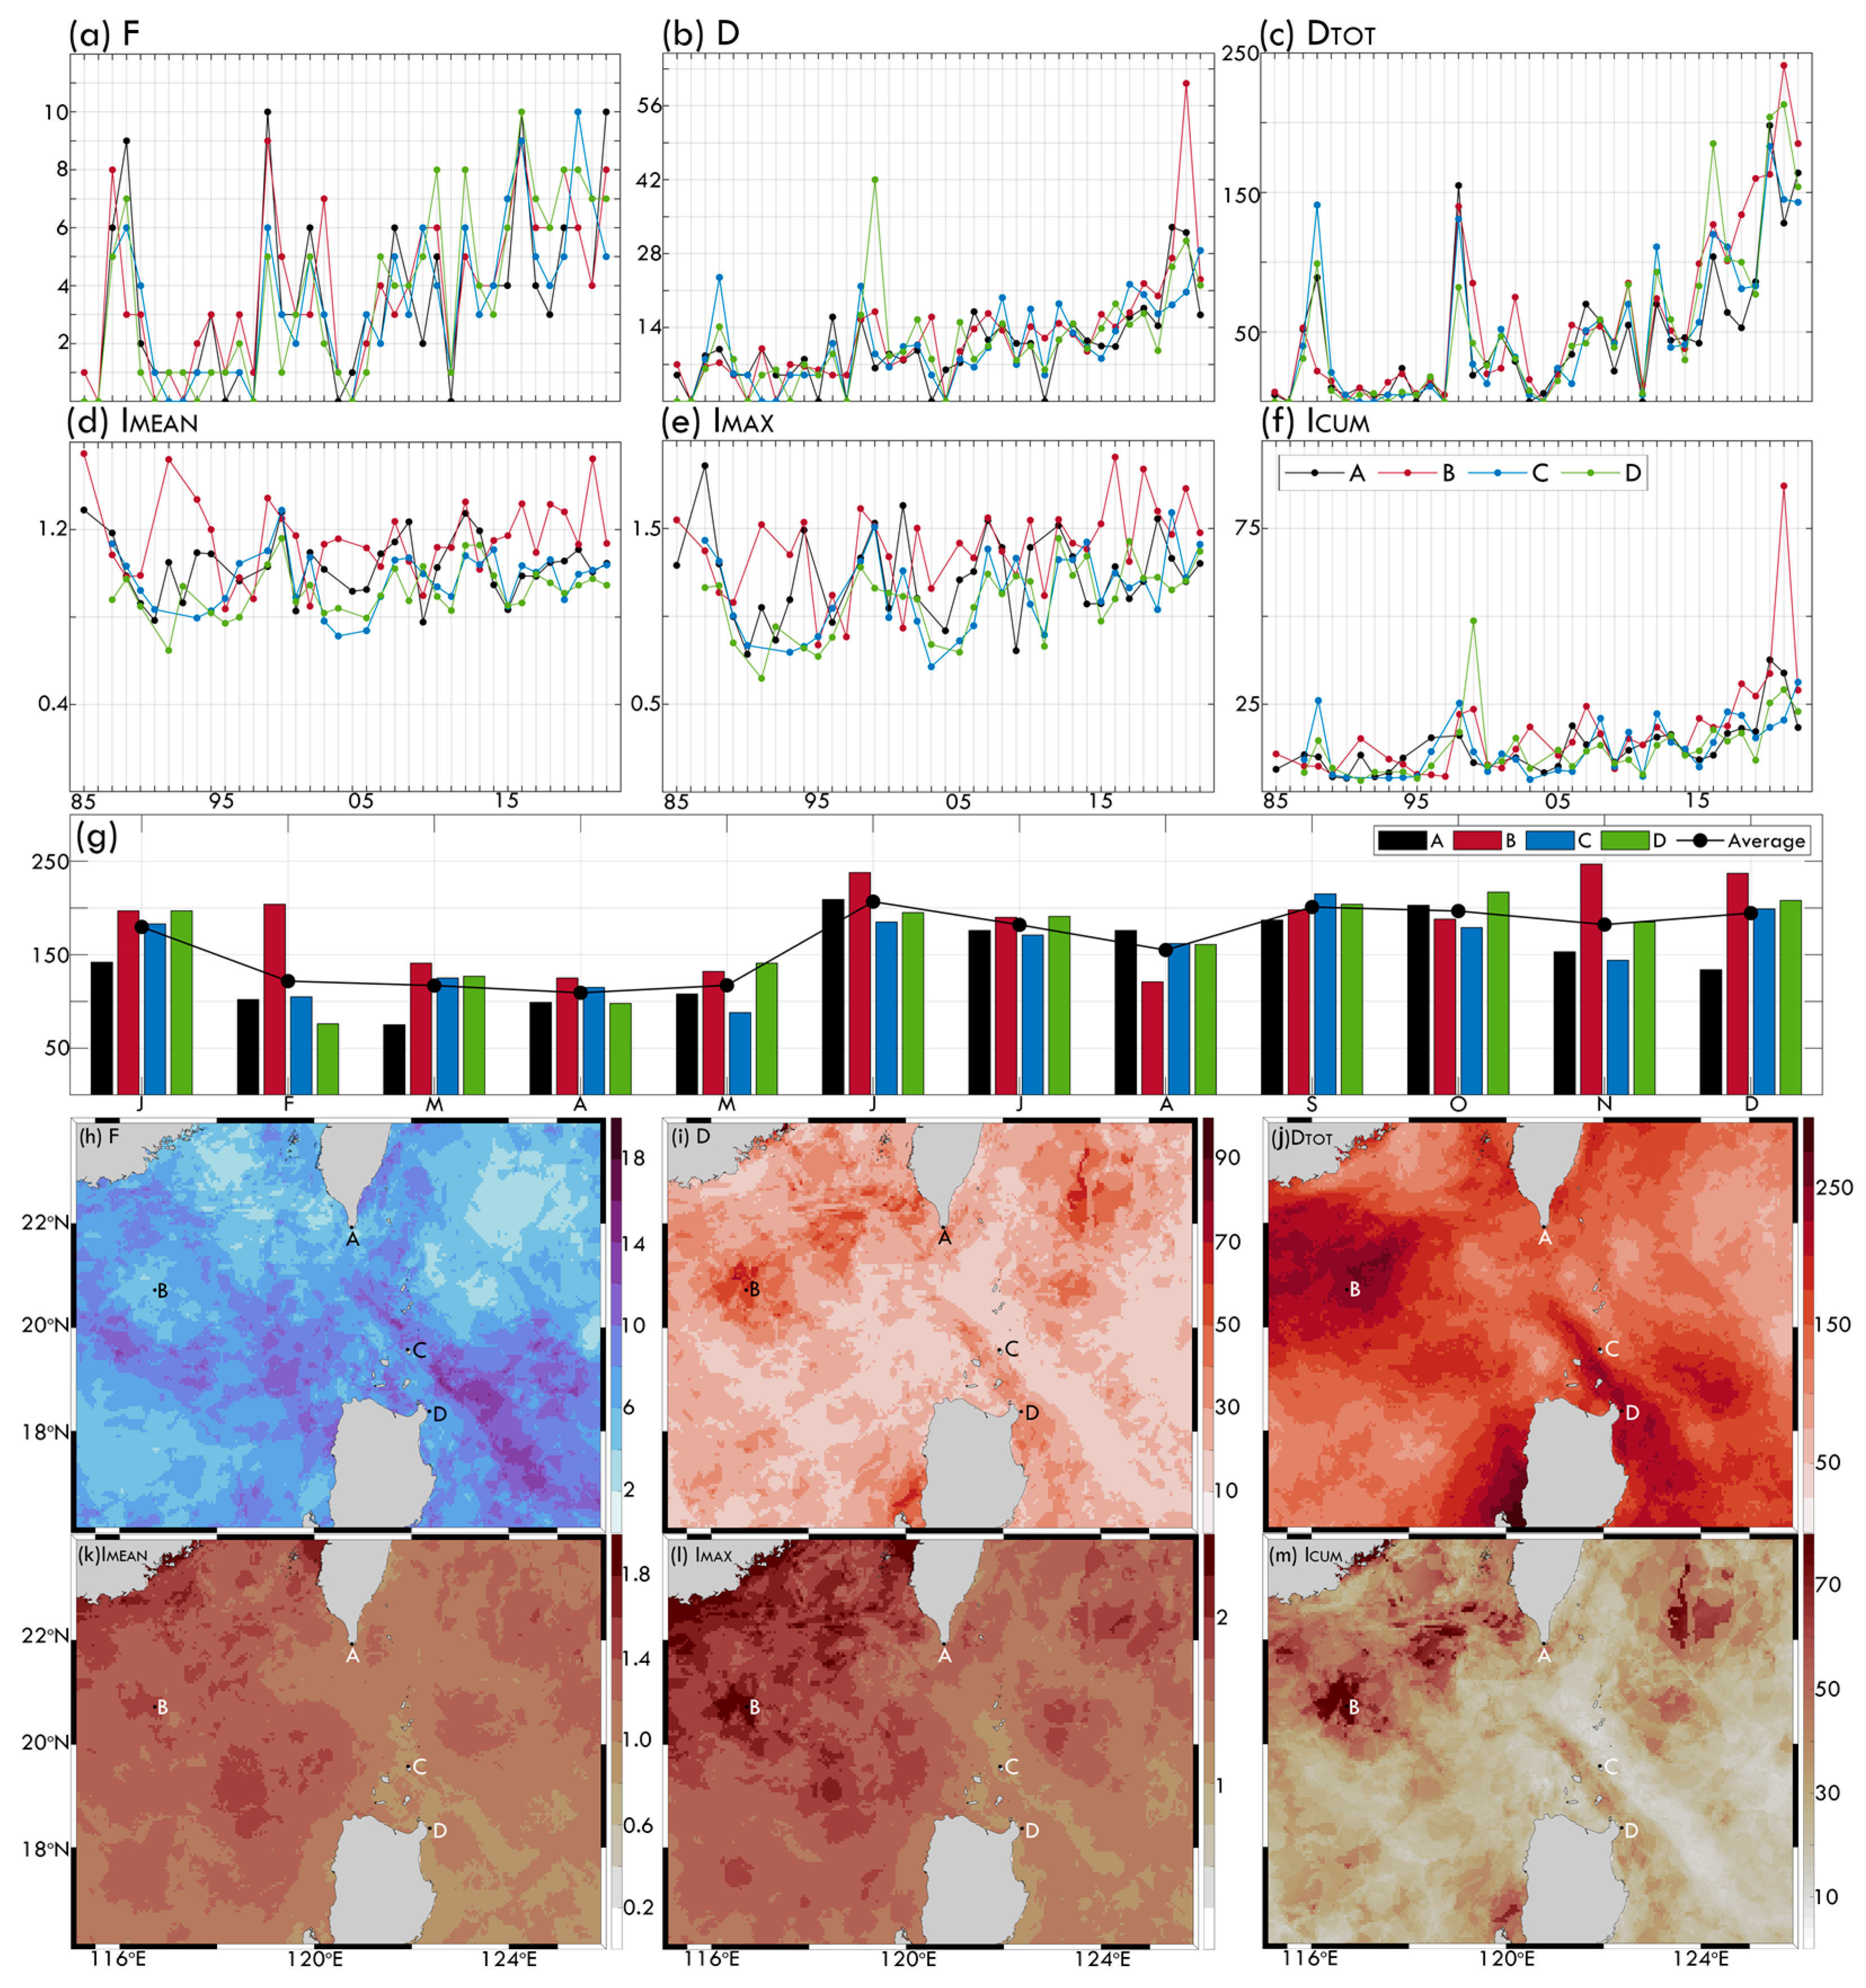
3.2.1. Coral Habitats near the Luzon Strait: Group I
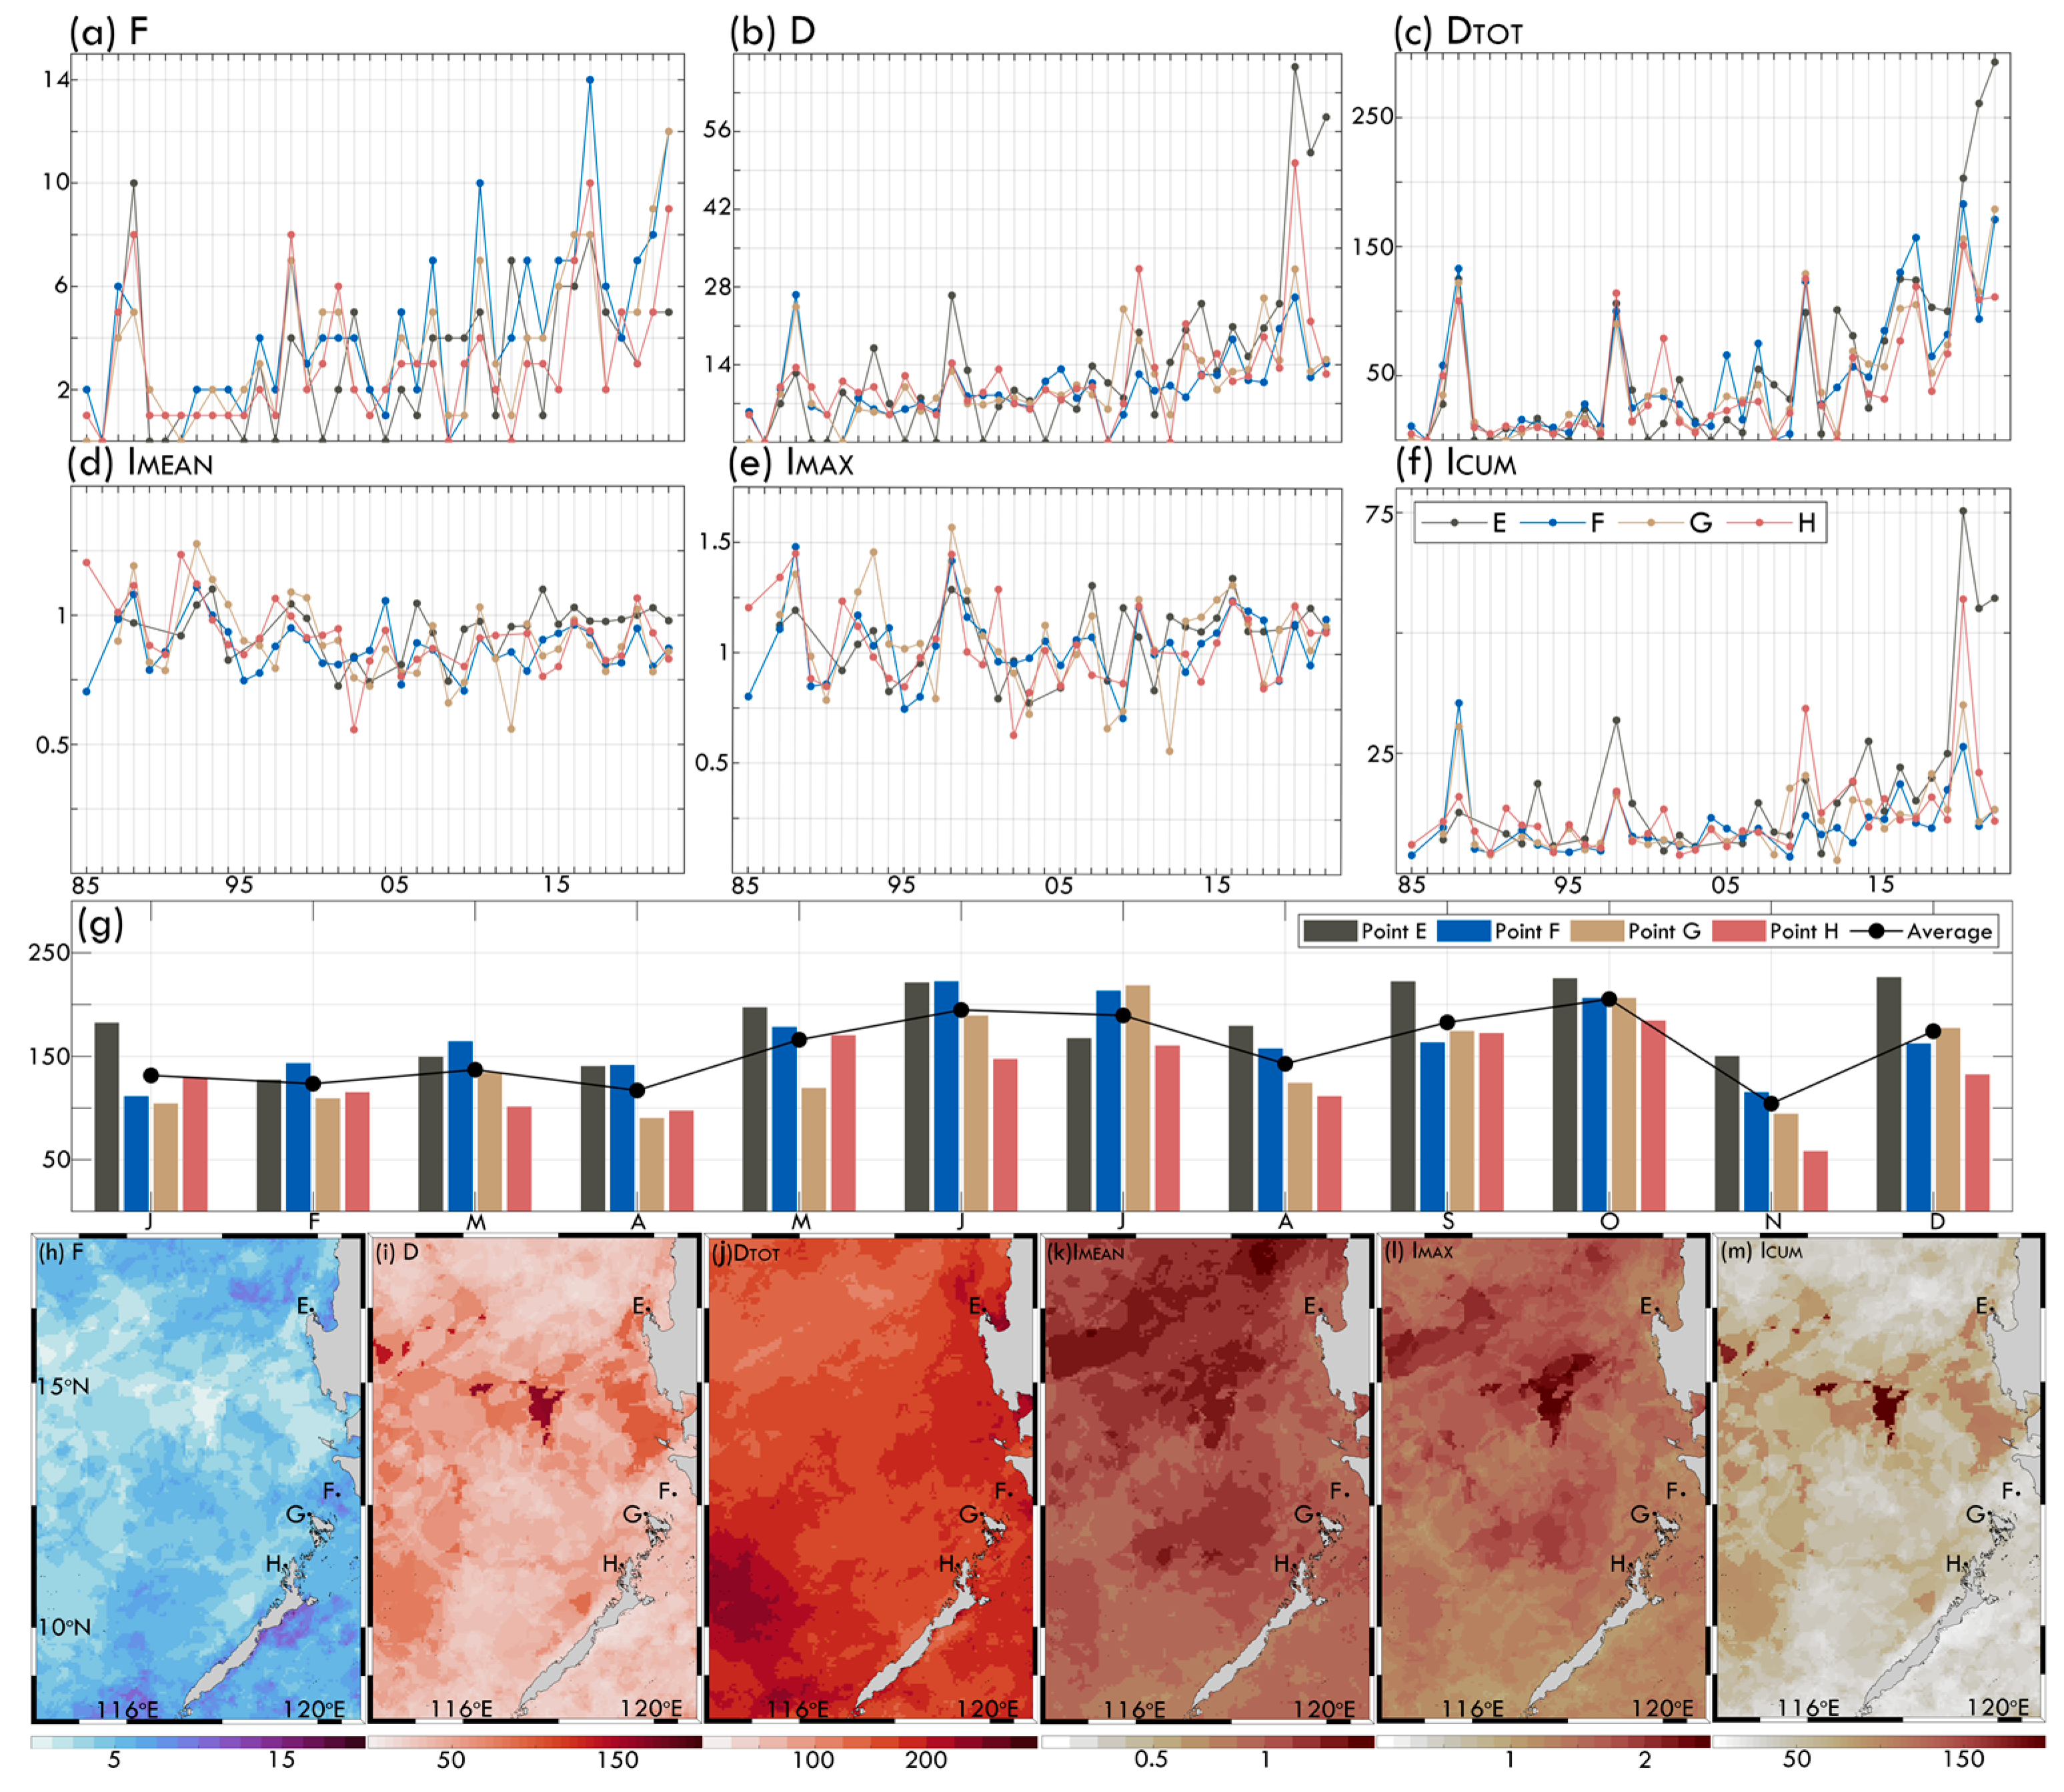
3.2.2. Coral Habitats of the Western Philippines in the WPS: Group II
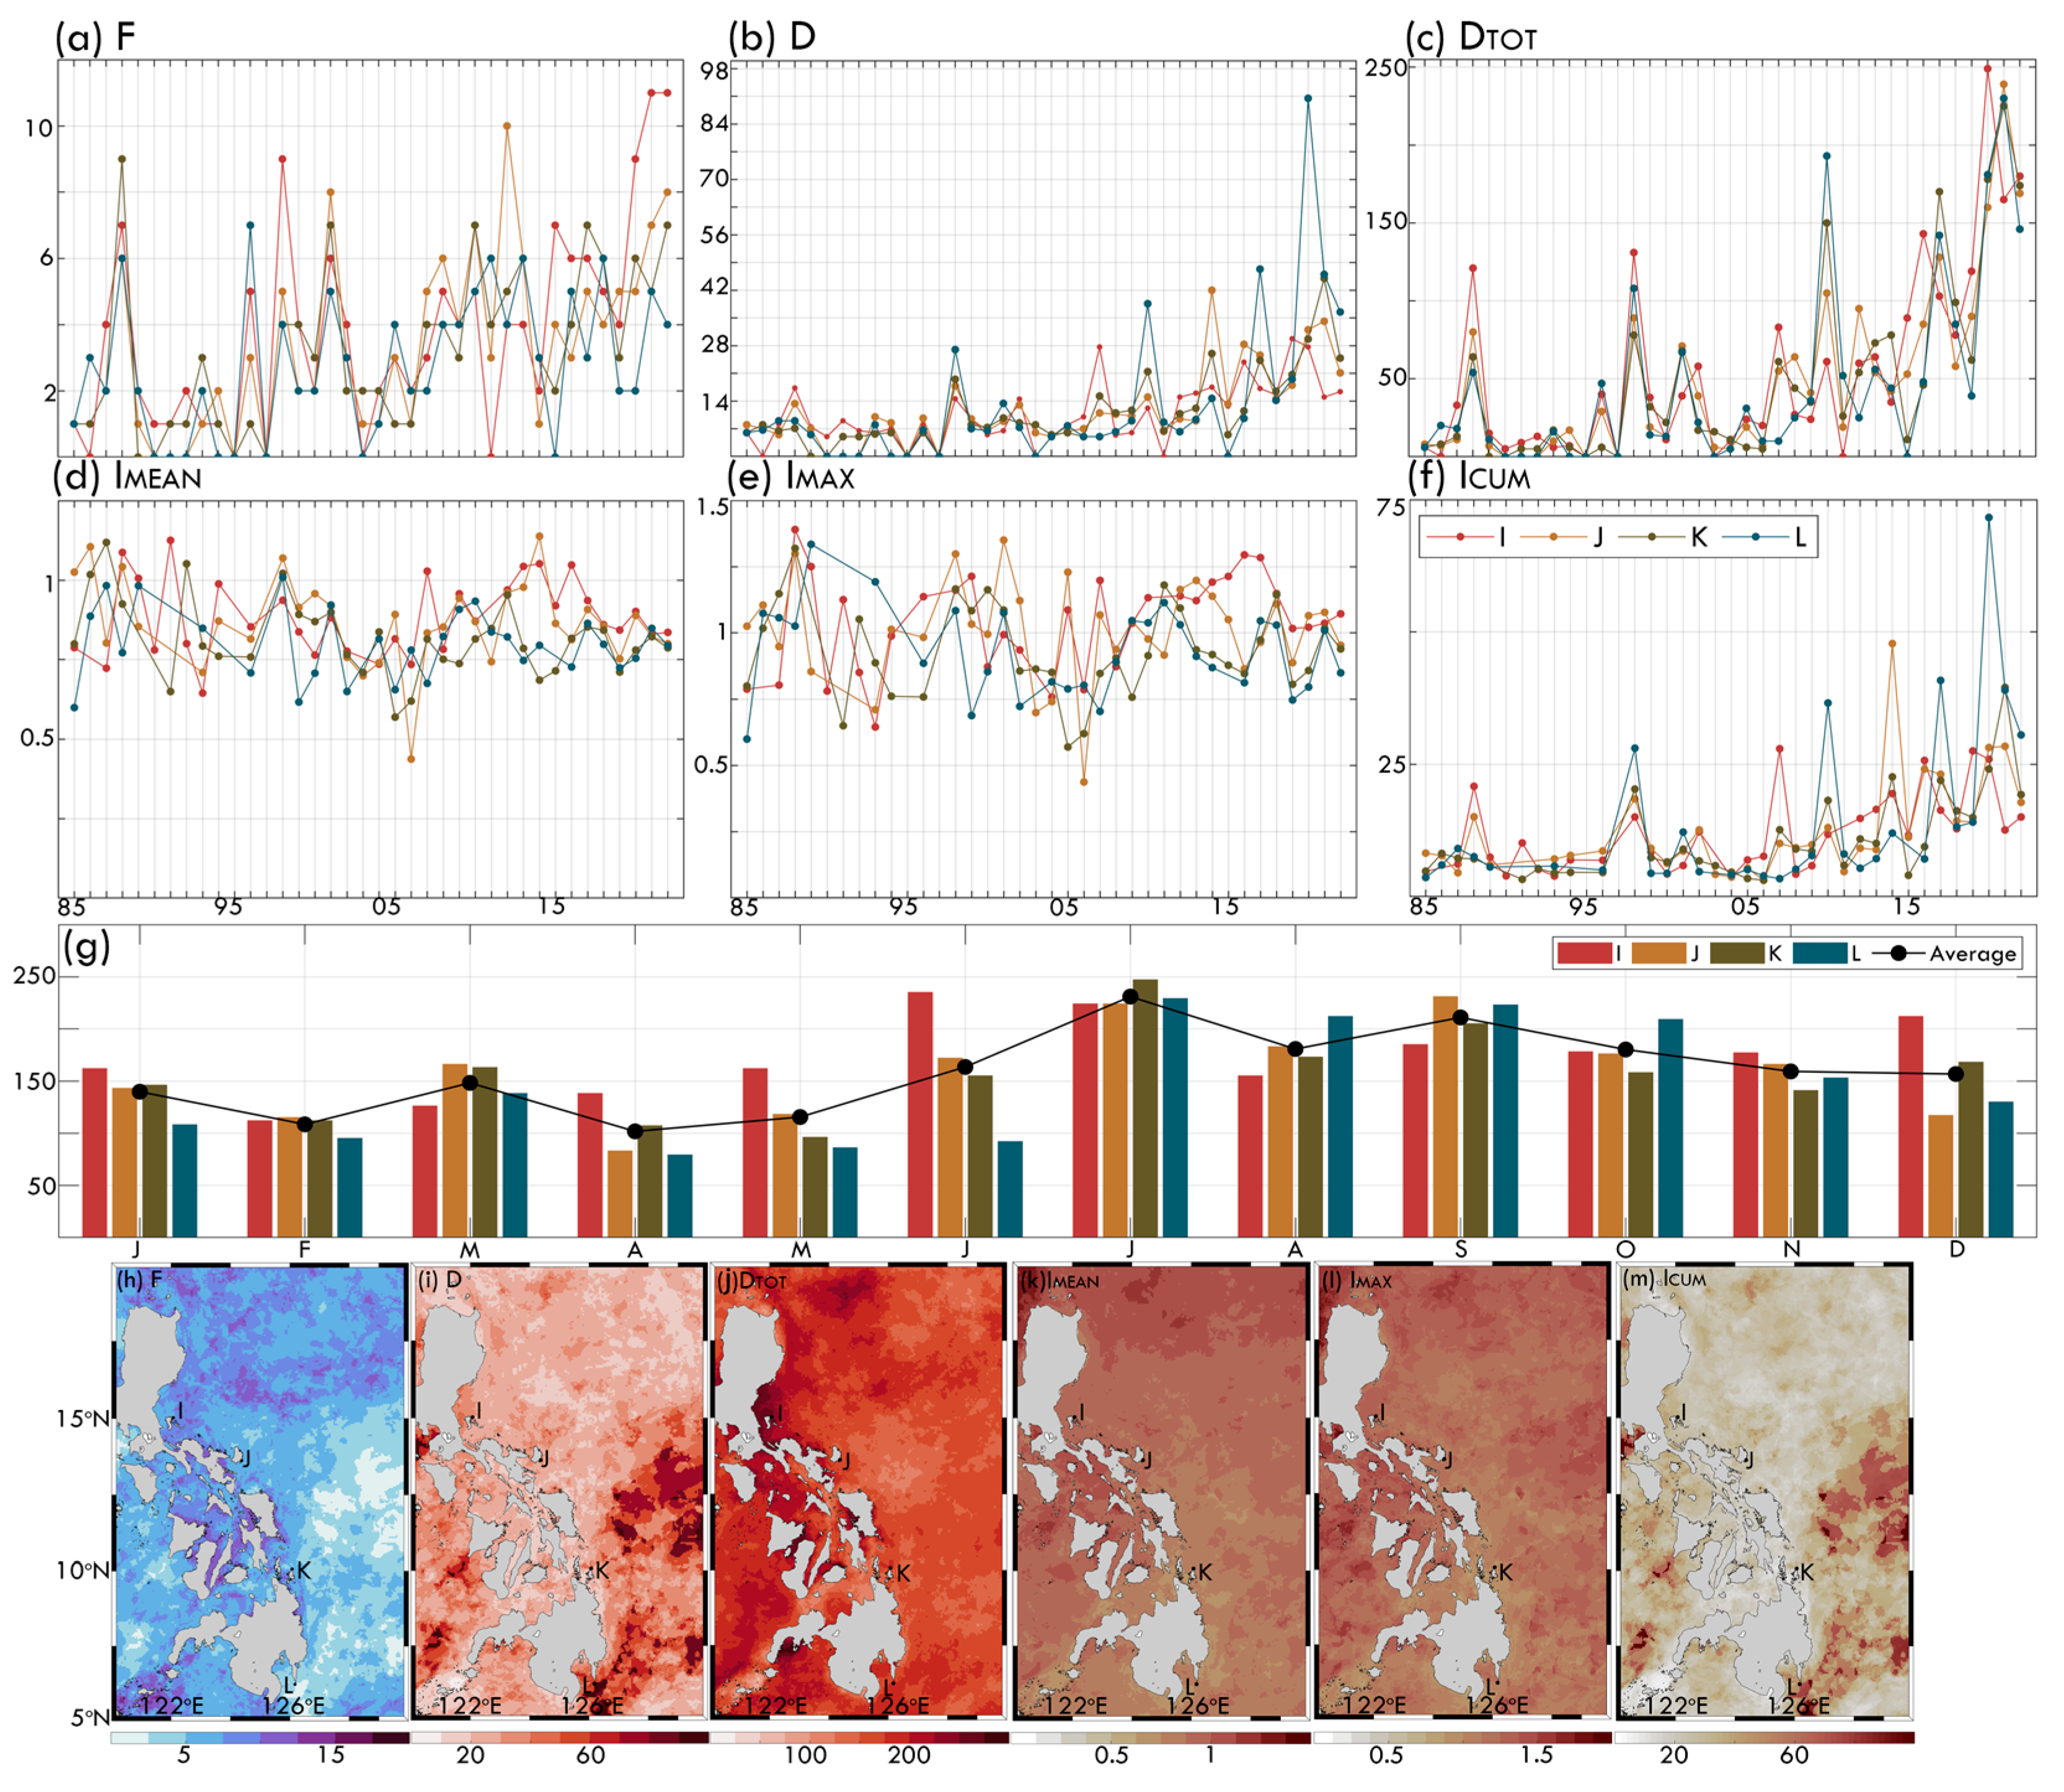
3.2.3. Coral Habitats of the Eastern Philippines in the Pacific: Group III
3.3. Possibility of Coral Bleaching
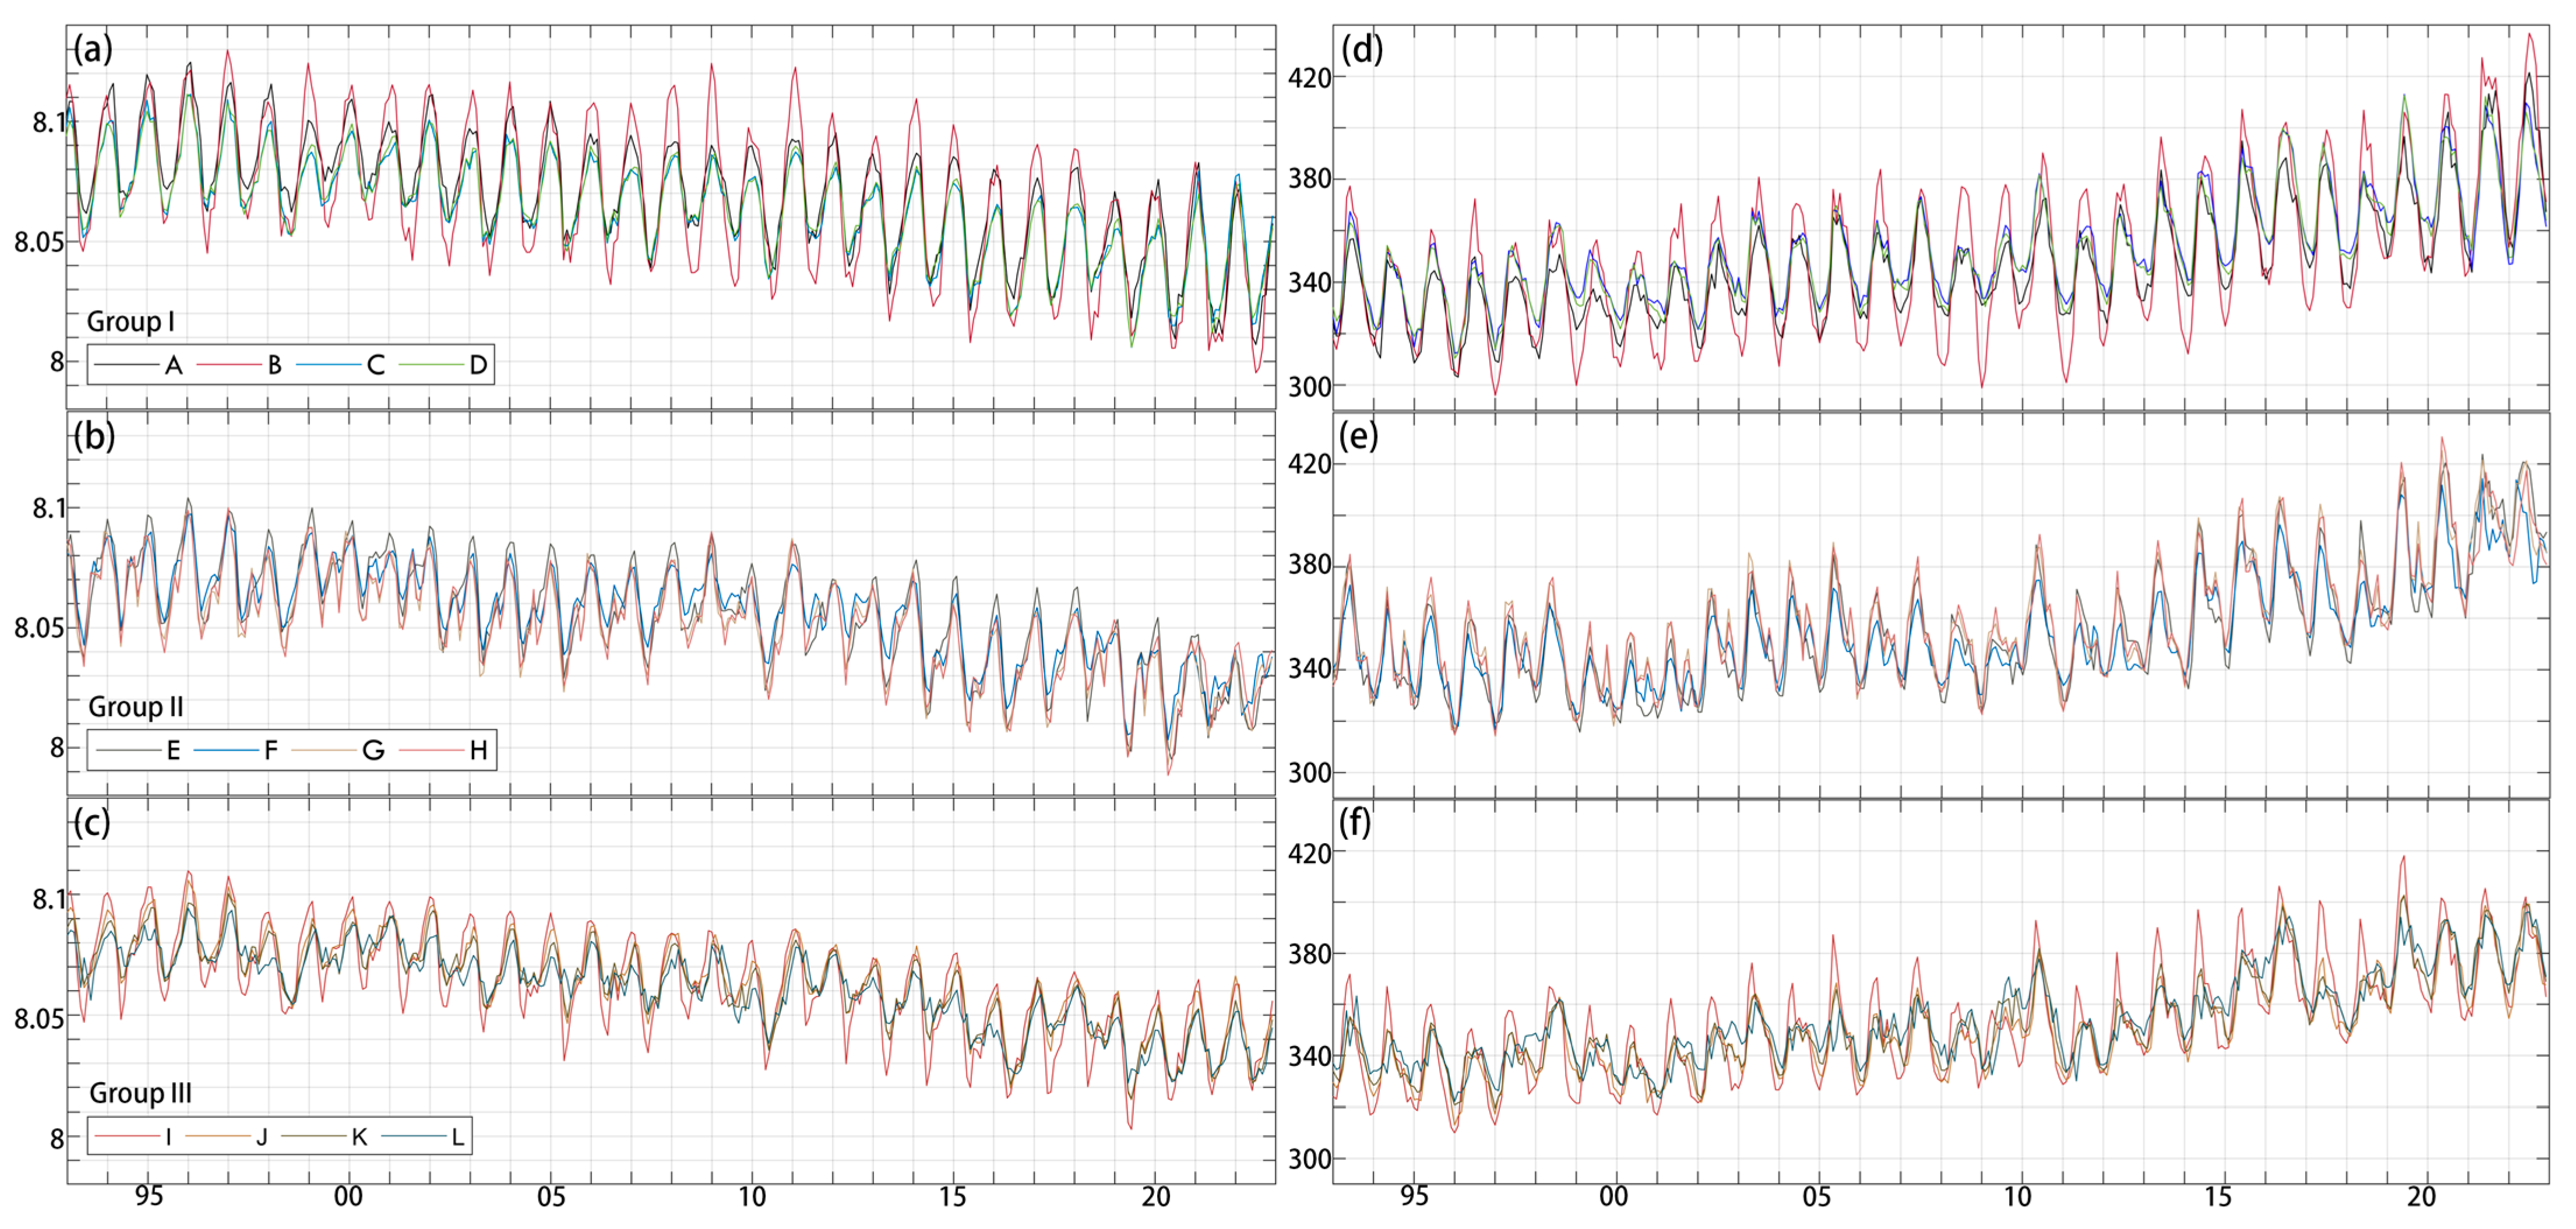
3.4. Coral Habitats Experiencing Gradual Ocean Acidification Trends
3.5. Identifying Vulnerable Coral Reef Regions
3.5.1. Northern Philippines and LS
3.5.2. Western Philippines
3.5.3. Eastern Philippines
4. Discussion
4.1. Historical Bleaching Event Reports and the Challenge of Severe Data Scarcity
4.2. Trend of MHW Events and the Underlying Large-Scale Climate Patterns
5. Conclusions
Author Contributions
Funding
Data Availability Statement
Acknowledgments
Conflicts of Interest
Abbreviations
| CO2 | Carbon dioxide |
| CoralVI | Coral Marine Environmental Vulnerability Index |
| CRW | Coral reef watch |
| DHW | Degree heating weeks |
| D | Duration |
| DTOT | Total MHW days |
| EAS | East Asia Seas |
| EN | El Niño |
| ENSO | El Niño–Southern Oscillation |
| EOF | Empirical Orthogonal Function |
| F | Frequency |
| ICUM | Cumulative intensity |
| IMAX | Maximum intensity |
| IMEAN | Mean intensity |
| ITF | Indonesian throughflow |
| LN | La Niña |
| LS | Luzon strait |
| KC | Kuroshio current |
| MHW | Marine heatwaves |
| MMM | Maximum monthly mean |
| MC | Mindanao current |
| N | Normal |
| NEC | North equatorial current |
| NECC | North equatorial countercurrent |
| OA | Ocean acidification |
| ONI | Oceanic Niño Index |
| PDO | Pacific Decadal Oscillation |
| SST | Sea surface temperature |
| SCS | South China Sea |
| SPCO2 | Surface partial pressure of CO2 |
| TA | Total alkalinity |
| WPS | West Philippine Sea |
Appendix A


References
- Anthony, K.R.; Kline, D.I.; Diaz-Pulido, G.; Dove, S.; Hoegh-Guldberg, O. Ocean acidification causes bleaching and productivity loss in coral reef builders. Proc. Natl. Acad. Sci. USA 2008, 105, 17442–17446. [Google Scholar] [CrossRef] [PubMed]
- Hoegh-Guldberg, O.; Mumby, P.J.; Hooten, A.J.; Steneck, R.S.; Greenfield, P.; Gomez, E.; Harvell, C.D.; Sale, P.F.; Edwards, A.J.; Caldeira, K.; et al. Coral reefs under rapid climate change and ocean acidification. Science 2007, 318, 1737–1742. [Google Scholar] [CrossRef]
- Parry, M.L. (Ed.) Climate Change 2007-Impacts, Adaptation and Vulnerability: Working Group II Contribution to the Fourth Assessment Report of the IPCC; Cambridge University Press: Cambridge, UK, 2007; Volume 4. [Google Scholar]
- Cheng, L.; Abraham, J.; Hausfather, Z.; Trenberth, K.E. How fast are the oceans warming? Science 2019, 363, 128–129. [Google Scholar] [CrossRef] [PubMed]
- Hoegh-Guldberg, O. Climate change, coral bleaching and the future of the world’s coral reefs. Mar. Freshw. Res. 1999, 50, 839–866. [Google Scholar] [CrossRef]
- Erez, J.; Reynaud, S.; Silverman, J.; Schneider, K.; Allemand, D. Coral calcification under ocean acidification and global change. In Coral Reefs: An Ecosystem in Transition; Springer: Dordrecht, The Netherlands, 2011; pp. 151–176. [Google Scholar] [CrossRef]
- Eakin, C.M.; Sweatman, H.P.; Brainard, R.E. The 2014–2017 global-scale coral bleaching event: Insights and impacts. Coral Reefs 2019, 38, 539–545. [Google Scholar] [CrossRef]
- Mason, R.A.; Skirving, W.J.; Dove, S.G. Integrating physiology with remote sensing to advance the prediction of coral bleaching events. Remote Sens. Environ. 2020, 246, 111794. [Google Scholar] [CrossRef]
- Lachs, L.; Bythell, J.C.; East, H.K.; Edwards, A.J.; Mumby, P.J.; Skirving, W.J.; Spady, B.L.; Guest, J.R. Fine-tuning heat stress algorithms to optimise global predictions of mass coral bleaching. Remote Sens. 2021, 13, 2677. [Google Scholar] [CrossRef]
- Hoegh-Guldberg, O.; Skirving, W.; Dove, S.G.; Spady, B.L.; Norrie, A.; Geiger, E.F.; Liu, G.; De La Cour, J.L.; Manzello, D.P. Coral reefs in peril in a record-breaking year. Science 2023, 382, 1238–1240. [Google Scholar] [CrossRef]
- Hobday, A.J.; Alexander, L.V.; Perkins, S.E.; Smale, D.A.; Straub, S.C.; Oliver, E.C.; Benthuysen, J.A.; Burrows, M.T.; Donat, M.G.; Feng, M.; et al. A hierarchical approach to defining marine heatwaves. Prog. Oceanogr. 2016, 141, 227–238. [Google Scholar] [CrossRef]
- Holbrook, N.J.; Scannell, H.A.; Sen Gupta, A.; Benthuysen, J.A.; Feng, M.; Oliver, E.C.; Alexander, L.V.; Burrows, M.T.; Donat, M.G.; Hobday, A.J.; et al. A global assessment of marine heatwaves and their drivers. Nat. Commun. 2019, 10, 2624. [Google Scholar] [CrossRef]
- Hughes, T.P.; Kerry, J.T.; Álvarez-Noriega, M.; Álvarez-Romero, J.G.; Anderson, K.D.; Baird, A.H.; Babcock, R.C.; Beger, M.; Bellwood, D.R.; Berkelmans, R.; et al. Global warming and recurrent mass bleaching of corals. Nature 2017, 543, 373–377. [Google Scholar] [CrossRef] [PubMed]
- Frölicher, T.L.; Fischer, E.M.; Gruber, N. Marine heatwaves under global warming. Nature 2018, 560, 360–364. [Google Scholar] [CrossRef]
- Oliver, E.C.; Donat, M.G.; Burrows, M.T.; Moore, P.J.; Smale, D.A.; Alexander, L.V.; Benthuysen, J.A.; Feng, M.; Gupta, A.S.; Hobday, A.J.; et al. Longer and more frequent marine heatwaves over the past century. Nat. Commun. 2018, 9, 1324. [Google Scholar] [CrossRef]
- Hauri, C.; Pagès, R.; McDonnell, A.M.; Stuecker, M.F.; Danielson, S.L.; Hedstrom, K.; Irving, B.; Schultz, C.; Doney, S.C. Modulation of ocean acidification by decadal climate variability in the Gulf of Alaska. Commun. Earth Environ. 2021, 2, 191. [Google Scholar] [CrossRef]
- Ishizu, M.; Miyazawa, Y.; Guo, X. Long-term variations in ocean acidification indices in the Northwest Pacific from 1993 to 2018. Clim. Change 2021, 168, 29. [Google Scholar] [CrossRef]
- Babcock, R.C.; Thomson, D.P.; Haywood, M.D.E.; Vanderklift, M.A.; Pillans, R.; Rochester, W.A.; Miller, M.; Speed, C.W.; Shedrawi, G.; Field, S.; et al. Recurrent coral bleaching in north-western Australia and associated declines in coral cover. Mar. Freshw. Res. 2020, 72, 620–632. [Google Scholar] [CrossRef]
- Hsu, P.C.; Lee, H.J.; Zheng, Q.; Lai, J.W.; Su, F.C.; Ho, C.R. Tide-Induced Periodic Sea Surface Temperature Drops in the Coral Reef Area of Nanwan Bay, Southern Taiwan. J. Geophys. Res. Ocean. 2020, 125, e2019JC015226. [Google Scholar] [CrossRef]
- Chen, W.; Hu, P.; Huangfu, J. Multi-scale climate variations and mechanisms of the onset and withdrawal of the South China Sea summer monsoon. Sci. China Earth Sci. 2022, 65, 1030–1046. [Google Scholar] [CrossRef]
- Hsu, P.C.; Macagga, R.A.T.; Lu, C.Y.; Lo, D.Y.J. Investigation of the Kuroshio-coastal current interaction and marine heatwave trends in the coral habitats of Northeastern Taiwan. Reg. Stud. Mar. Sci. 2024, 71, 103431. [Google Scholar] [CrossRef]
- Hsu, P.C.; Macagga, R.A.T.; Roshin, P.R. Assessment of the Impacts of Rapid Marine Heatwaves and Cumulative Thermal Stress on Cold-Water Upwelling Coral Refugia. Geomat. Nat. Hazards Risk 2025, 16, 2448240. [Google Scholar] [CrossRef]
- Gomez, E.D.; Alino, P.M.; Yap, H.T.; Licuanan, W.Y. A review of the status of Philippine reefs. Mar. Pollut. Bull. 1994, 29, 62–68. [Google Scholar] [CrossRef]
- Nañola, C.L.; Aliño, P.M.; Carpenter, K.E. Exploitation-related reef fish species richness depletion in the epicenter of marine biodiversity. Environ. Biol. Fishes 2011, 90, 405–420. [Google Scholar] [CrossRef]
- Licuanan, W.Y.; Robles, R.; Reyes, M. Status and recent trends in coral reefs of the Philippines. Mar. Pollut. Bull. 2019, 142, 544–550. [Google Scholar] [CrossRef] [PubMed]
- Da-Anoy, J.P.; Cabaitan, P.C.; Conaco, C. Species variability in the response to elevated temperature of select corals in north-western Philippines. J. Mar. Biol. Assoc. U. K. 2019, 99, 1273–1279. [Google Scholar] [CrossRef]
- Isah, R.R.; Enochs, I.C.; San Diego-McGlone, M.L. Sea surface carbonate dynamics at reefs of Bolinao, Philippines: Seasonal variation and fish mariculture-induced forcing. Front. Mar. Sci. 2022, 9, 858853. [Google Scholar] [CrossRef]
- Edullantes, B.; Concolis, B.M.M.; Quilestino-Olario, R.; Atup, D.P.D.; Cortes, A.; Yñiguez, A.T. Marine Heatwaves and their Impacts: Research Perspectives in the Philippines. Philipp. J. Sci. 2022, 151, 1885–1892. [Google Scholar] [CrossRef]
- Edullantes, B.; Concolis, B.M.M.; Quilestino-Olario, R.; Atup, D.P.D.; Cortes, A.; Yñiguez, A.T. Characteristics of marine heatwaves in the Philippines. Reg. Stud. Mar. Sci. 2023, 62, 102934. [Google Scholar] [CrossRef]
- Yao, Y.; Wang, C. Variations in summer marine heatwaves in the South China Sea. J. Geophys. Res. Ocean. 2021, 126, e2021JC017792. [Google Scholar] [CrossRef]
- Tan, H.J.; Cai, R.S.; Wu, R.G. Summer marine heatwaves in the South China Sea: Trend, variability and possible causes. Adv. Clim. Change Res. 2022, 13, 323–332. [Google Scholar] [CrossRef]
- Song, Q.; Yao, Y.; Wang, C. Response of future summer marine heatwaves in the South China Sea to enhanced western Pacific subtropical high. Geophys. Res. Lett. 2023, 50, e2023GL103667. [Google Scholar] [CrossRef]
- Reyes, M.; Pavia, R.; van Hooidonk, R. Ocean acidification in the Philippines and the potential role of water pollution management in mitigating an unaddressed threat. Reg. Environ. Change 2023, 23, 107. [Google Scholar] [CrossRef]
- Chang, Y.; Shih, Y.Y.; Tsai, Y.C.; Lu, Y.H.; Liu, J.T.; Hsu, T.Y.; Yang, J.H.; Wu, X.H.; Hung, C.C. Decreasing trend of kuroshio intrusion and its effect on the chlorophyll-a concentration in the Luzon Strait, South China Sea. GIScience Remote Sens. 2022, 59, 633–647. [Google Scholar] [CrossRef]
- Wang, S.; Ummenhofer, C.C.; Oppo, D.W.; Murty, S.A.; Wagner, P.; Böning, C.W.; Biastoch, A. Freshwater contributions to decadal variability of the Indonesian Throughflow. Geophys. Res. Lett. 2023, 50, e2023GL103906. [Google Scholar] [CrossRef]
- Wang, B.; Huang, F.; Wu, Z.; Yang, J.; Fu, X.; Kikuchi, K. Multi-scale climate variability of the South China Sea monsoon: A review. Dyn. Atmos. Ocean. 2009, 47, 15–37. [Google Scholar] [CrossRef]
- Hu, P.; Chen, W.; Chen, S.; Liu, Y.; Huang, R. Extremely early summer monsoon onset in the South China Sea in 2019 following an El Niño event. Mon. Weather Rev. 2020, 148, 1877–1890. [Google Scholar] [CrossRef]
- Yang, S.; Chen, D.; Deng, K. Global effects of climate change in the South China Sea and its surrounding areas. Ocean-Land-Atmos. Res. 2024, 3, 0038. [Google Scholar] [CrossRef]
- Wang, D.; Wang, Q.; Cai, S.; Shang, X.; Peng, S.; Shu, Y.; Xiao, J.; Xie, X.; Zhang, Z.; Liu, Z.; et al. Advances in research of the mid-deep South China Sea circulation. Sci. China Earth Sci. 2019, 62, 1992–2004. [Google Scholar] [CrossRef]
- Liu, D.; Wang, F.; Zhu, J.; Wang, D.; Wang, J.; Xie, Q.; Shu, Y. Impact of assimilation of moored velocity data on low-frequency current estimation in northwestern tropical Pacific. J. Geophys. Res. Ocean. 2020, 125, e2019JC015829. [Google Scholar] [CrossRef]
- Foo, S.A.; Asner, G.P. Scaling up coral reef restoration using remote sensing technology. Front. Mar. Sci. 2019, 6, 79. [Google Scholar] [CrossRef]
- Licuanan, A.M.; Reyes, M.Z.; Luzon, K.S.; Chan, M.A.A.; Licuanan, W.Y. Initial findings of the nationwide assessment of Philippine coral reefs. Philipp. J. Sci. 2017, 146, 177–185. [Google Scholar]
- Skirving, W.; Marsh, B.; De La Cour, J.; Liu, G.; Harris, A.; Maturi, E.; Geiger, E.; Eakin, C.M. CoralTemp and the coral reef watch coral bleaching heat stress product suite version 3.1. Remote Sens. 2020, 12, 3856. [Google Scholar] [CrossRef]
- Heron, S.F.; Liu, G.; Eakin, C.M.; Skirving, W.J.; Muller-Karger, F.E.; Vega-Rodriguez, M.; De La Cour, J.L.; Burgess, T.F.; Strong, A.E.; Geiger, E.F.; et al. Climatology Development for NOAA Coral Reef Watch’s 5-km Product Suite; NOAA Technical Report NESDIS; NOAA: Washington, DC, USA, 2014. [Google Scholar] [CrossRef]
- Glynn, P.W.; D’croz, L. Experimental evidence for high temperature stress as the cause of El Niño-coincident coral mortality. Coral Reefs 1990, 8, 181–191. [Google Scholar] [CrossRef]
- Liu, G.; Strong, A.E.; Skirving, W. Remote sensing of sea surface temperatures during 2002 Barrier Reef coral bleaching. Eos Trans. Am. Geophys. Union 2003, 84, 137–141. [Google Scholar] [CrossRef]
- Skirving, W.; Liu, G.; Strong, A.E.; Liu, C.; Sapper, J.; Arzayus, F. Extreme events and perturbations of coastal ecosystems. In Remote Sensing of Aquatic Coastal Ecosystem Processes; Springer: Dordrecht, The Netherlands, 2006; pp. 11–25. [Google Scholar] [CrossRef]
- Little, C.M.; Liu, G.; De La Cour, J.L.; Eakin, C.M.; Manzello, D.; Heron, S.F. Global coral bleaching event detection from satellite monitoring of extreme heat stress. Front. Mar. Sci. 2022, 9, 883271. [Google Scholar] [CrossRef]
- Genevier, L.G.; Jamil, T.; Raitsos, D.E.; Krokos, G.; Hoteit, I. Marine heatwaves reveal coral reef zones susceptible to bleaching in the Red Sea. Glob. Change Biol. 2019, 25, 2338–2351. [Google Scholar] [CrossRef]
- Dalton, S.J.; Carroll, A.G.; Sampayo, E.; Roff, G.; Harrison, P.L.; Entwistle, K.; Huang, Z.; Salih, A.; Diamond, S.L. Successive marine heatwaves cause disproportionate coral bleaching during a fast phase transition from El Niño to La Niña. Sci. Total Environ. 2020, 715, 136951. [Google Scholar] [CrossRef]
- Fox, M.D.; Cohen, A.L.; Rotjan, R.D.; Mangubhai, S.; Sandin, S.A.; Smith, J.E.; Thorrold, S.R.; Dissly, L.; Mollica, N.R.; Obura, D. Increasing coral reef resilience through successive marine heatwaves. Geophys. Res. Lett. 2021, 48, e2021GL094128. [Google Scholar] [CrossRef]
- Marzonie, M.R.; Bay, L.K.; Bourne, D.G.; Hoey, A.S.; Matthews, S.; Nielsen, J.J.; Harrison, H.B. The effects of marine heatwaves on acute heat tolerance in corals. Glob. Change Biol. 2023, 29, 404–416. [Google Scholar] [CrossRef]
- Hobday, A.J.; Oliver, E.C.; Gupta, A.S.; Benthuysen, J.A.; Burrows, M.T.; Donat, M.G.; Holbrook, N.J.; Moore, P.J.; Thomsen, M.S.; Wernberg, T.; et al. Categorizing and naming marine heatwaves. Oceanography 2018, 31, 162–173. [Google Scholar] [CrossRef]
- Rio, M.H.; Mulet, S.; Picot, N. Beyond GOCE for the ocean circulation estimate: Synergetic use of altimetry, gravimetry, and in situ data provides new insight into geostrophic and Ekman currents. Geophys. Res. Lett. 2014, 41, 8918–8925. [Google Scholar] [CrossRef]
- Shlesinger, T.; van Woesik, R. Oceanic differences in coral-bleaching responses to marine heatwaves. Sci. Total Environ. 2023, 871, 162113. [Google Scholar] [CrossRef] [PubMed]
- Voolstra, C.R.; Valenzuela, J.J.; Turkarslan, S.; Cárdenas, A.; Hume, B.C.; Perna, G.; Buitrago-López, C.; Rowe, K.; Orellana, M.V.; Baliga, N.S.; et al. Contrasting heat stress response patterns of coral holobionts across the Red Sea suggest distinct mechanisms of thermal tolerance. Mol. Ecol. 2021, 30, 4466–4480. [Google Scholar] [CrossRef]
- Matz, M.V.; Treml, E.A.; Haller, B.C. Estimating the potential for coral adaptation to global warming across the Indo-West Pacific. Glob. Change Biol. 2020, 26, 3473–3481. [Google Scholar] [CrossRef]
- Thomas, L.; Underwood, J.N.; Rose, N.H.; Fuller, Z.L.; Richards, Z.T.; Dugal, L.; Grimaldi, C.M.; Cooke, I.R.; Palumbi, S.R.; Gilmour, J.P. Spatially varying selection between habitats drives physiological shifts and local adaptation in a broadcast spawning coral on a remote atoll in Western Australia. Sci. Adv. 2022, 8, eabl9185. [Google Scholar] [CrossRef] [PubMed]
- Gilmour, J.P.; Cook, K.L.; Ryan, N.M.; Puotinen, M.L.; Green, R.H.; Heyward, A.J. A tale of two reef systems: Local conditions, disturbances, coral life histories, and the climate catastrophe. Ecol. Appl. 2022, 32, e2509. [Google Scholar] [CrossRef] [PubMed]
- Anthony, K.R. Coral reefs under climate change and ocean acidification: Challenges and opportunities for management and policy. Annu. Rev. Environ. Resour. 2016, 41, 59–81. [Google Scholar] [CrossRef]
- Guo, W.; Bokade, R.; Cohen, A.L.; Mollica, N.R.; Leung, M.; Brainard, R.E. Ocean acidification has impacted coral growth on the Great Barrier Reef. Geophys. Res. Lett. 2020, 47, e2019GL086761. [Google Scholar] [CrossRef]
- Krishna, K.V.; Shanmugam, P. Robust estimates of the Total Alkalinity from Satellite Oceanographic data in the Global Ocean. IEEE Access 2023, 11, 42824–42838. [Google Scholar] [CrossRef]
- Priyanka, K.; Shanthi, R.; Poornima, D.; Saravanakumar, A.; Roy, R.; Nagamani, P.V. Long-term variability of satellite derived total alkalinity in the southwest Bay of Bengal. Quat. Sci. Adv. 2022, 8, 100066. [Google Scholar] [CrossRef]
- Shaver, E.C.; McLeod, E.; Hein, M.Y.; Palumbi, S.R.; Quigley, K.; Vardi, T.; Mumby, P.J.; Smith, D.; Montoya-Maya, P.; Muller, E.M.; et al. A roadmap to integrating resilience into the practice of coral reef restoration. Glob. Change Biol. 2022, 28, 4751–4764. [Google Scholar] [CrossRef]
- Suggett, D.J.; Guest, J.; Camp, E.F.; Edwards, A.; Goergen, L.; Hein, M.; Humanes, A.; Levy, J.S.; Montoya-Maya, P.H.; Vardi, T.; et al. Restoration as a meaningful aid to ecological recovery of coral reefs. npj Ocean Sustain. 2024, 3, 20. [Google Scholar] [CrossRef]
- Newman, M.; Alexander, M.A.; Ault, T.R.; Cobb, K.M.; Deser, C.; Di Lorenzo, E.; Mantua, N.J.; Miller, A.J.; Minobe, S.; Nakamura, H.; et al. The Pacific decadal oscillation, revisited. J. Clim. 2016, 29, 4399–4427. [Google Scholar] [CrossRef]
- Hsu, P.C. Surface current variations and hydrological characteristics of the Penghu Channel in the southeastern Taiwan Strait. Remote Sens. 2022, 14, 1816. [Google Scholar] [CrossRef]
- Mitsuguchi, T.; Dang, P.X.; Kitagawa, H.; Yoneda, M.; Shibata, Y. Tropical South China Sea surface 14C record in an annually-banded coral. Radiocarbon 2007, 49, 905–914. [Google Scholar] [CrossRef]
- Hu, J.; Kawamura, H.; Hong, H.; Qi, Y. A review on the currents in the South China Sea: Seasonal circulation, South China Sea warm current and Kuroshio intrusion. J. Oceanogr. 2000, 56, 607–624. [Google Scholar] [CrossRef]
- Matsumoto, J.; Olaguera, L.M.P.; Nguyen-Le, D.; Kubota, H.; Villafuerte, M.Q. Climatological seasonal changes of wind and rainfall in the Philippines. Int. J. Climatol. 2020, 40, 4843–4857. [Google Scholar] [CrossRef]
- Chen, Y.; Zhai, F.; Li, P.; Gu, Y.; Wu, K. Extreme 2020 summer SSTs in the northern South China Sea: Implications for the Beibu Gulf coral bleaching. J. Clim. 2022, 35, 4177–4190. [Google Scholar] [CrossRef]
- Hsu, P.C.; Lin, C.C.; Huang, S.J.; Ho, C.R. Effects of cold eddy on Kuroshio meander and its surface properties, east of Taiwan. IEEE J. Sel. Top. Appl. Earth Obs. Remote Sens. 2016, 9, 5055–5063. [Google Scholar] [CrossRef]
- Wang, G.; Chen, D.; Su, J. Generation and life cycle of the dipole in the South China Sea summer circulation. J. Geophys. Res. Ocean. 2006, 111, C06002. [Google Scholar] [CrossRef]
- Wong, G.T.; Tseng, C.M.; Wen, L.S.; Chung, S.W. Nutrient dynamics and N-anomaly at the SEATS station. Deep Sea Res. Part II Top. Stud. Oceanogr. 2007, 54, 1528–1545. [Google Scholar] [CrossRef]
- Zhang, H.; Mai, G.; Luo, W.; Chen, M.; Duan, R.; Shi, T. Changes in diazotrophic community structure associated with Kuroshio succession in the northern South China Sea. Biogeosciences 2024, 21, 2529–2546. [Google Scholar] [CrossRef]
- Yang, C.; Chen, X.; Cheng, X.; Qiu, B. Annual versus semi-annual eddy kinetic energy variability in the Celebes Sea. J. Oceanogr. 2020, 76, 401–418. [Google Scholar] [CrossRef]
- Qu, T.; Lukas, R. The bifurcation of the North Equatorial Current in the Pacific. J. Phys. Oceanogr. 2003, 33, 5–18. [Google Scholar] [CrossRef]
- Magdaong, E.T.; Yamano, H.; Fujii, M. Development of a large-scale, long-term coral cover and disturbance database in the Philippines. In Integrative Observations and Assessments; Springer: Tokyo, Japan, 2014; pp. 83–109. [Google Scholar] [CrossRef]
- Arceo, H.O.; Quibilan, M.C.; Aliño, P.M.; Lim, G.; Licuanan, W.Y. Coral bleaching in Philippine reefs: Coincident evidences with mesoscale thermal anomalies. Bull. Mar. Sci. 2001, 69, 579–593. [Google Scholar]
- Kimura, T.; Chou, L.M.; Huang, D.; Tun, K.; Goh, E. (Eds.) Status and Trends of East Asian Coral Reefs: 1983–2019. Global Coral Reef Monitoring Network, East Asia Region. Available online: https://icriforum.org/documents/status-and-trends-of-east-asian-coral-reefs-1983-2019/ (accessed on 14 March 2025).
- Fine, R.A.; Willey, D.A.; Millero, F.J. Global variability and changes in ocean total alkalinity from Aquarius satellite data. Geophys. Res. Lett. 2017, 44, 261–267. [Google Scholar] [CrossRef]
- Ho, D.T.; Schanze, J.J. Precipitation-induced reduction in surface ocean pCO2: Observations from the eastern tropical Pacific Ocean. Geophys. Res. Lett. 2020, 47, e2020GL088252. [Google Scholar] [CrossRef]
- Hoegh-Guldberg, O.; Poloczanska, E.S.; Skirving, W.; Dove, S. Coral reef ecosystems under climate change and ocean acidification. Front. Mar. Sci. 2017, 4, 158. [Google Scholar] [CrossRef]
- Pata, P.R.; Yñiguez, A.T. Spatial planning insights for Philippine coral reef conservation using larval connectivity networks. Front. Mar. Sci. 2021, 8, 719691. [Google Scholar] [CrossRef]
- Feliciano, G.N.R.; Rollon, R.N.; Licuanan, W.Y. Coral community structure of Philippine fringing reefs is shaped by broad-scale hydrologic regimes and local environmental conditions. Coral Reefs 2023, 42, 873–890. [Google Scholar] [CrossRef]
- DeCarlo, T.M.; Cohen, A.L.; Wong, G.T.; Davis, K.A.; Lohmann, P.; Soong, K. Mass coral mortality under local amplification of 2 C ocean warming. Sci. Rep. 2017, 7, 44586. [Google Scholar] [CrossRef]
- Souter, D.; Planes, S.; Wicquart, J.; Logan, M.; Obura, D.; Staub, F. (Eds.) Status of Coral Reefs of the World: 2020: Executive Summary; Global Coral Reef Monitoring Network (GCRMN) and International Coral Reef Initiative (ICRI): London, UK, 2021. [Google Scholar]
- Sweatman, H.; Delean, S.; Syms, C. Assessing loss of coral cover on Australia’s Great Barrier Reef over two decades, with implications for longer-term trends. Coral Reefs 2011, 30, 521–531. [Google Scholar] [CrossRef]
- Claar, D.C.; Szostek, L.; McDevitt-Irwin, J.M.; Schanze, J.J.; Baum, J.K. Global patterns and impacts of El Niño events on coral reefs: A meta-analysis. PLoS ONE 2018, 13, e0190957. [Google Scholar] [CrossRef] [PubMed]
- Zhao, H.; Wang, C. Interdecadal modulation on the relationship between ENSO and typhoon activity during the late season in the western North Pacific. Clim. Dyn. 2016, 47, 315–328. [Google Scholar] [CrossRef]
- Chen, W.; Park, J.K.; Dong, B.; Lu, R.; Jung, W.S. The relationship between El Niño and the western North Pacific summer climate in a coupled GCM: Role of the transition of El Niño decaying phases. J. Geophys. Res. Atmos. 2012, 117, D12111. [Google Scholar] [CrossRef]
- Hu, P.; Chen, W.; Wang, L.; Chen, S.; Liu, Y.; Chen, L. Revisiting the ENSO–monsoonal rainfall relationship: New insights based on an objective determination of the Asian summer monsoon duration. Environ. Res. Lett. 2022, 17, 104050. [Google Scholar] [CrossRef]


| Dataset Category | Parameter | Source | Temporal Coverage | Spatial Resolution | Purpose of the Study |
|---|---|---|---|---|---|
| Ocean Thermal Data | SST | NOAA Coral Reef Watch | 1985–2022 | 5 km | Analyze long-term SST trends |
| DHW | Identify thermal stress and bleaching risk | ||||
| MHW Indices | Detect extreme thermal events | ||||
| Ocean Current | Zonal and Meridional Currents | CMEMS, Copernicus | 1993–2022 | 0.25° | Analyze ocean circulation patterns |
| Biogeochemistry Dataset | spCO2 | CMEMS, Copernicus | 1993–2022 | 0.25° | Analyze oceanic carbon dynamics |
| pH | Evaluate ocean acidification trends | ||||
| Climate Patterns | Oceanic Niño Index | NOAA CPC | 1985–2022 | Monthly | Identify ENSO events |
| PDO Index | NOAA NCEI | 1985–2022 | Monthly | Identify PDO impacts |
| MHW Index | Definition | Formula | Unit |
|---|---|---|---|
| F | Total MHW events in a year | Times | |
| D | Number of days from the start to the end of an MHW event | Days | |
| Total MHW days in a year | Days | ||
| IMEAN | Average SST anomaly in an MHW event | °C | |
| IMAX | Maximum SST anomaly in an MHW event | , where | °C |
| ICUM | Sum of the intensity anomalies in an MHW event | °C days |
| Coral Reef Site | 4 ≤ DHW < 8 | DHW ≥ 8 |
|---|---|---|
| A | 1998 (72), 2007 (51), 2020 (37), 2022 (48) | 2020 (55), 2022 (47) |
| B | 1998 (29), 2006 (18), 2007 (24), 2010 (70), 2015 (10), 2016 (64), 2017 (18), 2018 (22), 2019 (56), 2020 (64), 2021 (73), 2022 (41) | 1998 (68), 2007 (69), 2016 (26), 2019 (28), 2020 (81), 2021 (56), 2022 (60) |
| C | 1988 (5), 1998 (56), 2007 (69), 2010 (56), 2014 (60), 2016 (56), 2017 (83), 2019 (68), 2020 (65), 2022 (45) | 1998 (28), 2016 (51) |
| D | 1998 (69), 2007 (62), 2012 (17), 2014 (53), 2015 (27), 2016 (68), 2017 (86), 2018 (73), 2019 (65), 2020 (18), 2021 (71), 2022 (41) | 2016 (55) |
| E | 1998 (57), 2013 (50), 2016 (69), 2019 (72), 2020 (66), 2022 (46) | 2016 (18), 2020 (33) |
| F | 2016 (63), 2020 (63) | --- |
| G | 2010 (72), 2014 (75), 2015 (72), 2016 (5), 2022 (75) | --- |
| H | 2010 (80), 2020 (78) | --- |
| I | 1998 (40), 2007 (50), 2010 (56), 2014 (67), 2015 (65), 2016 (70), 2017 (77), 2019 (60), 2020 (63), 2022 (73) | 2016 (17), 2019 (25) |
| J | 1998 (48), 2014 (73) | --- |
| K | 1998 (47), 2014 (64), 2017 (43) | --- |
| L | 1998 (73), 2010 (98) | --- |
Disclaimer/Publisher’s Note: The statements, opinions and data contained in all publications are solely those of the individual author(s) and contributor(s) and not of MDPI and/or the editor(s). MDPI and/or the editor(s) disclaim responsibility for any injury to people or property resulting from any ideas, methods, instructions or products referred to in the content. |
© 2025 by the authors. Licensee MDPI, Basel, Switzerland. This article is an open access article distributed under the terms and conditions of the Creative Commons Attribution (CC BY) license (https://creativecommons.org/licenses/by/4.0/).
Share and Cite
Macagga, R.A.T.; Hsu, P.-C. Spatiotemporal Dynamics of Marine Heatwaves and Ocean Acidification Affecting Coral Environments in the Philippines. Remote Sens. 2025, 17, 1048. https://doi.org/10.3390/rs17061048
Macagga RAT, Hsu P-C. Spatiotemporal Dynamics of Marine Heatwaves and Ocean Acidification Affecting Coral Environments in the Philippines. Remote Sensing. 2025; 17(6):1048. https://doi.org/10.3390/rs17061048
Chicago/Turabian StyleMacagga, Rose Angeli Tabanao, and Po-Chun Hsu. 2025. "Spatiotemporal Dynamics of Marine Heatwaves and Ocean Acidification Affecting Coral Environments in the Philippines" Remote Sensing 17, no. 6: 1048. https://doi.org/10.3390/rs17061048
APA StyleMacagga, R. A. T., & Hsu, P.-C. (2025). Spatiotemporal Dynamics of Marine Heatwaves and Ocean Acidification Affecting Coral Environments in the Philippines. Remote Sensing, 17(6), 1048. https://doi.org/10.3390/rs17061048