Article

SAOF: A Semantic-Aware Optical Flow Framework for Fine-Grained Disparity Estimation in High-Resolution Satellite Stereo Images


by
Dingkai Wang
1,2,3,
Feng Wang
1,2,
Jingyi Cao
1,2,
Niangang Jiao
1,2,*,
Yuming Xiang
4,5,
Enze Zhu
1,2,3,
Jingxing Zhu
1,2 and
Hongjian You
1,2,3
1
Key Laboratory of Target Cognition and Application Technology (TCAT), Aerospace Information Research Institute, Chinese Academy of Sciences, Beijing 100190, China
2
Aerospace Information Research Institute, Chinese Academy of Sciences, Beijing 100094, China
3
School of Electronic, Electrical and Communication Engineering, University of Chinese Academy of Sciences, Beijing 101408, China
4
College of Surveying and Geoinformatics, Tongji University, Shanghai 200092, China
5
Shanghai Key Laboratory for Planetary Mapping and Remote Sensing for Deep Space Exploration, Shanghai 200092, China
*
Author to whom correspondence should be addressed.
Remote Sens. 2025, 17(24), 4017; https://doi.org/10.3390/rs17244017
Submission received: 3 November 2025 / Revised: 10 December 2025 / Accepted: 11 December 2025 / Published: 12 December 2025

Highlights

What are the main findings?
  • We develop a semantic-aware optical flow framework (SAOF) that integrates semantic guidance into a multi-level optical flow optimization for disparity estimation. It features three novel components: sub-top pyramid re-PatchMatch, scale-adaptive matching window, and multi-feature cost refinement.
  • We introduce a region-level semantic guidance mechanism. The SAMgeo-Reg module generates semantic prototypes and semantic guidance maps to provide robust constraints for disparity estimation.
What are the implications of the main findings?
  • SAOF effectively addresses challenges in large-disparity, textureless, and structurally complex regions, enhancing the accuracy and robustness of disparity estimation for high-resolution satellite stereo images.
  • The accurate disparity results obtained by SAOF can be used in 3D reconstruction tasks, enhancing remote sensing applications such as urban modeling, environmental monitoring, and disaster assessment.

Abstract

Disparity estimation from high-resolution satellite stereo images is critical for 3D reconstruction but remains challenging due to large disparities, complex structures, and textureless regions. To address this, we propose a Semantic-Aware Optical Flow (SAOF) framework for fine-grained disparity estimation, which enhances optical flow-based via a multi-level optimization incorporating sub-top pyramid re-PatchMatch, scale-adaptive matching windows, and multi-feature cost refinement. For improving the spatial consistency of the resulting disparity map, SAMgeo-Reg is utilized to produce semantic prototypes, which are used to build guidance embeddings for integration into the optical flow estimation process. Experiments on the US3D dataset demonstrate that SAOF outperforms state-of-the-art methods across challenging scenarios. It achieves an average endpoint error (EPE) of 1.317 and a D1 error of 9.09%.

1. Introduction

With the rapid development of space technology and the aerospace industry, satellite platforms have greatly improved Earth observation capability, enabling more efficient and economical acquisition of high-resolution satellite imagery [1]. These images offer high observation altitude, wide coverage, and long-term stability, while ensuring the continuity and completeness of large-scale, multi-temporal ground information. Such characteristics make them a core data source for large-scale 3D reconstruction. High-precision 3D models derived from these images provide reliable support for applications such as urban modeling, environmental monitoring, and disaster assessment [2]. In 3D reconstruction workflows, stereo matching plays a key role in identifying precise correspondences in stereo images to generate disparity maps. When combined with Rational Polynomial Coefficients (RPCs), these disparity maps can be further converted into digital surface models (DSMs) [3]. Therefore, accurate disparity estimation is essential to ensure the geometric precision and structural integrity of DSMs.
Stereo matching involves four steps: matching cost computation, cost aggregation, cost optimization, and disparity refinement [4]. Traditional methods typically use fixed-size windows to calculate matching costs between left and right epipolar images, construct a cost volume [5,6], aggregate local costs, and compute/optimize disparities to generate a disparity map. However, they face three key challenges: (1) low computational efficiency due to complex aggregation and optimization [7]; (2) loss of fine details (e.g., building edges) during aggregation; (3) poor robustness to illumination variations, occlusions, and textureless regions [8], with fixed-size windows failing to balance large-scale smoothness and fine details. Thus, traditional methods are significantly limited in accuracy and efficiency when processing high-resolution satellite stereo images with complex ground objects.
In addition to stereo matching methods, optical flow provides an alternative approach for pixel-wise disparity estimation. Its core principle is to compute a dense motion vector field between consecutive image frames. When processing images from different viewpoints or time instances, epipolar geometry constrains the two-dimensional optical flow estimation to a one-dimensional search space, rendering stereo matching a special case of optical flow theory [9,10]. Compared with stereo matching, optical flow can generate sub-pixel displacement fields, enabling the capture of fine-grained disparity information.
Furthermore, most existing optical flow–based disparity estimation studies have focused on aerial or UAV imagery [11,12], while their application to satellite imagery remains relatively underexplored. A major reason lies in the fundamental difference in imaging geometry. Unlike frame-based UAV cameras with a single central projection, modern satellites use pushbroom imaging, where each row has its own imaging center and orientation [13]. Although each row can be locally approximated as a central projection, the row-varying geometry allows only approximate (pseudo-epipolar) rectification. As a result, rectified satellite stereo images exhibit epipolar-like behavior only within small local regions. However, when covering larger spatial extents, the rectification no longer guarantees a constant displacement along the y-direction, causing residual vertical disparity [14,15].
A key advantage of the optical flow–based approach is that it can estimate disparities along the x-direction while simultaneously capturing subtle residual displacements along the y-direction. However, conventional optical flow–based methods rely on brightness constancy and small displacement assumptions, which can lead to matching ambiguities in textureless or complex satellite scenes. Incorporating semantic information introduces region-level constraints that enhance the matching process by distinguishing between intra-region and inter-region pixels, strengthening structural consistency, and reducing correspondence ambiguities. This integration yields more robust and fine-grained disparity estimations.
To address the challenges of optical flow-based disparity estimation in high-resolution satellite stereo images, we propose a Semantic-Aware Optical Flow Framework (SAOF). This framework integrates a SAMgeo-Reg module to bridge semantic understanding and geometric matching. SAMgeo-Reg leverages a large-scale vision model (SAMgeo) to extract semantic features and construct prototypes that encode the visual–semantic content of segmented regions. These prototypes are registered via cosine similarity and used to generate semantic guidance maps, which are embedded into the optical flow estimation to ensure region-level consistency. The guidance maps help distinguish intra-region from cross-region pixels during cost computation, reducing mismatches in low-texture areas while preserving structural boundaries in complex regions. Importantly, SAMgeo-Reg enables semantic-aware disparity estimation in a label-free manner. Building upon this, we further employ a multi-level optical flow optimization scheme that integrates sub-top pyramid re-PatchMatch, scale-adaptive matching window, and multi-feature cost refinement. These strategies effectively mitigate error propagation across the flow pyramid, enhance multi-scale stability, and preserve edge details. By exploiting the sub-pixel accuracy of optical flow, the proposed framework captures subtle disparity variations, producing fine-grained and stable disparity maps even in regions with large disparities or weak textures.
Contributions of this work are summarized as follows:
  • We propose a Semantic-Aware Optical Flow Framework (SAOF) for fine-grained disparity estimation. This framework integrates semantic information into optical flow-based disparity estimation, alleviating matching ambiguities in regions with large disparities and weak textures.
  • We develop a label-free semantic extraction module (SAMgeo-Reg) to construct semantic prototypes and generate semantic guidance maps. The resulting semantic guidance maps impose region-level consistency constraints, reducing incorrect matches and improving the overall structural consistency of disparity estimation.
  • The sub-top pyramid re-PatchMatch and scale-adaptive matching window mechanism are introduced. By additional matching and dynamic window size adjustment, our approach achieves accurate multi-scale matching for large disparities while enhancing robustness to local structural variations.
  • We design a multi-feature matching cost function with semantic constraints, incorporating bilateral weighting to preserve edge details.

2. Related Works

2.1. Disparity Estimation Based on Stereo Matching

Early global stereo methods formulated disparity estimation as a multi-label energy minimization problem solved via graph cuts, but these approaches were computationally expensive and difficult to scale [16]. To improve efficiency, Semi-Global Matching (SGM) was introduced, approximating global optimization through multi-directional cost aggregation and radiation-invariant measures such as mutual information [17]. Ghuffar et al. [18] later extended SGM into object space to better exploit real-world geometry for DSM generation. Despite its success, SGM still suffers from streaking artifacts and reduced accuracy in blurred or textureless regions. To mitigate these issues, More Global Matching (MGM) incorporates two-dimensional consistency constraints [19] and has been integrated into the NASA Ames Stereo Pipeline for large-scale satellite DSM production [20]. Additional prior-based refinements further enhance structural continuity and geometric fidelity [21,22,23].
With the rise of deep learning, DispNet [24] enabled end-to-end disparity prediction, followed by PSM-Net [25], which introduced multi-scale global context through dilated convolutions and spatial pyramid pooling. However, directly applying these networks to satellite imagery remains challenging due to occlusions, complex terrain, and textureless regions. Recent satellite-oriented methods, such as Bidir-EPNet [26], HMSM-Net [27], CAGFNet [28], and UGC-Net [29], incorporate specialized cost volumes, occlusion handling, and hierarchical multi-scale features to address these issues.

2.2. Disparity Estimation Based on Optical Flow

Optical flow methods were initially developed to estimate pixel motion in image sequences, with classical approaches including Horn–Schunck (HS) [30] and Lucas–Kanade (LK) [31]. Beardsley [32] integrated optical flow with stereo matching to improve disparity estimation, while Slesareva et al. [33] employed total variation regularization to preserve discontinuities in dense disparity maps. Cai et al. [34] further incorporated an extended Potts prior to enhance regional consistency and mitigate issues such as occlusion and noise. Zhao et al. [35] refined disparities in textureless regions using motion cues. Several studies have also explored incorporating semantic information to improve optical flow estimation. Sevilla et al. [36] added localized semantic layers for within-object motion consistency. Cheng et al. [37] jointly optimized optical flow and semantic segmentation with shared feature representations, enabling the flow estimation to benefit from object-level semantic cues. Ref. [38] fused segmentation masks to improve boundary alignment.
While these approaches have shown success in natural scene imagery, directly applying them to satellite images remains challenging due to limited texture and large disparity regions. To address these issues, Yuan et al. [12] proposed a hierarchical coarse-to-fine optical flow matching strategy, which significantly improves dense matching performance in textureless regions. Wang et al. [39] employed the large displacement optical flow (LDOF) method to generate initial disparities and combined it with refinement processes, achieving improved results in large disparities scenes. Furthermore, Ref. [40] introduced an optical flow-based framework for terrain extraction from high-resolution satellite stereo images. However, the coarse-to-fine optical flow matching strategy often suffers from top-layer errors propagating downward. To address this issue, SAOF introduces sub-top pyramid re-PatchMatch mechanism to suppress error accumulation and employs a scale-adaptive matching window for improved robustness to local structural variations.

2.3. Disparity Estimation Based on Semantic Guidance

To address the inaccuracy of disparity estimation in textureless and complex structures regions, several studies have attempted to incorporate semantic information to improve the accuracy of disparity estimation. SegStereo [41] embedded semantic features into the disparity estimation framework and introduced a semantic soft maximum loss, thereby improving disparity accuracy. Zhang et al. proposed DispSegNet [42], which integrates semantic segmentation and disparity estimation in an end-to-end network, using semantic guidance to improve disparity prediction in textureless regions. Considering the characteristics of satellite imagery, Yang et al. [43] designed self-fusion and mutual-fusion modules to tightly couple semantic segmentation with disparity estimation, significantly improving stereo reconstruction performance in complex scenes. Chen et al. proposed SemStereo [44], which further enhances disparity accuracy in high-resolution satellite images through semantic-selective refinement and a left–right semantic consistency module. However, most semantic-guided methods rely on supervised semantic segmentation labels. To overcome this limitation, SAOF introduces the SAMgeo-Reg module, which adopts an unsupervised strategy tailored for remote sensing imagery and incorporates a morphology–geometry joint refinement mechanism, enabling high-precision semantic correspondence without requiring labeled data.

3. Materials and Methods

3.1. SAOF Pipeline

Before applying the proposed SAOF framework, the satellite images are first processed under an approximate epipolar constraint. This step confines the disparity estimation primarily to the x-direction. Both the SAOF algorithm design and the subsequent experiments are conducted on pseudo-epipolar rectified images.
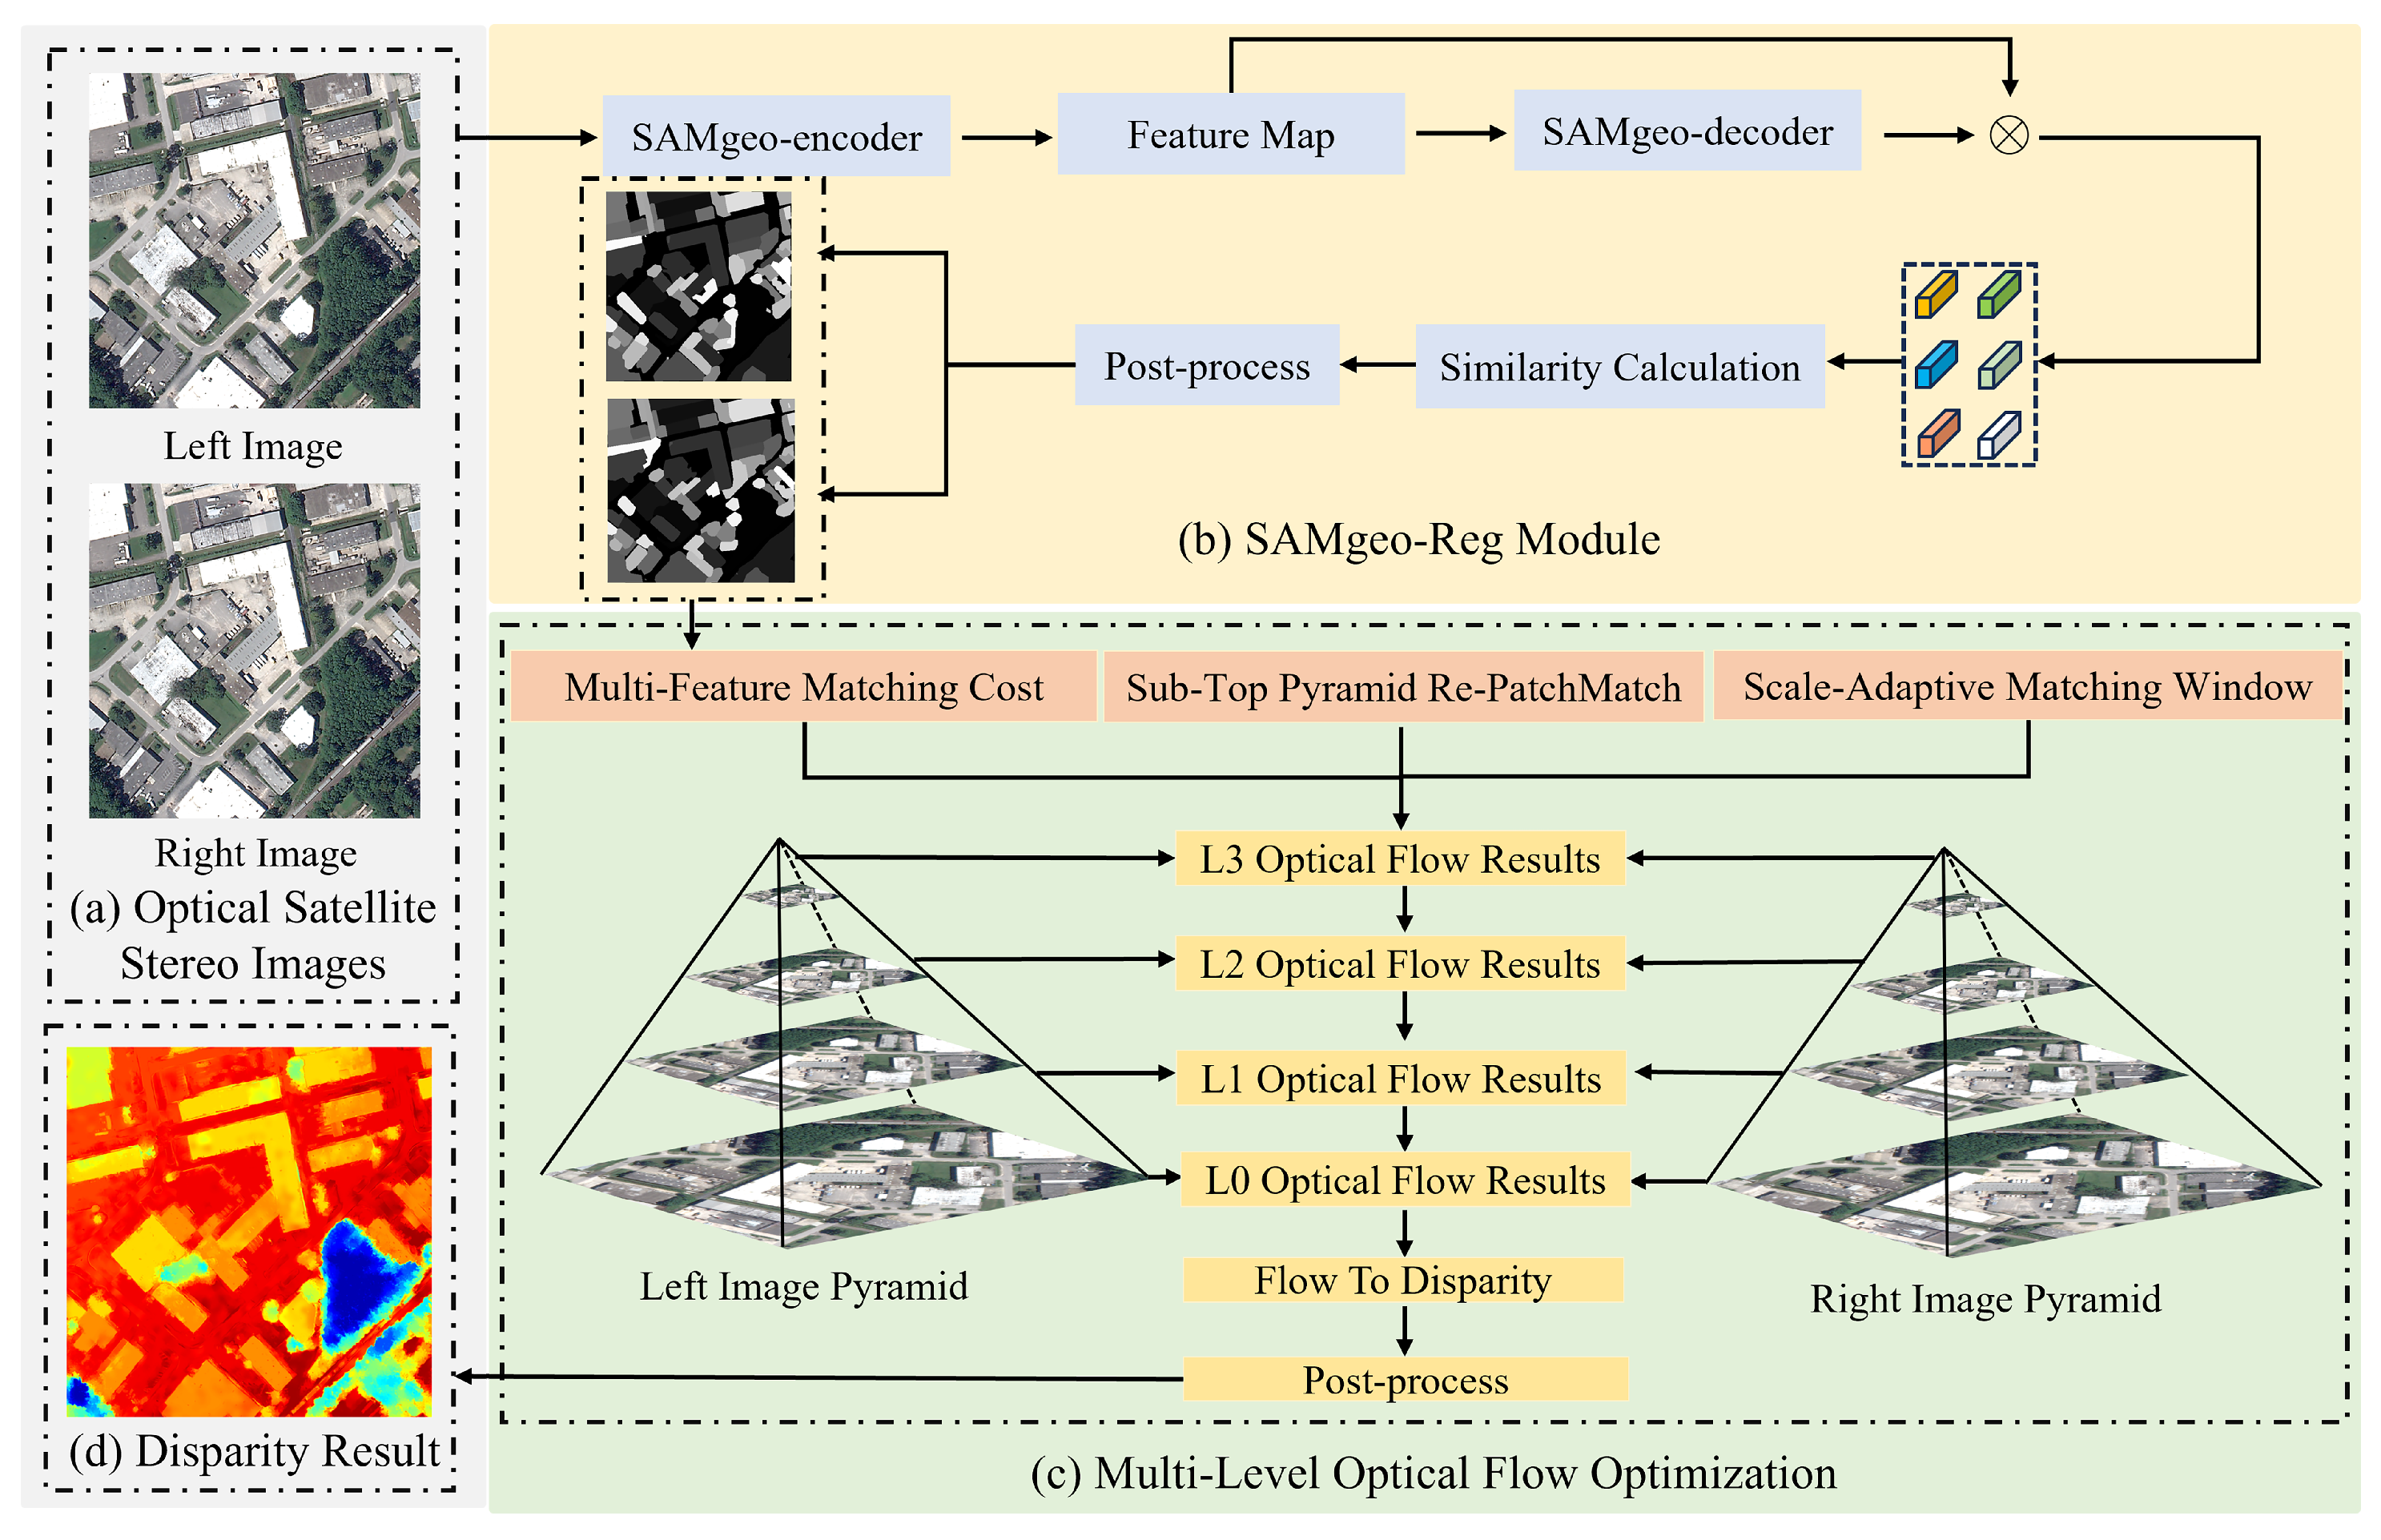
As illustrated in Figure 1, the input consists of approximately epipolar rectified high-resolution satellite stereo images (Figure 1a). Two semantic guidance maps are extracted using the SAMgeo-Reg module (Figure 1b), and the semantic information is incorporated into the construction of the matching cost function. Subsequently, multi-level optical flow optimization is performed (Figure 1c), which integrates the sub-top pyramid re-PatchMatch, the scale-adaptive matching window, and the multi-feature matching cost refinement to progressively refine the optical flow results from level L3 to L0. Finally, the optical flow results are converted into disparity maps and further optimized through a post-process module, yielding high-accuracy and structurally consistent disparity outputs that primarily represent the x-direction component (Figure 1d).

3.2. Semantic Guidance Maps Generation Based on SAMgeo-Reg

While optical flow provides a powerful basis for dense disparity estimation, its core matching paradigm relies fundamentally on pixel-level local similarity. This approach is inherently limited in addressing large, homogeneous regions and complex semantic boundaries, as it lacks guidance from region-level structural information. The study of SAMReg [45] provides valuable inspiration for addressing this issue: it establishes region-level correspondences between images by defining Regions of Interest (ROIs) using segmentation masks generated by Segment Anything [46].
In this study, we adapt this idea to satellite imagery. Unlike SAMReg, which is designed for general image correspondence, our method specifically addresses the problem of stereo matching in satellite images. The central idea is to convert the semantic information obtained from segmentation into effective constraints for the matching process. However, the original SAM model was primarily trained on natural images, which limits its applicability to satellite imagery with significant scale variations and complex regions.
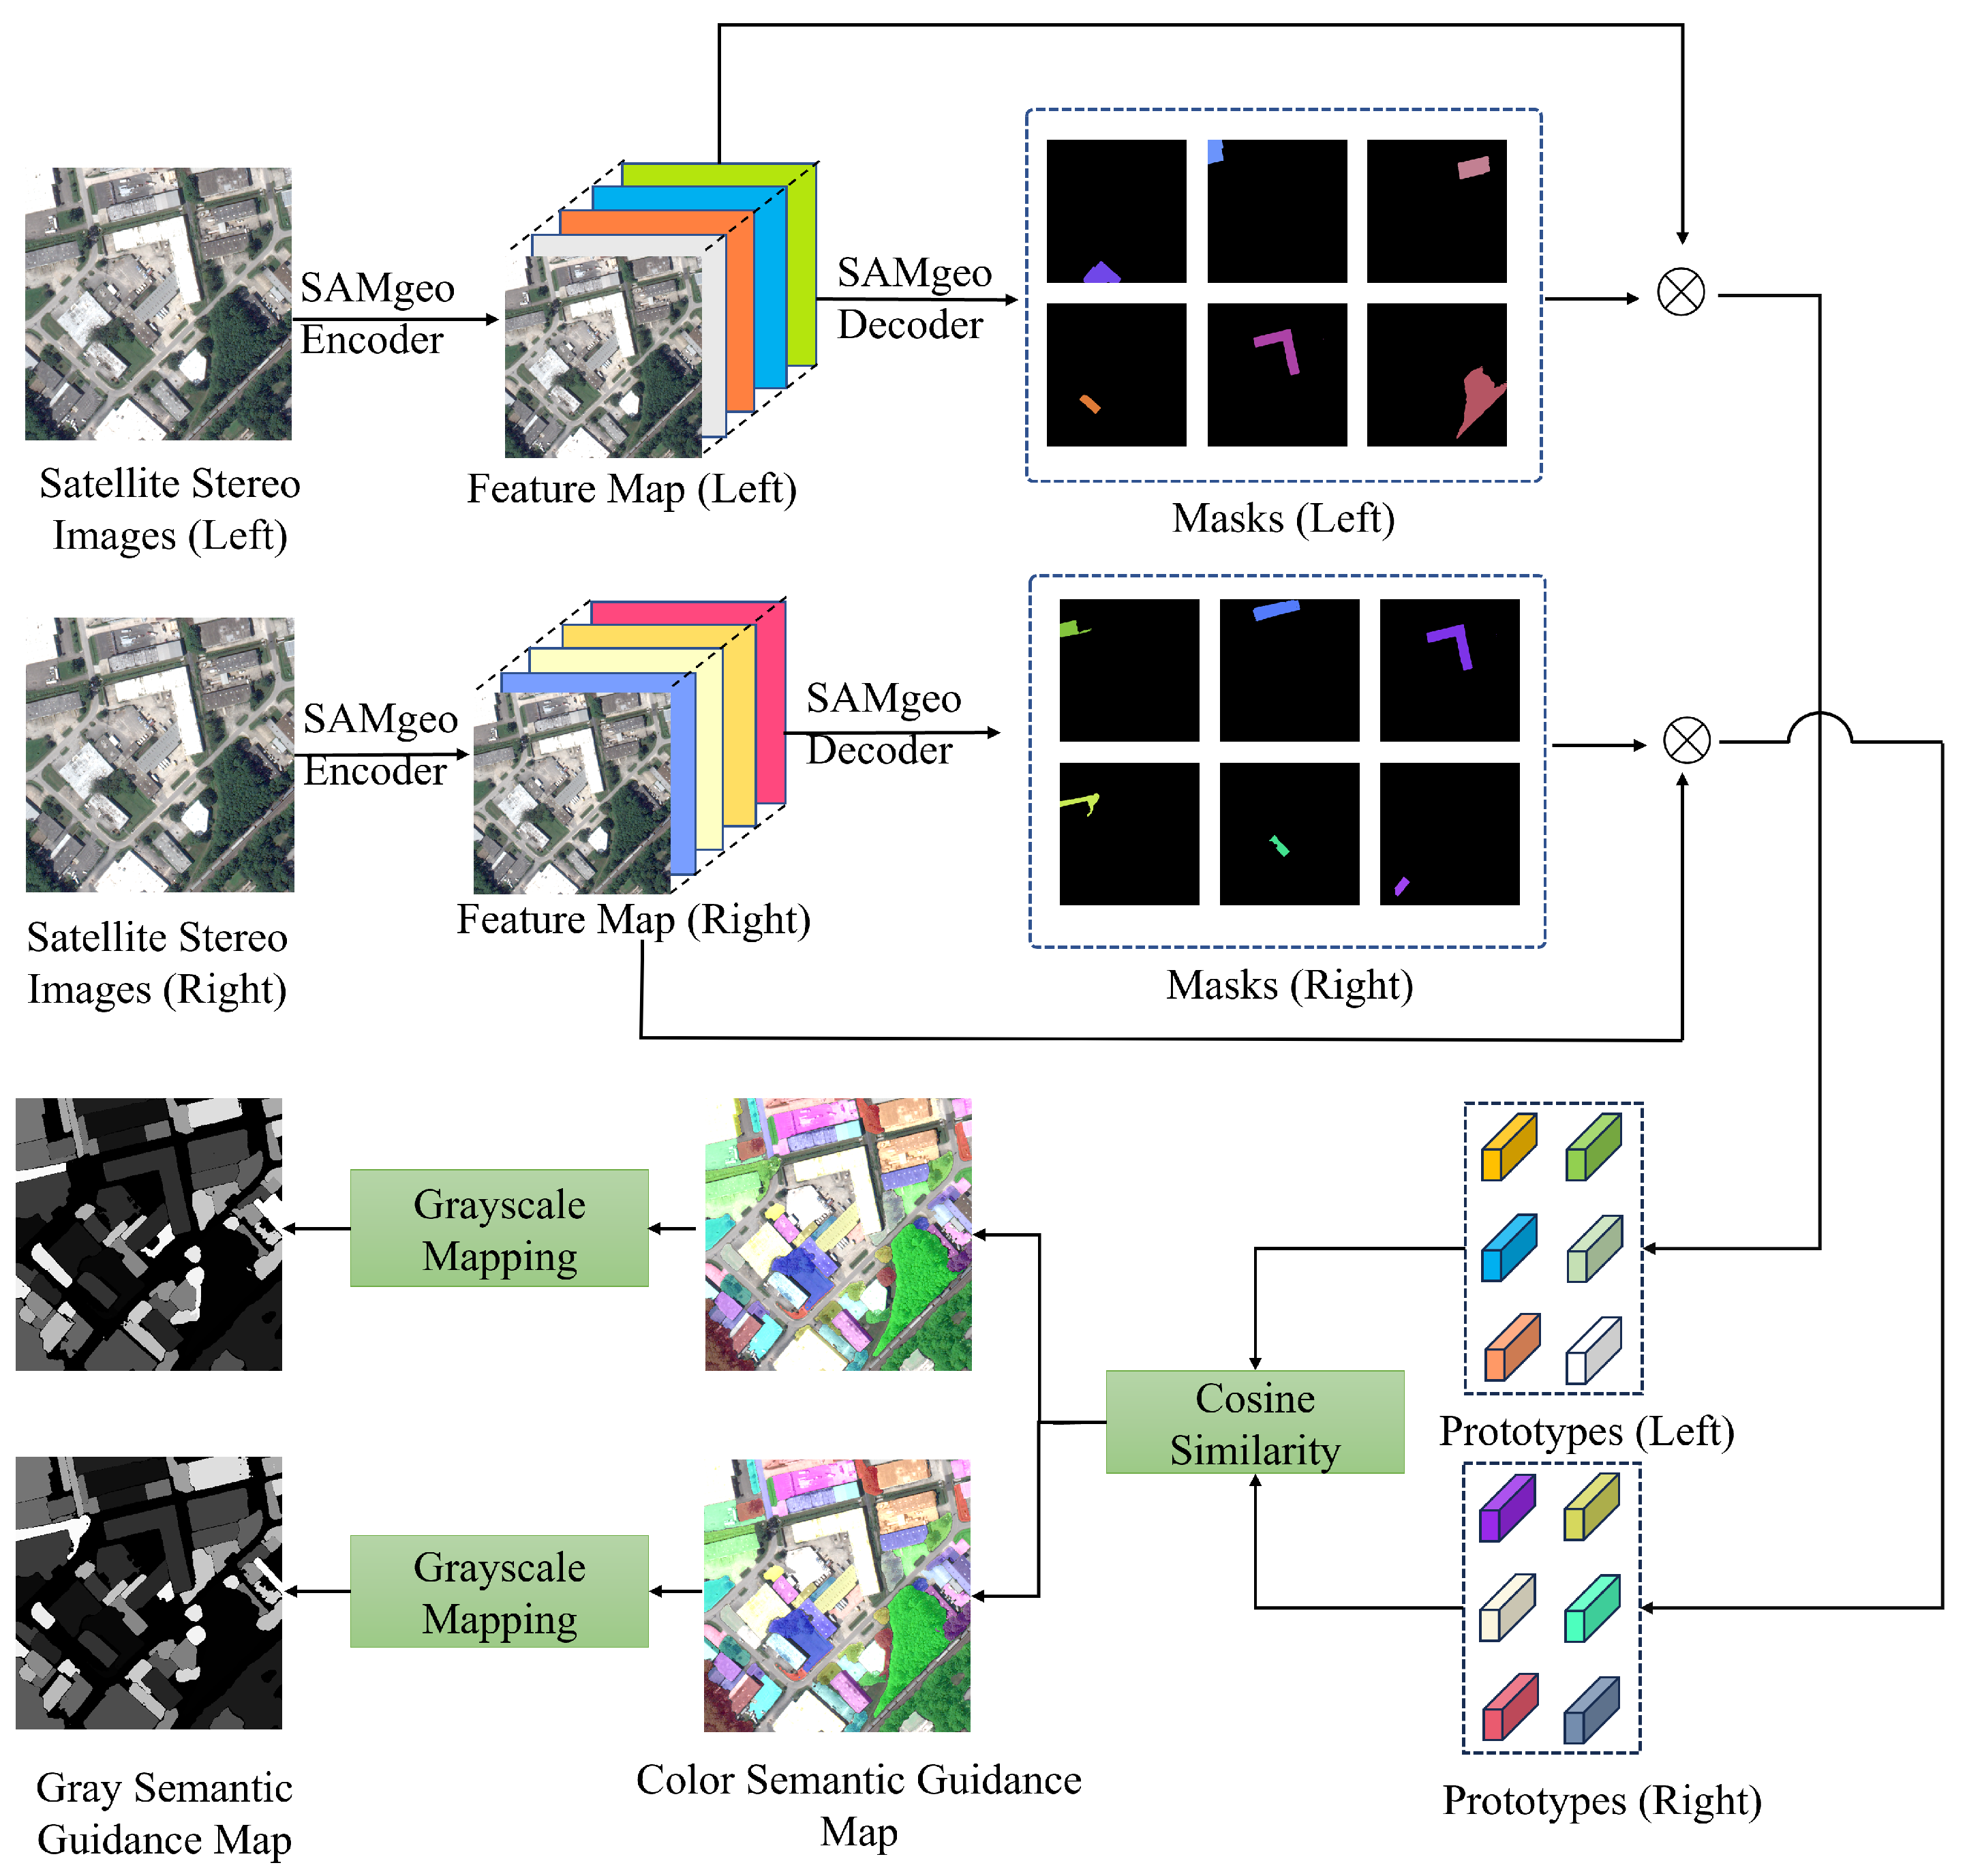
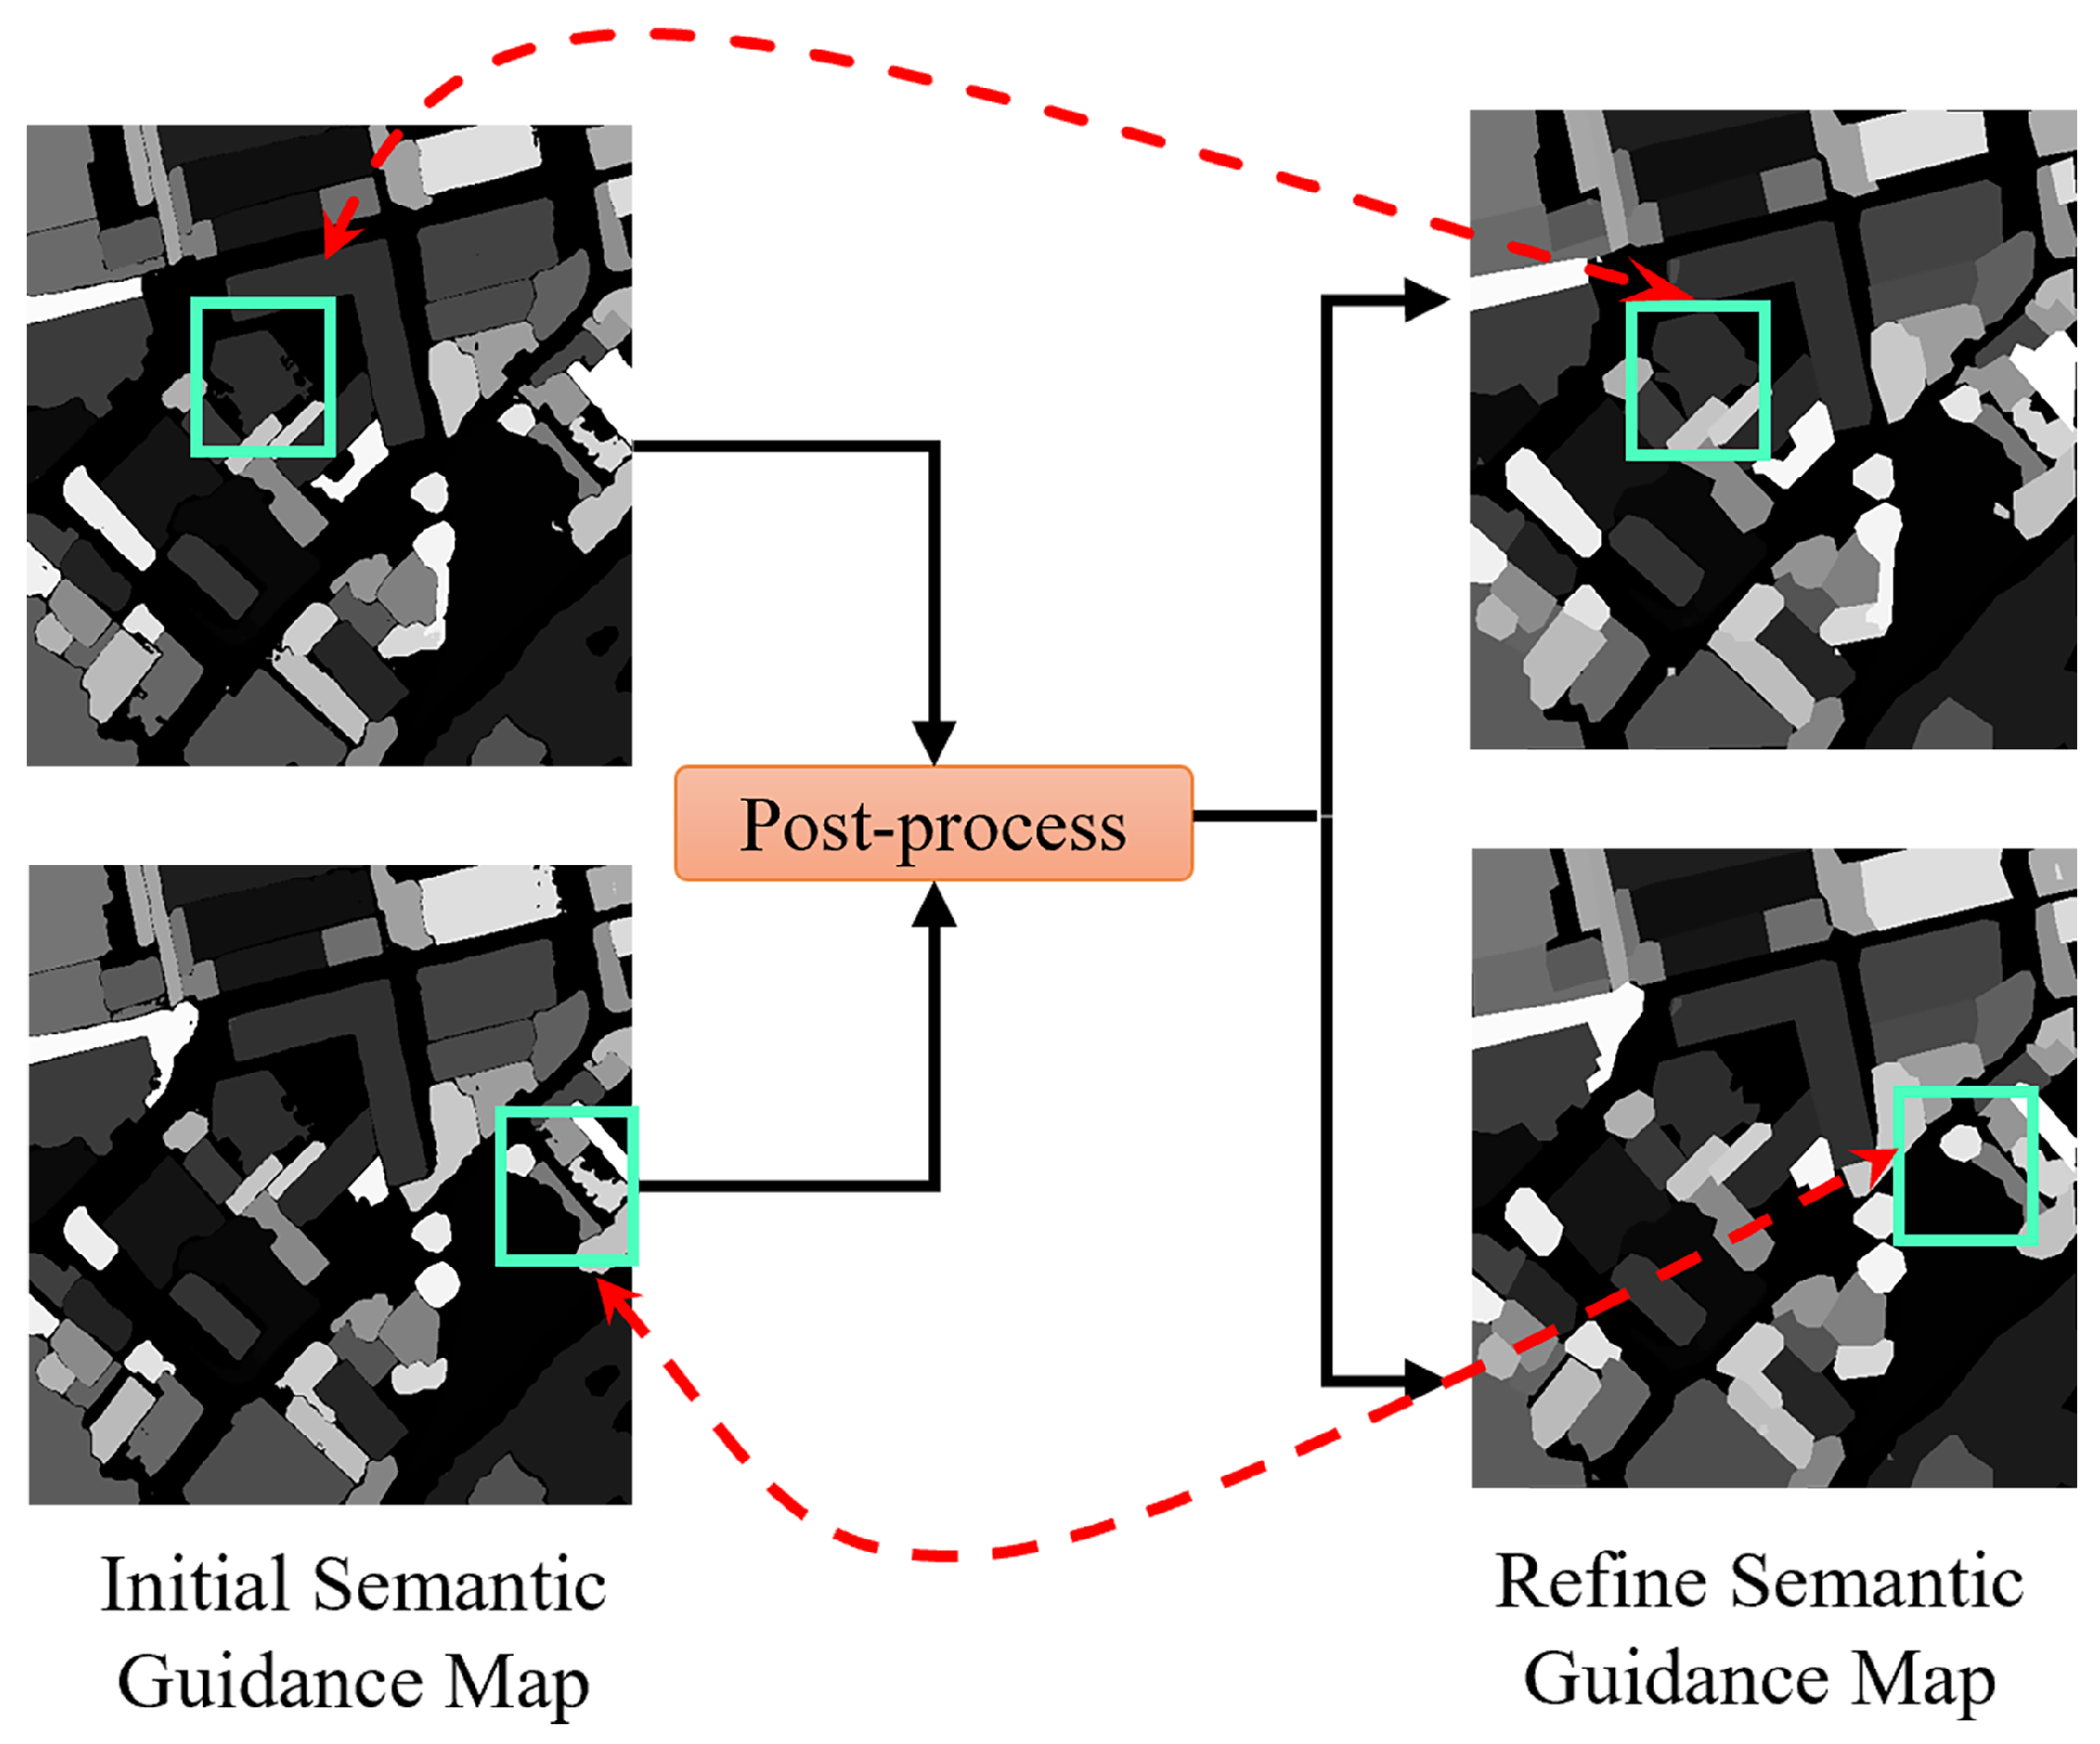
To overcome these limitations, we propose an improved label-free SAMgeo-Reg module based on SAMReg, in which the general-purpose SAM model is replaced with SAMgeo [47], a model specifically optimized for satellite imagery. This enables the generation of high-quality segmentation results better aligned with remote sensing characteristics. As illustrated in Figure 2, this module first extracts feature maps using the SAMgeo encoder. The decoder then produces a set of candidate segmentation masks. For each segmentation mask, we compute a prototype by averaging the feature map pixels within the masked region. This prototype serves as a compact, discriminative representation of the region’s visual-semantic characteristics. Subsequently, semantic correspondences are established by computing the cosine similarity between all prototypes derived from the left and right stereo images. Prototype pairs with similarity values exceeding a predefined threshold are identified as valid semantic correspondences. After establishing these correspondences, each matched pair of semantic regions is assigned a unique index, which is then converted into a grayscale value to generate the semantic guidance maps. Specifically, the semantic guidance maps impose region-level constraints that differentiate intra-region from cross-region correspondences, effectively suppressing mismatches in homogeneous areas and maintaining structural integrity along object boundaries.
In addition, considering that the initial semantic guidance maps often contains noise and isolated pixels along boundaries, as well as holes and over-segmentation in structurally complex regions, we further design a morphology–geometry joint post-process strategy. This strategy integrates morphological operations to fill holes, Gaussian filtering to suppress boundary noise, and the Douglas–Peucker algorithm [48] to optimize boundary contours, thereby producing smoother and more accurate semantic correspondence results. As shown in Figure 3, the post-processed semantic guidance map yields more precise results and effectively enhances the spatial consistency of the matching process.
By integrating the label-free module and the morphology–geometry joint post-process strategy, the optical flow estimation in our SAOF framework can be guided by region-level semantic priors rather than relying solely on pixel similarity. This establishes the foundation for the subsequent semantic-aware optical flow optimization and constraint mechanisms described in Section 3.3 and Section 3.4.

3.3. Multi-Level Optical Flow Optimization

As proposed in [49], the algorithm achieves efficient large-displacement matching by combining self-similarity propagation with a multi-level matching strategy. However, its direct application to satellite imagery still faces certain limitations.
First, although multi-level matching progressively refines disparities from coarse to fine, its performance still depends heavily on the accuracy of the top pyramid level. Errors at this level are easily propagated and amplified, especially in high-resolution satellite imagery with complex structures and large displacements. To mitigate this issue, we introduce a sub-top pyramid re-PatchMatch scheme that suppresses error accumulation and improves robustness in large-displacement regions.
Second, the block-based matching cost in [49] uses only color information, which is inadequate under illumination changes, weak textures, and complex structures in satellite imagery. To address this, we adopt a multi-feature cost that combines color, gradient, and Census cues, and further introduce semantic consistency and bilateral weighting to enhance structural coherence and preserve edges.
Finally, the self-similarity propagation mechanism relies on a fixed-size matching window, which lacks scale adaptability. To address this issue, we design a scale-adaptive matching window mechanism within the self-similarity propagation process. This mechanism dynamically adjusts the window size according to the resolution at each pyramid level, thereby enhancing the robustness of the matching process in high-resolution satellite imagery.

3.3.1. Sub-Top Pyramid Re-PatchMatch

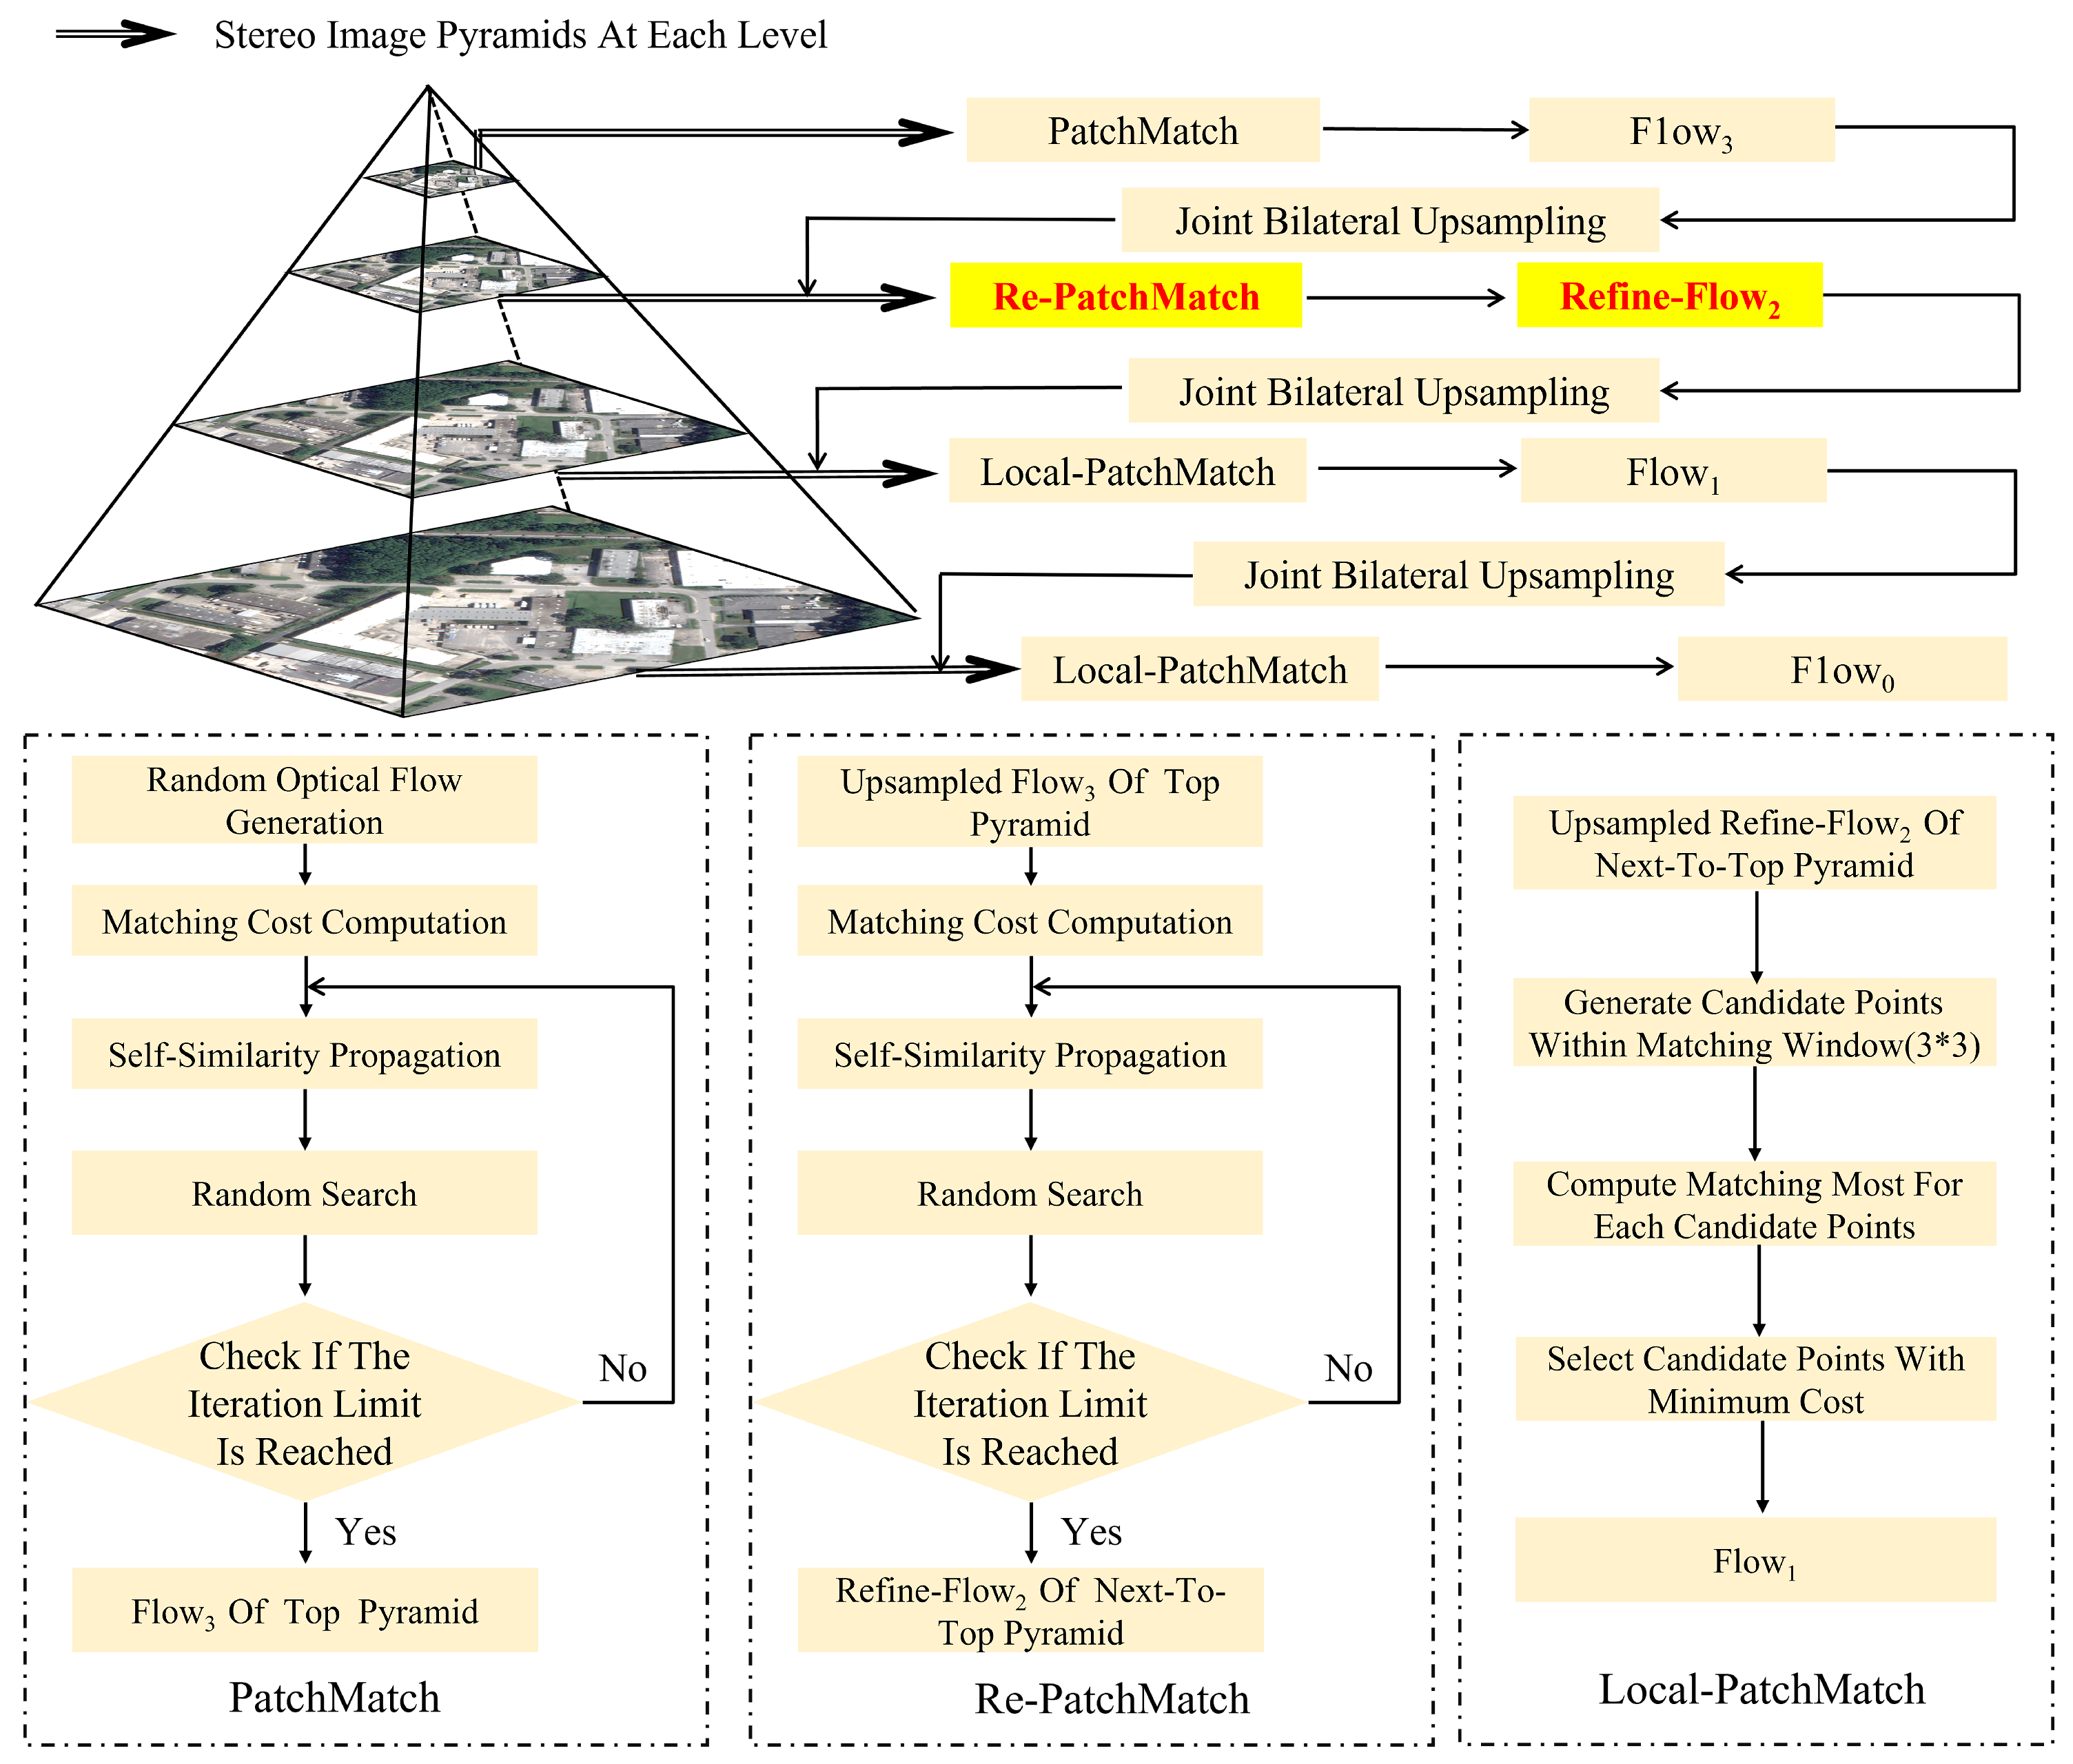
To address the issue that matching errors at the top level may accumulate and be amplified during pyramid propagation, a sub-top pyramid re-PatchMatch is introduced (as shown in Figure 4) Specifically, the initial optical flow estimation result ( F l o w 3 ) is first obtained at the top level. Then, at the sub-top pyramid level, self-similarity propagation and random search (re-PatchMatch) are executed based on F l o w 3 again to obtain a refined optical flow result ( R e f i n e - F l o w 2 ). Finally, joint bilateral upsampling and local matching are performed level by level to generate high-precision optical flow estimation at the original resolution. Through this scheme, the cumulative effect of errors during pyramid propagation can be effectively reduced, while the robustness of matching in large-displacement regions is significantly enhanced.

3.3.2. Multi-Feature Matching Cost Refinement

Traditional block-based matching methods typically define the matching cost as the L2 norm between blocks [50]. Specifically, suppose two blocks with radius r are centered at positions ( x A , y A ) in image A and ( x B , y B ) in image B, respectively. Then, the matching cost between the two blocks is defined as Equation (1).
C A , B = 1 2 r + 1 2 i = r r j = r r I A x A + i , y A + j I B x B + i , y B + j 2
where I A · and I B · denote the color values of the corresponding pixels in images A and B, · denotes the L2-norm, i , j denote the horizontal and vertical offset indices relative to the central pixel ( x A , y A ) and ( x B , y B ) , respectively.
However, a simple L2-norm-based cost computation has evident limitations: it is highly sensitive to outliers, making it vulnerable to noise and occlusions. Moreover, relying solely on color information is insufficient to accurately characterize the diverse land-cover types in satellite imagery. To address these issues, the L2-norm in Equation (1) is replaced with a more robust loss function, thereby mitigating the impact of outliers on the matching results.
In this study, we adopt a negative Gaussian function as a substitute for the L2-norm, as described in [49], which can be defined as Equation (2).
G d = 1 exp d 2 λ 2
where d denotes the block matching cost in different feature spaces, and λ is a tuning parameter. To fully exploit the multidimensional information contained in satellite imagery, the matching cost is formulated as a combination of multiple features, including color, gradient, and Census.
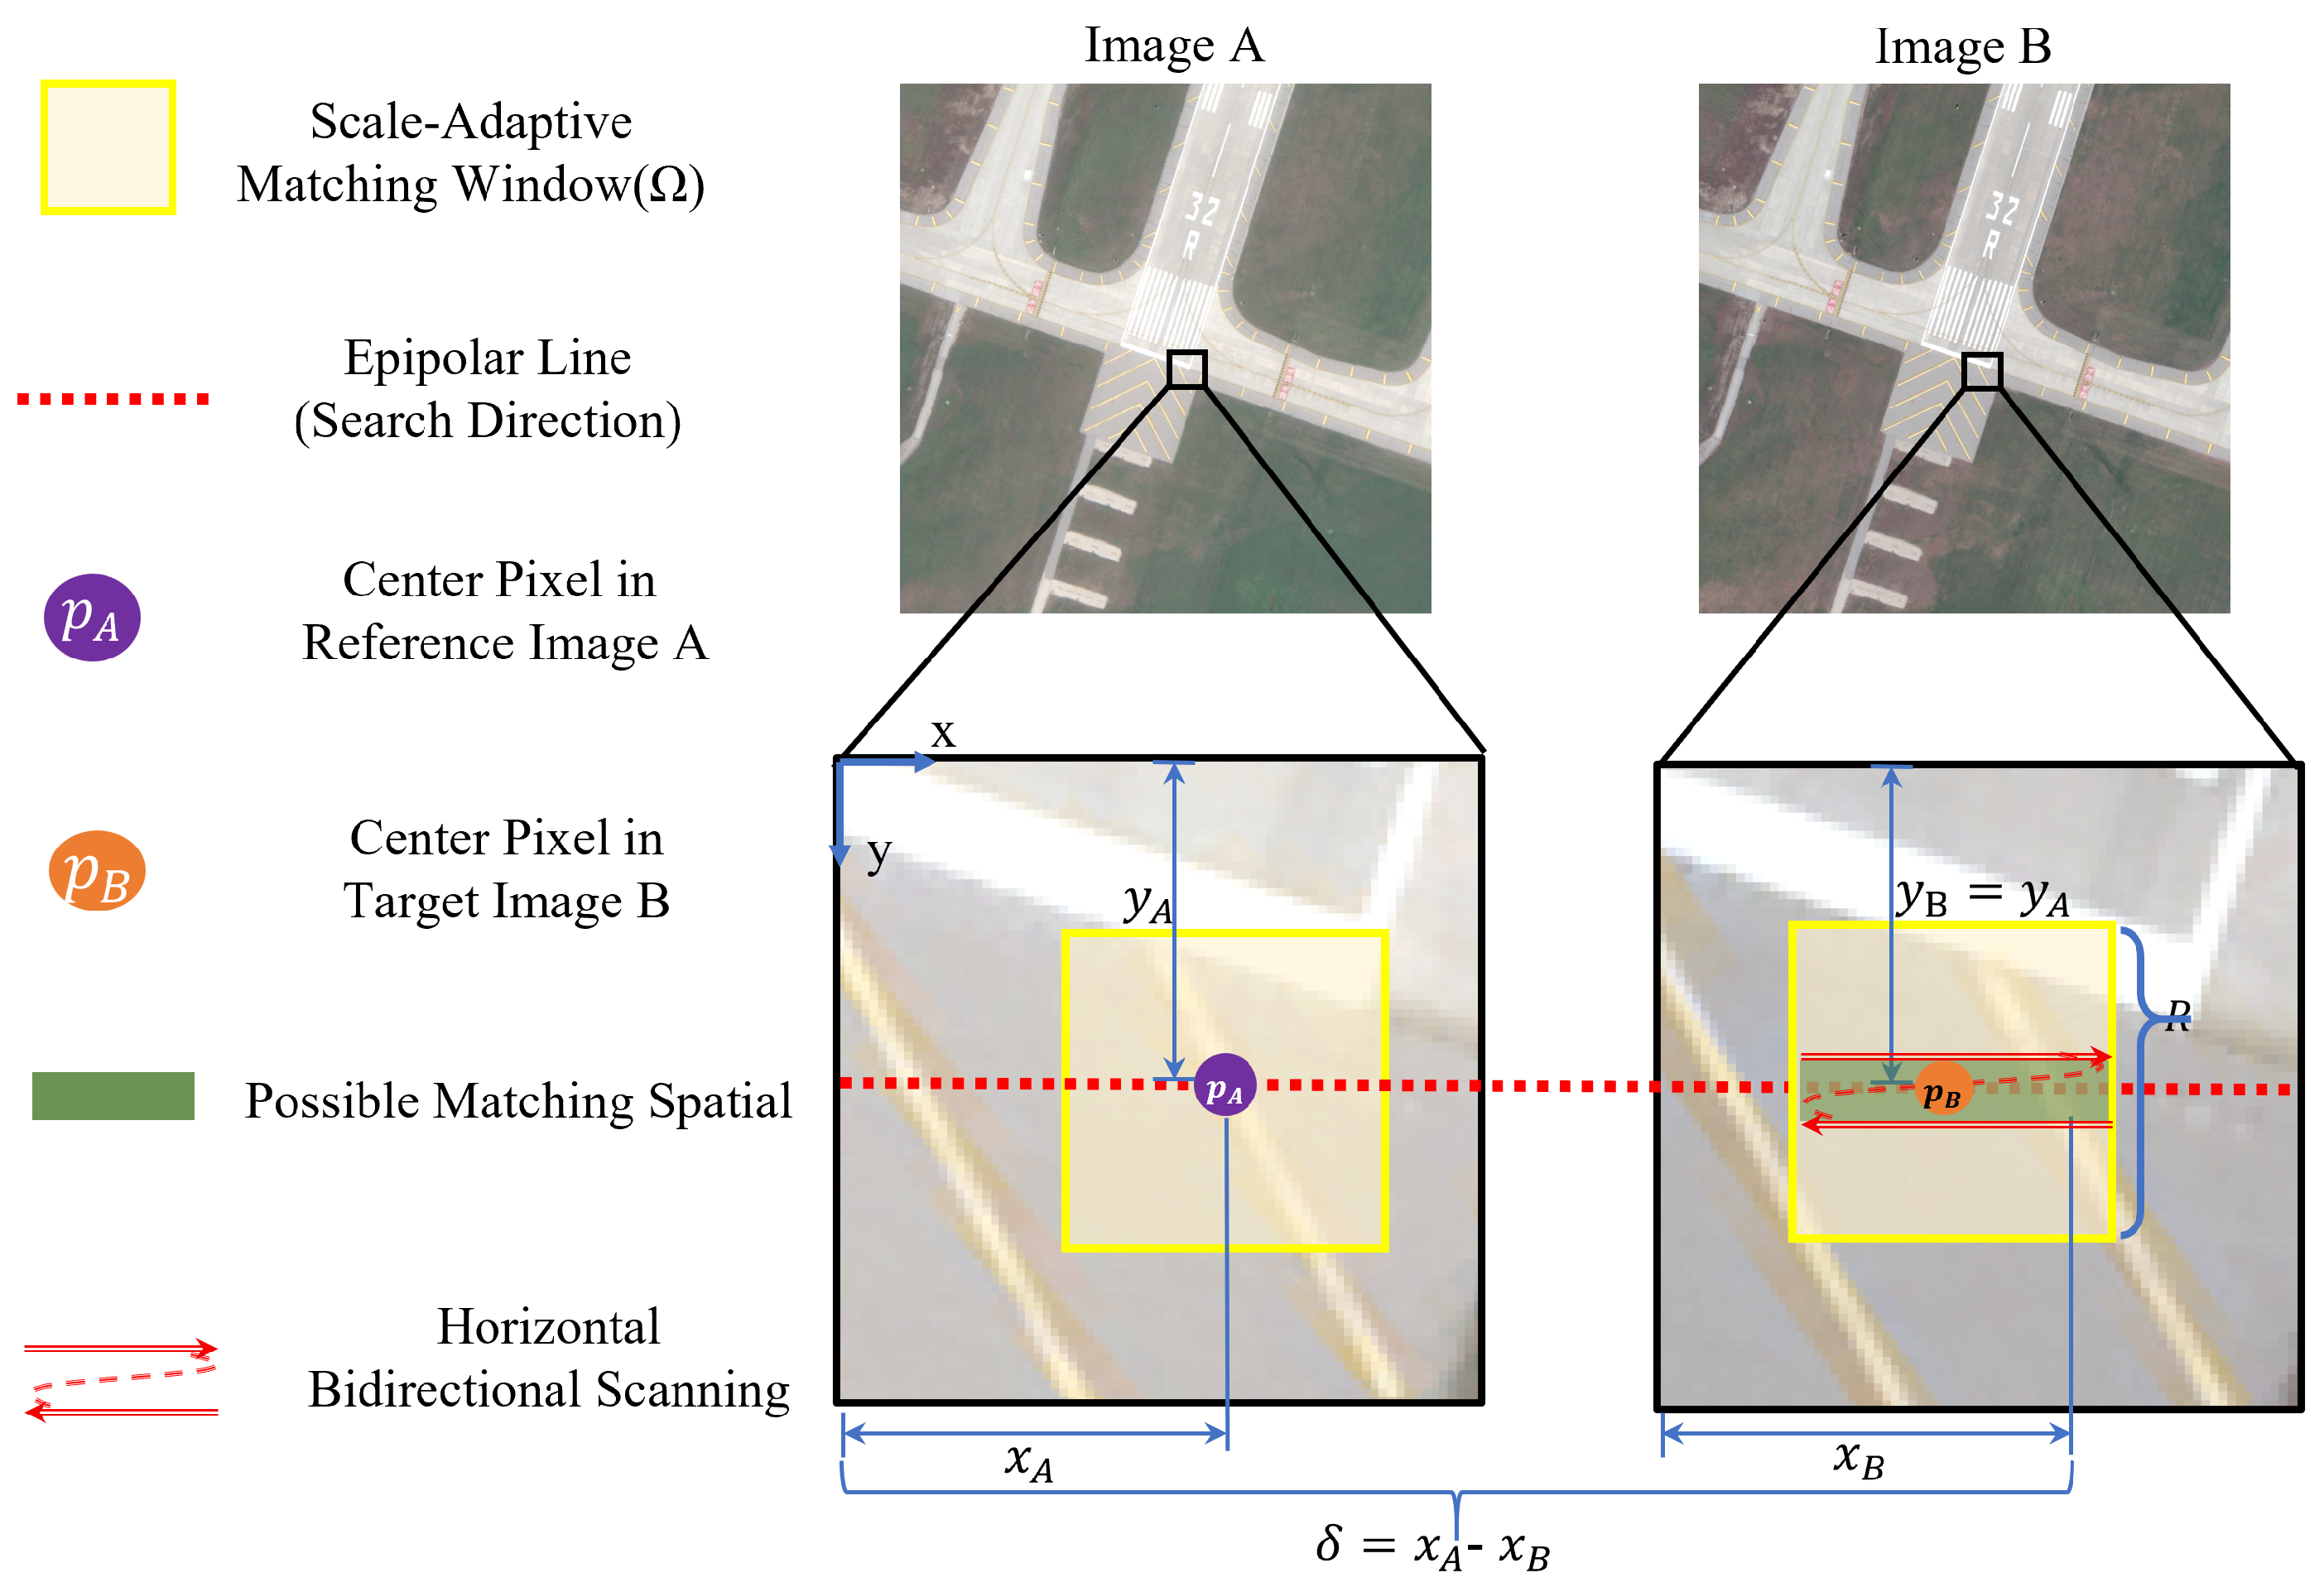
After approximately epipolar rectification, let image A serve as the reference and image B as the target. For a reference pixel p = ( x A , y A ) in A, the search for its corresponding pixel in B is strictly constrained along the epipolar line. Therefore, the search is performed only in one dimension, in the horizontal (column) direction. Accordingly, a candidate pixel in the target image B can be represented as q = ( x B , y B ) , where y A = y B and the disparity along the horizontal direction is defined as δ x = x A x B .
To compute the matching cost, a local matching window Ω of size R is centered at the reference pixel p. The offsets of neighboring pixels within this window, denoted as Δ = ( d x , d y ) Ω , are used to accumulate the multi-feature matching cost. It should be emphasized that these window offsets ( d x , d y ) are used solely for local matching cost computation and do not represent the search direction. During computation, the window slides strictly along the epipolar line direction, ensuring that the disparity search remains a one-dimensional process.
In this manner, the multi-feature matching cost for a pixel pair ( p , q ) within a matching window combines three types of feature costs: color cost ( d c o l ) , gradient cost ( d g r a d ) , and Census cost ( d c e n ) [51]. The detailed definitions and computation formulas are provided in the Appendix A (Equations (A1)–(A5)).
The three types of matching costs can all be regarded as block matching costs in different feature spaces and are robustified via a negative Gaussian function. However, when using the negative Gaussian function for larger matching windows, although the robustness is improved, edge details tend to be smoothed inevitably. To maintain robustness while enhancing sensitivity to edge structures, bilateral weights are introduced for cost optimization [52]. Based on [49], we define the multi-feature matching cost D ( p , q ) over a matching window Ω of size R as Equation (3), with the bilateral weighting ω b i l defined in the Appendix A (Equation (A6)).
D p , q = Δ Ω ω b i l p , q , Δ · D p , q , Δ Δ Ω ω b i l p , q , Δ
D p , q , Δ = G d c o l p , q , Δ + G d g r a d p , q , Δ + G d c e n p , q , Δ
where D p , q , Δ represents the matching cost through the negative Gaussian mapping, as defined in Equation (4).
By combining multiple features, the matching cost not only fuses color, gradient, and Census information, but also applies adaptive weighting to pixels within the matching window via the bilateral weights. This enhances robustness against outliers and noise while preserving the distinction of edges and fine structural details.

3.3.3. Scale-Adaptive Matching Window

To address the limitations of a fixed window size in optical flow estimation, we introduce a scale-adaptive matching window mechanism within the self-similarity propagation framework. The core idea is that the matching window size varies according to the image scale of each pyramid level. We first set a reference window R 0 at the top pyramid level. Then, a logarithmic scale factor log 2 ( w / ϑ ) is used to describe the relative image size, where w is the image width at the current pyramid level and ϑ is the reference width. This factor increases by one whenever the image width doubles, which is consistent with the sampling process of the image pyramid. A nonlinear term max ( 0 , · ) keeps the factor non-negative. The coefficient k controls how sensitively the window size responds to resolution changes, and the floor operation ensures an integer result. The complete derivation of this process can be defined as Equation (5). Through this derivation, it can be observed that images at different pyramid scales are assigned adaptively sized matching windows. At pyramid levels with larger image size, relatively larger windows are employed to aggregate richer spatial information, thereby improving matching stability and enhancing robustness to local structural variations.
R w = R 0 · 1 + k · max 0 , log 2 w ϑ
where R 0 denotes the matching window size at the top pyramid level, R w denotes the scale-adaptive matching window size, k is a tuning parameter, w represents the image width at the current pyramid level, and ϑ is the reference width, where · denotes the floor operation.
As shown in Figure 5, after approximately epipolar rectification, each pixel p A in the reference image A searches for its correspondence q B in the target image B along the epipolar line (red dashed line). The scale-adaptive matching window (yellow boxes) is centered on the selected pixel p A and adaptively resized according to the image pyramid level as Equation (5). To ensure consistency with epipolar rectification, the bidirectional scanning is limited to the 1D horizontal direction, as indicated by the red double-headed arrows. We also provide the detailed pseudo-code in Appendix B, Algorithm A1. The algorithm has a space complexity of O ( n ) and a time complexity of O ( n l o g n ) during propagation.

3.3.4. Post-Process

When computing the optical flow at each pixel across the pyramid levels, directly computing the corresponding backward flow at the matched point coordinates obtained from the forward flow leads to low computational efficiency. Therefore, in this study we compute the forward and backward flows separately and perform a forward–backward consistency check to handle occlusions occurring during the computation. To compensate for scale differences among pyramid levels, a dynamic-threshold strategy is employed in the forward–backward consistency check; the threshold is given by the following Equation (6).
ϵ L = ϵ 3 log 2 W 3 W L , L = 0 , 1 , 2
where ϵ L denotes the threshold for the forward–backward consistency check at L pyramid level, W L denotes the image width at the L pyramid level, ϵ 3 denotes the threshold at the top pyramid level, W 3 denotes the image size at the top pyramid level.
Although forward–backward consistency removes many mismatches, some outliers still remain. To further suppress them, we apply a weighted median filter at each pyramid level to smooth the flow field and improve robustness. For sub-pixel estimation, matching costs are computed for several candidate points around each pixel, and a 2D paraboloid is fitted to these costs. The sub-pixel flow is then obtained by analytically locating the minimum of the paraboloid. Finally, the refined sub-pixel flow at full resolution is converted into a high-precision disparity map using the optical-flow–to-disparity relationship.

3.4. Semantic-Aware Matching Constraints

Given that disparities within the same semantic region of satellite stereo images should remain continuous and consistent, whereas distinct semantic regions usually exhibit clear disparity discontinuities, we further utilize the pre-generated semantic guidance maps (Section 3.2) to introduce a semantic consistency constraint into the matching cost computation. The core idea is to explicitly distinguish between intra-region and cross-region pixel pairs using the pre-generated semantic guidance maps and impose penalties on the latter during cost computation.
Specifically, let the center pixel in the reference image A be denoted as p, and the corresponding candidate pixel in the target image B be denoted as q. For any pair of neighboring pixels ( p , q ) within the matching window, the semantic constraint is introduced into the cost calculation as follows:
  • Intra-image semantic region consistency check. Determine whether the neighboring pixel p in the reference image A belongs to the same semantic region as the center pixel p, and whether the neighboring pixel q in the target image B belongs to the same semantic region as the center pixel q. This process can be formulated as Equation (7).
    R 1 p , q = I S 1 q = S 1 p ,   R 2 p , q = I S 2 q = S 2 p
    where R · denotes the intra-image semantic consistency function, I represents the indicator function, and S 1 · , S 2 · denote the grayscale values of the semantic guidance maps of the reference and target images, respectively.
  • Cross-image semantic region check. If R ( 1 ) = 1 and R ( 2 ) = 1 , further examine the semantic consistency between the reference and target images.
  • Penalty mechanism. If the inter-image check confirms consistency, ( p , q ) is considered to belong to the same semantic region, and no penalty is applied. Otherwise, a penalty term based on the color cost is imposed. Specifically, the consistency indicator C ( p , q ) is defined as Equation (8). The penalty term ω s e g ( p , q ) is then computed as Equation (9), where E ( p , q ) represents the effective color cost and is defined Equation (10).
    C p , q = I R 1 p , q = R 2 p , q
    ω s e g p , q = exp E p , q σ r 2
    E ( p , q ) = 0 , R 1 ( p , q ) = 1 C ( p , q ) = 1 d c o l 1 ( p , q ) , otherwise + 0 , R 2 ( p , q ) = 1 C ( p , q ) = 1 d c o l 2 ( p , q ) , otherwise
By integrating this penalty into the optimized matching cost function Equation (3), we obtain the final cost formulation as follows Equation (11):
D p , q = Δ Ω ω b i l p , q , Δ · ω s e g p , q , Δ · D p , q , Δ Δ Ω ω b i l p , q , Δ · ω s e g p , q , Δ
Through the design of a semantic-guided regional consistency penalty, both intra-region smoothness and cross-region disparity discontinuities are explicitly modeled in the matching cost function. Consequently, the optimization process automatically suppresses cross-region mismatches, enabling the final results to maintain smoothness and robustness within homogeneous regions while accurately capturing true boundaries in complex scenes. This effectively improves the overall matching accuracy.

4. Results

In this section, we evaluate the performance of the SAOF framework. We first introduce the experimental dataset, followed by the implementation details and evaluation metrics used in our experiments. Finally, we present the disparity results across different scene categories, including complex regions and textureless regions, and compare them with those of other state-of-the-art methods.

4.1. Experiment Settings

This subsection details the experimental setup, covering dataset, implementation details, and evaluation metrics. We evaluate the proposed SAOF framework on the Track-2 US3D dataset. Key implementation details are described in the following. Finally, we introduce the evaluation metrics (EPE and D1) adopted for quantitative assessment.

4.1.1. Dataset

In this study, the performance of the proposed SAOF is evaluated using the Track-2 US3D dataset provided by the 2019 IEEE Data Fusion Contest [53,54]. The dataset, acquired by the WorldView-3 satellite, covers approximately 100 km2 over Jacksonville, Florida, and Omaha, Nebraska. It contains more than 4000 stereo image pairs with diverse scene types, including skyscrapers, residential areas, rivers, and woodlands. The dataset provides epipolar-rectified RGB image pairs along with their corresponding ground-truth disparity maps. Each image has a size of 1024 × 1024 pixels, with a ground sampling distance (GSD) of approximately 0.3 m. Detailed information is presented in Table 1.

4.1.2. Implementation Details

In the proposed SAOF method, the parameter settings involve two modules:
  • Multi-Level Optical Flow Optimization: This module involves four key parameters: the number of pyramid levels (P), the matching window size (R), the weighting coefficients of multi-feature matching cost components ( λ c e n , λ g r a d , λ c o l ), and the bilateral weighting parameters ( σ s , σ r ). To ensure a good balance between computational cost and estimation accuracy, four pyramid levels are adopted according to the image size of the dataset. The matching window size determines the spatial extent of local similarity measurement in optical flow estimation. Considering the presence of multi-scale ground objects in the dataset, this value is set to 17. To address illumination variations and radiometric inconsistencies commonly observed in the dataset, a higher weighting coefficient is assigned to the Census cost component, enhancing the robustness of matching against brightness changes. Furthermore, the bilateral weighting is incorporated into the multi-feature cost computation to preserve edge structures, where σ s and σ r control spatial and range influences respectively.
  • SAMgeo-Reg module: This module incorporates semantic guidance maps into the optical flow optimization process, where they serve as region-level priors that improve the consistency and reliability of disparity estimation. These maps are derived from the semantic correspondences between the left and right stereo images, which are established by computing the cosine similarity between their semantic prototypes. To ensure reliable semantic constraints, a relatively high similarity threshold τ is applied to filter out uncertain matches, retaining only high-confidence semantic correspondences.
The detailed parameter settings are summarized in Table 2.

4.1.3. Evaluation Metrics

In this work, the average endpoint error (EPE) and percentage of error pixels (D1) are adopted as the primary metrics to evaluate the accuracy of predicted disparity maps. Let the ground-truth disparity be d g t , the predicted disparity be d ^ p r e , and the set of valid disparity pixels be Φ , with the total number of valid pixels N. The two metrics are defined as follows:
  • EPE: EPE measures the overall deviation between the predicted disparity and the ground truth, computed as Equation (12). A smaller EPE indicates that the predicted disparity is closer to the ground truth, reflecting the average accuracy of the method over the entire image.
    E P E = 1 N k Φ d g t d ^ p r e
  • D1: D1 focuses on the proportion of pixels whose prediction error exceeds a certain threshold, which evaluates the number of significantly erroneous pixels. It is computed as Equation (13). This metric reflects the proportion of erroneous pixels in the predicted disparity map.
    D 1 = 1 N k Φ d g t d ^ p r e > ε
    where ε is the error threshold.

4.2. Results and Comparisons

We use SGM [17], AD-Census (ADC) [55], MGM [19], and Gefolki [56] as traditional stereo matching algorithms. In addition, HMSMNet [27] is included as a deep-learning baseline. SGM is the classical semi-global algorithm and is widely applied to stereo matching. ADC constructs a robust matching cost to alleviate mismatches caused by illumination inconsistency and low-texture regions. MGM augments SGM with global-consistency constraints to improve matching accuracy. Gefolki, built on the Lucas–Kanade (LK) optical-flow framework [30], employs rank filtering and related techniques to produce dense flow fields. HMSMNet incorporates hierarchical matching and spatial–context modeling into its overall architecture and is an end-to-end stereo matching network specifically designed for satellite imagery. The key parameter settings of each method are as follows:
  • SGM [17]: Block size = 11; P1 = 8 × image channels × Block size; P2 = 64 × image channels × Block size.
  • AD-Census [55]: Census window size = 9 × 7; λ c e n s u s = 30; λ A D = 10.
  • Gefolki [56]: Pyramid levels = 4; Iterations = 5; Median filter window size = 5.
  • MGM [19]: Number of search directions = 8; P1 and P2 are set to the same values as in SGM.
  • HMSMNet [27]: Epochs = 100; the initial learning rate is set to 0.001 and drops to half every 10 epochs as the training goes on.
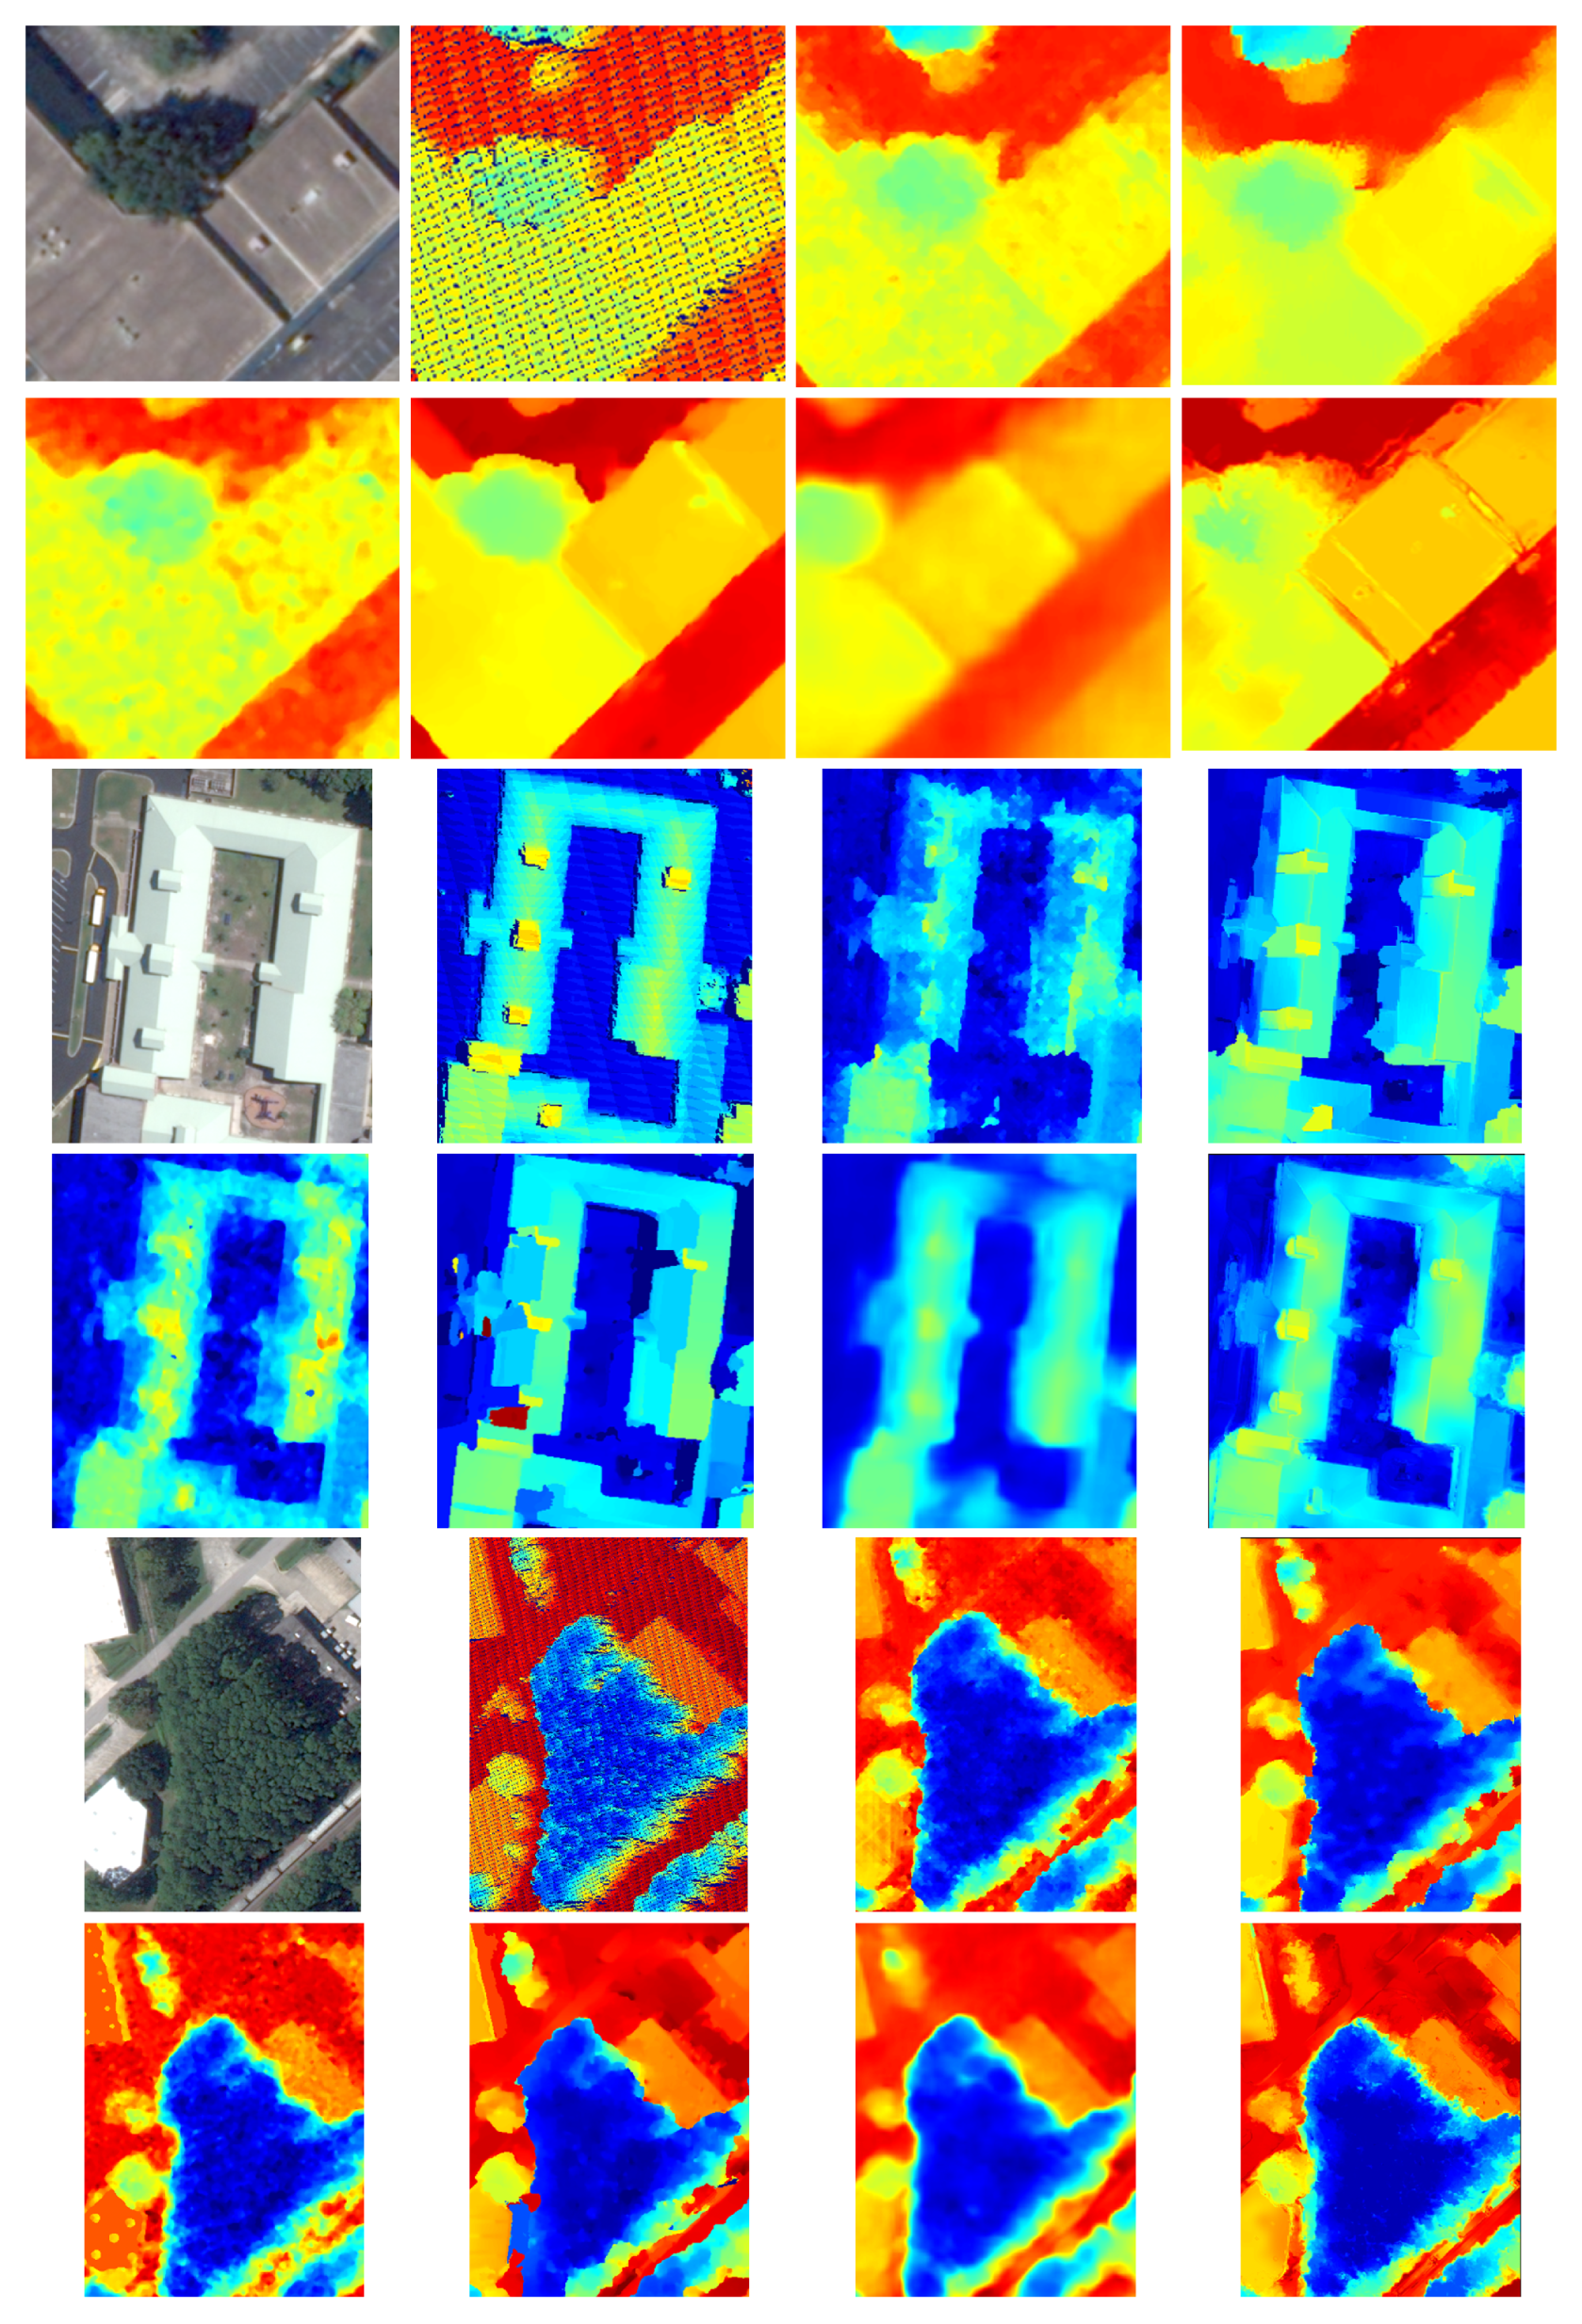
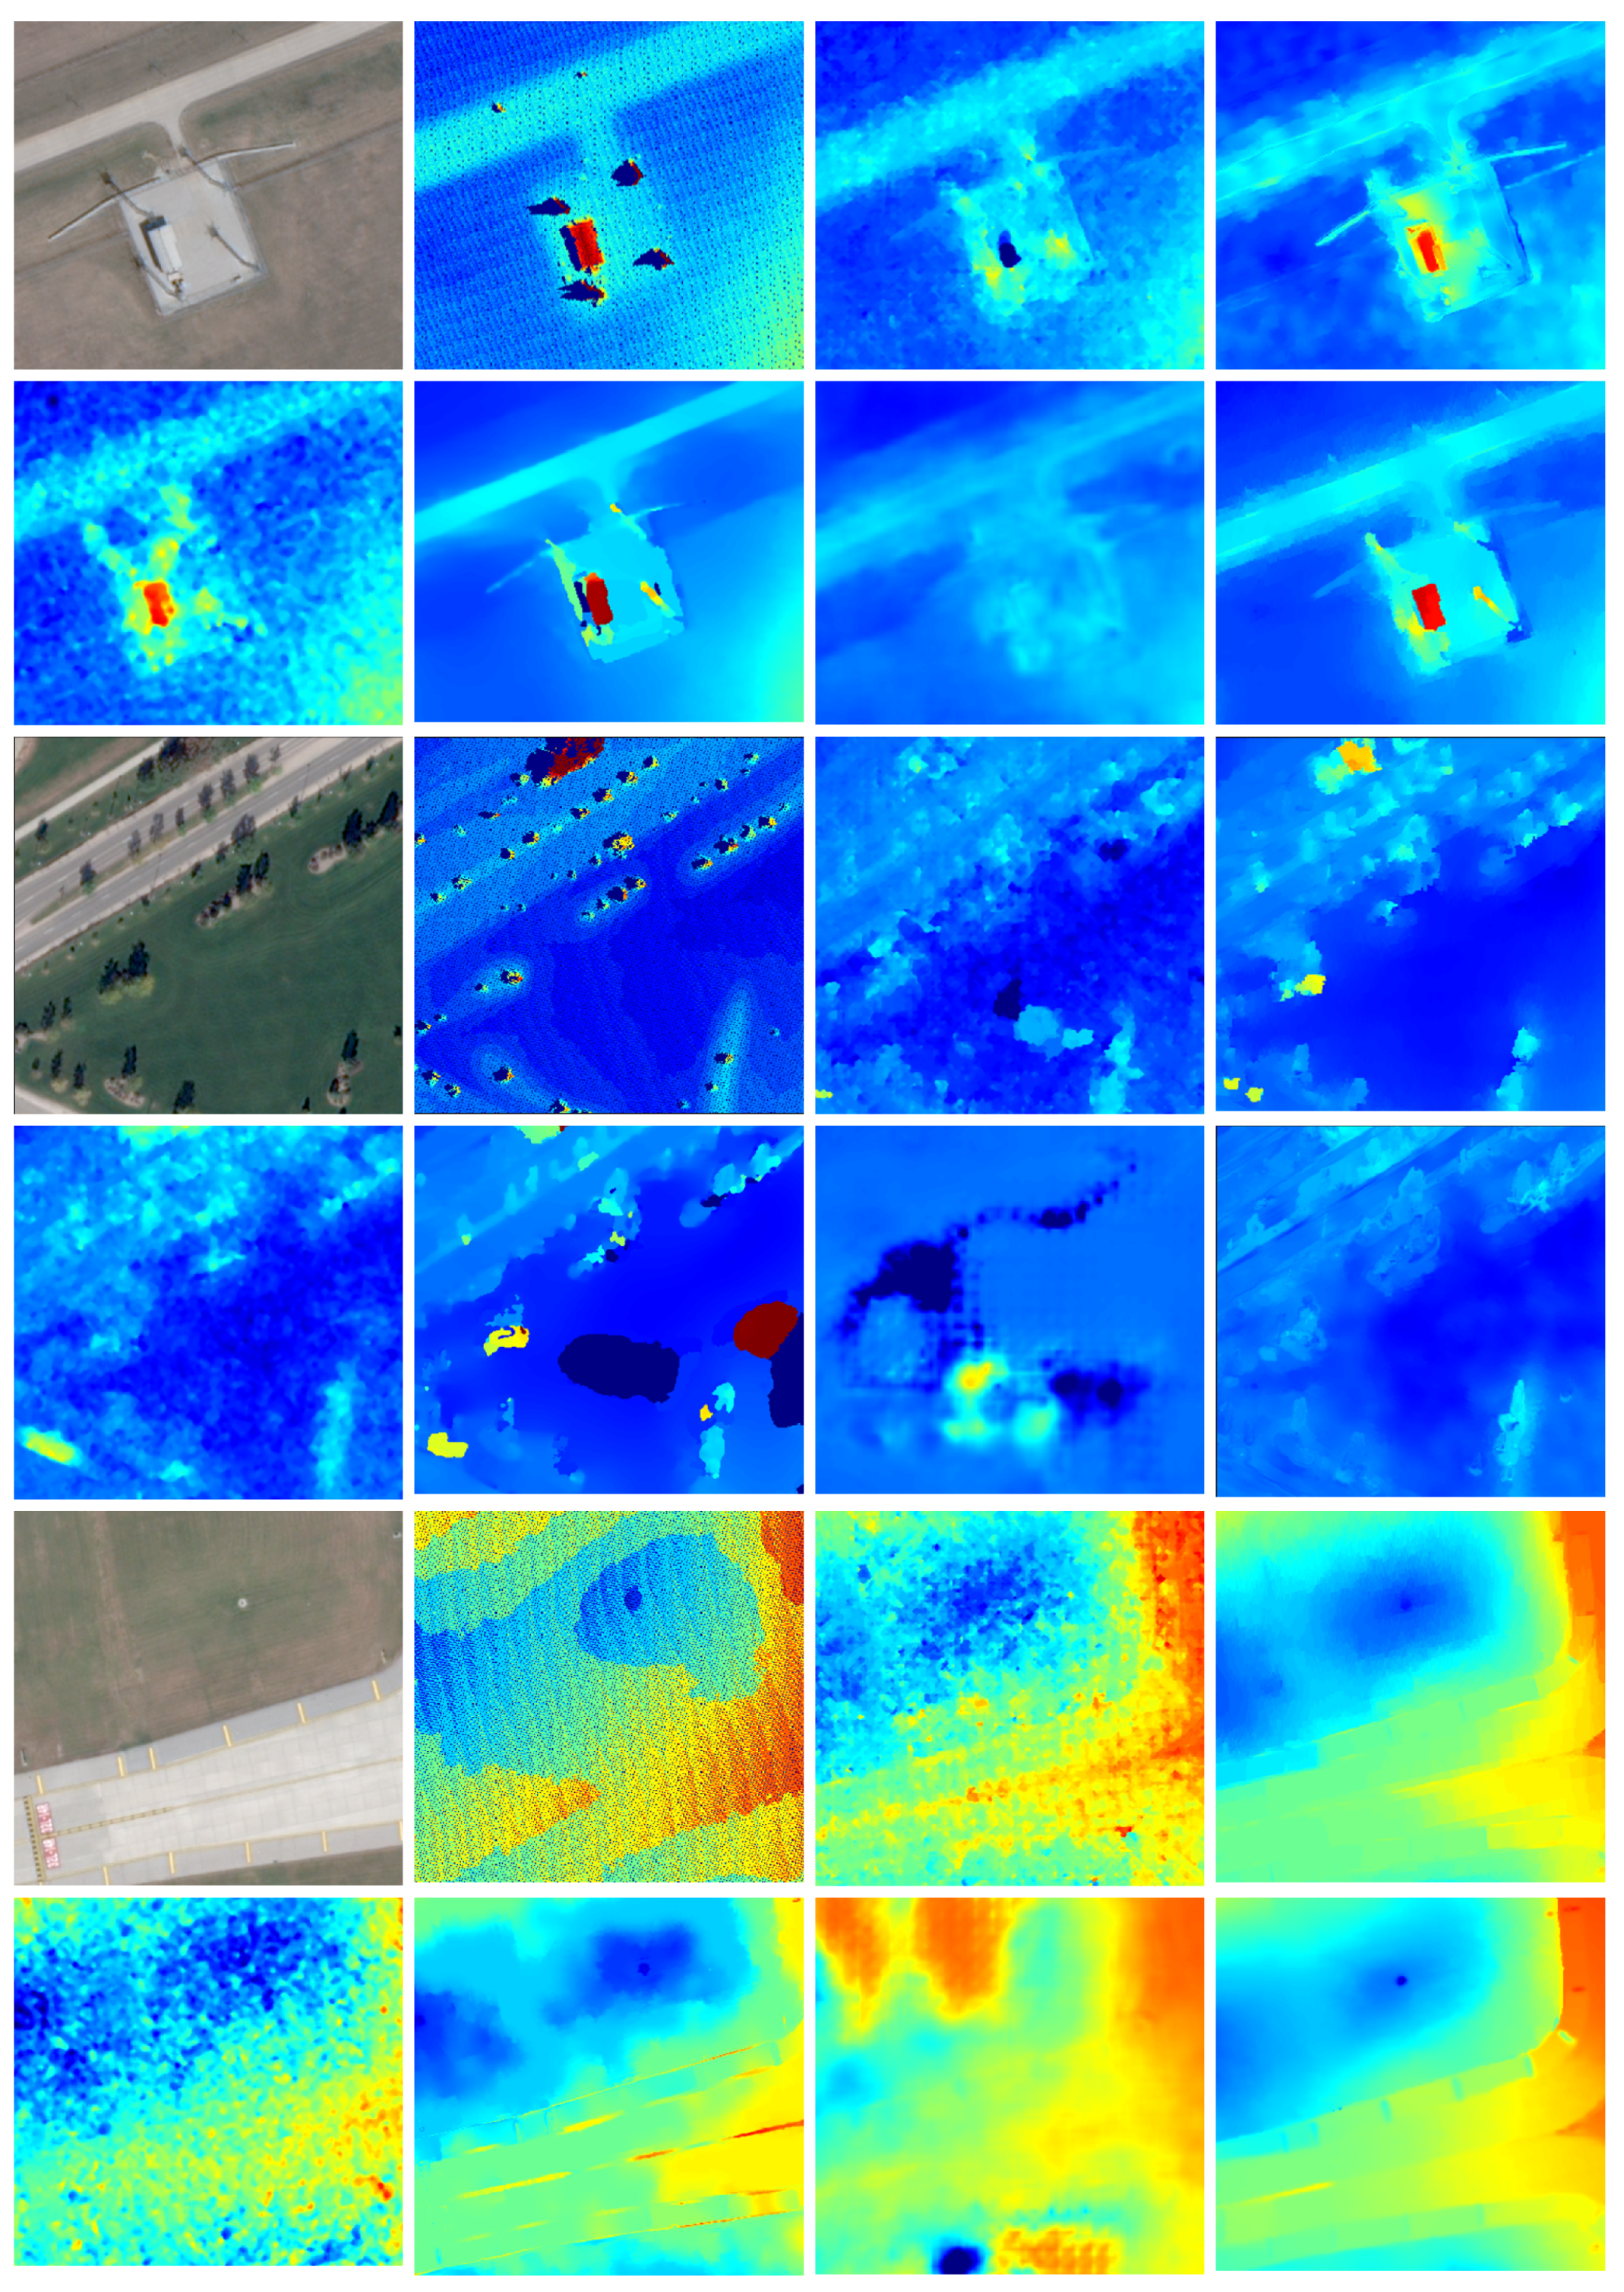
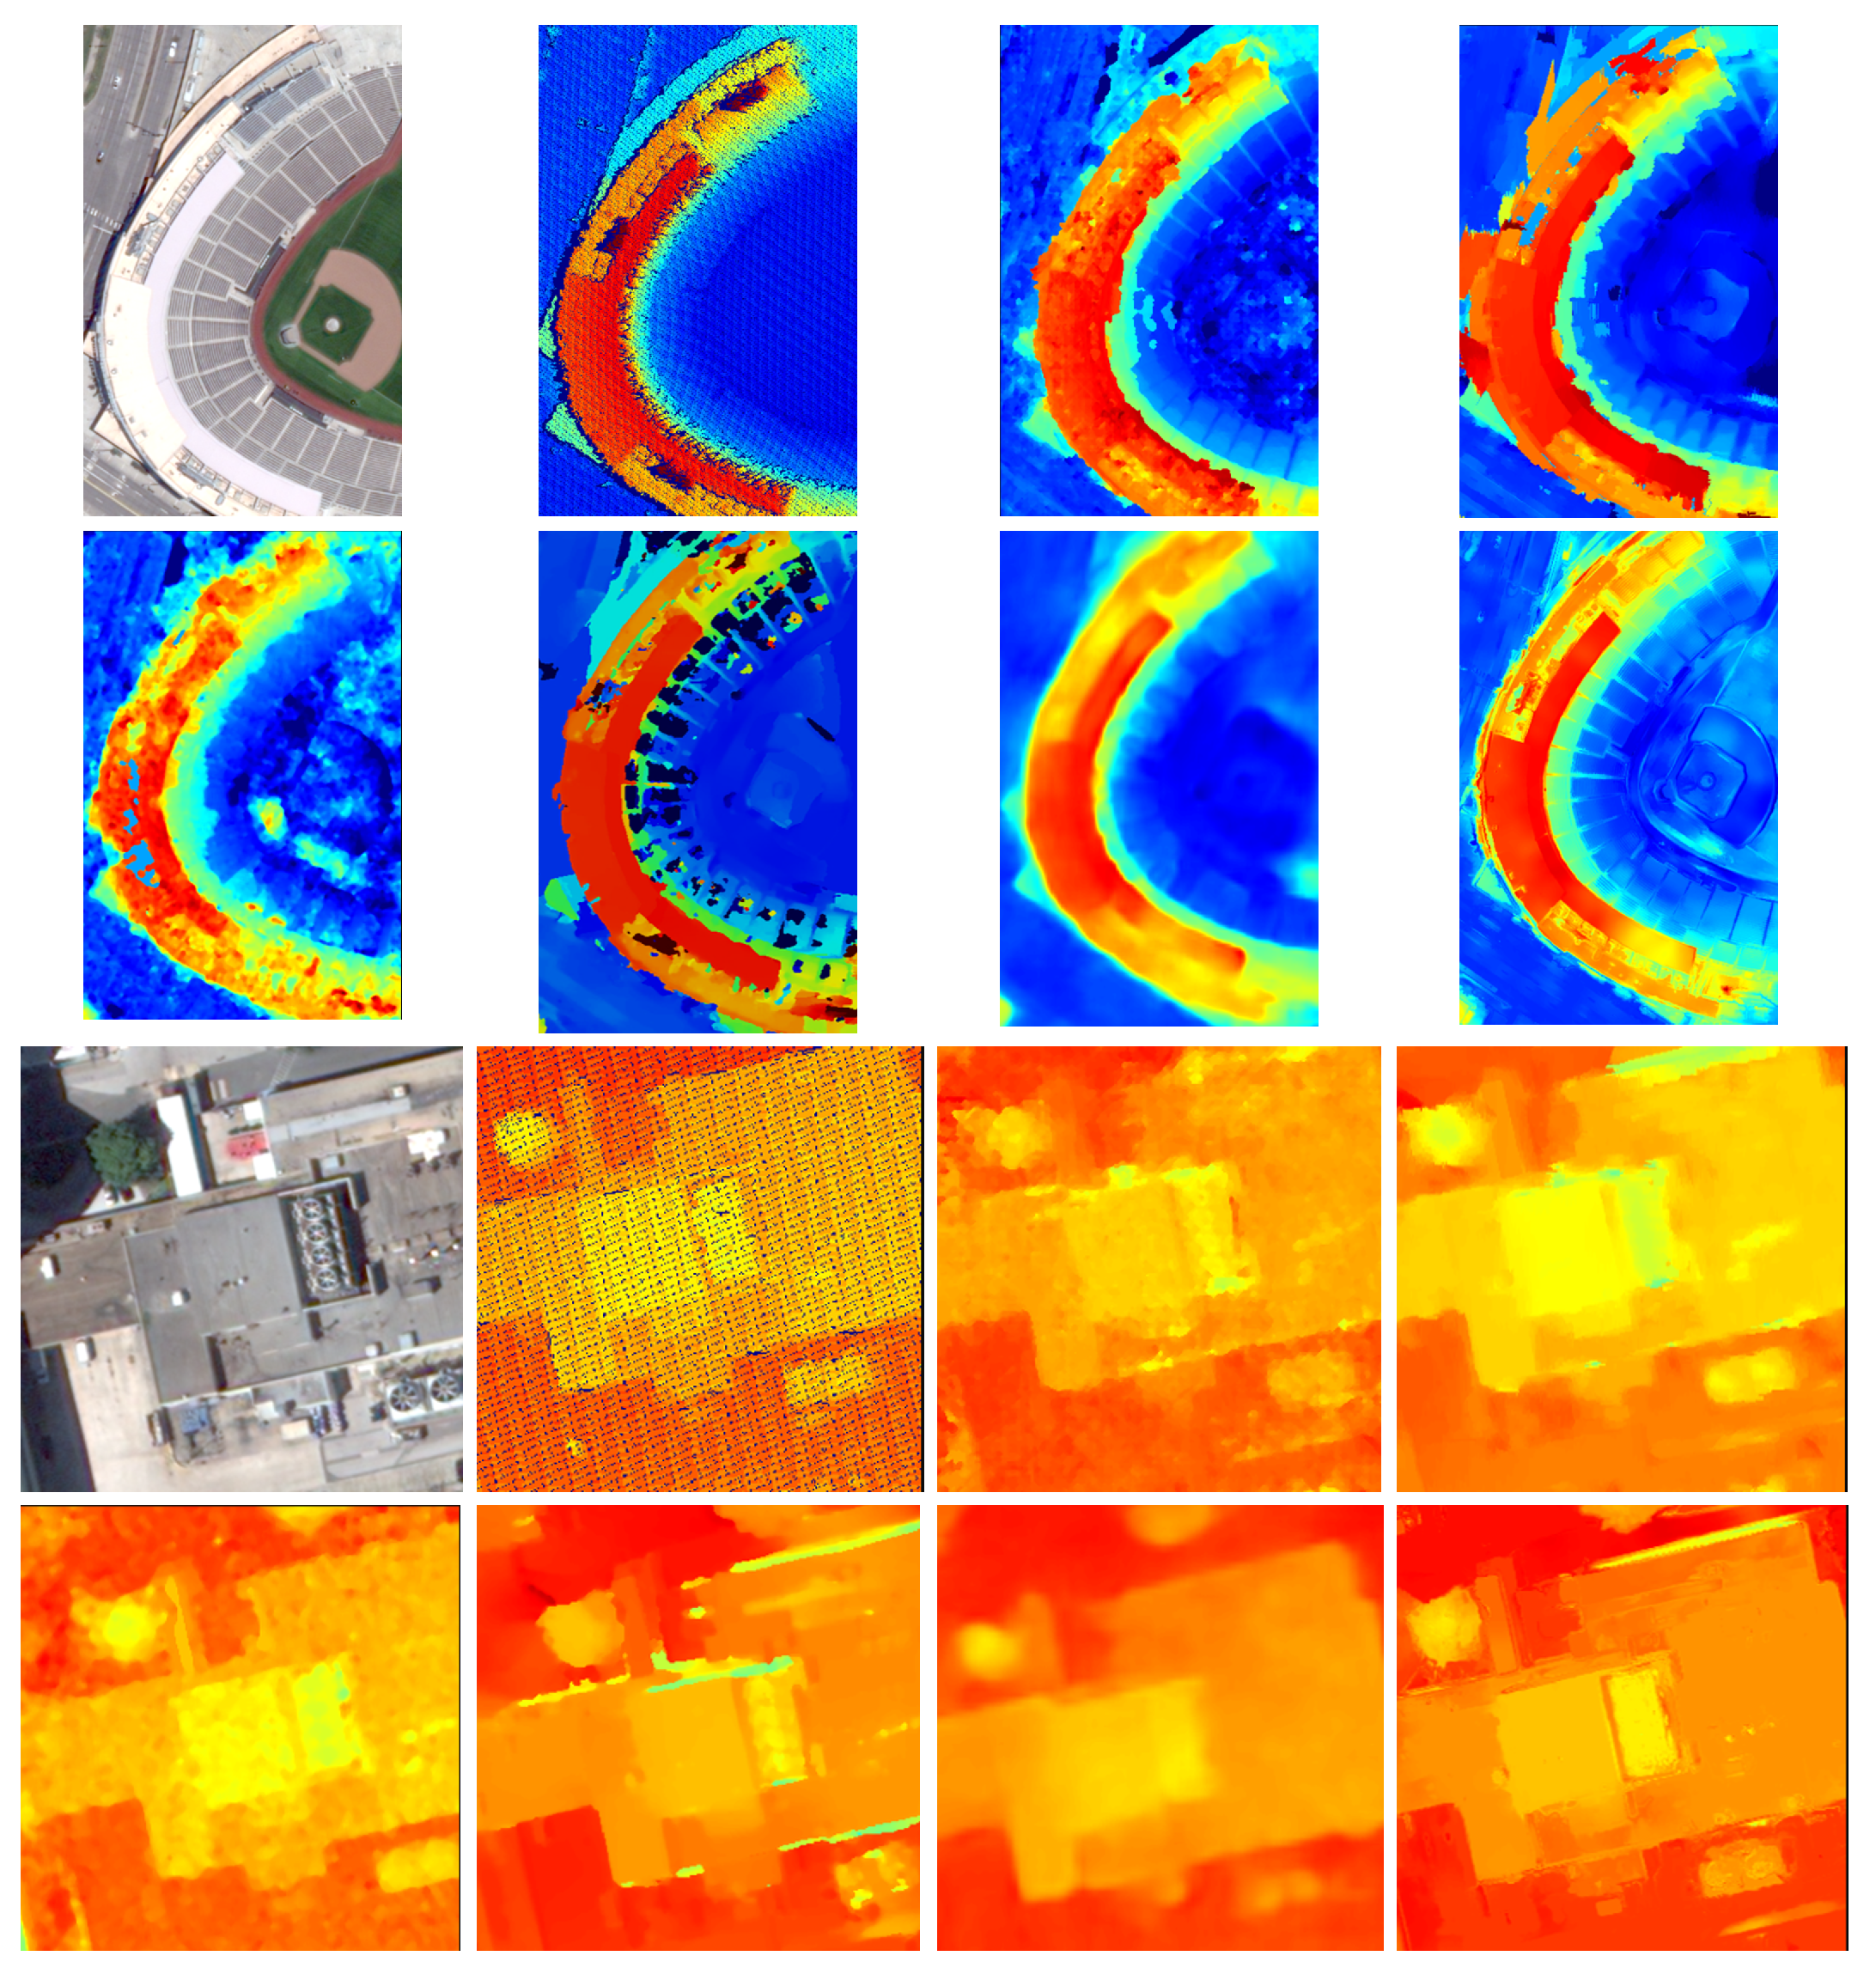
Disparity estimation in high-resolution satellite stereo images is highly challenging due to their diverse and complex scene content. Following [28,57,58], the performance of the SAOF algorithm was evaluated on multiple stereo pairs representing various land-cover types, including structurally complex regions (e.g., urban areas and vegetation with large disparities) and textureless surfaces (e.g., gobi, lakes, and airport runways). The specific details of the selected stereo images are provided in Table 3. For clarity, the enlarged details of experimental results are provided in the Appendix C, Figure A1, Figure A2, Figure A3 and Figure A4.

4.2.1. Complex Regions

To more comprehensively analyze the performance of the SAOF in complex scenes, we further divide the evaluation into three representative categories: weak-texture regions containing large, flat or homogeneous building rooftops; structurally complex building regions; and building–vegetation mixed regions.
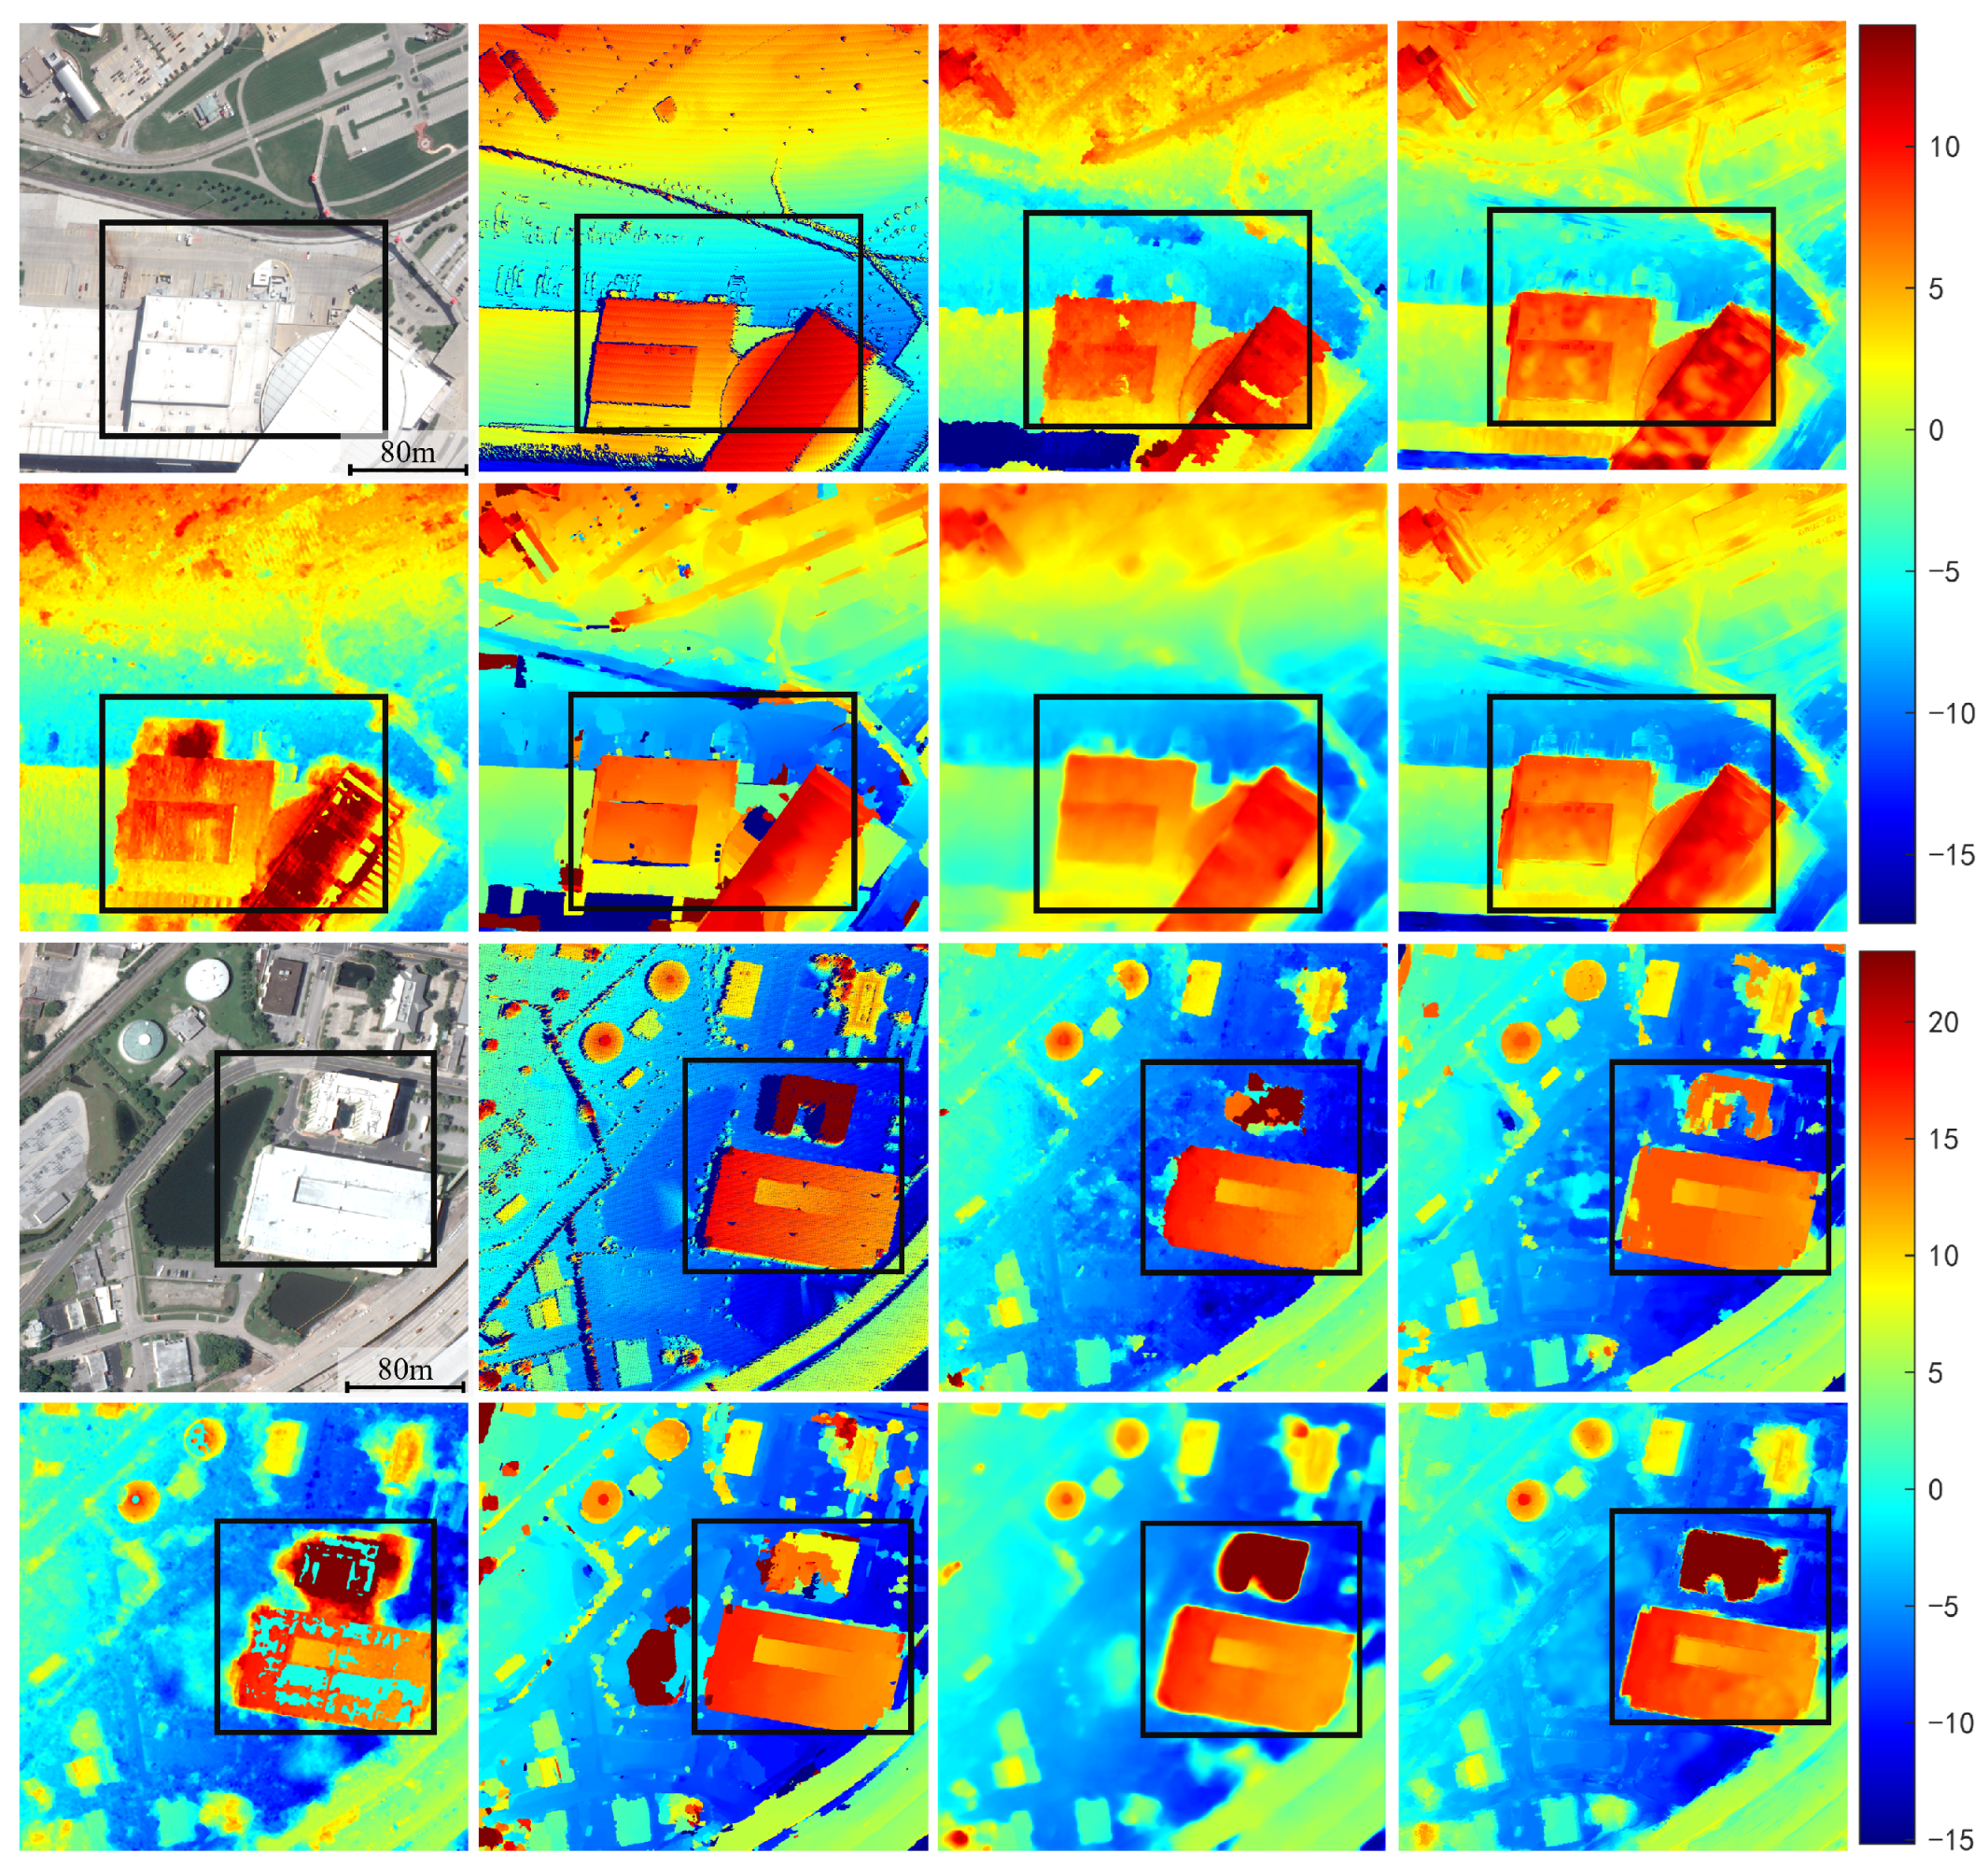
Figure 6 shows disparity estimates from different algorithms in weak-texture regions with large, flat, or uniform rooftops. SGM results display structural artifacts—linear or cross-shaped streaks along aggregation paths. These limitations come from its cost-aggregation strategy, producing unsmooth disparities in weak-texture areas. ADC gains robustness to illumination changes and maintains relatively smooth disparities in such regions. However, it misses fine details and struggles with structurally complex areas. MGM addresses SGM’s cost-aggregation shortcomings, but still has trouble in these regions. Gefolki is sensitive to weak textures: its optical-flow propagation lacks stable constraints in flat areas, so random noise and blurred edges appear. HMSMNet gives overall smoother results. Yet, due to its hierarchical cost volumes and spatial attention mechanisms, large weak-texture regions are prone to over-smoothing, which blurs edge transitions and leads to the merging of adjacent buildings.
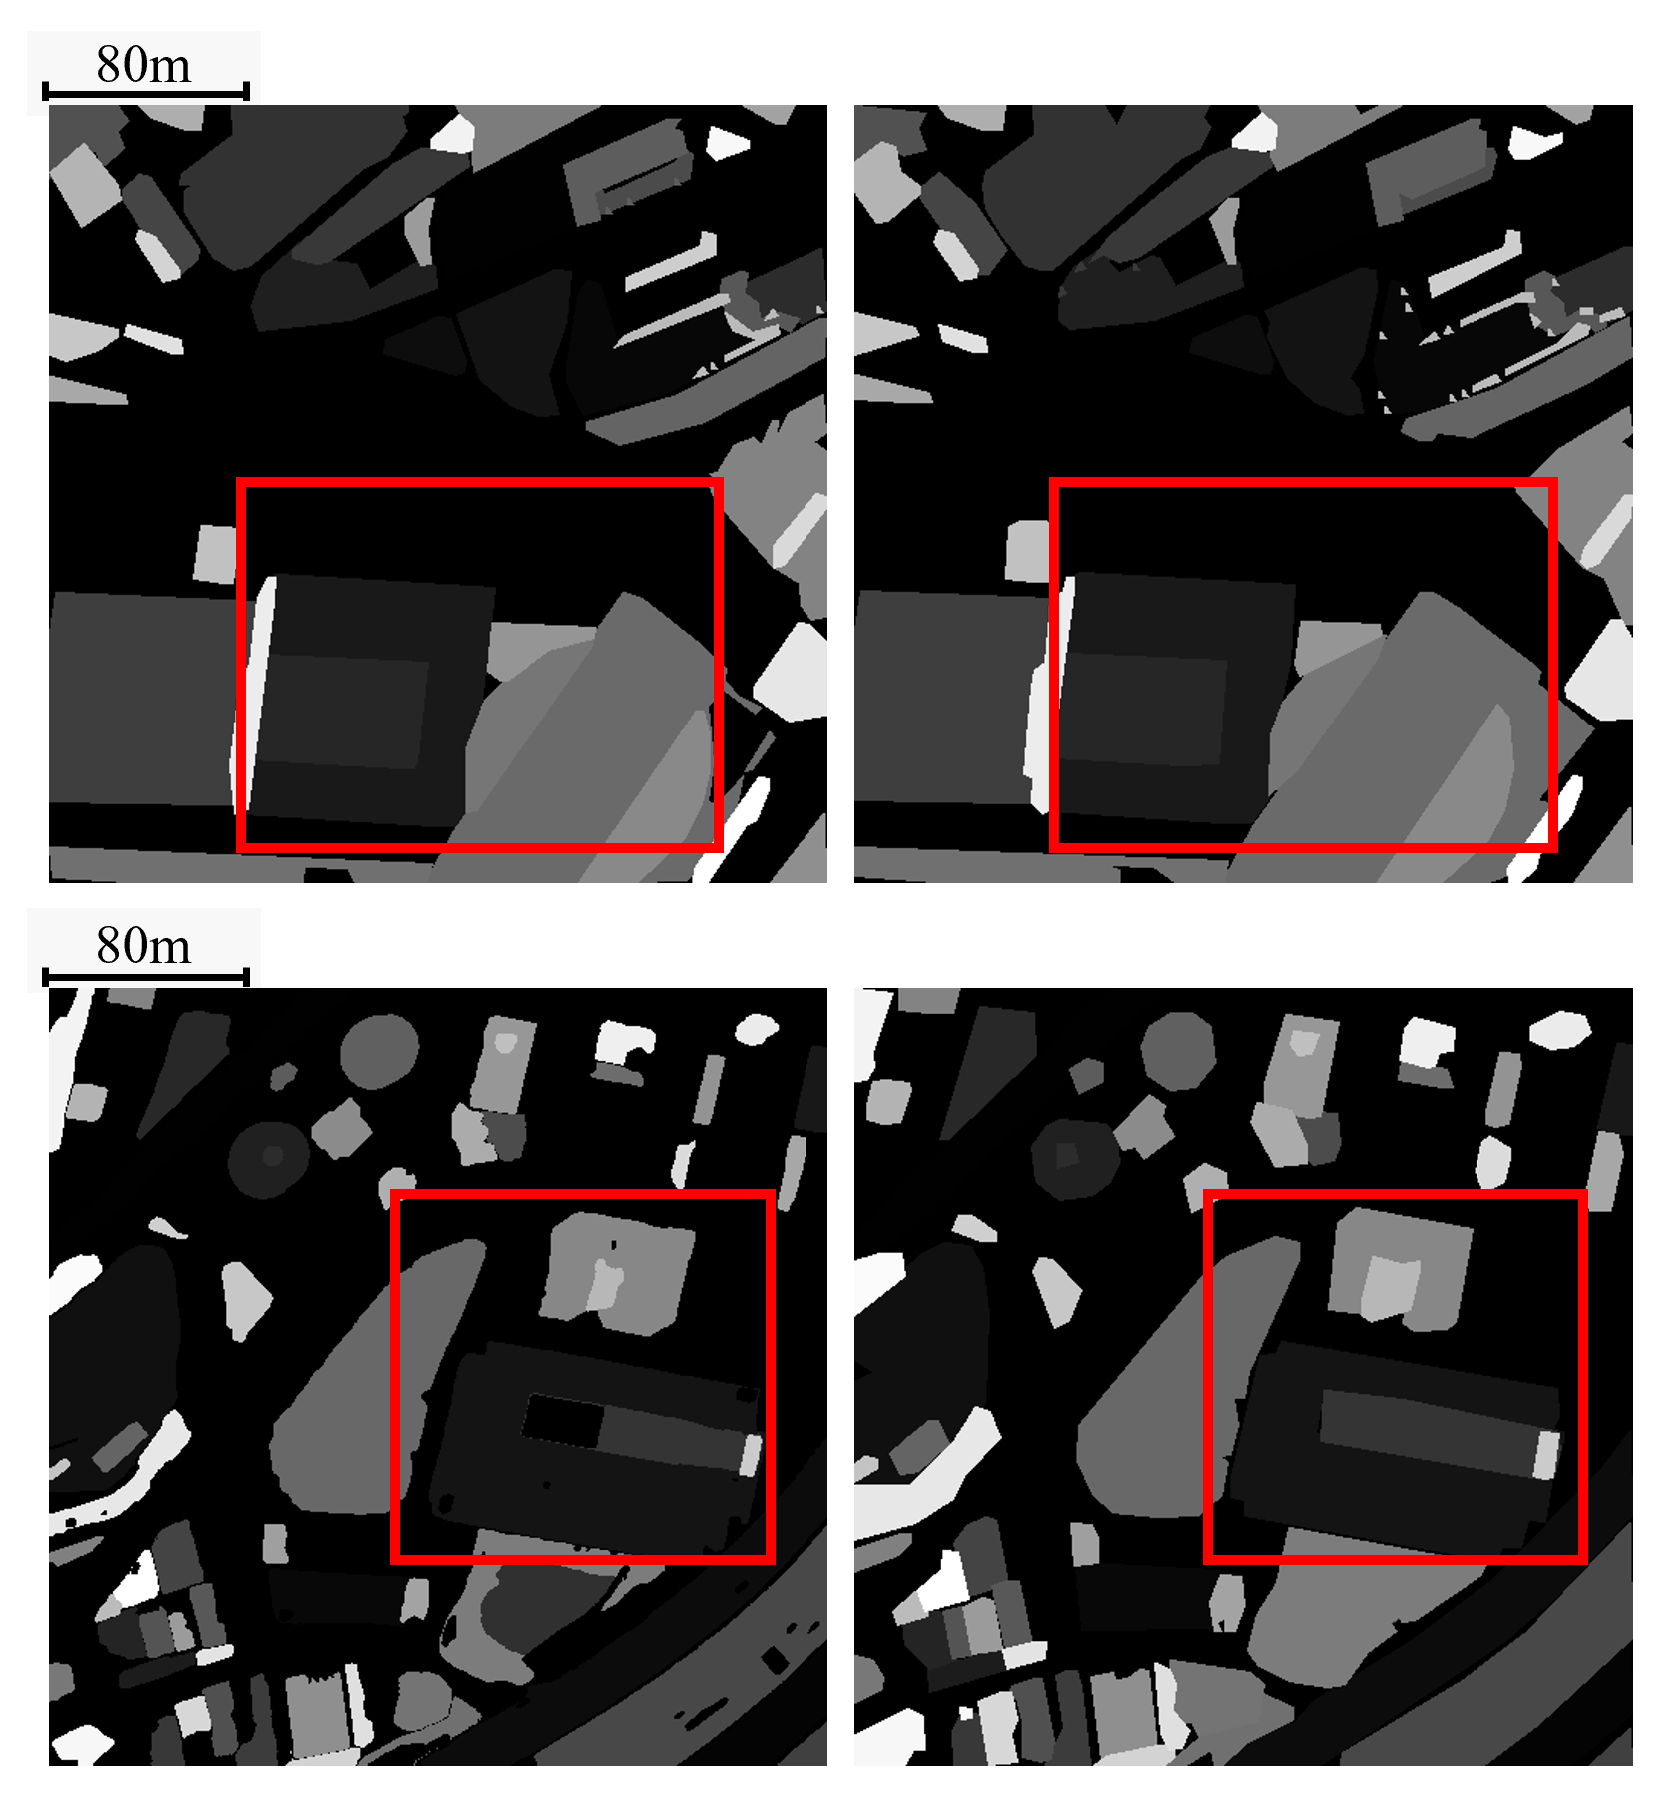
By contrast, SAOF effectively overcomes the challenges posed by weak-texture regions. First, SAOF introduces multi-feature matching cost that fuses color, gradient, and Census features, which preserves strong discriminative ability even in flat or homogeneous rooftop areas with limited local texture. This multi-feature integration also captures pixel intensity differences, local structural cues, and neighborhood self-similarity, enabling the generation of continuous, smooth, and stable optical-flow disparity estimates in weak-texture regions while avoiding holes and noise artifacts. Second, SAOF incorporates semantic information as a global prior to guide planar consistency in weak-texture rooftops, preventing the optical-flow propagation process from being disturbed by local texture absence. These two aspects jointly enhance both the accuracy and robustness of disparity estimation in weak-texture areas. Moreover, semantic information helps alleviate disparity misestimation in irregularly shaped buildings. As shown in Figure 7, the semantic guidance map produced by SAMgeo-Reg not only recognizes weak-texture rooftops as coherent regions but also effectively segments irregularly shaped buildings in the II image, thereby enabling high-precision disparity estimation, whereas other algorithms typically fail to produce accurate results for such irregular buildings.
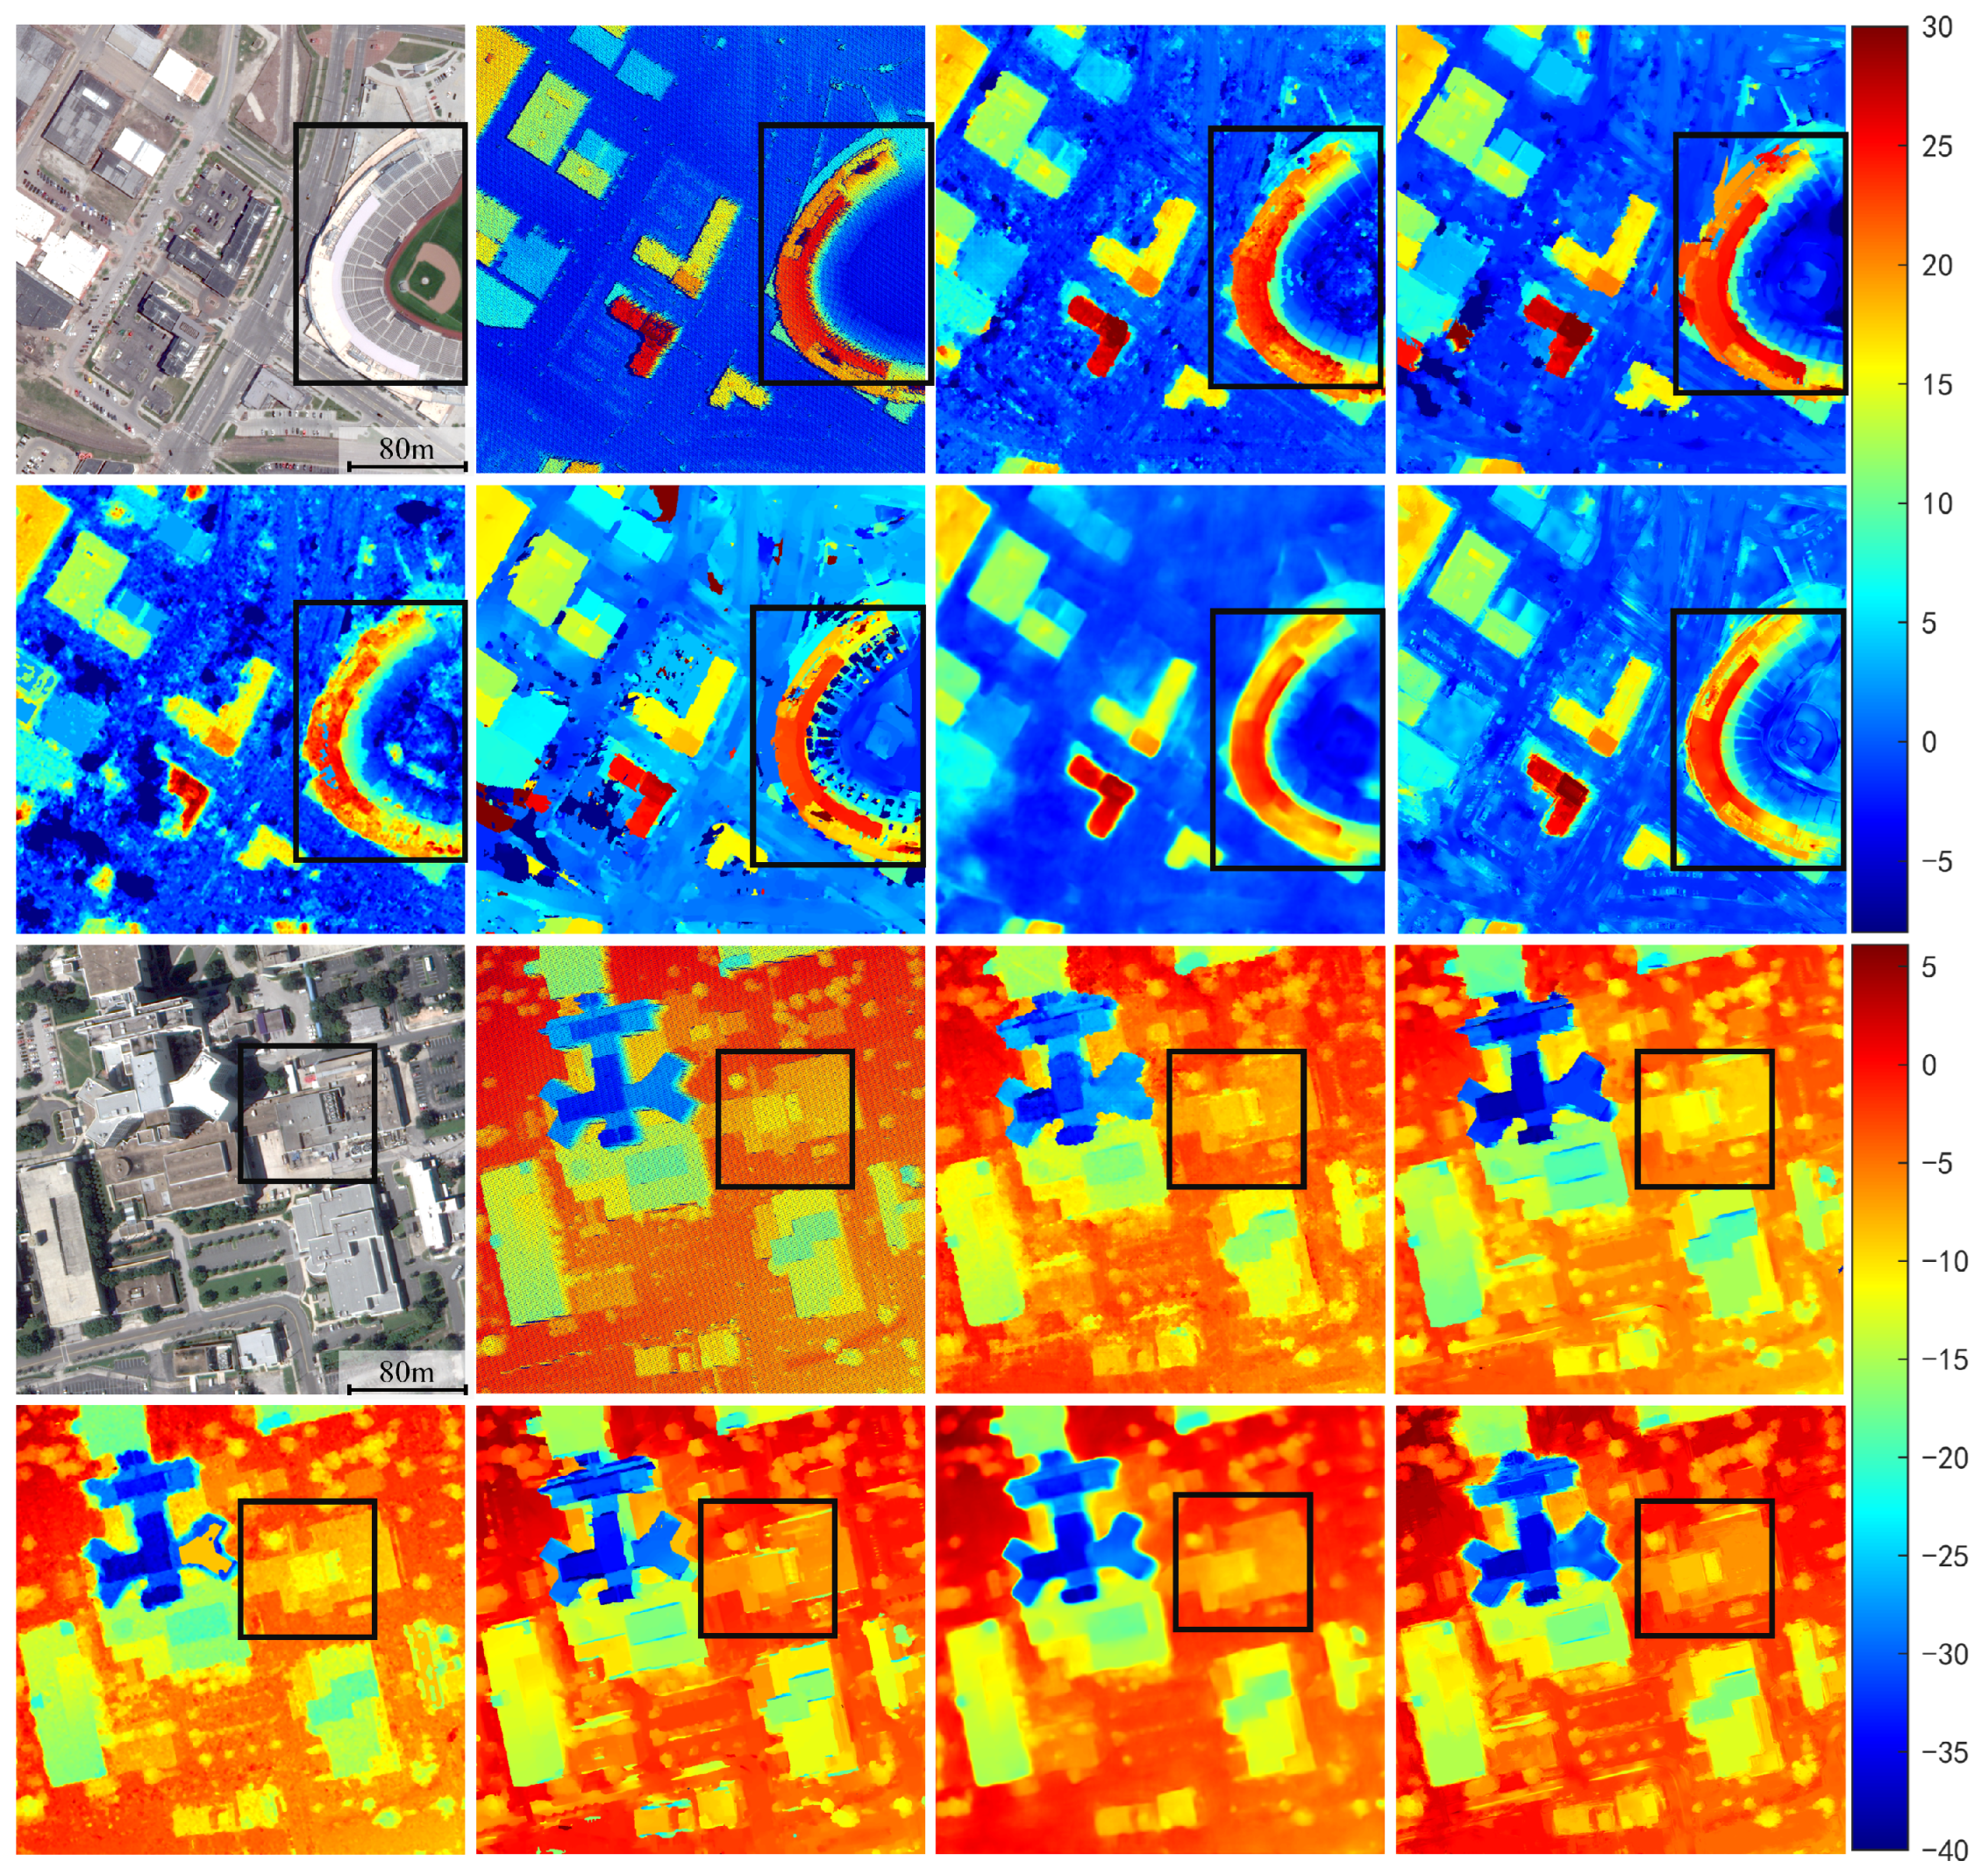
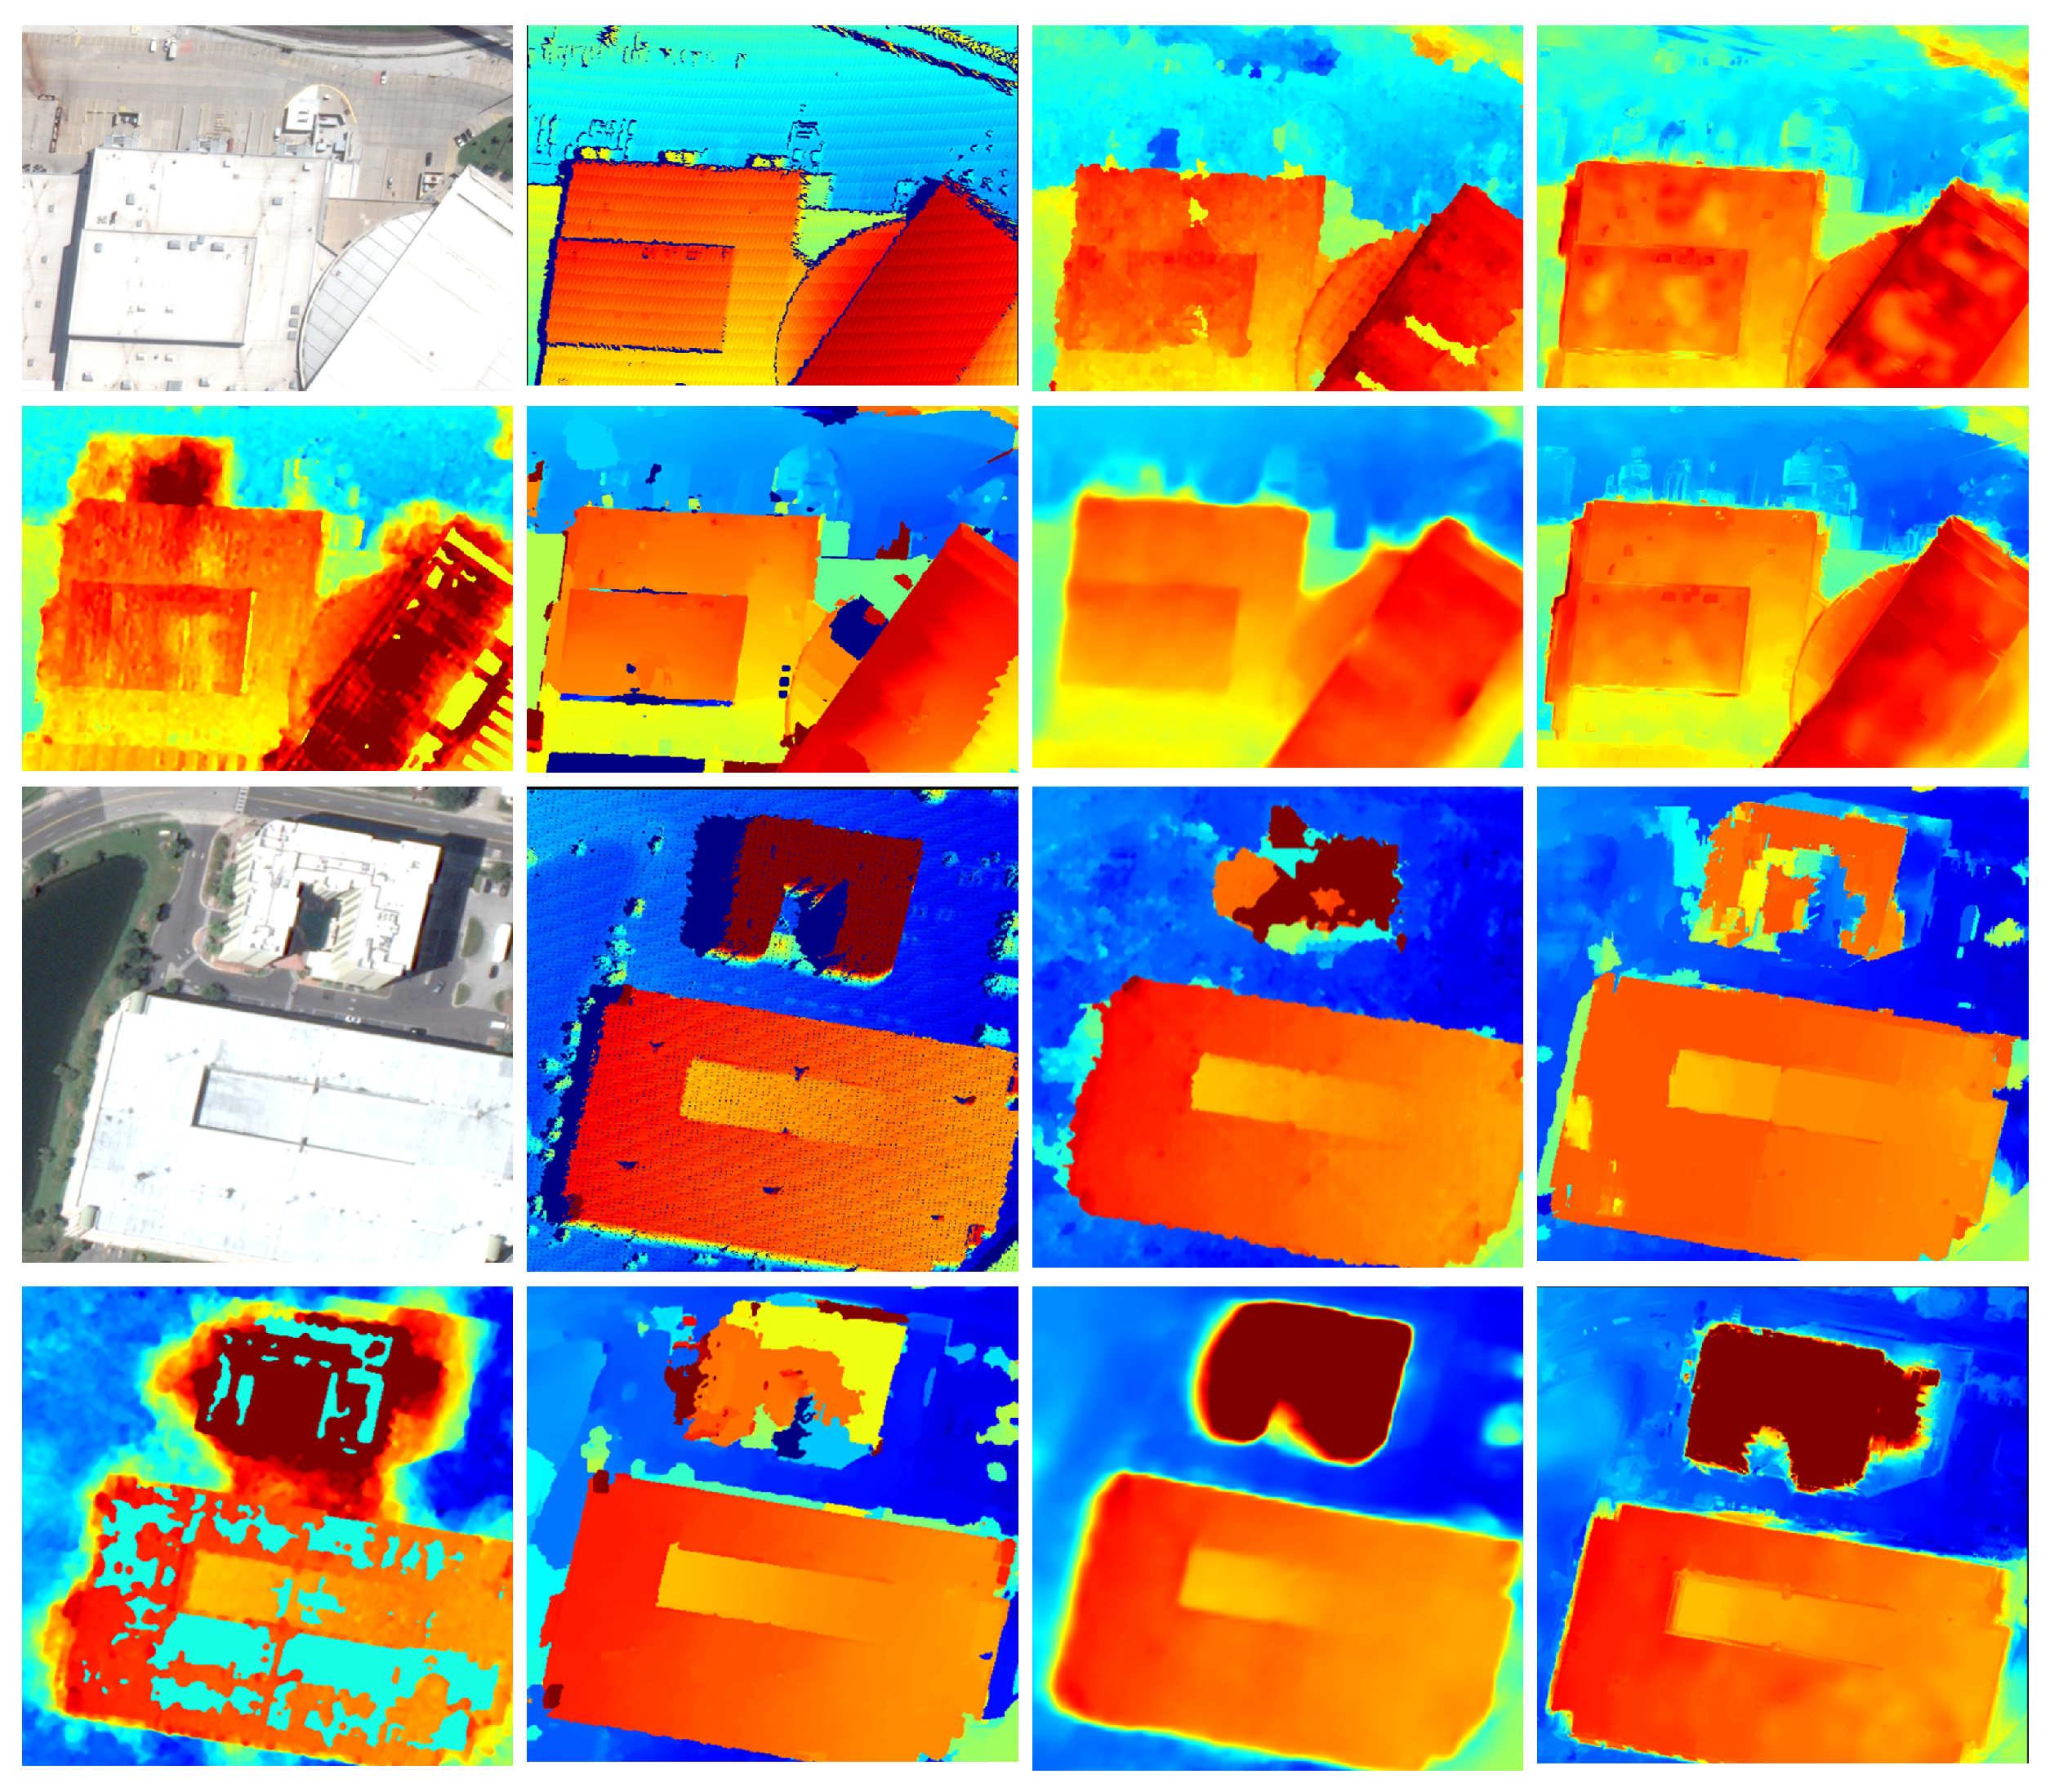
Figure 8 shows the disparity results in regions with structurally complex buildings. As observed in Figure 8, the results of SGM, MGM, and Gefolki exhibit pronounced noise, holes, and blurred edges, with severe loss of details, making it difficult to accurately capture the geometric contours of buildings.ADC performs slightly better in edge preservation than the aforementioned methods; however, its local cost-smoothing assumption is sensitive to disparity discontinuities, and fine details still cannot be accurately estimated. The main limitation of HMSMNet lies in contour and detail representation. Since its spatial attention mechanism favors global consistency during cost aggregation, disparity discontinuities along complex edges are weakened, leading to the loss of detailed information. By contrast, SAOF demonstrates clear advantages in disparity estimation over complex regions: the bilateral weighting introduced into its matching cost effectively preserves edge information, enabling more accurate disparity estimation for building structures and detailed areas; moreover, the incorporation of semantic information reduces noise and holes, ultimately yielding structurally consistent and detail-preserving disparity results.
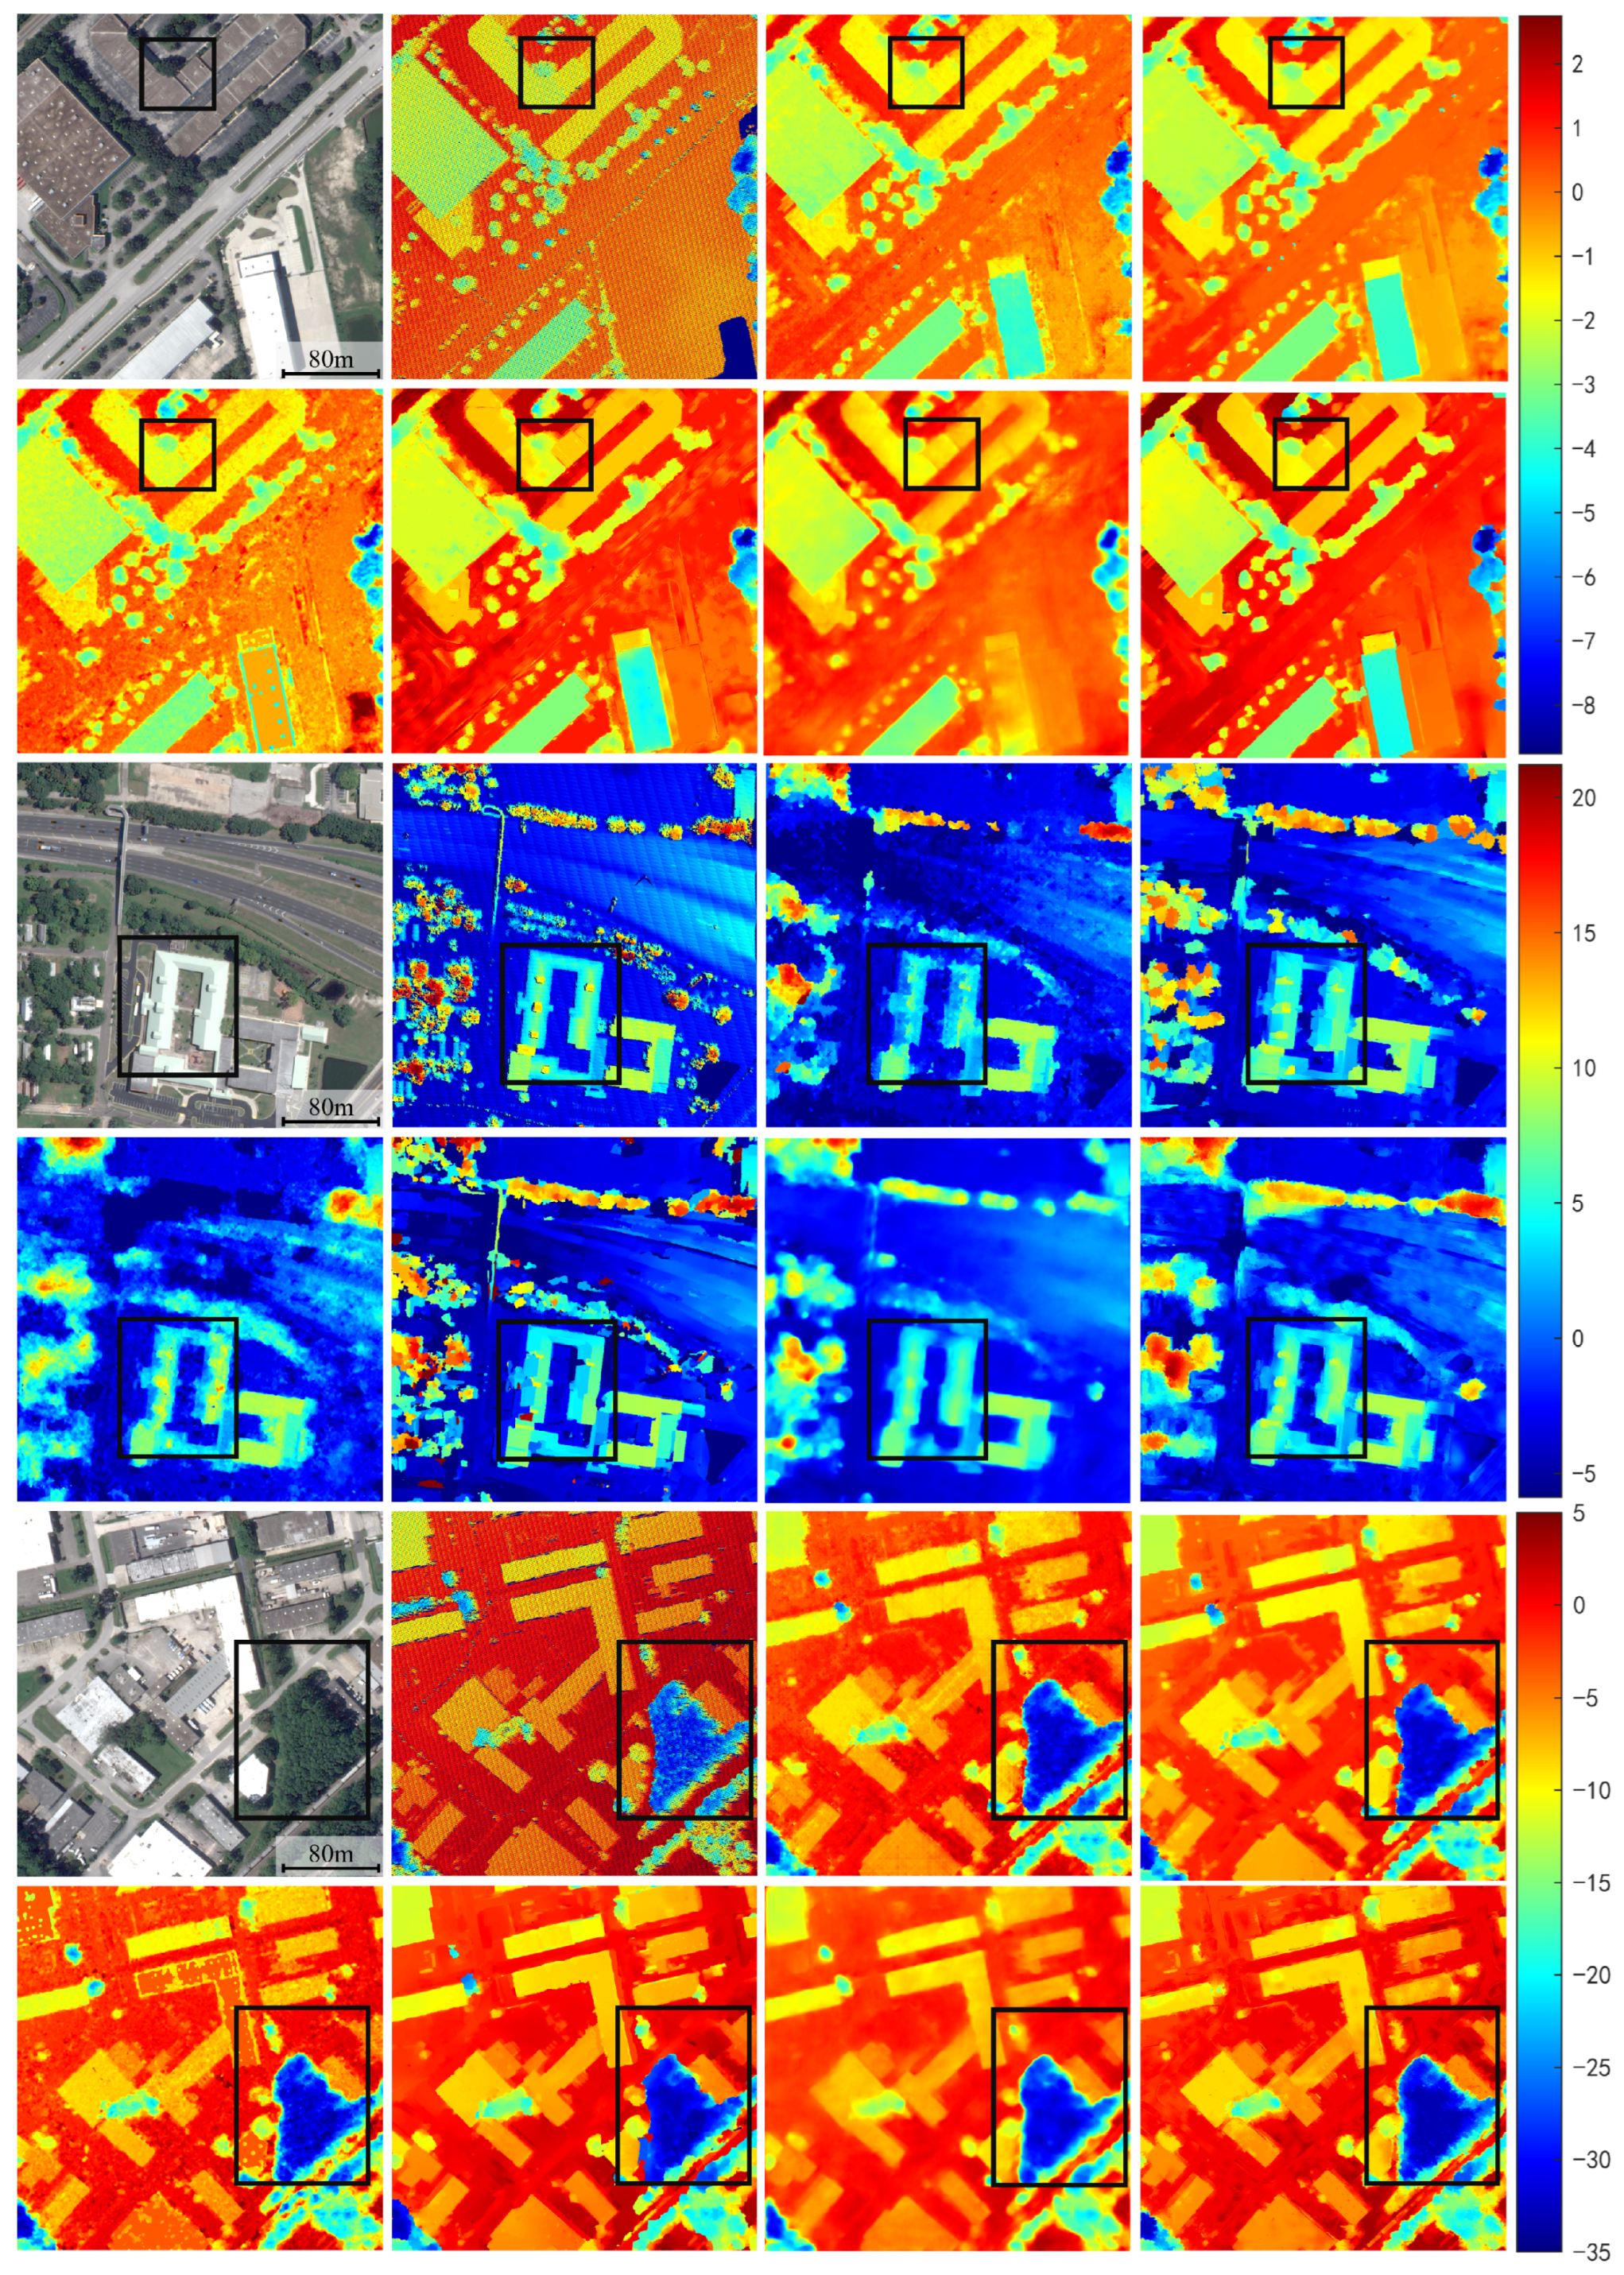
Figure 9 illustrates the disparity results in building–vegetation mixed areas. As shown in Figure 9, SGM and MGM suffer from noise and edge blurring at the boundaries between vegetation and buildings; Gefolki performs poorly in dense vegetation areas, resulting in fragmented local structures and incomplete building contours; ADC is able to better reconstruct building outlines, but disparity errors still occur in regions where vegetation and buildings are adjacent. HMSMNet, due to cross-propagation of heterogeneous features during context modeling and the lack of semantic guidance, produces blurred boundaries between vegetation and building contours. In contrast, SAOF achieves the best performance in such mixed scenarios: it not only effectively suppresses noise and holes in vegetation regions but also preserves clear and complete geometric structures along rooftops and edges. Details such as eaves, corners, and small-scale components are well maintained, and the overall performance is significantly superior to existing methods.

4.2.2. Textureless Regions

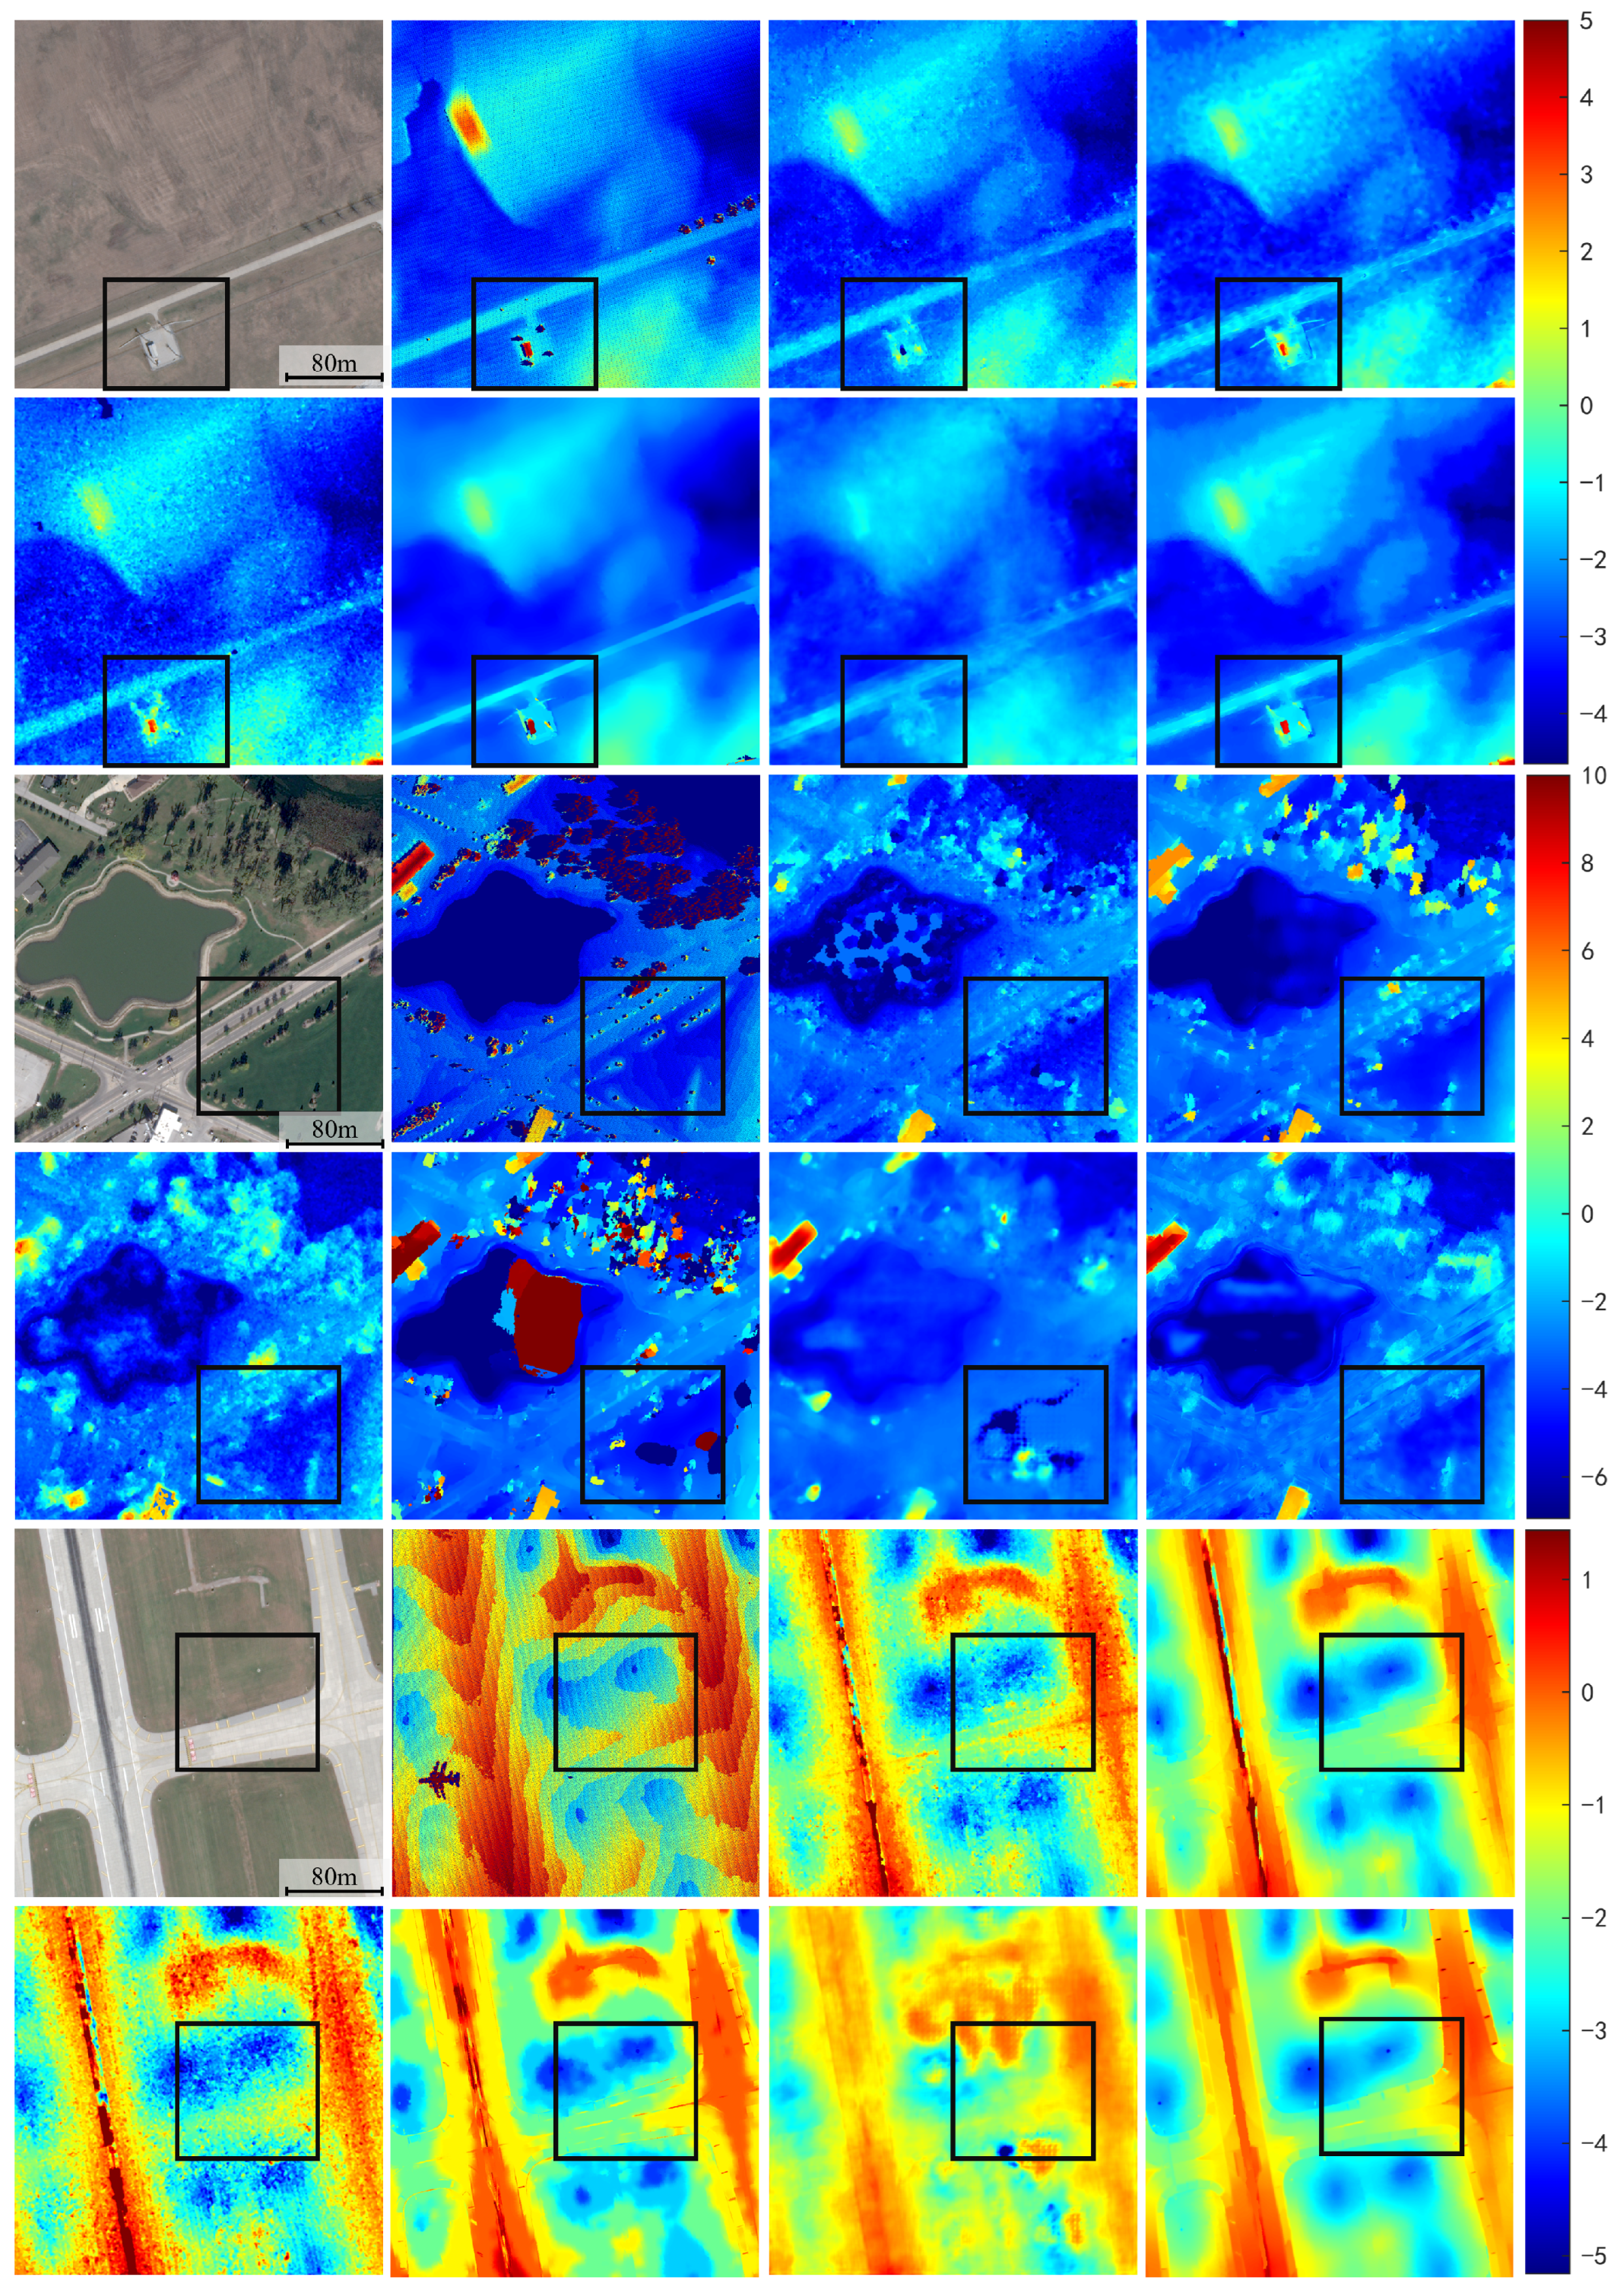
To evaluate the applicability of the SAOF algorithm in textureless regions, we selected typical textureless scenes from the dataset for testing, including areas such as gobi, lakes, and airport runways. The main characteristic of these scenes is the presence of large homogeneous surfaces with minimal pixel intensity variation, making feature distinction difficult and posing greater challenges to the robustness of disparity estimation algorithms.
As shown in Figure 10, the SGM, MGM, and Gefolki algorithms produce significant noise on textureless surfaces; the ADC algorithm still exhibits errors in lake and grassland scenes; and HMSMNet fails in matching for grassland and runway areas. In contrast, the SAOF algorithm generates accurate and complete disparity maps: it can precisely reconstruct disparities of small trees in gobi regions, produce consistent and stable results over water surfaces and flat grasslands, and preserve fine details on airport runways, fully demonstrating its robustness and structural preservation capability in textureless scenarios.

4.2.3. Quantitative Evaluation

We further quantitatively assessed the accuracy of the disparity results using the EPE and D1 metrics. For complex regions with large disparity variations, the threshold for the D1 metric was set to 3 pixels. For textureless regions with smaller overall disparity ranges, the D1 threshold was set to 2 pixels.
The quantitative results are summarized in the Table 4, Table 5, Table 6 and Table 7. From these results and the corresponding disparity map, it is evident that traditional methods (SGM, MGM, Gefolki, ADC) perform suboptimally in both complex and textureless regions. In structurally intricate scenes with large disparities, they often produce edge blurring and lose fine structural details. In textureless areas, they suffer from matching ambiguities and noise; although ADC provides some local improvements, its performance remains unstable. In contrast, HMSMNet consistently outperforms these traditional methods across both scene types. Furthermore, by leveraging multi-level optical flow optimization and semantic guidance, SAOF achieves the best overall accuracy and visual performance, effectively preserving fine details and edge accuracy in complex regions while substantially reducing errors in textureless regions.

5. Discussion

5.1. Ablation Study

In this subsection, we focus on the impact of the scale-adaptive matching window (SAMW), sub-top pyramid re-PatchMatch (STPR), and Semantic-Aware Matching Constraint (SAMC) modules on disparity estimation. To validate the effectiveness of each module under different scenarios, we conducted ablation experiments on the test images presented in Section 4 and calculated the average values of the EPE and D1 metrics. In addition, the average runtime for each module configuration is reported in Table 8 and Table 9, providing a clear view of the computational cost. Because its computation grows linearly with the number of pixels, SAMW introduces only minimal overhead. By contrast, STPR and SAMC add moderate time and memory costs due to multi-scale sub-top pyramid re-PatchMatch operations and semantic feature processing. The combination of STPR and SAMC achieves the highest accuracy but also results in the longest runtime.
From the experimental results in complex regions (Table 8), it can be observed that each module individually contributes to improving the results. The SAMW module alleviates local matching uncertainty to some extent, but the overall improvement remains limited. In contrast, the effects of the STPR and SAMC modules are more pronounced: EPE decreases by 7.21% and 9.51%, respectively, compared with the baseline, while the average D1-3 decreases by 18.23% and 17.83%. In the multi-module experiments, combinations involving the SAMC module consistently outperform those without it, with the STPR+SAMC configuration achieving the best performance. Specifically, the average EPE and D1-3 decrease by 14.8% and 25.9%, respectively, relative to the baseline, further demonstrating that the introduction of STPR and SAMC can effectively handle complex scenes. These findings indicate that in complex scenarios, the joint incorporation of multi-level optimization and semantic-aware constraints can effectively address the challenges of disparity estimation under large disparities and intricate structures.
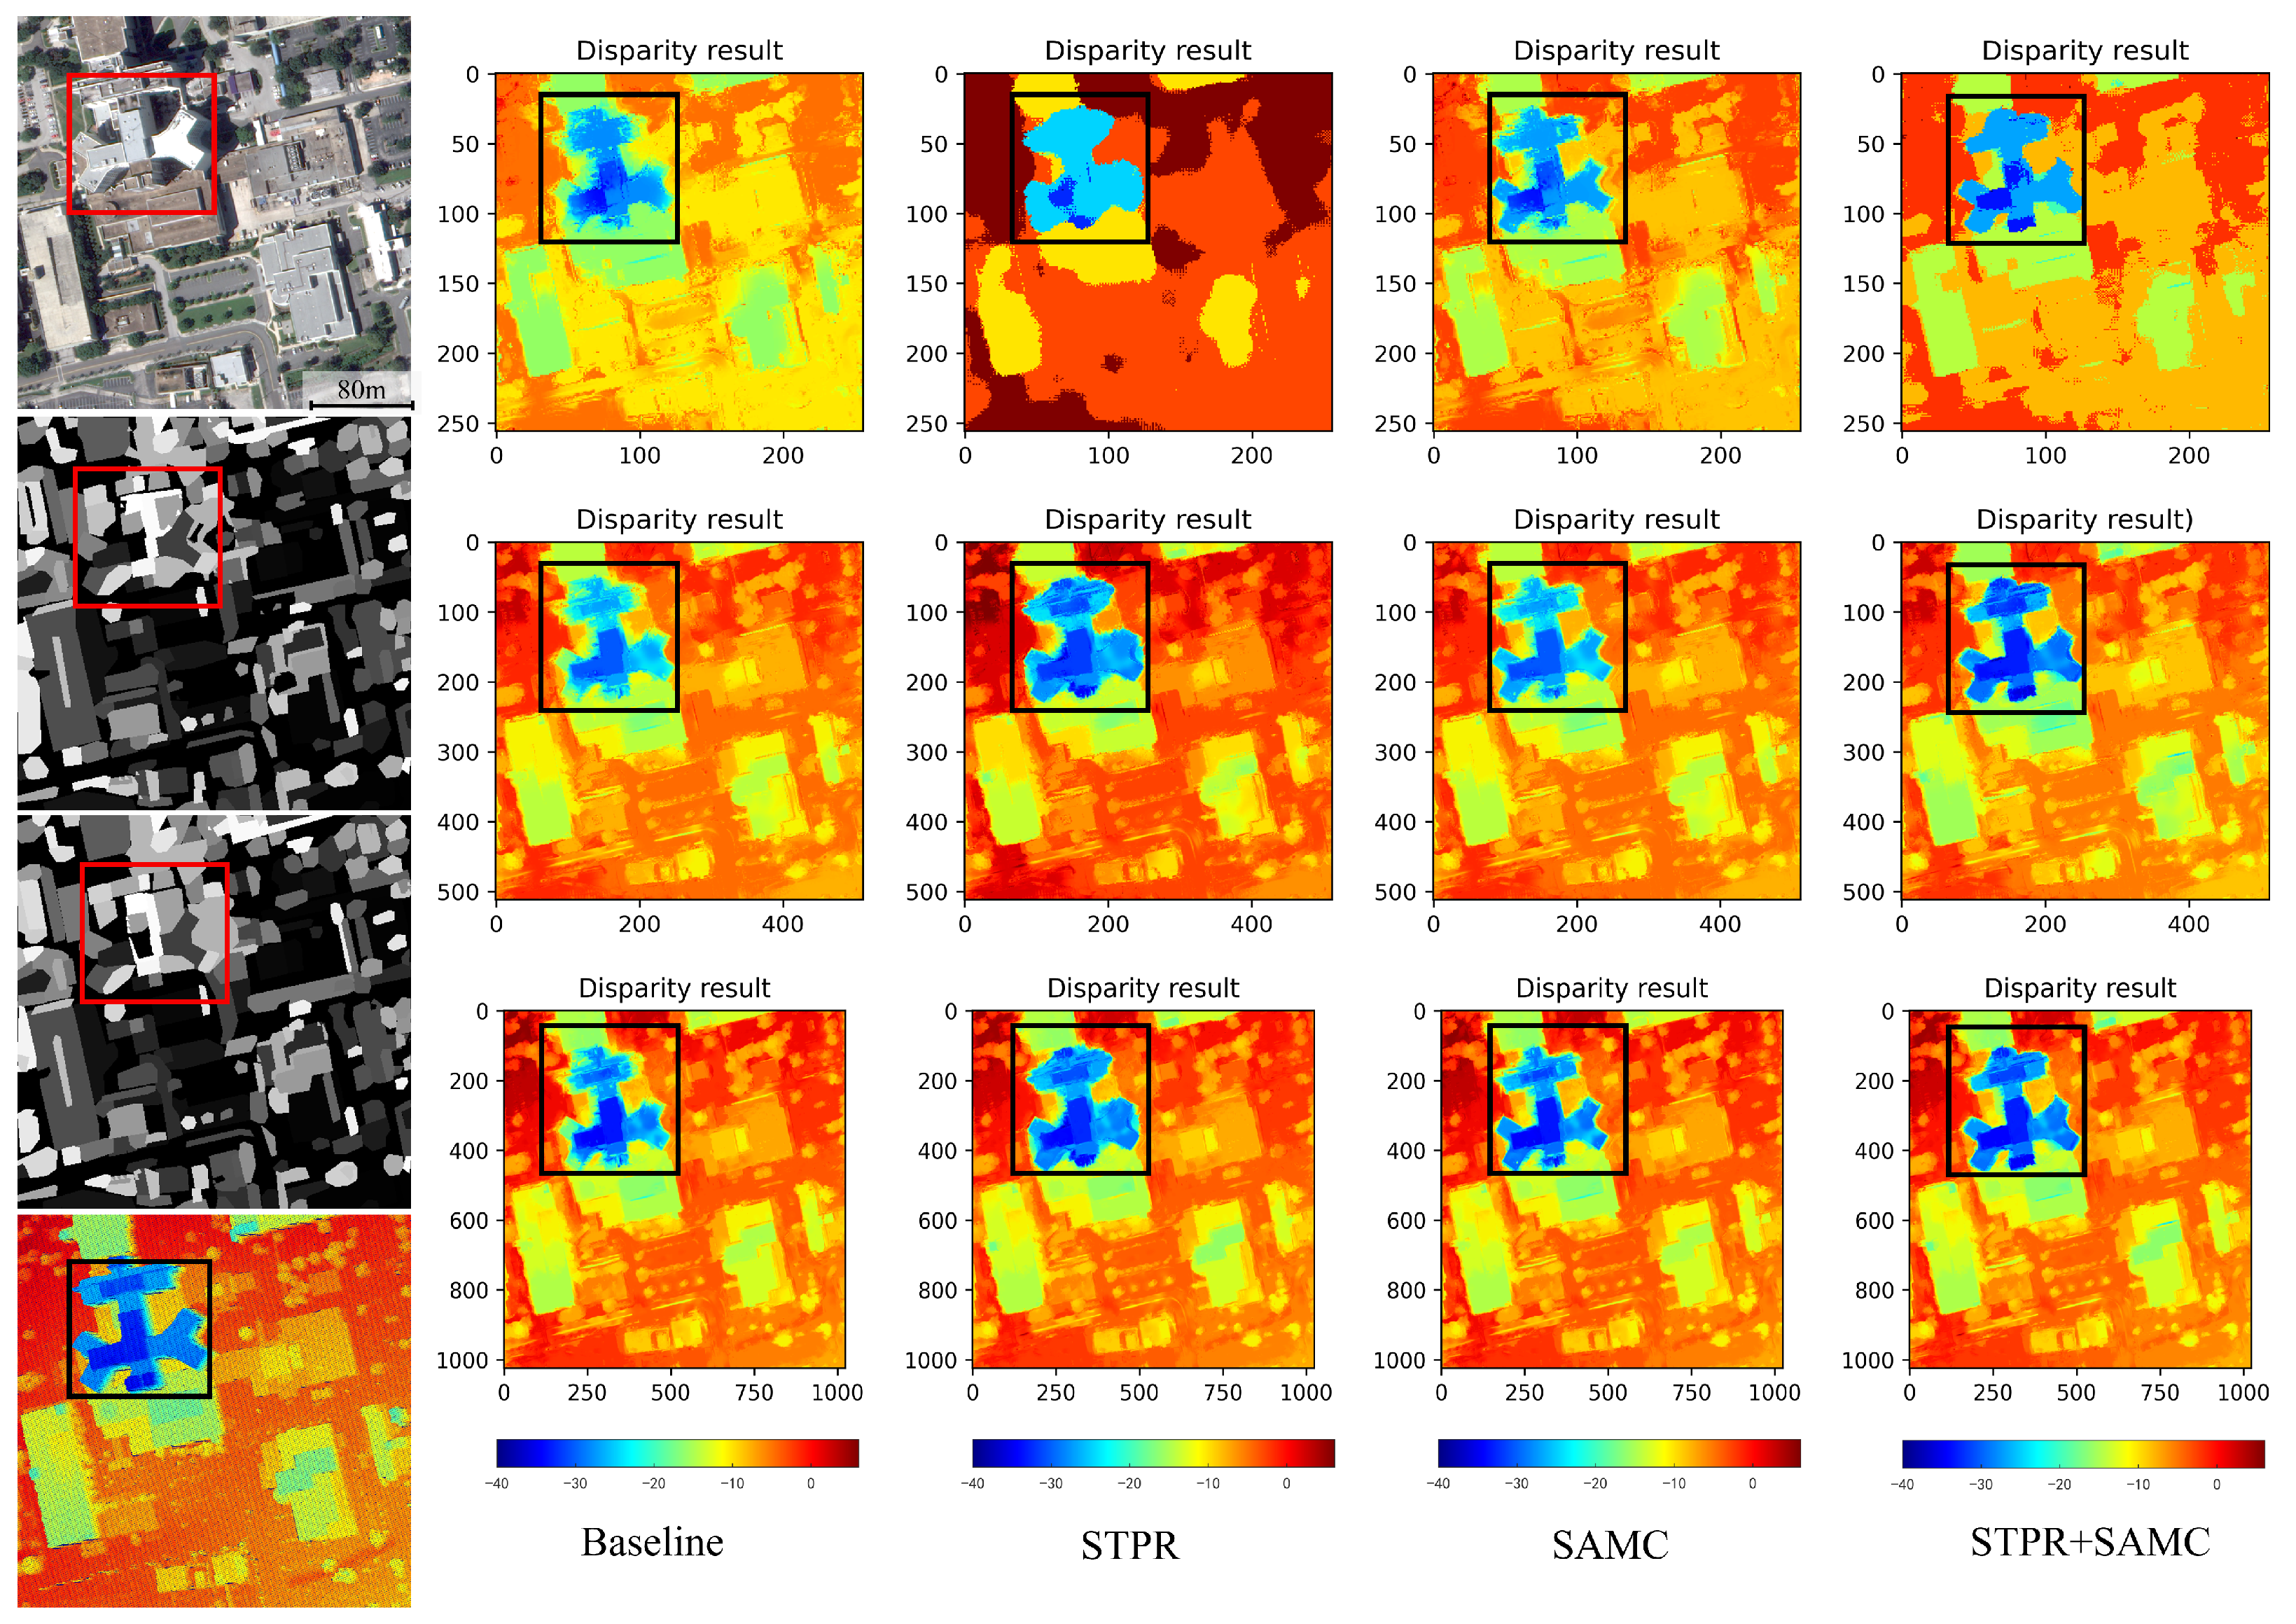
To more intuitively illustrate the roles of the STPR and SAMC modules in large-disparity and structurally complex regions, we take the JAX_068_001_002 image as an example and analyze the optical flow results at each pyramid level. Since the top-level flow only provides a coarse estimate, we focus on the results from the sub-top level down to the original resolution. To maintain consistency with the ground-truth disparity, each level of flow is converted into disparity.
As shown in Figure 11, without any modules, significant errors already appear in the disparity at the sub-top level, and these errors accumulate and amplify during propagation, ultimately leading to substantial deviations at the original resolution. Consequently, the method fails to correctly recover disparity information in large-disparity and complex-structure regions. When the STPR module is applied alone, the second-to-top level achieves relatively accurate estimation in large-disparity regions, but due to the absence of semantic guidance, the representation of edges and fine structures remains insufficient. In contrast, applying only the SAMC module effectively preserves edge and detail information, but its accuracy in large-disparity regions is inadequate. When STPR and SAMC are combined, however, the method not only maintains high accuracy in large-disparity regions but also recovers clear edges and details in complex structures.
In textureless regions (Table 9), the improvements of SAMW and STPR in single-module experiments are relatively limited, indicating that their effectiveness in large homogeneous areas is weaker than in complex regions. In contrast, the SAMC module yields the most notable gain by leveraging semantic priors to impose effective constraints and alleviate matching ambiguities, leading to decreases of 4.81% and 2.03% in the average EPE and D1-2, respectively. Furthermore, multi-module combinations exhibit a consistent trend with that observed in complex regions: configurations incorporating SAMC generally outperform those without it, with STPR+SAMC achieving the best overall results (average EPE and D1-2 reduced by 5.47% and 9.32%). These results demonstrate that the semantic-aware module plays a critical role in textureless scenes, where its structural and regional priors effectively compensate for the lack of texture cues. When combined with the STPR module, it further enhances matching stability in smooth regions.

5.2. Semantic Segmentation Errors and Impact on Disparity Estimation

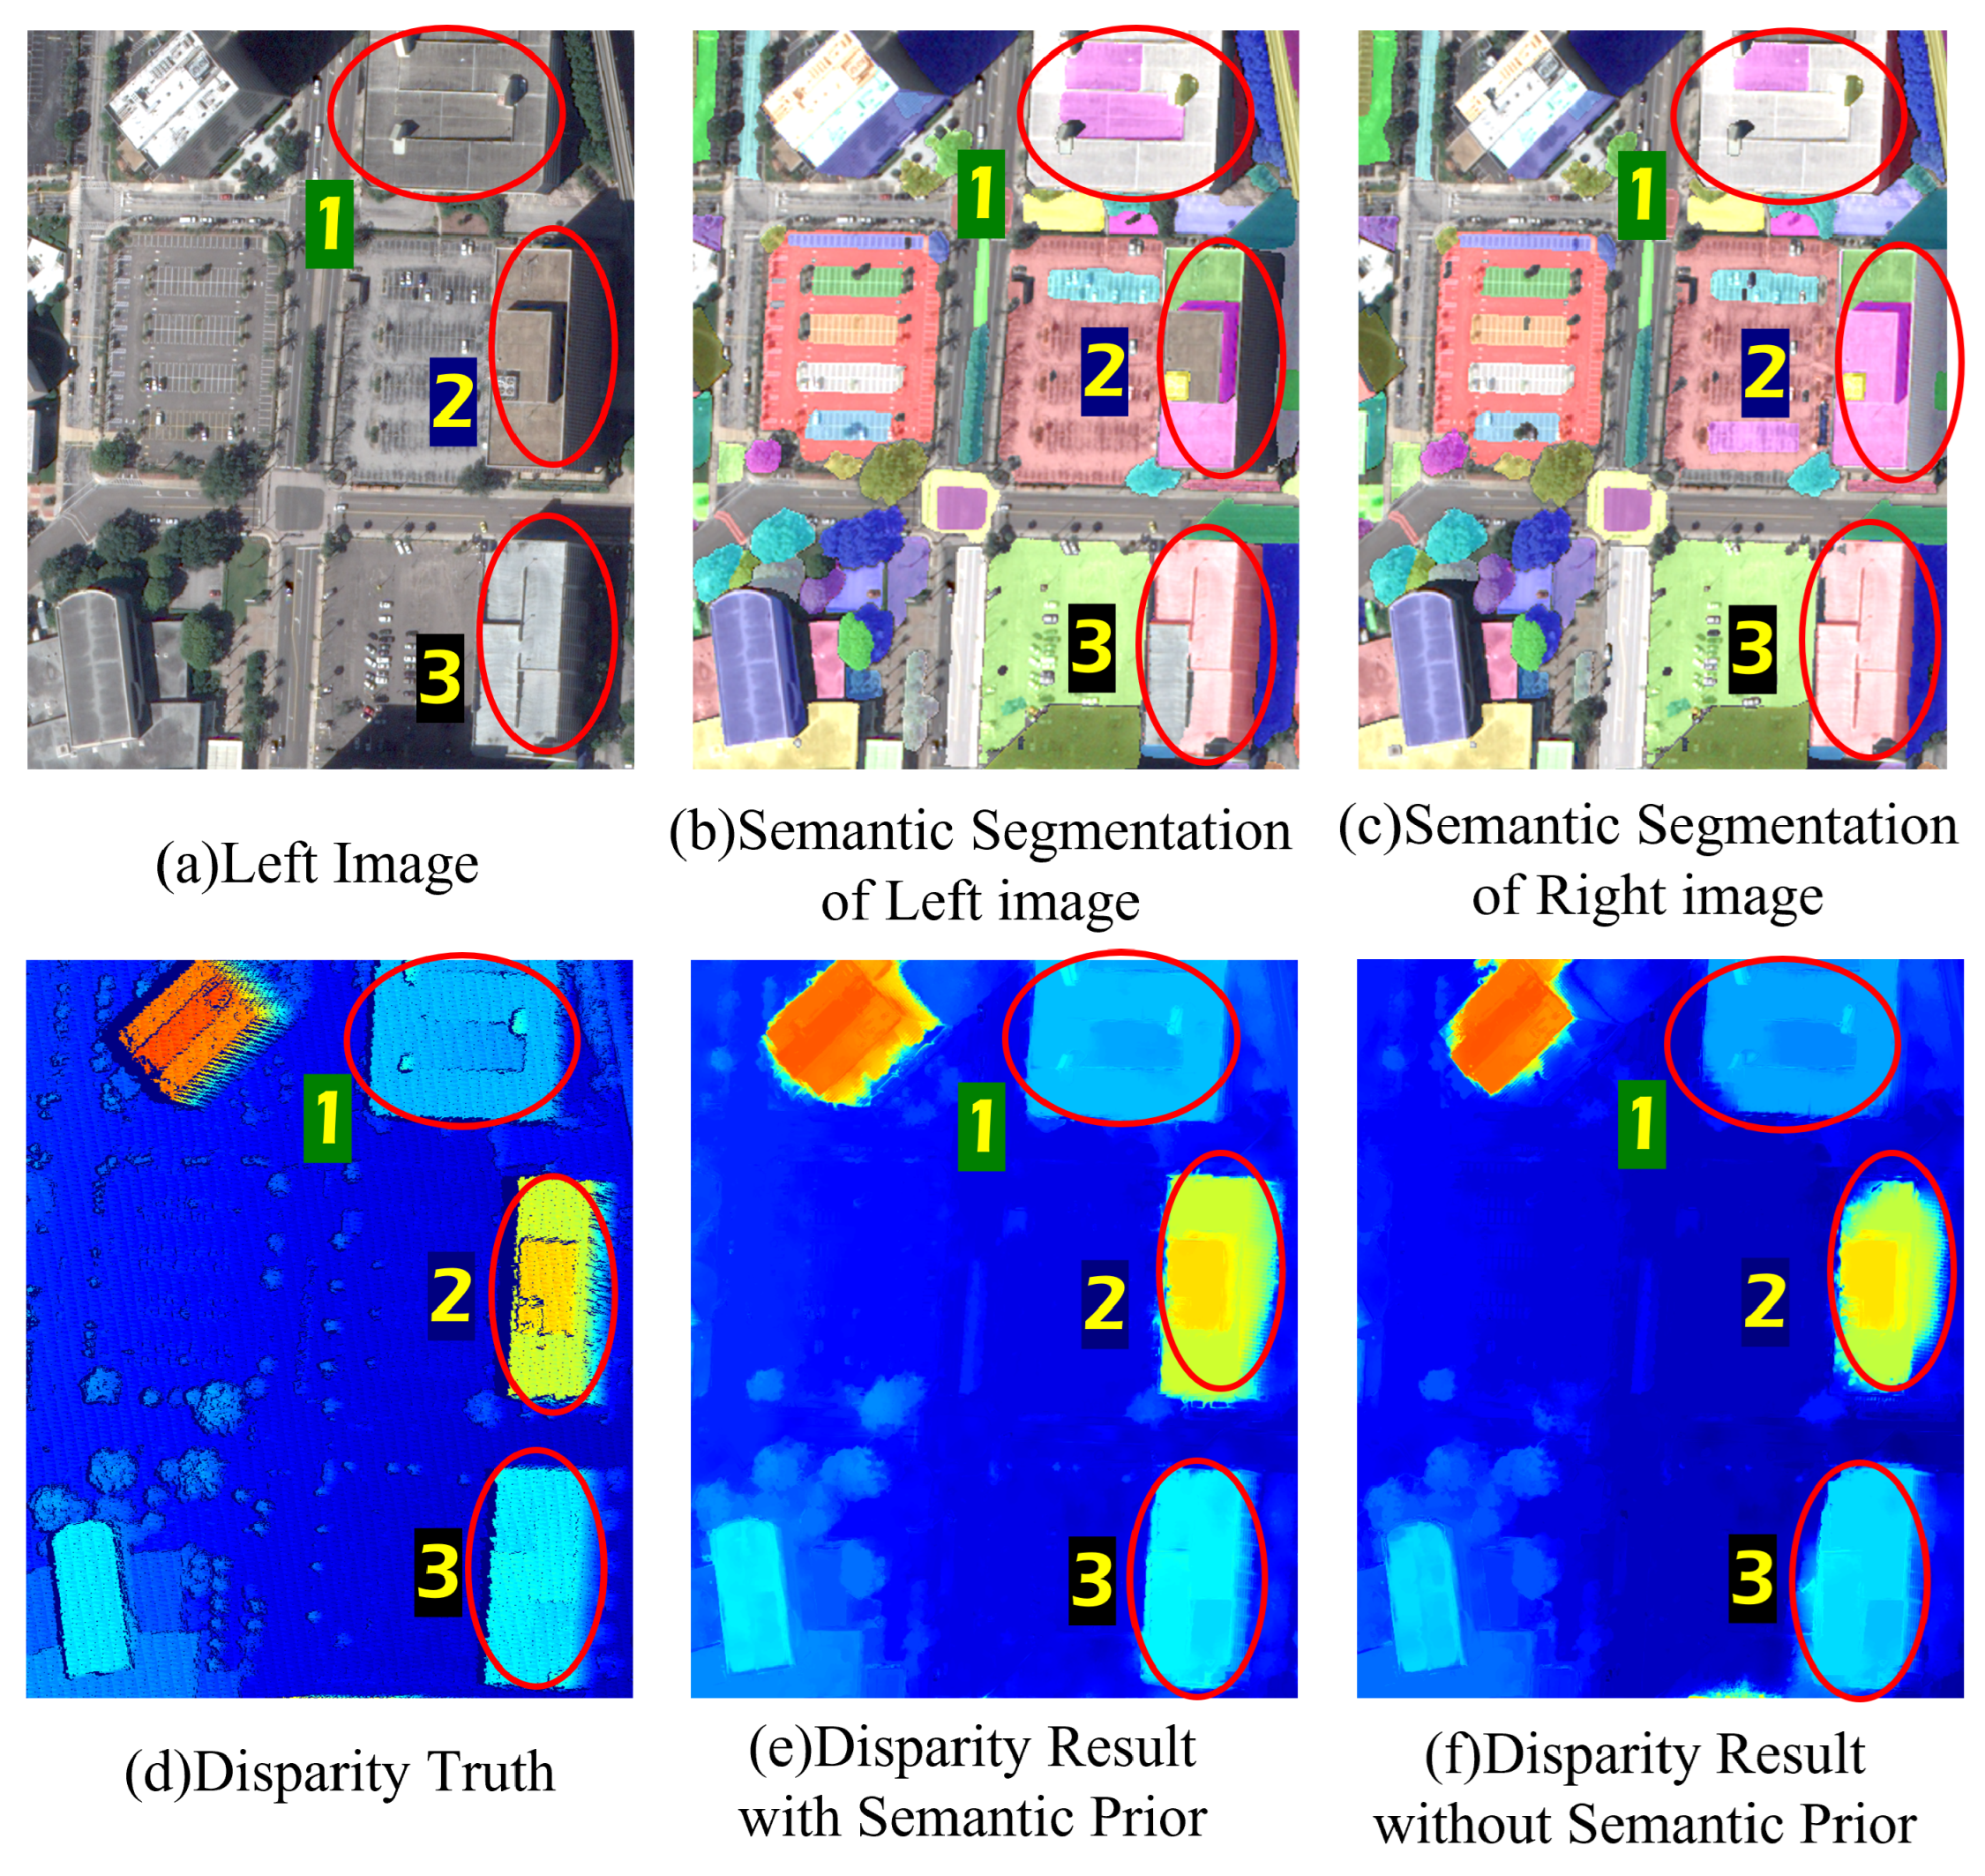
In this subsection, we further analyze the impact of semantic segmentation errors on disparity estimation using three representative regions. As shown in Figure 12b,c, regions 1–3 exhibit varying degrees of misclassifications on roof details. These errors lead to local discontinuities or slight irregularities in the disparity results but do not introduce significant structural errors (as shown in Figure 12e.) Notably, compared with results without semantic priors, the semantic-guided disparity result (as shown in Figure 12e) shows more complete roof structures and clearer boundaries. Furthermore, the shadow areas in regions 2 and 3 are separated into individual semantic instances, which helps mitigate the boundary ambiguity caused by shadows. Overall, while semantic segmentation may introduce minor local errors in the disparity results, these deviations are generally limited and do not lead to major structural failures. Meanwhile, the incorporation of semantic priors enhances the global consistency and structural completeness of the disparity results.

5.3. Disparity Estimation on Large-Coverage Scenes

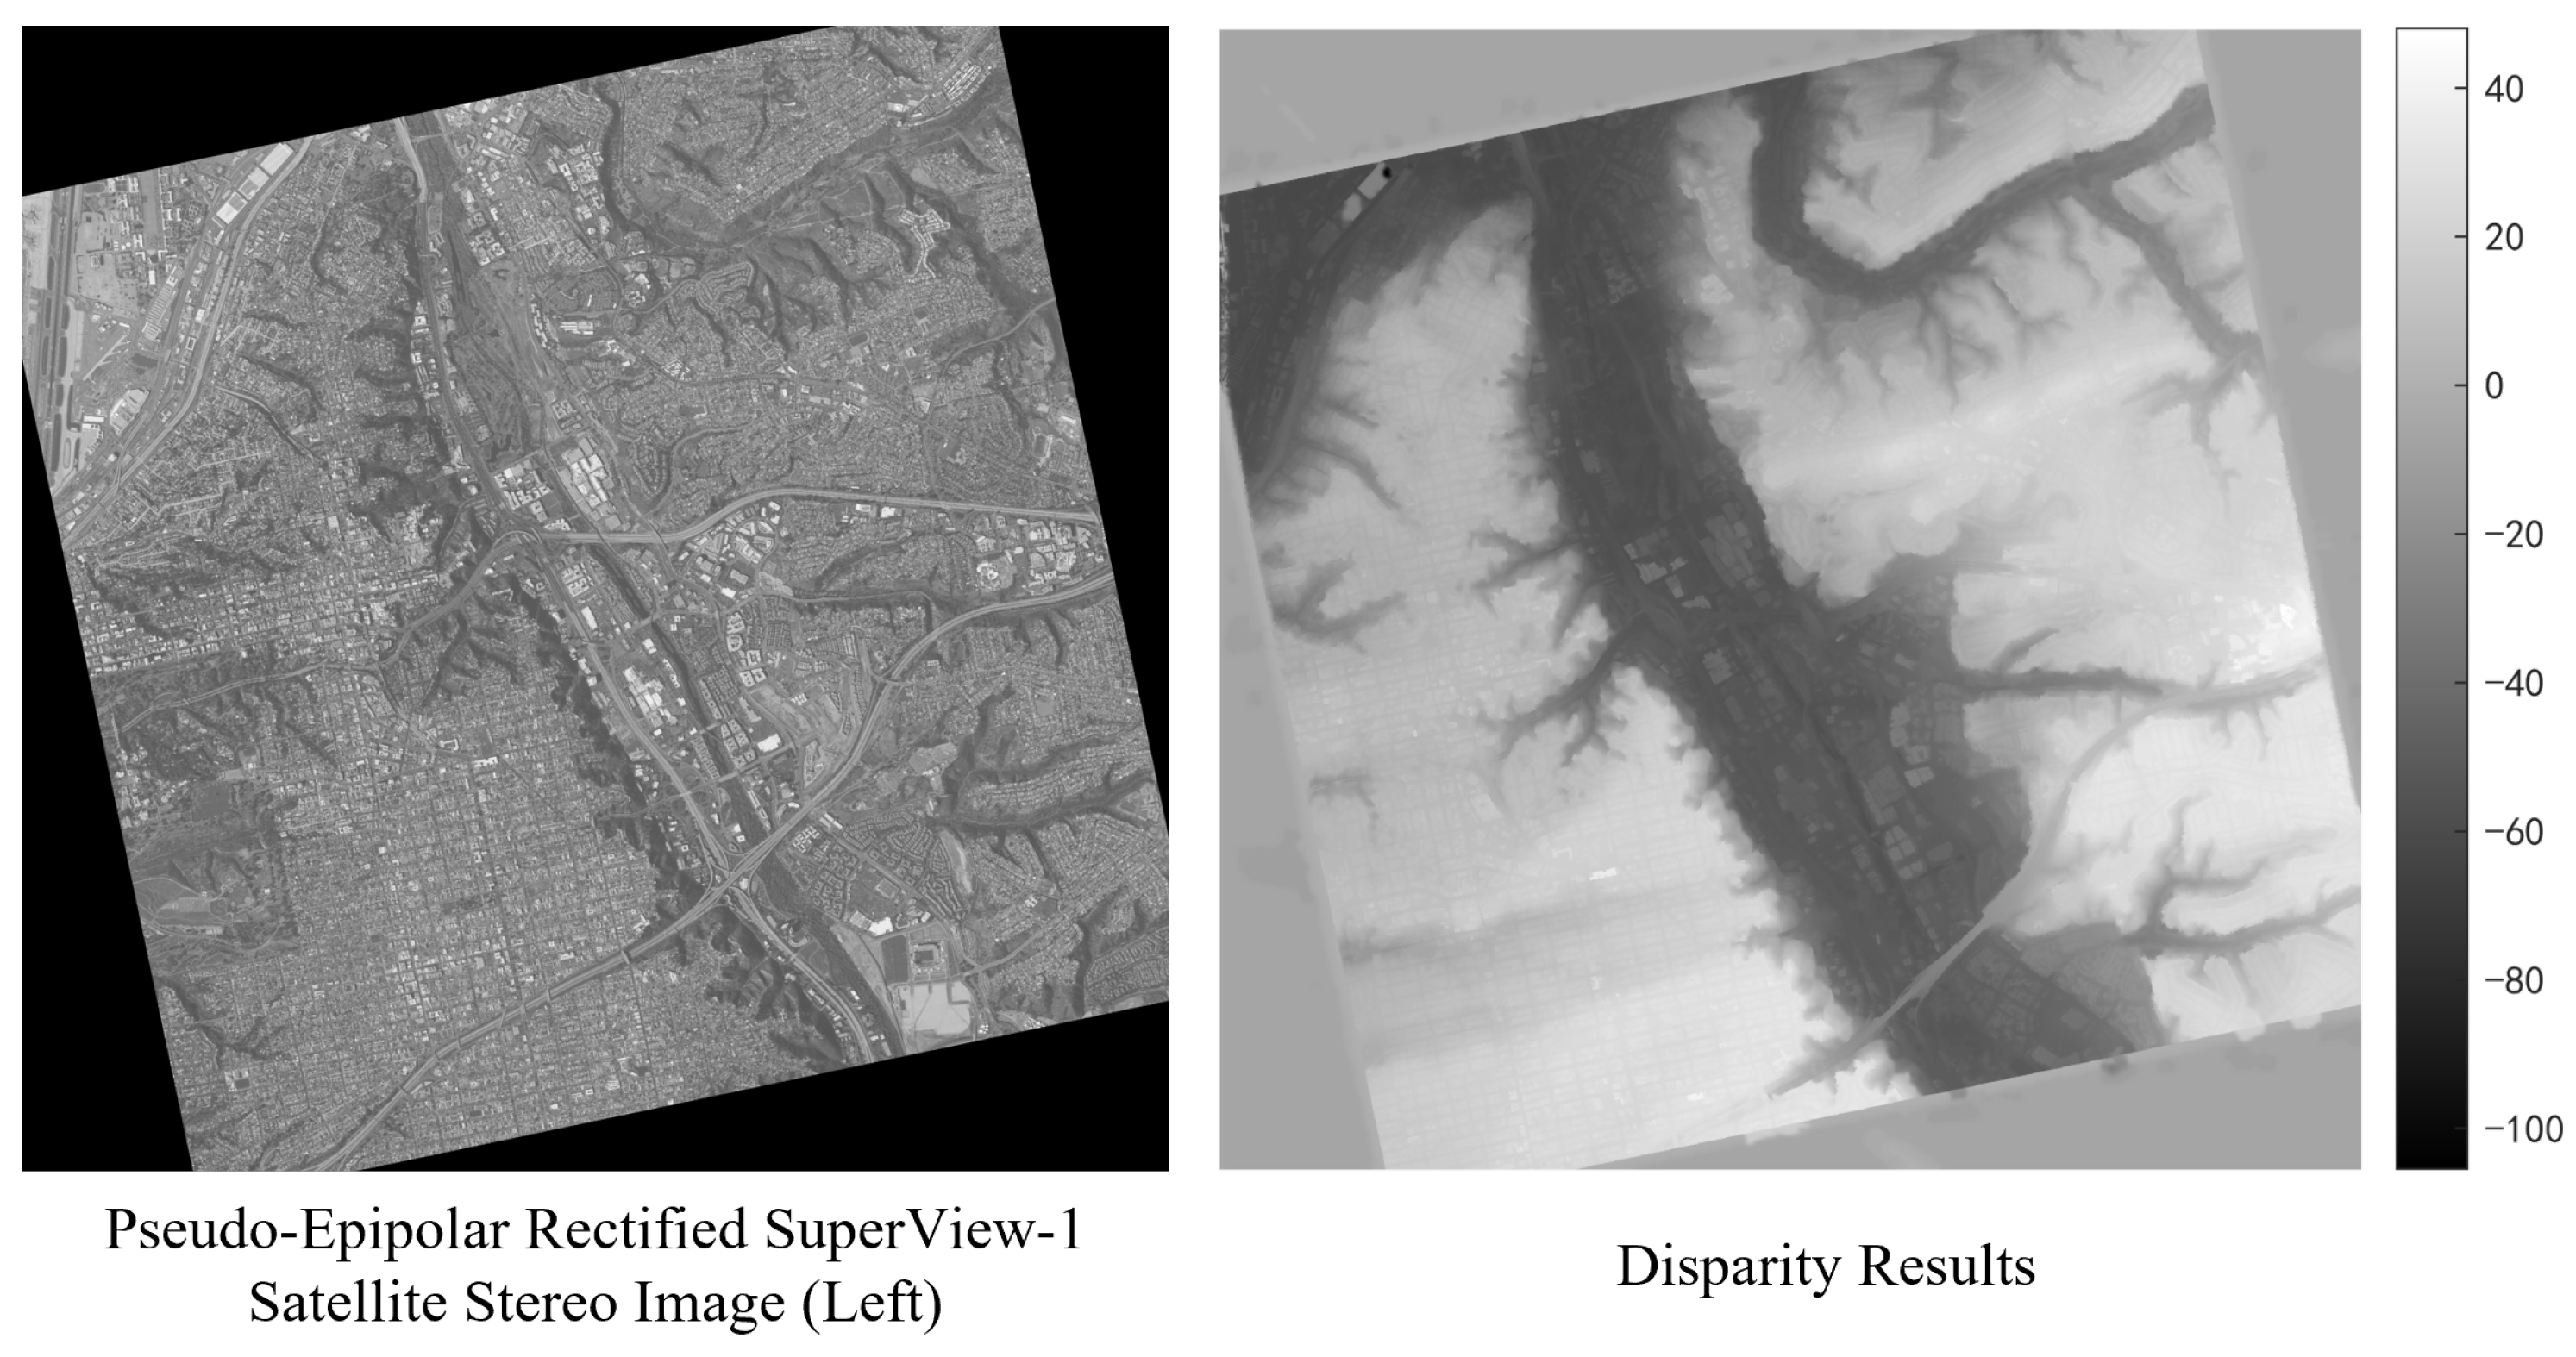
We further applied the proposed SAOF algorithm to large-coverage (8 km × 8 km) SuperView-1 satellite images containing diverse terrain features such as roads, hills, and building clusters. The images were first processed under an approximate epipolar constraint to generate pseudo-epipolar rectified pairs, followed by disparity estimation using the proposed framework. As shown in Figure 13, the resulting disparity maps clearly reflect the depth variations across different land-cover types and capture fine local structural details. These results demonstrate the effectiveness and applicability of the SAOF algorithm in complex, large-scale satellite scenes. It should be noted that, due to the absence of high-accuracy ground-truth disparity data, the evaluation is primarily qualitative.

6. Limitations and Future Work

Although SAOF demonstrates strong performance across multiple scenarios, there remain aspects that require further refinement. Firstly, the test data in this study predominantly originate from WorldView-3 satellite imagery, representing a relatively limited data source. Future work will incorporate a broader range of optical satellite data under diverse imaging conditions to further enhance the robustness of the algorithm.
Second, semantic segmentation may produce errors, which can in turn affect disparity estimation. In future work, we plan to integrate imaging parameters and introduce physically constrained priors. In addition, we will explore the separability of foreground objects (e.g., buildings and vegetation) and background objects (e.g., roads and rivers) at the feature level. By leveraging semantic disentanglement mechanisms, the model’s ability to capture critical structural details and improve segmentation accuracy can be further enhanced.
Finally, in the disparity search process, future work will focus on constraining search ranges based on target semantics. Adaptive adjustment of search ranges will further help reduce redundant computations and improve the algorithm’s efficiency and speed.

7. Conclusions

In this study, we propose a semantic-aware optical flow framework (SAOF) to address the key challenges in high-resolution satellite stereo imagery, including large disparities, weak textures, and complex structures. SAOF combines the sub-pixel precision of optical flow with a semantic prior that enforces regional consistency, effectively improving the robustness and structural integrity of disparity estimation while preserving fine details. Experiments on the US3D dataset show that SAOF consistently outperforms both classical methods and deep learning network. The ablation study further confirms the effectiveness and complementarity of its core modules. More importantly, by combining disparity results with the RPCs of the satellite imagery, the information in the disparity map can be converted into real-world 3D coordinates. Therefore, high-quality disparity estimation is fundamental for DSMs generation and 3D city modeling. SAOF achieves significant accuracy and robustness improvements in weak-texture and structurally complex scenes. The resulting high-quality disparities can support reliable DSMs reconstruction and detailed 3D modeling, and they further facilitate large-scale satellite mapping and related remote sensing applications.

Author Contributions

Conceptualization, D.W.; methodology, D.W.; software, D.W.; validation, D.W.; formal analysis, D.W.; investigation, D.W.; resources, D.W.; data curation, D.W., Y.X. and E.Z.; writing—original draft preparation, D.W.; writing—review and editing, D.W. and J.C.; supervision, N.J. and J.Z.; project administration, F.W. and H.Y.; funding acquisition, F.W., N.J. and H.Y. All authors have read and agreed to the published version of the manuscript.

Funding

This research received no external funding.

Data Availability Statement

In this study, the US3D dataset can be obtained from https://ieee-dataport.org/open-access/data-fusion-contest-2019-dfc2019 (accessed on 1 September 2025). The source code is available at https://github.com/PacificRobot/SAOF (accessed on 1 September 2025).

Conflicts of Interest

The authors declare no conflicts of interest.

Appendix A. Detailed Derivations of Multi-Feature Matching Cost

Appendix A.1. Color Cost dcol

The color cost measures the matching consistency based on pixel color differences. For a pixel pair ( p , q ) and a relative offset Δ within the matching window, the color cost is defined as Equation (A1):
d c o l p , q , Δ = max I R G B A ( p + Δ ) I R G B B ( q + Δ )
where I A and I B denote the RGB color vectors in the reference and target images, respectively.

Appendix A.2. Gradient Cost dgrad

The gradient cost measures the matching consistency based on gradient magnitude differences. The horizontal and vertical gradients are computed using central difference filters (Equation (A2)):
I g h ( i , j ) = k = m m ξ k I ( i , j + k ) , I g v ( i , j ) = k = m m ξ k I ( i + k , j )
The overall gradient magnitude is then given by Equation (A3):
I g ( i , j ) = I g h ( i , j ) 2 + I g v ( i , j ) 2 , ξ k = ξ k
Finally, the gradient cost is expressed as Equation (A4):
d g r a d ( p , q , Δ ) = I g A ( p + Δ ) I g B ( q + Δ )

Appendix A.3. Census Cost dcen

The Census cost reduces mismatches caused by illumination variations. Let I c e n A and I c e n B be the Census-transformed images. The cost is defined in Equation (A5):
d c e n ( p , q , Δ ) = I c e n A I c e n B
where ⊕ denotes the XOR operation applied to the binarized Census codes.

Appendix A.4. Bilateral Weighting

The bilateral weight ω b i l is defined as Equation (A6):
ω b i l ( p , q , Δ ) = exp Δ 2 2 σ s 2 exp I A ( p + Δ ) I A ( p ) 2 2 σ r 2 exp I B ( q + Δ ) I B ( q ) 2 2 σ r 2
where σ s and σ r are the spatial and color Gaussian parameters, respectively.

Appendix B. Pseudo-Code of the Self-Similarity Propagation Based on Scale-Adaptive Matching Window

This appendix provides the detailed pseudo-code of the proposed self-similarity propagation algorithm based on scale-adaptive matching window. Within each adaptive window, n candidate pixels are randomly sampled along the horizontal neighborhood of the epipolar line and combined with a forward–backward scanning strategy to refine disparities. The correspondence search is strictly constrained to the horizontal epipolar direction.
Algorithm A1 Self-Similarity Propagation Algorithm Based on Scale-Adaptive Matching Window
Input: 
High-resolution satellite stereo images A and B, initial disparity vector, initial matching cost, initial window size R 0
Output: 
Refined disparity vector and refined matching cost
1:
Compute adaptive window size R based on Equation (5)
2:
for each pixel p in image A (raster-scan order) do
3:
      Randomly select n candidate pixels along the epipolar line
4:
      Calculate the matching cost for candidate pixels
5:
      Update disparity and matching cost using the lowest-cost candidate
6:
end for
7:
for each pixel p in image A (reverse raster-scan order) do
8:
      Randomly select n candidate pixels along the epipolar line
9:
      Calculate the matching cost for candidate pixels
10:
    Update disparity and matching cost using the lowest-cost candidate
11:
end for
12:
return refined disparity vector and matching cost for all pixels

Appendix C. Enlarged Details of Experimental Results

In this Appendix, we provide enlarged details of all experimental results presented in the main text. All figures are organized corresponding to the original results in the main text.
Figure A1. Enlarged Details results in weak-texture urban building regions. From left to right: original image, ground truth, SGM, MGM, Gefolki, ADC, HMSMNet, and SAOF. Image index: I, II.
Remotesensing 17 04017 g0a1
Figure A2. Enlarged Details in complex building regions. From left to right: original image, ground truth, SGM, MGM, Gefolki, ADC, HMSMNet, SAOF. Image index: III, IV.
Remotesensing 17 04017 g0a2
Figure A3. Enlarged Details in building–vegetation mixed regions. From left to right: original image, ground truth, SGM, MGM, Gefolki, ADC, HMSMNet, SAOF. Image index: V, VI, VII.
Remotesensing 17 04017 g0a3
Figure A4. Enlarged Details in textureless regions. From left to right: original image, ground truth, SGM, MGM, Gefolki, ADC, HMSMNet, SAOF. Image index: VIII, IX, X.
Remotesensing 17 04017 g0a4

References

  1. Zhao, Q.; Yu, L.; Du, Z.; Peng, D.; Hao, P.; Zhang, Y.; Gong, P. An Overview of the Applications of Earth Observation Satellite Data: Impacts and Future Trends. Remote Sens. 2022, 14, 1863. [Google Scholar] [CrossRef] [Scilit]
  2. Chen, P.; Huang, H.; Liu, J.; Wang, J.; Liu, C.; Zhang, N.; Su, M.; Zhang, D. Leveraging Chinese GaoFen-7 imagery for high-resolution building height estimation in multiple cities. Remote Sens. Environ. 2023, 298, 113802. [Google Scholar] [CrossRef] [Scilit]
  3. Michel, J.; Sarrazin, E.; Youssefi, D.; Cournet, M.; Buffe, F.; Delvit, J.M.; Emilien, A.; Bosman, J.; Melet, O.; L’Helguen, C. A New Satellite Imagery Stereo Pipeline Designed for Scalability, Robustness and Performance. ISPRS Ann. Photogramm. Remote Sens. Spat. Inf. Sci. 2020, V-2-2020, 171–178. [Google Scholar] [CrossRef] [Scilit]
  4. Scharstein, D.; Szeliski, R. A taxonomy and evaluation of dense two-frame stereo correspondence algorithms. Int. J. Comput. Vis. 2002, 47, 7–42. [Google Scholar] [CrossRef] [Scilit]
  5. Banks, J.; Bennamoun, M. Reliability analysis of the rank transform for stereo matching. IEEE Trans. Syst. Man Cybern. Part B (Cybern.) 2001, 31, 870–880. [Google Scholar] [CrossRef] [PubMed]
  6. Hirschmuller, H.; Scharstein, D. Evaluation of Stereo Matching Costs on Images with Radiometric Differences. IEEE Trans. Pattern Anal. Mach. Intell. 2009, 31, 1582–1599. [Google Scholar] [CrossRef] [Scilit] [PubMed]
  7. Tatar, N.; Arefi, H. Evaluation of Selected Cost Aggregation Methods on High Resolution Satellite Stereo Images. Int. Arch. Photogramm. Remote Sens. Spat. Inf. Sci. 2019, XLII-4/W18, 1045–1050. [Google Scholar] [CrossRef] [Scilit]
  8. Wei, K.; Huang, X.; Li, H. Stereo Matching Method for Remote Sensing Images Based on Attention and Scale Fusion. Remote Sens. 2024, 16, 387. [Google Scholar] [CrossRef] [Scilit]
  9. Liu, P.; King, I.; Lyu, M.R.; Xu, J. Flow2Stereo: Effective Self-Supervised Learning of Optical Flow and Stereo Matching. In Proceedings of the 2020 IEEE/CVF Conference on Computer Vision and Pattern Recognition (CVPR), Seattle, WA, USA, 14–19 June 2020; pp. 6647–6656. [Google Scholar] [CrossRef] [Scilit]
  10. Xu, H.; Zhang, J.; Cai, J.; Rezatofighi, H.; Yu, F.; Tao, D.; Geiger, A. Unifying Flow, Stereo and Depth Estimation. IEEE Trans. Pattern Anal. Mach. Intell. 2023, 45, 13941–13958. [Google Scholar] [CrossRef] [Scilit]
  11. Yuan, W.; Ran, W.; Adriano, B.; Shibasaki, R.; Koshimura, S. The Performance of the Optical Flow Field based Dense Image Matching for UAV Imagery. ISPRS Ann. Photogramm. Remote Sens. Spat. Inf. Sci. 2024, X-4-2024, 433–440. [Google Scholar] [CrossRef] [Scilit]
  12. Yuan, W.; Yuan, X.; Xu, S.; Gong, J.; Shibasaki, R. Dense Image-Matching via Optical Flow Field Estimation and Fast-Guided Filter Refinement. Remote Sens. 2019, 11, 2410. [Google Scholar] [CrossRef] [Scilit]
  13. Wang, M.; Hu, F.; Li, J. Epipolar resampling of linear pushbroom satellite imagery by a new epipolarity model. ISPRS J. Photogramm. Remote Sens. 2011, 66, 347–355. [Google Scholar] [CrossRef] [Scilit]
  14. Wang, X.; Wang, F.; Xiang, Y.; You, H. A General Framework of Remote Sensing Epipolar Image Generation. Remote Sens. 2021, 13, 4539. [Google Scholar] [CrossRef] [Scilit]
  15. Liao, P.; Chen, G.; Zhang, X.; Zhu, K.; Gong, Y.; Wang, T.; Li, X.; Yang, H. A linear pushbroom satellite image epipolar resampling method for digital surface model generation. ISPRS J. Photogramm. Remote Sens. 2022, 190, 56–68. [Google Scholar] [CrossRef] [Scilit]
  16. Boykov, Y.; Veksler, O.; Zabih, R. Fast approximate energy minimization via graph cuts. IEEE Trans. Pattern Anal. Mach. Intell. 2001, 23, 1222–1239. [Google Scholar] [CrossRef] [Scilit]
  17. Hirschmuller, H. Stereo Processing by Semiglobal Matching and Mutual Information. IEEE Trans. Pattern Anal. Mach. Intell. 2008, 30, 328–341. [Google Scholar] [CrossRef] [Scilit] [PubMed]
  18. Ghuffar, S. Satellite Stereo Based Digital Surface Model Generation Using Semi Global Matching in Object and Image Space. ISPRS Ann. Photogramm. Remote Sens. Spat. Inf. Sci. 2016, III-1, 63–68. [Google Scholar]
  19. Facciolo, G.; Franchis, C.D.; Meinhardt, E. MGM: A Significantly More Global Matching for Stereovision. In Proceedings of the British Machine Vision Conference, Swansea, UK, 7–10 September 2015; BMVA Press: Swansea, UK, 2015. [Google Scholar] [CrossRef] [Scilit]
  20. Beyer, R.A.; Alexandrov, O.; McMichael, S. The Ames Stereo Pipeline: NASA’s Open Source Software for Deriving and Processing Terrain Data. Earth Space Sci. 2018, 5, 537–548. [Google Scholar] [CrossRef] [Scilit]
  21. Hermann, S.; Klette, R.; Destefanis, E. Inclusion of a Second-Order Prior into Semi-Global Matching. In Proceedings of the Advances in Image and Video Technology, Tokyo, Japan, 13–16 January 2009; Wada, T., Huang, F., Lin, S., Eds.; Springer: Berlin/Heidelberg, Germany, 2009; pp. 633–644. [Google Scholar] [CrossRef] [Scilit]
  22. Scharstein, D.; Taniai, T.; Sinha, S.N. Semi-global Stereo Matching with Surface Orientation Priors. In Proceedings of the 2017 International Conference on 3D Vision (3DV), Qingdao, China, 10–12 October 2017; pp. 215–224. [Google Scholar] [CrossRef] [Scilit]
  23. Ruf, B.; Pollok, T.; Weinmann, M. Efficient Surface-Aware Semi-Global Matching with Multi-View Plane-Sweep Sampling. ISPRS Ann. Photogramm. Remote Sens. Spat. Inf. Sci. 2019, IV-2/W7, 137–144. [Google Scholar] [CrossRef] [Scilit]
  24. Mayer, N.; Ilg, E.; Häusser, P.; Fischer, P.; Cremers, D.; Dosovitskiy, A.; Brox, T. A Large Dataset to Train Convolutional Networks for Disparity, Optical Flow, and Scene Flow Estimation. In Proceedings of the 2016 IEEE Conference on Computer Vision and Pattern Recognition (CVPR), Las Vegas, NV, USA, 27–30 June 2016; pp. 4040–4048. [Google Scholar] [CrossRef] [Scilit]
  25. Chang, J.R.; Chen, Y.S. Pyramid Stereo Matching Network. In Proceedings of the 2018 IEEE/CVF Conference on Computer Vision and Pattern Recognition, Salt Lake City, UT, USA, 18–23 June 2018; pp. 5410–5418. [Google Scholar] [CrossRef] [Scilit]
  26. Tao, R.; Xiang, Y.; You, H. An Edge-Sense Bidirectional Pyramid Network for Stereo Matching of VHR Remote Sensing Images. Remote Sens. 2020, 12, 4025. [Google Scholar] [CrossRef] [Scilit]
  27. He, S.; Li, S.; Jiang, S.; Jiang, W. HMSM-Net: Hierarchical multi-scale matching network for disparity estimation of high-resolution satellite stereo images. ISPRS J. Photogramm. Remote Sens. 2022, 188, 314–330. [Google Scholar] [CrossRef] [Scilit]
  28. Zhang, Q.; Ge, J.; Tian, S.; Xi, L. CAGFNet: A Cross-Attention Image-Guided Fusion Network for Disparity Estimation of High-Resolution Satellite Stereo Images. Remote Sens. 2025, 17, 1572. [Google Scholar] [CrossRef] [Scilit]
  29. Jeong, W.; Park, S.Y. UGC-Net: Uncertainty-Guided Cost Volume Optimization with Contextual Features for Satellite Stereo Matching. Remote Sens. 2025, 17, 1772. [Google Scholar] [CrossRef] [Scilit]
  30. Horn, B.K.; Schunck, B.G. Determining optical flow. Artif. Intell. 1981, 17, 185–203. [Google Scholar] [CrossRef] [Scilit]
  31. Lucas, B.D.; Kanade, T. An iterative image registration technique with an application to stereo vision. In Proceedings of the 7th International Joint Conference on Artificial Intelligence—Volume 2 (IJCAI’81), San Francisco, CA, USA, 24–28 August 1981; pp. 674–679. [Google Scholar]
  32. Beardsley, P.A.; Brady, J.M.; Murray, D.W. Prediction of stereo disparity using optical flow. In Proceedings of the BMVC, Oxford, UK, 24–27 September 1990; pp. 1–6. [Google Scholar]
  33. Slesareva, N.; Bruhn, A.; Weickert, J. Optic flow goes stereo: A variational method for estimating discontinuity-preserving dense disparity maps. In Proceedings of the Joint Pattern Recognition Symposium, Vienna, Austria, 31 August–2 September 2005; Springer: Berlin/Heidelberg, Germany, 2005; pp. 33–40. [Google Scholar] [CrossRef] [Scilit]
  34. Cai, X.; Henrik Fitschen, J.; Nikolova, M.; Steidl, G.; Storath, M. Disparity and optical flow partitioning using extended Potts priors. Inf. Inference J. IMA 2014, 4, 43–62. [Google Scholar] [CrossRef] [Scilit]
  35. Zhao, C.; Fan, B.; Hu, J.; Zhang, Z.; Pan, Q.; Wang, X. Disparity Map Enhancement based Stereo Matching Method Using Optical Flow. In Proceedings of the 2018 IEEE 14th International Conference on Control and Automation (ICCA), Anchorage, AK, USA, 12–15 June 2018; pp. 69–74. [Google Scholar] [CrossRef] [Scilit]
  36. Sevilla-Lara, L.; Sun, D.; Jampani, V.; Black, M.J. Optical Flow with Semantic Segmentation and Localized Layers. In Proceedings of the 2016 IEEE Conference on Computer Vision and Pattern Recognition (CVPR), Las Vegas, NV, USA, 27–30 June 2016; pp. 3889–3898. [Google Scholar] [CrossRef] [Scilit]
  37. Cheng, J.; Tsai, Y.H.; Wang, S.; Yang, M.H. SegFlow: Joint Learning for Video Object Segmentation and Optical Flow. In Proceedings of the 2017 IEEE International Conference on Computer Vision (ICCV), Venice, Italy, 22–29 October 2017; pp. 686–695. [Google Scholar] [CrossRef] [Scilit]
  38. Yu, Y.; Yuan, J.; Mittal, G.; Fuxin, L.; Chen, M. BATMAN: Bilateral Attention Transformer in Motion-Appearance Neighboring Space for Video Object Segmentation. In Proceedings of the Computer Vision—ECCV 2022, Tel Aviv, Israel, 23–27 October 2022; pp. 612–629. [Google Scholar] [CrossRef] [Scilit]
  39. Wang, X.; Jiang, L.; Wang, F.; You, H.; Xiang, Y. Disparity Refinement for Stereo Matching of High-Resolution Remote Sensing Images Based on GIS Data. Remote Sens. 2024, 16, 487. [Google Scholar] [CrossRef] [Scilit]
  40. Wang, X.; Wang, M.; Pi, Y. An optical flow-based terrain extraction framework of VHR optical satellite stereo images. Int. J. Appl. Earth Obs. Geoinf. 2023, 124, 103543. [Google Scholar] [CrossRef] [Scilit]
  41. Yang, G.; Zhao, H.; Shi, J.; Deng, Z.; Jia, J. SegStereo: Exploiting Semantic Information for Disparity Estimation. In Proceedings of the Computer Vision—ECCV 2018, Munich, Germany, 8–14 September 2018; pp. 660–676. [Google Scholar] [CrossRef] [Scilit]
  42. Zhang, J.; Skinner, K.A.; Vasudevan, R.; Johnson-Roberson, M. DispSegNet: Leveraging Semantics for End-to-End Learning of Disparity Estimation From Stereo Imagery. IEEE Robot. Autom. Lett. 2019, 4, 1162–1169. [Google Scholar] [CrossRef] [Scilit]
  43. Yang, Q.; Chen, G.; Tan, X.; Wang, T.; Wang, J.; Zhang, X. S3Net: Innovating Stereo Matching and Semantic Segmentation with a Single-Branch Semantic Stereo Network in Satellite Epipolar Imagery. In Proceedings of the IGARSS 2024—2024 IEEE International Geoscience and Remote Sensing Symposium, Athens, Greece, 7–12 July 2024; pp. 8737–8740. [Google Scholar] [CrossRef] [Scilit]
  44. Chen, C.; Zhao, L.; He, Y.; Long, Y.; Chen, K.; Wang, Z.; Hu, Y.; Sun, X. SemStereo: Semantic-Constrained Stereo Matching Network for Remote Sensing. Proc. AAAI Conf. Artif. Intell. 2025, 39, 15758–15766. [Google Scholar] [CrossRef] [Scilit]
  45. Huang, S.; Xu, T.; Shen, Z.; Saeed, S.U.; Yan, W.; Barratt, D.; Hu, Y. One Registration is Worth Two Segmentations. In Proceedings of the Medical Image Computing and Computer Assisted Intervention—MICCAI 2024, Marrakesh, Morocco, 6–10 October 2024; pp. 665–675. [Google Scholar] [CrossRef] [Scilit]
  46. Kirillov, A.; Mintun, E.; Ravi, N.; Mao, H.; Rolland, C.; Gustafson, L.; Xiao, T.; Whitehead, S.; Berg, A.C.; Lo, W.Y.; et al. Segment Anything. In Proceedings of the 2023 IEEE/CVF International Conference on Computer Vision (ICCV), Paris, France, 1–6 October 2023; pp. 3992–4003. [Google Scholar] [CrossRef] [Scilit]
  47. Wu, Q.; Osco, L.P. samgeo: A Python package for segmenting geospatial data with the Segment Anything Model (SAM). J. Open Source Softw. 2023, 8, 5663. [Google Scholar] [CrossRef] [Scilit]
  48. Yu, J.; Chen, G.; Zhang, X.; Chen, W.; Pu, Y. An improved Douglas-Peucker algorithm aimed at simplifying natural shoreline into direction-line. In Proceedings of the 2013 21st International Conference on Geoinformatics, Kaifeng, China, 20–22 June 2013; pp. 1–5. [Google Scholar] [CrossRef] [Scilit]
  49. Bao, L.; Yang, Q.; Jin, H. Fast Edge-Preserving PatchMatch for Large Displacement Optical Flow. In Proceedings of the 2014 IEEE Conference on Computer Vision and Pattern Recognition, Columbus, OH, USA, 23–28 June 2014; pp. 3534–3541. [Google Scholar] [CrossRef] [Scilit]
  50. Barnes, C.; Shechtman, E.; Finkelstein, A.; Goldman, D.B. PatchMatch: A randomized correspondence algorithm for structural image editing. ACM Trans. Graph. 2009, 28, 24. [Google Scholar] [CrossRef] [Scilit]
  51. Zabih, R.; Woodfill, J. Non-parametric local transforms for computing visual correspondence. In Proceedings of the Computer Vision—ECCV ’94, Stockholm, Sweden, 2–6 May 1994; pp. 151–158. [Google Scholar] [CrossRef] [Scilit]
  52. Yoon, K.J.; Kweon, I.S. Adaptive support-weight approach for correspondence search. IEEE Trans. Pattern Anal. Mach. Intell. 2006, 28, 650–656. [Google Scholar] [CrossRef] [Scilit] [PubMed]
  53. Bosch, M.; Foster, K.; Christie, G.; Wang, S.; Hager, G.D.; Brown, M. Semantic Stereo for Incidental Satellite Images. In Proceedings of the 2019 IEEE Winter Conference on Applications of Computer Vision (WACV), Waikoloa Village, HI, USA, 7–11 January 2019; pp. 1524–1532. [Google Scholar] [CrossRef] [Scilit]
  54. Le Saux, B.; Yokoya, N.; Hansch, R.; Brown, M.; Hager, G. 2019 Data Fusion Contest [Technical Committees]. IEEE Geosci. Remote Sens. Mag. 2019, 7, 103–105. [Google Scholar] [CrossRef] [Scilit]
  55. Mei, X.; Sun, X.; Zhou, M.; Jiao, S.; Wang, H.; Zhang, X. On building an accurate stereo matching system on graphics hardware. In Proceedings of the 2011 IEEE International Conference on Computer Vision Workshops (ICCV Workshops), Barcelona, Spain, 6–13 November 2011; pp. 467–474. [Google Scholar] [CrossRef] [Scilit]
  56. Brigot, G.; Colin-Koeniguer, E.; Plyer, A.; Janez, F. Adaptation and Evaluation of an Optical Flow Method Applied to Coregistration of Forest Remote Sensing Images. IEEE J. Sel. Top. Appl. Earth Obs. Remote Sens. 2016, 9, 2923–2939. [Google Scholar] [CrossRef] [Scilit]
  57. Luo, Y.; Wang, H.; Lv, X. End-to-End Edge-Guided Multi-Scale Matching Network for Optical Satellite Stereo Image Pairs. Remote Sens. 2024, 16, 882. [Google Scholar] [CrossRef] [Scilit]
  58. Luo, Y.; Lv, X.; Wang, H. Dense Matching with Optimized Penalty and Interpolation for High-Resolution Optical Stereo Image Pairs. IEEE Geosci. Remote Sens. Lett. 2024, 21, 1–5. [Google Scholar] [CrossRef] [Scilit]
Figure 1. The pipeline of proposed SAOF.
Remotesensing 17 04017 g001
Figure 2. SAMgeo-Reg module.
Remotesensing 17 04017 g002
Figure 3. Morphology–geometry joint post-process.
Remotesensing 17 04017 g003
Figure 4. Sub-top pyramid re-PatchMatch scheme.
Remotesensing 17 04017 g004
Figure 5. Self-Similarity propagation based on scale-adaptive matching window after approximately epipolar rectification.
Remotesensing 17 04017 g005
Figure 6. Disparity results in weak-texture urban building regions. From left to right: original image, ground truth, SGM, MGM, Gefolki, ADC, HMSMNet, and SAOF. Image index: I, II.
Remotesensing 17 04017 g006
Figure 7. Semantic guidance maps of stereo pairs. Top image index: I; bottom image index: II. Each pair shows the left and right images.
Remotesensing 17 04017 g007
Figure 8. Disparity results in complex building regions. From left to right: original image, ground truth, SGM, MGM, Gefolki, ADC, HMSMNet, SAOF. Image index: III, IV.
Remotesensing 17 04017 g008
Figure 9. Disparity results in building–vegetation mixed regions. From left to right: original image, ground truth, SGM, MGM, Gefolki, ADC, HMSMNet, SAOF. Image index: V, VI, VII.
Remotesensing 17 04017 g009
Figure 10. Disparity results in textureless regions. From left to right: original image, ground truth, SGM, MGM, Gefolki, ADC, HMSMNet, SAOF. Image index: VIII, IX, X.
Remotesensing 17 04017 g010
Figure 11. Effect of STPR and SAMC modules on disparity estimation at different pyramid levels. The black square marks a complex, large-disparity region. Columns show (from left to right): reference inputs, baseline, STPR, SAMC, and STPR+SAMC results; rows indicate pyramid levels from penultimate to full resolution.
Remotesensing 17 04017 g011
Figure 12. Effect of semantic mis-segmentation on disparity estimation.
Remotesensing 17 04017 g012
Figure 13. Disparity estimation on large-coverage SuperView-1 satellite images.
Remotesensing 17 04017 g013
Table 1. Track-2 US3D dataset.
Stereo PairModeSizeNumbers
JacksonvilleRGB1024 × 10242135
OmahaRGB1024 × 10242152
Table 2. Parameter settings.
NameSymbolValue
Number of pyramid levelsP4
Matching window sizeR17
Weighting coefficients of matching cost components λ c e n ,   λ g r a d ,   λ c o l 0.2, 0.1, 0.1
Bilateral weighting parameters σ s ,   σ r 0.5 R , 0.1
Similarity threshold τ 0.9
Table 3. Description of stereo pairs and their correspondence to subsequent experiment results.
Region TypesImage IDsImage Indices
Complex RegionsOMA_251_001_004I
JAX_264_003_001II
OMA_248_036_031III
JAX_068_001_002IV
JAX_416_001_002V
JAX_113_006_003VI
JAX_467_001_002VII
Textureless RegionsOMA_181_027_028VIII
OMA_176_039_040IX
OMA_059_039_040X
Roman numerals (I–X) are used for concise reference in subsequent experiment results.
Table 4. EPE (pixels) results in complex regions.
Image IndexSGM [17]MGM [19]Gefolki [56]ADC [55]HMSMNet [27]SAOF
I1.9641.4991.9712.5371.2311.261
II2.4152.5413.6363.2362.3312.254
III1.0921.0851.3091.2960.9570.913
IV1.1721.0191.2681.1390.8660.901
V0.9010.8810.9420.8310.7970.764
VI2.6762.6312.8583.5912.3072.192
VII1.3721.1951.0420.9851.0310.934
Average1.6561.5521.8611.9451.3601.317
Bold and underlined values indicate the best results for each metric.
Table 5. D1-3 (%) results in complex regions.
Image IndexSGM [17]MGM [19]Gefolki [56]ADC [55]HMSMNet [27]SAOF
I13.5211.6815.7314.839.869.55
II17.9318.8126.8319.5119.2617.45
III5.996.0310.929.719.455.21
IV6.635.325.836.092.933.06
V5.865.075.845.373.934.09
VI27.2926.3329.1625.5221.8920.58
VII6.785.834.714.323.723.69
Average12.0111.2914.1512.1910.149.09
Bold and underlined values indicate the best results for each metric.
Table 6. EPE (pixels) results in textureless regions.
Image IndexSGM [17]MGM [19]Gefolki [56]ADC [55]HMSMNet [27]SAOF
VIII0.6560.6530.6370.5930.6810.539
IX2.8532.7643.1233.2582.9412.728
X0.6910.6690.7120.6350.7230.507
Average1.4031.3621.4911.4951.4481.258
Bold and underlined values indicate the best results for each metric.
Table 7. D1-2 (%) results in textureless regions.
Image IndexSGM [17]MGM [19]Gefolki [56]ADC [55]HMSMNet [27]SAOF
VIII2.6303.0913.0902.6502.2832.240
IX16.5616.2718.6515.6315.5712.94
X1.2331.3462.1350.6380.5770.460
Average12.0111.2914.1512.1910.149.090
Bold and underlined values indicate the best results for each metric.
Table 8. Ablation study results in complex regions.
ModelEPE (Average/Pixel)D1-3 (Average/%)Time (Average/S)
Baseline1.56612.560.779
Baseline + SAMW1.51412.480.786
Baseline + STPR1.45310.270.916
Baseline + SAMC1.41710.320.870
Baseline + SAMW + STPR1.43410.140.923
Baseline + SAMW + SAMC1.3979.770.884
Baseline + STPR + SAMC1.3359.311.031
Bold and underlined values indicate the best results for each metric.
Table 9. Ablation study results in textureless regions.
ModelEPE (Average/Pixel)D1-2 (Average/%)Time (Average/S)
Baseline1.3715.900.771
Baseline + SAMW1.3455.760.782
Baseline + STPR1.3385.530.902
Baseline + SAMC1.3055.780.842
Baseline + SAMW + STPR1.3225.510.918
Baseline + SAMW + SAMC1.3185.660.851
Baseline + STPR + SAMC1.2965.351.021
Bold and underlined values indicate the best results for each metric.
Disclaimer/Publisher’s Note: The statements, opinions and data contained in all publications are solely those of the individual author(s) and contributor(s) and not of MDPI and/or the editor(s). MDPI and/or the editor(s) disclaim responsibility for any injury to people or property resulting from any ideas, methods, instructions or products referred to in the content.