1. Introduction
Natural disasters have a profound impact on human-made infrastructure and the built landscape, with earthquakes and cyclones among the most destructive—often damaging roofs and walls and directly compromising structural integrity. As urbanization increases and extreme weather events become more frequent due to climate change, the severity of building damage is expected to increase, underscoring the importance of automated damage detection as a fast and efficient tool for post-disaster response and recovery [
1,
2,
3]. In 2023 alone, 399 natural hazard-related disasters were recorded, resulting in 86,473 fatalities [
4].
Recent advances in computer vision have significantly enhanced the automation and accuracy of post-disaster building damage assessment, leveraging SOTA methodologies and tackling the task of building damage assessment from the perspective of common computer vision tasks, such as object detection, semantic and instance segmentation, image classification, and change detection [
5,
6,
7,
8,
9]. Architectures like Mask R-CNN, U-Net derivatives, Siamese networks, and optimized YOLO variants have become foundational [
9,
10,
11,
12], enabling precise localization and quantification of structural damage from high-resolution satellite and aerial imagery. Despite their impressive performance, these approaches often rely on computationally intensive models or complex end-to-end pipelines that can be challenging to deploy in resource-constrained or real-time field environments [
5,
13,
14].
Recent work has introduced new resources to address the lack of post-disaster data for underrepresented regions and architectural characteristics in Africa. The mwBTFreddy dataset [
15], developed by the Kuyesera AI Lab, focuses on flash flood damage assessment in urban Malawi following Cyclone Freddy, providing paired pre- and post-disaster satellite imagery with detailed building annotations and damage levels tailored to African urban environments, but does not include rural areas. The Africa Exposure model [
16,
17] offers a comprehensive inventory of residential, commercial, and industrial buildings across the continent, including vulnerability characteristics and building stock data, although it does not contain any post-disaster imagery, instead supporting risk and exposure analysis relevant to disaster impact assessment in Africa. Addressing both regional and architectural diversity, the EDDA dataset [
18] (EDDA being a proper name assigned by the dataset authors, not an acronym) has demonstrated promising results for building damage assessment in African contexts [
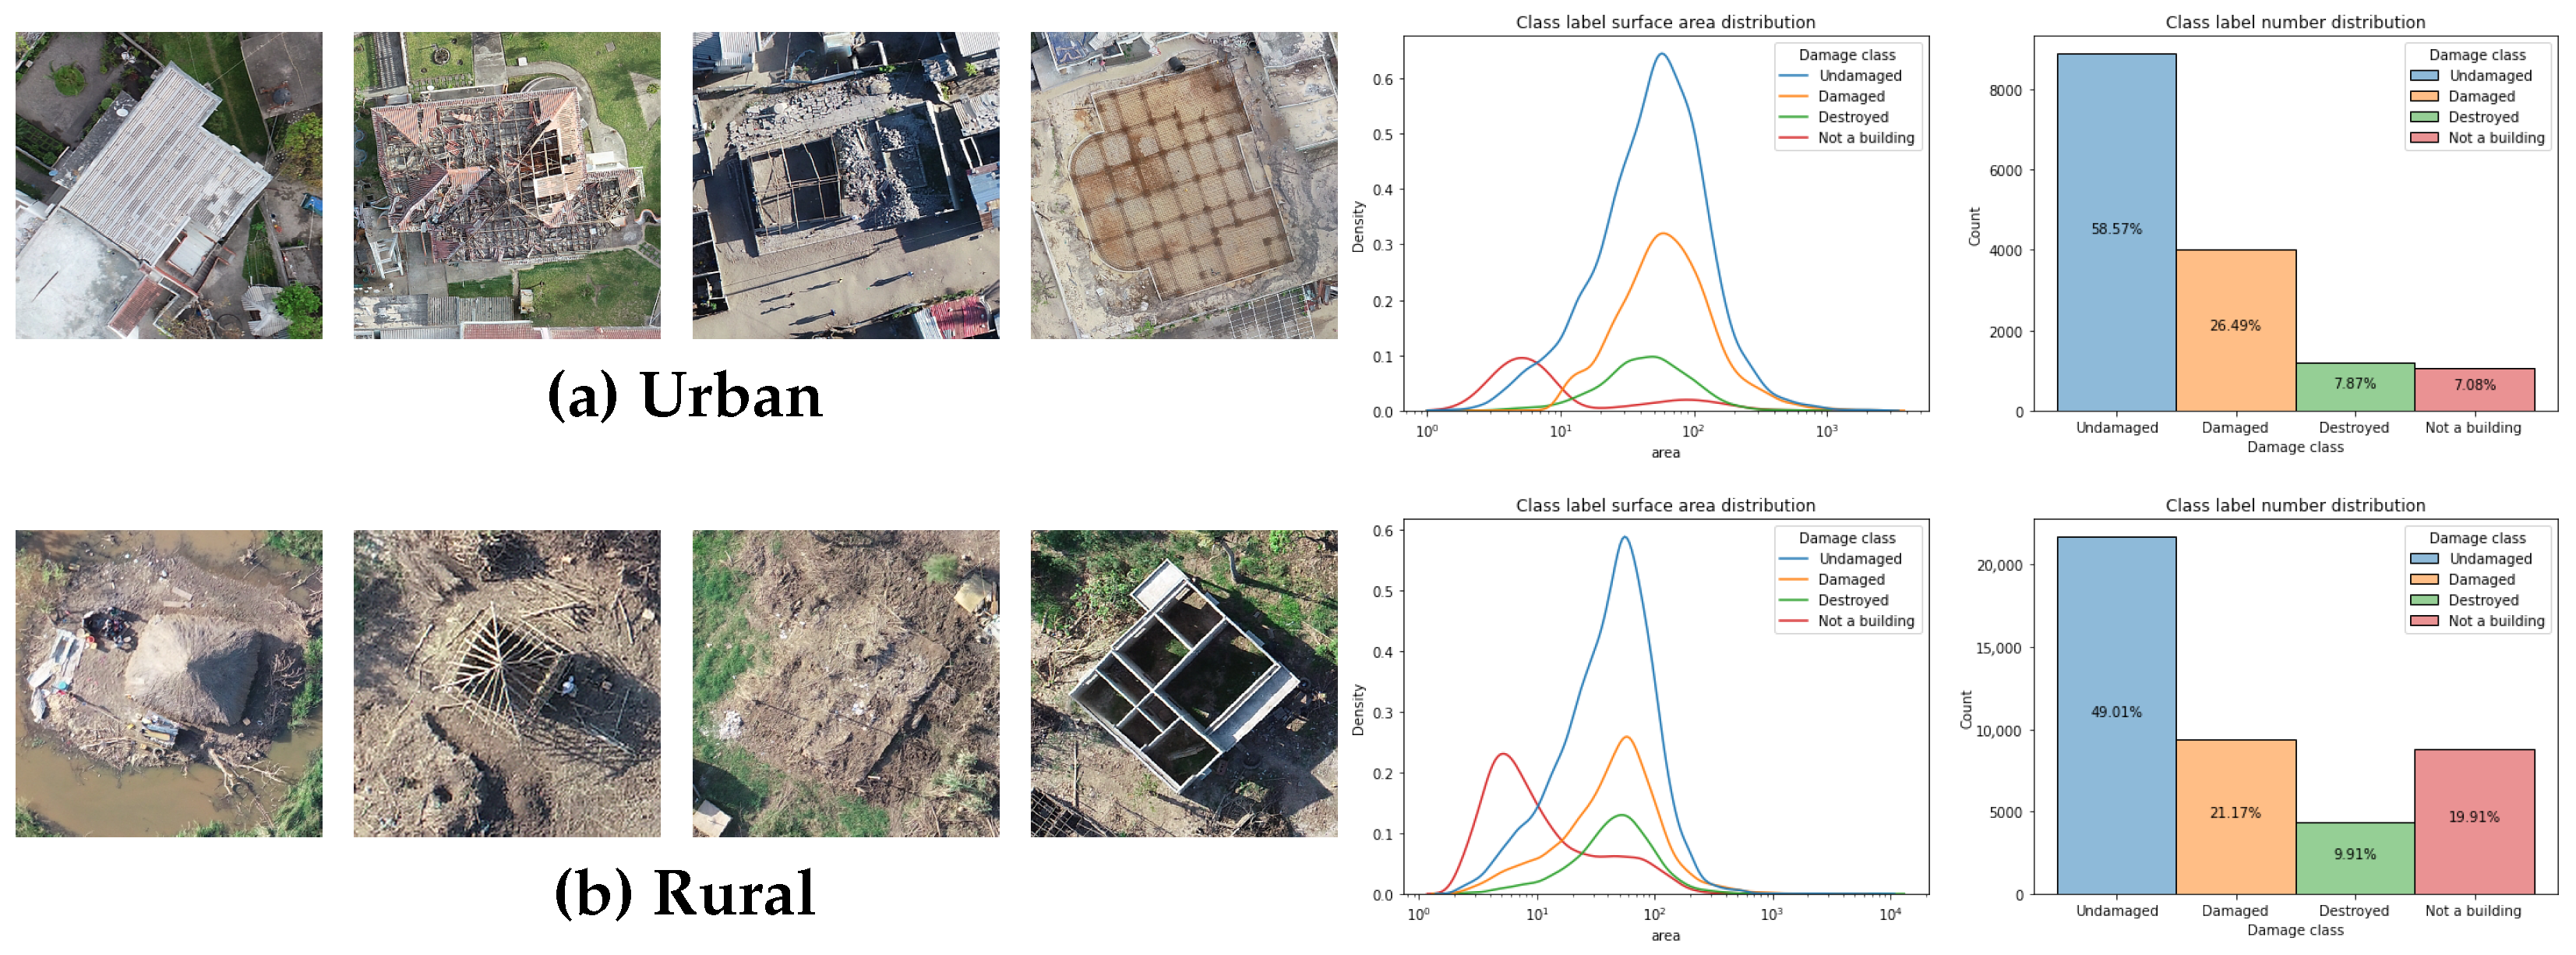
2]. The dataset consists of orthomosaics of UAV images containing rural and urban parts of Mozambique affected by the events of Cyclone Idai, and therefore also contains varying instances of both rural and urban architecture under four classes of building damage (undamaged, damaged, destroyed, and not a building), as illustrated in
Figure 1.
We propose an approach that employs a single-stage object detector (YOLO) followed by a dedicated classification network, establishing a conceptual bridge to traditional two-stage architectures like R-CNN [
19,
20]. While conventional two-stage detectors integrate region proposal and classification within a unified framework with shared feature representations [
20,
21], our pipeline decouples these processes into distinct networks. This modular design preserves the computational efficiency of single-stage detection while incorporating the classification precision typically associated with two-stage methods [
22,
23,
24].
Unlike integrated two-stage architectures such as Faster R-CNN, which use Region Proposal Networks (RPNs) followed by classification, our approach sacrifices feature sharing between stages but gains flexibility in component optimization. This hybrid methodology aligns with recent research exploring the trade-offs between detection speed and accuracy [
24,
25,
26,
27], potentially offering advantages in specialized domains where detection and classification requirements differ substantially. The approach is conceptually similar to cascade detection frameworks [
28], where sequential refinement of detections improves overall performance. As noted in comprehensive reviews of object detection architectures, such hybrid approaches can effectively balance the speed advantages of one-stage detectors with the precision benefits of specialized classification networks [
26,
27].
We conduct this methodological comparison using the EDDA dataset as our evaluation testbed. While this study focuses on a single dataset, the comparison between multi-class object detection and two-stage pipelines provides insights applicable to building damage assessment more broadly. The EDDA dataset’s diversity in building types (from traditional rural structures to modern urban buildings), damage levels (spanning minor to complete destruction), and environmental conditions (varied lighting, occlusion, and viewing angles) makes it a representative testbed for evaluating these approaches in post-disaster scenarios.
Our study is scoped to bounding-box localization and categorical damage assessment, without instance segmentation or quantitative (area/volume) damage estimation. This reflects (i) the limited availability and consistency of segmentation masks at the geographic and temporal coverage required post-event; (ii) the operational need to deploy models rapidly using bounding boxes or building footprints that are commonly available; and (iii) the objective to isolate pipeline effects between multiclass detection and a two-stage localization-plus-classification approach under like-for-like supervision. While segmentation can improve delineation and may enable quantitative damage, our focus is the frequent rapid-response setting where only boxes and categorical labels exist. Accordingly, we report detection AP and damage-level precision/recall/F1 with macro/micro averaging.
The main contributions of this work are:
A comprehensive empirical evaluation of lightweight object detectors (RTMDet, YOLOv7, YOLOv8) for both multi-class building damage detection and damage-agnostic building localization on the EDDA UAV dataset.
A systematic assessment of state-of-the-art image classifiers—including transformer-based Compact Convolutional Transformers (CCT) and established CNN architectures (ResNet, EfficientNet)—for building damage severity classification under severe class imbalance.
A controlled comparison of single-stage multi-class detection versus a two-stage localization-then-classification pipeline, quantifying performance trade-offs and robustness to class imbalance in post-disaster building damage assessment.
Beyond reporting benchmark scores, this work provides three empirical insights: (i) separating localization and damage classification yields a modest but consistent mAP gain over multi-class detectors while substantially improving flexibility for deployment; (ii) single-class localization trained on EDDA significantly outperforms multi-class detection in pure localization quality, indicating that jointly learning damage labels hampers detection on this dataset; and (iii) transformer-based classifiers (CCT) show clear advantages over CNNs for fine-grained building damage assessment, particularly under severe class imbalance.
1.1. Building Damage Analysis
Rapid building damage assessment is crucial for providing timely and detailed information in emergency situations [
29]. Remote data acquisition and observation technologies such as satellite imagery or UAV imagery offer the advantage of being able to cover large areas with very high resolution in within a short time frame [
9,
10,
12,
29,
30]. Compared to satellite imagery, UAV imaging has increasingly become the preferred method of sensing for automated building damage assessment, especially in the context of disaster response, due to its flexible deployment, low-altitude imaging, finer spatial resolution, and reduced susceptibility to cloud obstruction [
31,
32,
33,
34,
35].
The capacity to cover large land areas in high resolution results in large data collections and further introduces the challenge of having to evaluate the same data in a relatively short amount of time. Manual evaluation of the data is time-consuming and does not provide objective insights into data statistics or a comprehensive understanding of the disaster’s extent across various regions. Therefore, leveraging machine vision techniques for this purpose has been widely explored, with the research community increasingly shifting from classical image processing methods [
36,
37] toward learning-based approaches [
35,
38,
39,
40]. The literature on the topic has become very rich in recent years. Therefore, refs. [
41,
42,
43,
44] provide reviews on the topic of structural damage assessment from different perspectives. Common challenges across all studies include robustness to different spatial resolutions, dataset specifics depending on the assessment location, and limited availability of annotated data.
To address these ongoing challenges, this study introduces a modular two-stage pipeline tailored for post-disaster building damage assessment in underrepresented regions, using UAV imagery from the EDDA dataset collected in Mozambique. By separating building localization and damage classification into independently optimized stages, the approach enhances adaptability across varying spatial resolutions and architectural contexts.
1.2. Building Damage Datasets
Keeping in mind the task of damage recognition in urban and rural areas of Southern Africa specifically Mozambique, we examine existing building datasets containing building labels for either segmentation or object detection. Datasets such as xDB [
45], Inria [
46], Landcover.ai [
47], Massachusetts Buildings Dataset [
48,
49], SpaceNet 4, 6 and 7 [
50,
51,
52] and xView [
53], mostly characterize infrastructure in Western countries or new construction. Only a small number of them contain information on damaged and destroyed buildings (xDB [
45], xView [
53]).
In order to build robust disaster response solutions based on building damage recognition from drone imagery, publicly available datasets need to characterize building damage in architectures other than Western. Recently, two such datasets have been made available (EDDA [
18] and mwBTFreddy [
15] datasets).
1.3. Object Detection
Object detection techniques primarily rely on deep learning models, which are broadly categorized into region-based and regression-based approaches. The R-CNN family, representing the former, follows a two-step process: first generating region proposals and then classifying them. While this method achieves high precision, it comes at the cost of computational efficiency. In contrast, regression-based models adopt an end-to-end approach, with YOLO by Redmon et al. [
19,
54,
55] emerging as a pioneering framework. YOLOv1 integrates multiple steps—region suggestion, bounding box refinement, redundant detection suppression, and box re-scoring—resulting in significantly faster detection compared to R-CNN [
19]. YOLOv2 [
54] introduced several enhancements, such as leveraging DarkNet-19 [
56] for feature extraction, employing K-means clustering for improved bounding box predictions, and incorporating multi-scale training to boost generalization. Real-world applications such as UAV and helicopter-based object detection have highlighted challenges in detecting small-scale targets [
57]. To address these limitations, YOLOv3 [
55] replaced DarkNet-19 with DarkNet-53, enabling deeper feature extraction and multi-scale predictions. Further modifications were introduced by Ma H. and Liu Y. [
58], who adapted YOLOv3 for seismic emergency applications by integrating ShuffleNet-v2 [
59], a lightweight CNN, along with the generalized intersection over union (GIoU) for more accurate bounding-box computations. These advancements significantly improved both detection speed and accuracy. Building on these foundations, YOLO continued to evolve with the release of YOLOv4 [
25] and YOLOv5 [
60]. These iterations introduced optimizations in data augmentation, architecture, and computational efficiency, enhancing both inference speed and detection accuracy. Notably, YOLOv5 offers four model variants—YOLOv5s, YOLOv5m, YOLOv5l, and YOLOv5x—tailored for different performance trade-offs [
60]. Its effectiveness has been demonstrated in diverse applications, such as livestock monitoring as illustrated by Lema et al. [
61]. Adapting YOLOv5 to aerial imagery has been a focal point of recent research. One challenge, particularly in high-density wheat spike detection, was addressed by Zhao et al. [
62], who introduced a microscale detection layer to improve the identification of small objects in UAV images. Another significant modification involved integrating a Vision Transformer into the backbone and replacing the PANet neck with a Bi-Directional Feature Pyramid Network (BiFPN) to enhance multi-scale feature aggregation, which led to improved building damage detection [
35]. Further refinements were made with YOLOv7 [
63], which introduced several architectural improvements. The Extended Efficient Layer Aggregation Network (E-ELAN) replaced the traditional backbone to mitigate gradient vanishing, while compound model scaling improved adaptability to variations in data resolution, channel depth, and model size. Additionally, the introduction of RepConvN aimed to prevent identity connections in layers undergoing re-parameterization, and multi-head prediction mechanisms leveraged middle-layer features to enhance detection performance [
63,
64].
Lyu et al. [
65] introduced RTMDet, incorporating an anchor-free, center-based detection head, eliminating the need for predefined anchor boxes and instead predicting object centers with direct bounding box regression. A re-parameterized backbone, inspired by RepVGG, merges complex training structures into single-branch convolutions at inference, reducing computational overhead. To enhance multi-scale feature extraction, it adopts a lightweight feature pyramid strategy, prioritizing spatial information retention while minimizing computational costs. Additionally, it employs a dynamic label assignment strategy (optimal transport-based methods) for more flexible and stable training and optimizes real-time performance by integrating strong data augmentation techniques while maintaining a minimal post-processing pipeline, ensuring high frames per second (FPS) without sacrificing accuracy.
YOLOv8 [
66,
67] introduced several significant architectural innovations that enhance detection performance and efficiency. The model adopts an anchor-free detection paradigm, eliminating the dependency on predefined anchor boxes and thereby improving detection flexibility across diverse object scales and aspect ratios. A key architectural advancement is the implementation of a decoupled head design that separates classification and regression tasks into distinct branches, resulting in more precise object localization and classification accuracy. The backbone network incorporates the C2f (Cross-Stage Partial with 2 convolutions and fusion) module, which replaces the C3 module from YOLOv5 and provides enhanced feature extraction through improved gradient flow and cross-stage feature fusion. Additionally, YOLOv8 employs mosaic data augmentation during training, which combines multiple images into a single training input to enhance model robustness and generalization capabilities. However, unlike previous versions, YOLOv8 strategically disables mosaic augmentation in the final training epochs to improve convergence and final model performance.
In this work, we deliberately start from standard detection backbones widely used in remote sensing (YOLOv7/8, RTMDet) and specialize them through data representation (GSD normalization, tiling) and anchor evaluation, rather than proposing yet another architectural variant. This allows us to isolate the effect of the pipeline design choice (multi-class vs. two-stage) under realistic UAV-imaging conditions and to provide empirical guidance on how to structure end-to-end building damage assessment systems around such backbones.
1.4. Damage Classification
Contemporary post-disaster building damage assessment has witnessed significant advancements through deep learning approaches, with various convolutional neural network (CNN) architectures demonstrating promising results across different imaging platforms and damage classification scenarios. Wang et al. [
68] achieved 93% validation accuracy using AlexNet and GoogLeNet for masonry historic structure damage classification. Duarte et al. [
69] advanced satellite-based damage classification by combining multi-resolution imagery from airborne and satellite platforms using residual connections and dilated convolutions, achieving nearly 4% improvement in classification accuracy. Ma et al. [
70] further advanced the field by proposing an improved CNN Inception V3 architecture that achieved 90.07% test accuracy with a Kappa coefficient of 0.81 for earthquake-damaged building groups, representing an 18% improvement over traditional multi-feature machine learning classifiers through the integration of GIS block vector data and automated feature selection. The EBDC-Net framework proposed by Hong et al. [
71] demonstrated strong classification performance on post-disaster aerial imagery, achieving overall accuracies of 94.72%, 79.02%, and 67.62% across three progressively fine-grained damage severity groupings: (1) a 2-class scheme distinguishing non-collapsed (intact to severely damaged) from collapsed buildings, (2) a 3-class scheme separating intact (including slightly damaged), severely damaged, and collapsed structures, and (3) a 4-class scheme differentiating intact, slightly damaged, severely damaged, and collapsed buildings.
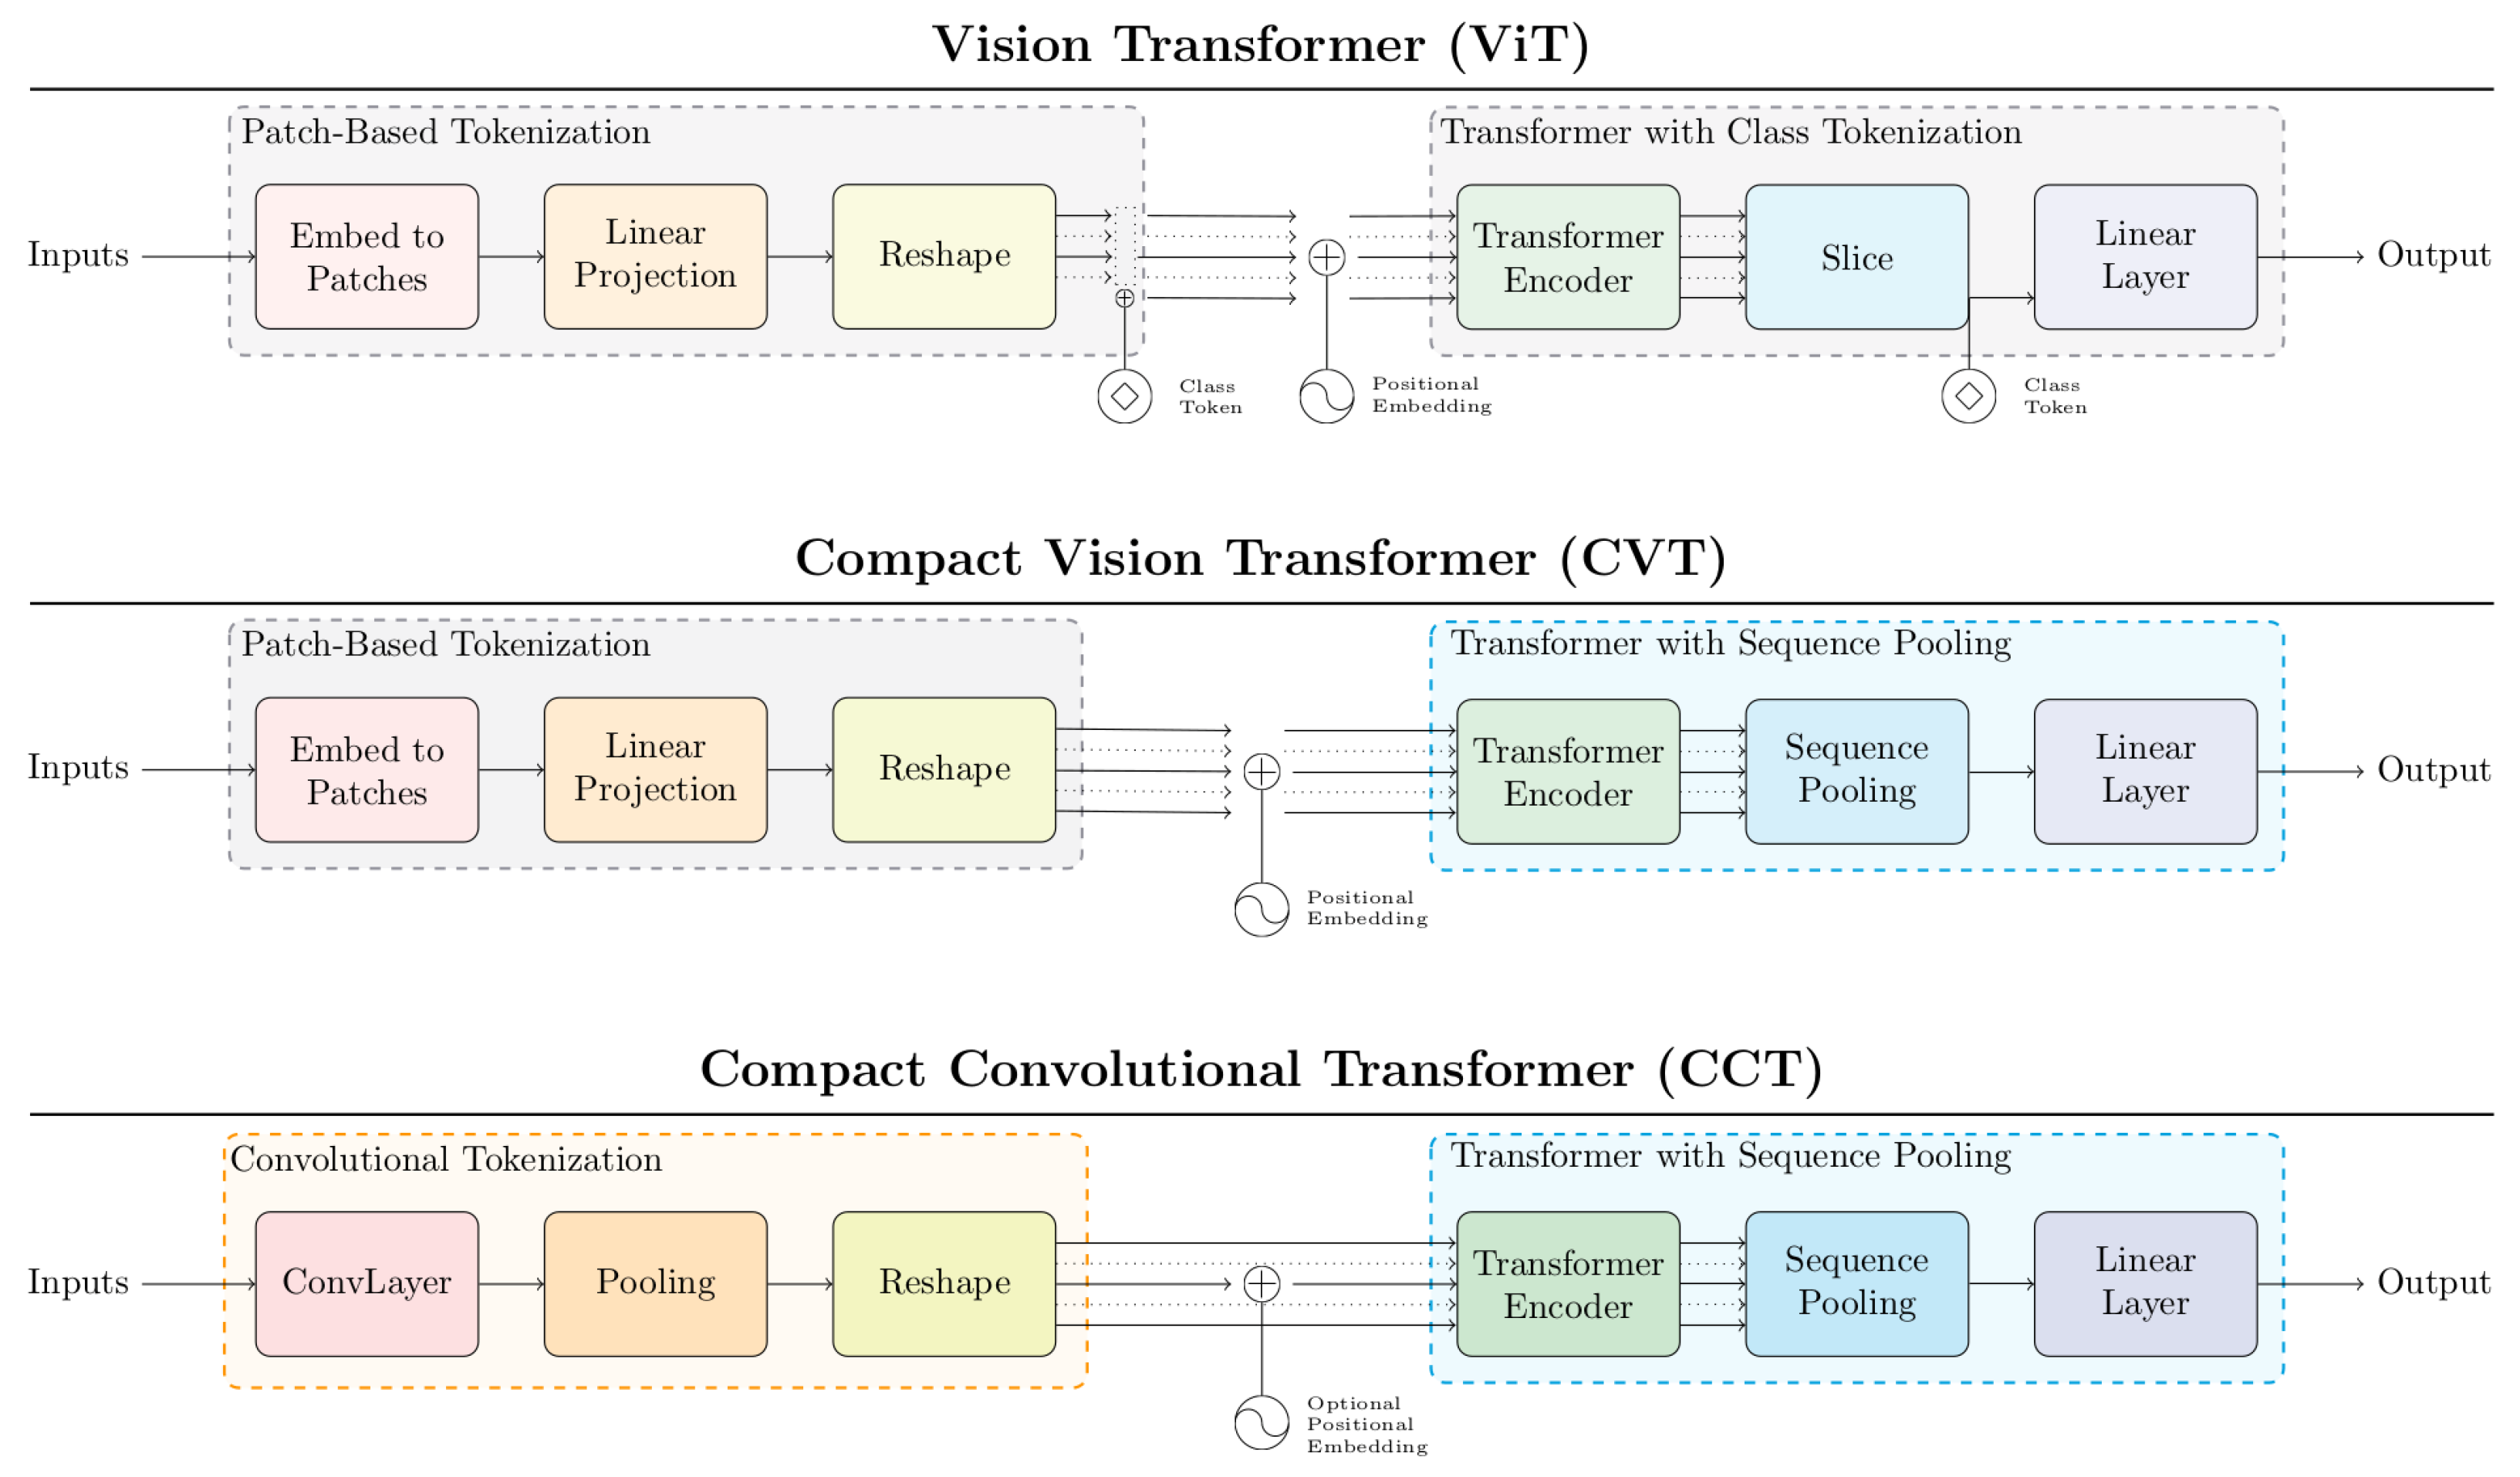
The Compact Convolutional Transformer (CCT) architecture, proposed by Hassani et al. [
72] and illustrated in
Figure 2, integrates several features that make it particularly well-suited for post-disaster building damage assessment. Its convolutional tokenization mechanism preserves local spatial information, which is essential for distinguishing subtle damage patterns such as cracks, spalling, and structural deformation—details often lost in traditional transformer approaches. The model’s compact design, with only 0.28–3.7 million parameters, supports deployment in resource-constrained environments without sacrificing accuracy. Furthermore, its rapid training capability, reaching 90% accuracy in under 30 min on a single GPU, aligns well with the time-sensitive nature of emergency response operations. In addition, CCT reduces reliance on positional embeddings and instead uses a sequence pooling (SeqPool) mechanism to capture global contextual information across image regions without adding extra parameters. This design helps manage multi-scale damage features and variable spatial resolutions commonly encountered in UAV imagery. It also contributes to accurate boundary preservation, which is critical for fine-grained damage classification across severity levels.
Given these advantages, we selected the CCT architecture as the classification model for the second stage of our building damage assessment pipeline, alongside other well-established lightweight networks.
2. Materials and Methods
In this paper, we introduce a pipeline for post-disaster building damage evaluation, which divides the task into two sequential computer vision tasks: object detection for localizing buildings within a scene and image classification for categorizing the damage level of the localized buildings. This modular approach allows for specialized optimization of each task while maintaining an integrated workflow. This consisted of preparing the previously mentioned EDDA dataset into the appropriate formats for the tasks of object detection and image classification. A baseline for comparing our pipeline to the common approach of utilizing a multi-class object detection network was developed, employing three lightweight multi-class object detection networks implemented in the MMDetection toolbox [
73]: RTMDet [
65], YOLOv7 [
63] and YOLOv8 [
66]. To assess the viability of building object detection as a localization method independent of damage classification, the same models were trained and analyzed on a single “building” class representations of the dataset. Separately, to evaluate the complete pipeline for the task of building detection and damage classification we used a combination of image classification models. Specifically, we evaluated the Compact Convolutional Transformer (CCT) model [
72] alongside well-established lightweight classification models, including ResNet [
74], EfficientNet [
75], and their respective variants. To optimize the performance of the deep learning models, we conducted a comprehensive set of experiments exploring a wide range of hyper-parameters and training strategies.
Finally, we compared the results of the best-performing multi-class object detection network with the combination of the best-performing single-class object detection network for localization and the best-performing image classification network for damage classification. This comparison allowed us to evaluate the effectiveness of the two-stage pipeline in assessing building damage with respect to the multi-class object detection.
2.1. Data Preparation
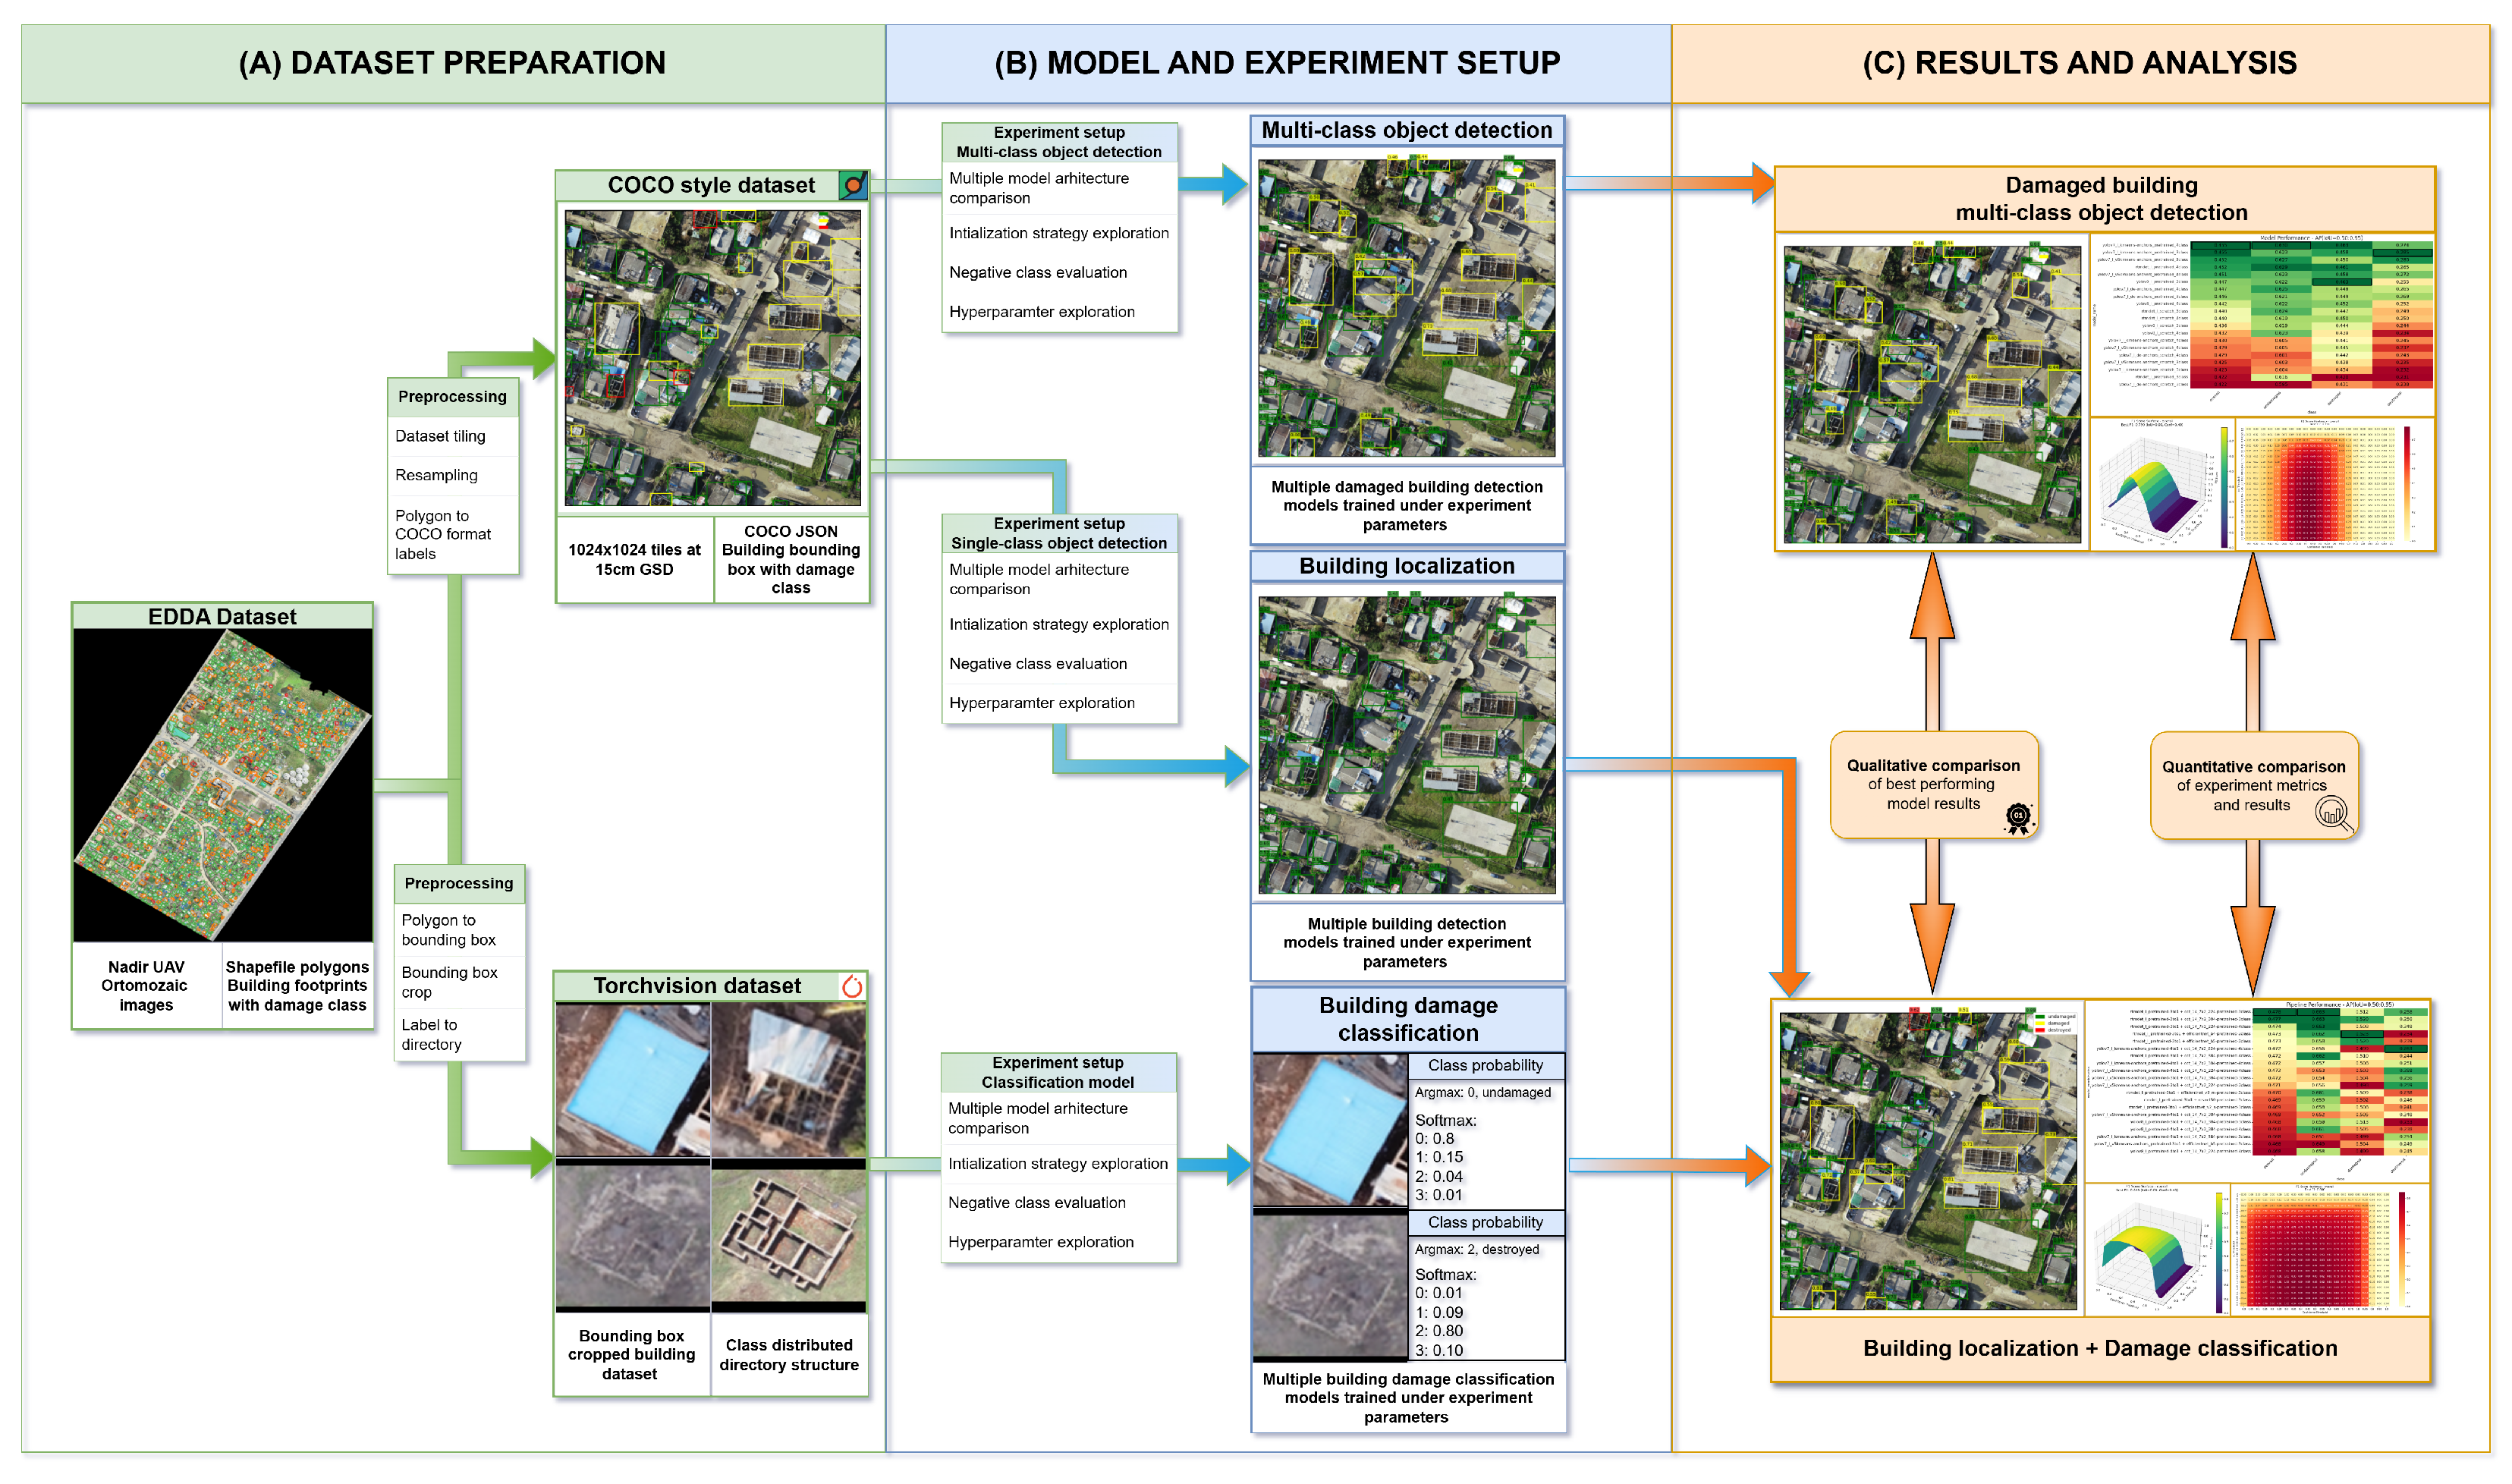
The first step of the pipeline, shown in
Figure 3, involved data preparation. Before model training, we followed established guidelines for optimal ground sampling distance (GSD) and image resolution, based on prior research using this dataset’s aerial imagery, to generate inputs suitable for both object detection and image classification tasks. High-resolution orthomosaic images were divided into non-overlapping tiles of 1024 × 1024 pixels and aligned to a consistent resolution of 15 cm per pixel through standard image scaling procedures, following the tiling setup described in the original EDDA work [
2] to ensure methodological consistency and comparability. This tiling process not only standardized the input data but also made it computationally feasible to train and evaluate deep learning models on large-scale aerial imagery. The dataset was then divided into three subsets: 70% for training, 15% for validation, and 15% for testing. These splits were consistently used across all experiments to ensure fair and reproducible comparisons. At this stage, the pipeline diverged into task-specific data preparation for object detection and image classification.
For object detection, the COCO (Common Objects in Context) annotation format [
76] was used, as it includes both tiled images and their associated bounding box annotations, which are essential for training detection models. This format is widely adopted due to its support for multi-class annotations and its compatibility with many modern deep learning frameworks, making it particularly suitable for detecting multiple damage categories within a single image. For image classification, from the COCO-style annotations individual building instances were cropped from the tiled images based on their bounding box coordinates. These cropped images, each representing a single building, were then organized into a directory structure compatible with the baseline ImageFolder class from the Pytorch Torchvision library [
77]. This format involves grouping images into subdirectories based on their class labels, making it straightforward to load and preprocess the data for classification tasks. By separating the data preparation into these two distinct formats, the pipeline ensured that each task, object detection and image classification, could be optimized independently while maintaining a shared foundation in the original dataset.
Although the backbone architectures are generic object detectors, the overall pipeline is tailored to UAV remote sensing through explicit control of ground sampling distance, tile size, and bounding-box distributions. The anchor-optimization study for YOLOv7 is driven by the characteristic object scales and aspect ratios of EDDA buildings, and the choice of 1024 × 1024 tiles at 15 cm GSD directly reflects remote sensing deployment constraints.
2.2. Experiment Setup
All models employed in this study, including the RTMDet, YOLOv7, and YOLOv8 detectors, and the CCT, EfficientNet, and ResNet classifiers, were selected for their lightweight architectures, aligning with the computational constraints inherent in rapid post-disaster assessment. While a comprehensive FLOPs or latency benchmark for every model combination was beyond the scope of this comparative study, all experiments were conducted within a standardized software and hardware environment. This approach ensures a fair relative comparison of performance metrics, allowing for qualitative assessment of efficiency trade-offs between the Multi-class Object Detection (MCOD) and the two-stage pipeline approaches. The modularity of the two-stage pipeline, where detection operates on 1024 × 1024 tiles and classification on cropped building patches, inherently bounds the additional computational overhead, making it suitable for deployment in resource-constrained scenarios.
At the same time, we acknowledge that the decoupled design implies that detection errors cannot be corrected downstream and that no low- or mid-level features are shared between localization and classification, so missed or poorly localized buildings will directly propagate to the damage classification stage; this trade-off between modularity and potential error accumulation is revisited in the Discussion
To obtain stable and competitive configurations for each architecture, we performed an extensive, heuristic exploration of hyperparameters, including optimizer choice (e.g., Adam, AdamW, SGD), learning rate values and schedules, batch sizes, and data augmentations. The same general search strategy was applied across all detectors (RTMDet, YOLOv7, YOLOv8) and classifiers (CCT, EfficientNet, ResNet), and final configurations were selected based on validation performance and convergence stability. Unfortunately, the original training code base and logs from this tuning phase are no longer available, and we therefore cannot reliably reconstruct and report the exact numerical settings (precise number of epochs, per-model learning rates, batch sizes, and schedule parameters) for each final model. To avoid introducing unverifiable or potentially inaccurate values, we describe the training protocol at this level of detail and emphasize that all methods were tuned under a consistent procedure on identical data splits, with shared preprocessing and augmentation pipelines. The comparative conclusions in this work thus rely on consistently applied experimental protocols rather than on a specific, fixed hyperparameter configuration.
2.2.1. Multi-Class and Single-Class Object Detection
To establish a solid baseline for both multi-class object detection and single class detection as a localization method, the MMYolo [
78] platform within the broader OpenMMLab framework was utilized to construct the evaluation pipeline for the evaluation of multiple detection architectures. We chose MMYOLO as the training environment due to its modular design and comprehensive support for the YOLO family of algorithms. Training pipelines were standardized across different model variants, allowing for fair comparisons between architectures. Three well-known lightweight multi-class object detection networks were examined, RTMDet, YOLOv7, and YOLOv8 mentioned in
Section 1.3, all of which are implemented within the MMYolo toolbox.
An empirical evaluation was conducted to determine optimal training initialization strategies by comparing models initialized with COCO-pretrained weights against those with random parameter initialization. The former approach leverages transfer learning to potentially accelerate convergence through pretrained feature extractors learned from the extensive COCO dataset, while the latter develops representations exclusively from task-specific data. This comparative analysis aimed to quantify the efficacy of domain transfer versus domain-specific learning, particularly given the substantial distributional shift between source and target domains. The investigation provides insights into whether cross-domain knowledge transfer offers performance advantages over task-specific representation learning in contexts with significant domain disparities. Each model’s training configuration was inherited from its respective COCO-tuned model during transfer learning experiments, including typical hyper-parameters such as the loss function, learning rate, learning rate scheduling and optimizer settings. For randomly initialized runs, only the learning rates were changed, facilitating quicker model convergence.
Additionally, we conducted comparative testing between two dataset configurations: one containing only the three target classes (undamaged building, damaged building and destroyed building), and another incorporating the same three target classes plus an additional non-target class, that contained object that visually resembled buildings. This experimental design allowed us to evaluate whether the inclusion of a non-target class would improve the models’ ability to distinguish between visually similar objects. This was evaluated to determine its effect on model robustness and detection performance, specifically in terms of reducing false positives and improving classification accuracy for the target classes.
To address the known sensitivity of YOLO models to anchor generation methods, particularly when detecting objects with atypical aspect ratios or size distributions, three anchor optimization techniques were implemented and compared for YOLOv7. (1) K-means clustering groups object dimensions to generate anchors that match the statistical distribution of object sizes; (2) V5k-means clustering enhances this process by incorporating binary K-means and architectural constraints tailored to YOLOv7’s multi-head detection design; (3) Differential Evolution iteratively refines anchor dimensions by optimizing their alignment with ground truth boxes. These techniques target improved detection robustness on challenging objects, as seen in benchmark datasets like COCO, PASCAL VOC, Open Images, VisDrone, and DOTA, all of which include a wide range of object shapes and sizes that test anchor effectiveness under varied real-world conditions.
2.2.2. Classification Networks Setup
To evaluate the proposed image classification models for the task of building damage classification, explained in
Section 1.4 an training and evaluation pipeline was developed. The models were sourced from two primary repositories: the established TorchVision library [
77] and a more recent Compact Convolutional Transformer (henceforth CCT) architecture repository [
79]. TorchVision provided standardized implementations of conventional CNNs with consistent preprocessing and optimization frameworks. To ensure methodological uniformity, the CCT model was integrated into this same TorchVision pipeline, enabling identical data augmentation, training procedures, and evaluation metrics across all models. This integration allowed for direct performance comparisons between traditional convolutional approaches and the transformer-based CCT, maintaining computational efficiency for resource-constrained environments.
The classification models were evaluated using two initialization strategies: random and pretrained ImageNet weight initialization, allowing us to assess whether transfer learning benefits extended to the classification task despite domain differences. Similarly to the setup for multi-class object detection, we tested classification performance with and without a negative class to determine if the inclusion of non-target examples improved discrimination capabilities and reduced false positives for the previously mentioned target classes (undamaged building, damaged building and destroyed building).
Prior to the main experimental analysis, and consistent with the general hyperparameter exploration described in
Section 2.2, a preliminary heuristic optimization phase was conducted to determine effective training configurations for the classification models. Through this we identified optimal hyperparameters including optimizer selection (comparing Adam, AdamW, and SGD), learning rate values and schedules (step decay versus cosine annealing), appropriate batch sizes, and loss function formulations (categorical cross-entropy with and without class-balanced weights). Similarly, three augmentation strategies were evaluated: geometric transformations, photometric transformations, and a combined approach. The best-performing configuration from this preliminary phase was then applied consistently across all subsequent experiments to ensure fair comparisons between model architectures, initialization strategies and class configurations.
2.2.3. Two-Step Pipeline—Object Detection as a Localization Method + Image Classification Setup
To evaluate our proposed two-step approach for building damage assessment, we developed an integrated pipeline that first uses single-class object detection to localize buildings, followed by specialized image classification to categorize the level of damage. This modular setup allows each stage to be optimized separately while still functioning together as a cohesive, end-to-end system.
The pipeline begins with a single-class object detection model that identifies and localizes all buildings within an aerial image, regardless of damage state. For this localization component, we utilized the best-performing model from our single-class detection experiments, which was trained to recognize buildings as a unified category without damage differentiation. This approach simplifies the detection task, potentially improving recall for building instances that might be missed in a multi-class framework due to ambiguous damage characteristics.
Following building localization, the pipeline extracts individual building instances using the predicted bounding boxes, creating cropped images centered on each detected structure. These cropped images are then processed by the classification component, which assigns damage labels—undamaged, damaged, or destroyed—to each building instance. To evaluate and compare their performance within the full pipeline, we employed all previously trained image classification models for this task.
To ensure fair comparison with the multi-class detection approach, both components of the pipeline were trained and evaluated using identical data splits. Same as with the MCOD, we employ Non-Maximum Suppression (NMS) with a threshold of 0.5 to eliminate redundant detections while preserving distinct instances. For integrating detection and classification confidences, multiple fusion strategies were evaluated, including multiplication, minimum value selection, geometric mean, and weighted averaging. For weighted averaging, we used manually chosen weights on detection and classification scores, reflecting the operational preference for slightly prioritizing correct building localization over damage labeling in ambiguous cases. Confidence multiplication was selected as the default approach as it represents the joint probability of correct detection and classification, providing a balanced assessment that penalizes both low detection and classification confidences equally. This method ensures that high performance is only achieved when both pipeline components perform well, preventing scenarios where strong performance in one stage could mask deficiencies in the other—for instance, accurate object detection with uncertain damage classification, or confident classification applied to uncertainly localized buildings—thus enabling fair comparison across different model combinations.
This two-step architecture offers several potential advantages over direct multi-class detection: it allows each model to focus on a specialized task, enables independent optimization of localization and classification components, and provides flexibility for incorporating different model architectures tailored to each sub-task. By comparing this pipeline against multi-class detection models trained on identical data, we could systematically evaluate whether task decomposition improves overall building damage assessment accuracy.
3. Results
Evaluation and comparison of the experiments described in
Section 2.2 followed a structured four-step approach: (1) establishing a baseline by identifying the best-performing multi-class object detection (MCOD) model based on architecture, initialization strategy, and class composition; (2) determining the optimal single-class object detection model for building localization alongside the most effective classification network, demonstrating task-specific performance capabilities; (3) identifying the best pipeline configuration by combining the top-performing components; and (4) conducting comparative analysis between the optimized pipeline and the baseline MCOD approach to assess relative performance advantages.
The object detection models, both MCOD and OD for localization, were evaluated through both quantitative and qualitative approaches. Quantitatively, we employed well-established performance metrics including mean Average Precision (mAP[0.5:0.95]) and per-class Average Precision (AP[0.5:0.95]) across IoU thresholds. We also assessed classification performance at optimal confidence thresholds to simulate real-world deployment scenarios. Qualitatively, we conducted comparative analyses of inference results across the entire test set, with particular attention to challenging edge cases that highlight the practical differences between model configurations.
3.1. Evaluation of Multi-Class Object Detection: Building Detection and Damage Assessment
Looking at
Table 1, the YOLOv7 and RTMDet architectures with pretrained weights consistently outperform other configurations, with YOLOv7_L using kmeans-anchors showing the highest overall performance (AP[50:95] of 0.455). Among the top five performing models, YOLOv7 variants occupy four positions, demonstrating this architecture’s effectiveness for building damage detection. RTMDet also performs competitively, particularly with pretrained weights, ranking fourth among all tested configurations.
Models initialized with pretrained weights significantly outperformed their randomly initialized counterparts across all architectures, with an average mAP[50:95] of 0.447 compared to 0.431 for randomly initialized models, and a 1.5% difference in mAP[50:95] between the best-performing models of each group. This 3.8% average performance gap highlights the value of transfer learning from COCO-pretrained weights, which provides better feature representations despite domain differences between natural objects and damaged buildings. The performance advantage of pretrained models is consistent across all tested architectures and class configurations, suggesting that the general feature extraction capabilities learned from COCO are beneficial for aerial building damage assessment.
Models trained with 4-class configurations (undamaged, damaged, destroyed, and not-a-building) slightly outperform 3-class models (without the not-a-building class) in detection metrics, with an average mAP[0.50:0.95] of 0.441 vs. 0.437 between groups; however, this difference is relatively small compared to the impact of initialization strategy. To better understand performance under class imbalance, we therefore analyse per-class AP and F1 scores reported in
Table 1 and
Table 2. For both the 3-class and 4-class settings, undamaged buildings (C1) are detected most accurately (AP[0.50:0.95] around 0.62), followed by damaged (C2; around 0.45), while destroyed buildings (C3) achieve substantially lower scores (around 0.25), reflecting their minority status and the higher visual variability of heavily fragmented structures. The consistently lower performance on destroyed buildings across all models thus captures both the inherent difficulty of this class and the effect of class imbalance in the EDDA dataset.
3.2. Task Specific Evaluation: Object Detection for Localization and Image Classification for Damage Assessment
Based on the results shown in
Table 3, the YOLOv8 and RTMDet architectures with pretrained weights demonstrate superior performance across all evaluation criteria. RTMDet with pretrained weights achieves the highest overall detection performance (AP[50:95] of 0.655), closely followed by YOLOv8 pretrained (0.650) and YOLOv7 with v5kmeans-anchors (0.649). Among the top five performing models, YOLOv7 variants occupy two positions while YOLOv8 and RTMDet each claim strong positions, indicating robust performance across different architectural approaches for building damage detection.
Similarly to the MCOD experiments, models initialized with pretrained weights significantly outperform their random initialized counterparts across all architectures, with an average mAP[50:95] of 0.628 compared to 0.603 for random initialized models. This 4.1% performance improvement is consistent with the results from MCOD and demonstrates the substantial value of transfer learning from COCO-pretrained weights, providing better feature representations despite domain differences between natural objects and aerial building detection. The consistent performance advantage of pretrained models across YOLOv7, YOLOv8, and RTMDet architectures suggests that general object detection capabilities learned from COCO effectively transfer to specialized detection tasks.
Interestingly, in contrast to the MCOD approach, models trained with the original 3-class dataset labels (undamaged, damaged, destroyed) substantially outperform those trained with 4-class labels (including the ‘not-a-building’ category) in detection metrics, with an average AP[50:95] of 0.638 versus 0.593, respectively. This 7.6% performance difference suggests that the inclusion of the “not-a-building” class may introduce classification complexity that reduces overall detection accuracy, for the specific task of target class building localization.
Evaluating image classification models for building damage assessment, shown in
Table 4, reveals that leveraging pretrained weights and advanced architectures, such as Compact Convolutional Transformers (CCT) and EfficientNet variants (B4, B5, and V2), substantially enhances performance, particularly for challenging and classes with smaller dataset representation. Across both three-class and four-class tasks, pretrained models consistently achieved the highest macro and weighted F1 scores, with CCT_14_7x2_384 reaching a macro F1 of 0.91 and a weighted F1 of 0.94.
The “undamaged” class was classified with high accuracy (F1 scores of 0.91–0.97) across all models and class configurations, while the “damaged” and “destroyed” categories exhibited lower and more variable F1 scores, especially in models trained from scratch or when a fourth, negative class (“not-a-building”) was introduced. The inclusion of this negative class generally led to a modest reduction in overall F1 scores, reflecting increased task complexity and class imbalance, though the negative class itself was classified with high F1 scores (up to 0.93 for pretrained models). Increasing input resolution and employing more sophisticated architectures further improved results, with CCT and EfficientNet outperforming ResNet models in most scenarios. These findings underscore the critical role of transfer learning, model architecture, and class definition in achieving robust performance, particularly in imbalanced datasets where accurate identification of minority and nuanced damage categories is essential.
3.3. Evaluation of the Proposed Pipeline: Sequential Building Localization and Building Damage Classification
To test the performance of the pipeline for automated building damage assessment an extensive evaluation of 640 model combinations across multiple object detection and classification architectures. The experimental framework systematically evaluated the integration of state-of-the-art object detection models (YOLOv7, YOLOv8, and RTMDet) with advanced image classification architectures (CCT_14, EfficientNet variants, and ResNet models) across different class configurations and initialization strategies. Across these configurations, we also compared the aforementioned fusion rules (multiplication, minimum, geometric mean, and weighted averaging) and observed only modest differences in overall performance, with confidence multiplication consistently achieving competitive or best mAP and F1 values; as a result, it was adopted as the default fusion strategy in all reported top configurations.
The experimental evaluation, visible in
Table 5 and
Table 6, demonstrates that the pipeline combining object detection and classification models achieves competitive performance across multiple damage assessment categories. The comprehensive evaluation revealed substantial performance variations across model combinations, with mAP[50:95] scores ranging from 0.251 to 0.478 and F1 scores spanning from 0.747 to 0.863. This performance spectrum encompasses 0.227 mAP points and 0.116 F1 score points across all evaluated configurations. More specifically, the mAP[50:95] ranges from 0.393 to 0.468 across different model combinations, with the best-performing configuration being RTMDet initialized with COCO weights and trained on three damage classes in combination with CCT_14_7x2_224 initialized with ImageNet weights and also trained on three damage classes, achieving an AP of 0.478. Correspondingly, F1 scores range from 0.759 to 0.863, with YOLOv7 with differential evolution anchors and pretrained weights + CCT_14 pretrained (4-class) achieving the highest F1 score of 0.863.
Pretrained models demonstrated statistically significant superior performance compared to randomly initialized models, consistently outperforming their randomly initialized counterparts across all evaluation metrics. Pretrained models achieved an average mAP of 0.456 compared to 0.394 for scratch-initialized models (15.9% improvement, p < 0.001). F1 scores showed consistent enhancement, with pretrained models achieving 0.838 compared to 0.817 for scratch models (2.2 percentage point improvement, p < 0.001). The performance gap is particularly pronounced in classification F1 scores, where pretrained models show improvements of 2–5 percentage points over randomly initialized variants. For detection metrics, pretrained YOLOv8 models achieve AP values 3–6% higher than randomly initialized versions. This improvement is most evident in the “undamaged” and “damaged” classes, where pretrained models achieve F1 scores of 0.87–0.93 compared to 0.83–0.87 for randomly initialized models.
YOLOv8 models demonstrate modest improvements over YOLOv7 variants, achieving an average mAP[0.50:0.95] of 0.429 compared to 0.421 for YOLOv7 (1.8% performance gain), and consistently outperforming YOLOv7 variants in detection tasks with 2–3% improvements in overall AP scores. RTMDet architectures exhibit competitive performance, with an average mAP[0.50:0.95] of 0.428.
For the classification components, transformer-based classifiers (CCT variants) demonstrate slightly superior performance compared to CNN-based alternatives (EfficientNet variants) for the task of building damage classification of detected building regions. CCT models achieve the highest average F1 score of 0.831, followed by EfficientNet variants at 0.829, while ResNet architectures show solid performance with an average F1 score of 0.820. Within the ResNet family, ResNet-50 models slightly outperform ResNet-34 variants (0.824 vs. 0.816 average F1), and pretrained ResNet models reach 0.825 average F1 compared to 0.805 for scratch-initialized variants. In all cases, we report both macro- and weighted-average F1 scores to explicitly account for class imbalance, ensuring that performance on minority classes is not obscured by the dominance of undamaged buildings.
The 4-class configuration yields superior F1 scores, with an average of 0.841 compared to 0.813 for the 3-class approach (2.7 percentage point improvement). Across architectures, the 4-class classification approach generally outperforms 3-class variants by 1–2% in F1, suggesting that the additional granularity introduced by the explicit “not-a-building” class provides discriminative information that benefits the overall assessment task. However, mAP[0.50:0.95] scores remain comparable between configurations (0.423 for 4-class vs. 0.426 for 3-class), indicating that the main gains manifest in classification quality rather than in localization performance. ResNet models, in particular, show a stronger preference for the 4-class configuration, achieving an average F1 of 0.830 in 4-class settings compared to 0.810 in 3-class configurations.
Performance varies substantially across damage categories, revealing inherent challenges in damage assessment and the increasing difficulty of accurately identifying more severe damage states under class imbalance. Undamaged buildings achieve the highest detection and classification accuracy, with an average F1 score of 0.864 and AP[0.50:0.95] values ranging from 0.63 to 0.66, and F1 scores between 0.83 and 0.93 across different model combinations. Damaged structures attain an average F1 score of 0.823, with AP values of 0.42–0.51 and F1 scores of 0.71–0.88, reflecting moderate but relatively stable performance. Destroyed buildings represent the most challenging category, with an average F1 score of only 0.489 and AP values in the range 0.14–0.26, resulting in a performance gap of 0.375 F1 points compared to undamaged buildings. This systematic performance hierarchy (C1 > C2 > C3) reflects both the increasing visual complexity of more severe damage and the impact of class imbalance in the EDDA dataset, particularly for the minority “destroyed” class.
4. Discussion
Based on the comprehensive experimental results presented, the comparison between multi-class object detection (MCOD) and the proposed two-stage pipeline approach reveals nuanced performance trade-offs that have significant implications for automated building damage assessment deployment strategies. The pipeline approach, with its best configuration (YOLOv8 pretrained + CCT_14 pretrained) achieving an mAP of 0.468 and F1 score of 0.863, demonstrates only modest improvements over the top-performing MCOD baseline (YOLOv7 pretrained) which achieved an mAP of 0.455. However, this relatively small aggregate performance difference masks important architectural advantages that become apparent when examining task-specific capabilities and deployment flexibility. The pipeline’s modular design allows for independent optimization of detection and classification components, enabling practitioners to fine-tune each stage according to specific operational requirements or adapt to new damage categories without retraining the entire system. This modularity proves particularly valuable in disaster response scenarios where rapid adaptation to different types of structural damage or varying image quality conditions may be necessary.
The pipeline approach demonstrates superior performance in building localization tasks, with the best single-class detection models (RTMDet pretrained achieving AP of 0.655) significantly outperforming MCOD variants in pure detection accuracy. This improvement suggests that when the detection task is decoupled from classification, models can focus more effectively on identifying building boundaries and locations without the competing objective of simultaneously determining damage states. Conversely, the specialized classification networks, particularly transformer-based architectures like CCT, achieve exceptional performance on damage classification of localized building regions with macro F1 scores reaching 0.91, indicating that dedicated classification models can leverage focused attention mechanisms more effectively than the shared feature representations in the tested MCOD approaches. The pipeline’s ability to process higher-resolution inputs for classification while maintaining efficient detection at lower resolutions also provides computational advantages, allowing for more detailed damage assessment without proportionally increasing inference time.
From an architectural perspective, the two-stage pipeline necessarily forgoes the feature sharing that characterizes integrated MCOD architectures such as Faster R-CNN or single-stage multi-class YOLO variants, where a single backbone jointly supports localization and damage classification. In our setup, detection and classification operate on separate networks, which prevents reuse of shared low- and mid-level representations but enables task-specific specialization and independent model updates. The empirical results suggest that, under the UAV-based EDDA conditions, this loss of shared features does not translate into a clear performance penalty at the aggregate level: the best pipeline configuration achieves comparable mAP to the MCOD baseline (0.468 vs. 0.455) and substantially higher single-class localization AP (up to 0.655). However, the modular design introduces a different limitation, namely error propagation: buildings that are missed or poorly localized by the detector cannot be recovered by the classifier, and misaligned bounding boxes directly degrade damage predictions. These effects are an inherent trade-off between the interpretability and flexibility of a modular system and the tighter integration of end-to-end MCOD models.
While both approaches benefit substantially from transfer learning, with pretrained models showing 3–6% improvements in detection tasks and 2–5% in classification F1 scores, the pipeline architecture appears to leverage pretrained weights more effectively, particularly in the classification stage where transformer-based models demonstrate superior performance compared to CNN alternatives. The pronounced performance differences across damage categories, “undamaged” (F1: 0.83–0.93), “damaged” (F1: 0.71–0.88), and “destroyed” (F1: 0.21–0.66), remain consistent across both approaches, though the pipeline shows slightly better performance on the challenging “destroyed” class, suggesting that the specialized classification stage may provide marginal improvements for the most difficult damage categories. Despite these advantages, while the two-stage pipeline introduces additional computational complexity through its modular architecture, the inference time overhead remains manageable when employing lightweight classification models such as CCT or EfficientNet variants. These efficient architectures enable the pipeline to maintain competitive processing speeds while delivering superior task-specific performance, making the approach viable even in resource-constrained disaster response scenarios where both accuracy and rapid processing are critical for effective damage assessment at scale.
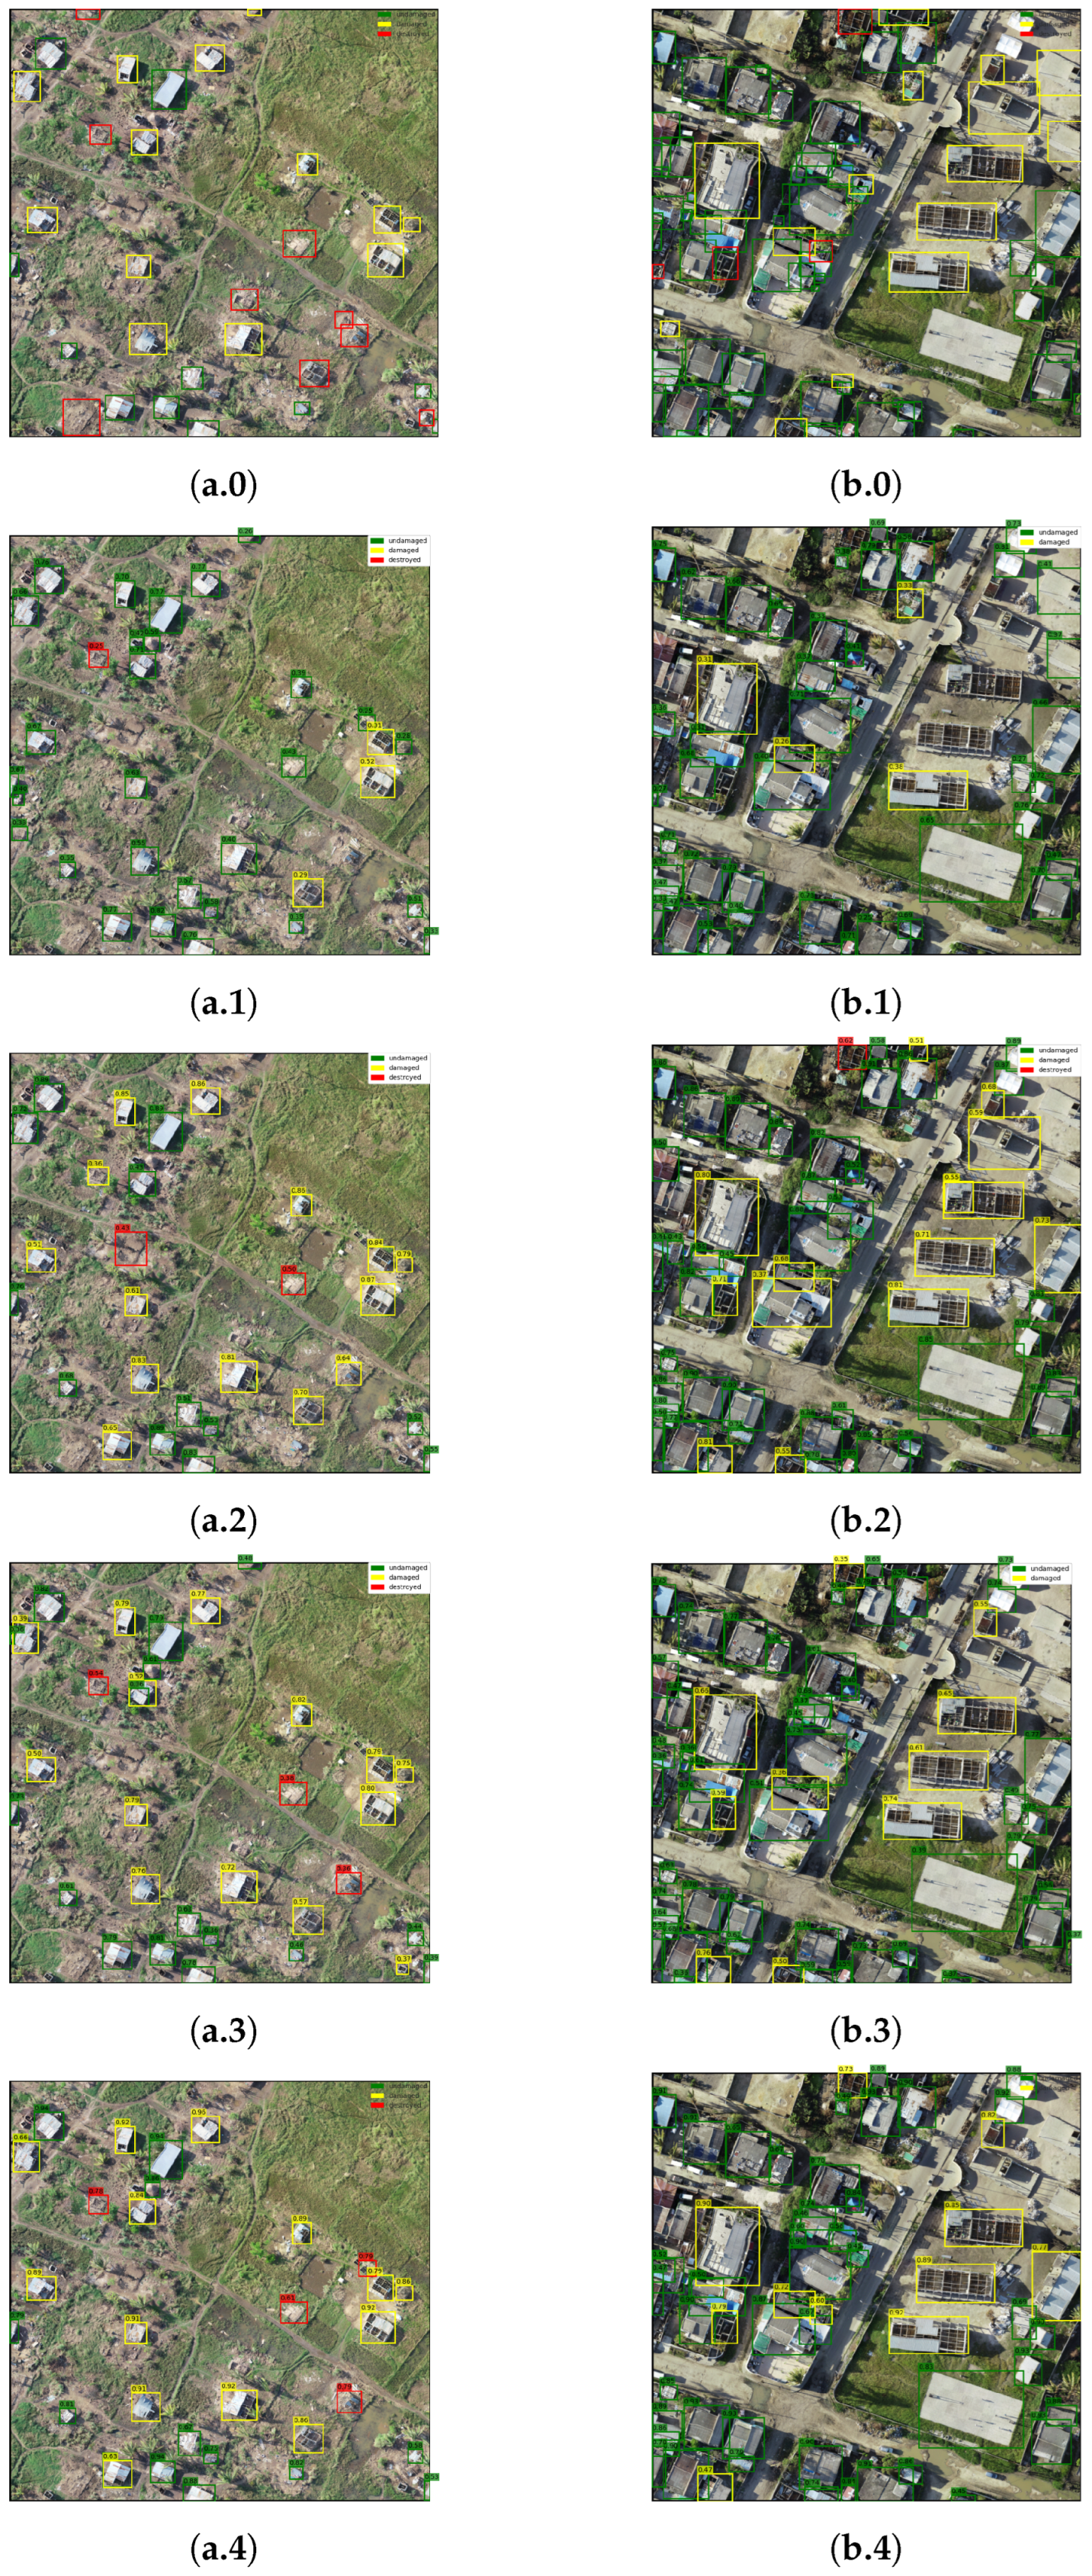
Figure 4 presents a qualitative comparison of building damage assessment performance across rural and urban tiles from the EDDA dataset, showcasing ground truth labels alongside inference results from the best-performing MCOD model and three pipeline variants (worst, middle, and best) ranked according to their COCO metrics. Inference was conducted using 0.5 NMS and confidence thresholds optimized for best COCO performance on the test set for both MCOD and sequential OD followed by classification pipelines. The three pipeline results demonstrate a progressive improvement in alignment with ground truth, consistent with their respective COCO metric rankings. While building localization remains relatively stable across pipelines, there is a clear refinement in damage classification accuracy from worst to best performing models. The notably lower confidence values observed in pipeline predictions are attributed to the multiplicative calculation of detection and classification confidences, which inherently reduces final confidence scores. A key advantage of the pipeline approach is the detection of buildings as a single class, enabling non-maximum suppression (NMS) across all building detections and effectively eliminating overlaps between class predictions.
In rural settings, buildings constructed from natural materials present persistent challenges for both MCOD and pipeline approaches, with destroyed clay brick structures being particularly difficult to distinguish from dirt roads (visible in
Figure 1), as evidenced by discrepancies between ground truth and inference results in the bottom left and middle portions of the rural example. Furthermore, urban environments benefit significantly from the single-class NMS approach, as dense detections with overlapping bounding boxes are common in such settings. Urban areas also present unique challenges, where the high density of buildings and similarities in roofing and foundation materials lead to frequent misclassifications of incomplete structures or non-building objects as undamaged buildings, particularly when they exhibit smooth morphological surfaces, such as the cement playground visible in the bottom right of the urban example. Additionally, the destroyed building class is problematic, especially in the case of smaller structures, where the remnants often resemble ordinary debris piles—features that are not uncommon in the imagery and can easily be misinterpreted by both models and human annotators.
Beyond immediate post-disaster damage assessment, the insights derived from this comparative analysis, particularly regarding the efficacy of single-class localization, hold relevance for a broader spectrum of remote sensing applications. These include general building mapping, infrastructure exposure assessment, and the integration of building data with multi-hazard risk models, such as the Africa Exposure model. The modularity and adaptability of the proposed pipeline offer a robust framework for diverse geospatial intelligence tasks requiring precise object identification and classification.
5. Conclusions
This study systematically evaluated a two-stage pipeline for post-disaster building damage assessment using high-resolution aerial imagery, comparing its performance against a conventional multi-class object detection (MCOD) approach used as a baseline. Using the EDDA dataset, which was specifically designed to represent rural and urban post-disaster African regions with annotated building damage data, we utilized well-established lightweight object detectors (RTMDet, YOLOv7, YOLOv8) for building localization and a mix of SOTA and standard image classification models (CCT, EfficientNet, ResNet) for damage categorization under a variety of training and data configurations.
Our results demonstrate that the proposed two-stage pipeline offers several distinct advantages over the baseline MCOD approach. While the best pipeline configuration, RTMDet_l with initialized COCO weights trained on 3 damage classes in combination with the CCT_14_7x2_224 initialized with ImageNet weights and trained on 3 classes, achieved a slightly higher mAP (0.478) than the top MCOD baseline (YOLOv7 initialized with COCO weights and trained with 3 damage classes and a “not a building” class, mAP 0.455), the pipeline’s modularity enabled superior building localization (AP up to 0.655) and more accurate damage classification, especially for challenging and minority classes. The ability to independently optimize detection and classification networks, and to flexibly adapt to new damage categories or operational requirements, makes the pipeline approach suitable and effective for real-world disaster response scenarios.
Transfer learning from large-scale datasets (COCO, ImageNet) consistently improved performance across both detection and classification tasks, underscoring the value of pretrained models even in specialized domains. However, persistent challenges remain, particularly in accurately identifying severely damaged or destroyed buildings and in handling visually ambiguous cases in both rural and urban environments.
Our results suggest three practical guidelines for post-disaster damage assessment on UAV imagery: first, decoupling localization and classification consistently improves building localization quality and enables independent model updates; second, including a “not-a-building” class benefits multi-class detection but degrades single-class localization performance, advising task-specific dataset design; and third, compact transformer-based classifiers provide superior damage discrimination for minority damage classes compared to conventional CNNs under the same data and training budget.
A limitation of this study is that all experiments are conducted on EDDA, a single post-disaster dataset from Mozambique. While EDDA was explicitly designed to capture both rural and urban African building typologies, we do not claim cross-hazard or cross-region generalization. Instead, we position our results as an in-depth case study that yields design recommendations for EDDA-like UAV-based building damage scenarios.
In summary, the proposed two-stage pipeline demonstrates a promising direction for scalable, accurate, and robust post-disaster building damage assessment, offering notable advantages in task-specific accuracy, adaptability, and deployment flexibility compared to the baseline MCOD approach.
Future work will focus on further improving classification of minority damage categories, integrating additional contextual and temporal information, and explicitly evaluating cross-scene and cross-event transfer, for example from EDDA to xBD, xView, or mwBTFreddy, as well as exploring real-time deployment in operational disaster response settings. An additional promising direction is to replace the hand-crafted fusion rules between detection and classification confidences with a compact learning-based fusion module that can adapt fusion weights to image context and class imbalance.
Author Contributions
Conceptualization, D.H. and V.P.; methodology, D.H.; software, D.H.; validation, D.H.; formal analysis, D.H.; investigation, D.H. and V.P.; resources, M.R. and H.H.; data curation, D.H.; writing—original draft preparation, D.H.; writing—review and editing, D.H., V.P., M.R. and H.H.; visualization, D.H.; supervision, M.R. and H.H.; project administration, M.R.; funding acquisition, M.R. All authors have read and agreed to the published version of the manuscript.
Funding
This research received no external funding.
Data Availability Statement
The datasets supporting the findings of this study are derived from the EDDA–Mozambique post-disaster building damage dataset [
18]. The dataset can be requested via the Fordatis record at
http://doi.org/10.24406/fordatis/296 and is associated with DOI 10.1117/12.2683882.
Acknowledgments
We extend our sincere gratitude to the supporters and collaborative partners whose essential support made this research endeavor possible. The work presented in this paper was conducted with the support and steadfast commitment of the Fraunhofer-Zukunftsstiftung (Fraunhofer Future Foundation), whose dedication to the importance of our research enabled us to advance from conceptualization to final publication. Furthermore, we acknowledge the invaluable contributions of our international partners who facilitated broader collaborative initiatives and supported dataset development activities. We are grateful to the European Union Humanitarian Aid (ECHO), the Government of Belgium, and the WFP Mozambique Country Office for their co-financing of dataset preparation workshops and their partnership in humanitarian-focused research efforts. This research builds upon the EDDA dataset, whose creation was made possible through the collaborative efforts of several key organizations. We recognize the substantial contributions of the European Union Humanitarian Aid (ECHO), the Government of Belgium, INGD CENOE, and WFP Mozambique Country Office, who provided essential drone orthomosaic imagery and facilitated the dataset annotation process. Special recognition is also due to the dedicated students who participated in the annotation workshops conducted at INGD CENOE in Maputo during June 2019 and December 2022, whose meticulous work was fundamental to the creation of our research dataset.
Conflicts of Interest
The authors declare no conflicts of interest.
References
- Howald, E.; Francone, L.; Martinelli, D. Vulnerability assessment of buildings to landslides: Application to Swiss case studies. In Proceedings of the XVIII European Conference on Soil Mechanics and Geotechnical Engineering, Lisbon, Portugal, 26–30 August 2024. [Google Scholar]
- Hatic, D.; Rauhut, M.; Polushko, V.; Codastefano, M.; Rosa, S.; McKay, P.; Stompanato, F.; Beleza, A.; Hagen, H. Disaster impact analysis in Africa: EDDA—UAV building damage dataset of rural and urban Mozambique. In Proceedings of the Earth Resources and Environmental Remote Sensing/GIS Applications XIV, Amsterdam, The Netherlands, 3–6 September 2023; Schulz, K., Michel, U., Nikolakopoulos, K.G., Eds.; International Society for Optics and Photonics, SPIE: Bellingham, WA, USA, 2023; Volume 12734, p. 127340G. [Google Scholar] [CrossRef]
- Polushko, V.; Jenal, A.; Bongartz, J.; Weber, I.; Hatic, D.; Rösch, R.; März, T.; Rauhut, M.; Weinmann, A. BlessemFlood21: A High-Resolution Georeferenced Dataset for Advanced Analysis of River Flood Scenarios. IEEE Access 2024, 12, 176389–176405. [Google Scholar] [CrossRef]
- Delforge, D.; Below, R.; Wathelet, V.; Jones, R.; Tubeuf, S.; Speybroek, N. 2023 Disasters in Numbers. Available online: https://reliefweb.int/attachments/305f0dbc-ee04-4631-a518-0238240c41aa/2023_EMDAT_report.pdf (accessed on 15 January 2025).
- Agbaje, T.; Abomaye-Nimenibo, N.; Ezeh, C.; Bello, A.; Olorunnishola, A. Building Damage Assessment in Aftermath of Disaster Events by Leveraging Geoai (Geospatial Artificial Intelligence): Review. World J. Adv. Res. Rev. 2024, 23, 667–687. [Google Scholar] [CrossRef]
- Xia, H.; Wu, J.; Yao, J.; Zhu, H.; Gong, A.; Yang, J.; Hu, L.; Mo, F. A Deep Learning Application for Building Damage Assessment Using Ultra-High-Resolution Remote Sensing Imagery in Turkey Earthquake. Int. J. Disaster Risk Sci. 2023, 14, 947–962. [Google Scholar] [CrossRef]
- Zou, R.; Liu, J.; Pan, H.; Tang, D.; Zhou, R. An Improved Instance Segmentation Method for Fast Assessment of Damaged Buildings Based on Post-Earthquake UAV Images. Sensors 2024, 24, 4371. [Google Scholar] [CrossRef]
- Gupta, R.; Shah, M. RescueNet: Joint Building Segmentation and Damage Assessment from Satellite Imagery. In Proceedings of the 2020 25th International Conference on Pattern Recognition (ICPR), Milan, Italy, 10–15 January 2021; pp. 4405–4411. [Google Scholar] [CrossRef]
- Xie, Z.; Zhou, Z.; He, X.; Fu, Y.; Gu, J.; Zhang, J. Methodology for Object-Level Change Detection in Post-Earthquake Building Damage Assessment Based on Remote Sensing Images: OCD-BDA. Remote Sens. 2024, 16, 4263. [Google Scholar] [CrossRef]
- Liu, J.; Luo, Y.; Chen, S.; Wu, J.; Wang, Y. BDHE-Net: A Novel Building Damage Heterogeneity Enhancement Network for Accurate and Efficient Post-Earthquake Assessment Using Aerial and Remote Sensing Data. Appl. Sci. 2024, 14, 3964. [Google Scholar] [CrossRef]
- Diao, Z.; Huang, X.; Liu, H.; Liu, Z. LE-YOLOv5: A Lightweight and Efficient Road Damage Detection Algorithm Based on Improved YOLOv5. Int. J. Intell. Syst. 2023, 2023, 1–17. [Google Scholar] [CrossRef]
- Shen, Y.; Zhu, S.; Yang, T.; Chen, C.; Pan, D.; Chen, J.; Xiao, L.; Du, Q. BDANet: Multiscale Convolutional Neural Network With Cross-Directional Attention for Building Damage Assessment From Satellite Images. IEEE Trans. Geosci. Remote Sens. 2022, 60, 5402114. [Google Scholar] [CrossRef]
- Gu, J.; Xie, Z.; Zhang, J.; He, X. Advances in Rapid Damage Identification Methods for Post-Disaster Regional Buildings Based on Remote Sensing Images: A Survey. Buildings 2024, 14, 898. [Google Scholar] [CrossRef]
- Manzini, T.; Perali, P.; Murphy, R.; Merrick, D. Challenges and Research Directions from the Operational Use of a Machine Learning Damage Assessment System via Small Uncrewed Aerial Systems at Hurricanes Debby and Helene. arXiv 2025, arXiv:2506.15890. [Google Scholar] [CrossRef]
- Chapuma, E.; Mengezi, G.; Msasa, L.; Taylor, A. mwBTFreddy: A Dataset for Flash Flood Damage Assessment in Urban Malawi. arXiv 2025, arXiv:2505.01242. [Google Scholar] [CrossRef]
- Yepes-Estrada, C.; Calderon, A.; Costa, C.; Crowley, H.; Dabbeek, J.; Hoyos, M.; Martins, L.; Paul, N.; Rao, A.; Silva, V. Global Building Exposure Model for Earthquake Risk Assessment. Earthq. Spectra 2023, 39. [Google Scholar] [CrossRef]
- Paul, N.; Silva, V.; Amo-Oduro, D. Development of a uniform exposure model for the African continent for use in disaster risk assessment. Int. J. Disaster Risk Reduct. 2022, 71, 102823. [Google Scholar] [CrossRef]
- Hatic, D.; Rauhut, M.; Polushko, V.; Codastefano, M.; Rosa, S.; McKay, P.; Stompanato, F.; Beleza, A.; Hagen, H. EDDA-Mozambique post disaster building damage dataset. In Proceedings of the Earth Resources and Environmental Remote Sensing/GIS Applications XIV, Amsterdam, The Netherlands, 3–6 September 2023. [Google Scholar] [CrossRef]
- Redmon, J.; Divvala, S.; Girshick, R.; Farhadi, A. You only look once: Unified, real-time object detection. In Proceedings of the IEEE Conference on Computer Vision and Pattern Recognition, Las Vegas, NV, USA, 27–30 June 2016; pp. 779–788. [Google Scholar]
- Girshick, R. Fast R-CNN. In Proceedings of the IEEE International Conference on Computer Vision (ICCV), Santiago, Chile, 7–13 December 2015; pp. 1440–1448. [Google Scholar] [CrossRef]
- Ren, S.; He, K.; Girshick, R.; Sun, J. Faster R-CNN: Towards real-time object detection with region proposal networks. Adv. Neural Inf. Process. Syst. 2015, 28, 91–99. [Google Scholar] [CrossRef]
- Liu, W.; Anguelov, D.; Erhan, D.; Szegedy, C.; Reed, S.; Fu, C.Y.; Berg, A.C. SSD: Single Shot MultiBox Detector. In Proceedings of the European Conference on Computer Vision (ECCV), Amsterdam, The Netherlands, 11–14 October 2016; Springer: Berlin/Heidelberg, Germany, 2016; Volume 9905, pp. 21–37. [Google Scholar] [CrossRef]
- Lin, T.Y.; Goyal, P.; Girshick, R.; He, K.; Doll’ar, P. Focal Loss for Dense Object Detection. IEEE Trans. Pattern Anal. Mach. Intell. 2020, 42, 318–327. [Google Scholar] [CrossRef]
- Huang, J.; Rathod, V.; Sun, C.; Zhu, M.; Korattikara, A.; Fathi, A.; Fischer, I.; Wojna, Z.; Song, Y.; Guadarrama, S.; et al. Speed/Accuracy Trade-offs for Modern Convolutional Object Detectors. In Proceedings of the IEEE Conference on Computer Vision and Pattern Recognition (CVPR), Honolulu, HI, USA, 21–26 July 2017; pp. 3296–3297. [Google Scholar] [CrossRef]
- Bochkovskiy, A.; Wang, C.Y.; Liao, H.Y.M. Yolov4: Optimal speed and accuracy of object detection. arXiv 2020, arXiv:2004.10934. [Google Scholar] [CrossRef]
- Terven, J.; Córdova-Esparza, D.M.; Romero-González, J.A. A Comprehensive Review of YOLO Architectures in Computer Vision: From YOLOv1 to YOLOv8 and YOLO-NAS. Mach. Learn. Knowl. Extr. 2023, 5, 1680–1716. [Google Scholar] [CrossRef]
- Jiao, L.; Zhang, F.; Liu, F.; Yang, S.; Li, L.; Feng, Z.; Qu, R. A Survey of Deep Learning-Based Object Detection. IEEE Access 2019, 7, 128837–128868. [Google Scholar] [CrossRef]
- Cai, Z.; Vasconcelos, N. Cascade R-CNN: Delving into High Quality Object Detection. In Proceedings of the IEEE/CVF Conference on Computer Vision and Pattern Recognition (CVPR), Salt Lake City, UT, USA, 18–23 June 2018; pp. 6154–6162. [Google Scholar] [CrossRef]
- Comert, R.; Küçük Matci, D.; Avdan, U. Detection of Collapsed Building from Unmanned Aerial Vehicle Data with Object Based Image Classification. EskişEhir Tech. Univ. J. Sci. Technol. B Theor. Sci. 2018, 6, 109–116. [Google Scholar] [CrossRef]
- Ge, P.; Gokon, H.; Meguro, K. A review on synthetic aperture radar-based building damage assessment in disasters. Remote Sens. Environ. 2020, 240, 111693. [Google Scholar] [CrossRef]
- Valentijn, T.; Margutti, J.; van den Homberg, M.; Laaksonen, J. Multi-Hazard and Spatial Transferability of a CNN for Automated Building Damage Assessment. Remote Sens. 2020, 12, 2839. [Google Scholar] [CrossRef]
- Calantropio, A.; Chiabrando, F.; Codastefano, M.; Bourke, E. Deep learning for automatic building damage assessment: Application in post-disaster scenarios using UAV data. ISPRS Ann. Photogramm. Remote Sens. Spat. Inf. Sci. 2021, 1, 113–120. [Google Scholar] [CrossRef]
- Yuan, X.; Azimi, S.; Henry, C.; Gstaiger, V.; Codastefano, M.; Manalili, M.; Cairo, S.; Modugno, S.; Wieland, M.; Schneibel, A.; et al. Automated Building Segmentation and Damage Assessment from Satellite Images for Disaster Relief. Int. Arch. Photogramm. Remote Sens. Spat. Inf. Sci. 2021, XLIII-B3-2021, 741–748. [Google Scholar] [CrossRef]
- Fernandez Galarreta, J.; Kerle, N.; Gerke, M. UAV-based urban structural damage assessment using object-based image analysis and semantic reasoning. Nat. Hazards Earth Syst. Sci. 2015, 15, 1087–1101. [Google Scholar] [CrossRef]
- Jing, Y.; Ren, Y.; Liu, Y.; Wang, D.; Yu, L. Automatic Extraction of Damaged Houses by Earthquake Based on Improved YOLOv5: A Case Study in Yangbi. Remote Sens. 2022, 14, 382. [Google Scholar] [CrossRef]
- Bitelli, G.; Camassi, R.; Gusella, L.; Mognol, A.; Creti, D. Image change detection on urban area: The earthquake case. Int. Arch. Photogramm. Remote Sens. Spat. Inf. Sci. 2004, 35, 692–697. [Google Scholar]
- Brunner, D.; Lemoine, G.; Bruzzone, L. Earthquake Damage Assessment of Buildings Using VHR Optical and SAR Imagery. IEEE Trans. Geosci. Remote Sens. 2010, 48, 2403–2420. [Google Scholar] [CrossRef]
- Wan, D.; Lu, R.; Wang, S.; Shen, S.; Xu, T.; Lang, X. YOLO-HR: Improved YOLOv5 for Object Detection in High-Resolution Optical Remote Sensing Images. Remote Sens. 2023, 15, 614. [Google Scholar] [CrossRef]
- Liu, C.; Sui, H.; Wang, J.; Ni, Z.; Ge, L. Real-Time Ground-Level Building Damage Detection Based on Lightweight and Accurate YOLOv5 Using Terrestrial Images. Remote Sens. 2022, 14, 2763. [Google Scholar] [CrossRef]
- Wang, Y.; Feng, W.; Jiang, K.; Li, Q.; Lv, R.; Tu, J. Real-Time Damaged Building Region Detection Based on Improved YOLOv5s and Embedded System From UAV Images. IEEE J. Sel. Top. Appl. Earth Obs. Remote Sens. 2023, 16, 4205–4217. [Google Scholar] [CrossRef]
- Nex, F.; Duarte, D.; Tonolo, F.G.; Kerle, N. Structural Building Damage Detection with Deep Learning: Assessment of a State-of-the-Art CNN in Operational Conditions. Remote Sens. 2019, 11, 2765. [Google Scholar] [CrossRef]
- Azimi, M.; Eslamlou, A.D.; Pekcan, G. Data-Driven Structural Health Monitoring and Damage Detection through Deep Learning: State-of-the-Art Review. Sensors 2020, 20, 2778. [Google Scholar] [CrossRef]
- Koshimura, S.; Moya, L.; Mas, E.; Bai, Y. Tsunami Damage Detection with Remote Sensing: A Review. Geosciences 2020, 10, 177. [Google Scholar] [CrossRef]
- Zhang, Y.; Yuen, K.V. Review of artificial intelligence-based bridge damage detection. Adv. Mech. Eng. 2022, 14, 168781322211227. [Google Scholar] [CrossRef]
- Gupta, R.; Hosfelt, R.; Sajeev, S.; Patel, N.; Goodman, B.; Doshi, J.; Heim, E.; Choset, H.; Gaston, M. xBD: A Dataset for Assessing Building Damage from Satellite Imagery. arXiv 2019, arXiv:1911.09296. [Google Scholar] [CrossRef]
- Maggiori, E.; Tarabalka, Y.; Charpiat, G.; Alliez, P. Can Semantic Labeling Methods Generalize to Any City? The Inria Aerial Image Labeling Benchmark. In Proceedings of the IEEE International Geoscience and Remote Sensing Symposium (IGARSS), Fort Worth, TX, USA, 23–28 July 2017; IEEE: Piscataway, NJ, USA, 2017. [Google Scholar]
- Boguszewski, A.; Batorski, D.; Ziemba-Jankowska, N.; Dziedzic, T.; Zambrzycka, A. LandCover.ai: Dataset for Automatic Mapping of Buildings, Woodlands, Water and Roads from Aerial Imagery. In Proceedings of the IEEE/CVF Conference on Computer Vision and Pattern Recognition (CVPR) Workshops, Nashville, TN, USA, 19–25 June 2021; pp. 1102–1110. [Google Scholar]
- Mnih, V. Machine Learning for Aerial Image Labeling: Massachusetts Building Dataset. Ph.D. Thesis, University of Toronto, Toronto, ON, Canada, 2013. [Google Scholar]
- Zhu, X.; Liang, J.; Hauptmann, A. MSNet: A Multilevel Instance Segmentation Network for Natural Disaster Damage Assessment in Aerial Videos. arXiv 2020, arXiv:2006.16479. [Google Scholar]
- Weir, N.; Lindenbaum, D.; Bastidas, A.; Etten, A.V.; McPherson, S.; Shermeyer, J.; Kumar, V.; Tang, H. SpaceNet MVOI: A Multi-View Overhead Imagery Dataset. In Proceedings of the IEEE/CVF International Conference on Computer Vision (ICCV), Seoul, Republic of Korea, 27 October–2 November 2019. [Google Scholar]
- Shermeyer, J.; Hogan, D.; Brown, J.; Etten, A.V.; Weir, N.; Pacifici, F.; Haensch, R.; Bastidas, A.; Soenen, S.; Bacastow, T.; et al. SpaceNet 6: Multi-Sensor All Weather Mapping Dataset. arXiv 2020, arXiv:2004.06500. [Google Scholar]
- Etten, A.V.; Hogan, D.; Martinez-Manso, J.; Shermeyer, J.; Weir, N.; Lewis, R. The Multi-Temporal Urban Development SpaceNet Dataset. arXiv 2021, arXiv:2102.04420. [Google Scholar]
- Lam, D.; Kuzma, R.; McGee, K.; Dooley, S.; Laielli, M.; Klaric, M.; Bulatov, Y.; McCord, B. xView: Objects in Context in Overhead Imagery. arXiv 2018, arXiv:1802.07856. [Google Scholar] [CrossRef]
- Redmon, J.; Farhadi, A. YOLO9000: Better, faster, stronger. In Proceedings of the IEEE Conference on Computer Vision and Pattern Recognition, Honolulu, HI, USA, 21–26 July 2017; pp. 7263–7271. [Google Scholar]
- Redmon, J.; Farhadi, A. Yolov3: An incremental improvement. arXiv 2018, arXiv:1804.02767. [Google Scholar] [CrossRef]
- Redmon, J. Darknet: Open Source Neural Networks in C. 2013–2016. Available online: http://pjreddie.com/darknet/ (accessed on 1 May 2023).
- Pi, Y.; Nath, N.D.; Behzadan, A.H. Convolutional neural networks for object detection in aerial imagery for disaster response and recovery. Adv. Eng. Inform. 2020, 43, 101009. [Google Scholar] [CrossRef]
- Ma, H.; Liu, Y.; Ren, Y.; Yu, J. Detection of collapsed buildings in post-earthquake remote sensing images based on the improved YOLOv3. Remote Sens. 2019, 12, 44. [Google Scholar] [CrossRef]
- Ma, N.; Zhang, X.; Zheng, H.T.; Sun, J. Shufflenet v2: Practical guidelines for efficient cnn architecture design. In Proceedings of the European Conference on Computer Vision (ECCV), Munich, Germany, 8–14 September 2018; pp. 116–131. [Google Scholar]
- Jocher, G.; Liu, C.; Hogan, A.; Yu, L.; Rai, P.; Sullivan, T. YOLOv5 Version 1.0. Available online: https://github.com/ultralytics/yolov5/releases/tag/v1.0 (accessed on 26 June 2023). [CrossRef]
- Lema, D.G.; Pedrayes, O.D.; Usamentiaga, R.; García, D.F.; Alonso, Á. Cost-performance evaluation of a recognition service of livestock activity using aerial images. Remote Sens. 2021, 13, 2318. [Google Scholar] [CrossRef]
- Zhao, J.; Zhang, X.; Yan, J.; Qiu, X.; Yao, X.; Tian, Y.; Zhu, Y.; Cao, W. A wheat spike detection method in UAV images based on improved YOLOv5. Remote Sens. 2021, 13, 3095. [Google Scholar] [CrossRef]
- Wang, C.Y.; Bochkovskiy, A.; Liao, H.Y.M. YOLOv7: Trainable Bag-of-Freebies Sets New State-of-the-Art for Real-Time Object Detectors. In Proceedings of the IEEE/CVF Conference on Computer Vision and Pattern Recognition (CVPR), Vancouver, BC, Canada, 17–24 June 2023; pp. 7464–7475. [Google Scholar]
- Malagoli, E.; Di Persio, L. 2D Object Detection: A Survey. Mathematics 2025, 13, 893. [Google Scholar] [CrossRef]
- Lyu, C.; Zhang, W.; Huang, H.; Zhou, Y.; Wang, Y.; Liu, Y.; Zhang, S.; Chen, K. RTMDet: An Empirical Study of Designing Real-Time Object Detectors. arXiv 2022, arXiv:2212.07784. [Google Scholar] [CrossRef]
- Varghese, R.; M, S. YOLOv8: A Novel Object Detection Algorithm with Enhanced Performance and Robustness. In Proceedings of the 2024 International Conference on Advances in Data Engineering and Intelligent Computing Systems (ADICS), Chennai, India, 18–19 April 2024; pp. 1–6. [Google Scholar]
- Yaseen, M. What is YOLOv8: An In-Depth Exploration of the Internal Features of the Next-Generation Object Detector. arXiv 2024, arXiv:2408.15857. [Google Scholar]
- Wang, N.; Zhao, Q.; Li, S.; Zhao, X.; Zhao, P. Damage Classification for Masonry Historic Structures Using Convolutional Neural Networks Based on Still Images: Damage classification for masonry historic structures using CNNs. Comput. Aided Civ. Infrastruct. Eng. 2018, 33, 1073–1089. [Google Scholar] [CrossRef]
- Duarte, D.; Nex, F.; Kerle, N.; Vosselman, G. Multi-Resolution Feature Fusion for Image Classification of Building Damages with Convolutional Neural Networks. Remote Sens. 2018, 10, 1636. [Google Scholar] [CrossRef]
- Ma, H.; Liu, Y.; Ren, Y.; Wang, D.; Yu, L.; Yu, J. Improved CNN Classification Method for Groups of Buildings Damaged by Earthquake, Based on High Resolution Remote Sensing Images. Remote Sens. 2020, 12, 260. [Google Scholar] [CrossRef]
- Hong, Z.; Zhong, H.; Pan, H.; Liu, J.; Zhou, R.; Zhang, Y.; Han, Y.; Wang, J.; Yang, S.; Zhong, C. Classification of Building Damage Using a Novel Convolutional Neural Network Based on Post-Disaster Aerial Images. Sensors 2022, 22, 5920. [Google Scholar] [CrossRef]
- Hassani, A.; Walton, S.; Shah, N.; Abuduweili, A.; Li, J.; Shi, H. Escaping the Big Data Paradigm with Compact Transformers. arXiv 2021, arXiv:2104.05704. [Google Scholar]
- Chen, K.; Wang, J.; Pang, J.; Cao, Y.; Xiong, Y.; Li, X.; Sun, S.; Feng, W.; Liu, Z.; Xu, J.; et al. MMDetection: Open MMLab Detection Toolbox and Benchmark. arXiv 2019, arXiv:1906.07155. [Google Scholar] [CrossRef]
- He, K.; Zhang, X.; Ren, S.; Sun, J. Deep Residual Learning for Image Recognition. arXiv 2015, arXiv:1512.03385. [Google Scholar] [CrossRef]
- Tan, M.; Le, Q.V. EfficientNet: Rethinking Model Scaling for Convolutional Neural Networks. arXiv 2020, arXiv:1905.11946. [Google Scholar] [CrossRef]
- Lin, T.; Maire, M.; Belongie, S.J.; Bourdev, L.D.; Girshick, R.B.; Hays, J.; Perona, P.; Ramanan, D.; Doll’a r, P.; Zitnick, C.L. Microsoft COCO: Common Objects in Context. arXiv 2014, arXiv:1405.0312. [Google Scholar]
- Marcel, S.; Rodriguez, Y. Torchvision the machine-vision package of torch. In Proceedings of the 18th ACM International Conference on Multimedia, Firenze, Italy, 25–29 October 2010; Association for Computing Machinery: New York, NY, USA, 2010; pp. 1485–1488. [Google Scholar]
- MMYOLO Contributors MMYOLO: OpenMMLab YOLO Series Toolbox and Benchmark. 2022. Available online: https://github.com/open-mmlab/mmyolo (accessed on 1 October 2024).
- Hassani, A.; Walton, S.; Shah, N.; Abuduweili, A.; Li, J.; Shi, H. Compact-Transformers. 2021. Available online: https://github.com/SHI-Labs/Compact-Transformers (accessed on 3 March 2025).
Figure 1.
Left: Building damage classification examples—urban (top) and rural (bottom) samples across undamaged, damaged, destroyed, and not-a-building categories. Right: Dataset statistics for rural (top) and urban (bottom) areas, showing class surface area () and class representation.
Figure 1.
Left: Building damage classification examples—urban (top) and rural (bottom) samples across undamaged, damaged, destroyed, and not-a-building categories. Right: Dataset statistics for rural (top) and urban (bottom) areas, showing class surface area () and class representation.
Figure 2.
Schematic representation of the architecture of Vision Transformer (ViT), Compact Vision Transformer(CVT) and Compact Convolutional Transformer (CCT). Source: Hassani et al. [
72].
Figure 2.
Schematic representation of the architecture of Vision Transformer (ViT), Compact Vision Transformer(CVT) and Compact Convolutional Transformer (CCT). Source: Hassani et al. [
72].
Figure 3.
Proposed method pipeline for evaluating and comparing the use of multi-class object detection against sequential single class object detection/localization and image classification for the task of automated BDA.
Figure 3.
Proposed method pipeline for evaluating and comparing the use of multi-class object detection against sequential single class object detection/localization and image classification for the task of automated BDA.
Figure 4.
Qualitative comparison of inference results with confidence scores for a representative rural (left, a) and urban (right, b) dataset tile. From top to bottom, ground truth (row 0), worst performing pipeline (row 1), middle of the road performing pipeline (row 2), best performing pipeline combination (row 3 and for comparison the best MCOD model results (row 4)).
Figure 4.
Qualitative comparison of inference results with confidence scores for a representative rural (left, a) and urban (right, b) dataset tile. From top to bottom, ground truth (row 0), worst performing pipeline (row 1), middle of the road performing pipeline (row 2), best performing pipeline combination (row 3 and for comparison the best MCOD model results (row 4)).
Table 1.
Multi-class object detection performance: mAP[0.50:0.95] and per-class AP[0.50:0.95] scores for C1, C2, C3 classes for each tested model configuration. C1, C2 and C3 are the target building damage classes (undamaged, damaged and destroyed).
Table 1.
Multi-class object detection performance: mAP[0.50:0.95] and per-class AP[0.50:0.95] scores for C1, C2, C3 classes for each tested model configuration. C1, C2 and C3 are the target building damage classes (undamaged, damaged and destroyed).
| Model | Anchor
Method | Weight
Init. | Class
N | mAP
[0.50:0.95] | C1
AP[0.50:0.95] | C2
AP[0.50:0.95] | C3
AP[0.50:0.95] |
|---|
| YOLOv7 | K-means | pretrained | 4 | 0.455 | 0.630 | 0.463 | 0.274 |
| YOLOv7 | K-means | pretrained | 3 | 0.455 | 0.623 | 0.458 | 0.285 |
| YOLOv7 | V5k-means | pretrained | 3 | 0.452 | 0.627 | 0.450 | 0.280 |
| RTMDet | None | pretrained | 4 | 0.452 | 0.629 | 0.461 | 0.265 |
| YOLOv7 | V5k-means | pretrained | 4 | 0.451 | 0.623 | 0.458 | 0.272 |
| YOLOv8 | None | pretrained | 3 | 0.447 | 0.622 | 0.463 | 0.255 |
| YOLOv7 | Diff. Evol. | pretrained | 4 | 0.447 | 0.625 | 0.449 | 0.265 |
| YOLOv7 | Diff. Evol. | pretrained | 3 | 0.447 | 0.621 | 0.449 | 0.269 |
| YOLOv8 | None | pretrained | 4 | 0.442 | 0.622 | 0.452 | 0.252 |
| RTMDet | None | scratch | 3 | 0.440 | 0.624 | 0.447 | 0.249 |
| RTMDet | None | scratch | 4 | 0.440 | 0.619 | 0.450 | 0.250 |
| YOLOv8 | None | scratch | 3 | 0.436 | 0.619 | 0.444 | 0.244 |
| YOLOv8 | None | scratch | 4 | 0.432 | 0.623 | 0.439 | 0.234 |
| YOLOv7 | K-means | scratch | 4 | 0.430 | 0.605 | 0.441 | 0.245 |
| YOLOv7 | V5k-means | scratch | 4 | 0.429 | 0.605 | 0.445 | 0.237 |
| YOLOv7 | Diff. Evol. | scratch | 4 | 0.429 | 0.601 | 0.442 | 0.243 |
| YOLOv7 | V5k-means | scratch | 3 | 0.426 | 0.603 | 0.438 | 0.235 |
| YOLOv7 | K-means | scratch | 3 | 0.423 | 0.604 | 0.434 | 0.232 |
| RTMDet | None | pretrained | 3 | 0.422 | 0.616 | 0.420 | 0.232 |
| YOLOv7 | Diff. Evol. | scratch | 3 | 0.422 | 0.595 | 0.431 | 0.238 |
Table 2.
Multi-class object detection performance: F1 (overall) and per-class F1 scores for C1, C2, C3 for each tested model configuration and at optimal confidence thresholds. C1, C2 and C3 are the target building damage classes (undamaged, damaged and destroyed).
Table 2.
Multi-class object detection performance: F1 (overall) and per-class F1 scores for C1, C2, C3 for each tested model configuration and at optimal confidence thresholds. C1, C2 and C3 are the target building damage classes (undamaged, damaged and destroyed).
| Model | Anchor
Method | Weight
Init. | Class
N | F1
(Overall) | C1 | C2 | C3 |
|---|
| YOLOv7 | K-means | pretrained | 4 | 0.832 | 0.877 | 0.795 | 0.624 |
| YOLOv7 | K-means | pretrained | 3 | 0.830 | 0.877 | 0.794 | 0.609 |
| YOLOv7 | Diff. Evol. | pretrained | 4 | 0.827 | 0.872 | 0.789 | 0.626 |
| YOLOv7 | V5k-means | pretrained | 3 | 0.827 | 0.872 | 0.789 | 0.626 |
| YOLOv7 | V5k-means | pretrained | 4 | 0.826 | 0.869 | 0.797 | 0.617 |
| YOLOv7 | Diff. Evol. | pretrained | 3 | 0.823 | 0.869 | 0.784 | 0.605 |
| RTMDet | None | pretrained | 3 | 0.819 | 0.869 | 0.788 | 0.516 |
| YOLOv8 | None | pretrained | 3 | 0.814 | 0.865 | 0.772 | 0.570 |
| YOLOv7 | V5k-means | scratch | 3 | 0.812 | 0.860 | 0.783 | 0.537 |
| YOLOv7 | V5k-means | scratch | 4 | 0.811 | 0.862 | 0.777 | 0.504 |
| YOLOv7 | Diff. Evol. | scratch | 4 | 0.810 | 0.860 | 0.771 | 0.543 |
| YOLOv7 | K-means | scratch | 3 | 0.808 | 0.861 | 0.769 | 0.510 |
| YOLOv7 | K-means | scratch | 4 | 0.808 | 0.859 | 0.771 | 0.500 |
| YOLOv8 | None | pretrained | 4 | 0.807 | 0.861 | 0.766 | 0.531 |
| YOLOv7 | Diff. Evol. | scratch | 3 | 0.805 | 0.856 | 0.760 | 0.518 |
| YOLOv8 | None | scratch | 3 | 0.804 | 0.859 | 0.768 | 0.503 |
| YOLOv8 | None | scratch | 4 | 0.803 | 0.861 | 0.761 | 0.475 |
| RTMDet | None | pretrained | 4 | 0.802 | 0.860 | 0.751 | 0.517 |
| RTMDet | None | scratch | 4 | 0.794 | 0.856 | 0.724 | 0.490 |
| RTMDet | None | scratch | 3 | 0.790 | 0.851 | 0.734 | 0.450 |
Table 3.
Common Average Precision (AP) metrics for single-class building detection models, evaluated across model architectures, anchor methods, weight initialization strategies, and training base splits. The table reports AP at IoU = 0.50:0.95, as well as AP at IoU = 0.50 (AP50) and IoU = 0.75 (AP75) for each configuration.
Table 3.
Common Average Precision (AP) metrics for single-class building detection models, evaluated across model architectures, anchor methods, weight initialization strategies, and training base splits. The table reports AP at IoU = 0.50:0.95, as well as AP at IoU = 0.50 (AP50) and IoU = 0.75 (AP75) for each configuration.
| Model | Anchor
Method | Weight
Init. | Training
Base | AP
[0.50:0.95] | AP50 | AP75 |
|---|
| RTMDet | None | pretrained | 3 to 1 | 0.655 | 0.872 | 0.748 |
| YOLOv8 | None | pretrained | 3 to 1 | 0.650 | 0.868 | 0.745 |
| YOLOv7 | V5k-means | pretrained | 3 to 1 | 0.649 | 0.874 | 0.741 |
| YOLOv7 | K-means | pretrained | 3 to 1 | 0.644 | 0.871 | 0.732 |
| YOLOv8 | None | scratch | 3 to 1 | 0.642 | 0.862 | 0.739 |
| YOLOv7 | Diff. Evol. | pretrained | 3 to 1 | 0.642 | 0.869 | 0.735 |
| RTMDet | None | scratch | 3 to 1 | 0.637 | 0.861 | 0.726 |
| YOLOv7 | K-means | scratch | 3 to 1 | 0.622 | 0.862 | 0.707 |
| YOLOv7 | Diff. Evol. | scratch | 3 to 1 | 0.621 | 0.863 | 0.704 |
| YOLOv7 | V5k-means | scratch | 3 to 1 | 0.620 | 0.863 | 0.705 |
| YOLOv7 | K-means | pretrained | 4 to 1 | 0.614 | 0.819 | 0.700 |
| YOLOv8 | None | pretrained | 4 to 1 | 0.612 | 0.809 | 0.699 |
| YOLOv7 | V5k-means | pretrained | 4 to 1 | 0.608 | 0.817 | 0.695 |
| YOLOv7 | Diff. Evol. | pretrained | 4 to 1 | 0.605 | 0.818 | 0.689 |
| YOLOv8 | None | scratch | 4 to 1 | 0.603 | 0.806 | 0.688 |
| RTMDet | None | pretrained | 4 to 1 | 0.603 | 0.806 | 0.694 |
| RTMDet | None | scratch | 4 to 1 | 0.580 | 0.795 | 0.665 |
| YOLOv7 | K-means | scratch | 4 to 1 | 0.575 | 0.792 | 0.658 |
| YOLOv7 | Diff. Evol. | scratch | 4 to 1 | 0.568 | 0.793 | 0.649 |
| YOLOv7 | V5k-means | scratch | 4 to 1 | 0.565 | 0.784 | 0.642 |
Table 4.
F1 metrics reported as macro-average across classes, weighted-average by class prevalence, and per-class (C1, C2, C3) for image classification models used for building damage classification. C1, C2, and C3 denote undamaged, damaged, and destroyed, respectively.
Table 4.
F1 metrics reported as macro-average across classes, weighted-average by class prevalence, and per-class (C1, C2, C3) for image classification models used for building damage classification. C1, C2, and C3 denote undamaged, damaged, and destroyed, respectively.
| Model | Class
N | Weight
Init. | Macro
Average | Weighted
Average | C1 | C2 | C3 |
|---|
| CCT_14_7x2_384 | 3 | pretrained | 0.91 | 0.94 | 0.97 | 0.87 | 0.88 |
| CCT_14_7x2_224 | 3 | pretrained | 0.90 | 0.93 | 0.96 | 0.87 | 0.87 |
| CCT_14_7x2_384 | 4 | pretrained | 0.90 | 0.93 | 0.96 | 0.87 | 0.86 |
| EfficientNet_B4 | 3 | pretrained | 0.89 | 0.92 | 0.96 | 0.85 | 0.84 |
| CCT_14_7x2_224 | 4 | pretrained | 0.88 | 0.91 | 0.95 | 0.84 | 0.83 |
| EfficientNet_B5 | 3 | pretrained | 0.88 | 0.92 | 0.96 | 0.85 | 0.83 |
| EfficientNet_v2_m | 3 | pretrained | 0.88 | 0.92 | 0.96 | 0.84 | 0.83 |
| EfficientNet_v2_s | 3 | pretrained | 0.88 | 0.92 | 0.95 | 0.84 | 0.83 |
| ResNet50 | 3 | pretrained | 0.88 | 0.92 | 0.96 | 0.84 | 0.85 |
| EfficientNet_B4 | 4 | pretrained | 0.87 | 0.90 | 0.94 | 0.83 | 0.81 |
| EfficientNet_B5 | 4 | pretrained | 0.87 | 0.90 | 0.94 | 0.83 | 0.80 |
| EfficientNet_B4 | 3 | scratch | 0.86 | 0.91 | 0.95 | 0.82 | 0.80 |
| EfficientNet_v2_m | 4 | pretrained | 0.86 | 0.89 | 0.94 | 0.81 | 0.79 |
| EfficientNet_v2_s | 4 | pretrained | 0.86 | 0.90 | 0.94 | 0.81 | 0.77 |
| ResNet34 | 3 | pretrained | 0.86 | 0.90 | 0.95 | 0.81 | 0.81 |
| ResNet34 | 4 | pretrained | 0.85 | 0.89 | 0.94 | 0.79 | 0.77 |
| ResNet50 | 4 | pretrained | 0.85 | 0.89 | 0.93 | 0.80 | 0.77 |
| EfficientNet_v2_m | 3 | scratch | 0.84 | 0.90 | 0.95 | 0.81 | 0.75 |
| CCT_14_7x2_224 | 3 | scratch | 0.83 | 0.88 | 0.94 | 0.79 | 0.76 |
| EfficientNet_B4 | 4 | scratch | 0.83 | 0.88 | 0.93 | 0.78 | 0.72 |
| EfficientNet_v2_m | 4 | scratch | 0.83 | 0.88 | 0.92 | 0.80 | 0.71 |
| EfficientNet_v2_s | 4 | scratch | 0.83 | 0.87 | 0.92 | 0.76 | 0.73 |
| CCT_14_7x2_384 | 3 | scratch | 0.82 | 0.88 | 0.94 | 0.77 | 0.74 |
| CCT_14_7x2_224 | 4 | scratch | 0.81 | 0.86 | 0.91 | 0.75 | 0.72 |
| EfficientNet_B5 | 4 | scratch | 0.81 | 0.86 | 0.91 | 0.76 | 0.71 |
| ResNet50 | 4 | scratch | 0.81 | 0.86 | 0.92 | 0.76 | 0.70 |
| CCT_14_7x2_384 | 4 | scratch | 0.80 | 0.86 | 0.92 | 0.74 | 0.66 |
| EfficientNet_B5 | 3 | scratch | 0.80 | 0.87 | 0.93 | 0.76 | 0.70 |
| EfficientNet_v2_s | 3 | scratch | 0.80 | 0.87 | 0.94 | 0.76 | 0.70 |
| ResNet34 | 3 | scratch | 0.80 | 0.87 | 0.94 | 0.76 | 0.70 |
| ResNet50 | 3 | scratch | 0.77 | 0.85 | 0.93 | 0.74 | 0.63 |
| ResNet34 | 4 | scratch | 0.61 | 0.71 | 0.82 | 0.43 | 0.39 |
Table 5.
Top 20 multi-class object detection and classification model combinations, ranked by mAP[0.50:0.95] and per-class AP[0.50:0.95] for target building damage classes C1, C2, and C3 (undamaged, damaged, and destroyed). Abbreviations: PT indicates models initialized with pretrained weights; 3 and 4 in model names denote training on 3-class or 4-class classification tasks, respectively.
Table 5.
Top 20 multi-class object detection and classification model combinations, ranked by mAP[0.50:0.95] and per-class AP[0.50:0.95] for target building damage classes C1, C2, and C3 (undamaged, damaged, and destroyed). Abbreviations: PT indicates models initialized with pretrained weights; 3 and 4 in model names denote training on 3-class or 4-class classification tasks, respectively.
| Detection Model | Classification Model | mAP
[0.50:0.95] | C1
AP[0.50:0.95] | C2
AP[0.50:0.95] | C3
AP[0.50:0.95] |
|---|
| RTMDet-PT-3to1 | CCT_224-PT-3 | 0.478 | 0.663 | 0.512 | 0.258 |
| RTMDet-PT-3to1 | CCT_384-PT-3 | 0.477 | 0.663 | 0.520 | 0.250 |
| RTMDet-PT-3to1 | CCT_224-PT-4 | 0.474 | 0.663 | 0.508 | 0.249 |
| RTMDet-PT-3to1 | EfficientNet_B4-PT-3 | 0.473 | 0.662 | 0.523 | 0.234 |
| RTMDet-PT-3to1 | EfficientNet_B5-PT-3 | 0.473 | 0.658 | 0.520 | 0.239 |
| YOLOv7-K_M-PT-4to1 | CCT_224-PT-4 | 0.472 | 0.656 | 0.499 | 0.263 |
| RTMDet-PT-3to1 | CCT_384-PT-4 | 0.472 | 0.662 | 0.510 | 0.244 |
| YOLOv7-K_M-PT-4to1 | CCT_384-PT-4 | 0.472 | 0.657 | 0.508 | 0.251 |
| YOLOv7-V5k_M-PT-4to1 | CCT_224-PT-4 | 0.472 | 0.653 | 0.503 | 0.259 |
| YOLOv7-V5k_M-PT-3to1 | CCT_384-PT-3 | 0.472 | 0.654 | 0.504 | 0.256 |
| YOLOv7-V5K_M-PT-3to1 | CCT_224-PT-3 | 0.471 | 0.656 | 0.498 | 0.259 |
| RTMDet-PT-3to1 | EfficientNet_v2_m-PT-3 | 0.470 | 0.661 | 0.509 | 0.238 |
| RTMDet-PT-3to1 | ResNet50-PT-3 | 0.469 | 0.659 | 0.502 | 0.246 |
| RTMDet-PT-3to1 | EfficientNet_v2_s-PT-3 | 0.469 | 0.658 | 0.508 | 0.241 |
| YOLOv7-V5K_M-PT-4to1 | CCT_384-PT-4 | 0.469 | 0.652 | 0.505 | 0.248 |
| YOLOv8-PT-3to1 | CCT_384-PT-3 | 0.468 | 0.659 | 0.513 | 0.233 |
| YOLOv8-PT-4to1 | CCT_384-PT-4 | 0.468 | 0.661 | 0.505 | 0.238 |
| YOLOv7-V5k_M-PT-4to1 | CCT_384-PT-3 | 0.468 | 0.651 | 0.499 | 0.254 |
| YOLOv7-V5K_M-PT-3to1 | EfficientNet_B5-PT-3 | 0.468 | 0.649 | 0.504 | 0.249 |
| YOLOv8-PT-4to1 | CCT_224-PT-4 | 0.468 | 0.658 | 0.499 | 0.245 |
Table 6.
Top 20 pipeline model combinations, ranked by overall F1 score. Columns show the detection model, classification model, overall F1, and per-class F1 for target building damage classes C1, C2, and C3 (undamaged, damaged, and destroyed) at optimal confidence threshold. Abbreviations: PT indicates models initialized with pretrained weights; 3 and 4 denote training on 3-class or 4-class tasks.
Table 6.
Top 20 pipeline model combinations, ranked by overall F1 score. Columns show the detection model, classification model, overall F1, and per-class F1 for target building damage classes C1, C2, and C3 (undamaged, damaged, and destroyed) at optimal confidence threshold. Abbreviations: PT indicates models initialized with pretrained weights; 3 and 4 denote training on 3-class or 4-class tasks.
| Detection Model | Classification Model | F1
Overall | C1 | C2 | C3 |
|---|
| YOLOv7-DE-PT-4to1 | CCT_224-PT-4 | 0.863 | 0.885 | 0.881 | 0.660 |
| YOLOv7-K_M-PT-4to1 | CCT_384-PT-4 | 0.863 | 0.891 | 0.870 | 0.641 |
| YOLOv7-V5K_M-PT-3to1 | CCT_224-PT-4 | 0.863 | 0.888 | 0.881 | 0.627 |
| YOLOv7-V5K_M-PT-3to1 | CCT_384-PT-4 | 0.863 | 0.886 | 0.879 | 0.633 |
| YOLOv7-DE-PT-4to1 | CCT_384-PT-4 | 0.862 | 0.885 | 0.876 | 0.650 |
| YOLOv7-K_M-PT-4to1 | EfficientNet_v2_m-PT-4 | 0.861 | 0.887 | 0.872 | 0.651 |
| YOLOv7-K_M-PT-4to1 | CCT_224-PT-4 | 0.861 | 0.884 | 0.882 | 0.653 |
| YOLOv7-K_M-PT-4to1 | EfficientNet_B5-PT-4 | 0.861 | 0.883 | 0.887 | 0.632 |
| YOLOv7-DE-PT-4to1 | EfficientNet_B4-PT-4 | 0.860 | 0.882 | 0.880 | 0.624 |
| YOLOv7-K_M-PT-4to1 | EfficientNet_B4-PT-4 | 0.860 | 0.888 | 0.872 | 0.612 |
| YOLOv7-V5K_M-PT-3to1 | EfficientNet_v2_m-PT-4 | 0.860 | 0.890 | 0.867 | 0.614 |
| YOLOv7-V5K_M-PT-3to1 | EfficientNet_B4-PT-3 | 0.860 | 0.882 | 0.876 | 0.623 |
| YOLOv7-V5K_M-PT-3to1 | EfficientNet_B5-PT-4 | 0.860 | 0.887 | 0.878 | 0.588 |
| YOLOv7-K_M-PT-4to1 | EfficientNet_B4-PT-4 | 0.860 | 0.887 | 0.872 | 0.612 |
| YOLOv7-K_M-PT-3to1 | CCT_384-PT-4 | 0.859 | 0.888 | 0.869 | 0.610 |
| YOLOv7-V5K_M-PT-3to1 | EfficientNet_B4-PT-4 | 0.859 | 0.884 | 0.878 | 0.602 |
| YOLOv7-DE-PT-3to1 | CCT_224-PT-4 | 0.859 | 0.885 | 0.873 | 0.628 |
| YOLOv7-DE-PT-3to1 | CCT_384-PT-4 | 0.859 | 0.880 | 0.881 | 0.650 |
| YOLOv7-K_M-PT-3to1 | CCT_224-PT-4 | 0.859 | 0.886 | 0.873 | 0.615 |
| YOLOv7-V5K_M-PT-3to1 | ResNet34-PT-4 | 0.858 | 0.884 | 0.876 | 0.633 |
| Disclaimer/Publisher’s Note: The statements, opinions and data contained in all publications are solely those of the individual author(s) and contributor(s) and not of MDPI and/or the editor(s). MDPI and/or the editor(s) disclaim responsibility for any injury to people or property resulting from any ideas, methods, instructions or products referred to in the content. |
© 2025 by the authors. Licensee MDPI, Basel, Switzerland. This article is an open access article distributed under the terms and conditions of the Creative Commons Attribution (CC BY) license (https://creativecommons.org/licenses/by/4.0/).