Highlights
- What are the main findings?
- In the northwestern Kubuqi Desert, bistatic InSAR-derived DEMs were independently validated as the accuracy of about 0.9 m against publicly available ICESat-2 data.
- This study reveals that the average height of dunes in the northwestern Kubuqi Desert decreased by 1.04 m from 26 December 2012 to 25 January 2018 based on the high-precision DEM differential method, which has been proven by the t-test.
- What is the implication of the main finding?
- The actual precision of the two DEMs is likely higher since ground surface variations (such as the melting of snow or change in surface humidity, etc.) present in collected four- or five-month ICESat-2 data possibly lower the inherent accuracy of ICESat-2.
- This study investigated two key factors. Decreased wind energy and increased vegetation coverage have inhibited sediment transport, thereby supporting the dune height decrease.
Abstract
Sand dune movements represent a critical global environment challenge. While previous studies have mainly focused on horizontal deformation, this study applies the bistatic InSAR technique to reconstruct high-precision digital elevation models (DEMs) of the desert terrain, enabling quantitative assessment of the height change in sand dunes by the DEM differential method. Although InSAR has been widely applied to monitor the surface deformation over the urban, mining, and landslide areas, its application in the desert area is still rare. In this study, the northwestern Kubuqi desert, where sand dunes are clearly distributed, was selected as the study area. Using the TanDEM-X bistatic InSAR data acquired on 26 December 2012 and 25 January 2018, we generated high-resolution DEMs with an estimated accuracy of RMSE ≈ 0.9 m in non-dune areas, as validated against ICESat-2 reference data. The high-precision DEM is attributed to the application of a parameterized modeling method, which also facilitates the effective implementation of the DEM differential method. Then, the t-test (i.e., a statistical hypothesis method) was used to estimate a minimum detectable height change (i.e., LoD) of approximately ±0.50 m and confirm the significance of observed elevation changes. Based on this, this reveals a net mean dune height decrease of 1.04 m during the study period. In addition, quantitative investigations on the vegetation coverage and the wind conditions provided further evidence supporting the observed reduction in dune height, suggesting that vegetation stabilization has likely inhibited sediment transport. This study demonstrates the potential of bistatic InSAR for monitoring desert geomorphological processes and provides scientific support for designing effective desertification control strategies.
1. Introduction
Sand dune movement is a major global environmental issue. Driven by monsoons and climate change, widespread sand dune migration and associated dust dispersion lead to atmospheric pollution and ecological degradation. These processes pose serious threats to desert oases, agriculture, residential areas, transportation infrastructure, and local ecosystems [1,2,3]. As the dynamics and morphological changes in sand dunes are key indicators of desertification [4,5], monitoring their movement can help assess the rate and extent of land degradation and provide a scientific basis for formulating effective sand strategies for sand prevention and control [6].
Current methods for dune morphological change monitoring primarily involves traditional field measurement, optical remote sensing technique, and Light Detection and Ranging (LiDAR) technology. Traditional field measurement, such as the stake method, total station surveys [7,8], and GPS-RTK technique are used to identify and track the boundaries of individual dunes [9,10,11]. Although these methods are straightforward, they are labor-intensive and logistically challenging for large-scale applications, particularly in remote desert interior. In addition, harsh environmental conditions and adverse weather can frequently interrupt measurements, potentially causing the omission of important stages of the sand dune movement. Optical remote sensing is a non-contact and large-scale observation. Through manual interpretation or automated identification of dune crestline from high-resolution images, it facilitates dune monitoring in inaccessible areas [12,13]. Moreover, image registration and cross-correlation methodologies are effective for obtaining two-dimensional horizontal displacement (or velocity) across extensive dune fields [14,15,16,17]. However, these techniques rely on image quality and are susceptible to variations in illumination, shadows, and cloud cover, which may lead to registration failures.
Furthermore, most studies mainly focus on monitoring for the horizontal deformation, while the vertical deformation, an important component of dune morphological changes, is often overlooked. LiDAR technology can generate high-resolution and high-precision digital elevation models (DEMs). Space-borne platforms like ICESAT-2 offers the elevation in sparse footprint points, while airborne LiDAR is prominent in producing high-quality DEMs. By comparing multi-temporal elevation data, changes in dune height direction and horizontal direction can be detected [18,19,20]. However, conducting large-scale, frequent LiDAR surveys over deserts is prohibitively expensive, and operational challenges such as the need for extensive flight missions and limited battery life persist.
Synthetic Aperture Radar (SAR), as an active microwave remote sensing technique, provides substantial benefits, such as all-weather, day-and-night, and large-scale observation capabilities. It has now been widely applied in monitoring ground subsidence [21], landslides [22], and marine vessel identification [23]. Some studies have attempted to delineate and identify sand dunes using the typical SAR weak backscatter from dune surfaces [24,25,26]. Nonetheless, this approach is often hindered by topographic shadowing and low backscatter from inter-dune areas, leading to identification failures. Advanced SAR techniques like Interferometric SAR (InSAR) and Polarimetric SAR (PolSAR) have provided novel methodologies in dune identification and deformation detection [27,28]. Polarimetric decomposition or scattering mechanism studies have successfully aided in dune classification, but have contributed little to direction deformation extraction. While exploiting interferometric coherence to identify dune position changes is a viable strategy, the method is limited by blurred coherence at dune edges.
Although InSAR technology has been widely applied to high-precision DEM generation, its efficacy is often limited by spatio-temporal decorrelation, particularly over desert areas, where rapid surface changes result in significant coherence loss and diminished backscattering [29,30]. Bistatic InSAR systems, like TerraSAR-X/TanDEM-X and Tianhui-2, employ helical orbits to acquire images of the same area simultaneously (or nearly so), thereby effectively reducing atmospheric delay and spatio-temporal decorrelation effects. Additionally, these systems typically yield higher resolution and better interferometric quality, demonstrating the ability to extract the desert topography, which had been proved in the literature [31,32]. However, existing studies are devoted to large-scale dune measurement using InSAR data with resolutions lower than 30 m, which is not clear in the depiction of small sand dunes. The research about the performance and accuracy assessment of bistatic InSAR-derived high-resolution (better than 10 m) DEMs in desert areas is rare.
This paper aims at retrieving (at least) two high-resolution and high-precision DEMs in desert area and then extracting the often overlooked vertical deformation of sand dunes based on a DEM differential method [33,34,35]. Unlike previous studies on large-scale sand dune dynamics which have focused primarily on the displacement in horizontal direction, this study captures the morphological changes in the sand dunes from another dimension (i.e., the elevation direction). To test this method, two sets of TanDEM-X bistatic InSAR data collected in the northwestern Kubuqi Desert on 26 December 2012 and 25 January 2018 were utilized. High-resolution and high-precision DEMs were generated based on a parameterized modeling method to correct the systemic bias dominated by orbital errors [36]. The obtained DEMs were independently validated against publicly available ICESat-2 data. Subsequently, the DEM differential method was conducted to quantify dune height variations. Moreover, a t-test was carried out to exclude the interference of DEM errors on the actual height deformation. This study will provide a more comprehensive understanding of dune morphodynamics.
2. Study Area and Datasets
2.1. Study Area
The Kubuqi Desert is located between 39°15′–40°45′N and 107°00′–111°30′E, covering an area of approximately 18,600 km2. The northwestern portion of the Kubuqi Desert, encompassing both mobile and semi-fixed sand dunes, was selected as the study area (Figure 1a,b). Landsat 8 imagery obtained from the Geospatial Data Cloud (https://www.gscloud.cn/ (accessed on 18 December 2024)) was used for surface cover classifications. As shown in Figure 1b, the study area is located on the Ordos Plateau, with an average elevation in approximately 1000 m. Figure 1d presents the mean NDVI values from 2013 to 2018. The distinctly low NDVI values indicate the spatial distribution of sand dunes, particularly in the central and northern portions of the study area.
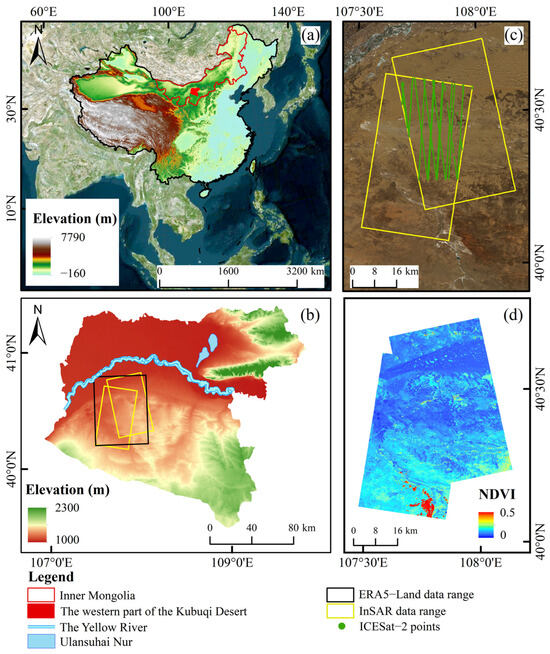
Figure 1.
Overview of the study area and data coverage. (a,b) Location of the study area, and ERA5-Land meteorological data (black rectangle). (c) Coverage of TanDEM-X InSAR data (yellow rectangle) and distribution of ICESat-2 validation points (green dots). (d) Mean NDVI of the study area from 2013 to 2018.
2.2. Datasets
2.2.1. TanDEM-X InSAR Data
The TerraSAR-X (TSX) satellite and the TanDEM-X (TDX) satellite operate in a helical orbit, constituting a bistatic SAR interferometry system. This study utilized TanDEM-X bistatic InSAR data acquired over the Kubuqi Desert on 26 December 2012 and 25 January 2018, with their coverage identified in Figure 1. The detailed interferometric parameters are shown in Table 1. The collections were processed to generate individual interferometric phase maps, each with a spatial resolution of 10 m.

Table 1.
Detailed parameters of the TanDEM-X bistatic InSAR data.
2.2.2. ICESat-2 Data
The ICESat-2 satellite carrying the Advanced Topographic Laser Altimeter System (ATLAS) is used to measure the elevation in land and sea ice globally [37,38]. ICESat-2 employs a multi-beam configuration, projecting three pairs of lasers (with a 90 m intra-pair spacing) that provide high-resolution elevation and slope data with a nominal footprint of 17 m and a 0.7 m along-track sampling interval. To reduce the height differences caused by temporal variations, this study utilized the data acquired between October 2018 and February 2019 to accurately assess the InSAR-measured DEMs. A total of 14,979 evenly distributed ICESat-2 points were collected within the study area (see Figure 1c).
2.2.3. ERA5-Land Meteorological Dataset
This study used the ERA5-Land surface reanalysis dataset, produced by the European Centre for Medium-Range Weather Forecasts (ECMWF), to analyze meteorological conditions. ERA5-Land provides global meteorological data from 1950 onward, with a spatial resolution of 0.1° × 0.1°. This study extracted three-hourly 10 m wind field data from December 2012 to January 2018, covering the overlapping portion of the study area. The U and V wind components were used to compute wind speed and direction within the study area [39]. U and V denote the eastward and northward component of the horizontal wind speed at a height of 10 m above the ground, respectively.
2.2.4. Optical Image Data
Landsat 8 imagery (30 m resolution) was acquired from the geographic space data cloud (https://www.gscloud.cn/ (accessed on 18 December 2024)) for the period after the satellite’s launch on 11 February 2013. The data were subsequently radiometrically calibrated, atmospherically corrected, and clipped to the study area to support the analysis of sand dune deformation.
3. Monitoring Sand Dune Height Changes Using DEM Differential Technology
Based on bistatic TanDEM-X InSAR data, the reconstruction of high-precision DEM is achieved through two operations a two-step strategy, the utilization of the freely available TanDEM-X global DEM product and the application of a parameterized modeling method for orbital error correction [36].
In the bistatic InSAR mode, the interferometric phase mainly consists of the topographic phase, the flat-earth phase, and the thermal noise phase, as the impacts from the atmospheric delay, the temporal decorrelation, and the surface deformation are negligible. To extract a high-precision DEM, interferometric differential processing needs to be carried out. However, both the estimated flat-earth phase and the simulated topographic phase are influenced by InSAR geometric parameters, especially interferometric baseline parameters. The free released TanDEM-X DEM product is also used in this stage. As a result, the obtained differential interferogram contains orbital errors, elevation differences, and noise. Since the TanDEM-X DEM product share the vertical datum with TanDEM-X interferometric data, it can avoid complications from datum difference during data processing. To reconstruct a high-precision DEM, the orbital error should be estimated and eliminated. This was accomplished using a parameterized modeling method [36] by linking the orbital error phase to the baseline parameter errors. In the parameterized model, the modeled orbital error phase is treated as a systemic error and is decomposed into a residual flat-earth phase error and a terrain-related phase error, both resulting from imprecise baseline parameters during the flat-earth and topographic phase removal. Using the parameterized modeling, the systemic bias in the bistatic InSAR is effectively estimated and eliminated. After removing the orbital error phase, the residual topographic phase is obtained and converted to the height difference. In such a case, a high-resolution and high-precision DEM can be reconstructed by adding the height difference to the resampled TanDEM-X DEM. Finally, the vertical deformation or sand dune changes can be obtained based on the difference in reconstructed high-quality DEMs.
When the DEM differential method is used to calculate height differences, measurement errors and actual height deformation must be distinguished. To address this, the t-test approach can be applied to quantify the statistical significance of height differences [40,41]. Its core idea is to compare with the t-statistic and a critical value at a chosen significance level (e.g., 95% confidence). The t-statistic is constructed based on the absolute value of the height difference within each pixel and the standard deviation of height differences within a stable reference region, a region where no significant erosion or deposition occurred during the acquired period of two DEMs.
If the value of the t-statistic is greater than the given critical value, the statistical significance is proved and the deformation can be inferred. The implementation of this test proceeded as follows. First, one or more regions of stable terrain within the study area should be delineated. Then, the mean and standard deviation of height differences within selected regions are computed. These statistics characterize the systematic deviation and random noise (i.e., measurement error). Generally, the systematic deviation is equal to or very close to zero. Subsequently, the t-statistic was calculated for every pixel across the entire study area. Any pixel with an absolute t-statistic exceeding the selected confidence level (using the appropriate t-value) is classified as statistically significant and interpreted as actual height change. The limit of detection (LoD) is determined based on the product of the above-mentioned standard deviation and the selected confidence level , i.e., . The LoD can be used as the critical value for distinguishing measurement error from actual height change.
4. Results and Analysis
4.1. Estimation and Removal of Orbital Errors
This study employed the acquired raw DEM to simulate the terrain phase, which was then subtracted from the original interferometric phase to derive the differential interferogram, as illustrated in Figure 2a,d. The resulting phase maps reveals a pronounced orbital error, manifested as parallel stripes. The magnitude of this error ranged from approximately −300 to 150 rad for the 2012 dataset and from −200 to 250 rad for the 2018 dataset. This significant systematic bias conceals subtle phase signals related to dune height change.
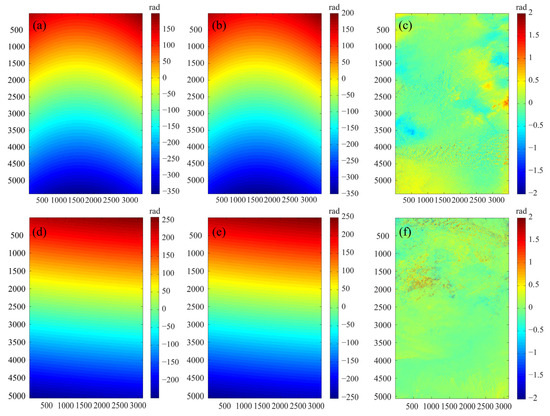
Figure 2.
The differential interferograms before and after removing the orbital error: (a,d) Initial differential interferograms; (b,e) estimated orbital error phase; (c,f) residual topographic phases after error correction. (a–c) is for imagery of 26 December 2012 and (d–f) is for that of 25 January 2018.
The orbit error estimated by the parametric model is shown in Figure 2b,e, which accurately captures the systematic trend present in the original interferogram. After the removal of this estimated error, the resulting height difference phase is displayed in Figure 2c,f. Obviously, using the parameterized modeling method effectively estimates and eliminates the systemic error.
4.2. Reconstruction and Assessment of the Desert Topography
After removing orbital errors from the differential interferograms, final DEMs with a spatial resolution of 10 m × 10 m were reconstructed for the Kubuqi Desert area for 26 December 2012 and 25 January 2018, as shown in Figure 3. The topographic elevation ranges from 900 m to 1300 m, with lower elevations predominantly observed in the western and northern part of the test site.
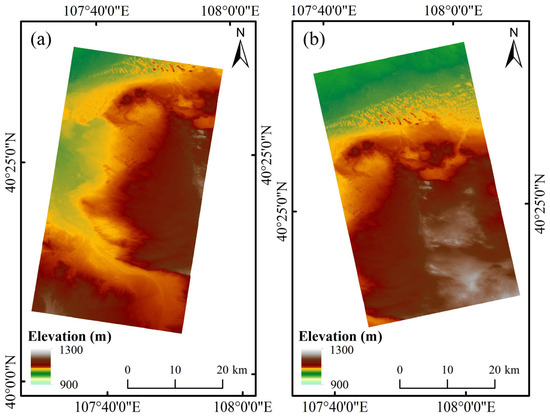
Figure 3.
DEMs of the study area derived from TanDEM-X bistatic InSAR data acquired on (a) 25 January 2018 and (b) 26 December 2012.
To further assess the accuracies of reconstructed desert DEMs, the overlapping area with ICESat-2 validation data (see Figure 1c) was analyzed. Given the potential sand dune movement, non-dune areas are relatively stable and can be used for this accuracy assessment [42,43]. The validation results (Figure 4) show that the ME of non-dune areas is 0.07 m for 26 December 2012 and −0.03 m for 25 January 2018, and their RMSEs are 0.96 m and 0.91 m, respectively. Both MEs and RMSEs are very close, despite the considerable temporal difference with ICESat-2 data. This reflects the reliability of the bistatic InSAR technique for topographic mapping in desert environments and confirms the stability of the non-dune areas between the two acquisition dates. The selected ICESat-2 data should be temporally consistent with InSAR data or the DEM. At least, these two should be synchronized in terms of seasons, if the temporal synchronization cannot be ensured. In fact, the actual precision of these two DEMs is likely even higher since ground surface variations (such as the melting of snow or change in surface humidity, etc.) present in collected four- or five-month ICESat-2 data possibly lower the inherent accuracy of ICESat-2.
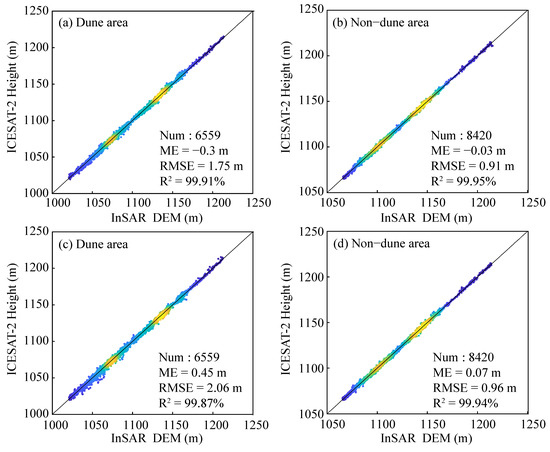
Figure 4.
Accuracy assessment of InSAR-derived DEMs against ICESat-2 data. Verification results of dune and non-dune area from InSAR DEM acquired on (a,b) 25 January 2018 and (c,d) 26 December 2012.
Three sand dune regions (called as Region I, II and III, as shown in Figure 5a) were selected by for detailed analysis based on their distinct sand dune morphologies and spatial distribution patterns (see Figure 5b–d).
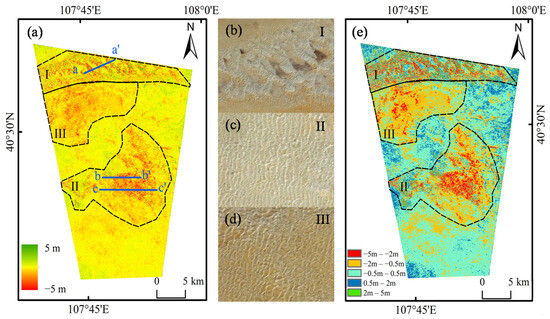
Figure 5.
Height changes in the Kubuqi Desert derived from differential InSAR DEM analysis. (a) Elevation difference map obtained by subtracting the 2012 DEM from the 2018 DEM. aa′, bb′, cc′ are the profiles analyzed in Figure 6; (b–d) sand dune morphologies within the three selected regions derived from Google satellite imagery. (e) Pixels exhibiting statistically significant deformation within the study area. I, II, III are the three selected sand dune regions.
Region I, located in the northwestern Kubuqi Desert, is characterized by extensive latticed dunes with a northeast–southwest direction, separated by stable inter-dune corridors. The inter-dune areas remained almost unchanged, while the sand dune areas show significant height difference (Figure 5a). The negative deformation values are far greater than the positive ones, indicating erosion exceeded deposition. Region II and III are composed of clustered latticed dunes aligned in an east–west direction, resulting in more continuous, sheet-like deformation patterns. Accuracy assessment using ICESat-2 data in these dune areas showed an ME of 0.45 m and RMSE of 2.06 m for the 26 December 2012 DEM, and −0.3 m and 1.75 m for the 25 January 2018 DEM. The accuracy of the topography obtained from different dates varies significantly, which may result from the sand dune movement.
The overall mean height decrease of 0.75 m from 26 December 2012 to 25 January 2018 provides an estimate of the net vertical deformation, though this value may be influenced by uncertainties in the ICESat-2 reference data. The DEM differential method effectively captures this topographic change, offering a more direct approach for quantifying dune morphodynamic processes.
4.3. Identification and Analysis of the Dune Height Change in Kubuqi Desert
To analyze the sand dune height changes in the test site, an elevation difference map in the overlapping area is obtained by subtracting the DEM acquired on 26 December 2012 from that acquired on 25 January 2018, as shown in Figure 5a. The height change in sand dune areas is significant. However, the obtained elevation difference cannot be directly interpreted as the actual height change due to inevitable DEM errors.
This study applies the t-test to distinguish between the DEM errors and actual height change, based on the statistical characteristics of stable terrain located outside the three delineated dune regions. The mean (0.03 m) and standard deviation (0.26 m) of elevation differences in these stable areas represent the systematic error and random noise, respectively. Subsequently, the pixel-wise t-test was then performed across the entire study area and at a 95% confidence level (α = 0.05), yielding a minimum detectable height change (i.e., LoD) of approximately ±0.50 m. Elevation changes exceeding this LoD threshold were classified as the actual height deformation, as shown in Figure 5e. Changes within the ±0.50 m range (light blue in Figure 5e) were considered DEM errors. Figure 5e presents five elevation difference levels, i.e., −5.0 m to −2.0 m, −2.0 m to −0.5 m, −0.5 m to 0.5 m, 0.5 m to 2.0 m, and 2.0 m to 5.0 m. Most height changes are concentrated within the three delineated dune regions, indicating a substantial decrease in dune height. The potential drivers of this observed height reduction will be explored in the Discussion section.
Further, to quantitatively analyze the topographic evolution, three profiles (i.e., aa′, bb′, cc′) were established perpendicular to the sand dune ridge orientations, as shown in Figure 6. Profile aa′ (see Figure 6a) traverses dunes with heights of 20 to 40 m, spaced over 100 m apart. The elevation difference in two DEMs along the profile aa′ varies from around −12.0 m to 3.7 m within the dune areas, while the inter-dune corridors show minor changes. These suggest the height of the sand dunes decreased since 26 December 2012.
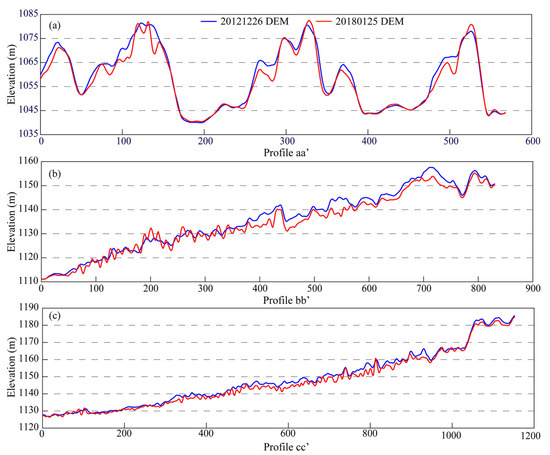
Figure 6.
Elevation profiles of two DEMs. (a) Profile aa′; (b) profile bb′; (c) profile cc′.
In Region II, profiles bb′ and cc′ (Figure 6b,c) reveal smaller and continuous crests with most heights less than ten meters. Negative deformation is remarkable but their values are smaller than those in Region I. The dune elevation variation ranges between −8.5 m and 6.0 m along profile bb′, and between −7.0 m and 2.0 m along profile cc′. Critically, both profiles consistently show lower elevations in 2018 compared to 2012 across all dune positions. In summary, the elevation in the sand dunes in both regions indeed presents a decreasing tendency.
To quantitatively describe the height changes in the study area, a statistical analysis was conducted in regions I, II, III, and the combined three regions (Figure 7). Despite deviations from a normal distribution in the deformation values, the results reveal a consistent decreasing trend in dune elevation. Region I exhibited a mean height decrease of 0.74 m (see Figure 7a), while Regions II and III showed greater reductions of 1.12 m and 1.23 m, respectively (see Figure 7b,c). Overall, the average height of the sand dunes within the combined three regions decreased by 1.04 m (see Figure 7d).
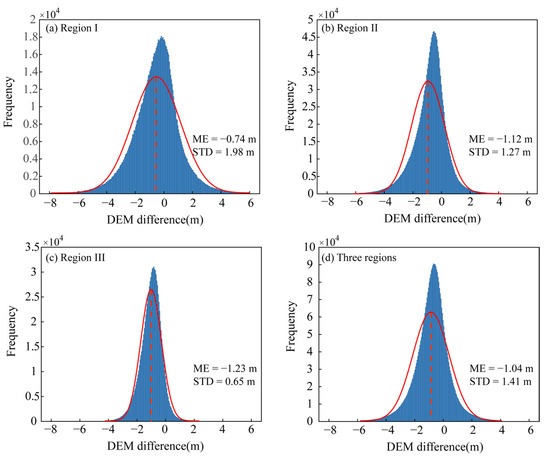
Figure 7.
The Gaussian frequency distribution histogram of DEM differences in the dune deformation region. (a–c) Statistical results for Regions I, II, and III; (d) combined histogram for the three regions.
5. Discussions
The comparison of two high-precision DEMs confirms that the height of sand dunes in the study area declines. In this study, we have ruled out the possibility of extensive use of sand in construction projects because there were no indications of a large number of vehicles transporting sand on the optical images. To explore the underlying reasons of the decreased height, this study examines two potential factors.
5.1. Sand Dune Movement Patterns
The decline in dune height can be correlated with the sand dune movement patterns. Here, we focus on two possibilities, a general weakening of dune mobility, and dune differentiation and flattening. The latter does not imply reduced dune movement and may reflect enhanced dynamics.
The first mechanism would be directly evidenced by a decrease in the horizontal rate of dune movement. However, this cannot be verified with the current datasets and method. For the second mechanism, previous studies have shown that this dune differentiation and flattening can occur when wind conditions (such as the strength, direction, and frequency of the wind) remain unchanged and the wind direction becomes more diverse and complex [44].
Wind conditions are the primary factors controlling dune deformation and migration [45]. As wind speed escalates, surface particles experience acceleration and lift forces, substantially enhancing the sand transport rate and promoting dune movement. Previous studies have shown that the threshold wind speed for initiating sand particle movement in the study area is approximately 6.0 m·s−1 [46]. In this study, ERA5-Land reanalysis data covering the study region were obtained and processed. The U and V components of wind speed collected at a height of 10 m above the ground were extracted at three-hour intervals from December 2012 to January 2018 using the Google Earth Engine (GEE) platform, then converted to wind velocity and direction. Subsequently, the raster data were vectorized, and all records with wind speeds ≥ 6.0 m·s−1 were extracted. Annual wind direction rose diagrams were generated, with separate analyses for December 2012 and January 2018 (Figure 8).
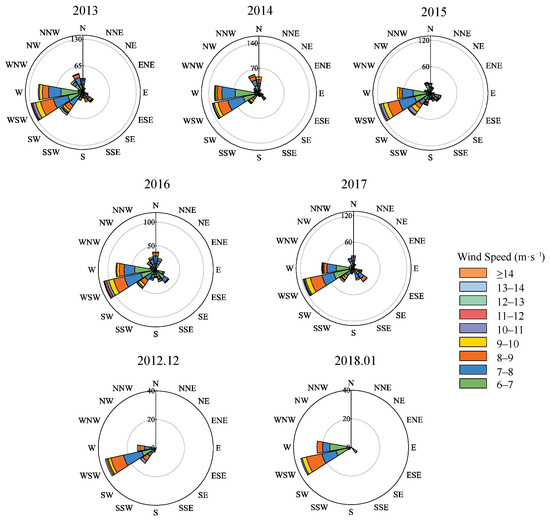
Figure 8.
Wind direction analysis from December 2012 to January 2018. The rose diagrams depict the prevailing wind directions. The data presented from 2013 to 2017 illustrates the annual wind conditions.
The results demonstrate that the prevailing wind direction throughout the observation period remained consistently from the WSW, with secondary contributions from the W. Winds from other directions occurred at lower frequencies each year. We can see that the wind directions had no significant change during the study period.
To further quantify the wind conditions (such as wind strength and frequency), the annual mean speeds and the frequency of events the 6.0 m·s−1 transport threshold were calculated (Figure 9). The results indicate that while the average wind speed remained relatively stable from 2012 to 2018, the frequency of wind speeds above 6.0 m·s−1 has shown a continuous downward trend since 2013, reflecting a reduction in moderate to strong wind events capable of entraining and transporting sand particles.
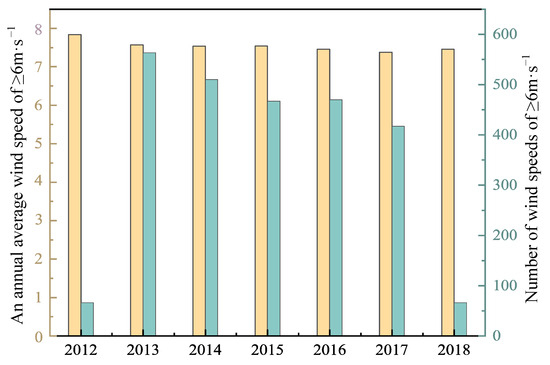
Figure 9.
Interannual variations in wind speeds exceeding 6 m·s−1.
From the perspective of the wind conditions, these findings do not support the mechanism of dune differentiation under complex wind regimes. Instead, the observed decline in wind transport capacity increases the plausibility of the first mechanism that is the weakened dune mobility. Of course, more evidence need to be provided.
5.2. Vegetation Coverage
Vegetation plays a vital role in terrestrial ecosystems, connecting atmosphere, water, and soil [47]. The Normalized Difference Vegetation Index (NDVI) is a key metric used to assess vegetation growth and reflects the temporal dynamics of regional vegetation cover [48,49].
This study calculated the NDVI values using six Landsat 8 optical images acquired during the peak vegetation growth seasons from 2013 to 2018 (Figure 10). In sand dune areas, the vegetation is sparse, with corresponding NDVI values typically ranging between 0 and 0.1. In contrast, NDVI values in non-dune areas exceed 0.3. High NDVI values surrounding sand dune areas indicate ongoing vegetation expansion.
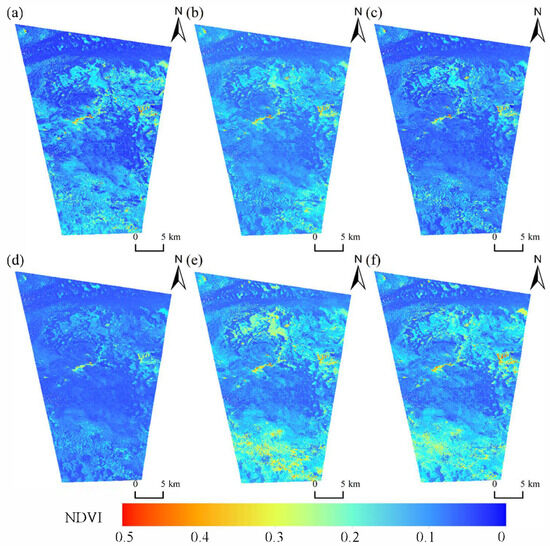
Figure 10.
Spatio-temporal dynamics of vegetation coverage represented by the NDVI derived from Landsat 8 imagery. The images were acquired on (a) 26 August 2013, (b) 13 August 2014, (c) 1 September 2015, (d) 15 June 2016, (e) 5 August 2017, and (f) 24 August 2018.
To quantify vegetation changes from 2013 to 2018, the fractional vegetation cover (FVC) was calculated. FVC represents the proportion of the vertical projection area of vegetation (including leaves, stems, and branches) on the ground relative to the total surface area. This index directly reflects variations in the ecological environment of desertified regions and provides insight into associated climatic, hydrological, and environmental conditions [50].
The calculated FVC values for the Kubuqi Desert were classified into five levels: extremely low (≤0.2), low (0.2~0.4), moderately low (0.4~0.6), moderately high (0.6~0.8), and high (0.8~1). Analysis reveals a gradual improvement in vegetation cover in the dune areas, gradually increasing from low to moderately low levels. The southern part of the overlapping area exhibited the most pronounced vegetation recovery, shifting from low to moderately high level (Figure 11a,b).
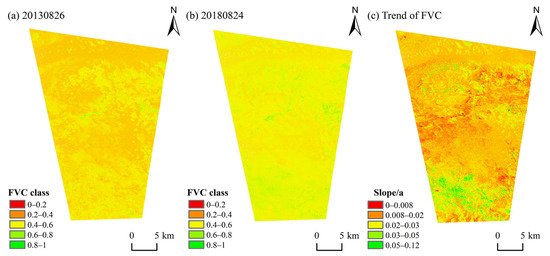
Figure 11.
Spatial distribution of the fractional vegetation cover (FVC) in the study area derived from Landsat 8 imagery on (a) 26 August 2013 and (b) 24 August 2018. (c) The corresponding interannual trend of FVC from 2013 to 2018.
The growth rate and temporal trend of FVC were calculated (see Figure 11c and Figure 12a). In the dune areas and surrounding regions, the FVC growth rate was approximately 0.02/a, indicating a gradual increase in vegetation around the sand dunes. It can be inferred that the persistent increase in vegetation cover from inter-dune corridors and adjacent regions can reduce the surface wind speed, inhibit the movement of sand particles, and cut off the sediment supply.
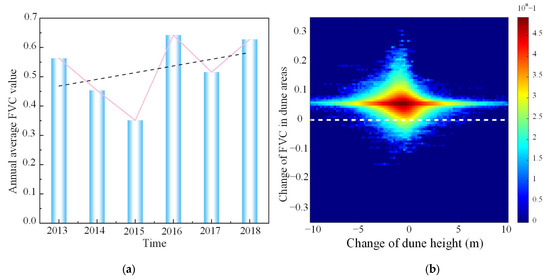
Figure 12.
(a) Interannual variation in the average FVC from 2013 to 2018; (b) analysis of the correlation between the change in dune height and the change in FVC.
To further demonstrate the above-mentioned inference, we conducted an analysis of the correlation between the height change (denoted by ) of sand dunes and the change in FVC (denoted by ) from 2013 to 2018, as shown in Figure 12b. From the displayed two-dimensional plane, there are several insights to be gained. Firstly, the values of are mainly concentrated within the range of around −5.0 m to 3.5 m and their mean (denoted by ) is close to −1.0 m, reflecting that the height of sand dunes indeed decreases when the dune topography acquired on 26 December 2012 is acting as the reference. Secondly, pixels with in the total ones account for 99.3% and their mean (denoted by ) is around 0.06, demonstrating that the FVC indeed increases in sand dune areas in the study period. Thirdly, starting from the , whether it moves to its left or to its right on the horizontal axis, the gradually tends to the . Obviously, when the is near the , the increase in the FVC is uneven. Even, due to the asymmetric distribution above and below the , it can be clearly seen that the degree of sand dune height reduction when the is greater than the is more severe than that when is less than the .
This long-term trend coincides with extensive ecological restoration initiatives implemented by the Chinese government, including engineering-based sand fixation, afforestation, grass planting, aerial grass seeding, and fence enclosures [45,51]. Since 2013, the Key Water and Ecological Comprehensive Management Project in Hanggin Banner in Ordos City has implemented. By 2016, 14 km2 of vegetation had been planted, achieving a survival rate of 90%. Additionally, 17.35 km of ecological embankments were constructed, further improving the regional ecological environment. Collectively, these facts further indicate that the decrease in the sand dune height might be due to the interruption of the sand supply.
6. Conclusions
This study develops a strategy for quantifying sand dune height change in desert environments using high-quality bistatic interferometric data and a DEM differential method. The northwestern Kubuqi desert was selected as the test area, with TanDEM-X InSAR data acquired on 26 December 2012 and 25 January 2018. In addition, the ICESat-2 data acted as the reference. Accuracy assessment in non-dune areas demonstrated the reliability of the bistatic InSAR-derived DEMs, with an RMSE of about 0.9 m. DEM differential analysis revealed an overall dune height decrease of about 1.0 m after identifying DEM errors. Further, complementary investigations on the vegetation coverage and the wind conditions suggest that enhanced surface stabilization has substantially reduced sediment availability and transport capacity. With the increase in high-resolution bistatic and formation-flying InSAR satellites in orbit, like China’s Hongtu-1, LT-1, and Tianhui-2, etc., the research on high-precision DEM reconstruction and the height deformation monitoring based on multi-temporal InSAR data will further attract more attention.
Author Contributions
Conceptualization, C.L., R.L. and H.W.; methodology, C.L. and H.W.; software, C.L., R.L. and H.W.; validation, C.L. and H.W.; writing—original draft preparation, C.L. and H.W.; writing—review and editing, all authors; supervision, R.L., H.W., Y.Y., C.M. and N.W.; funding acquisition, R.L. and H.W. All authors have read and agreed to the published version of the manuscript.
Funding
This research was funded by the Natural Science Foundation project of Inner Mongolia (grant number 2024MS04006), the National Natural Science Foundation of China (grant number 42204024), Inner Mongolia Autonomous Region Water Conservancy Science and Technology Special Project (grant number NSLKJ2024002-03), the High-level/excellent doctoral talents introduction research project in Inner Mongolia Agricultural University (grant number NDYB2022-27), and Research on the Quality Evaluation System of Dual line Blended Teaching in Vocational Colleges (grant number NZJGH2024162).
Data Availability Statement
The TanDEM-X data used in this study can be freely downloaded or ordered from https://tandemx-science.dlr.de/ (accessed on 30 October 2021). The Landsat 8 data used in this study can be freely downloaded or ordered from https://www.gscloud.cn/ (accessed on 18 December 2024). The ICESat-2 data used in this study can be freely downloaded or ordered from https://nsidc.org/ (accessed on 26 October 2025).
Acknowledgments
The TanDEM-X data were provided as part of a science data project conducted by the German Aerospace Centre (Proposal ID. NTI_BIST7299). The TanDEM-X DEM data were freely downloaded from the DLR.
Conflicts of Interest
The authors declare no conflicts of interest.
References
- Bruno, L.; Horvat, M.; Raffaele, L. Windblown sand along railway infrastructures: A review of challenges and mitigation measures. J. Wind Eng. Ind. Aerodyn. 2018, 177, 340–365. [Google Scholar] [CrossRef]
- Wang, Z.; Shi, Y.; Zhang, Y. Review of Desert Mobility Assessment and Desertification Monitoring Based on Remote Sensing. Remote Sens. 2023, 15, 4412. [Google Scholar] [CrossRef]
- D’Ettorre, U.S.; Liso, I.S.; Parise, M. Desertification in karst areas: A review. Earth-Sci. Rev. 2024, 253, 104786. [Google Scholar] [CrossRef]
- Hermas, E.; Leprince, S.; El-Magd, I.A. Retrieving sand dune movements using sub-pixel correlation of multi-temporal optical remote sensing imagery, northwest Sinai Peninsula, Egypt. Remote Sens. Environ. 2012, 121, 51–60. [Google Scholar] [CrossRef]
- Ali, E.; Xu, W.; Xie, L.; Ding, X. Assessment of aeolian activity in the Bodélé Depression, Chad: A dense spatiotemporal time series from Landsat-8 and Sentinel-2 data. Front. Environ. Sci. 2022, 9, 808802. [Google Scholar] [CrossRef]
- Zucca, C.; Fleiner, R.; Bonaiuti, E.; Kang, U. Land degradation drivers of anthropogenic sand and dust storms. Catena 2022, 219, 106575. [Google Scholar] [CrossRef]
- Arteaga, C.; Juan de Sanjosé, J.; Serrano, E. Landforms Terrestrial photogrammetric techniques applied to the control of a parabolic dune in the Liencres dune system, Cantabria (Spain). Earth Surf. Process. Landf. 2008, 33, 2201–2210. [Google Scholar] [CrossRef]
- Craddock, R.A.; Tooth, S.; Zimbelman, J.R.; Wilson, S.A.; Maxwell, T.A.; Kling, C. Temporal observations of a linear sand dune in the Simpson Desert, central Australia: Testing models for dune formation on planetary surfaces. J. Geophys. Res.-Planets 2015, 120, 1736–1750. [Google Scholar] [CrossRef]
- Xing, X.; Yang, Z.; Qian, G.; Zhou, G. Real-Time Kinematic Positioning (RTK) for Monitoring of Barchan Dune Migration in the Sanlongsha Dune Field, the Northern Kumtagh Sand Sea, China. Remote Sens. 2023, 15, 4728. [Google Scholar] [CrossRef]
- Mitasova, H.; Overton, M.; Harmon, R.S. Geospatial analysis of a coastal sand dune field evolution: Jockey’s Ridge, North Carolina. Geomorphology 2005, 72, 204–221. [Google Scholar] [CrossRef]
- Derijckere, J.; Strypsteen, G.; Rauwoens, P. Early-stage development of an artificial dune with varying plant density and distribution. Geomorphology 2023, 437, 108806. [Google Scholar] [CrossRef]
- Fabbri, S.; Grottoli, E.; Armaroli, C.; Ciavola, P. Using High-Spatial Resolution UAV-Derived Data to Evaluate Vegetation and Geomorphological Changes on a Dune Field Involved in a Restoration Endeavour. Remote Sens. 2021, 13, 1987. [Google Scholar] [CrossRef]
- Ding, C.; Zhang, L.; Liao, M.; Feng, G.; Dong, J.; Ao, M.; Yu, Y. Quantifying the spatio-temporal patterns of dune migration near Minqin Oasis in northwestern China with time series of Landsat-8 and Sentinel-2 observations. Remote Sens. Environ. 2020, 236, 111498. [Google Scholar] [CrossRef]
- Baird, T.; Bristow, C.S.; Vermeesch, P. Measuring Sand Dune Migration Rates with COSI-Corr and Landsat: Opportunities and Challenges. Remote Sens. 2019, 11, 2423. [Google Scholar] [CrossRef]
- Singh Jasrotia, A.; Ahmad, S.; Ridwan, Q.; Ahmad Wani, Z.; Siddiqui, S.; Siddiqua, A.; Ali Morfeine aika, E. Estimation of Surface Ice Velocity of Durung Drung Glacier, Western Himalaya using COSI-Corr from Landsat images. Egypt. J. Remote Sens. Space Sci. 2024, 27, 369–381. [Google Scholar] [CrossRef]
- Xia, Z.; Lü, P.; Ma, F.; Cao, M.; Yu, J. Quantifying dune migration patterns and influencing factors in the central Sahara Desert. Catena 2024, 235, 107686. [Google Scholar] [CrossRef]
- Dong, Y.; Chang, H.-C.; Liu, J. Measuring Sand Dune Dynamics in the Badain Jaran Desert, China, Using Multitemporal Landsat Imagery. Remote Sens. 2022, 14, 6343. [Google Scholar] [CrossRef]
- Solazzo, D.; Sankey, J.B.; Sankey, T.T.; Munson, S.M. Mapping and measuring aeolian sand dunes with photogrammetry and LiDAR from unmanned aerial vehicles (UAV) and multispectral satellite imagery on the Paria Plateau, AZ, USA. Geomorphology 2018, 319, 174–185. [Google Scholar] [CrossRef]
- Dong, P. Automated measurement of sand dune migration using multi-temporal lidar data and GIS. Int. J. Remote Sens. 2015, 36, 5426–5447. [Google Scholar] [CrossRef]
- Pedersen, A.; Kocurek, G.; Mohrig, D.; Smith, V. Landforms Dune deformation in a multi-directional wind regime: White Sands Dune Field, New Mexico. Earth Surf. Process. Landf. 2015, 40, 925–941. [Google Scholar] [CrossRef]
- Liosis, N.; Marpu, P.R.; Pavlopoulos, K.; Ouarda, T.B.M.J. Ground subsidence monitoring with SAR interferometry techniques in the rural area of Al Wagan, UAE. Remote Sens. Environ. 2018, 216, 276–288. [Google Scholar] [CrossRef]
- Niu, C.; Zhang, H.; Liu, W.; Li, R.; Hu, T. Using a fully polarimetric SAR to detect landslide in complex surroundings: Case study of 2015 Shenzhen landslide. ISPRS-J. Photogramm. Remote Sens. 2021, 174, 56–67. [Google Scholar] [CrossRef]
- Guan, T.; Chang, S.; Deng, Y.; Xue, F.; Wang, C.; Jia, X. Oriented SAR Ship Detection Based on Edge Deformable Convolution and Point Set Representation. Remote Sens. 2025, 17, 1612. [Google Scholar] [CrossRef]
- Havivi, S.; Amir, D.; Schvartzman, I.; August, Y.; Maman, S.; Rotman, S.R.; Blumberg, D.G. Mapping dune dynamics by InSAR coherence. Earth Surf. Process. Landf. 2018, 43, 1229–1240. [Google Scholar] [CrossRef]
- Delgado Blasco, J.M.; Chini, M.; Verstraeten, G.; Hanssen, R.F. Sand Dune Dynamics Exploiting a Fully Automatic Method Using Satellite SAR Data. Remote Sens. 2020, 12, 3993. [Google Scholar] [CrossRef]
- Abdelkareem, M.; Gaber, A.; Abdalla, F.; El-Din, G.K. Use of optical and radar remote sensing satellites for identifying and monitoring active/inactive landforms in the driest desert in Saudi Arabia. Geomorphology 2020, 362, 107197. [Google Scholar] [CrossRef]
- Zhu, J.; Liu, G.; Zhao, R.; Ding, X.; Fu, H. ML based approach for inverting penetration depth of SAR signals over large desert areas. Remote Sens. Environ. 2023, 295, 113643. [Google Scholar] [CrossRef]
- Mahmoud, A.M.A.; Novellino, A.; Hussain, E.; Marsh, S.; Psimoulis, P.; Smith, M. The Use of SAR Offset Tracking for Detecting Sand Dune Movement in Sudan. Remote Sens. 2020, 12, 3410. [Google Scholar] [CrossRef]
- Schepanski, K.; Wright, T.; Knippertz, P. Evidence for flash floods over deserts from loss of coherence in InSAR imagery. J. Geophys. Res.-Atmos. 2012, 117, D20101. [Google Scholar] [CrossRef]
- Song, Y.; Chen, C.; Xu, W.; Zheng, H.; Bao, A.; Lei, J.; Luo, G.; Chen, X.; Zhang, R.; Tan, Z. Mapping the temporal and spatial changes in crescent dunes using an interferometric synthetic aperture radar temporal decorrelation model. Aeolian Res. 2020, 46, 100616. [Google Scholar] [CrossRef]
- Blumberg, D.G. Analysis of large aeolian (wind-blown) bedforms using the Shuttle Radar Topography Mission (SRTM) digital elevation data. Remote Sens. Environ. 2006, 100, 179–189. [Google Scholar] [CrossRef]
- Rizzoli, P.; Dell’Amore, L.; Bueso-Bello, J.-L.; Gollin, N.; Carcereri, D.; Martone, M. On the derivation of volume decorrelation from TanDEM-X bistatic coherence. IEEE J. Sel. Top. Appl. Earth Observ. Remote Sens. 2022, 15, 3504–3518. [Google Scholar] [CrossRef]
- Hugonnet, R.; McNabb, R.; Berthier, E.; Menounos, B.; Nuth, C.; Girod, L.; Farinotti, D.; Huss, M.; Dussaillant, I.; Brun, F. Accelerated global glacier mass loss in the early twenty-first century. Nature 2021, 592, 726–731. [Google Scholar] [CrossRef]
- Andualem, T.G.; Peters, S.; Hewa, G.A.; Myers, B.R.; Boland, J.; Pezzaniti, D. Channel morphological change monitoring using high-resolution LiDAR-derived DEM and multi-temporal imageries. Sci. Total Environ. 2024, 921, 171104. [Google Scholar] [CrossRef]
- Medwedeff, W.G.; Clark, M.K.; Zekkos, D. Regional back-analysis of earthquake triggered landslide inventories: A 2D method for estimating rock strength from remote sensing data. J. Geophys. Res.-Earth Surf. 2025, 130, e2023JF007471. [Google Scholar] [CrossRef]
- Wang, H.; Zhou, Y.; Fu, H.; Zhu, J.; Yu, Y.; Li, R.; Zhang, S.; Qu, Z.; Hu, S. Parameterized Modeling and Calibration for Orbital Error in TanDEM-X Bistatic SAR Interferometry over Complex Terrain Areas. Remote Sens. 2021, 13, 5124. [Google Scholar] [CrossRef]
- Markus, T.; Neumann, T.; Martino, A.; Abdalati, W.; Brunt, K.; Csatho, B.; Farrell, S.; Fricker, H.; Gardner, A.; Harding, D.; et al. The Ice, Cloud, and land Elevation Satellite-2 (ICESat-2): Science requirements, concept, and implementation. Remote Sens. Environ. 2017, 190, 260–273. [Google Scholar] [CrossRef]
- Li, Y.; Gao, S.; Zhu, J.; Fu, H.; Wang, C.; Zhao, R.; Zhou, Y. A Gradient-Constrained Morphological Operation for Retrieving Subcanopy Topography Over Densely Forested Areas from ICESat-2/ATL03 Data. IEEE Trans. Geosci. Remote Sensing. 2024, 62, 4408213. [Google Scholar] [CrossRef]
- Li, G.; Tan, L.; Yang, B.; Che, T.; Feng, G.; Ljungqvist, F.C.; Luo, Y.; Du, H.; Zhao, H.; Zhang, Y. Site selection of desert solar farms based on heterogeneous sand flux. npj Clim. Atmos. Sci. 2024, 7, 61. [Google Scholar] [CrossRef]
- He, Y.; Lei, S.; Dai, W.; Chen, X.; Wang, B.; Sheng, Y.; Lin, H. DEM-based topographic change detection considering the spatial distribution of errors. Geo-Spat. Inf. Sci. 2025, 28, 497–510. [Google Scholar] [CrossRef]
- Bailey, G.; Li, Y.; McKinney, N.; Yoder, D.; Wright, W.; Washington-Allen, R. Las2DoD: Change Detection Based on Digital Elevation Models Derived from Dense Point Clouds with Spatially Varied Uncertainty. Remote Sens. 2022, 14, 1537. [Google Scholar] [CrossRef]
- Rehman, K.; Fareed, N.; Chu, H.-J. NASA ICESat-2: Space-Borne LiDAR for Geological Education and Field Mapping of Aeolian Sand Dune Environments. Remote Sens. 2023, 15, 2882. [Google Scholar] [CrossRef]
- Wang, M.; Li, H.; Liu, Y.; Li, H. Multi-Source DEM Vertical Accuracy Evaluation of Taklimakan Desert Hinterland Based on ICESat-2 ATL08 and UAV Data. Remote Sens. 2025, 17, 1807. [Google Scholar] [CrossRef]
- Itzkin, M.; Moore, L.J.; Ruggiero, P.; Hacker, S.D.; Biel, R.G. The relative influence of dune aspect ratio and beach width on dune erosion as a function of storm duration and surge level. Earth Surf. Dyn. 2021, 9, 1223–1237. [Google Scholar] [CrossRef]
- Dörwald, L.; Lehmkuhl, F.; Delobel, L.; Yang, X.; Stauch, G. Dynamics of dunes and climate variability over the last five decades: A remote sensing analysis of regional contrasts on the northeastern Tibetan Plateau and the adjacent Hexi Corridor. Glob. Planet. Chang. 2025, 252, 104873. [Google Scholar] [CrossRef]
- Yang, H.; Cao, J.; Hou, X. Characteristics of Aeolian Dune, Wind Regime and Sand Transport in Hobq Desert, China. Appl. Sci. 2019, 9, 5543. [Google Scholar] [CrossRef]
- Ge, W.; Deng, L.; Wang, F.; Han, J. Quantifying the contributions of human activities and climate change to vegetation net primary productivity dynamics in China from 2001 to 2016. Sci. Total Environ. 2021, 773, 145648. [Google Scholar] [CrossRef]
- Ma, N.; Cao, S.; Bai, T.; Yang, Z.; Cai, Z.; Sun, W. Assessment of Vegetation Dynamics in Xinjiang Using NDVI Data and Machine Learning Models from 2000 to 2023. Sustainability 2025, 17, 306. [Google Scholar] [CrossRef]
- Hou, H.; Li, R.; Zheng, H.; Tong, C.; Wang, J.; Lu, H.; Wang, G.; Qin, Z.; Wang, W. Regional NDVI Attribution Analysis and Trend Prediction Based on the Informer Model: A Case Study of the Maowusu Sandland. Agronomy 2023, 13, 2882. [Google Scholar] [CrossRef]
- Jiapaer, G.; Chen, X.; Bao, A. A comparison of methods for estimating fractional vegetation cover in arid regions. Agric. For. Meteorol. 2011, 151, 1698–1710. [Google Scholar] [CrossRef]
- Li, Y.; Cui, J.; Zhang, T.; Okuro, T.; Drake, S. Effectiveness of sand-fixing measures on desert land restoration in Kerqin Sandy Land, northern China. Ecol. Eng. 2009, 35, 118–127. [Google Scholar] [CrossRef]
Disclaimer/Publisher’s Note: The statements, opinions and data contained in all publications are solely those of the individual author(s) and contributor(s) and not of MDPI and/or the editor(s). MDPI and/or the editor(s) disclaim responsibility for any injury to people or property resulting from any ideas, methods, instructions or products referred to in the content. |
© 2025 by the authors. Licensee MDPI, Basel, Switzerland. This article is an open access article distributed under the terms and conditions of the Creative Commons Attribution (CC BY) license (https://creativecommons.org/licenses/by/4.0/).