Article

A Class-Aware Unsupervised Domain Adaptation Framework for Cross-Continental Crop Classification with Sentinel-2 Time Series

College of Geography and Remote Sensing Science, Xinjiang University, Urumqi 830046, China
*
Author to whom correspondence should be addressed.
Remote Sens. 2025, 17(22), 3762; https://doi.org/10.3390/rs17223762
Submission received: 30 September 2025 / Revised: 6 November 2025 / Accepted: 15 November 2025 / Published: 19 November 2025
(This article belongs to the Special Issue Advances in Remote Sensing for Crop Monitoring and Food Security)

Highlights

What are the main findings?
  • A novel spatio-temporal feature extractor that incorporates a class-aware feature alignment strategy effectively mitigates the domain shift challenge in cross-continental adaptation of crop classification.
  • A new unsupervised framework shows robust cross-continental adaptation on difficult categories, boosting the Macro F1-score from 65.50% to 96.56%.
What is the implication of the main finding?
  • This new approach makes the model more reliable, providing a foundation for achieving high accuracy across diverse agricultural systems.
  • This robust performance makes it practical to automatically map large crop areas without needing costly local data, which helps support global food security assessments.

Abstract

Accurate and large-scale crop mapping is crucial for global food security, yet its performance is often hindered by domain shift when models trained in one region are applied to another. This is particularly challenging in cross-continental scenarios where variations in climate, soil, and farming systems are significant. To address this, we propose PLCM (PSAE-LTAE + Class-aware MMD), an unsupervised domain adaptation (UDA) framework for crop classification using Sentinel-2 satellite image time series. The framework features two key innovations: (1) a Pixel-Set Attention Encoder (PSAE), which intelligently aggregates spatial features within parcels by assigning weights to individual pixels, enhancing robustness against noise and intra-parcel heterogeneity; and (2) a class-aware Maximum Mean Discrepancy (MMD) loss function that performs fine-grained feature alignment within each crop category, effectively mitigating negative transfer caused by domain shift while preserving class-discriminative information. We validated our framework on a challenging cross-continental, cross-year task, transferring a model trained on data from the source domain in the United States (2022) to an unlabeled target domain in Wensu County, Xinjiang, China (2024). The results demonstrate the robust performance of PLCM. While achieving a competitive overall Macro F1-score of 96.56%, comparable to other state-of-the-art UDA methods, its primary advantage is revealed in a granular per-class analysis. This analysis shows that PLCM provides a more balanced performance by particularly excelling at identifying difficult-to-adapt categories (e.g., Cotton), demonstrating practical robustness. Ablation studies further confirmed that both the PSAE module and the class-aware MMD strategy were critical to this performance gain. Our study shows that the PLCM framework can effectively learn domain-invariant and class-discriminative features, offering an effective and robust solution for high-accuracy, large-scale crop mapping across diverse geographical regions.

1. Introduction

Accurate monitoring of crop type distribution plays a crucial role in food security research, crop growth monitoring, yield estimation, and the formulation of sustainable agricultural policies [1,2,3]. Over the past decades, such information has been collected primarily through field surveys and statistical reports, which are both costly and time-consuming. In recent years, however, advances in cloud computing and satellite image time series (SITS)—capable of capturing dynamic changes throughout the entire growing season across large areas—have opened new possibilities. Satellites like Sentinel-2, for instance, offer high temporal and spatial resolution (with a revisit interval of up to 5 days and a 10-meter spatial resolution) as well as rich spectral information, making them a valuable data source for generating high-precision time-series crop growth curves [4,5]. Together, these technological advancements serve as effective tools for large-scale crop mapping [6]. Consequently, there is an urgent need to develop accurate and automated classification methods that leverage these capabilities.
Currently, widely used crop classification methods include machine learning approaches, including regression trees, decision trees [7], random forest classifiers [8,9], support vector machines [10], and deep learning methods, such as LSTMs [11], CNNs [12], and RNNs [13]. Deep learning methods, in particular, have demonstrated strong performance, as they can extract complex, multi-level crop features from time-series remote sensing images [14]. However, to achieve optimal classification results, these approaches require large volumes of training data [15,16]. Unfortunately, creating labeled samples for cropland areas is a time-intensive and costly process. To address this challenge, researchers have explored a potential solution for deep learning-based crop classification: transferring models trained in regions with sufficient annotated samples (i.e., the source domain) to unlabeled target study areas (i.e., the target domain) [17,18,19,20]. While these transfer learning methods show promising outcomes, they have a notable limitation: they only perform effectively when the target region shares similar agro-ecological conditions with the source domain. When applied beyond this scope, their generalization ability is often severely compromised due to “domain shift”, which denotes a phenomenon where climatic and environmental differences between the source and target domains lead to variations in the spectral and temporal characteristics of crops [21,22].
To tackle domain shift, unsupervised domain adaptation (UDA) and its variants [23,24,25,26] have been introduced into the field of remote sensing [27,28,29]. These methods have been applied in crop mapping and land cover mapping studies to reduce domain discrepancies and enhance the effectiveness of knowledge transfer from a label-rich source domain to an unlabeled target domain. For instance, Wang et al. [30] proposed a UDA method based on differences in climatic indicators—constructed using six climatic variables (including solar radiation, thermal conditions, moisture, and stress factors)—to minimize discrepancies between the source and target domains. Wang et al. [31] developed an innovative Phenology Alignment Network (PAN) framework, which adopts a twin-branch architecture consisting of two identical deep learning models. This framework incorporates a multi-scale deep feature alignment module that constrains the distribution of deep features generated from the two branches using Maximum Mean Discrepancy (MMD) loss. Additionally, Nyborg et al. [21] proposed the TimeMatch model, which explicitly captures the underlying temporal offset in data by estimating the temporal gap between two regions and uses this offset to generate pseudo-labels for the target domain.
Although these methods have achieved some success, they typically treat the entire domain as a single unit for global alignment. For tasks highly sensitive to category-specific semantics (e.g., crop classification), this global alignment strategy has inherent limitations: it may incorrectly force the alignment of crop categories that are spectrally and temporally similar yet distinct, while failing to adequately bridge the distribution gaps of the same crop caused by inter-domain differences. This can result in negative transfer and a subsequent decline in classification performance.
To overcome these limitations, this paper proposes a class-aware unsupervised domain adaptation framework named PLCM (PSAE-LTAE + Class-aware MMD), specifically designed for cross-regional crop classification using Sentinel-2 time series imagery. The core idea of this framework is to introduce category-semantic information to upgrade the coarse-grained global feature alignment of traditional UDA methods to a more refined strategy of “intra-class alignment and inter-class separation”. To this end, we improve upon the existing PSE-LTAE model by proposing a novel spatio-temporal feature extractor, PSAE-LTAE, in which the Pixel-Set Attention Encoder (PSAE) can intelligently aggregate spatial features within a parcel to suppress noise interference. Subsequently, instead of using a standard MMD loss for global alignment, we introduce a class-aware MMD loss function. This strategy utilizes high-confidence pseudo-labels to independently compute and minimize the inter-domain discrepancy within each crop category, thereby effectively bridging the domain gap while avoiding feature confusion and negative transfer.
The contributions of this study are threefold:
  • Architectural Contribution: We propose a novel spatio-temporal feature extractor named PSAE-LTAE. This architecture innovatively incorporates a Pixel-Set Attention Encoder (PSAE) based on a self-attention mechanism. Compared to traditional statistical pooling methods, it can more robustly extract parcel representations, effectively mitigating the interference from mixed pixels and noise.
  • Methodological Contribution: We propose and validate a class-aware MMD alignment strategy. We demonstrate the limitations of global alignment in crop classification tasks and innovatively refine the application of MMD loss from the domain level to the category level. This strategy significantly enhances alignment precision, effectively mitigating negative transfer, and is key to achieving high-performance cross-domain classification.
  • Empirical Contribution: We thoroughly validate the framework’s effectiveness through a cross-continental, cross-year experiment. In a challenging transfer task from the US study area to Wensu, Xinjiang, China, our method (PLCM) outperforms multiple state-of-the-art UDA methods. Furthermore, comprehensive ablation studies systematically demonstrate the necessity and superiority of each innovative component.

2. Materials

2.1. Study Area
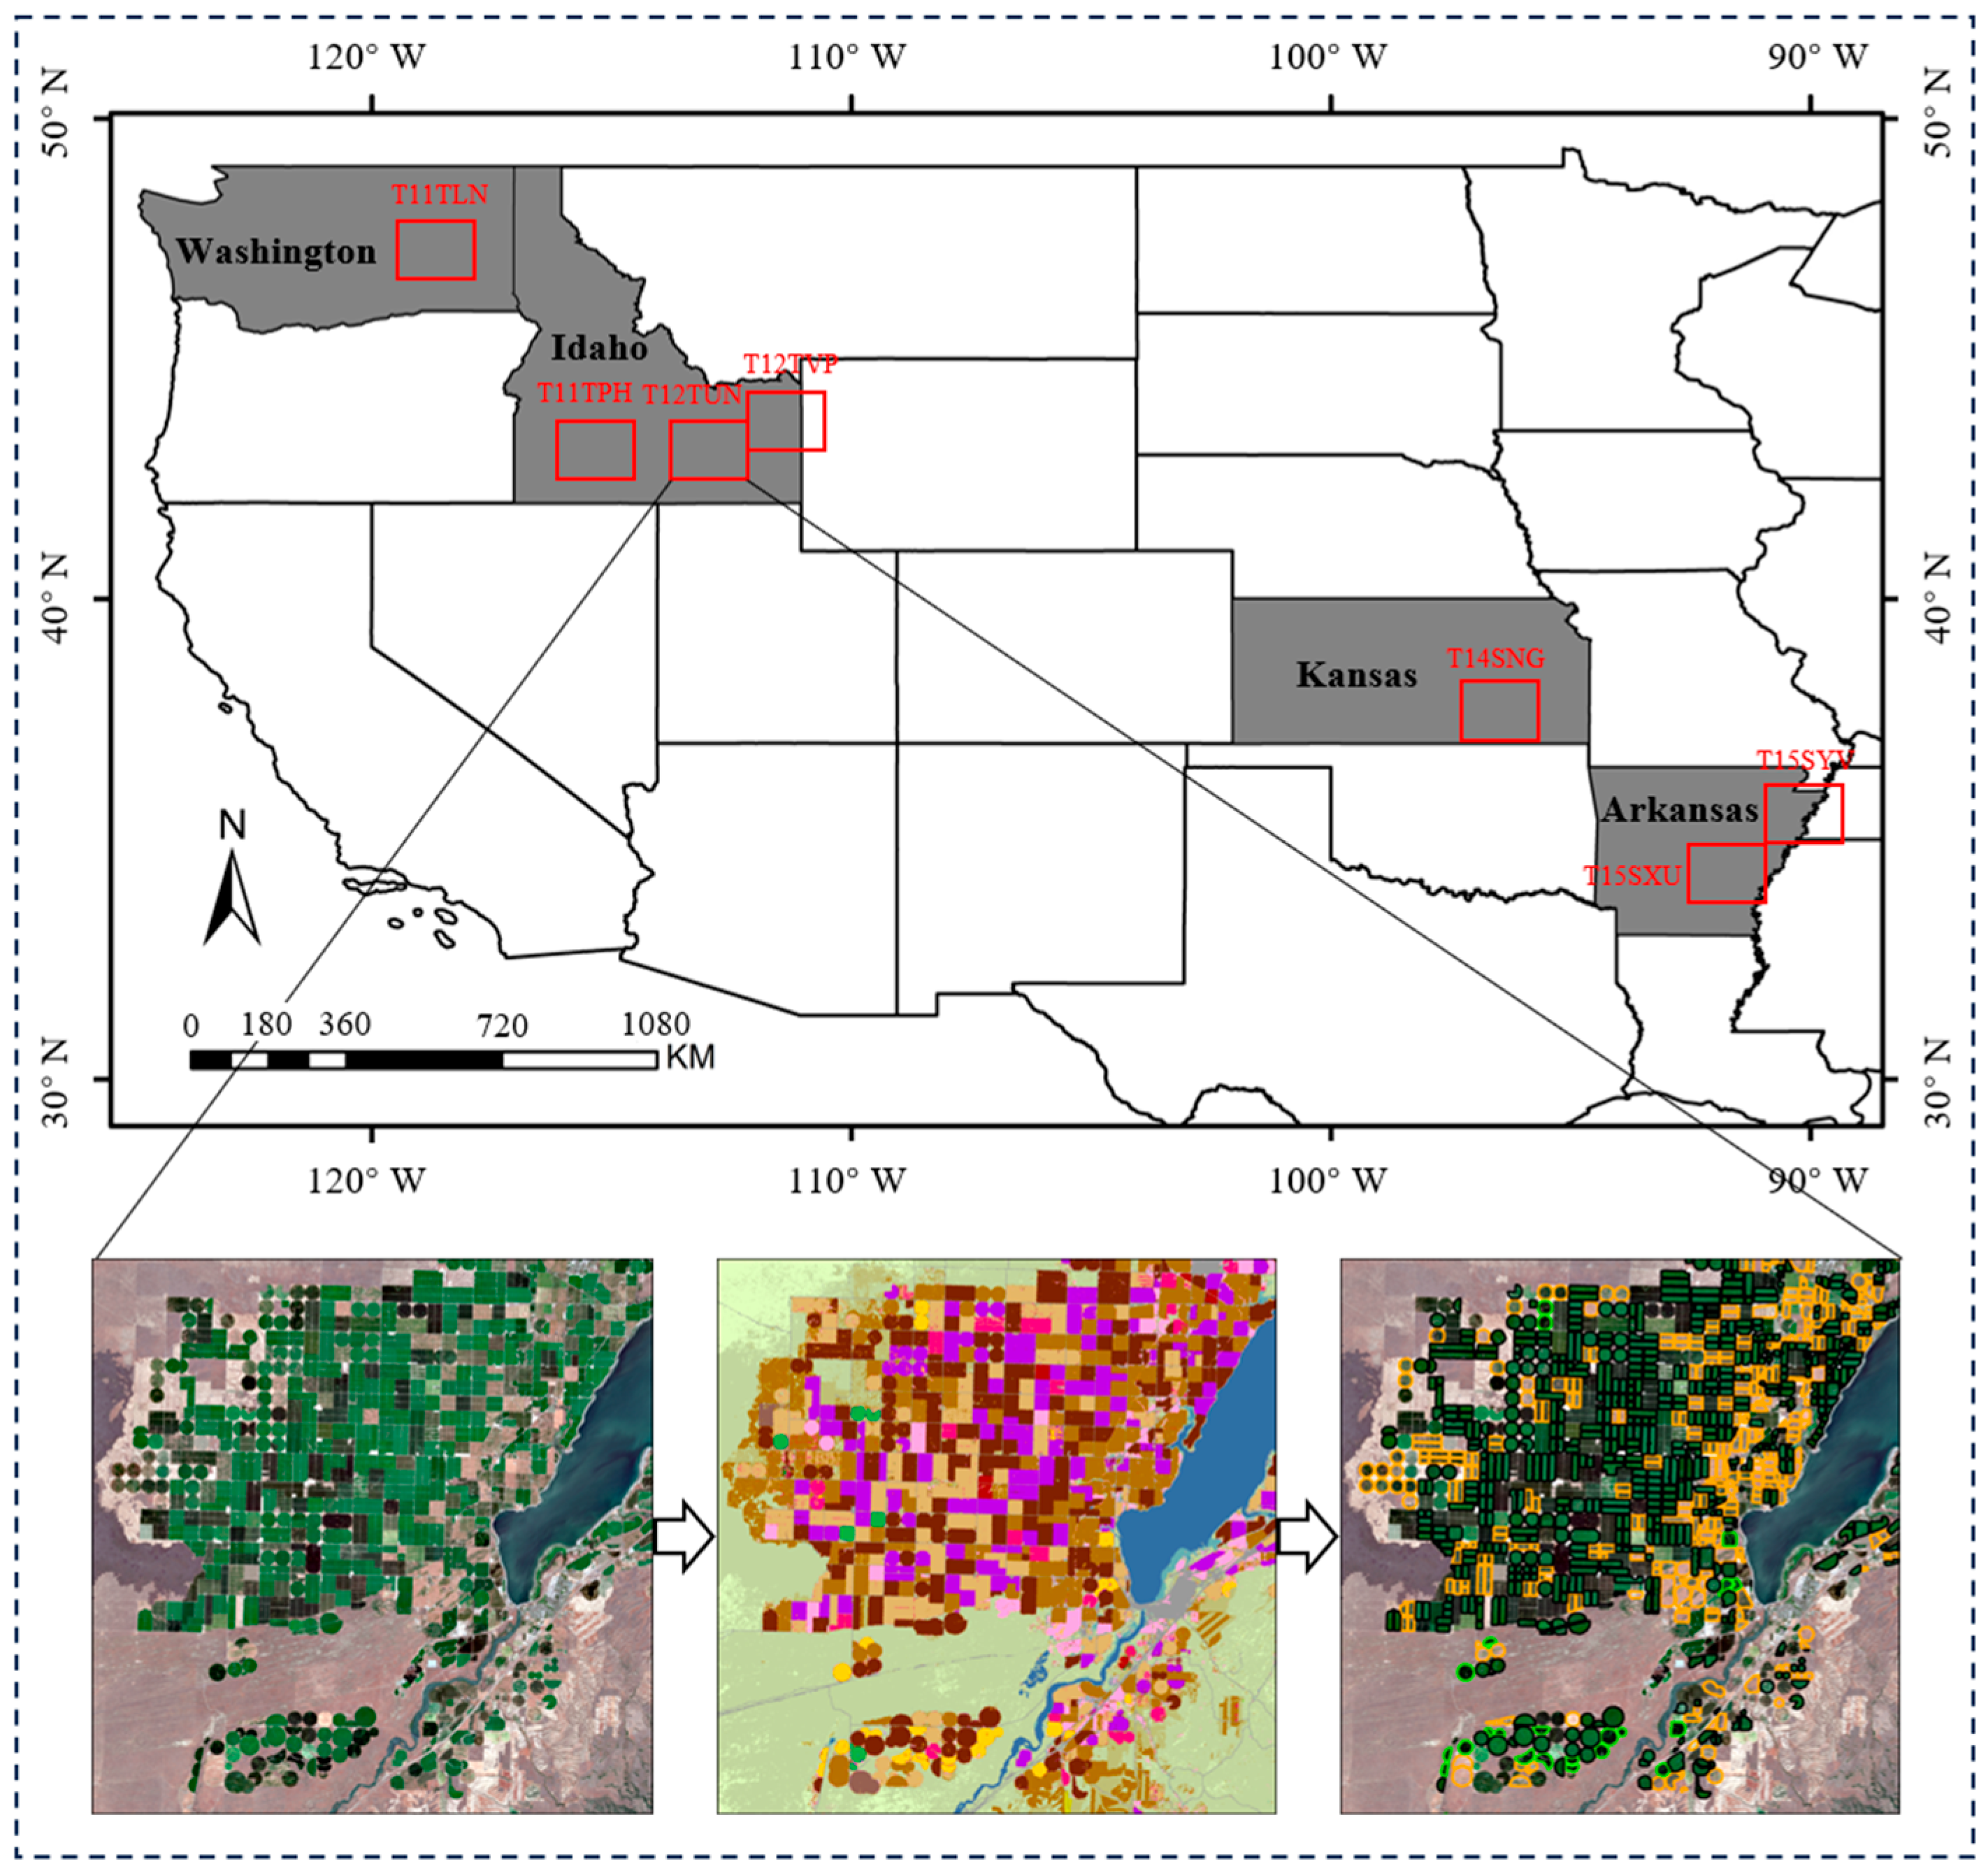
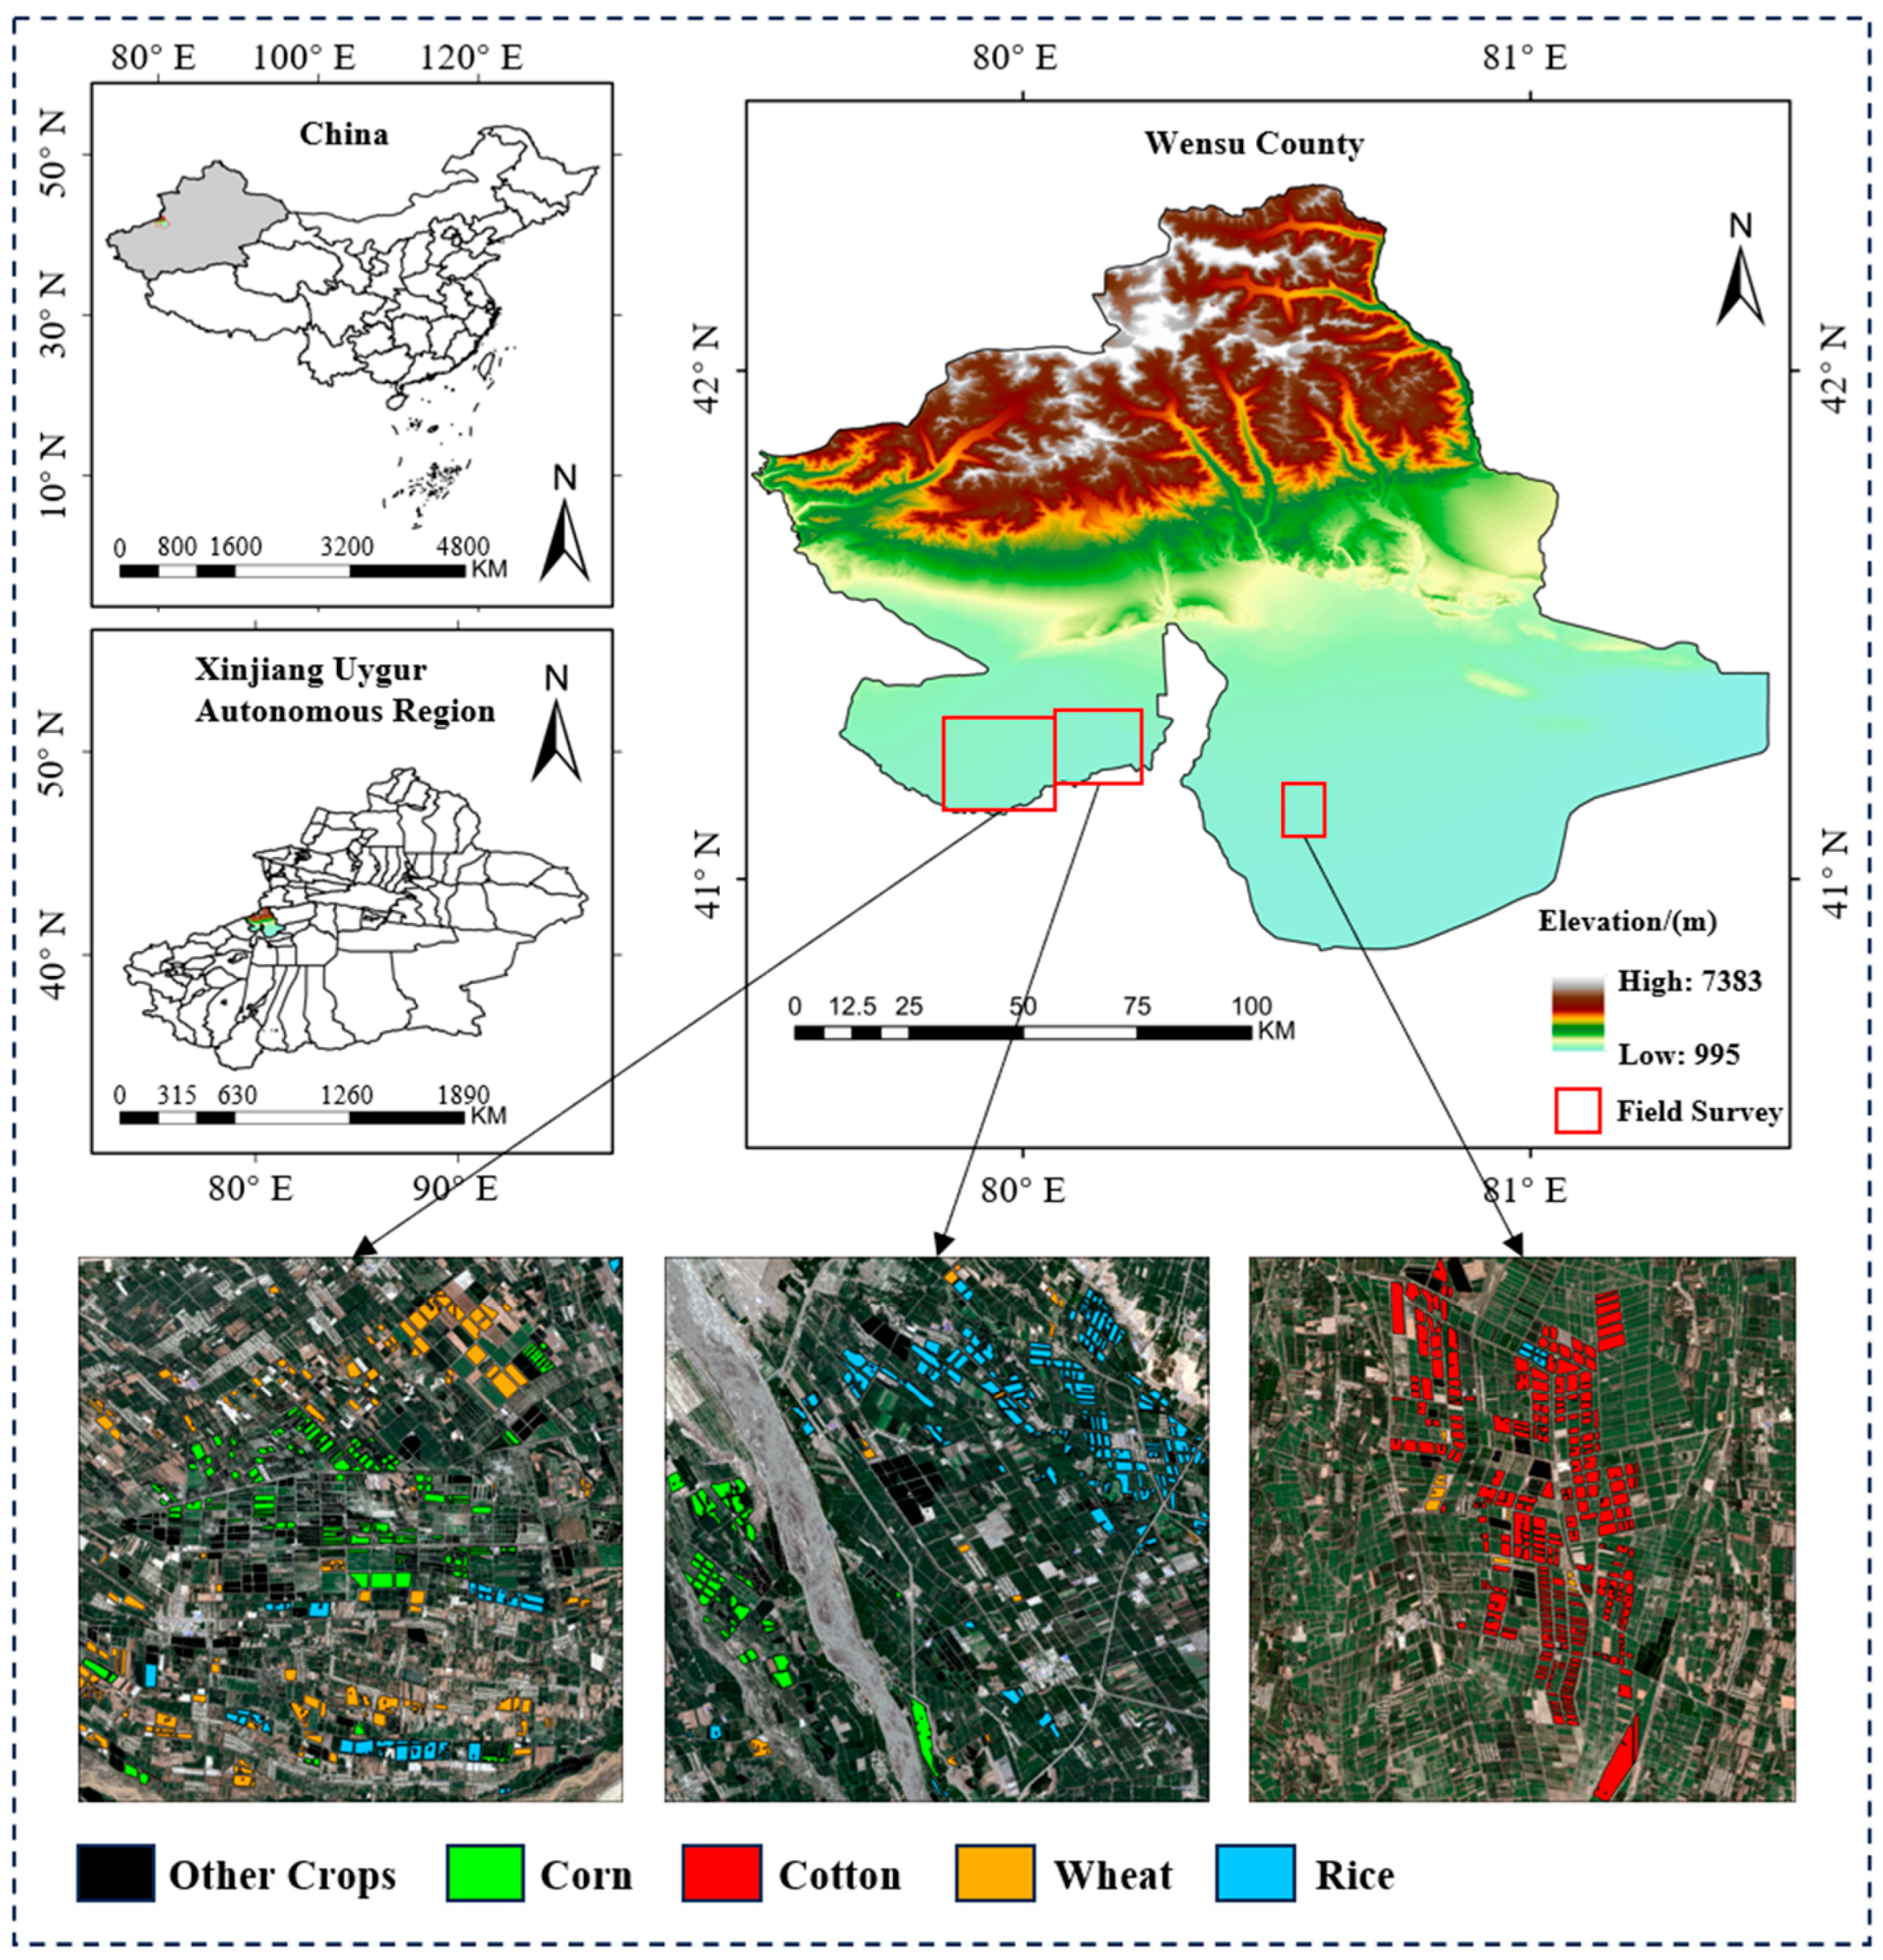
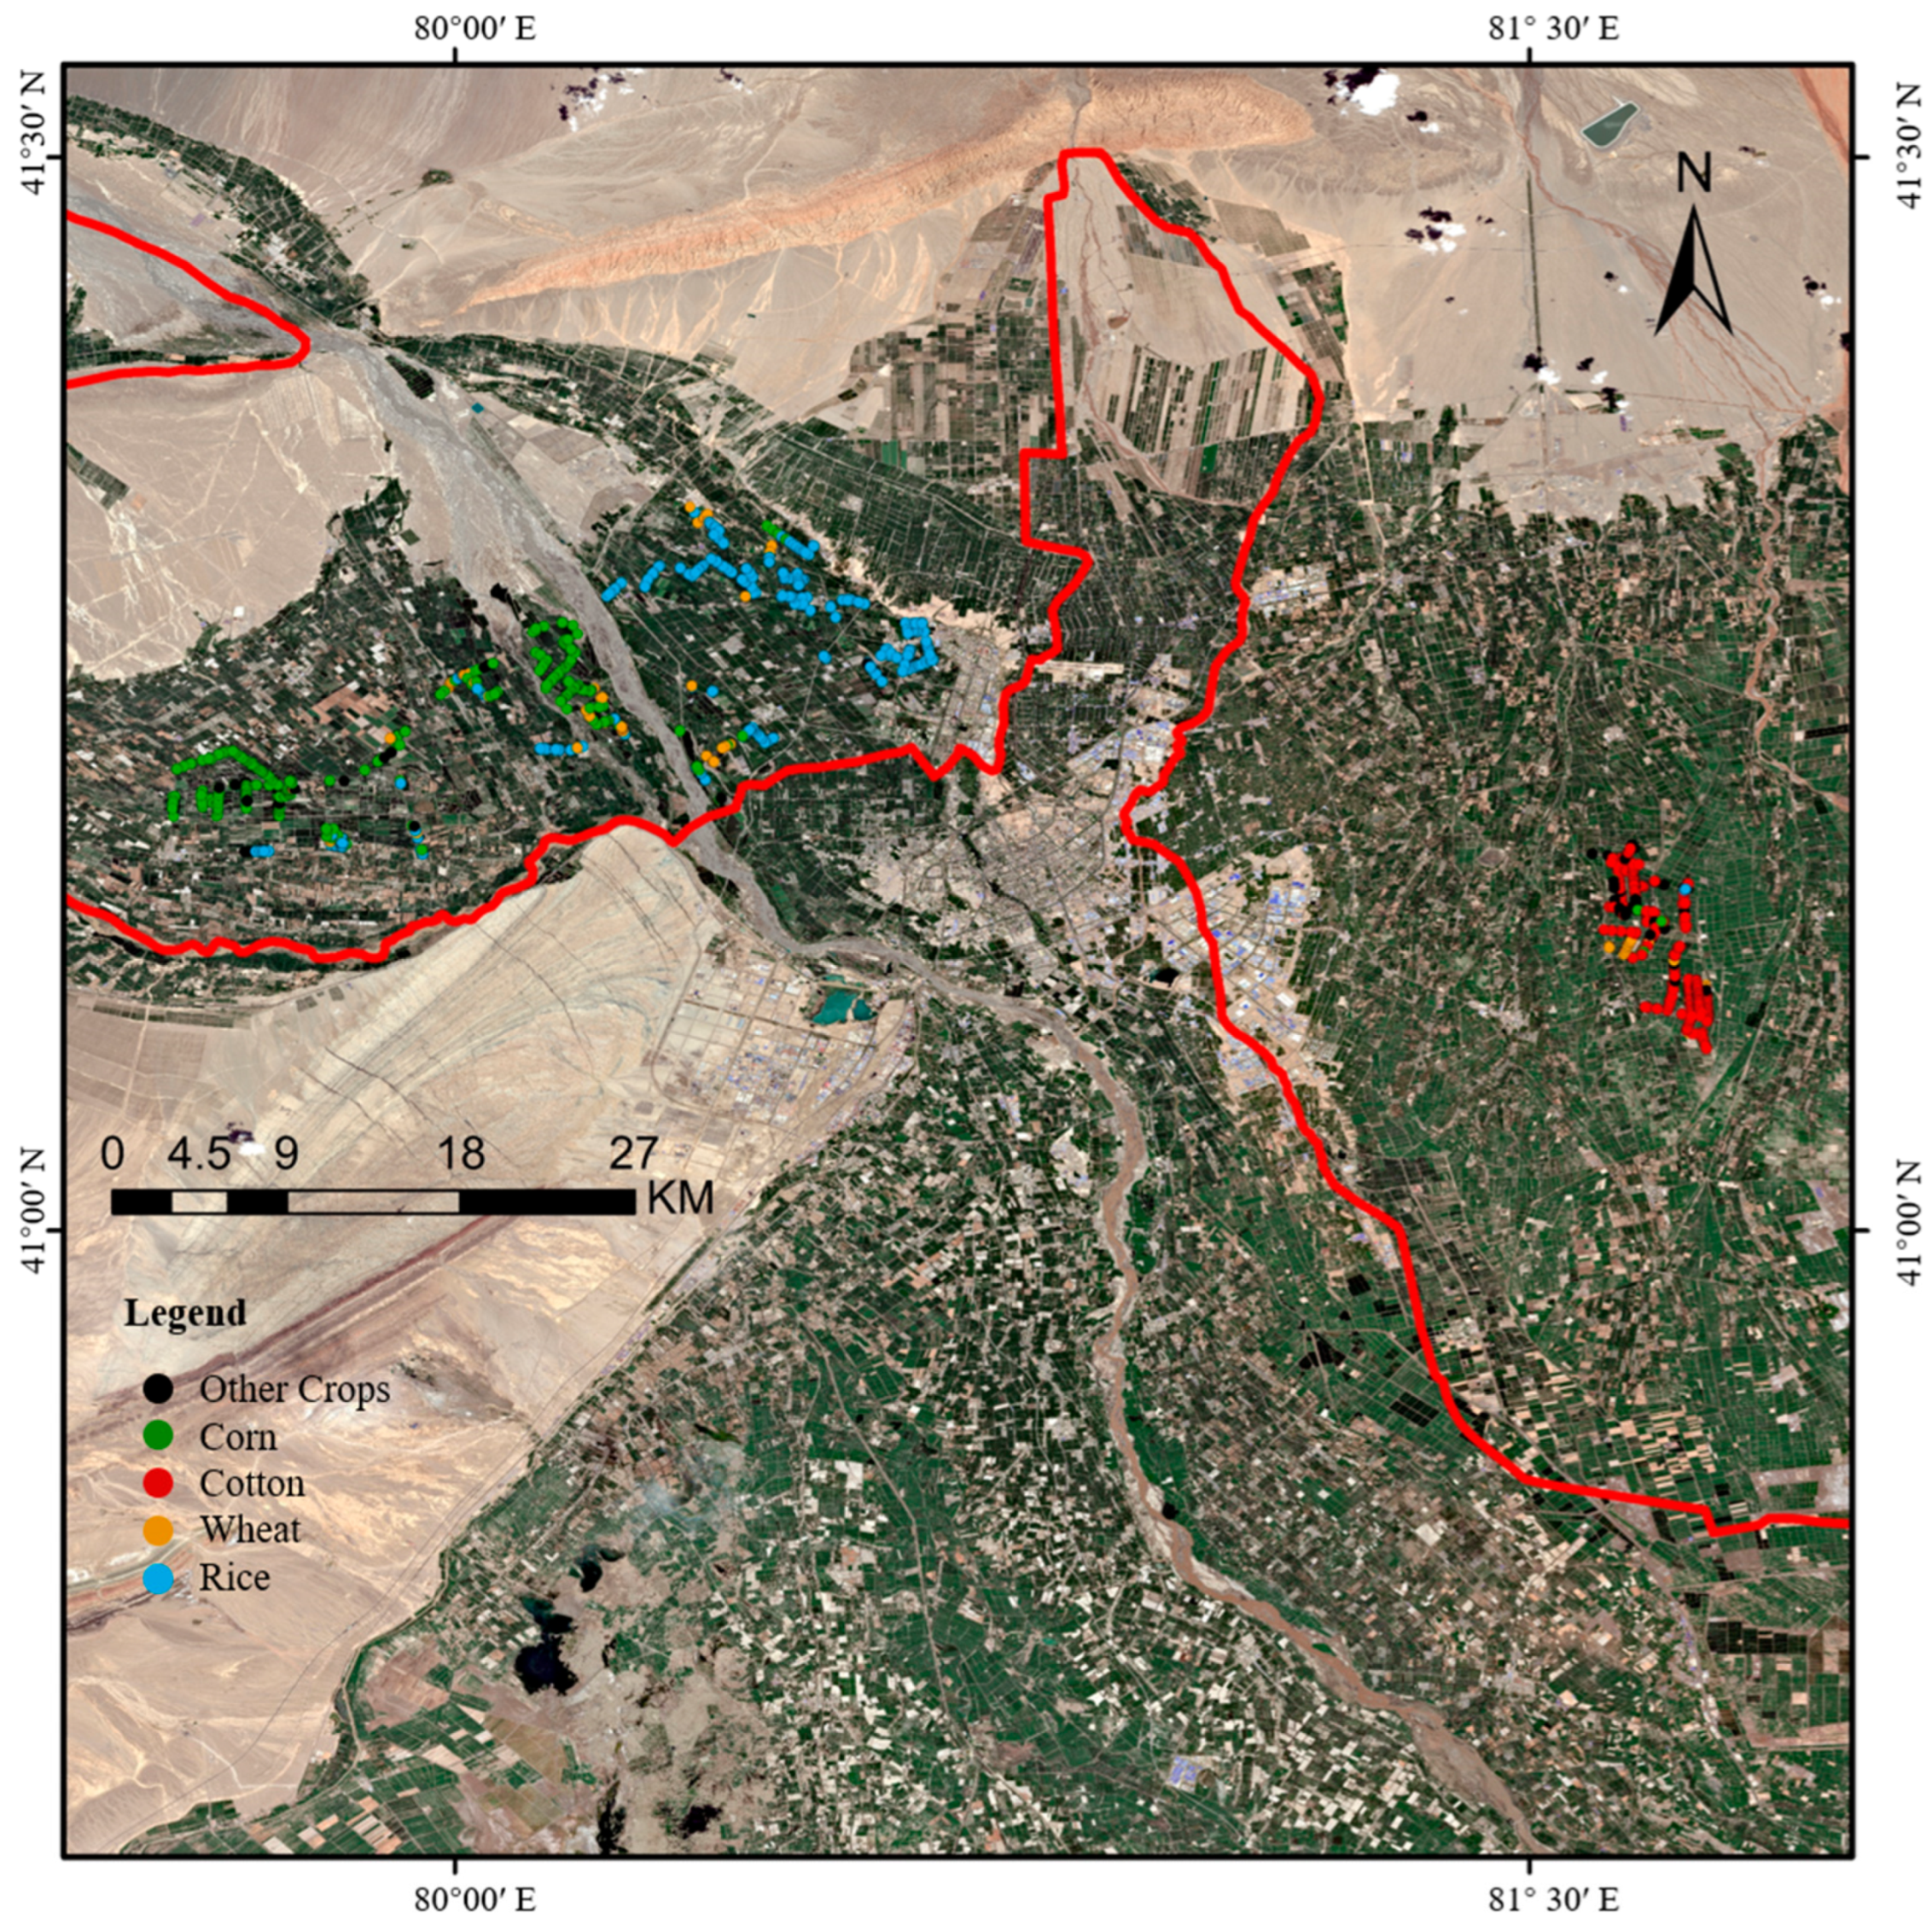
To validate the effectiveness of our proposed unsupervised domain adaptation method for crop classification, we selected seven sites located across Washington, Idaho, Kansas, and Arkansas in the United States as the source domain (Figure 1), and three sites in Wensu County, Aksu Prefecture, Xinjiang Uygur Autonomous Region, China, as the target domain (Figure 2). The source and target domains exhibit significant disparities in climatic conditions, soil types, farming systems, and crop phenology, constituting a challenging UDA scenario.
The U.S. study areas are distributed across eastern Washington, southern Idaho, southern Kansas, and east-central Arkansas. Eastern Washington is characterized by a temperate semi-arid climate with hot, dry summers and cold winters, featuring an average annual temperature of 10.7 °C and mean annual precipitation of 421 mm; the primary crop cultivated is wheat. Southern Idaho has a similar temperate semi-arid climate, with an average annual temperature of 12.4 °C and mean annual precipitation of 303 mm, where wheat and corn are the main crops. Southern Kansas experiences a humid subtropical climate with hot, humid summers and cold, dry winters, an average annual temperature of 14.1 °C, and mean annual precipitation of 773 mm; key crops include wheat, corn, and cotton. East-central Arkansas also features a humid subtropical climate with hot, humid summers and mild winters, an average annual temperature of 17.9 °C, and mean annual precipitation of 1294 mm, where rice, cotton, soybean, and corn are the predominant crops [32].
Wensu County, situated on the northwestern edge of the Tarim Basin, has a typical continental climate characterized by cold winters, hot summers, and significant diurnal temperature variations. The average annual temperature is 9.5 °C, and the mean annual precipitation is 209 mm [32]. The primary crops grown in this region include rice, wheat, corn, and cotton.
Figure 1. Geographical locations of the source domain study areas and the workflow for parcel label acquisition. The upper panel shows the locations of the multiple source domain sites in the United States; red boxes indicate the Sentinel-2 tiles used in this study, within which our specific study parcels are located. The lower panel illustrates the workflow for obtaining parcel label samples by referencing remote sensing imagery and the Cropland Data Layer (CDL) product [33].
Remotesensing 17 03762 g001
Figure 2. Geographical locations of the target domain study area (Wensu County, Xinjiang, China). The lower panel illustrates the final ground reference parcels for the three core study sites (delineated by red boxes). These parcels were generated by combining data from the 2024 field survey with a high-precision vector dataset.
Remotesensing 17 03762 g002

2.2. Data and Preprocessing

2.2.1. Remote Sensing Imagery

The remote sensing data source for this study was the Sentinel-2 SITS from the European Space Agency (ESA). With a revisit period of 5 days, the Sentinel-2 mission provides multispectral imagery with high spatio-temporal resolution, offering robust support for capturing crop phenological dynamics. We utilized Sentinel-2 Level-2A surface reflectance products, which have been atmospherically corrected and are suitable for direct use in time-series analysis. We defined distinct data acquisition periods for the source and target domains: for the source domain in the United States, we collected all available imagery from December 2021 to November 2022; for the target domain in Wensu County, Xinjiang, China, we collected all available imagery from December 2023 to November 2024. This specific 12-month window, which spans from the winter of the preceding year to the late autumn of the target year, was intentionally chosen over a standard calendar year (January–December). This approach was designed to capture the full phenological cycle (including pre-planting, growth, maturation, and post-harvest phases) for the major crops under investigation (corn, cotton, wheat, and rice) in both regions. For each study site within the source and target domains (as depicted in Figure 1 and Figure 2), all required ground reference parcels fell within the footprint of a single Sentinel-2 tile per site; therefore, no mosaicking of tiles was necessary. To ensure data quality, only scenes with a cloud cover of less than 20% were retained, and these images were subsequently clipped to the predefined study area boundaries corresponding to these tiles. For band selection, we excluded the coastal aerosol (B1), water vapor (B9), and cirrus (B10) bands because they have lower spatial resolution and are primarily used for atmospheric correction. We retained 10 core spectral bands (B2–B8, B8A, B11, B12). All 20-meter resolution bands (e.g., red-edge and short-wave infrared) were resampled to 10 meters using bilinear interpolation to ensure consistent spatial resolution across all input features. While computationally efficient, this method might introduce some smoothing of spectral signatures. Alternative resampling techniques (e.g., cubic convolution [34]) exist and could potentially yield slightly different spectral characteristics, which might subtly influence the final classification outcomes, although further investigation would be needed to quantify this effect within our parcel-based framework. The final distribution of available images with cloud cover below 20% and the longest data gaps for both domains are illustrated in Figure 3.

2.2.2. Ground Reference Data and Parcel Delineation

In this study, crop classification was conducted at the parcel scale, with the corresponding ground reference data (labels and boundaries) sourced from different channels.
For the source domain, parcel boundaries and crop type labels were primarily derived from the Cropland Data Layer (CDL) released by the United States Department of Agriculture (USDA) [33]. The CDL is an annual 30-meter resolution crop type product renowned for its high classification accuracy for major crops such as corn and cotton in key agricultural regions like the Midwestern United States, making it an authoritative data source for generating reliable training samples. To generate accurate, pixel-level vector representations for these parcels, we adopted a semi-automated approach combining automated segmentation with manual refinement, visually cross-referencing against high-resolution Google Earth imagery. An initial vectorization was performed using the Geo-SAM plugin in QGIS, leveraging the Segment Anything Model (SAM) [35]. This was followed by careful manual correction and supplementation in ArcGIS (version 10.8), particularly for regions where automated segmentation yielded clear inaccuracies or failed to capture complex boundaries, referencing the Sentinel-2 imagery directly to ensure fidelity at the pixel level. Through this combined approach, we obtained a total of 16,161 high-quality parcels with 2022 crop type labels, comprising 2678 for corn, 2190 for cotton, 1891 for wheat, 1433 for rice, and 7969 for other crops (Figure 4).
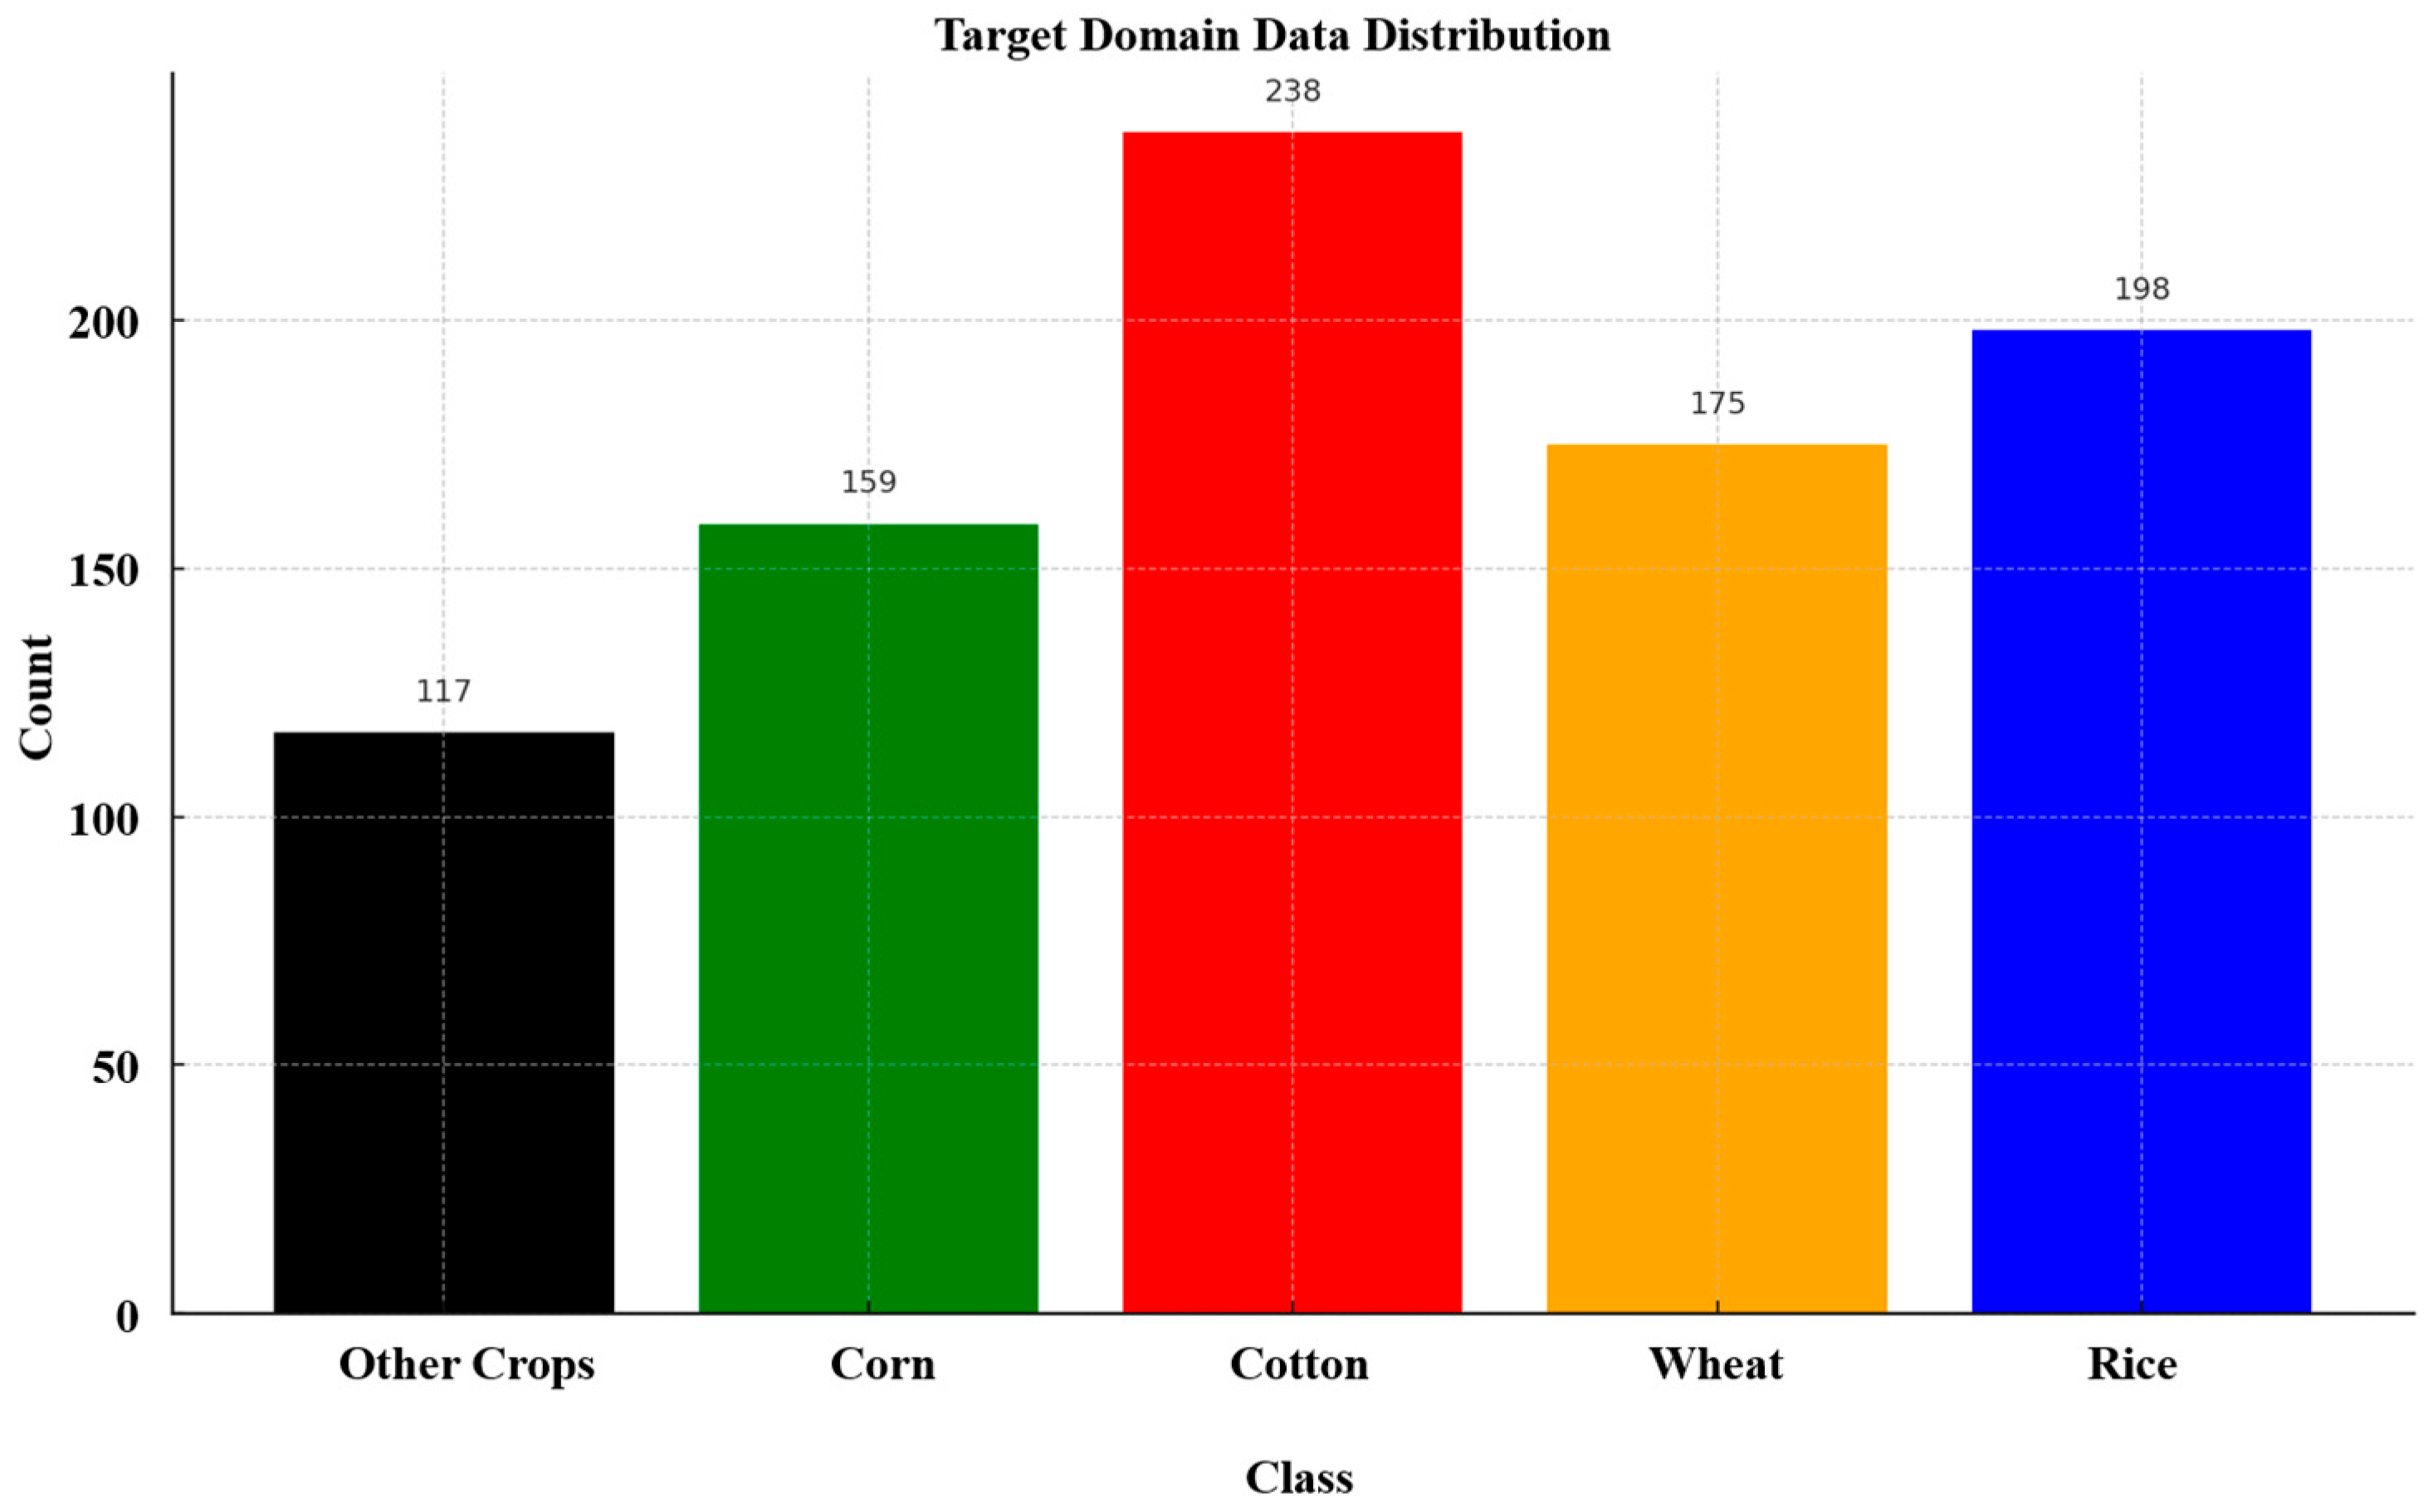
The ground reference data for the target domain (Wensu County, Xinjiang) were constructed by integrating a field survey conducted in July 2024 with a published high-precision cropland extent vector dataset. First, we performed a detailed field investigation within the study area (Figure 5), where our team used handheld Real-Time Kinematic (RTK) devices to accurately record the geographic coordinates and crop types of individual parcels. Concurrently, we created preliminary sketches of parcel locations and boundaries with the aid of real-time remote sensing imagery from Ovey Interactive Map software (version 10.3.0). Subsequently, the collected coordinate points and sketches were spatially matched with the 2020 high-precision cropland extent vector dataset for China published by Jiang et al. [36]. Parcels were identified by spatially joining the RTK points with the vector polygons. Acknowledging potential discrepancies between our field sketches and the 2020 vector data, we retained only those parcels with high boundary consistency as the final ground reference samples. The crop types identified in the 2024 survey were then assigned as the attribute labels for these parcels for that year. Through this rigorous screening process, we updated the high-precision parcel vector data with the latest crop type labels. In total, we obtained 887 high-quality parcel samples with 2024 crop type labels, comprising 159 for corn, 238 for cotton, 175 for wheat, 198 for rice, and 117 for other crops (Figure 6).
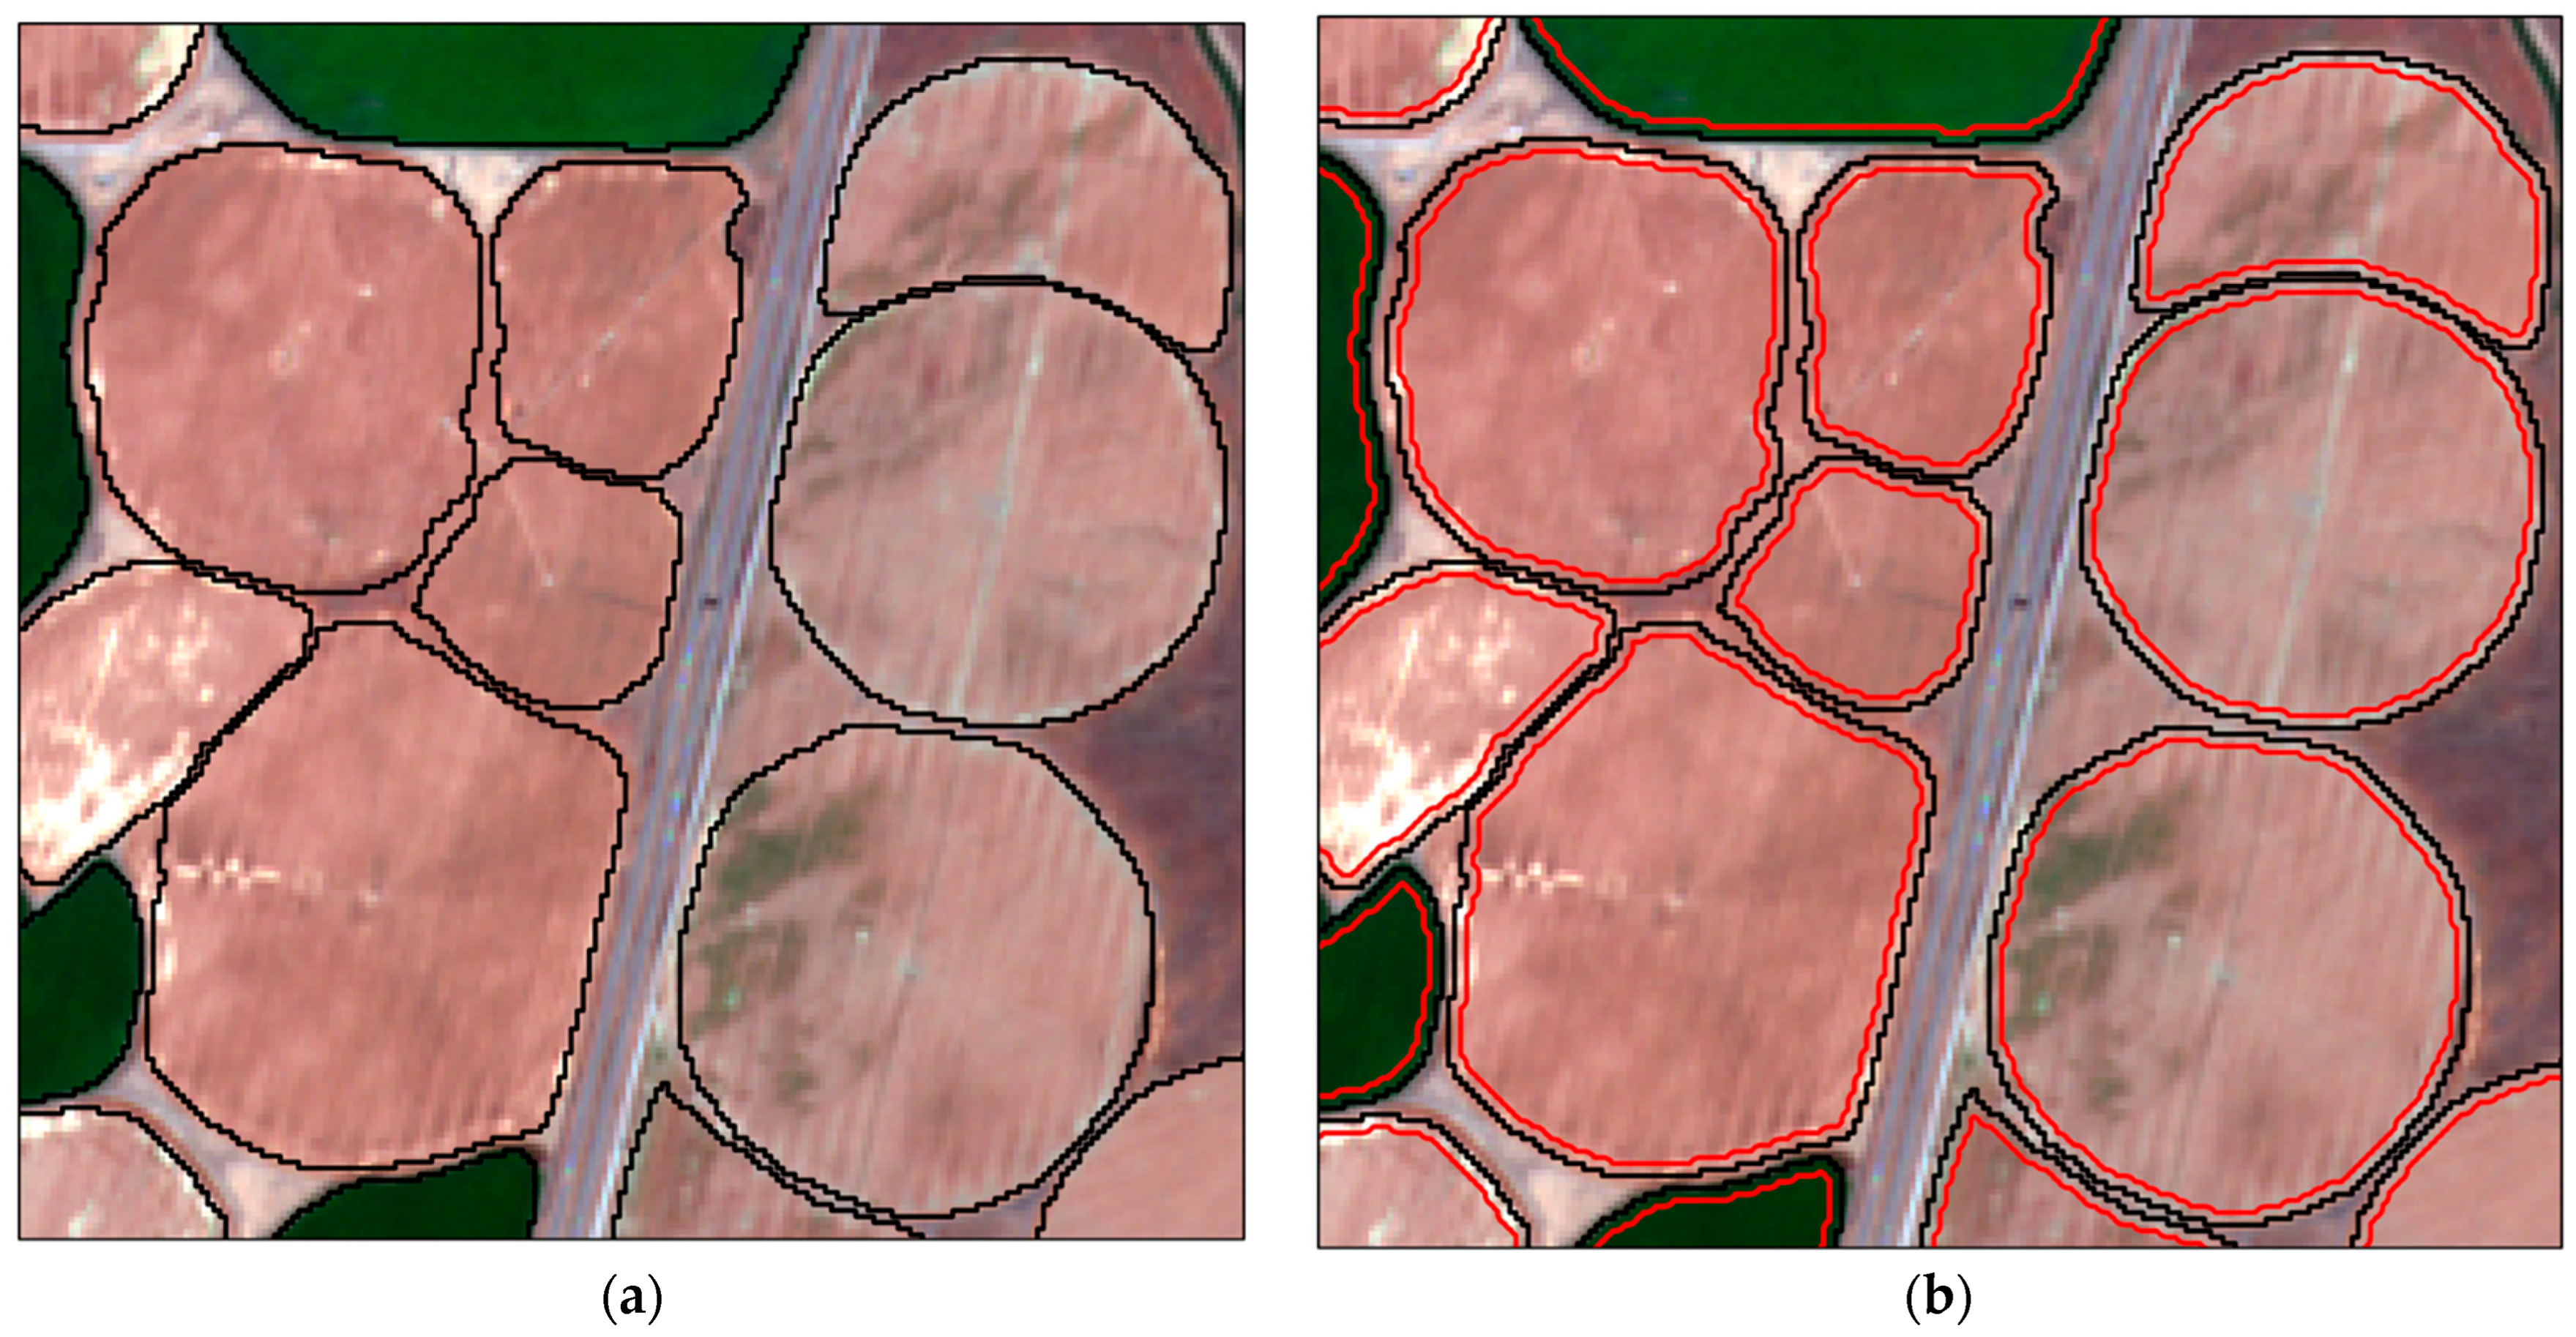
For parcel preprocessing, to minimize the label noise caused by mixed pixels at parcel boundaries and to exclude excessively small parcels from interfering with model training, we applied a consistent preprocessing workflow to all selected parcel data from both the source and target domains (Figure 7). We performed a 20-meter inward erosion on each parcel polygon to remove the boundary regions, which is a common practice in parcel-based remote sensing analysis aimed at excluding edge effects [21,37,38]. The chosen distance of 20 meters, corresponding to two pixels of the 10-meter resolution Sentinel-2 imagery, represents a conservative approach deemed appropriate for robustly extracting purer spectral signatures from the core parcel areas in this study. Following this process, all parcels with an area smaller than 1 hectare were eliminated from the dataset. This filtering was necessary because, after the 20-meter inward erosion, these small parcels may not contain a sufficient number of pure pixels to form a representative set for our pixel-set-based model. Additionally, this filtering helps mitigate potential label noise, as very small or linear polygons can sometimes represent miscellaneous features like field borders rather than the intended crop.

3. Methods

3.1. Methodological Framework

This study aims to address the UDA problem for crop classification using SITS. We define the labeled dataset as the source domain, D S   =   X s , Y s , and the unlabeled dataset as the target domain, D T   =   { X t } . Our objective is to train a deep learning model using both D S and D T that can achieve high-precision crop classification in the target domain.
To achieve this, we propose a training pipeline consisting of two main stages, as illustrated in Figure 8:
  • Supervised Pre-training: In this initial stage, the core PSAE-LTAE model is trained exclusively on the labeled source dataset D S using a standard supervised learning approach. The PSAE-LTAE, a spatio-temporal feature extractor, first aggregates pixel-level information with its spatial encoder and then models temporal dynamics with its temporal encoder (detailed in Section 3.2). This stage is designed to learn a robust representation of crop spatio-temporal features from the source domain. The model weights that achieve the best performance on a held-out source validation set are saved for the next stage.
  • UDA Fine-tuning and Prediction: Using the pre-trained weights as a starting point, the model is then fine-tuned with both the source domain D S and the unlabeled target domain D T . The objective of this stage is to minimize a joint loss function that combines the source domain classification loss with a domain alignment loss, which reduces the discrepancy between the source and target feature distributions. After fine-tuning, the final model is deployed to perform inference and generate class predictions for the target domain samples.
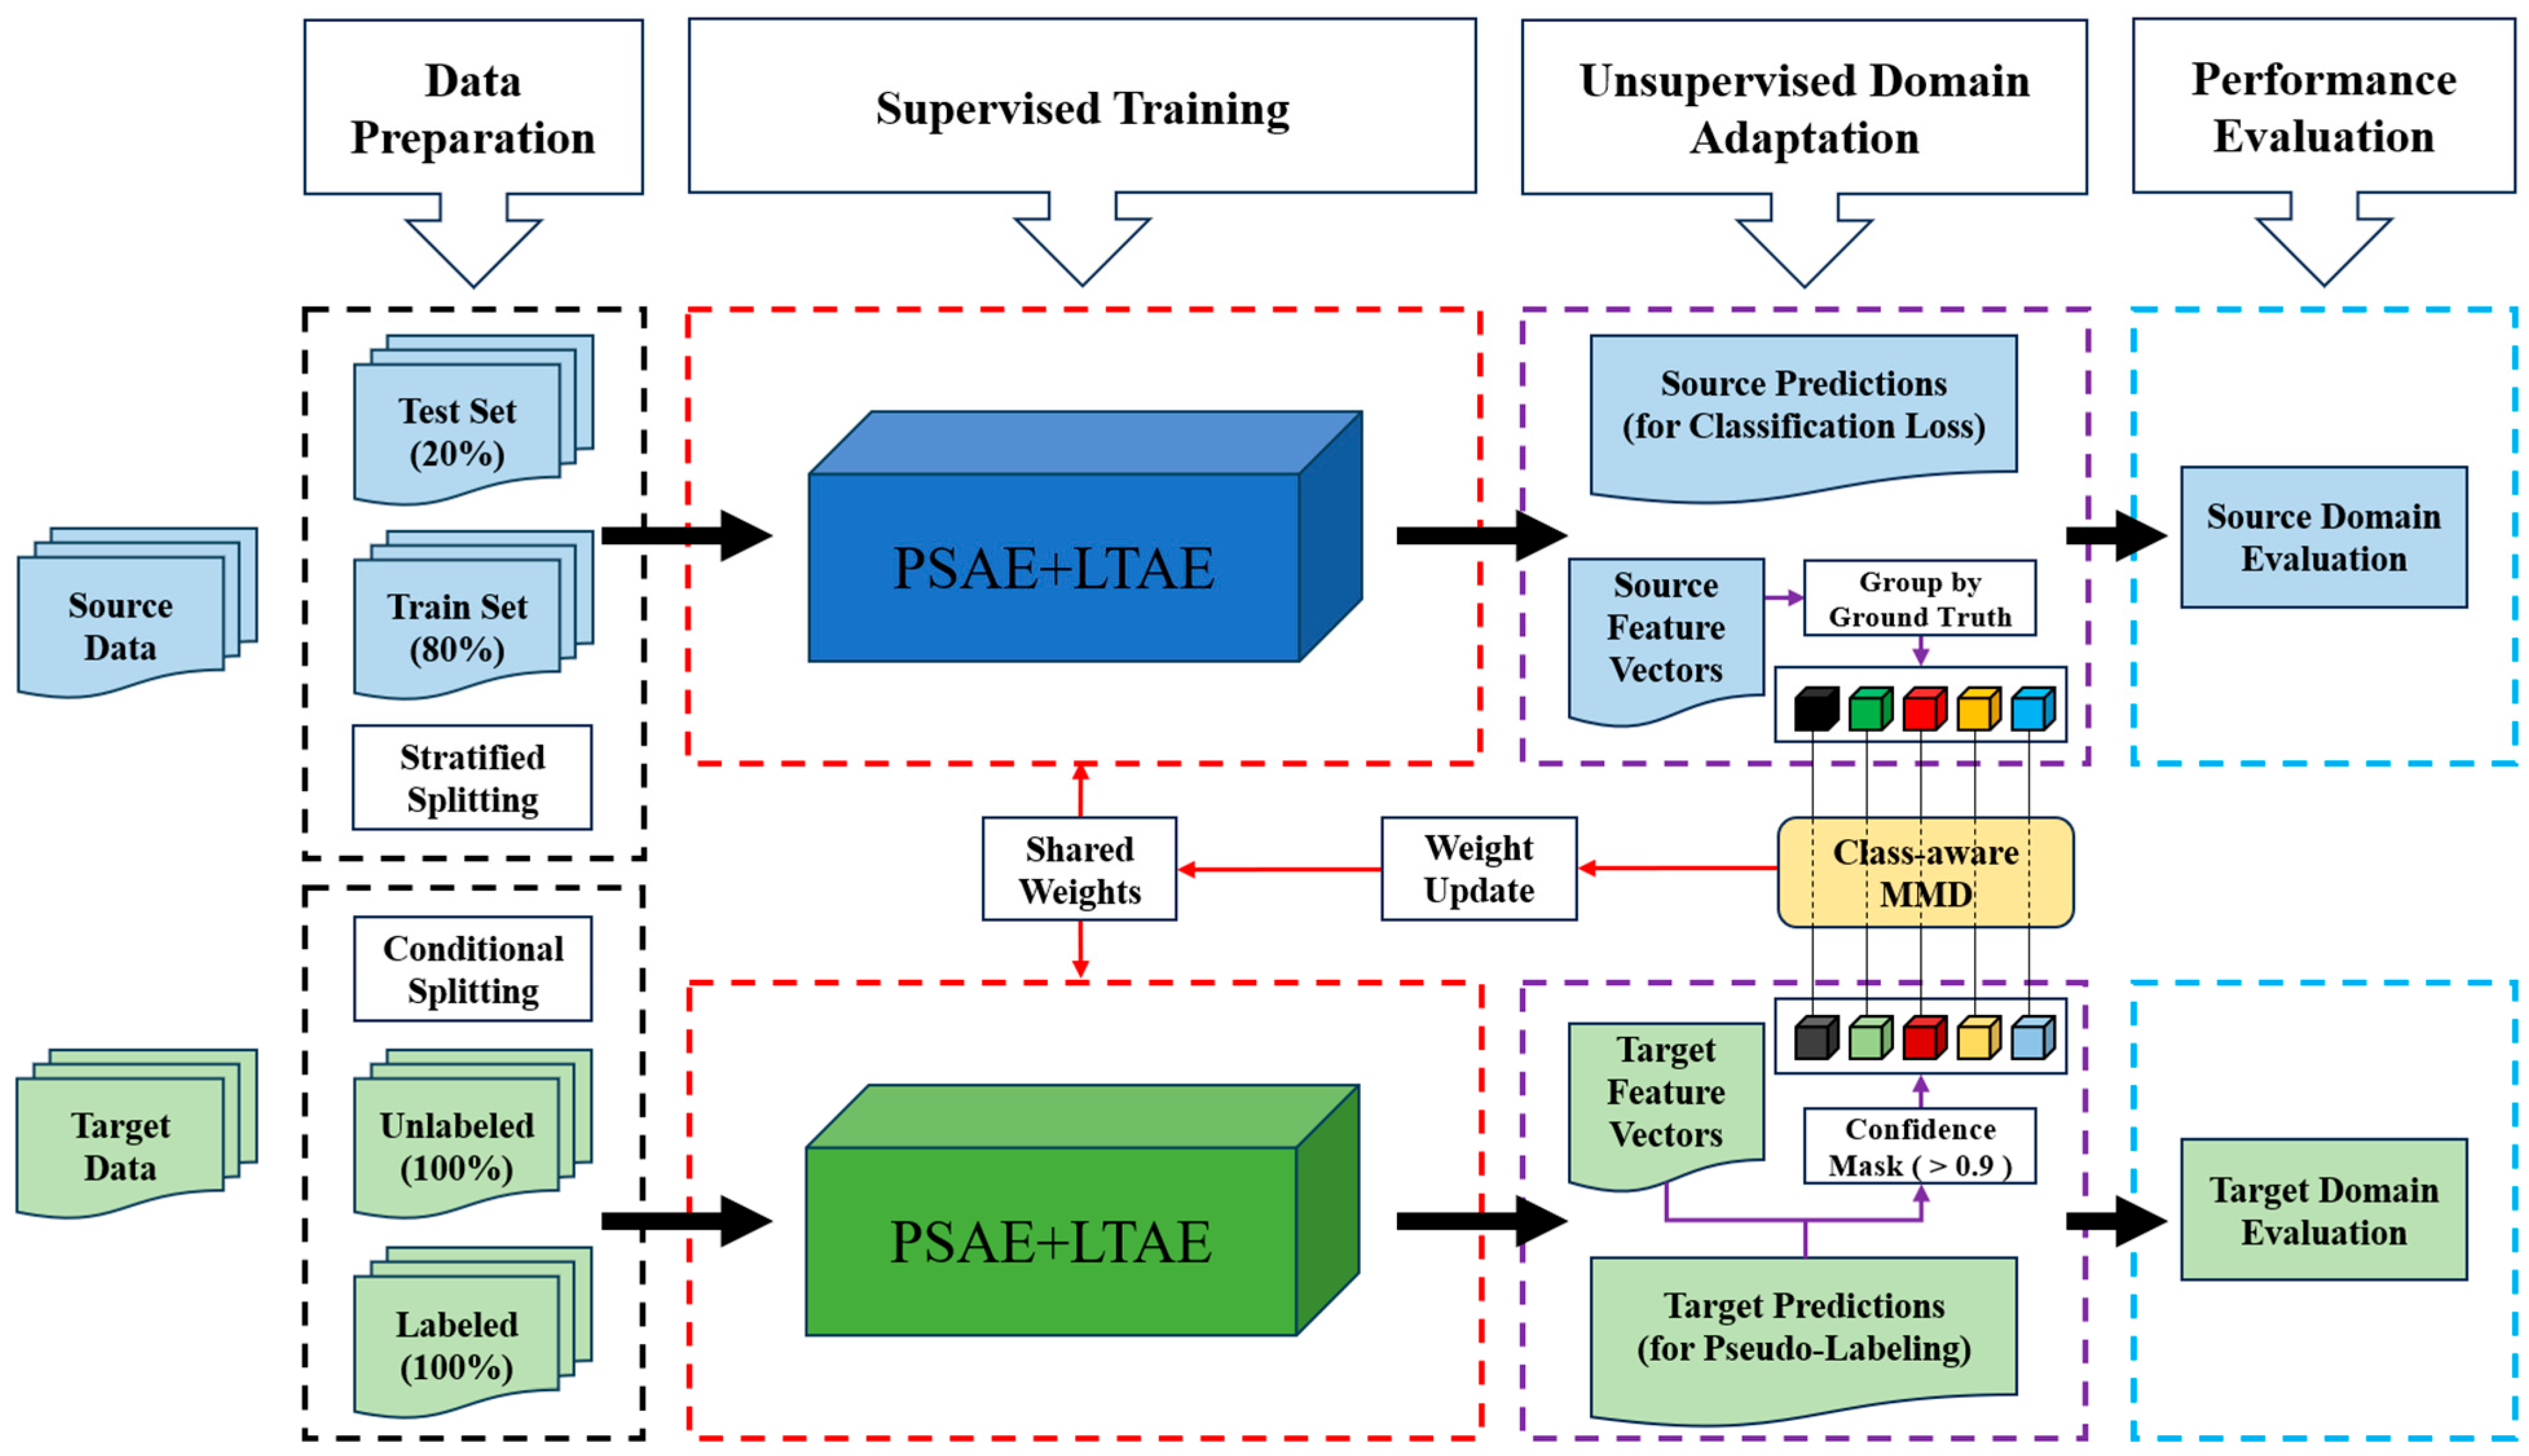
Figure 8. The overall framework of the proposed unsupervised domain adaptation method.
Remotesensing 17 03762 g008

3.2. Backbone Network: PSAE + LTAE Architecture

We improve upon the existing object-based crop classifier, PSE-LTAE [39,40], by developing a novel attention-based PSAE module. The LTAE module remains unchanged and is integrated into our UDA framework. The original Pixel-Set Encoder (PSE) module employs a simple statistical pooling method, which treats all pixels within a parcel equally by assigning them the same importance. In contrast, our PSAE module can intelligently learn the contribution weight of each pixel within a parcel, thereby focusing on the most representative crop pixels while suppressing interference from noisy ones during feature aggregation. The PSAE-LTAE model is composed of three sequential parts: a spatial encoder, a temporal encoder, and an output decoder (Figure 9).

3.2.1. Spatial Encoder: PSAE

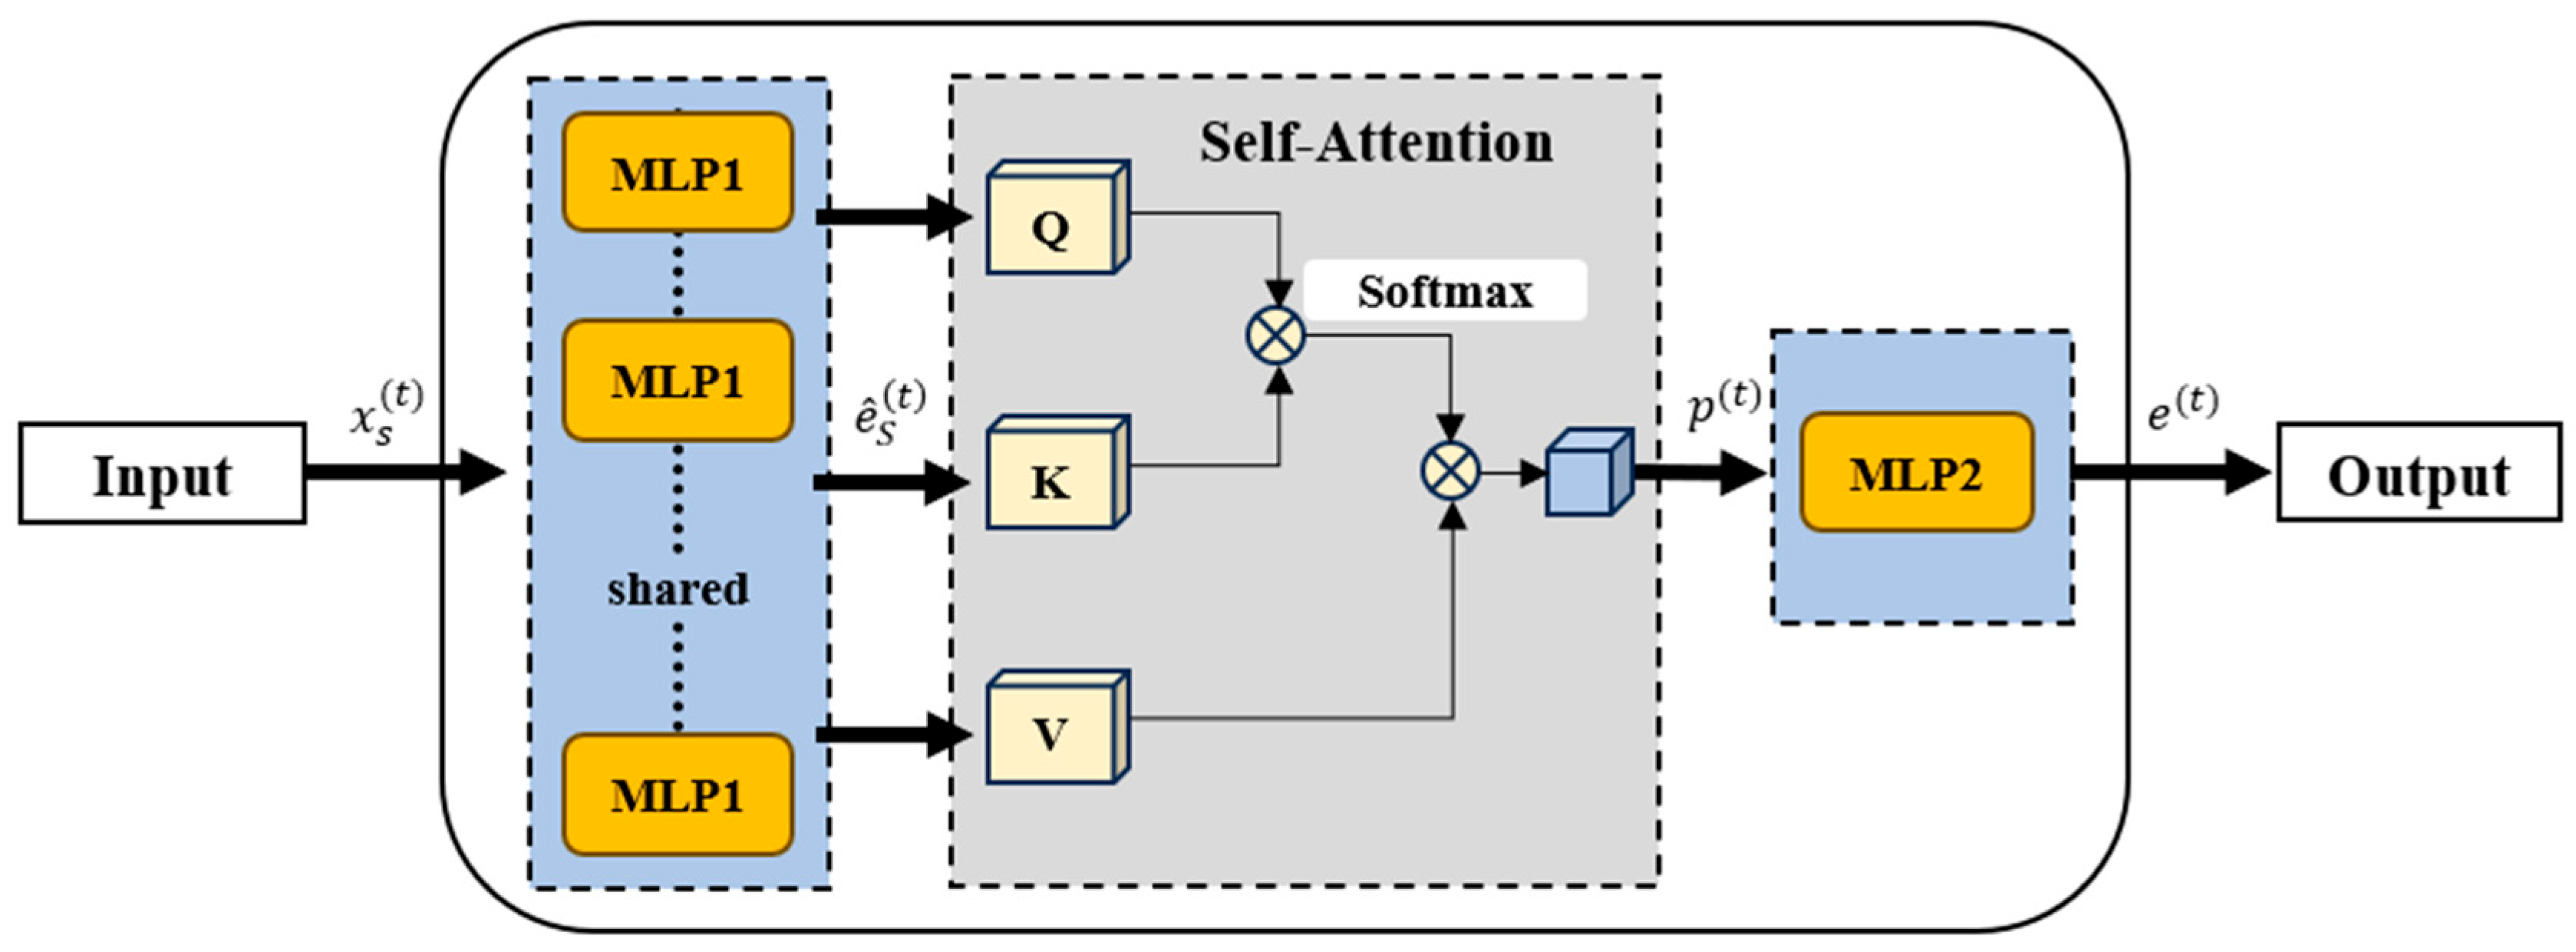
The role of the Pixel-Set Attention Encoder (PSAE) is to aggregate an irregular set of pixels from a parcel into a single fixed-dimensional vector at each time point (Figure 10).
It consists of three main steps:
(1)
For a set of pixels x S ( t ) at a given time point t , a weight-sharing MLP1 is used to extract deep features for each pixel, yielding an enhanced feature set e ^ S ( t ) .
(2)
The enhanced feature set e ^ S ( t ) is processed by a self-attention pooling module, which aggregates the S context-aware pixel features into a single vector p ( t ) .
(3)
The aggregated single vector p ( t ) is then passed through another MLP2 for a final transformation, producing the spatial feature output e ( t ) for that time point.
The PSAE architecture can be formulated as follows:
e ^ S ( t ) = M L P 1 x S ( t )
p ( t ) = A t t e n t i o n P o o l i n g e ^ S ( t )
e ( t ) = M L P 2 p ( t )

3.2.2. Time Encoder: LTAE

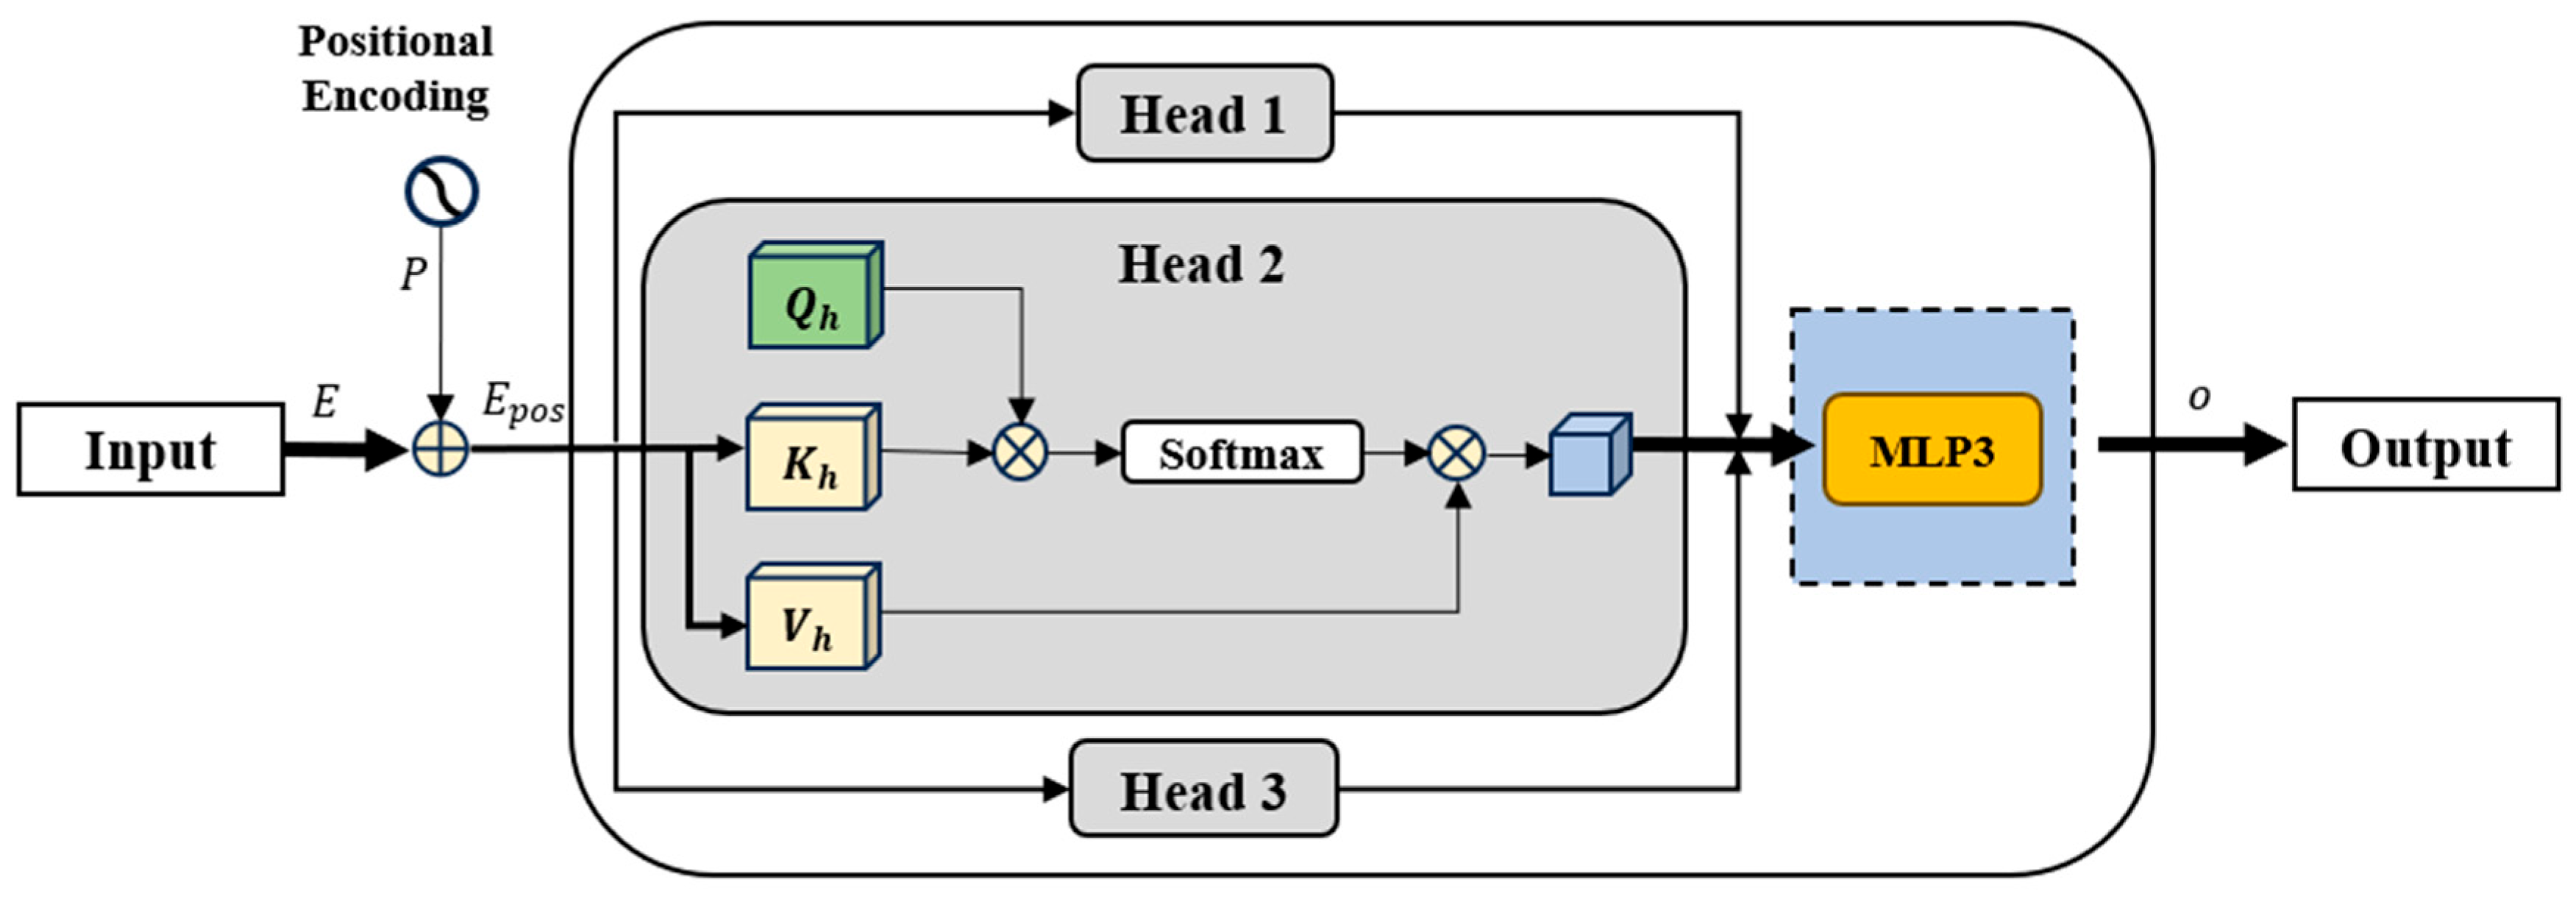
The sequence of feature vectors E = [ e ( 1 ) , , e ( T ) ] generated by the PSAE is fed into the Lightweight Temporal Attention Encoder (LTAE) (Figure 11).
It consists of three main steps:
(1)
A positional encoding P , corresponding to the timestamps of the feature vector sequence E , is added to inject temporal order information.
(2)
The core of LTAE is an efficient, lightweight multi-head attention module. Unlike standard attention mechanisms, its Query (Q) is a learnable global parameter rather than being dynamically generated from the input data. This allows the model to efficiently capture the most critical global temporal patterns for the classification task. This global Q interacts with the Key (K) vectors, each with a dimension of d k , generated from the input sequence for each time step to compute the importance weight for each point in time. To further enhance efficiency and reduce parameters, the module employs a channel grouping strategy, distributing the input feature channels among parallel attention heads. It directly uses the input features themselves as the Value (V) for weighted aggregation, ultimately producing a single feature vector that fuses information from the entire sequence.
(3)
The output of the attention module is finally integrated through an MLP3 to generate the final feature vector o , which represents the entire spatio-temporal sequence.
The LTAE architecture can be formulated as follows:
E p o s = E + P
a h = s o f t m a x ( ( Q h K h ) / s q r t ( d k ) )
o = M L P 3 C o n c a t ( A t t e n t i o n ( Q h , K h , V h ) )

3.2.3. Output Module: Decoder

This final feature vector is then fed into an MLP decoder, which produces the predicted probability for each class. For the UDA training stage, these features output by LTAE (which serve as the input to the decoder) are utilized as the representations F s and F t for the MMD loss calculation.

3.3. Class-Aware MMD for Domain Adaptation

To effectively reduce the distribution discrepancy between the source and target domains during the UDA fine-tuning stage, we employ a domain alignment strategy based on a class-aware Maximum Mean Discrepancy (MMD) [23]. This strategy guides the model’s optimization through a joint loss function composed of the source domain classification loss, L c l s , and the class-aware MMD loss, L m m d .
For the classification loss L c l s , we use the standard cross-entropy loss function to maintain the model’s classification performance on the source domain [41,42]. For the class-aware MMD loss L m m d , instead of matching the global feature distributions, our method performs fine-grained alignment within each category c { 1 , , C } , where C is the total number of classes. Let F s c   =   { f i s | y i s   =   c } denote the set of source domain features belonging to class c . Let F t c   =   { f j t | y ^ j t   =   c a n d m a x p j t >   τ } denote the set of target domain features whose high-confidence pseudo-label is c . The squared MMD between the source and target features for class c is calculated using a kernel function k as:
M M D c 2 F s c , F t c = 1 | F s c | 2 f i F s c f i F s c k ( f i , f i ) 2 | F s c | | F t c | f i F s c f j F t c k ( f i , f j ) + 1 | F t c | 2 f j F t c f j F t c k ( f j , f j )
The final class-aware MMD loss L m m d is then computed as the average of the squared MMD values across all classes for which both F s c and F t c are non-empty:
L m m d ( F s , F t , Y s , Y ^ t ) = 1 C c C v a l i d M M D c 2 ( F s c , F t c )
where C v a l i d   =   c F s c   >   0   a n d     F t c   >   0 and C   =   | C v a l i d | . This strategy ensures that the alignment process focuses on reducing the domain discrepancy for each crop category independently, thus preserving class-discriminative information and mitigating potential negative transfer.
The total loss function, L t o t a l , is then formulated as the weighted sum of the classification loss and the class-aware MMD loss:
L t o t a l   =   L c l s X s , Y s + λ L m m d ( F s , F t , Y s , Y ^ t )
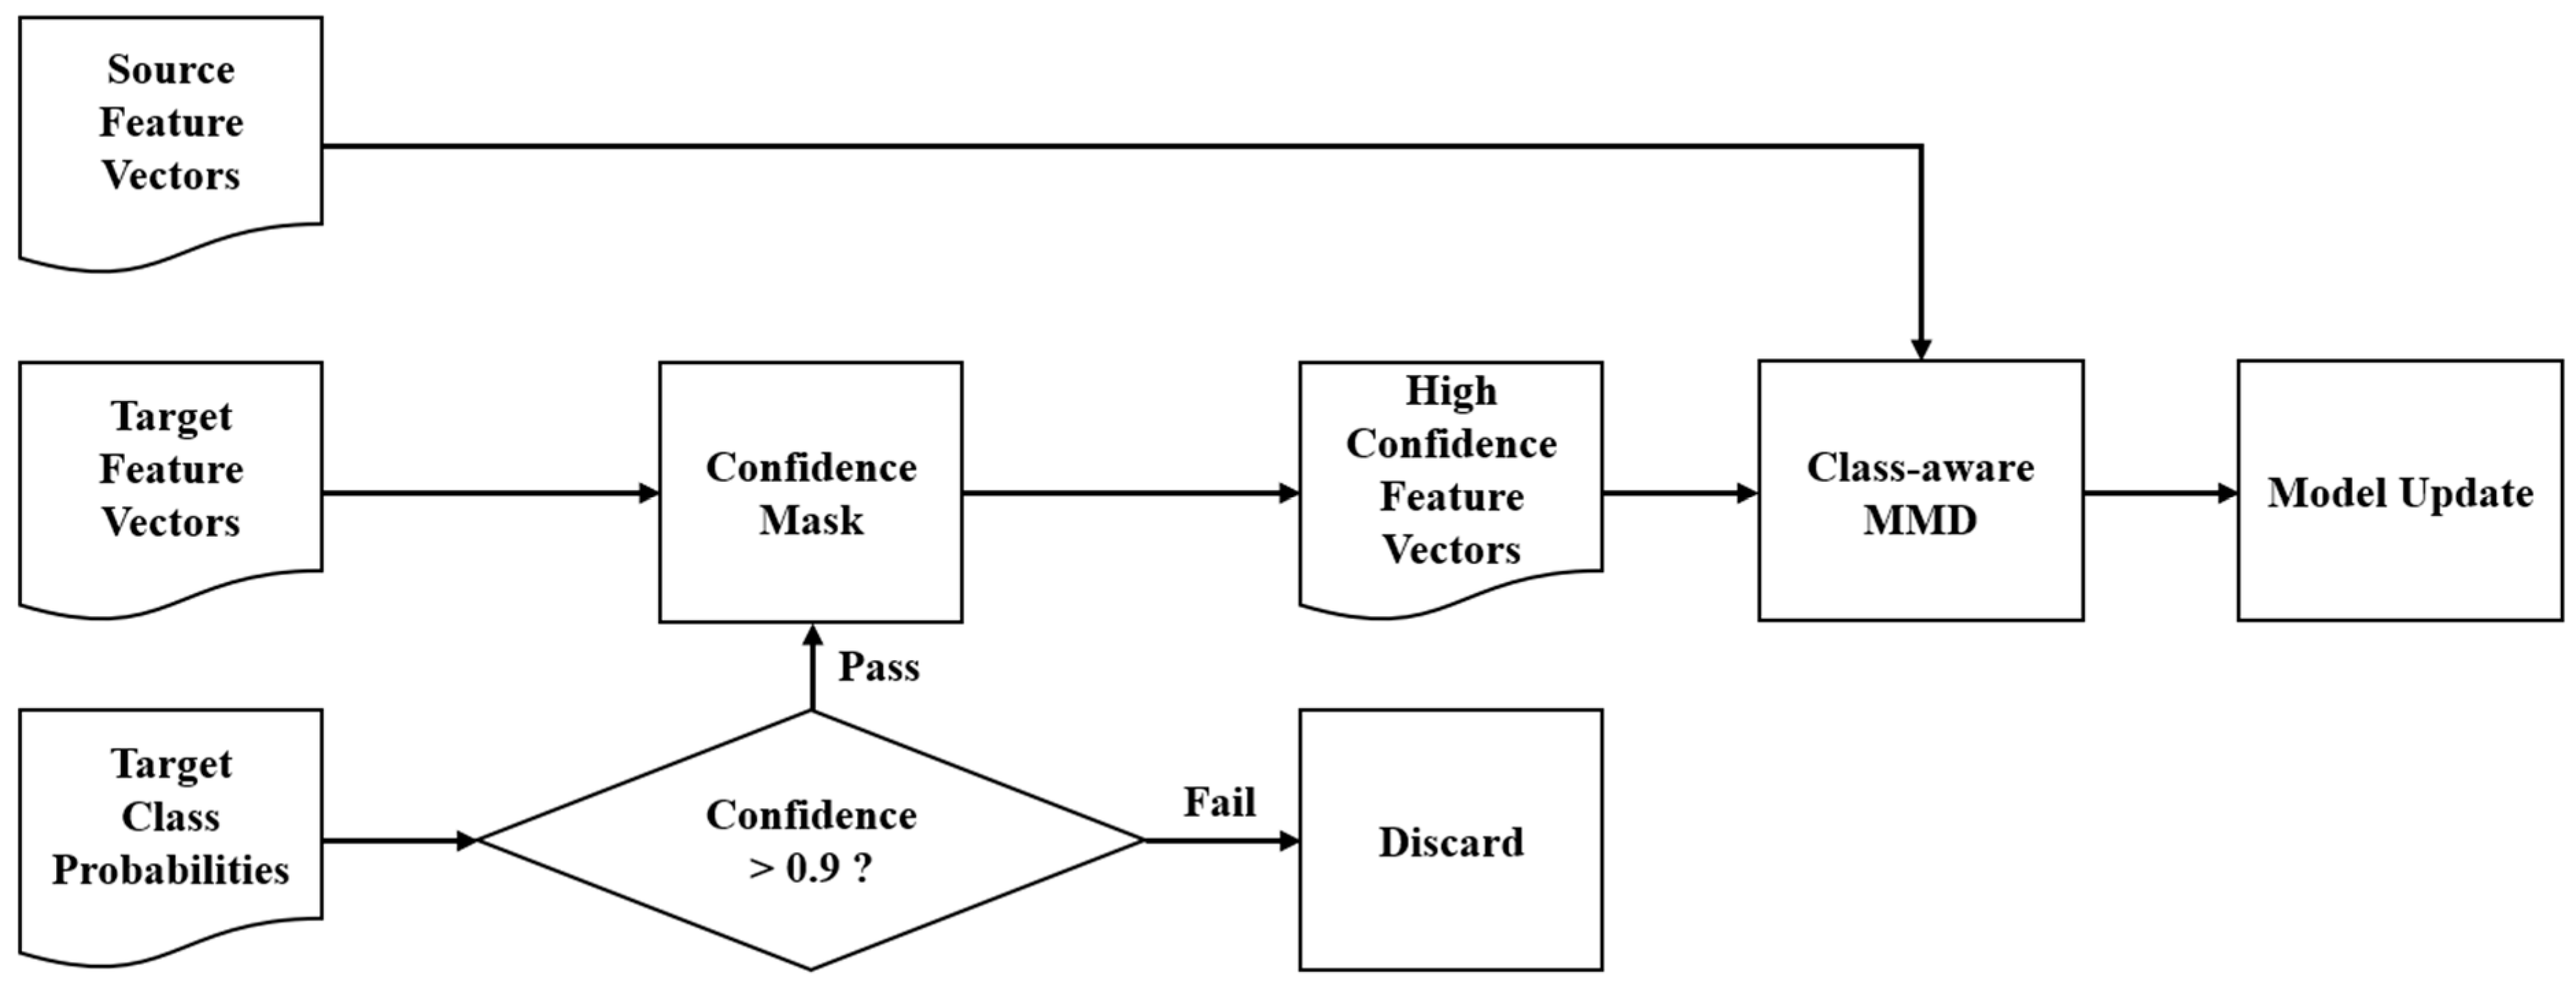
where λ is a hyperparameter that balances the two loss terms. The process for obtaining the features F s , F t and pseudo-labels Y ^ t used in these calculations is illustrated in Figure 12.
The process unfolds as follows:
(1)
For the target domain features F t , we first obtain their predicted probabilities from the model’s classifier.
(2)
We set a confidence threshold τ and select only those high-confidence samples whose predicted probabilities are greater than τ , along with their pseudo-labels Y ^ t , to be used in the MMD loss calculation.
(3)
For each class, we separately calculate the Gaussian kernel MMD distance between the source and target features belonging to that class. The final L m m d is the average of the MMD losses across all matched categories.
By minimizing this joint loss, the model learns a feature representation that is both domain-invariant and class-discriminative.

3.4. Experimental Setup

3.4.1. Baselines

To comprehensively evaluate the performance of our method, we compared it against a series of representative baseline models. To ensure a fair comparison, all competing UDA methods employed the same PSAE-LTAE architecture as the backbone feature extractor. This approach ensures that the evaluation validates the merits of the domain adaptation strategy itself, rather than differences in feature extractors.
These baseline models are categorized into two groups. The first group, “Supervised Baselines,” does not perform domain adaptation and is used to establish the lower-bound (Source-Only) and practical upper-bound (Target-Only) performance benchmarks for our task. The second group, “Unsupervised Domain Adaptation Methods,” includes competing UDA techniques that serve as direct comparisons to evaluate the effectiveness of our proposed adaptation strategy.
Supervised Baselines:
  • Source-Only: This model is trained exclusively on labeled data from the source domain and then directly applied to the target domain for evaluation. It represents the performance lower bound without any domain adaptation, and its results intuitively measure the extent of the domain shift between the source and target domains.
  • Target-Only: This model is trained on the labeled training set of the target domain and evaluated on its test set. It represents the potential performance upper bound on this dataset, providing an ideal benchmark for all UDA methods.
  • Unsupervised Domain Adaptation Methods:
  • MMD [23]: A classic discrepancy-based UDA method. It achieves domain alignment by minimizing the distribution distance between source and target features in a Reproducing Kernel Hilbert Space (RKHS).
  • DANN [24]: A classic adversarial learning-based UDA method. It introduces a domain discriminator that is trained adversarially against the feature extractor. A Gradient Reversal Layer (GRL) compels the feature extractor to learn domain-invariant features that are indistinguishable to the discriminator.
  • CDAN+E [25]: An advanced variant of DANN. It constructs a conditional adversarial network by applying a multilinear map to the features and the classifier’s predicted probabilities, enabling a more refined distribution alignment. Additionally, it incorporates an entropy minimization loss on the target domain to encourage high-confidence predictions.
  • ALDA [26]: Another adversarial UDA method distinguished by its weighted discriminator loss function. It assigns higher weights to hard-to-distinguish samples (i.e., those with prediction probabilities close to 0.5), thereby guiding the feature extractor to prioritize improvements on these challenging samples.
  • JUMBOT [43]: A UDA method based on optimal transport theory. It aligns domains by computing and minimizing the optimal transport distance between the joint distributions of features and labels, and is particularly effective at handling class distribution imbalances.

3.4.2. Experimental Details

All experiments were conducted using the PyTorch (version 2.2.2) deep learning framework and trained on a workstation equipped with a single NVIDIA GeForce RTX 4090 D GPU (NVIDIA Corporation, Santa Clara, CA, USA). To ensure the stability and reproducibility of the results, the training and evaluation of all methods were repeated under three different random seeds, with the final reported metrics being the mean and standard deviation of the evaluation scores.
Supervised Baseline Training: To establish performance upper and lower bounds, we first trained the Source-Only and Target-Only supervised baseline models. The training pipeline for both baselines was identical, differing only in the data domain used. We partitioned the entire sample set of the respective domain (source or target) into an 80% training set and a 20% validation set using stratified sampling based on crop type labels to ensure similar class distributions in both subsets. The models were trained using the Adam optimizer with an initial learning rate of 0.001 and a weight decay of 0.0001. For data augmentation, we randomly sampled 64 pixels from each parcel at each time step and randomly subsampled 20 time steps from the time series, with a batch size of 128. To address the prevalent class imbalance in the dataset, we employed a class-balanced batch sampler to ensure that the number of samples for each class was approximately equal in every training batch. The models were trained for 50 epochs, and after each epoch, the best model weights were saved based on the macro-averaged F1-score on the corresponding domain’s validation set. The weights of the Source-Only model served as the initialization for all UDA methods.
Unsupervised Domain Adaptation Training: All UDA methods (including our proposed method and all baselines for comparison) were initialized with the pre-trained weights from the Source-Only model. The domain adaptation training was also conducted for 50 epochs. To balance the different sizes of the source and target datasets, we fixed each epoch to consist of 200 iterations. In each iteration, we simultaneously sampled one batch of data from the source domain (using a balanced sampler) and one from the target domain (using a random sampler) for training. For our proposed method, the key UDA hyperparameters were determined through comprehensive sensitivity analysis experiments: the weighting coefficient λ, which balances the classification and domain adaptation losses, was set to 1.0, and the confidence threshold τ for generating pseudo-labels was set to 0.9. To ensure a fair and rigorous comparison, all baseline UDA methods were tuned using the same procedure as our PLCM. All methods shared a unified base configuration for common parameters (e.g., learning rate, weight decay, batch size) as defined in our configuration. Subsequently, we performed a systematic parameter search for each method’s critical hyperparameters, such as the domain adaptation loss weight (λ) and other key internal parameters (e.g., discriminator architecture). The search ranges for this tuning were selected based on values and practices established in the relevant literature [1,21,31].
Model Evaluation: To ensure a fair and consistent evaluation, we adopted a differentiated evaluation dataset strategy for different types of models. For the Target-Only baseline, performance was assessed on the reserved 20% test set of the target domain, simulating the optimal scenario with sufficient target domain labels. For the Source-Only baseline and all UDA methods, since they were not exposed to any target domain labels during the training phase, we used the entire labeled sample set of the target domain as a complete test set for the final performance evaluation to comprehensively measure their generalization ability. During all evaluation stages, to obtain more stable and comprehensive parcel features, we used a different sampling strategy from the training phase: we still randomly sampled 64 pixels from each parcel but used all available time steps as inputs, rather than performing temporal sub-sampling.

3.4.3. Evaluation Metrics

To comprehensively evaluate and compare the performance of the different methods, this study uses the macro-averaged F1-score as the primary evaluation metric. It measures the overall performance of a model by calculating the F1-score for each class and then taking the average of these scores. The Macro F1-score assigns equal weight to each class, making it a fair metric that accurately reflects a model’s ability to identify rare classes in the presence of class imbalance. The relevant formulas are as follows:
P r e c i s i o n = T P T P + F P
R e c a l l = T P T P + F N
F 1 = 2 × P r e c i s i o n × R e c a l l P r e c i s i o n + R e c a l l
M a c r o   F 1 = 1 C c = 1 C F 1 c
where T P is True Positive, F P is False Positive, F N is False Negative, C is the total number of classes, and F 1 c is the F1-score for the c -th class.

4. Results

4.1. Main Results

This section quantitatively evaluates the performance of our proposed PLCM framework, which combines the PSAE-LTAE architecture with a class-aware MMD, on a cross-regional, cross-year crop classification task. The task involves transferring a model from a source domain (U.S. study areas, 2022 data) to a geographically and climatically distinct target domain (Wensu County, Xinjiang, China, 2024 data). We conducted a direct comparison of our proposed method with a series of baseline and UDA methods. To ensure the robustness of our findings, we report the mean and standard deviation of the macro-averaged F1-scores based on three independent runs with different random seeds.
Table 1 summarizes the final performance of all compared methods on this cross-domain task. First, the results from the baseline models clearly reveal the existence of a significant domain shift between the study regions. Under ideal conditions, the Target-Only model, trained on labeled data from the target domain, achieves a Macro F1-score of 99.17%, representing the performance upper bound for the current dataset and model architecture. In contrast, when the Source-Only model, trained on the source domain, is directly applied to the target domain, its F1-score drops sharply to 65.50%, resulting in a substantial performance gap of 33.67%. This demonstrates that models without any domain adaptation struggle to generalize to new regions due to geographical and environmental differences.
Compared to the Source-Only baseline (65.50%), all tested UDA methods achieved significant performance improvements, confirming the necessity and general effectiveness of domain adaptation techniques in mitigating the domain shift problem. Among all competing UDA methods, our proposed class-aware MMD approach performed the best, achieving a Macro F1-score of 96.56%, the only method to exceed 96%. Compared to the second-best-performing method, CDAN+E (95.65%), our method shows a net improvement of nearly 1%. It also significantly outperforms other adversarial learning-based methods such as ALDA (94.29%) and DANN (94.82%). Furthermore, our method achieves a 3.5% performance advantage over the optimal transport-based method, JUMBOT (93.06%). Particularly noteworthy is that our class-aware modification to the standard MMD method (85.45%) led to a substantial performance improvement of over 11%, transforming it from the weakest to the top-performing UDA method. This stark difference supports the necessity of performing feature alignment at the category level to avoid negative transfer and enhance final classification accuracy.
In this highly challenging cross-continental, cross-year crop classification task, our proposed framework effectively compensates for most of the performance loss caused by domain shift, boosting the model’s performance from an unadapted 65.50% to 96.56%, which is very close to the ideal level of the Target-Only model (99.17%). These results indicate that our method can effectively learn domain-invariant and class-discriminative phenological features, providing an effective solution for high-precision, cross-regional crop mapping.
To provide a more granular analysis, we provide a detailed per-class F1-score comparison for the principal methods in Table 2.
The per-class metrics in Table 2 reveal two critical challenges. First, the Source-Only model’s performance demonstrates that the domain shift disproportionately affects specific categories. The model completely fails to identify “Cotton” (0.00%) and performs poorly on “Other Crops” (49.31%), demonstrating that these are highly dissimilar or difficult-to-adapt categories.
Second, the results provide direct evidence for the concept of negative transfer. While the standard MMD model improves performance on the challenging classes (e.g., Cotton at 80.44%), it simultaneously harms the performance on an already well-aligned class. On Corn, the MMD model’s F1-score (90.07%) is lower than the Source-Only baseline (91.37%). This supports the view that a simple global alignment can blur inter-class boundaries. This view is further corroborated by the performance of our proposed PLCM. Our method’s core is also MMD, but it is applied in a class-aware manner, guided by pseudo-labels. This modification proves critical: as shown in Table 2, PLCM not only effectively mitigates the negative transfer on Corn (achieving 97.93%) but also outperforms the standard MMD on the difficult-to-adapt Cotton (96.32% vs. 80.44%) and Other Crops (91.19% vs. 75.52%) classes. In fact, PLCM shows improvement over the standard MMD in every category, demonstrating that this class-aware strategy is the key to achieving robust alignment without blurring inter-class boundaries.
Finally, compared to the second-best method, CDAN+E, PLCM achieves a more balanced result. While the overall Macro F1-scores are comparable given the variance reported in Table 2, PLCM shows clear advantages on the difficult-to-adapt classes (mean F1-score 96.32% vs. 93.30% for Cotton; 91.19% vs. 89.72% for Other Crops). Indeed, in all categories where PLCM holds an advantage in mean F1-score (Cotton, Other Crops, Wheat, and Rice), it also demonstrates higher stability (a lower standard deviation) than CDAN+E. This demonstrates that PLCM’s pseudo-label-driven local alignment strategy effectively manages both class imbalance and negative transfer.

4.2. Ablation Study

To deeply analyze the effectiveness of the key components and training strategies within our proposed framework, we designed a series of ablation studies. The results of these experiments are presented in Table 3.
First, we compared the full model with the Source-Only baseline. The substantial performance gap of 31.06% demonstrates the overall effectiveness of our entire UDA framework in overcoming the domain shift problem.
Regarding the training strategy, we found that removing the balanced batch sampler led to a sharp decline in model performance. This result highlights the severe class imbalance present in the dataset, and underscores that the balanced sampler is crucial for ensuring the model can adequately learn features from all classes (especially minority classes), thereby enhancing its overall generalization ability.
We also validated the two core modules of the spatio-temporal encoder separately. Replacing our designed PSAE module with a traditional PSE resulted in a performance drop of 18.12%. This performance difference suggests that our pixel-set attention mechanism, which intelligently weights pixels unlike the traditional PSE’s equal treatment via statistical pooling (e.g., mean and standard deviation), can more effectively aggregate spatially heterogeneous information within a parcel. By intelligently weighting pixels, it successfully suppresses interference from noisy pixels and extracts more representative spatial features. Similarly, replacing the LTAE module with a standard LSTM network led to a 20.75% performance loss, which supports our choice of LTAE as the temporal encoder. Its global attention mechanism is better suited for capturing the complex phenological dependencies of crops compared to traditional recurrent networks.
The most critical comparison in this ablation study was to validate the effectiveness of our proposed class-aware MMD. When it was replaced with the standard MMD, the performance dropped significantly from 96.56% to 85.45%, a performance loss of 11.11%. This result strongly supports our core hypothesis: performing fine-grained feature alignment at the category level is key to significantly mitigating negative transfer in UDA and maintaining the class-discriminative nature of the features.

4.3. Visual Analysis

To provide a more intuitive understanding of the effectiveness of our proposed method at both the feature level and in spatial mapping, this section presents visualizations for qualitative assessment.
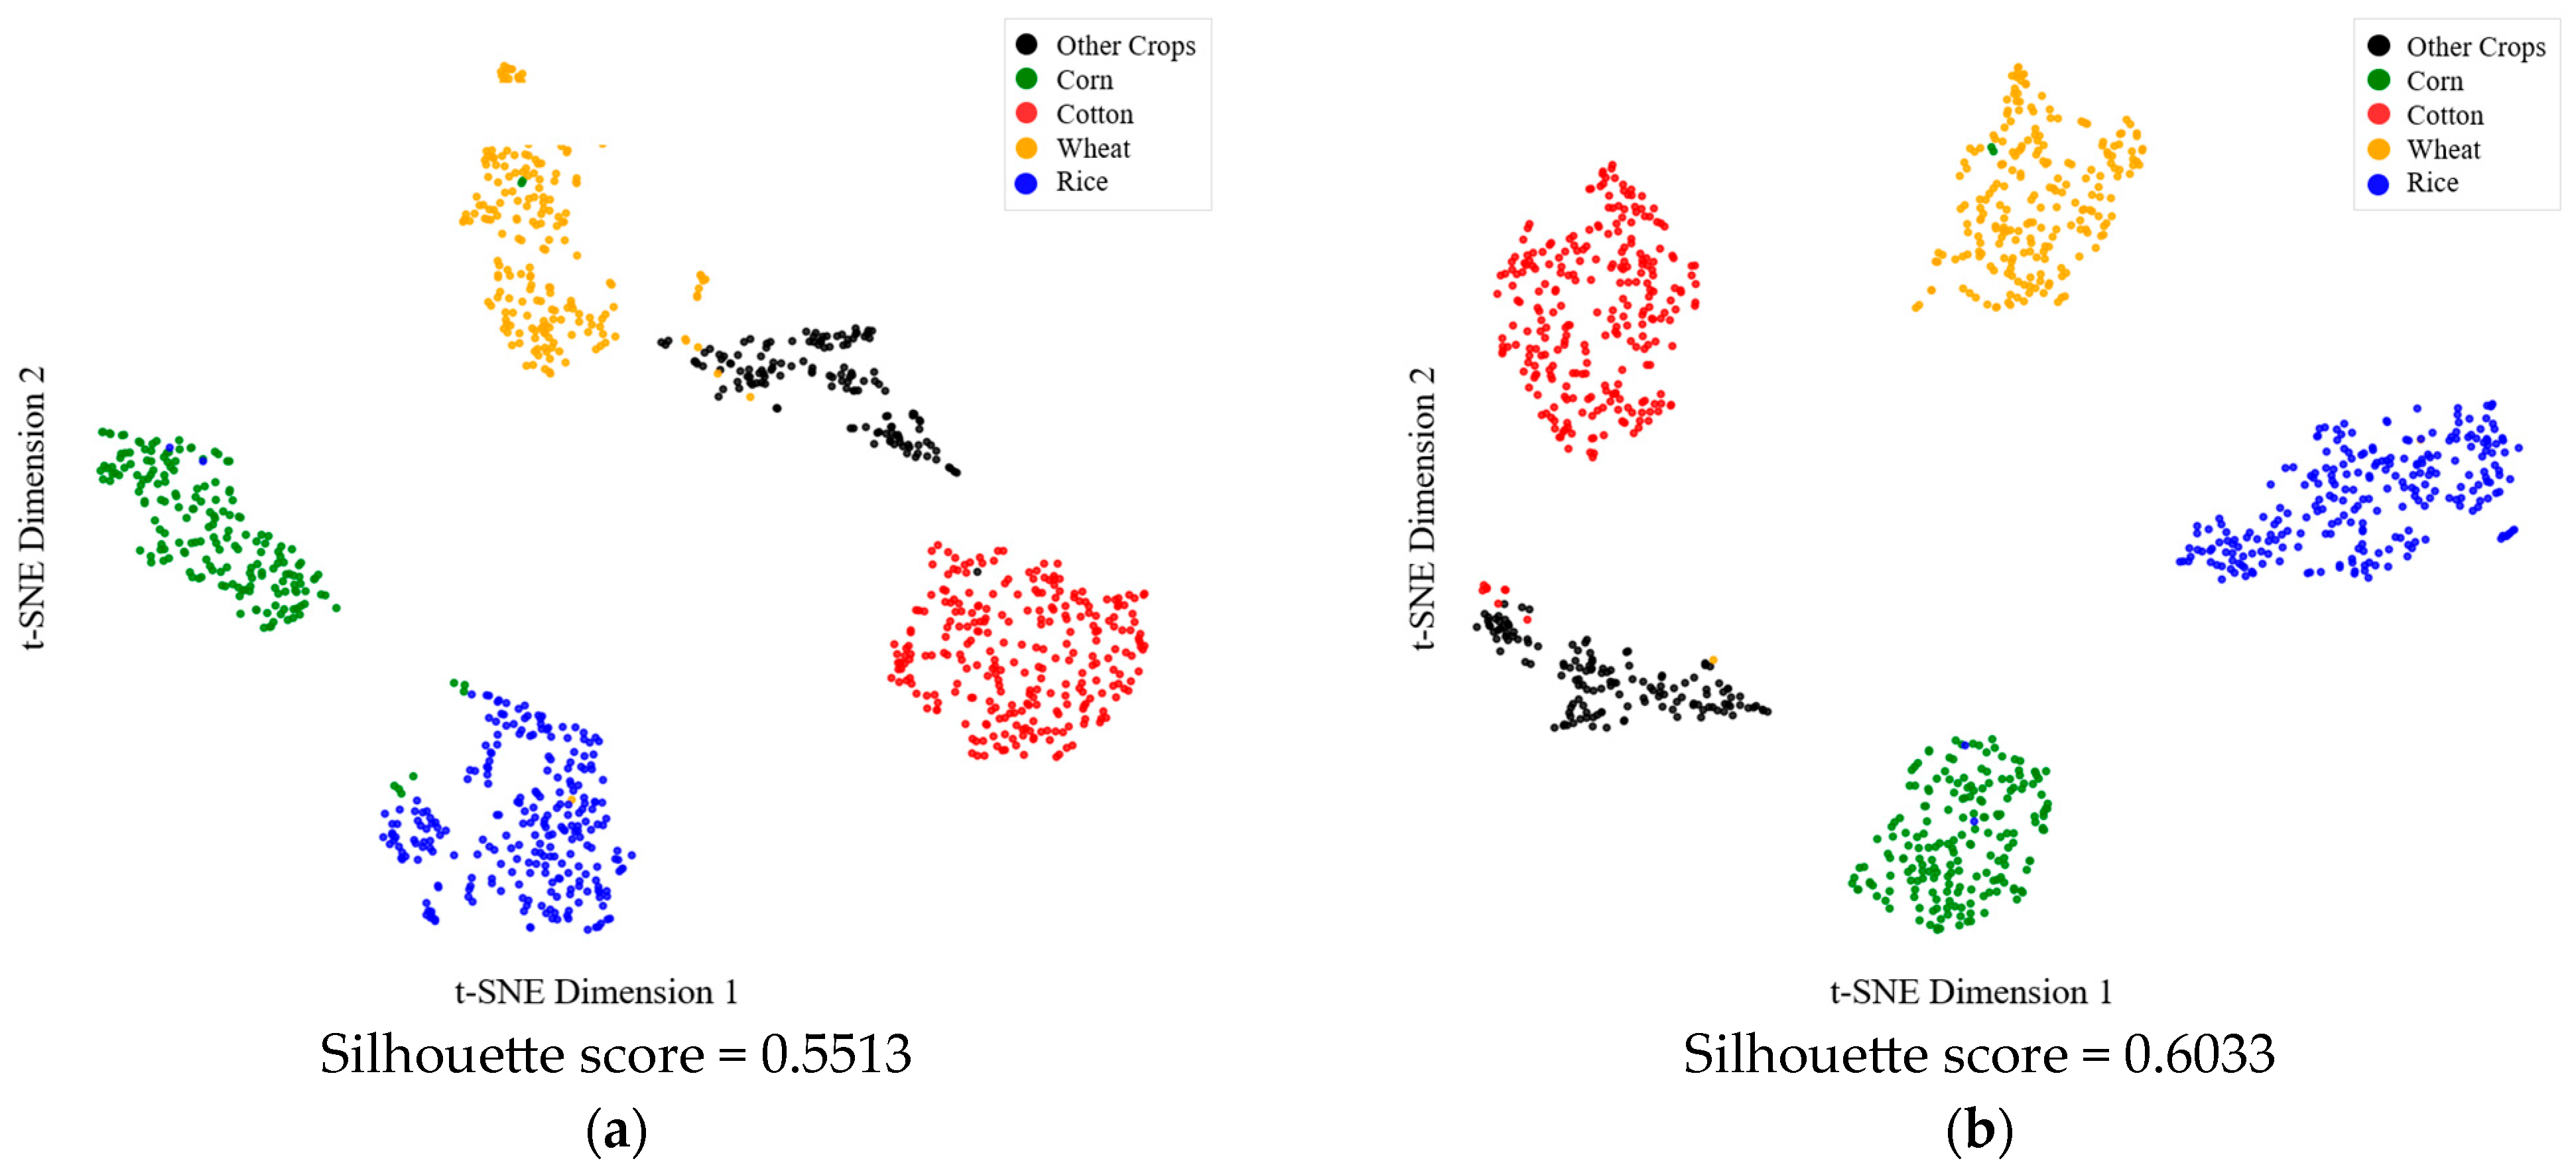
We used t-distributed Stochastic Neighbor Embedding (t-SNE) to project the high-dimensional features extracted by the models from the target domain test data into a two-dimensional plane to observe the separation of features across different classes (Figure 13). Figure 13a displays the features extracted by the Source-Only baseline. Although the model’s Macro F1-score is low, the sample points for each class in the plot already show a certain clustering tendency. This indicates that the feature extraction part of the model is effective and capable of identifying differences between crops. Figure 13b shows the features extracted by our final model. Compared to Figure 13a, the clusters for each class have become more compact and separated, with particularly clear boundaries between them. This visual improvement in feature separability is quantitatively supported by the Silhouette Score, which increased from 0.5513 for the Source-Only features (Figure 13a) to 0.6033 for the PLCM features (Figure 13b). This visually indicates that our UDA framework not only aligns the features but also enhances their discriminability.
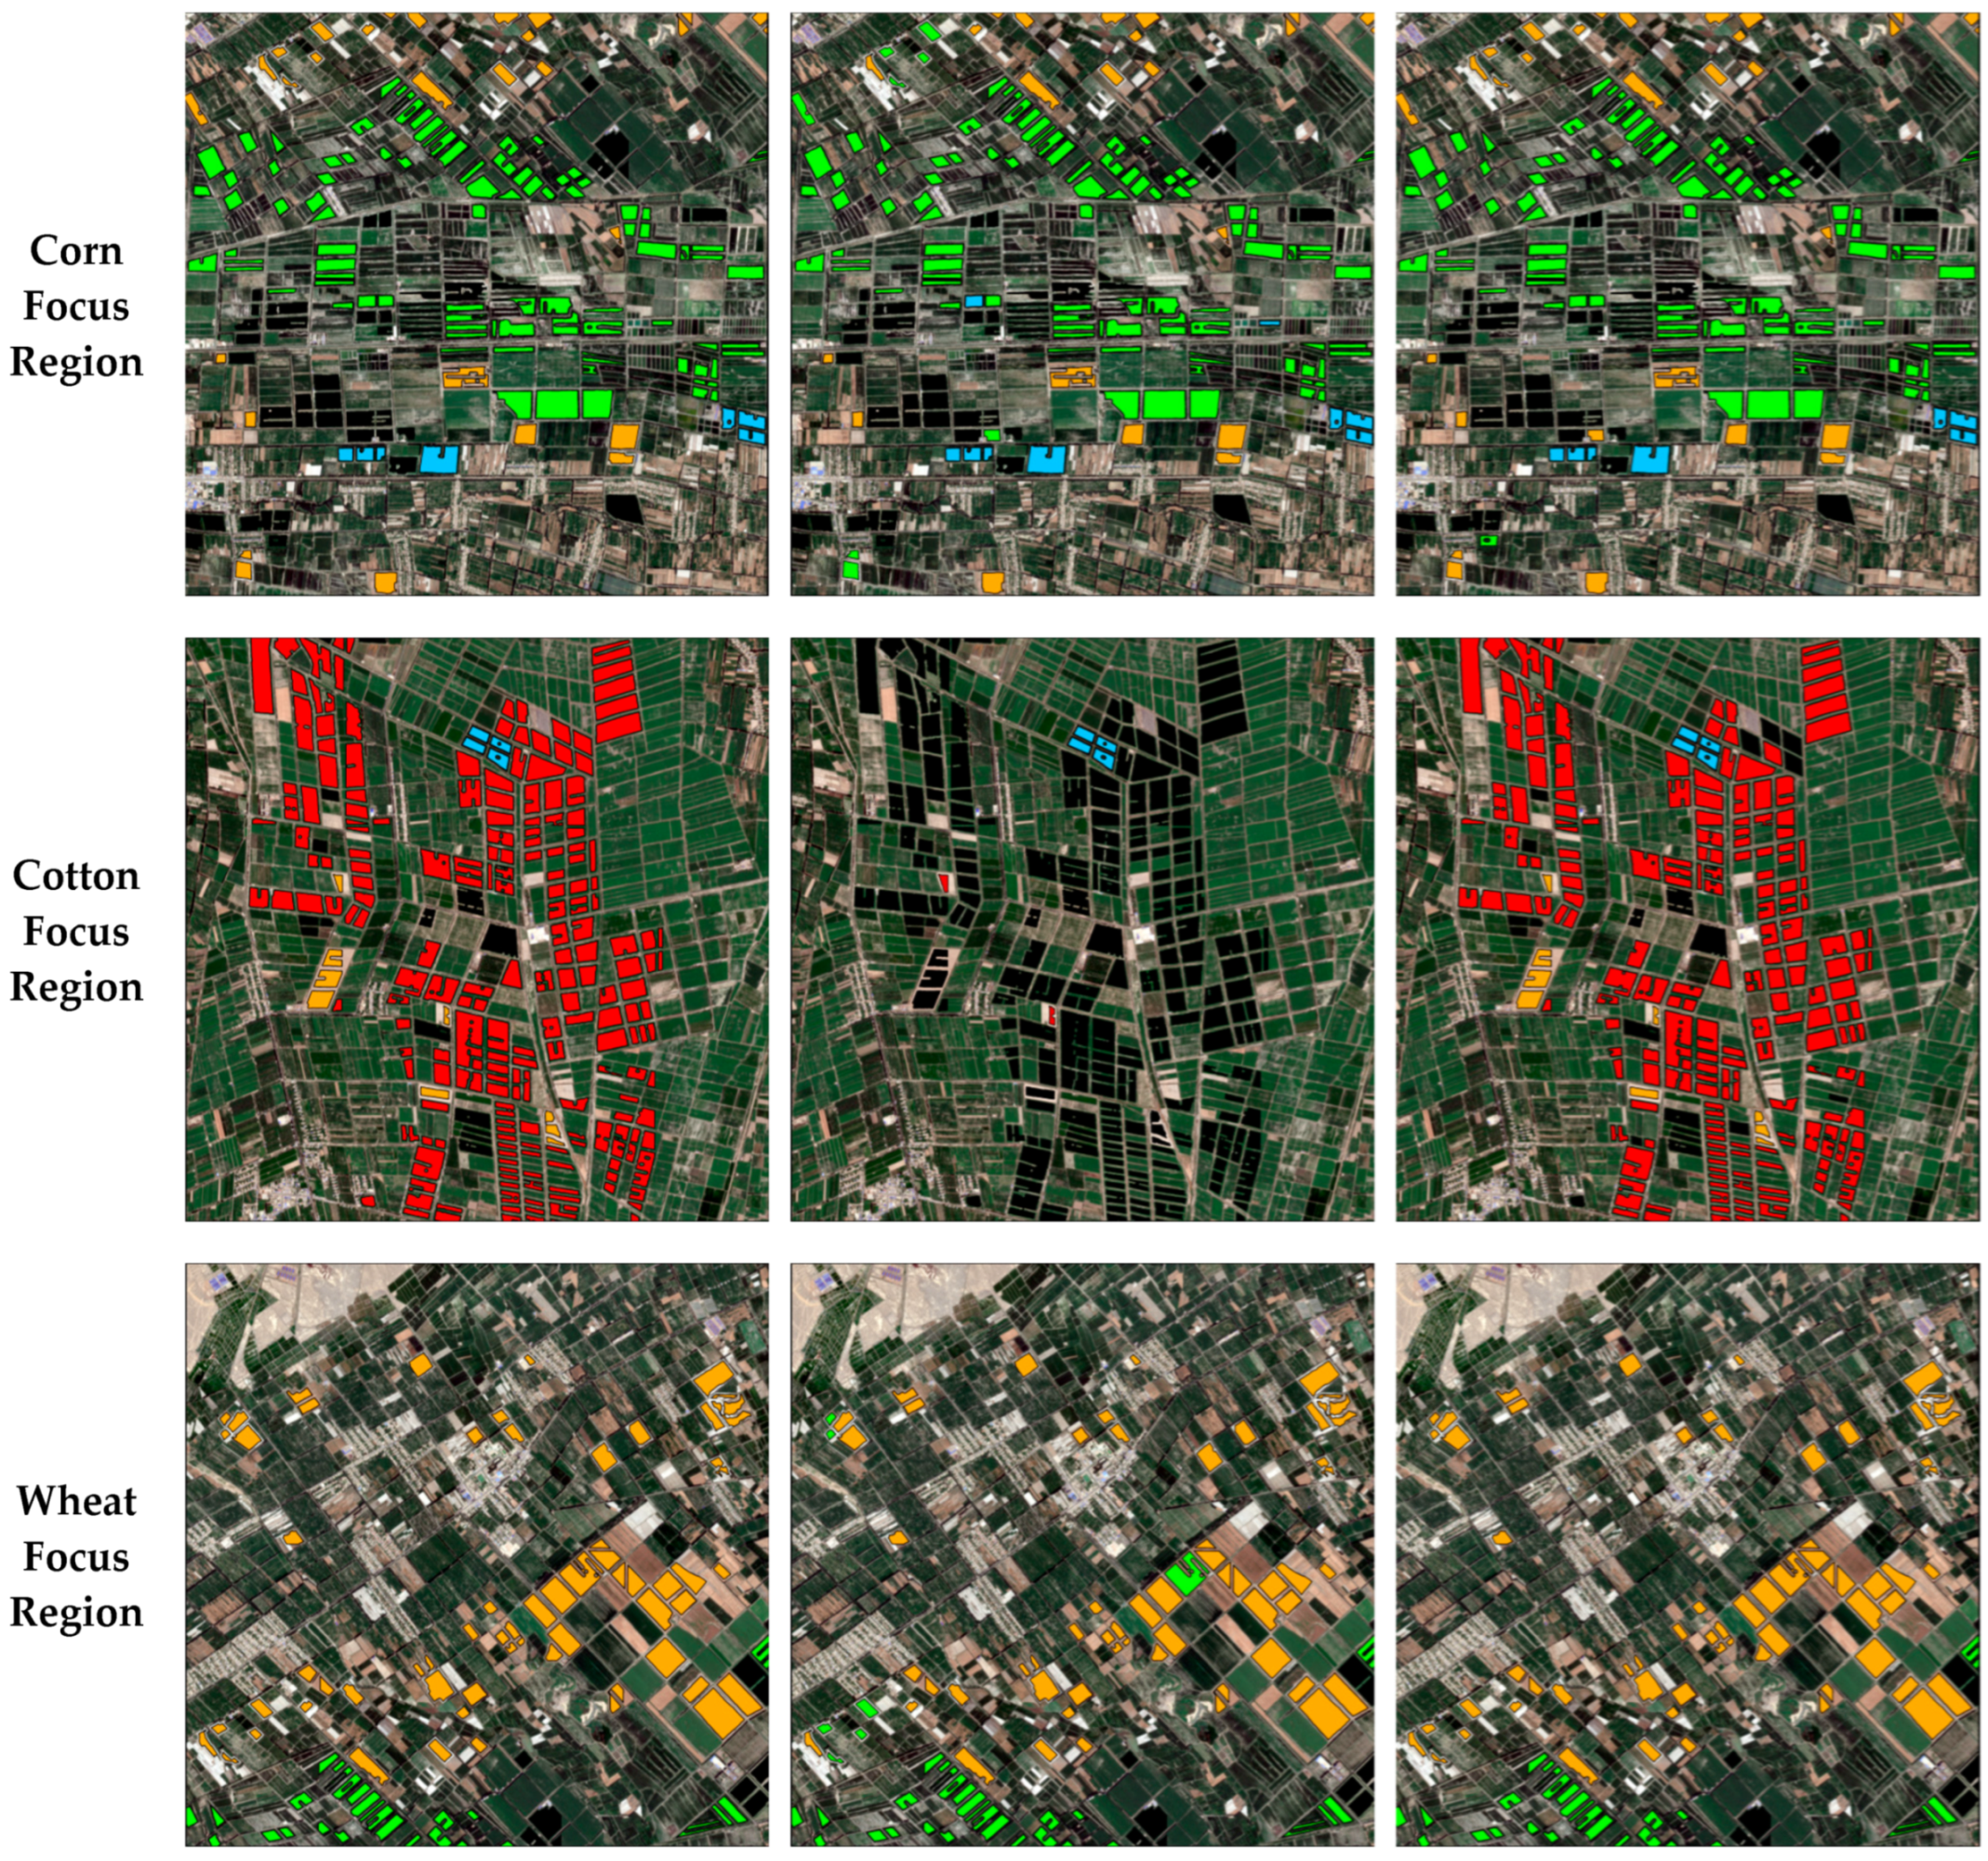
To visually assess the model’s practical mapping capability, we conducted a spatial visualization comparison of the classification results from the ground truth (column a), the Source-Only model (column b), and our proposed PLCM (column c) in representative regions for the four major crops (Figure 14).
The classification maps from the Source-Only model (column b) differ significantly from the ground truth (column a), with numerous misclassified parcels. The most severe issue is observed in the Cotton Focus Region (Figure 14, Row 2). In this representative subset, the Source-Only model (Figure 14b) failed to identify any cotton parcels; all areas of the red class were misclassified into the other crops category (black). This indicates a complete failure of the model to recognize this challenging class without domain adaptation. In stark contrast, the classification map generated by our proposed method (Figure 14c) shows a high degree of spatial agreement with the ground truth (Figure 14a) for this region. The vast majority of cotton parcels were accurately identified, effectively mitigating the complete failure of the Source-Only model for this class. Similar improvements are also evident in the Wheat Focus Region (Figure 14, Row 3). In the Source-Only model’s map (Figure 14b), many wheat parcels (orange) were misclassified, primarily being identified as corn, while a smaller portion was classified as other crops or cotton. In comparison, the number of misclassified parcels in the PLCM map (Figure 14c) is significantly reduced. This results in parcels of the same crop type forming spatially more contiguous and complete patches, which aligns more closely with the actual land cover distribution. We also observed that many of the Source-Only model’s misclassifications occurred in regions with more complex, interspersed crop compositions. In these areas with diverse cropping structures, the spectral and phenological features of different crops are more likely to be confused, which places higher demands on the model’s generalization ability. Our method, through more robust feature extraction (PSAE) and precise domain adaptation (class-aware MMD), demonstrated greater stability in such complex scenarios.

4.4. Sensitivity Analysis

This section analyzes the impact of two key hyperparameters in our UDA framework—the class-aware MMD loss weight λ and the pseudo-label confidence threshold τ—on the final model performance. The results are shown in Figure 15.
We investigated the effect of the MMD loss weight λ (Figure 15a). The experimental results show that the model’s performance is highly sensitive to the value of λ, especially when λ is small. As λ increases from 0.0001 to 1.0, the model’s Macro F1-score rises sharply, indicating that the domain adaptation loss is crucial for bridging the domain gap. When λ exceeds 1 (e.g., at 10 or 100), although the model’s average performance slightly improves or remains at a high level, we observed that its training process became extremely unstable, with drastic oscillations in the loss function and validation metrics.
After determining the optimal λ = 1.0, we further analyzed the influence of the pseudo-label confidence threshold τ (Figure 15b). The results show that the model’s performance is relatively stable in the range of τ from 0.5 to 0.8, with the F1-score maintained at around 95%. When the threshold is increased to 0.9, the performance reaches a clear peak. However, when the threshold is further increased to 0.95, the performance declines. This reveals a trade-off between the quality and quantity of pseudo-labels: a threshold that is too low introduces noise, whereas a threshold that is too high reduces the number of pseudo-labeled samples, thereby limiting the model’s learning capacity and ultimately leading to a drop in performance.
These sensitivity analyses highlight the importance of hyperparameter selection for optimal performance. The observed sensitivity, particularly to the MMD loss weight λ (Figure 15a), suggests that applying the PLCM framework to new domain pairs may require careful and potentially time-consuming hyperparameter tuning to achieve the best results, which could be a consideration for practical deployment scenarios requiring rapid adaptation.
Finally, we selected λ = 1 and τ = 0.9 as the optimal hyperparameter combination for our UDA method.

5. Discussion

5.1. Overall Performance and Principal Advantages

This study proposed and validated a novel unsupervised domain adaptation framework, PLCM, designed to address the domain shift problem in parcel-based, cross-regional, and cross-year crop classification. The main results in Section 4.1 (Table 1) demonstrate the robust and competitive performance of PLCM, which achieved a Macro F1-score of 96.56%, comparable to other state-of-the-art (SOTA) UDA methods. While this overall metric provides a useful benchmark, the primary advantages of the framework are revealed in the granular per-class analysis (Section 4.1, Table 2). This detailed breakdown shows that PLCM’s main contribution lies in its balanced performance and its ability to handle difficult-to-adapt categories. The underlying reasons for this success are explained in depth by the ablation studies (Section 4.2, Table 3).

5.2. Ablation Study: Component Necessity and Contributions

The ablation studies systematically demonstrated the necessity of each key design within the PLCM framework. Among the components constituting our framework, the balanced batch sampler made the most prominent contribution. When this strategy was removed, the model’s performance dropped by 21.13%. This indicates that severe class imbalance exists in both the source and target domain data, and the balanced sampling strategy plays a critical role in ensuring that the model can adequately learn features from all classes (especially minority classes), thereby enhancing its overall generalization ability.
At the model architecture level, replacing our designed PSAE module with a traditional PSE module [39] led to an 18.12% performance loss, which strongly supports the core advantages of PSAE. The PSE architecture generates a statistical description of a parcel by calculating the mean and standard deviation of the spectral features of all pixels within it and concatenating them [39]. Some studies have also added max and min pooling to the mean and standard deviation [21]. Although this method can capture both the “overall condition” and “degree of dispersion” of a parcel, it inherently treats all pixels equally. Our proposed PSAE transcends this fixed statistical summary by introducing a self-attention mechanism. It can intelligently assign a weight to each pixel within the parcel, thereby effectively suppressing interference from noise sources like field ridges, shadows, or mixed pixels, and modeling the intra-parcel spatial heterogeneity more finely. This ultimately allows for the extraction of purer and more robust spatial features. A similar performance loss occurred when we replaced the LTAE module with a standard LSTM network, with the Macro F1-score decreasing by 20.75%. Unlike the serial recurrent mechanism of LSTM, LTAE’s global attention mechanism enables it to more effectively capture key, distant phenological nodes throughout the crop’s entire growth cycle, thereby learning more discriminative temporal features.
Regarding the domain adaptation strategy, replacing the core class-aware MMD of the PLCM framework with a standard MMD also resulted in a significant performance drop of 11.11%. This result validates our core hypothesis: global feature alignment (standard MMD), while narrowing the overall distribution gap, can lead to negative transfer by ignoring class information, thereby confusing the feature boundaries between different classes. In contrast, the class-aware strategy adopted by PLCM, which performs independent and fine-grained feature alignment within each category, successfully preserves the class-discriminative nature of the features while closing the domain gap. This is empirically validated in Table 2, where standard MMD suffered from negative transfer on the Corn class (90.07%), performing worse than the Source-Only baseline (91.37%), while PLCM’s class-aware strategy effectively mitigated this issue (97.93%).

5.3. Comparison with State-of-the-Art Methods

Beyond the competitive overall Macro F1-scores presented in Table 1, the granular per-class analysis (Table 2) provides critical insights that the single aggregated metric obscures. While several SOTA methods (including the second-best method) show strong results on easy-to-adapt or major categories, PLCM’s primary advantage lies in its more balanced performance across all categories and its more effective handling of traditionally difficult-to-adapt categories. For instance, the Cotton and Other Crops categories were exceptionally challenging for baseline models. The fact that PLCM achieved the highest scores on both suggests that its class-aware MMD mechanism is more effective at preserving class-discriminative features for these low-support or spectrally ambiguous classes.
Evaluating the performance of UDA methods across different studies is inherently challenging due to variations in datasets, evaluation protocols, backbone architectures, geographic scales, and the specific set and number of target crop types. Nonetheless, positioning PLCM’s performance relative to recent state-of-the-art (SOTA) methods developed for related SITS crop classification tasks offers valuable insights.
Several recent UDA frameworks address cross-regional or cross-temporal crop mapping. For instance, the PAN [31], using a GRU-based backbone with standard MMD alignment for wheat, rape, fallow, and other land covers within China, reported an average Macro F1 score around 79.9% (with the best task reaching 85.2%). TimeMatch [21], which operates at the parcel level like PLCM, focuses on explicit temporal shift estimation combined with semi-supervised learning for adaptation across European regions. Applied to a more complex task involving over 15 crop types, TimeMatch achieved an average Macro F1 score of 58.2% (best task: 73.0%). Our PLCM framework, evaluated on a demanding cross-continental (US to China), cross-year task focused on four major crops plus the Other Crops category, yielded a Macro F1 score of 96.56%. While direct comparison is complicated by the differing number of classes—PLCM’s focus on fewer major crop types might allow the model to achieve higher specialization compared to methods classifying a broader range of categories—this result suggests the potential effectiveness of the class-aware MMD strategy combined with the PSAE + LTAE architecture for handling significant domain shifts. ClimID-UDA [30] presents another relevant approach, an unsupervised domain adaptation method based on climate indicator discrepancy (ClimID-UDA), utilizing climate indicator differences to correct target SITS data before classification (performed at the pixel level within available parcel boundaries). Focused on maize, soybean, and barley, ClimID-UDA reported high performance metrics (e.g., F1 reaching 94.6% in a Sentinel-2 scenario), demonstrating the efficacy of leveraging external data for adaptation. PLCM achieves a similarly high level of performance (96.56%) using a feature-alignment strategy that does not require auxiliary climate data, indicating its competitiveness. Methods addressing related but distinct challenges, such as Bayesian Joint Adaptation Network (BJAN) [22] (adapting without current-year labels) or Source-Free Unsupervised Domain Adaptation (SFUDA) [1] (where adaptation proceeds without access to source data), further highlight the diversity of ongoing research in this area.
In summary, while acknowledging the limitations of direct comparisons due to varying experimental conditions, PLCM demonstrates highly competitive performance against relevant SOTA UDA methods for SITS crop classification. Its considerable results, achieved under the specific conditions of a challenging cross-continental, cross-year adaptation task with shared crops, underscore the potential of the proposed class-aware feature alignment strategy.

5.4. Limitations and Future Work

Although PLCM has achieved promising results, some limitations remain that warrant further investigation in future work:
  • Complexity of the “Other Crops” Category, Label Shift, and Semantic Shift: A significant limitation inherent in this study relates to the constitution of the “Other Crops” category. In this work, all non-target crops were merged into this single class. It is important to clarify that this category encompasses other agricultural crops, rather than non-agricultural features (such as buildings or water bodies). Notably, the specific crop types within this category differ substantially between the domains: the source domain primarily includes soybeans, potatoes, and fallow land, whereas the target domain comprises entirely different types like peppers and tomatoes. Consequently, bundling these fundamentally distinct crops, which possess diverse phenological characteristics, into one macro-class introduces not only a complex form of label shift but also a significant semantic shift. This methodological choice simplifies the classification challenge by circumventing the task of aligning categories that lack direct semantic correspondence across domains. Therefore, while the achieved Macro F1-score of 96.56% indicates strong adaptation capability for the shared major crop types, caution is warranted when interpreting this result as a measure of overall generalization performance. It may not fully reflect the model’s ability to handle fine-grained classification tasks where precise alignment is required for all categories. The framework’s performance under conditions of strict one-to-one class correspondence remains an open question requiring further investigation. Addressing scenarios with mismatched class sets is crucial for advancing real-world applications. Future research should explore more advanced techniques specifically designed to handle such label space discrepancies. For instance, Partial Domain Adaptation (PDA) frameworks address situations where the target label set is a subset of the source [44], while Open Set Domain Adaptation (OSDA) approaches [45] explicitly account for unknown or outlier classes in the target domain. These paradigms offer theoretically more sound methodologies for tackling the “Other Crops” challenge. Furthermore, alternative strategies like Zero-Shot Learning (ZSL) adapted for remote sensing time series [46], which aim to classify unseen categories based on semantic descriptions (e.g., phenological attributes), might provide potential pathways for identifying specific minor crop types even without direct target labels. Exploring these directions constitutes a promising avenue for future investigation.
  • Inconsistency of Parcel Data Sources and Potential Bias: A methodological consideration in this study arises from the different origins and delineation processes of the parcel data for the source and target domains. The source domain parcels were generated using a semi-automated approach combining automated segmentation (Geo-SAM plugin in QGIS) with manual refinement based on high-resolution imagery and Sentinel-2 data (as described in Section 2.2.2), resulting in relatively precise, pixel-level boundaries. This approach was feasible given the generally larger and more regular parcel shapes in the source regions. In contrast, the target domain parcels, characterized by smaller sizes and more complex boundaries, were initially derived from a pre-existing high-precision cropland product [36]. To enhance the reliability of the target domain ground reference data, a crucial quality control step was implemented: data from a field survey (RTK coordinates and sketches) conducted in 2024 were spatially matched with this 2020 vector dataset, and only those parcels exhibiting high boundary consistency between the field data and the existing product were retained for analysis. This filtering process undoubtedly improved the quality and accuracy of the target parcel data used in our experiments, mitigating potential issues like contamination from incorrectly merged parcels affecting the PSAE module. However, despite this quality control, a fundamental inconsistency remains due to the different origins and initial delineation methodologies of the source and target parcel datasets. This difference still introduces a potential source of bias that could influence the study’s findings. Specifically, the distinct characteristics inherent in the two sets of boundaries might artificially influence the perceived domain shift between the source and target regions, independent of true geographical or phenological variations. Furthermore, while filtering improved the quality of the utilized samples, it also means that our evaluation might not fully reflect the model’s performance when applied directly to the unfiltered high-precision cropland product across the entire target region. Assessing this broader applicability requires further investigation. Therefore, interpreting the magnitude of the domain shift and the absolute performance gains should still consider this potential methodological bias stemming from the inconsistent data generation pathways. Future work should address the challenge of validating model performance on target regions using readily available but potentially less curated parcel datasets, while simultaneously developing methods robust to varying levels of parcel boundary accuracy. Employing consistent, high-quality parcel delineation methods across both domains (though potentially at a higher cost) remains a viable option. Alternatively, investigating the integration of parcel extraction models directly into the crop classification framework, potentially leveraging unsupervised domain adaptation techniques specifically designed for segmentation [47], could lead to more robust, end-to-end systems less sensitive to inconsistencies in pre-defined parcel inputs. Addressing the challenge posed by limited ground truth for validating target parcel accuracy also remains an important direction.
  • Dependence on Pseudo-Label Quality and Robustness to Large Domain Shifts: A core component of our class-aware MMD strategy is its reliance on pseudo-labels generated for the target domain to guide category-level feature alignment. To mitigate noise, we employ a high confidence threshold (τ = 0.9), aiming to select only reliable pseudo-labels for the adaptation process. However, this reliance introduces a potential limitation, particularly in scenarios involving substantial domain shifts. When transferring models across geographically distant regions, different years, or significantly varied agricultural systems, the initial performance of the Source-Only model on the target domain might be considerably low. This low performance can be exacerbated by challenges that become particularly acute under domain shift, such as the spectral mixing of crops and non-crop herbaceous vegetation (e.g., weeds). This ambiguity is often heightened in imagery captured during rainy seasons, which promotes similar vigorous growth in both crops and weeds, thereby confusing the model’s initial predictions. Under such challenging conditions, the model may fail to generate sufficient high-confidence pseudo-labels above the threshold τ, leading to a “cold-start” problem where the adaptation process cannot be effectively initiated or bootstrapped. The framework’s robustness under these extreme domain shift scenarios was not explicitly tested in this study and warrants further investigation. Future research should focus on enhancing the robustness of the adaptation process by exploring strategies that leverage limited target supervision. These include semi-supervised domain adaptation approaches utilizing a small amount of fully labeled target data [21,48], as well as weakly supervised methods that learn from more easily obtainable signals like sparse point samples [49]. Alternatively, integrating techniques like active learning [50] to intelligently select informative target samples for labeling could also improve performance and reduce reliance solely on high-confidence pseudo-labels derived from the source model. Investigating methods that can adapt effectively even with very weak initial target predictions is an essential area for future work.

6. Conclusions

This study addressed the critical challenge of domain shift in remote sensing-based crop classification, caused by geographical and environmental differences. We proposed and validated a novel unsupervised domain adaptation framework, PLCM (PSAE-LTAE + Class-aware MMD). The core contributions of this framework are twofold: first, we designed a PSAE space encoder based on a self-attention mechanism to extract features that are more robust to intra-parcel noise; second, we introduced a class-aware MMD loss function to perform a more fine-grained alignment of source and target domain features while preserving the class-discriminative nature of the features.
To comprehensively test the effectiveness of the proposed PLCM framework, we conducted experiments on a highly challenging cross-continental, cross-year crop classification task. PLCM demonstrated robust and competitive performance. The experimental results show that the framework achieved a Macro F1-score of 96.56%, comparable to other state-of-the-art (SOTA) UDA baseline models. More importantly, a granular per-class analysis revealed that PLCM’s primary advantage lies in its more balanced performance and its ability to robustly identify difficult-to-adapt categories (e.g., Cotton). Ablation studies further confirmed that our proposed PSAE module, the class-aware MMD strategy, and the balanced sampling strategy employed were all critical and indispensable components for achieving this performance.
Overall, the PLCM framework proposed in this study can effectively learn domain-invariant and class-discriminative phenological features. It provides an effective solution for achieving large-scale, high-precision automated crop mapping and reduces the dependency on large amounts of manually annotated data in the target domain.

Author Contributions

Conceptualization, L.L., Y.Y. and Y.M.; methodology, S.L. (Shuang Li) and L.L.; software, S.L. (Shuang Li); validation, S.L. (Shuang Li), J.H. and S.L. (Shengyang Li); formal analysis, S.L. (Shuang Li); investigation, S.L. (Shuang Li); resources, L.L.; data curation, S.L. (Shuang Li) and J.H.; writing—original draft preparation, S.L. (Shuang Li); writing—review and editing, L.L.; visualization, S.L. (Shuang Li); supervision, L.L.; project administration, L.L.; funding acquisition, L.L. and Y.M. All authors have read and agreed to the published version of the manuscript.

Funding

This research was funded by the Special Program for Regional Collaborative Innovation—Shanghai Cooperation Organization (SCO) Science and Technology Partnership Plan and International Science and Technology Cooperation Plan, grant number 2025E01020.

Data Availability Statement

The data presented in this study are available on request from the corresponding author. The data are not publicly available due to privacy or ethical restrictions.

Acknowledgments

Generated using or contains modified Copernicus Climate Change Service information. Neither the European Commission nor ECMWF is responsible for any use that may be made of the Copernicus information or data it contains.

Conflicts of Interest

The authors declare no conflicts of interest.

Abbreviations

The following abbreviations are used in this manuscript:
ALDAAdversarial Learning Domain Adaptation
CDAN+EConditional Adversarial Domain Adaptation with Entropy
CDLCropland Data Layer
CNNConvolutional Neural Network
DANNDomain-Adversarial Neural Network
ESAEuropean Space Agency
GRLGradient Reversal Layer
JUMBOTJoint Unbalanced Mini-batch Optimal Transport
LTAELightweight Temporal Attention Encoder
LSTMLong Short-Term Memory
MMDMaximum Mean Discrepancy
OSDAOpen Set Domain Adaptation
PANPhenology Alignment Network
PDAPartial Domain Adaptation
PLCMPSAE-LTAE + Class-aware MMD
PSAEPixel-Set Attention Encoder
PSEPixel-Set Encoder
RKHSReproducing Kernel Hilbert Space
RTKReal-Time Kinematic
RNNRecurrent Neural Network
SAMSegment Anything Model
SITSSatellite Image Time Series
SOTAState-of-the-Art
UDAUnsupervised Domain Adaptation
USDAUnited States Department of Agriculture
ZSLZero-Shot Learning

References

  1. Mohammadi, S.; Belgiu, M.; Stein, A. A Source-Free Unsupervised Domain Adaptation Method for Cross-Regional and Cross-Time Crop Mapping from Satellite Image Time Series. Remote Sens. Environ. 2024, 314, 114385. [Google Scholar] [CrossRef]
  2. Belgiu, M.; Marshall, M.; Boschetti, M.; Pepe, M.; Stein, A.; Nelson, A. PRISMA and Sentinel-2 Spectral Response to the Nutrient Composition of Grains. Remote Sens. Environ. 2023, 292, 113567. [Google Scholar] [CrossRef]
  3. Shen, Y.; Wang, H.; Zhang, Y.; Du, X.; Dong, Q.; Li, Q.; Wang, Y.; Zhang, S.; Dong, Y.; Xiao, J.; et al. Accurate Identification of Seed Maize Fields Based on Histogram of Stripe Slopes. IEEE J. Sel. Top. Appl. Earth Obs. Remote Sens. 2024, 17, 18278–18290. [Google Scholar] [CrossRef]
  4. Zhen, Z.; Chen, S.; Yin, T.; Gastellu-Etchegorry, J.-P. Globally Quantitative Analysis of the Impact of Atmosphere and Spectral Response Function on 2-Band Enhanced Vegetation Index (EVI2) over Sentinel-2 and Landsat-8. ISPRS J. Photogramm. Remote Sens. 2023, 205, 206–226. [Google Scholar] [CrossRef]
  5. Zhang, H.; Zhang, Y.; Gao, T.; Lan, S.; Tong, F.; Li, M. Landsat 8 and Sentinel-2 Fused Dataset for High Spatial-Temporal Resolution Monitoring of Farmland in China’s Diverse Latitudes. Remote Sens. 2023, 15, 2951. [Google Scholar] [CrossRef]
  6. Yang, G.; Li, X.; Xiong, Y.; He, M.; Zhang, L.; Jiang, C.; Yao, X.; Zhu, Y.; Cao, W.; Cheng, T. Annual Winter Wheat Mapping for Unveiling Spatiotemporal Patterns in China with a Knowledge-Guided Approach and Multi-Source Datasets. ISPRS J. Photogramm. Remote Sens. 2025, 225, 163–179. [Google Scholar] [CrossRef]
  7. Zhang, H.; Kang, J.; Xu, X.; Zhang, L. Accessing the Temporal and Spectral Features in Crop Type Mapping Using Multi-Temporal Sentinel-2 Imagery: A Case Study of Yi’an County, Heilongjiang Province, China. Comput. Electron. Agric. 2020, 176, 105618. [Google Scholar] [CrossRef]
  8. You, N.; Dong, J.; Huang, J.; Du, G.; Zhang, G.; He, Y.; Yang, T.; Di, Y.; Xiao, X. The 10-m Crop Type Maps in Northeast China during 2017–2019. Sci. Data 2021, 8, 41. [Google Scholar] [CrossRef]
  9. Lin, C.; Zhong, L.; Song, X.-P.; Dong, J.; Lobell, D.B.; Jin, Z. Early- and in-Season Crop Type Mapping without Current-Year Ground Truth: Generating Labels from Historical Information via a Topology-Based Approach. Remote Sens. Environ. 2022, 274, 112994. [Google Scholar] [CrossRef]
  10. Yan, S.; Yao, X.; Zhu, D.; Liu, D.; Zhang, L.; Yu, G.; Gao, B.; Yang, J.; Yun, W. Large-Scale Crop Mapping from Multi-Source Optical Satellite Imageries Using Machine Learning with Discrete Grids. Int. J. Appl. Earth Obs. Geoinf. 2021, 103, 102485. [Google Scholar] [CrossRef]
  11. Gill, H.S.; Bath, B.S.; Singh, R.; Riar, A.S. Wheat Crop Classification Using Deep Learning. Multimed. Tools Appl. 2024, 83, 82641–82657. [Google Scholar] [CrossRef]
  12. Lu, T.; Wan, L.; Wang, L. Fine Crop Classification in High Resolution Remote Sensing Based on Deep Learning. Front. Environ. Sci. 2022, 10, 991173. [Google Scholar] [CrossRef]
  13. Fan, J.; Bai, J.; Li, Z.; Ortiz-Bobea, A.; Gomes, C.P. A GNN-RNN Approach for Harnessing Geospatial and Temporal Information: Application to Crop Yield Prediction. In Proceedings of the AAAI Conference on Artificial Intelligence, Virtual Event, 22 February–1 March 2022; Volume 36, pp. 11873–11881. [Google Scholar] [CrossRef]
  14. Yi, Z.; Jia, L.; Chen, Q. Crop Classification Using Multi-Temporal Sentinel-2 Data in the Shiyang River Basin of China. Remote Sens. 2020, 12, 4052. [Google Scholar] [CrossRef]
  15. Wang, H.; Ye, Z.; Wang, Y.; Liu, X.; Zhang, X.; Zhao, Y.; Li, S.; Liu, Z.; Zhang, X. Improving the Crop Classification Performance by Unlabeled Remote Sensing Data. Expert Syst. Appl. 2024, 236, 121283. [Google Scholar] [CrossRef]
  16. Li, G.; Cui, J.; Han, W.; Zhang, H.; Huang, S.; Chen, H.; Ao, J. Crop Type Mapping Using Time-Series Sentinel-2 Imagery and U-Net in Early Growth Periods in the Hetao Irrigation District in China. Comput. Electron. Agric. 2022, 203, 107478. [Google Scholar] [CrossRef]
  17. Hu, Y.; Zeng, H.; Tian, F.; Zhang, M.; Wu, B.; Gilliams, S.; Li, S.; Li, Y.; Lu, Y.; Yang, H. An Interannual Transfer Learning Approach for Crop Classification in the Hetao Irrigation District, China. Remote Sens. 2022, 14, 1208. [Google Scholar] [CrossRef]
  18. Hao, P.; Di, L.; Zhang, C.; Guo, L. Transfer Learning for Crop Classification with Cropland Data Layer Data (CDL) as Training Samples. Sci. Total Environ. 2020, 733, 138869. [Google Scholar] [CrossRef]
  19. Ge, S.; Zhang, J.; Pan, Y.; Yang, Z.; Zhu, S. Transferable Deep Learning Model Based on the Phenological Matching Principle for Mapping Crop Extent. Int. J. Appl. Earth Obs. Geoinf. 2021, 102, 102451. [Google Scholar] [CrossRef]
  20. Antonijević, O.; Jelić, S.; Bajat, B.; Kilibarda, M. Transfer Learning Approach Based on Satellite Image Time Series for the Crop Classification Problem. J. Big Data 2023, 10, 54. [Google Scholar] [CrossRef]
  21. Nyborg, J.; Pelletier, C.; Lefèvre, S.; Assent, I. TimeMatch: Unsupervised Cross-Region Adaptation by Temporal Shift Estimation. ISPRS J. Photogramm. Remote Sens. 2022, 188, 301–313. [Google Scholar] [CrossRef]
  22. Xu, Y.; Ebrahimy, H.; Zhang, Z. Bayesian Joint Adaptation Network for Crop Mapping in the Absence of Mapping Year Ground-Truth Samples. IEEE Trans. Geosci. Remote Sens. 2024, 62, 1–20. [Google Scholar] [CrossRef]
  23. Tzeng, E.; Hoffman, J.; Zhang, N.; Saenko, K.; Darrell, T. Deep Domain Confusion: Maximizing for Domain Invariance. arXiv 2014, arXiv:1412.3474. [Google Scholar] [CrossRef]
  24. Ganin, Y.; Lempitsky, V. Unsupervised Domain Adaptation by Backpropagation. In Proceedings of the 32nd International Conference on Machine Learning, Lille, France, 6–11 July 2015; JMLR: Cambridge, MA, USA, 2015; Volume 37, pp. 1180–1189. [Google Scholar]
  25. Long, M.; Cao, Z.; Wang, J.; Jordan, M.I. Conditional Adversarial Domain Adaptation. In Proceedings of the 32nd International Conference on Neural Information Processing Systems, Montréal, Canada, 3–8 December 2018; Curran Associates Inc.: Red Hook, NY, USA, 2018; Volume 31, pp. 1647–1657. [Google Scholar]
  26. Chen, M.; Zhao, S.; Liu, H.; Cai, D. Adversarial-Learned Loss for Domain Adaptation. In Proceedings of the AAAI Conference on Artificial Intelligence, New York, NY, USA, 7–12 February 2020; Volume 34, pp. 3521–3528. [Google Scholar] [CrossRef]
  27. Zhang, Y.; Hao, X.; Li, F.; Wang, Z.; Li, D.; Li, M.; Mao, R. Unsupervised Domain Adaptation Semantic Segmentation Method for Wheat Disease Detection Based on UAV Multispectral Images. Comput. Electron. Agric. 2025, 236, 110473. [Google Scholar] [CrossRef]
  28. Wang, Y.; Feng, L.; Sun, W.; Zhang, Z.; Zhang, H.; Yang, G.; Meng, X. Exploring the Potential of Multi-Source Unsupervised Domain Adaptation in Crop Mapping Using Sentinel-2 Images. GIScience Remote Sens. 2022, 59, 2247–2265. [Google Scholar] [CrossRef]
  29. Wang, Y.; Feng, L.; Zhang, Z.; Tian, F. An Unsupervised Domain Adaptation Deep Learning Method for Spatial and Temporal Transferable Crop Type Mapping Using Sentinel-2 Imagery. ISPRS J. Photogramm. Remote Sens. 2023, 199, 102–117. [Google Scholar] [CrossRef]
  30. Wang, H.; Yao, Y.; Liu, J.; Zhang, X.; Zhao, Y.; Li, S.; Liu, Z.; Zhang, X.; Zeng, Y. Unsupervised Cross-Regional and Cross-Year Adaptation by Climate Indicator Discrepancy for Crop Classification. J. Remote Sens. 2025, 5, 0439. [Google Scholar] [CrossRef]
  31. Wang, Z.; Zhang, H.; He, W.; Zhang, L. Cross-Phenological-Region Crop Mapping Framework Using Sentinel-2 Time Series Imagery: A New Perspective for Winter Crops in China. ISPRS J. Photogramm. Remote Sens. 2022, 193, 200–215. [Google Scholar] [CrossRef]
  32. Hersbach, H.; Bell, B.; Berrisford, P.; Biavati, G.; Horányi, A.; Muñoz Sabater, J.; Nicolas, J.; Peubey, C.; Radu, R.; Rozum, I.; et al. ERA5 Hourly Data on Single Levels from 1940 to Present. Copernicus Climate Change Service (C3S) Climate Data Store (CDS). 2023. Available online: https://cds.climate.copernicus.eu/datasets/reanalysis-era5-single-levels?tab=overview (accessed on 10 November 2025).
  33. U.S. Department of Agriculture (USDA), National Agricultural Statistics Service (NASS). Cropland Data Layer. Available online: https://www.nass.usda.gov/Research_and_Science/Cropland/Release/index.php (accessed on 1 December 2024).
  34. Awada, H.; Ciraolo, G.; Maltese, A.; Provenzano, G.; Moreno Hidalgo, M.A.; Còrcoles, J.I. Assessing the Performance of a Large-Scale Irrigation System by Estimations of Actual Evapotranspiration Obtained by Landsat Satellite Images Resampled with Cubic Convolution. Int. J. Appl. Earth Obs. Geoinf. 2019, 75, 96–105. [Google Scholar] [CrossRef]
  35. Zhao, Z.; Fan, C.; Liu, L. Geo SAM: A QGIS Plugin Using Segment Anything Model (SAM) to Accelerate Geospatial Image Segmentation (1.1.0). Zenodo. 2023. Available online: https://zenodo.org/records/8191039 (accessed on 10 November 2025).
  36. Jiang, H.; Ku, M.; Zhou, X.; Zheng, Q.; Liu, Y.; Xu, J.; Li, D.; Wang, C.; Wei, J.; Zhang, J.; et al. CropLayer: A High-Accuracy 2-Meter Resolution Cropland Mapping Dataset for China in 2020 Derived from Mapbox and Google Satellite Imagery Using Data-Driven Approaches. Earth Syst. Sci. Data Discuss. 2025. preprint. [Google Scholar] [CrossRef]
  37. Lei, L.; Wang, X.; Zhong, Y.; Zhang, L. FineCrop: Mapping Fine-Grained Crops Using Class-Aware Feature Decoupling and Parcel-Aware Class Rebalancing with Sentinel-2 Time Series. ISPRS J. Photogramm. Remote Sens. 2025, 228, 785–803. [Google Scholar] [CrossRef]
  38. Chen, R.; Xiong, S.; Zhang, N.; Fan, Z.; Qi, N.; Fan, Y.; Feng, H.; Ma, X.; Yang, H.; Yang, G.; et al. Fine-Scale Classification of Horticultural Crops Using Sentinel-2 Time-Series Images in Linyi Country, China. Comput. Electron. Agric. 2025, 236, 110425. [Google Scholar] [CrossRef]
  39. Sainte Fare Garnot, V.; Landrieu, L.; Giordano, S.; Chehata, N. Satellite Image Time Series Classification with Pixel-Set Encoders and Temporal Self-Attention. In Proceedings of the 2020 IEEE/CVF Conference on Computer Vision and Pattern Recognition (CVPR), Seattle, WA, USA, 13–19 June 2020; pp. 12322–12331. [Google Scholar] [CrossRef]
  40. Sainte Fare Garnot, V.; Landrieu, L. Lightweight Temporal Self-Attention for Classifying Satellite Image Time Series. In Advanced Analytics and Learning on Temporal Data; Lemaire, V., Malinowski, S., Bagnall, A., Guyet, T., Tavenard, R., Ifrim, G., Eds.; Springer International Publishing: Cham, Switzerland, 2020; Volume 12588, pp. 171–181. [Google Scholar] [CrossRef]
  41. Nelder, J.A.; Wedderburn, R.W.M. Generalized Linear Models. J. R. Stat. Soc. A. 1972, 135, 370–384. [Google Scholar] [CrossRef]
  42. Xu, J.; Zhu, Y.; Zhong, R.; Lin, Z.; Xu, J.; Jiang, H.; Huang, J.; Li, H.; Lin, T. DeepCropMapping: A Multi-Temporal Deep Learning Approach with Improved Spatial Generalizability for Dynamic Corn and Soybean Mapping. Remote Sens. Environ. 2020, 247, 111946. [Google Scholar] [CrossRef]
  43. Fatras, K.; Séjourné, T.; Courty, N.; Flamary, R. Unbalanced Minibatch Optimal Transport; Applications to Domain Adaptation. In Proceedings of the 38th International Conference on Machine Learning, Virtual Event, 18–24 July 2021; Volume 139, pp. 3186–3197. [Google Scholar]
  44. Cao, Z.; Ma, L.; Long, M.; Wang, J. Partial Adversarial Domain Adaptation. In Computer Vision—ECCV 2018; Ferrari, V., Hebert, M., Sminchisescu, C., Weiss, Y., Eds.; Springer: Cham, Switzerland, 2018; Volume 11212, pp. 139–155. [Google Scholar] [CrossRef]
  45. Busto, P.P.; Gall, J. Open Set Domain Adaptation. In Proceedings of the 2017 IEEE International Conference on Computer Vision (ICCV), Venice, Italy, 22–29 October 2017; pp. 754–763. [Google Scholar] [CrossRef]
  46. Wen, S.; Zhao, W.; Ji, F.; Peng, R.; Zhang, L.; Wang, Q. “Phenology Description Is All You Need!” Mapping Unknown Crop Types with Remote Sensing Time-Series and LLM Generated Text Alignment. ISPRS J. Photogramm. Remote Sens. 2025, 228, 141–165. [Google Scholar] [CrossRef]
  47. Wei, R.; Yang, L.; Li, X.; Zhu, C.; Zhang, L.; Wang, J.; Liu, J.; Zhu, L.; Zhou, C. Breaking the Limitations of Scenes and Sensors Variability: A Novel Unsupervised Domain Adaptive Instance Segmentation Framework for Agricultural Field Extraction. Remote Sens. Environ. 2025, 331, 115051. [Google Scholar] [CrossRef]
  48. Wang, G.; Wang, Y.; Zhang, J.; Wang, X.; Pan, Z. Cross-Domain Self-Supervised Few-Shot Learning via Multiple Crops with Teacher-Student Network. Eng. Appl. Artif. Intell. 2024, 132, 107892. [Google Scholar] [CrossRef]
  49. Cai, Z.; Xu, B.; Yu, Q.; Zhang, X.; Yang, J.; Wei, H.; Li, S.; Song, Q.; Xiong, H.; Wu, H.; et al. A Cost-Effective and Robust Mapping Method for Diverse Crop Types Using Weakly Supervised Semantic Segmentation with Sparse Point Samples. ISPRS J. Photogramm. Remote Sens. 2024, 218, 260–276. [Google Scholar] [CrossRef]
  50. Hamrouni, Y.; Paillassa, E.; Chéret, V.; Monteil, C.; Sheeren, D. From Local to Global: A Transfer Learning-Based Approach for Mapping Poplar Plantations at National Scale Using Sentinel-2. ISPRS J. Photogramm. Remote Sens. 2021, 171, 76–100. [Google Scholar] [CrossRef]
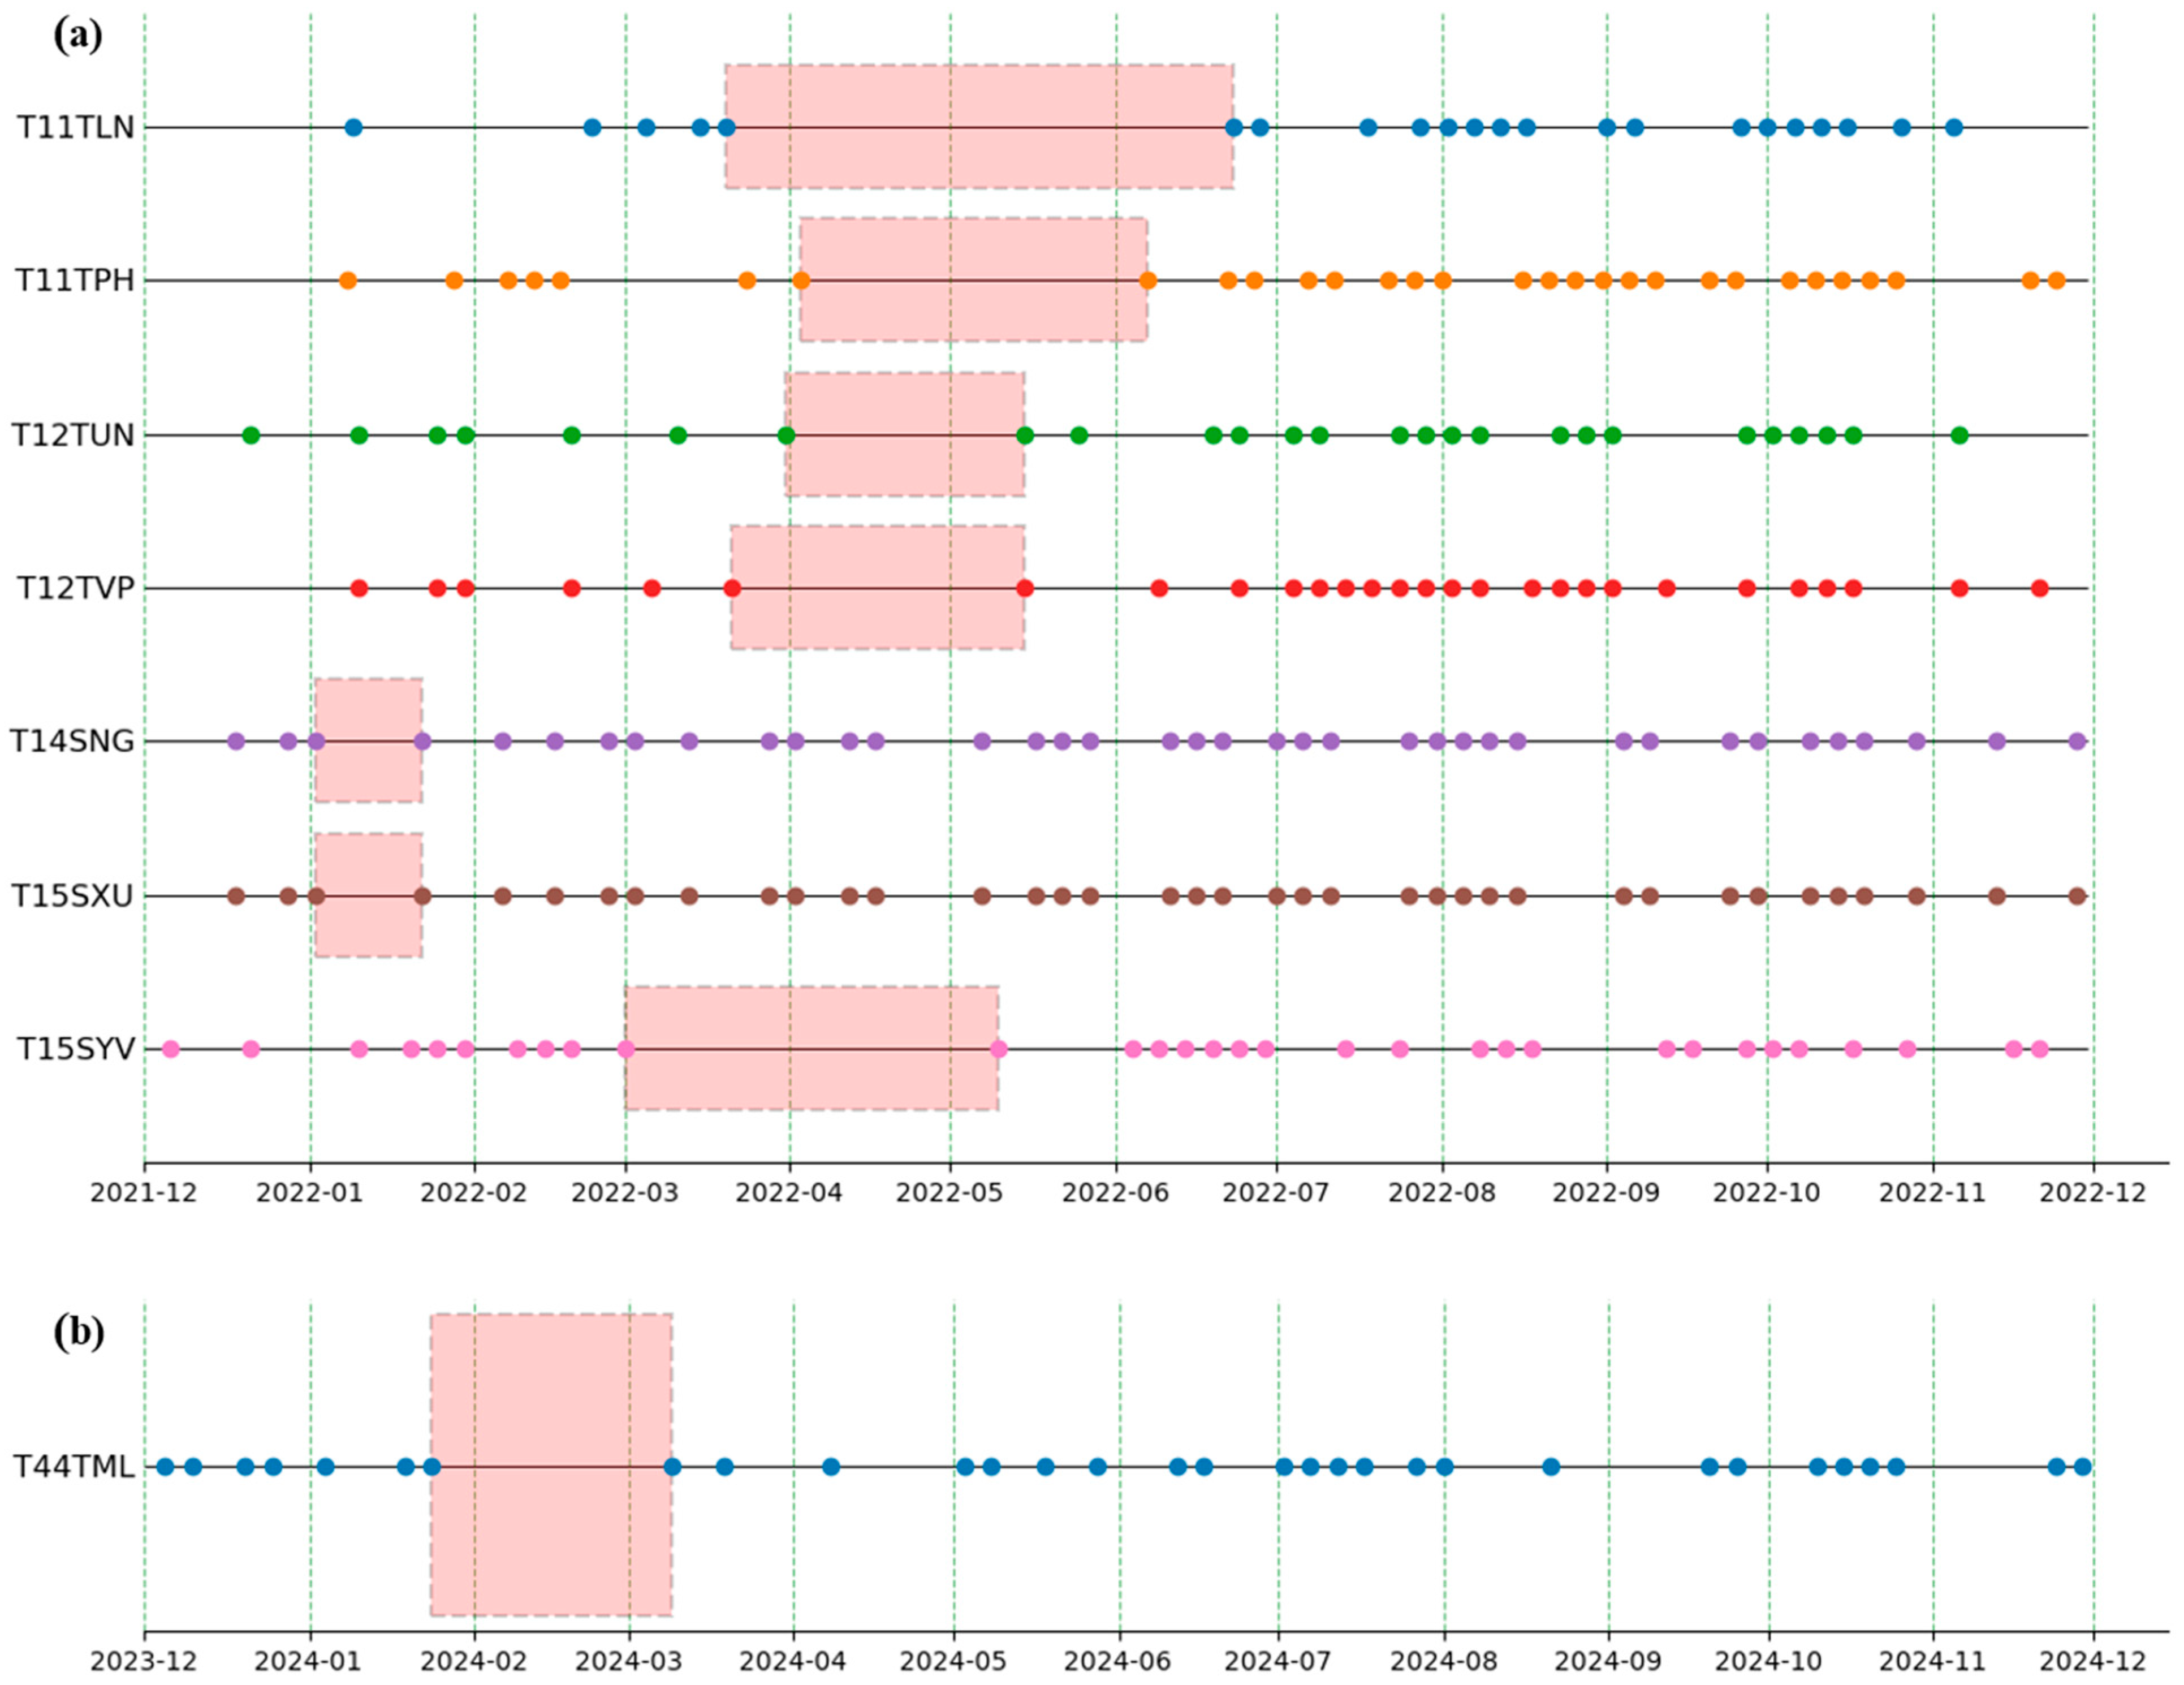
Figure 3. Acquisition dates of Sentinel-2 time series imagery for (a) the seven source domain sites and (b) the target domain site. The dots represent the sampling date of each image, and the red rectangles indicate the longest continuous period of missing data for each location.
Remotesensing 17 03762 g003
Figure 4. Class distribution of ground reference samples in the source domain. Note the significant class imbalance, with the “Other Crops” category being predominant.
Remotesensing 17 03762 g004
Figure 5. Spatial distribution of the ground reference samples collected via the Real-Time Kinematic (RTK) field survey in the target domain.
Remotesensing 17 03762 g005
Figure 6. Class distribution of ground reference samples in the target domain. The different class distributions between the two domains pose another key challenge for the unsupervised domain adaptation (UDA) task.
Remotesensing 17 03762 g006
Figure 7. Illustration of the parcel erosion process for preprocessing. (a) shows the original parcel boundaries before the 20-meter inward erosion. (b) shows the resulting parcel boundaries after erosion.
Remotesensing 17 03762 g007
Figure 9. The architecture of the Pixel-Set Attention Encoder-Lightweight Temporal Attention Encoder (PSAE-LTAE) model.
Remotesensing 17 03762 g009
Figure 10. The architecture of the Pixel-Set Attention Encoder (PSAE) module.
Remotesensing 17 03762 g010
Figure 11. The architecture of the Lightweight Temporal Attention Encoder (LTAE) module. The diagram illustrates the parallel processing architecture using H = 3 heads as an example.
Remotesensing 17 03762 g011
Figure 12. Workflow of the proposed Class-Aware Maximum Mean Discrepancy (MMD) strategy.
Remotesensing 17 03762 g012
Figure 13. Visualization of target domain samples in the t-distributed Stochastic Neighbor Embedding (t-SNE) feature space. (a) Features extracted by the Source-Only baseline model; (b) features extracted by our proposed PLCM (PSAE-LTAE + Class-aware MMD) framework. In the plots, each point represents a parcel sample, and different colors correspond to different crop types. It is important to note that while t-SNE is useful for visualizing local structure and cluster separation, the resulting embedding is sensitive to hyperparameters (e.g., perplexity) and may not accurately preserve the global structure of the original feature space.
Remotesensing 17 03762 g013
Figure 14. Comparison of classification maps for four representative crop regions in the target domain. Each row displays a specific crop type (from top to bottom: corn, cotton, wheat, and rice). (a) Ground truth; (b) prediction results from the Source-Only baseline model; (c) prediction results from our proposed PLCM (PSAE-LTAE + Class-aware MMD) framework.
Remotesensing 17 03762 g014aRemotesensing 17 03762 g014b
Figure 15. Sensitivity analysis of the Maximum Mean Discrepancy (MMD) loss weight λ and the pseudo-label confidence threshold τ. The figure shows the model performance (Macro F1-score): (a) as a function of the MMD loss weight λ in the cross-regional task; and (b) as a function of the pseudo-label confidence threshold τ when λ is fixed at its optimal value of 1.0. The error bars in both plots represent the standard deviation of three independent runs.
Remotesensing 17 03762 g015
Table 1. Comparison of Macro F1-Scores (%) between the proposed method and baseline models on the cross-regional crop classification task. The mean and standard deviation of the Macro F1-scores are derived from three independent runs.
MethodMacro F1-Score (%)
Source-Only65.50 ± 2.45
MMD85.45 ± 5.56
DANN94.82 ± 1.04
CDAN+E95.65 ± 1.89
ALDA94.29 ± 1.15
JUMBOT93.06 ± 1.82
PLCM96.56 ± 1.33
Target-Only *99.17 ± 0.20
* Performance for Target-Only was assessed on a reserved 20% test set of the target domain. All other methods (Source-Only and UDA baselines) were evaluated on the entire labeled sample set of the target domain.
Table 2. Detailed classification performance for the cross-regional task. Per-class metrics are F1-scores (%). The mean and standard deviation of the Macro F1-scores are derived from three independent runs.
MethodOther
Crops
CornCottonWheatRiceMacro F1-Score (%)
Source-Only49.31 ± 0.0991.36 ± 5.430.0088.49 ± 5.9198.35 ± 0.9965.50 ± 2.45
MMD75.52 ± 9.2290.07 ± 3.6680.44 ± 8.6090.60 ± 3.4390.62 ± 3.7385.45 ± 5.56
CDAN+E89.72 ± 6.7498.43 ± 0.1093.30 ± 2.4697.79 ± 1.1299.00 ± 0.5795.65 ± 1.89
PLCM91.19 ± 4.1897.93 ± 0.5596.32 ± 2.2398.15 ± 0.2199.19 ± 0.1796.56 ± 1.33
Table 3. Performance contribution analysis of key components in our proposed framework, sorted by the magnitude of performance decline.
AblationMacro F1-Score (%)Magnitude of Decline (%)
PLCM96.56 ± 1.33-
No UDA65.50 ± 2.45↓31.06 *
No balanced batch sampler75.43 ± 8.22↓21.13
Use LSTM75.81 ± 4.77↓20.75
Use PSE78.44 ± 4.77↓18.12
Use MMD85.45 ± 5.56↓11.11
* ‘↓’ indicates the performance decrease in F1-score percentage points compared to the full model.
Disclaimer/Publisher’s Note: The statements, opinions and data contained in all publications are solely those of the individual author(s) and contributor(s) and not of MDPI and/or the editor(s). MDPI and/or the editor(s) disclaim responsibility for any injury to people or property resulting from any ideas, methods, instructions or products referred to in the content.