Article

An Azimuth-Continuously Controllable SAR Image Generation Algorithm Based on GAN

1
Laboratory for Microwave Spatial Intelligence and Cloud Platform, Deqing Academy of Satellite Applications, Huzhou 313200, China
2
Laboratory of Pinghu, Jiaxing 314200, China
3
Pinghu Space Awareness Laboratory Technology Co., Ltd., Jiaxing 314200, China
4
Aerospace Information Research Institute, Chinese Academy of Sciences, Beijing 100101, China
*
Author to whom correspondence should be addressed.
Remote Sens. 2025, 17(22), 3763; https://doi.org/10.3390/rs17223763
Submission received: 9 September 2025 / Revised: 7 November 2025 / Accepted: 8 November 2025 / Published: 19 November 2025
(This article belongs to the Special Issue Big Data Era: AI Technology for SAR and PolSAR Image)

Highlights

What are the main findings?
  • An enhanced GAN for SAR image generation, called Azimuth-Continuously Controllable Generative Adversarial Network (ACC-GAN), is proposed to enable precise interpolation between arbitrary azimuth angles.
  • ACC-GAN improves the flexibility on angular generation, while maintaining the physical fidelity and angular accuracy of SAR images.
What are the implications of the main findings?
  • Since the multi-view SAR images are very scarce and the azimuth characteristics are particularly important for SAR target recognition, the proposed ACC-GAN can provide flexible and accessible augmentation of multi-view SAR images.

Abstract

The performance of deep learning models largely depends on the scale and quality of training data. However, acquiring sufficient, high-quality samples for specific observation scenarios is often challenging due to high acquisition costs. Unlike optical imagery, synthetic aperture radar (SAR) target images exhibit strong nonlinear scattering variations with changing azimuth angles, making conventional data augmentation methods such as cropping or rotation ineffective. To tackle these challenges, this paper introduces an Azimuth-Continuously Controllable Generative Adversarial Network (ACC-GAN), which incorporates a continuous azimuth conditional variable to achieve precise azimuth-controllable target generation from dual-input SAR images. Our key contributions are threefold: (1) a continuous azimuth control mechanism that enables precise interpolation between arbitrary azimuth angles; (2) a dual-discriminator framework combining similarity and azimuth supervision to ensure both visual realism and angular accuracy; and (3) conditional batch normalization integrated with adaptive feature fusion to maintain scattering consistency. Experiments on the MSTAR dataset demonstrate that ACC-GAN effectively captures nonlinear azimuth-dependent transformations, generating high-quality images that improve downstream classification accuracy and validate its practical value for SAR data augmentation.

1. Introduction

Synthetic Aperture Radar (SAR) employs synthetic aperture technology in the azimuth direction and pulse compression technology in the range direction to achieve high-precision imaging of ground targets. Additionally, its emitted microwave signals can penetrate clouds and fog, granting it all-weather and round-the-clock operational capabilities [1]. Owing to these distinctive advantages, SAR image interpretation technologies have found extensive applications in natural resource surveys [2,3,4], disaster monitoring [5,6,7], and target recognition [8,9,10,11], with the latter remaining a pivotal area of research within SAR image interpretation.
Traditional approaches to SAR image recognition typically rely on manual feature extraction [12,13,14,15], a process that is not only intricate and domain-expertise-dependent but also inefficient, often yielding subpar feature quality and limiting recognition accuracy. Since 2017, deep learning algorithms have introduced a fresh paradigm in SAR image recognition research [8]. In contrast to traditional methods, deep learning algorithms automatically extract and classify features from input data during network training, eliminating the need for elaborate manual design. This facilitates the precise and efficient extraction of inherent data features, resulting in superior recognition performance [16,17,18,19]. However, deep learning-based recognition algorithms are commonly constrained by the need for extensive labeled data for neural network training [20]. The scattering characteristics of SAR targets are affected by multiple factors, including operating frequency, polarization mode, and observation angle [21], leading to training datasets that often lack parameter continuity and completeness, thereby undermining the effectiveness of model training. While electromagnetic simulation can supplement training data beyond direct observation [22], it demands substantial computational resources and power, hindering its widespread adoption.
In recent years, as artificial intelligence (AI) technologies have advanced in content generation domains such as text creation, text-to-image conversion, and text-to-video synthesis, SAR image generation has garnered growing interest. Among these, the Generative Adversarial Network (GAN) has emerged as a leading approach [8]. Its capability to learn end-to-end from real image datasets and produce high-quality images without prior target information provides GANs with a distinct edge in controllable image generation. Given that the azimuth characteristic is significant for SAR target recognition, azimuth-controllable SAR image generation technology becomes indispensable, especially when training data is limited by azimuth angles.
Recent advances in GAN-based methods have enabled the azimuth image generation through latent variable modeling (e.g., InfoGAN variants) and explicit conditional constraints (e.g., cGAN-based approaches). However, the existing methods still lack the flexible control over azimuth angles and data-efficient utilization strategies in SAR image generation.
Thus, we propose an Azimuth-Continuously Controllable Generative Adversarial Network (ACC-GAN) to enable continuous azimuth control with discrete input-pair angles, which incorporates three key modules:
(1)
A generator equipped with a triple-branch encoder that seamlessly integrates dual-input images and azimuth conditions through an adaptive feature selection mechanism;
(2)
An azimuth discriminator that enforces angular constraints on the generated images;
(3)
A similarity discriminator that ensures consistency in scattering feature distribution between generated and real images.
The remainder of this paper is organized as follows: Section 2 reviews related work on azimuth-controllable SAR image generation; Section 3 presents the proposed ACC-GAN architecture and training strategy; Section 4 describes experimental setup and results; and Section 5 concludes the paper with discussion and future work.

2. Related Work

GANs have been widely adopted for SAR image generation due to their capability to learn end-to-end from real image datasets and produce high-quality images without requiring explicit target models. GANs have found applications in diverse areas, such as multi-view SAR image generation [23], super-resolution reconstruction [24], and SAR image filtering [25]. These applications demonstrate the potential of GANs in addressing data scarcity challenges inherent to SAR imaging systems. This section reviews existing approaches for azimuth-controllable SAR image generation, organized by their underlying control mechanisms. We then provide a systematic comparison (Table 1) to clarify the positioning and advantages of ACC-GAN.

2.1. Latent Variable Modeling Approaches

The latent variable modeling approach, exemplified by InfoGAN [27], aims to embed controllable semantics, such as azimuth angle and scale, into generated images by maximizing the mutual information between generated samples and designated latent variables. Building on this, Feng et al. [28] developed an InfoGAN-based generator that links latent codes to SAR image attributes, including target rotation azimuth and scaling factor, enabling interpretable attribute control through latent vector adjustments. Liang [29] further refined the InfoGAN model by replacing cross-entropy loss with least squares loss and substituting Jensen-Shannon divergence with Pearson chi-square divergence, thereby improving controllability of the generated azimuth angles. Sang et al. [30] proposed a variational neural network framework that optimizes the mutual information between the embedding and the azimuth images, achieving a superior balance between representational capability and generalization for azimuth recognition.
Despite these advances, latent variable modeling approaches face inherent limitations. The implicit nature of latent code representation makes it difficult to achieve precise control over specific azimuth angles. Moreover, these methods treat each real image as a single training sample, which limits the efficiency of data utilization and hinders the flexibility in the data augment for better angular distribution.

2.2. Explicit Conditional Generation Approaches

The explicit conditional generation approach focuses on conditional GANs (cGANs) [31], which integrate explicit category or azimuth labels directly into the generator and discriminator to achieve precise control over the generated results. For instance, Wang et al. [32] proposed a self-attention GAN based on DCGAN, incorporating azimuth sine and cosine values as conditional labels into the generator and concatenating image and azimuth information in the discriminator. Inspired by the limitations of one-dimensional azimuth labels, Xiang et al. [33] introduced a coarse-to-fine generation strategy that first predicts a two-dimensional azimuth angle feature (AAF) map to explicitly guide the subsequent synthesis of SAR vehicle images, enhancing physical consistency and controllability over the generated viewpoint.
The cGAN-based methods offer more explicit angular control than latent variable approaches, but they still rely on single-image inputs paired with azimuth labels. Each real sample can only be used once during the training, which might result in insufficient exploitation of available data. The situation can be more severe on SAR datasets where angular sampling is typically sparse and incomplete.

2.3. Dual-Input Image Fusion Approaches

Recognizing the limitations of noise-based and single-input generation methods, Wang et al. [26] introduced a dual-input image feature fusion approach in 2022. This method synthesizes intermediate-azimuth SAR images through residual block-based fusion and employs a similarity discriminator and an azimuth discriminator to refine the generation process. This azimuth-controllable framework effectively addresses the azimuthal imbalance seen in noise-based generation methods, proving crucial for target recognition tasks that demand precise azimuthal features.
However, Wang et al.’s approach is constrained by fixed angular interval requirements between input image pairs. The method generates images strictly at the midpoint between two input angles (e.g., generating a 10° image from 0° and 20° inputs), requiring rigid triplet configurations where missing any image invalidates the training sample. This constraint becomes particularly problematic for real-world SAR datasets with sparse angular sampling, restricting operational flexibility for image augmentation.

2.4. Continuous Azimuth Control Approaches

To systematically position our work within the existing literature and clarify the fundamental differences in methodology, Table 1 provides a comprehensive comparison of representative azimuth-controllable SAR generation methods across key dimensions including generator architecture, angular control mechanisms and flexibility.
As illustrated in Table 1, existing methods face fundamental challenges that limit their practical applicability: (1) inefficient data utilization—infoGAN and cGAN variants can only use each real sample once during training; (2) limited angular flexibility—dual-input methods require fixed angular configurations and fail when training data has insufficient angular diversity. These limitations are particularly acute for SAR applications where azimuth sampling is inherently sparse and obtaining complete angular coverage is prohibitively expensive or operationally infeasible.
The proposed ACC-GAN addresses these challenges through a novel method for constructing training samples. By enabling arbitrary angular pairing combined with continuous interpolation control (α ∈ [0, 1]), ACC-GAN can generate arbitrary azimuth of training samples from the same limited dataset, improving both data utilization efficiency and angular generation flexibility. This flexible training scheme, combined with the triple-branch encoder architecture and dual-discriminator framework, enables ACC-GAN to achieve superior performance in azimuth-controllable SAR image generation while maintaining physical fidelity and angular accuracy.

3. Materials and Methods

3.1. Dataset

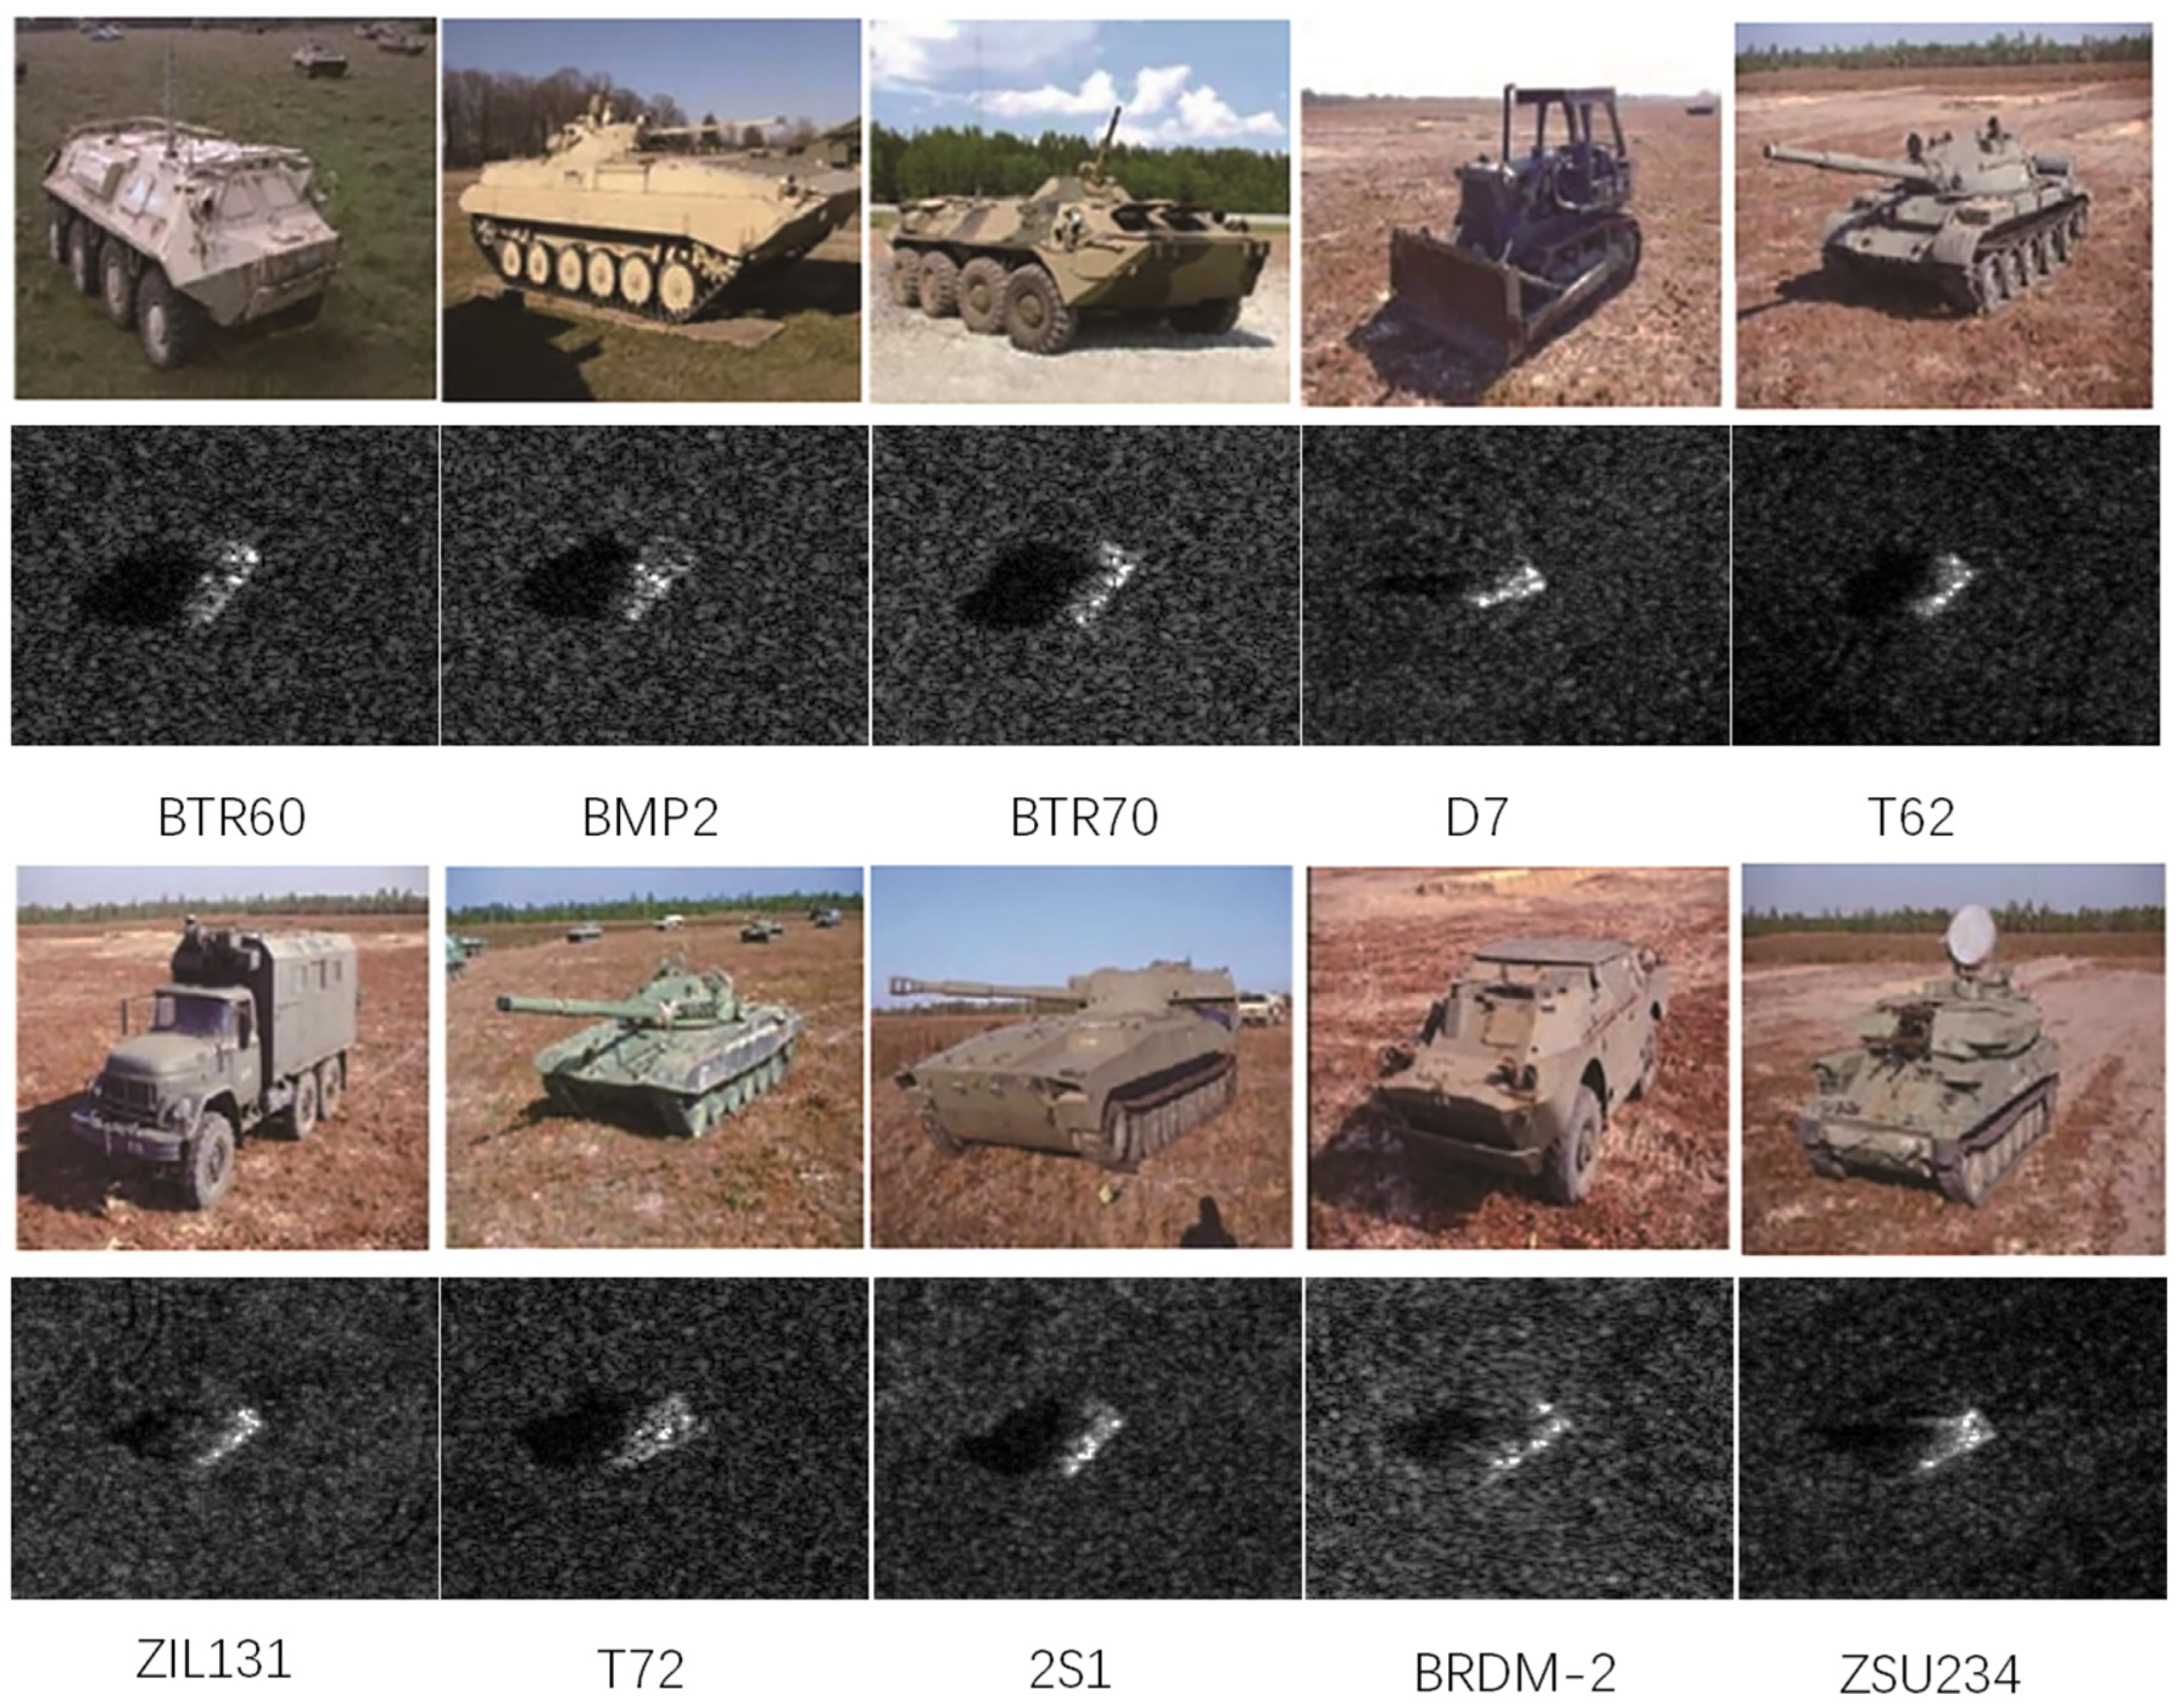
The experimental dataset employed to evaluate the proposed model is derived from the MSTAR program [34], jointly released by the Defense Advanced Research Projects Agency (DARPA, Arlington, VA, USA) and the Air Force Research Laboratory (AFRL, Dayton, OH, USA). This dataset was collected using the STARLOS sensor platform developed by Sandia National Laboratories (Albuquerque, NM, USA). Widely recognized as a benchmark for evaluating SAR Automatic Target Recognition (SAR ATR) performance, it comprises a significant number of SAR images covering 10 distinct classes of ground targets (Figure 1). Within each class, targets also exhibit variations across different models. Although targets of the same class but different models may differ in configuration, their overall scattering characteristics remain relatively consistent. These images are X-band SAR images with a resolution of 1 foot (approximately 0.3 m) and full azimuth coverage spanning 0° to 360°. They were captured under a variety of operating conditions, including different azimuth, depression angles, and serial numbers.

3.2. Methodology

To generate SAR images with specified azimuth, the ACC-GAN model adopts an adversarial training framework, pitting the generator against dual discriminators in a competitive process that progressively aligns the distribution of generated images with that of real images. The key innovation of ACC-GAN lies in its incorporation of an azimuth control variable and a dual discriminator architecture. The generator takes two SAR images captured from different azimuth as inputs and utilizes the azimuth control variable to guide the extraction, fusion, and reconstruction of features for the desired target azimuth image. The dual discriminators comprise a similarity discriminator and an azimuth discriminator: the former assesses the realism of the generated images, while the latter specifically enforces azimuth accuracy. During training, the generator aims to produce SAR images that are both visually realistic and precisely aligned with the target azimuth, while the two discriminators evaluate and constrain the generated results from the perspectives of image quality and azimuth accuracy, respectively. This multi-objective adversarial training mechanism ensures that, upon reaching the Nash equilibrium, the model can generate high-quality SAR target images with controllable azimuth.

3.2.1. Generator Design

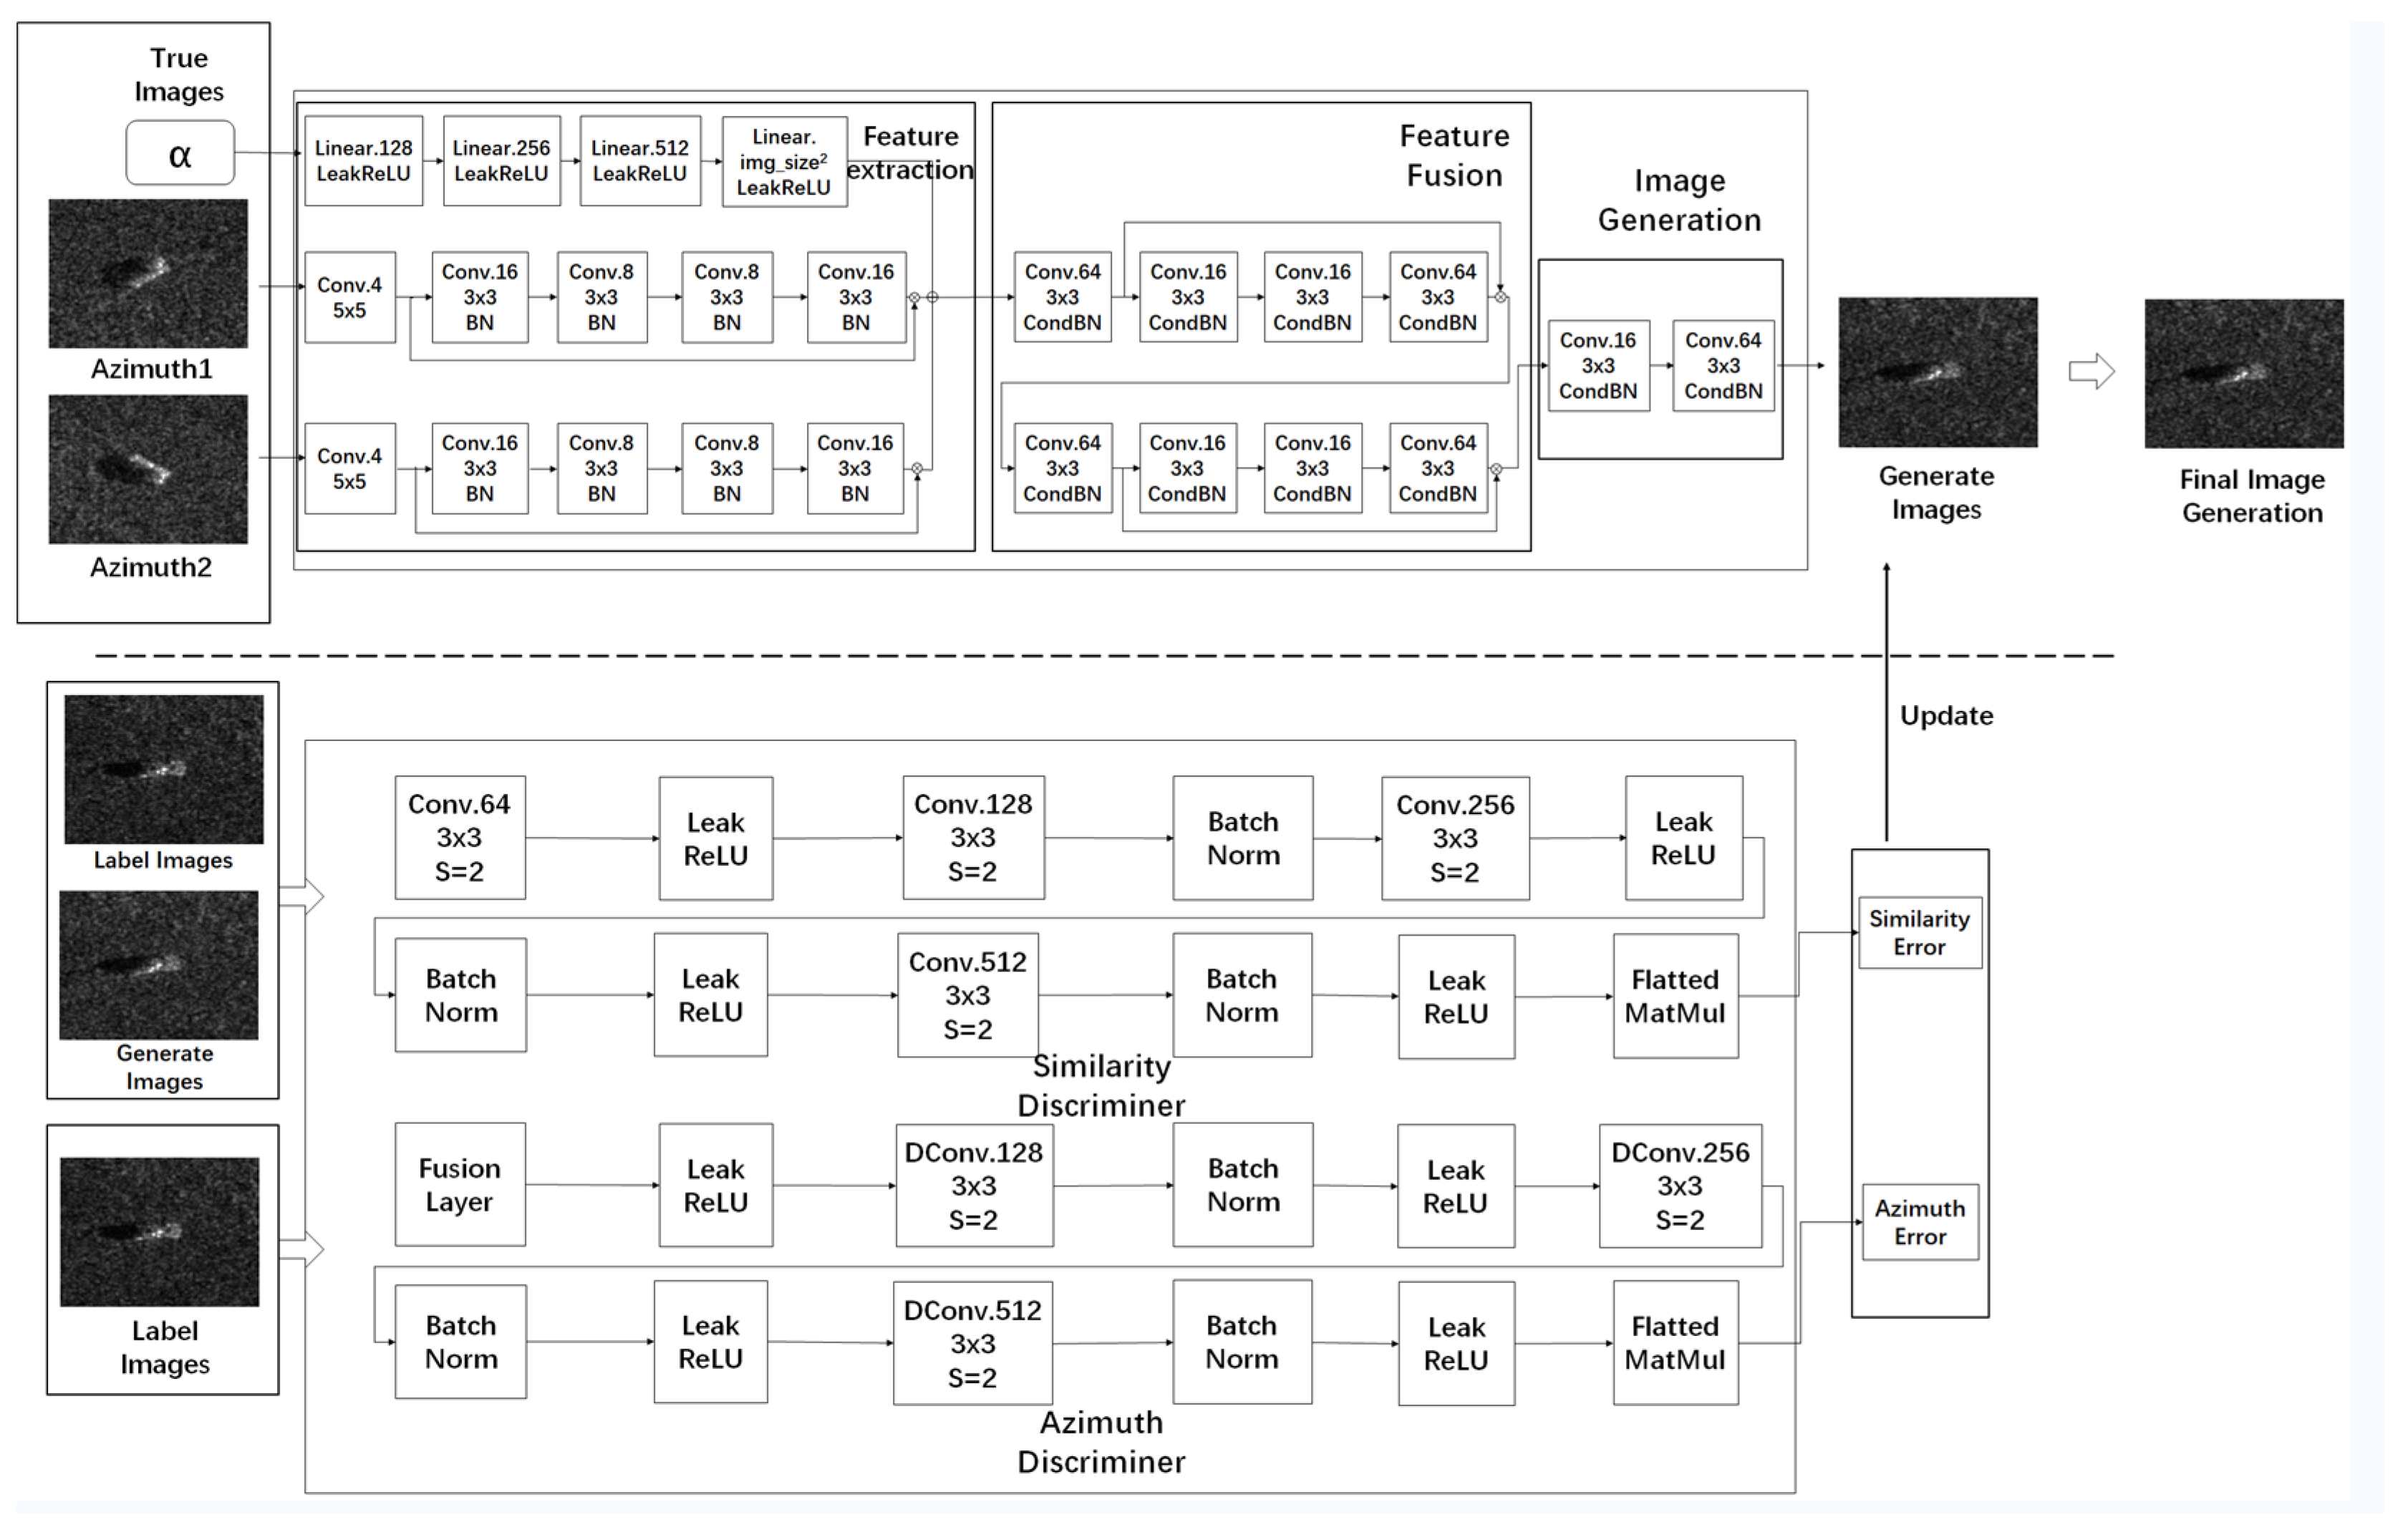
The ACC-GAN generator enables precise azimuth interpolation through control variable α ∈ [0, 1]. Given two SAR images (I1, I2) with azimuths (θ1, θ2), it generates a target image at θg = θ1 + (θ2 − θ1) * α. The generator employs a three-stage pipeline comprising feature extraction, feature fusion, and image reconstruction (see Figure 2).
In the feature extraction stage, parallel modules process both input images and encode the control variable. Specifically, modules Ipi1(·) and Ipi2(·) extract deep semantic features from I1 and I2 through multi-layer convolutions, while Ipi3(·) transforms the scalar α into high-dimensional condition C, as expressed in Equations (1)–(3). Residual connections are incorporated throughout to preserve critical information and mitigate gradient vanishing.
The feature fusion stage performs adaptive interpolation of the extracted features through module Bif (·), which combines Ipi1(·), Ipi2(·), and C to produce the intermediate representation  R i n t e r p  (Equation (4)). To ensure azimuth-aware feature generation, conditional batch normalization (CBN) is integrated into this stage. Unlike standard batch normalization, CBN modulates the normalization parameters γ(α) and β(α) based on the control variable, dynamically adapting the feature transformation to match the target azimuth (Equation (5)). This mechanism enables precise mapping between α and the generated image characteristics.
The image reconstruction stage employs mapping block  B m ( · )  to decode the fused features  R i n t e r p  into the final SAR image  I g  at the desired azimuth (Equation (6)). The complete formulation is:
I p i 1 = B p i 1 ( I 1 )
I p i 2 = B p i 2 ( I 2 )
C = B p i 3 ( α )
R i n t e r p = B i f ( I p i 1 ,   I p i 2 , C )
x ^ = γ α · x μ B σ B 2 + ϵ + β ( α )
I g = B m ( R i n t e r p )
The triple-branch architecture is motivated by the fundamental challenge of azimuth-controllable generation: the need to disentangle image content from azimuth information while enabling precise interpolation control. By introducing a dedicated third branch for encoding α into high-dimensional conditional features C, we create an explicit control pathway that directly modulates the feature fusion process. This design philosophy aligns with conditional generation principles where separating content and condition encoding lead to more disentangled representations. This separation enables the conditional batch normalization layers to effectively modulate feature statistics based on the target azimuth, ensuring that the generated scattering patterns smoothly transition between the two reference views.

3.2.2. Discriminator Design

To address the challenge of generating high-quality, azimuth-accurate SAR images, we introduce two complementary discriminators that provide targeted optimization guidance. The similarity discriminator  D S i m  adopts a PatchGAN architecture with strided convolutions, evaluating local realism across multiple image patches. This design effectively captures the texture details and spatial characteristic of SAR imagery. To ensure stable training, a gradient penalty term with λ_gp = 10 enforces the 1-Lipschitz constraint required by the WGAN-GP framework.
The azimuth discriminator  D A z  focuses on accurate orientation control. It incorporates deformable convolutions to capture directional features and predicts azimuth in (cos θ, sin θ) representation, which naturally handles angle periodicity and avoids discontinuities at 0°/360°. The circular loss function L = 1 − cos_sim, where cos_sim = (cos θpred × cos θreal + sin θpred × sin θreal), provides smooth gradients throughout the angular space, enabling the generator to progressively refine its azimuth control capabilities.
The complete training objective combines adversarial and azimuth losses as follows:
L D S i m = E I r p d a t a [ D S i m ( I r ) ] + E I 1 , I 2 p d a t a [ D S i m ( G ( I 1 , I 2 , α ) ) ] + λ g p E I ^ [ ( I ^ D S i m ( I ^ ) 2 1 ) 2 ] , L D A z = E I r p d a t a ( 1 D A z ( I r ) θ r ) , L G = E I 1 , I 2 p d a t a [ D S i m ( G ( I 1 , I 2 , α ) ) ] + E I 1 , I 2 p d a t a ( 1 D A z ( G ( I 1 , I 2 , α ) ) θ r )
In the loss functions defined above,  D S i m  denotes the similarity discriminator following the PatchGAN architecture, and  D A z  represents the azimuth discriminator that predicts the target orientation in  ( c o s θ ,   s i n θ )  form.  G ( I 1 , I 2 , α )  generates an azimuth-controlled synthetic image conditioned by the input pair  ( I 1 , I 2 )  and control variable  α , corresponding to the true image  I r  at the target azimuth. The gradient penalty term  E I ^ ( I ^ D S i m ( I ^ ) 2 1 ) 2  enforces the Lipschitz constraint in the WGAN-GP framework, where λgp is set to 10 following standard practice.  I ^  represents a randomly interpolated sample between real and generated images, which can be expressed as:
I ^ = ϵ · I r + 1 ϵ · G I 1 , I 2 , α , ϵ ~ U [ 0,1 ]
Through the collaborative efforts of these two discriminators, the model attains dual optimization goals during training: the similarity discriminator enhances the realism of generated images, while the azimuth discriminator ensures precise control over the azimuth of these images. This design effectively tackles the issue of subpar image generation quality and achieves high-precision azimuth control. Consequently, the ACC-GAN offers a more stable training process for SAR image generation compared to other GAN architectures and can produce SAR target images with more accurate azimuth.

3.3. Data Preparation and Experimental Setting

The experiments were conducted on the MSTAR dataset, using ten target categories under two depression angles (15° and 17°) and the 30 depression angles with three target categories. The detailed configuration of the training and testing datasets is presented in Table 2.
To prevent view leakage, all models were trained exclusively on the 17° images and evaluated on the 15° or 30° images, ensuring complete separation in depression angle and azimuth sampling. Therefore, the training and testing sets share the same categories but contain no overlapping viewing conditions.
The network was trained using the Adam optimizer with β1 = 0.5, β2 = 0.999 and an initial learning rate of 0.0002, decayed via cosine annealing to a minimum of 1 × 10⁻⁶. To maintain the adversarial equilibrium between the angle control generator and the similarity discriminator, the discriminator was updated ten times during each generator iteration. This strategy stabilizes the Wasserstein distance estimation while preventing discriminator dominance that could hinder generator convergence.

3.4. Evaluation Indices

To quantitatively evaluate the quality of the generated images, we utilize five metrics: Mean Squared Error (MSE), Structural Similarity Index Measure (SSIM), Multi-Scale Structural Similarity Index Measure (MS-SSIM), Fréchet Inception Distance (FID) and Learned Perceptual Image Patch Similarity (LPIPS).
MSE quantifies the pixel-value differences between the real SAR image and the generated SAR image, representing the global error of the image. The formula for calculating MSE is as follows:
M S E = 1 m × n i = 1 m j = 1 n ( x i , j y ( i , j ) ) 2
where  y  represents the generated SAR image, while x denotes the real image with the azimuth closest to that of the generated image. m and n are the height and width of the SAR image, respectively.
SSIM places a stronger emphasis on perceptual image quality. It assesses similarity based on luminance, contrast, and structure, thereby capturing the overall structural resemblance of the entire image. The SSIM can be expressed as:
S S I M = l ( x , y ) 2 α c ( x , y ) 2 β s ( x , y ) 2 γ
l x , y = 2 μ x μ y + c 1 μ x 2 + μ y 2 + c 1
c x , y = 2 σ x y + c 2 σ x 2 + σ y 2 + c 2
s x , y = σ x y + c 3 σ x + σ y + c 3
where l, c, and s represent the luminance similarity, contrast similarity, and structural similarity between the two images, respectively; μ and σ denote the mean and standard deviation of the images; and c1, c2, and c3 are positive constants related to the dynamic range of pixel values. When α = β = γ = 1 and c3 = c2/2, the SSIM formula can be simplified as:
S S I M = ( 2 μ x μ y + c 1 ) ( 2 σ x y + c 2 ) ( μ x 2 + μ y 2 + c 1 ) ( σ x 2 + σ y 2 + c 2 )
MS-SSIM is a multiscale extension of SSIM. It computes SSIM on progressively down-sampled versions of the image and combines these values using a weighted approach. This allows it to capture structural features at different scales, offering a more comprehensive assessment of perceptual quality across multiple resolutions. The MS-SSIM formula is given by:
M S S S I M = l x , y α M j = 1 M [ c x , y ] β j [ s x , y ] γ j
j = 1 M γ j = 1
where M denotes the number of image scales. To streamline parameter selection, it is standard practice to set all αj = βj = γj and standardize the cross-scale settings, ensuring comparability across different parameter configurations. In this study, the parameters for MS-SSIM are configured based on the work of Wang et al. [35].
FID is widely adopted to quantitatively evaluate the similarity between generated and real images in the feature space (projected using a pre-trained Inception V3 model). It measures the distance between two multivariate Gaussian distributions fitted to the deep features extracted from a pretrained Inception network. A lower FID value indicates that the generated images are more similar to real ones in terms of statistical distribution, thus implying higher generation quality. The FID can be expressed as:
F I D = μ r μ g 2 2 + T r Σ r + Σ g 2 ( Σ r Σ g ) 1 / 2
where  μ r Σ r  denote the mean and covariance of the real image features,  μ g Σ g  denote the mean and covariance of the generated image features, and  T r ( )  represents the trace of a matrix.
LPIPS metric evaluates perceptual similarity between two images based on deep feature representations. It computes the weighted distance between the normalized features extracted from multiple layers of a pretrained network (e.g., VGG or AlexNet). Unlike pixel-wise measures such as PSNR or SSIM, LPIPS better correlates with human perceptual judgments by capturing structural and textural differences.
L P I P S ( x , y ) = l 1 H l W l h , w w l ϕ l ( x ) h , w ϕ l ( y ) h , w 2 2
where x and y are the two images being compared,  ϕ l ( )  denotes the feature maps extracted from the l-th layer of the network,  H l  and  W l  are the height and width of the feature map at layer  l w l  represents the learned channel-wise weights, and   indicates element-wise multiplication.
For all these metrics, a lower value of MSE, FID, and LPIPS, and a higher value of SSIM and MS-SSIM indicate superior generation performance, and to comprehensively assess the perceptual and structural fidelity of the generated SAR images, each metric is computed both within the central 50% region  [ W / 4 : 3 W / 4 , H / 4 : 3 H / 4 ]  and over the entire image. The local (central) evaluation emphasizes the target region by reducing the influence of background clutter, while the global evaluation reflects the overall visual and statistical consistency between the generated and reference images.

4. Results and Discussion

The proposed model requires 0.76 GFLOPs and 2.35 million parameters. During inference on an NVIDIA RTX 4070 Ti S GPU, it processes each image in 9.5 ms (about 105 FPS) and uses approximately 520 MB of GPU memory.

4.1. Ablation Study

We further explore the structural effectiveness of the proposed framework by conducting ablation studies on two key components: the Conditional Batch Normalization (CBN) in the generator and the Deformable Convolution (DC) in the azimuth discriminator. We quantitatively assess the individual contribution of each component through ablation studies. Specifically, we selectively remove each component and evaluate the generated images of 15° depression using SSIM, FID, and LPIPS metrics, which capture perceptual quality and distributional similarity. Specifically, we compare the following methods.
Baseline: Full model with both CBN and DC.
Method1: CBN blocks removed and replaced with Batch Normalization block.
Method2: DC blocks removed and replaced with Conv block.
Method3: Both CBN and DC blocks removed and replaced with Batch Normalization and Conv block.
As shown in Table 3, across the evaluated azimuth intervals, the full model (Baseline), which incorporates both CBN and DC, consistently achieves the best performance on all metrics, as detailed in the table above. This demonstrates the complementary benefits and individual necessity of each component within the proposed framework.
When CBN is removed (Method1), leaving only DC, a significant drop in SSIM is observed (from 0.6575 to 0.5412). This indicates a substantial loss of structural consistency and semantic control, underscoring that CBN is critical for modulating feature distributions in an angle-aware manner, ensuring that the generated imagery accurately reflects the desired azimuth conditioning.
When DC is removed (Method2), leaving CBN intact, the decline in FID is especially notable (FID rises from 0.0697 to 0.1023). This suggests that while high-level angle conditioning is preserved, the network loses its ability to model geometric variations and fine-grained spatial adaptations, which are essential for realistic and perceptually coherent image synthesis under varying viewpoints.
The worst performance overall is observed in Method3, where both CBN and DC are ablated. Here, SSIM reaches its lowest value (0.4858), while FID and LPIPS are at their worst (20.496 and 0.2259, respectively). This confirms that the generator loses both structural integrity and perceptual quality, effectively failing to preserve either angle-specific attributes or geometric realism.
These results validate the necessity of incorporating both components in the network: CBN enables precise feature-level conditioning based on azimuth input, while DC provides essential spatial adaptability to geometric transformations. Together, they facilitate high-quality, controllable SAR image generation that is both semantically consistent and geometrically faithful.

4.2. Evaluation of the Generated SAR Images

4.2.1. Model Performance Analysis

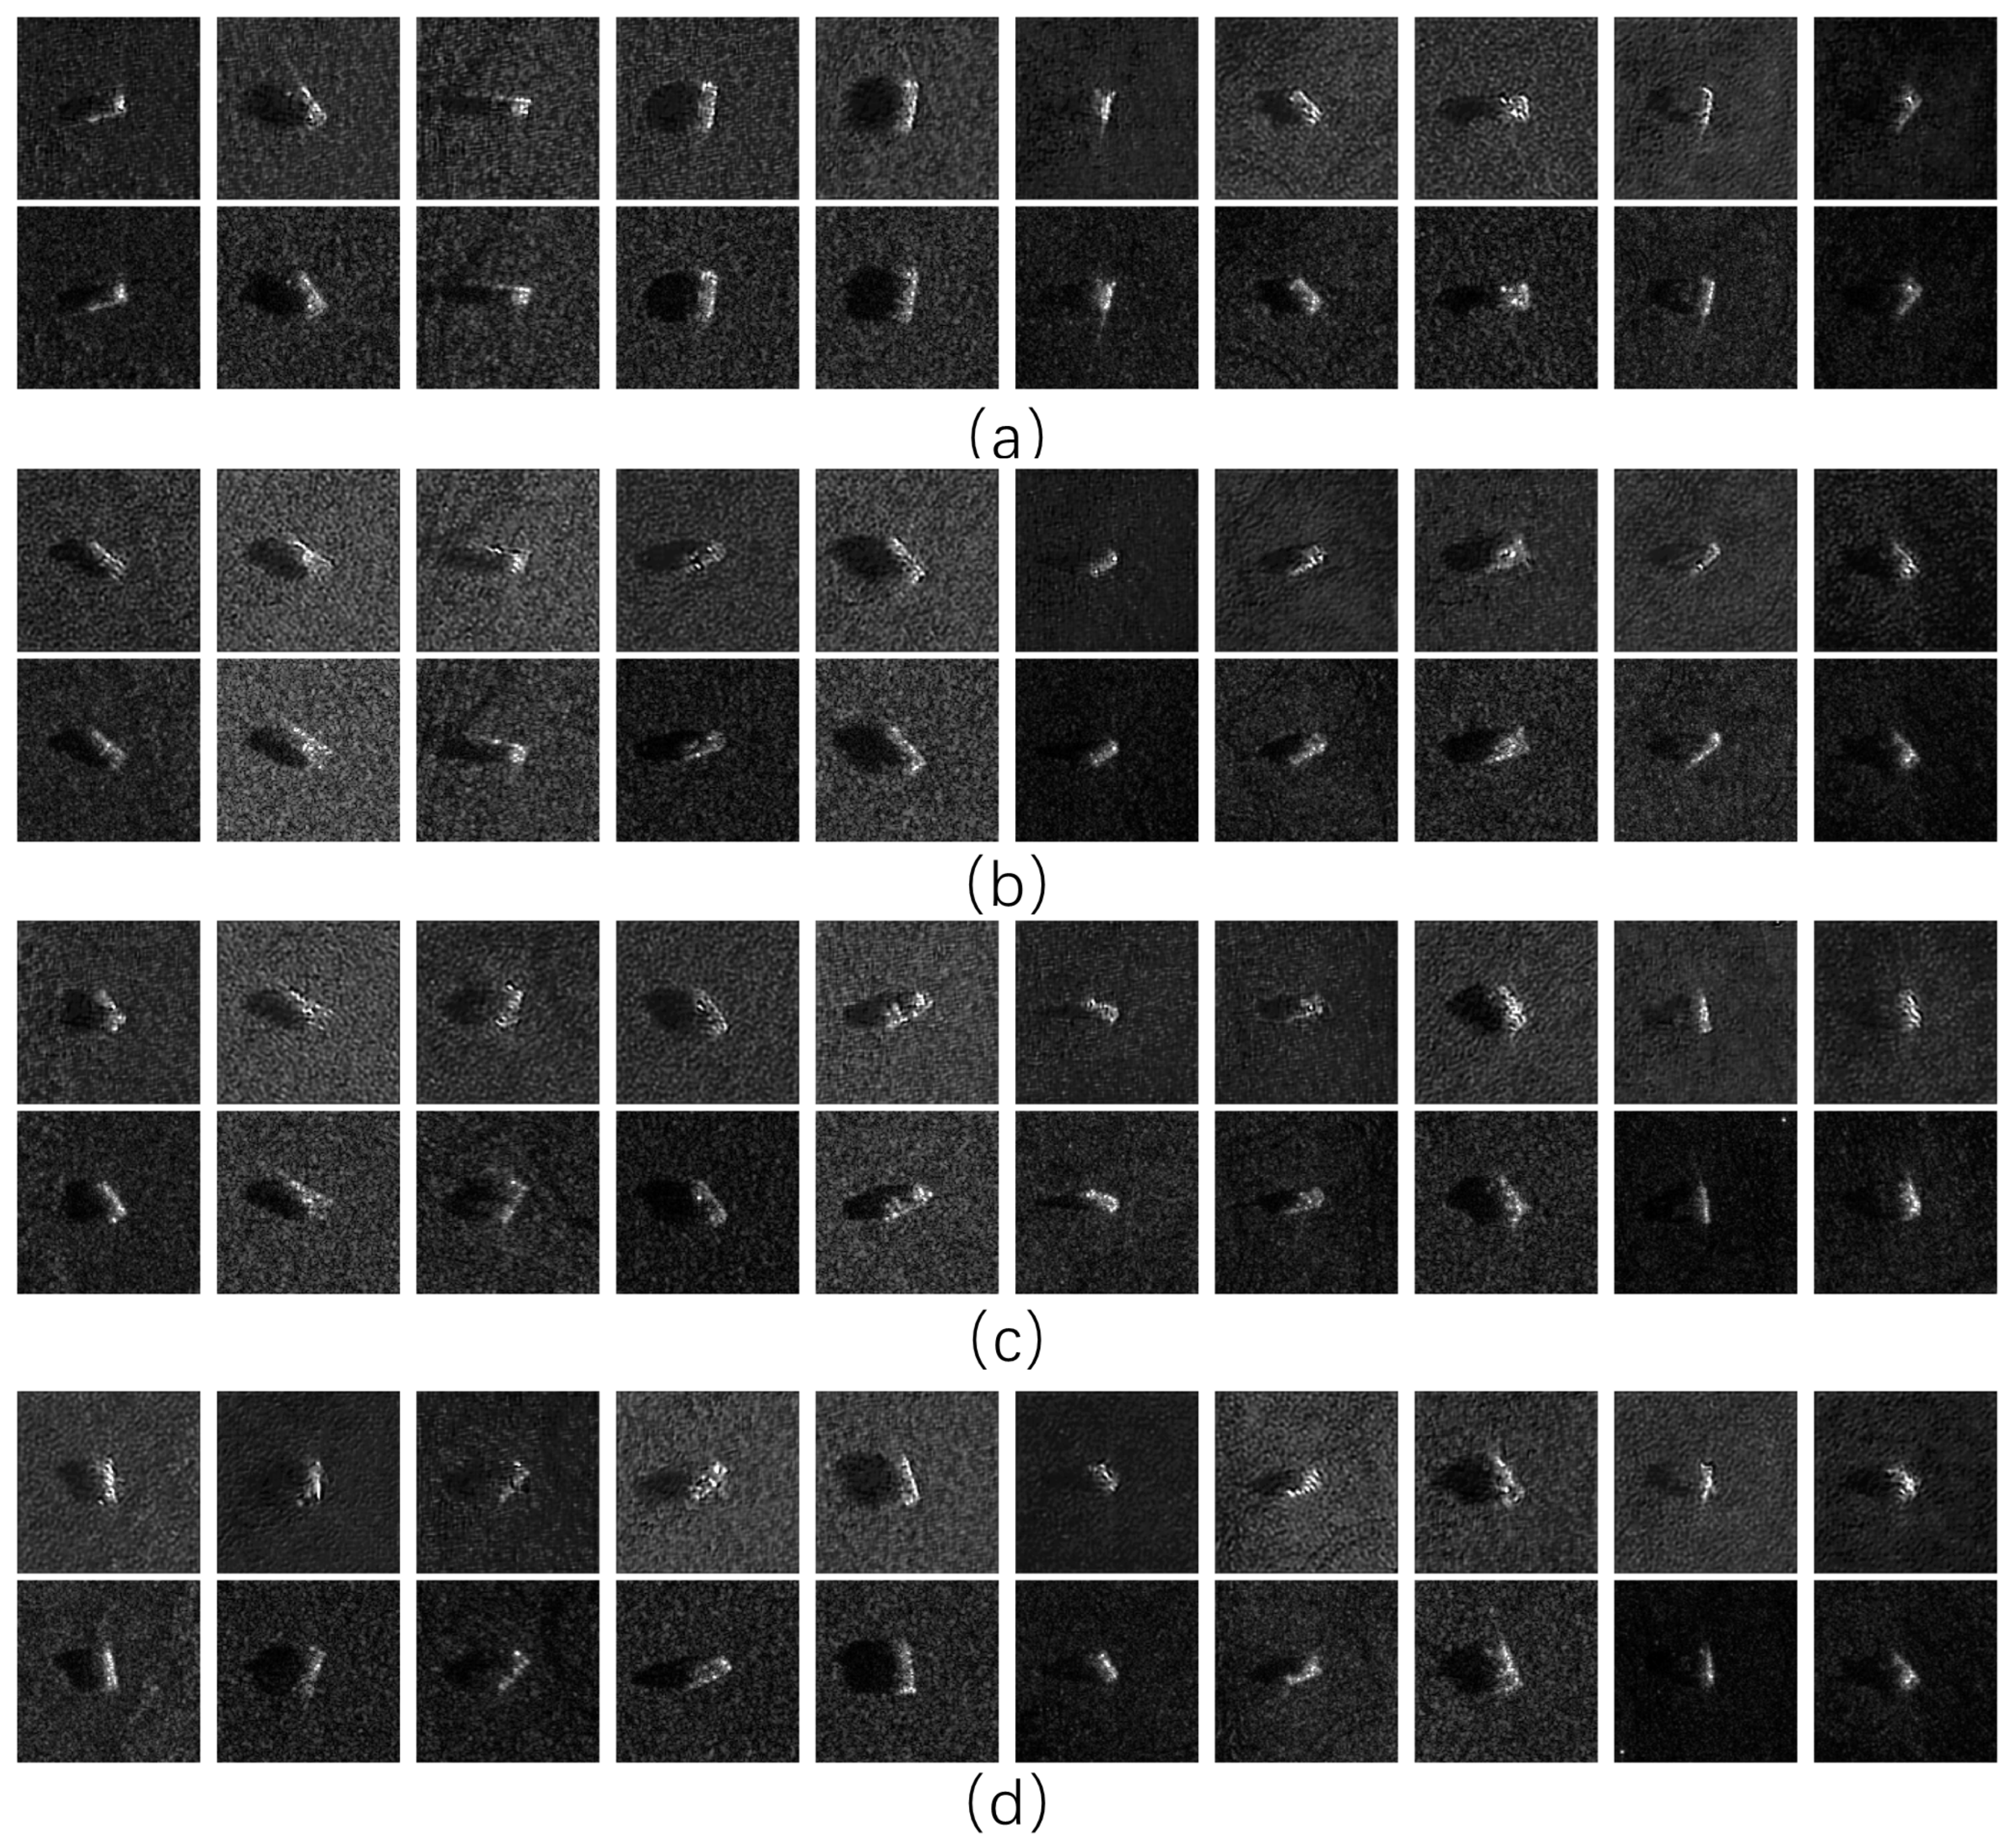
To demonstrate the SAR image generation performance of the proposed algorithm, Figure 3 presents a comparison between generated and real synthetic aperture radar images. The generative model was trained on MSTAR dataset with 17° depression angle and maximum azimuth angle separation of 50° between input image pairs. Subsequently, the model was applied to input image pairs at a 15° depression angle with four different azimuth separations (5°, 10°, 20°, 50°), using α = 0.5.
Visual inspection reveals that when the azimuth interval between input image pairs is small (less than 20°), the generated images accurately preserve key features such as vehicle scattering centers, azimuthal orientation, background structures, and shadow patterns. As the angular interval increases to 20°, the generated images maintain correct azimuthal orientation but start to exhibit positional deviations in scattering centers relative to the ground truth. When the angular separation widens to 50°, notable discrepancies arise in azimuthal orientation, geometric features, and background details. These visual comparisons confirm that the perceptual quality of ACC-GAN outputs is inversely related to the azimuth interval of input pairs.
Table 4 presents quantitative evaluation results for the generated full-image and center-image when applying the model to images with a 15° depression angle. The results reveal that the proposed model maintains stable generation performance when the azimuth separation between input pairs is relatively small, while a gradual performance degradation occurs as the interval increases. Specifically, when the azimuth interval is within 5–10°, the generated images exhibit high similarity to real SAR targets, achieving SSIM values of 0.66~0.69 and MS-SSIM exceeding 0.90, with low mean squared errors (MSE of 0.0055~0.0059) and limited azimuth estimation errors (1.8°~2.4°). These results indicate that the generated images accurately preserve both local and global scattering characteristics.
When the azimuth interval expands to 20°, a moderate reduction in structural similarity can be observed (SSIM = 0.63, MS-SSIM = 0.88), yet the generation quality remains acceptable, with preserved geometric consistency and controllable angular deviations (angle error = 3.2°). In contrast, a notable deterioration is observed at 50°, where the azimuth error rises to approximately 5.2°, accompanied by a clear decline in similarity metrics (SSIM < 0.60, MS-SSIM = 0.84) and an increase in FID (13.7), indicating the increased difficulty of reconstructing accurate scattering structures under large viewpoint differences.
It is also noteworthy that the Center Image results generally outperform the Full Image counterparts in terms of SSIM (up to 0.71 vs. 0.69 at 5°) and LPIPS (0.0267 vs. 0.0621), suggesting that focusing on the central region effectively suppresses peripheral distortions and stabilizes the model’s spatial representation, despite slightly higher FID values at larger azimuth intervals.
Overall, these findings demonstrate that ACC-GAN can reliably synthesize high-fidelity SAR images and maintain effective azimuth control when the angular separation between input views is below 20°, ensuring both perceptual similarity and structural coherence across diverse observation geometries.
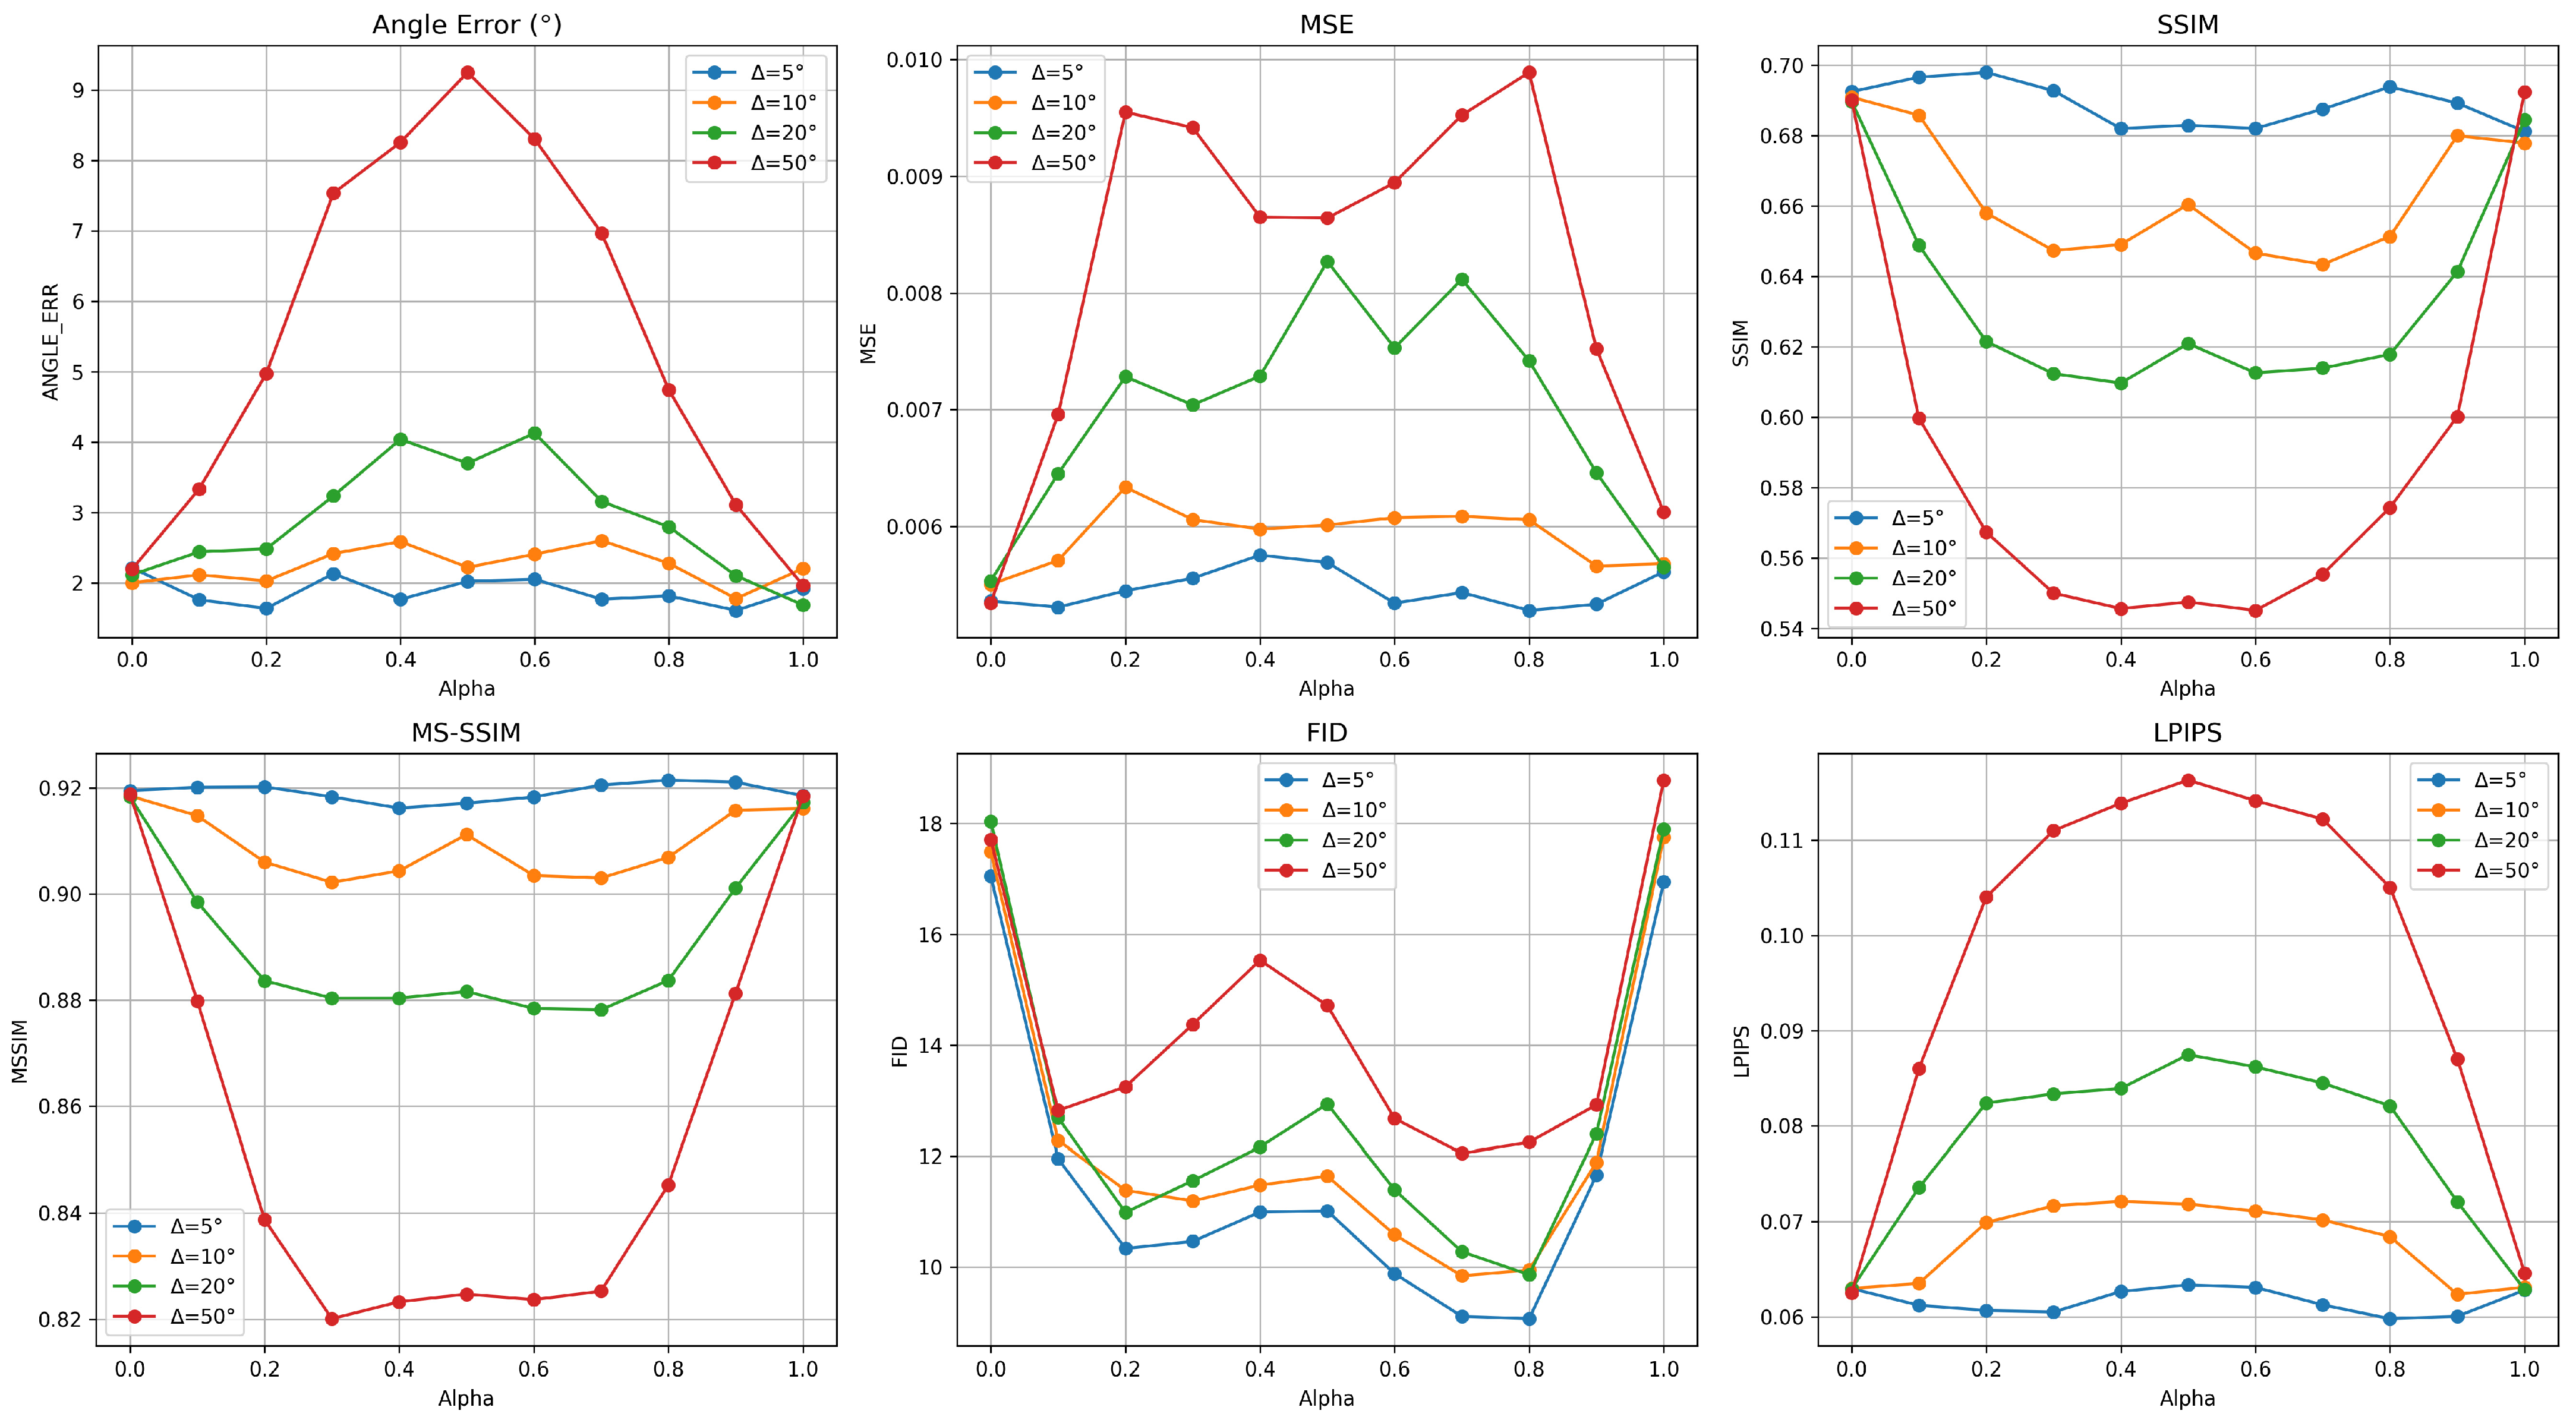
Figure 4 elucidates the feature fusion mechanism regulated by α across varying azimuth intervals on full image. When α approaches 0 or 1, the generated images predominantly emphasize features from the adjacent azimuth input, resulting in optimal quality metrics across all dimensions—minimal angle error, lowest MSE and perceptual distortion (FID, LPIPS), and highest structural similarity (SSIM, MS-SSIM). This boundary behavior demonstrates that single-view dominance effectively bypasses interpolation challenges. Conversely, when α ≈ 0.5, equal-weight fusion from both inputs leads to maximum quality degradation, as conflicting geometric and appearance features generate structural inconsistencies and perceptual artifacts. The fusion quality at intermediate α values is primarily dictated by the feature disparity between input images. For small azimuth intervals (Δ ≤ 20°), the metrics remain relatively stable across the entire α range, indicating manageable feature compatibility. However, large azimuth intervals (Δ > 20°) lead to severe degradation at mid-range α values, with dramatic increases in angle error, MSE, FID, and LPIPS, alongside substantial drops in SSIM and MS-SSIM. This phenomenon reveals that significant geometric and appearance disparities exceed the model’s generation capabilities, causing the fusion process to generate images that fall outside the learned feature manifold.
To further validate the cross-depression angle generalization capability of our ACC-GAN model, we conducted an additional 17° → 30° experiment beyond the standard 17° → 15° experiment.
As summarized in Table 5, the model maintains comparable generation performance across the two depression angles. Specifically, the MSE and LPIPS show only marginal differences, while the SSIM and MS-SSIM remain above 0.63 and 0.86, respectively. Although the FID score slightly increases at 30°, indicating a modest distributional shift, the overall reconstruction fidelity does not degrade noticeably. These results suggest that the learned generator exhibits robust generalization to moderate variations in depression angle, implying that the network captures intrinsic scattering representations rather than overfitting to a single imaging geometry.

4.2.2. Quantitative Result for Different Generation Methods

To comprehensively evaluate the effectiveness of our ACC-GAN framework, we compare it against two representative SAR image generation methods: (1) cGAN, a classic conditional generative adversarial network that conditions the generator on auxiliary information, and (2) ACGAN [33], a recent work specifically designed for multi-view SAR image synthesis.
For fair comparison, all methods were trained on the same MSTAR 17° dataset with identical preprocessing. cGAN was conditioned on azimuth angles through concatenation of angle embeddings with generator/discriminator inputs, while ACGAN method follows their original configuration. Our ACC-GAN was trained with a maximum azimuth interval of 50°. All models were evaluated on the same MSTAR 15° dataset.
Table 6 presents quantitative comparisons with conditional GAN baselines on the MSTAR 17° dataset. ACC-GAN demonstrates substantial and consistent improvements across all evaluation metrics. In terms of perceptual quality, ACC-GAN achieves a 50.0% reduction in FID (11.63 vs. 23.27) and 33.6% improvement in LPIPS (0.0782 vs. 0.1177) compared to ACGAN, indicating significantly more realistic and visually coherent SAR imagery. The advantage over the basic cGAN baseline is even more pronounced, with FID reduced by 75.8% and LPIPS improved by 65.1%, highlighting the critical importance of advanced conditional control mechanisms for multi-view SAR synthesis.
Regarding structural fidelity, ACC-GAN outperforms both baselines in preserving target geometry across viewpoint changes. The 15.7% improvement in MS-SSIM (0.8993 vs. 0.7772) over ACGAN is particularly noteworthy, as this multi-scale metric better captures SAR’s complex scattering structures while being robust to speckle noise. The high MS-SSIM score confirms that ACC-GAN effectively maintains structural consistency at multiple scales—a critical requirement for downstream SAR interpretation tasks. The 10.7% reduction in MSE further validates improved pixel-level accuracy, demonstrating that our dual-discriminator architecture and encoder–decoder fusion mechanism successfully balance both global realism and fine-grained detail preservation.
4.3. Classification Performance of the Generated SAR Images

This study demonstrates the practical value of generated images through vehicle classification experiments that evaluate how incorporating different proportions of generated images affects classification accuracy. The assessment utilizes three representative deep learning architectures: Convolutional Neural Networks (CNN) to analyze spatial local pattern fitting, Vision Transformers (ViT) to test global dependency modeling and long-range relationship capture, and Residual Networks (ResNet-18) to assess deep feature fusion effects. Together, these models cover the primary paradigms of convolutional neural networks, pure transformer architectures, and residual convolutional networks, representing mainstream approaches in visual task modeling.
Table 7 summarizes the classification performance of CNN, ViT, and ResNet trained on 15° depression angle MSTAR data (generation by 17° depression angle trained model with input image pairs spaced less than 50°) under different training data compositions. In the first four cases (Method 1–Method 4), only real images were used for training. As the proportion of training data increased, all three models showed a steady improvement in test accuracy. CNN reached 85.2% with just 25% of the data and climbed to 96.8% with full data. ViT exhibited a stronger dependency on data volume, improving from 65.1% to 93.3%, while ResNet maintained high accuracy across all conditions, rising from 93.4% to 98.8%.
In the subsequent three cases (Method 5–Method 7), 25% of real images were supplemented with varying amounts of generated images. The results indicate that generated images can effectively compensate for limited real data. CNN and ResNet benefited the most, with CNN achieving 96.7% and ResNet consistently around 97.5–97.7%, nearly matching the performance obtained with the full real dataset. ViT also improved, reaching 88.6%, yet it remained slightly below the performance with all real images, highlighting its higher sensitivity to the authenticity of training samples.
Overall, the inclusion of generated images provides a practical way to mitigate the shortage of real data, particularly for small-sample scenarios in MSTAR datasets. The influence of generated data varies with model architecture: while CNN and ResNet can leverage them efficiently, Transformer-based models like ViT still benefit from a larger proportion of real images. These observations suggest that a flexible combination of real and generated images could balance data efficiency and classification performance in practical applications.
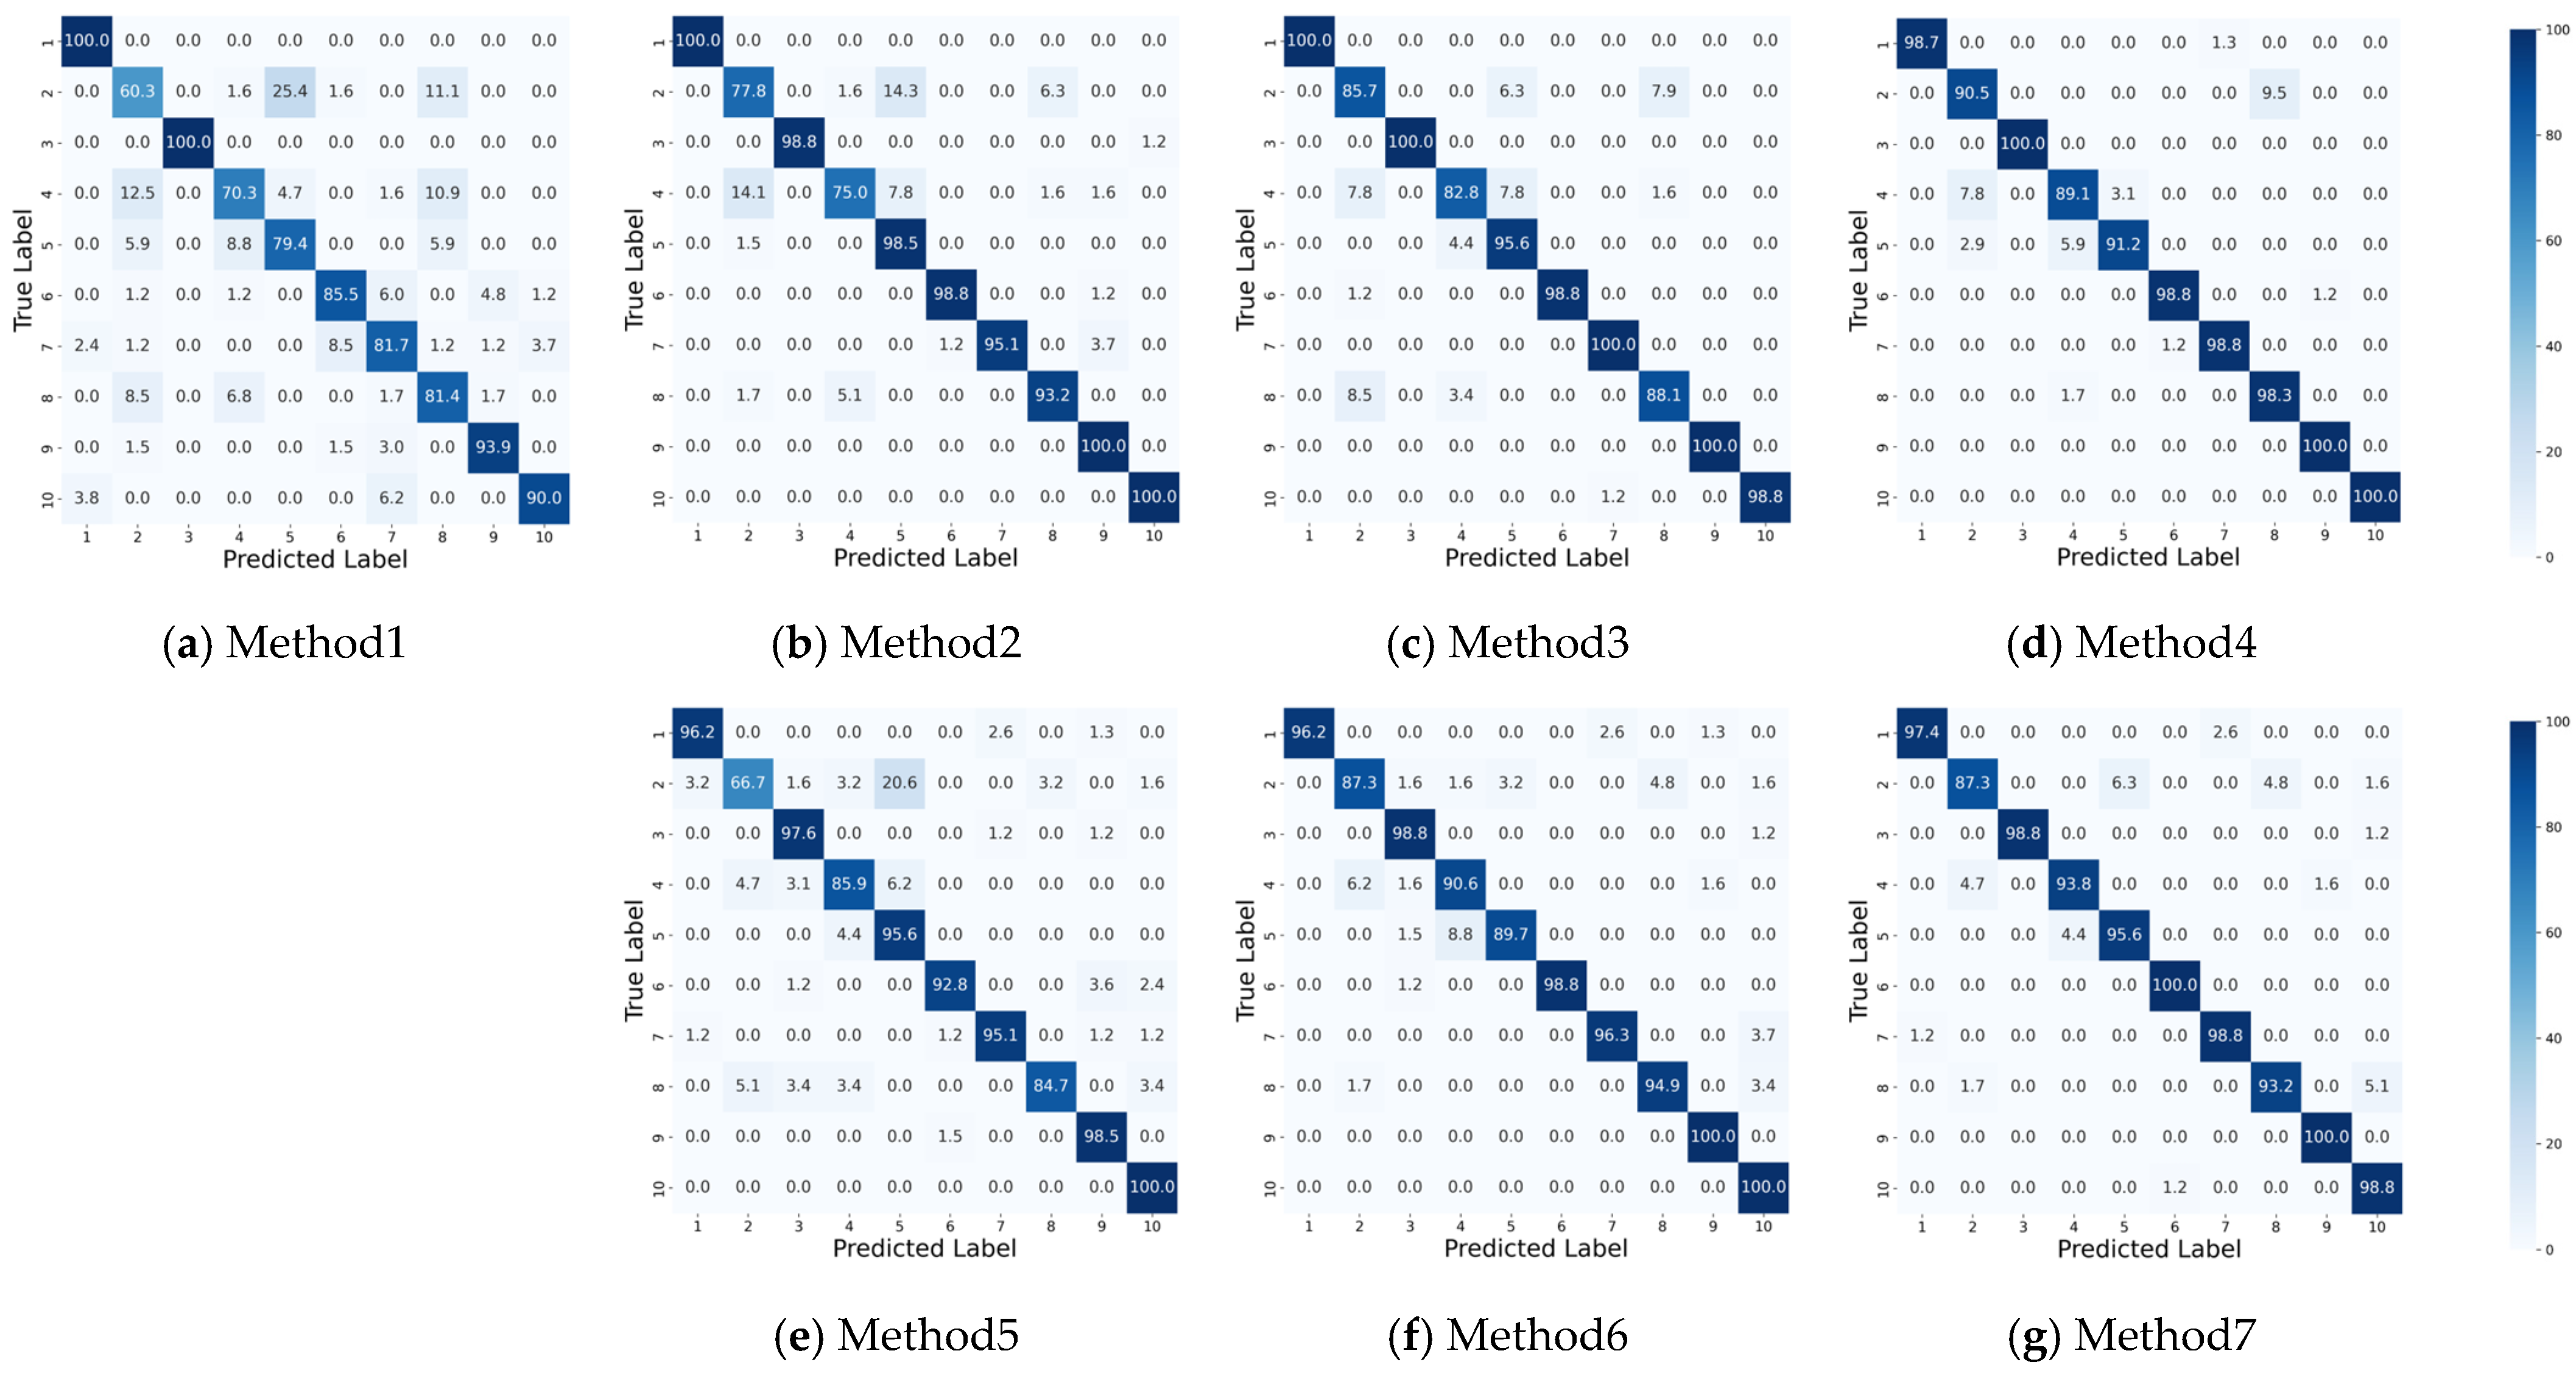
The confusion matrices reveal distinct patterns in classification performance across different training data compositions (Figure 5). When trained with limited real data (Method 1: 25% real), the CNN exhibits substantial class confusion, particularly among Classes 1, 3, and 6, where off-diagonal elements indicate frequent misclassifications. This confusion diminishes progressively as more real data becomes available, with Method 4 (100% real data) achieving near-perfect diagonal dominance with minimal inter-class confusion.
The introduction of synthetic data to augment the real dataset presents an intriguing trade-off. Methods 5–7, which combine 25% real data with varying proportions of synthetic samples, demonstrate improved classification accuracy compared to using 25% real data alone. Method 7 (25% real + 75% synthetic) achieves particularly strong performance, with diagonal values approaching those of Method 4, suggesting that synthetic samples can effectively compensate for real data. However, careful examination reveals subtle but important differences in error patterns. While Method 4 maintains consistently high precision across all classes with negligible confusion, Method 7 exhibits slightly elevated off-diagonal elements, particularly for Classes 1 and 3, indicating that synthetic augmentation may introduce minor ambiguities in feature representation. The most notable observation concerns Classes 6 and 7, which show persistent mutual confusion across multiple experimental conditions. This pattern appears inherent to the data characteristics rather than being an artifact of the augmentation strategy, as it manifests in both real-only and synthetic-augmented training scenarios. The synthetic data generation process appears to preserve these intrinsic class relationships while successfully capturing the discriminative features necessary for improved overall classification.
Performance gains from synthetic augmentation plateau around Method 6 (25% real + 50% synthetic), with additional synthetic data in Method 7 yielding marginal improvements. This suggests an optimal mixing ratio exists beyond which synthetic samples provide diminishing returns. The results validate that generated synthetic samples can serve as an effective strategy for addressing data scarcity in SAR target recognition tasks, though they cannot entirely replicate the discriminative quality of authentic radar signatures.

5. Conclusions

To overcome the challenges of limited angular controllability and continuity in SAR image generation, this paper introduces an enhanced GAN framework, ACC-GAN. By incorporating an azimuth control variable, the model effectively guides feature fusion from input SAR images, prioritizing features from adjacent azimuth to achieve high-quality image generation. This variable also regulates angular discrimination, ensuring precise azimuth control during the generation process. Furthermore, this mechanism eliminates stringent requirements on the angular distribution of input images, enabling the generation of high-quality SAR images with angular differences within 20°, thereby demonstrating its potential for efficient SAR image augmentation. The effectiveness of ACC-GAN is validated on the MSTAR dataset through both quantitative metrics and visual comparisons. Classification experiments further confirm the quality of the generated images: when replacing real images with generated ones for data augmentation, the performance of CNNs and ResNet models showed only a slight decline compared to using real data exclusively. For transformer models (ViT), while results were not as robust as when using real data alone, they still demonstrated significant improvement over models that did not utilize synthetic data at all.
However, all images in the MSTAR dataset are isolated cropped targets captured under constrained radar observation parameters (X-band, single-polarization, specific elevation angle). Real-world synthetic aperture radar applications present greater challenges, including complex backgrounds, overlapping targets, varying environmental conditions, and diverse observation parameters. Although ACC-GAN demonstrates excellent performance on the MSTAR benchmark, its effectiveness on real-world data requires further validation. Moving forward, we plan to validate the effectiveness of the ACC-GAN model in more challenging real-world SAR scenarios.

Author Contributions

Conceptualization, Y.C. and Z.L.; methodology, Y.C.; software, Y.C.; validation, L.R. and Z.L.; writing—original draft preparation, Y.C., Z.L. and L.R.; writing—review and editing, N.W., B.S. and X.X.; visualization, X.X.; supervision, X.B.; project administration, N.W. and B.S.; funding acquisition, Z.L. and X.B. All authors have read and agreed to the published version of the manuscript.

Funding

This research was funded by the Open Fund Project of the Laboratory of Pinghu.

Data Availability Statement

The original data presented in the study are openly available at https://pan.baidu.com/s/1f_ARiGIfHjk2LFtPYl2jbA?pwd=8q87#list/path=%2F (accessed on 7 November 2025).

Conflicts of Interest

Zhiqu Liu has received research grants from Pinghu Space Awareness Laboratory Technology Co., Ltd.

References

  1. García, L.P.; Furano, G.; Ghiglione, M.; Zancan, V.; Imbembo, E.; Ilioudis, C.; Clemente, C.; Trucco, P. Advancements in Onboard Processing of Synthetic Aperture Radar (SAR) Data: Enhancing Efficiency and Real-Time Capabilities. IEEE J. Sel. Top. Appl. Earth Obs. Remote Sens. 2024, 17, 16625–16645. [Google Scholar] [CrossRef]
  2. Liu, Y.; Chen, K.-S.; Xu, P.; Li, Z.-L. Modeling and characteristics of microwave backscattering from rice canopy over growth stages. IEEE Trans. Geosci. Remote Sens. 2016, 54, 6757–6770. [Google Scholar] [CrossRef]
  3. Liu, X.; Shao, Y.; Li, K.; Liu, Z.; Liu, L.; Xiao, X. Backscattering Statistics of Indoor Full-Polarization Scatterometric and Synthetic Aperture Radar Measurements of a Rice Field. Remote Sens. 2023, 15, 965. [Google Scholar] [CrossRef]
  4. Asiyabi, R.M.; Ghorbanian, A.; Tameh, S.N.; Amani, M.; Jin, S.; Mohammadzadeh, A. Synthetic aperture radar (SAR) for ocean: A review. IEEE J. Sel. Top. Appl. Earth Obs. Remote Sens. 2023, 16, 9106–9138. [Google Scholar] [CrossRef]
  5. Nava, L.; Monserrat, O.; Catani, F. Improving landslide detection on SAR data through deep learning. IEEE Geosci. Remote Sens. Lett. 2021, 19, 4020405. [Google Scholar] [CrossRef]
  6. Amitrano, D.; Di Martino, G.; Di Simone, A.; Imperatore, P. Flood detection with SAR: A review of techniques and datasets. Remote Sens. 2024, 16, 656. [Google Scholar] [CrossRef]
  7. Mazzanti, P.; Scancella, S.; Virelli, M.; Frittelli, S.; Nocente, V.; Lombardo, F. Assessing the performance of multi-resolution satellite SAR images for post-earthquake damage detection and mapping aimed at emergency response management. Remote Sens. 2022, 14, 2210. [Google Scholar] [CrossRef]
  8. Li, J.; Yu, Z.; Yu, L.; Cheng, P.; Chen, J.; Chi, C. A comprehensive survey on SAR ATR in deep-learning era. Remote Sens. 2023, 15, 1454. [Google Scholar] [CrossRef]
  9. El-Darymli, K.; Gill, E.W.; Mcguire, P.; Power, D.; Moloney, C. Automatic target recognition in synthetic aperture radar imagery: A state-of-the-art review. IEEE Access 2016, 4, 6014–6058. [Google Scholar] [CrossRef]
  10. Slesinski, J.; Wierzbicki, D. Review of Synthetic Aperture Radar Automatic Target Recognition: A Dual Perspective on Classical and Deep Learning Techniques. IEEE J. Sel. Top. Appl. Earth Obs. Remote Sens. 2025, 18, 18978–19024. [Google Scholar] [CrossRef]
  11. Kechagias-Stamatis, O.; Aouf, N. Automatic target recognition on synthetic aperture radar imagery: A survey. IEEE Aerosp. Electron. Syst. Mag. 2021, 36, 56–81. [Google Scholar] [CrossRef]
  12. O’Sullivan, J.A.; DeVore, M.D.; Kedia, V.; Miller, M.I. SAR ATR performance using a conditionally Gaussian model. IEEE Trans. Aerosp. Electron. Syst. 2002, 37, 91–108. [Google Scholar] [CrossRef]
  13. Potter, L.C.; Moses, R.L. Attributed scattering centers for SAR ATR. IEEE Trans. Image Process. 1997, 6, 79–91. [Google Scholar] [CrossRef]
  14. Li, H.-C.; Hong, W.; Wu, Y.-R.; Fan, P.-Z. An efficient and flexible statistical model based on generalized gamma distribution for amplitude SAR images. IEEE Trans. Geosci. Remote Sens. 2010, 48, 2711–2722. [Google Scholar]
  15. Yi-Bo, L.; Chang, Z.; Ning, W. A survey on feature extraction of SAR images. In Proceedings of the 2010 International Conference on Computer Application and System Modeling (ICCASM 2010), Taiyuan, China, 22–24 October 2010; IEEE: New York, NY, USA, 2010; Volume 1, p. V1-312. [Google Scholar]
  16. Guo, J.; Wang, L.; Zhu, D.; Hu, C. Compact convolutional autoencoder for SAR target recognition. IET Radar Sonar Navig. 2020, 14, 967–972. [Google Scholar] [CrossRef]
  17. Zhou, F.; Wang, L.; Bai, X.; Hui, Y. SAR ATR of ground vehicles based on LM-BN-CNN. IEEE Trans. Geosci. Remote Sens. 2018, 56, 7282–7293. [Google Scholar] [CrossRef]
  18. Zhang, M.; An, J.; Yang, L.D.; Wu, L.; Lu, X.Q. Convolutional neural network with attention mechanism for SAR automatic target recognition. IEEE Geosci. Remote Sens. Lett. 2020, 19, 4004205. [Google Scholar]
  19. Li, W.; Yang, W.; Liu, T.; Hou, Y.; Li, Y.; Liu, Z.; Liu, Y.; Liu, L. Predicting gradient is better: Exploring self-supervised learning for SAR ATR with a joint-embedding predictive architecture. ISPRS J. Photogramm. Remote Sens. 2024, 218, 326–338. [Google Scholar] [CrossRef]
  20. Cui, Z.; Zhang, M.; Cao, Z.; Cao, C. Image data augmentation for SAR sensor via generative adversarial nets. IEEE Access 2019, 7, 42255–42268. [Google Scholar] [CrossRef]
  21. Huang, Z.; Zhang, X.; Tang, Z.; Xu, F.; Datcu, M.; Han, J. Generative artificial intelligence meets synthetic aperture radar: A survey. IEEE Geosci. Remote Sens. Mag. 2024; early access. [Google Scholar] [CrossRef]
  22. Ren, Z.; Hou, B.; Wu, Q.; Wen, Z.; Jiao, L. A distribution and structure match generative adversarial network for SAR image classification. IEEE Trans. Geosci. Remote Sens. 2020, 58, 3864–3880. [Google Scholar] [CrossRef]
  23. Zhang, J.; Liu, Z.; Jiang, W.; Liu, Y.; Zhou, X.; Li, X. Application of deep generative networks for SAR/ISAR: A review. Artif. Intell. Rev. 2023, 56, 11905–11983. [Google Scholar] [CrossRef]
  24. Kong, Y.; Liu, S. DMSC-GAN: A c-GAN-Based Framework for Super-Resolution Reconstruction of SAR Images. Remote Sens. 2023, 16, 50. [Google Scholar] [CrossRef]
  25. Lattari, F.; Santomarco, V.; Santambrogio, R.; Rucci, A.; Matteucci, M. CycleSAR: SAR image despeckling as unpaired image-to-image translation. In Proceedings of the 2023 International Joint Conference on Neural Networks (IJCNN), Gold Coast, Australia, 18–23 June 2023; IEEE: New York, NY, USA, 2023; pp. 1–8. [Google Scholar]
  26. Wang, C.; Pei, J.; Liu, X.; Huang, Y.; Mao, D.; Zhang, Y.; Yang, J. SAR Target Image Generation Method Using Azimuth-Controllable Generative Adversarial Network. IEEE J. Sel. Top. Appl. Earth Obs. Remote Sens. 2022, 15, 9381–9397. [Google Scholar] [CrossRef]
  27. Chen, X.; Duan, Y.; Houthooft, R.; Schulman, J.; Sutskever, I.; Abbeel, P. Infogan: Interpretable representation learning by information maximizing generative adversarial nets. Adv. Neural Inf. Process. Syst. 2016, 29, 2180–2188. [Google Scholar]
  28. Feng, Z.; Daković, M.; Ji, H.; Zhou, X.; Zhu, M.; Cui, X.; Stanković, L. Interpretation of latent codes in InfoGAN with SAR images. Remote Sens. 2023, 15, 1254. [Google Scholar] [CrossRef]
  29. Liang, M. Research on Multi-View SAR Image Target Data Augmentation Based on Generative Adversarial Networks. Ph.D. Thesis, University of Electronic Science and Technology of China, Chengdu, China, 2021. [Google Scholar]
  30. Sang, H.; Wu, J.; Zhang, Z. Generalized Representation Learning of Azimuth based on Mutual Information for SAR Recognition. In Proceedings of the 2024 IEEE International Conference on Signal, Information and Data Processing (ICSIDP), Zhuhai, China, 22–24 November 2024; IEEE: New York, NY, USA, 2024; pp. 1–5. [Google Scholar] [CrossRef]
  31. Mirza, M.; Osindero, S. Conditional generative adversarial nets. arXiv 2014, arXiv:14111784. [Google Scholar]
  32. Ruyi, W.; Hanqing, Z.; Bing, H.; Yueting, Z.; Jiayi, G.; Wen, H.; Wei, S.; Wenlong, H. Multiangle SAR dataset construction of aircraft targets based on angle interpolation simulation. J. Radars 2022, 11, 637–651. [Google Scholar]
  33. Xiang, D.; Liu, Y.; Cheng, J.; Lu, X.; Xie, Y.; Guan, D. SAR Target Recognition with Image Generation and Azimuth Angle Feature Constraints. IEEE J. Sel. Top. Appl. Earth Obs. Remote Sens. 2025, 18, 18561–18580. [Google Scholar] [CrossRef]
  34. Keydel, E.R.; Lee, S.W.; Moore, J.T. MSTAR extended operating conditions: A tutorial. Algorithms Synth. Aperture Radar Imag. III 1996, 2757, 228–242. [Google Scholar]
  35. Wang, Z.; Simoncelli, E.P.; Bovik, A.C. Multiscale structural similarity for image quality assessment. In Proceedings of the Thrity-Seventh Asilomar Conference on Signals, Systems & Computers, Pacific Grove, CA, USA, 9–12 November 2003; IEEE: New York, NY, USA, 2003; Volume 2, pp. 1398–1402. [Google Scholar]
Figure 1. Optical images and corresponding measured SAR images of ten types of targets in the MSTAR dataset.
Remotesensing 17 03763 g001
Figure 2. The network architecture of ACC-GAN.
Remotesensing 17 03763 g002
Figure 3. Part of the SAR images generated with different azimuth intervals and the corresponding real SAR images. The upper line is the generated images, and the lower line is the real images. (a) Images generated with 5° azimuth interval, (b) 10° azimuth interval, (c) 20° azimuth interval, (d) 50° azimuth interval.
Remotesensing 17 03763 g003
Figure 4. Angular error and quality metrics of the generated SAR images with varying α.
Remotesensing 17 03763 g004
Figure 5. Confusion matrix of CNN with Different Compositions of the Training Data: (a) 25% Real images only (b) 50% Real images only (c) 75% Real images only (d) 100% Real images only (e) 25% Real and 25% generated images (f) 25% Real and 50% generated images (g) 25% Real and 75% generated images.
Remotesensing 17 03763 g005
Table 1. Comparison of azimuth-controllable SAR generation methods.
MethodGenerator ArchitectureAngular ControlFlexibility on Angular Generation
cGAN/InfoGANSingle encoder + noiseDisentangled representation learningWeak (interpolation not guaranteed)
Wang et al. [26]Dual encoder (fixed Δθ)Learned interpolation between fixed intervalsModerate (limited to trained intervals)
ACC-GAN (Ours)Triple-branch encoder + fusionFlexible pairing + continuous α controlStrong (arbitrary angle interpolation)
Table 2. Training and testing datasets.
Class IDClass NameDepressionNumberDepressionNumberDepressionNumber
1BTR6017°25615°19530°-
2BMP2-956317°23315°19230°-
3BTR70-C7117°23315°19630°-
4D717°29915°27430°-
5T6217°29915°27330°-
6ZIL13117°29915°27430°-
7T72-13217°23215°19630°-
82S117°29915°27430°288
9BRDM-217°29815°27430°287
10ZSU-23-417°29915°27430°288
Table 3. Quantitative result of the ablation study on network architecture components.
MethodCBNDCSSIMFIDLPIPS
Baseline0.657512.1710.0697
Method1×0.541215.2570.1498
Method2×0.585013.7040.1023
Method3××0.485820.4960.2259
Table 4. Angular error and quality metrics of the generated SAR images with varying azimuth intervals on 15° MSTAR Dataset.
Azimuth IntervalFull ImageCenter Image
Angle ErrorMSESSIMMS-SSIMFIDLPIPSAngle ErrorMSESSIMMS-SSIMFIDLPIPS
1.840.00550.69140.938210.33790.06212.020.00550.71050.921612.52070.0267
10°2.360.00590.65890.904411.17560.07032.490.00590.68700.885516.02720.0305
20°3.220.00720.63260.878311.70620.07942.110.00720.65980.853918.04120.0345
50°5.170.00860.57810.835813.66140.09506.030.00860.56860.781624.22950.0402
Table 5. Cross-depression angle generalization performance.
Depression Angle15°30°
MSE0.00750.0076
SSIM0.63610.6567
MS-SSIM0.89930.8685
FID11.627716.3428
LPIPS0.07820.0732
Table 6. Quantitative comparison with baseline methods.
OursACGANcGAN
MSE0.00750.00840.0125
SSIM0.63610.57380.4828
MS-SSIM0.89930.77720.6447
FID11.627723.266048.1495
LPIPS0.07820.11770.2241
Table 7. Overall Accuracy of Classification with Different Compositions of the Training Data.
MethodTraining Data CompositionNumber of Training DataNumber of Testing DataOverall Accuracy%
CNNViTResNET
Method 125% Real images only303121185.265.193.4
Method 250% Real images only606121194.484.395.1
Method 375% Real images only908121195.690.397.7
Method 4100% Real images only1211121196.893.398.8
Method 525% Real and 25% generated images606121192.070.695.1
Method 625% Real and 50% generated images908121195.682.197.5
Method 725% Real and 75% generated images1211121196.788.697.7
Disclaimer/Publisher’s Note: The statements, opinions and data contained in all publications are solely those of the individual author(s) and contributor(s) and not of MDPI and/or the editor(s). MDPI and/or the editor(s) disclaim responsibility for any injury to people or property resulting from any ideas, methods, instructions or products referred to in the content.