Article

New Advances Towards Early Warning Systems in the Mediterranean Sea Using the Real-Time RING GNSS Research Infrastructure

1
Sezione Irpinia, Istituto Nazionale di Geofisica e Vulcanologia, 83035 Grottaminarda, Italy
2
Deutsches GeoForschungsZentrum, 14473 Potsdam, Germany
3
Shanghai Astronomical Observatory, Shanghai 200030, China
4
Osservatorio Nazionale Terremoti, Istituto Nazionale di Geofisica e Vulcanologia, 00143 Rome, Italy
*
Author to whom correspondence should be addressed.
Remote Sens. 2025, 17(22), 3661; https://doi.org/10.3390/rs17223661
Submission received: 6 August 2025 / Revised: 23 October 2025 / Accepted: 5 November 2025 / Published: 7 November 2025
(This article belongs to the Special Issue Advanced Multi-GNSS Positioning and Its Applications in Geoscience)

Highlights

What are the main findings?
  • For the first time an assessment of the accuracies of the RING real-time GNSS position time series is performed, by comparing GPS and GNSS solutions and different Precise Point Positioning (PPP) strategies (standard PPP and PPP with Regional Augmentation PPP-RA)
  • The most accurate (sub-centimeter level) RING real-time solutions are obtained for GNSS solutions with the PPP-RA strategy by using a 300 s sliding window for solutions.
What are the implications of the main findings?
  • The real-time RING GNSS infrastructure can potentially observe co-seismic ground deformation after moderate-magnitude (M6) earthquakes.
  • The proposed approach supports the development of effective tsunami and earthquake early warning systems in tectonically active regions.

Abstract

Nowadays, information obtained through Global Navigation Satellite Systems (GNSSs) is widely employed in modern geodesy. The Precise Point Positioning (PPP) approach, which leverages signals from multiple GNSS constellations (e.g., GPS, GLONASS, Galileo, and BeiDou), enables high-precision positioning—crucial for seismic monitoring and early tsunami warning systems (EEWs). Recent advances, such as increased satellite availability and additional frequency bands, have significantly improved PPP performance, particularly in terms of positioning accuracy and convergence time. This study focuses on the Rete Integrata Nazionale GNSS (RING) network, managed by the Istituto Nazionale di Geofisica e Vulcanologia (INGV), which comprises dual-frequency GNSS receivers distributed across the Italian peninsula and parts of the Mediterranean Basin. We evaluate the performance of the RING data (GPS and GNSS) acquired in a period of three weeks between 19 January 2024 and 9 February 2024 and analyzed in real time by using different PPP strategies: standard PPP and PPP with Regional Augmentation (PPP-RA). The preliminary results show that the PPP-RA approach enhances positioning accuracy and reduces convergence time, especially when comparing GPS-only datasets with those incorporating full multi-GNSS configurations. For the daily solution, in the optimal setup (i.e., full GNSS with RA), real-time solutions exhibit average accuracies of 2.05, 1.73, and 4.35 cm for the North, East, and vertical components, respectively. Sub-daily accuracies’ analysis, using 300 s sliding windows, showed even better uncertainties, exhibiting median values of 0.41, 0.32, and 0.9 cm for the North, East and vertical components, respectively. Based on the outcomes for network-wide sub-daily accuracies, 84% of the stations demonstrate average errors within 2 cm for North and East components and 3 cm for the vertical one. The analysis on the convergence time after data gaps occurred during the investigation period shows that 87% of the RING stations experienced convergence times lower than five minutes in the GNSS PPP-RA solution. These findings underscore the potential of RT-GNSS RING data for enhancing seismic monitoring and early warning systems, particularly in tectonically active regions.

1. Introduction

Modern geodesy utilizes a range of space and terrestrial technologies that contribute to the investigation and understanding of the solid earth, atmosphere, and oceans [1]. Space geodesy, among many functions, provides observations that form the basis of physical models of the earthquake deformation cycle, offering key information to describe the processes leading up to and following significant events based on deformation rates on the Earth’s surface. During an earthquake, the antenna, anchored to the ground, moves, and these position variations can be calculated in real time (RT) to monitor both dynamic and static displacement. The Global Navigation Satellite System (GNSS) displacement waveforms provide reliable centimeter-level accurate representations of the ground motion for moderate-to-large (M > 6) seismic events and at local-to-regional scales, e.g., [2,3,4,5]. For these events, as displacements represent native measurements for GNSSs, when available, they should be considered preferable with respect to doubly integrated accelerograms due to well-known baseline offset problems [6]. The GNSS technique has been increasingly applied in seismic monitoring using the Precise Point Positioning (PPP) approach [7], enabling the direct computation of co-seismic displacements, rapid and accurate magnitude determination [8,9], and moment tensor calculation [10,11]. Consequently, in recent years, RT-GNSS data has been integrated into both earthquake and tsunami early warning systems (EEW-TEW), particularly for large events [12,13,14,15,16].
The PPP technique is based on the measurements of a single receiver observing a number of satellites and capable of obtaining high-precision positions. However, it requires a convergence time of tens of minutes up to several hours [17,18]. Another factor that affects the time to reach centimeter-level accuracy is the number and geometry of visible satellites for a given portion of the Earth’s surface. However, in recent years, PPP has been able to take advantage of more frequencies and satellite resources due to the restoration of the complete orbital constellation for GLONASS and the emergence of new satellite systems such as Galileo and BeiDou (BDS). The combination of different GNSS constellations increases the number of visible satellites and improves their geometry, presenting the possibility of improving the performance of the PPP in terms of the positioning accuracy and convergence time [19,20,21].
Thanks to these achievements, RT-GNSS data have also been employed in early tsunami warning systems [22,23,24] using two real-time observational networks (GNSS and seismic), leading to a denser global coverage for earthquake finite-source inversion. However, to achieve this, high-rate GNSS data and a solid processing infrastructure are essential. Over the past three decades, numerous permanent GNSS networks have been established worldwide [25,26,27]. Since 2004, the Istituto Nazionale di Geofisica e Vulcanologia (INGV) has operated a continuous network to observe and monitor the active tectonic processes in Italy [28,29]. The Italian peninsula, due to its tectonic evolution driven by the interaction between the African and Eurasian plates, represents a unique natural laboratory for geodynamical investigations. The region is characterized by complex tectonic and geological settings, with several seismically active domains, particularly in the Apennines and the northeastern Alps [30,31,32].
At the beginning, the abovementioned network, known as the Rete Integrata Nazionale GPS (RING), was equipped with instrumentation that could only acquire data from the Global Positioning System (GPS) constellation. Nowadays, this important research infrastructure is mostly composed of dual-frequency GNSS (GPS, GLONASS, GALILEO, and BEIDOU) receivers and antennas. The RING network currently comprises approximately 250 stations, mostly distributed across Italy, with additional sites in Malta and Greece.
At present, the use of real-time PPP in high-precision seismic monitoring remains challenging due to the relatively lower quality of real-time satellite orbits and clocks compared to precise final (post-processed) products [33]. From a technical point of view, a real-time GNSS product chain is typically structured with a server/client configuration, and it can be vulnerable to connection interruptions. Moreover, high-precision GNSS positioning requires correction streams (i.e., satellite orbits and clocks) computed by the external agency servers based on remote or global reference networks.
To overcome these limitations, scientifically advanced real-time PPP approaches should be considered. In addition to the standard PPP method, these strategies also include a single-receiver ambiguity resolution by applying corrections derived from a local reference network (i.e., the PPP-RA [34,35]) or from a global network (i.e., the RTPPP PPP-AR [36,37], PPP-Wizard [18]) and single-receiver Regional Augmentation (i.e., the RTPPP PPP-RA [38]). In fact, both ambiguity resolutions and Regional Augmentations are crucial for reaching high-accuracy products and fast convergence times after the occurrence of data gaps [39]. Moreover, multi-GNSS PPP outperforms the single system in both convergence and precision, as demonstrated by ambiguity-float and also fixed PPP [40].
In this study, following an initial overview of the implementation and management of the RING network, the performance of the GNSS infrastructure is assessed based on preliminary results from PPP-RA processing. Specifically, its measurement accuracy is evaluated through the analysis of the real-time datasets. In this study, a GPS-only dataset is compared with a full GNSS configuration in a research software environment, namely RTPPP (v1.4).

2. Materials and Methods

2.1. Real-Time RING Data Acquisition

Since 2006, the INGV has run the RING network (https://ring.gm.ingv.it, (accessed on 30 June 2025)) with the aim of studying deformations at different spatial and temporal scales in the Eurasia–Africa plate boundary. With regard to the different spatial scales, the purpose is to observe and model how the deformation is localized or distributed from a single seismogenic fault (or fault systems) to regional or plate-scale areas. With regard to studying deformation at different temporal scales, the purpose is to explore the whole frequency spectrum of the deformation up to sampling frequencies useful for earthquake source studies [40,41,42,43]. In this sense, the availability of real-time time series at RING sites would significantly contribute to seismological early warning applications. Nowadays, the whole RING network is composed of 253 stations (Figure 1, white triangles), whose spatial distribution is not homogeneous all over Italy, but instead it is denser where the accumulation of the deformation is expected, i.e., where the main seismogenic faults are present. Among these 253 stations, currently, about 150 sites are set up to transmit RT-GNSS data towards the RING acquisition center located at the INGV Irpinia headquarters (Grottaminarda, Southern Italy).
The RING data is primarily transmitted through LTE [44] and Wi-Fi technologies. Additionally, a significant number of RING sites also transmit data via satellite telemetry, as they are co-located with broadband and accelerometer instrumentation from the Rete Sismica Nazionale (RSN https://terremoti.ingv.it/instruments/network (accessed on 10 July 2025)), another INGV research infrastructure on which the seismic monitoring of Italy and surrounding countries is based [45]. Real-time RING data streams, formatted according to the standard RTCM v.3, are acquired and managed via a specifically tuned Ntrip Caster, developed by BKG (https://igs.bkg.bund.de/ntrip/bkgcaster (accessed on 10 July 2025)), hereafter RING Ntrip Caster). Metadata, accessible through the RING website, are also available as a source table, regularly synchronized with the RING database.

2.2. Real-Time Data Analysis

All the RING GNSS data as well as those belonging to other permanent networks operating in the Mediterranean region are routinely processed using various scientific software packages, such as Bernese (v5.2), GAMIT/GLOBK (v10.7), and GIPSY-OASIS (v6.3), to observe long-term deformation in the Eurasia–Africa plate boundary region (https://webring.gm.ingv.it/index.php/data-analysis-and-product/ (accessed on 25 July 2025)) [46]. The processing approach adopted in the first two software packages (Bernese and GAMIT/GLOBK) is based on the relative positioning concept using phase-observable double-differencing techniques, whereas the third processing scheme (GIPSY-OASIS) is based on the Precise Point Positioning (PPP) technique [7,47,48].
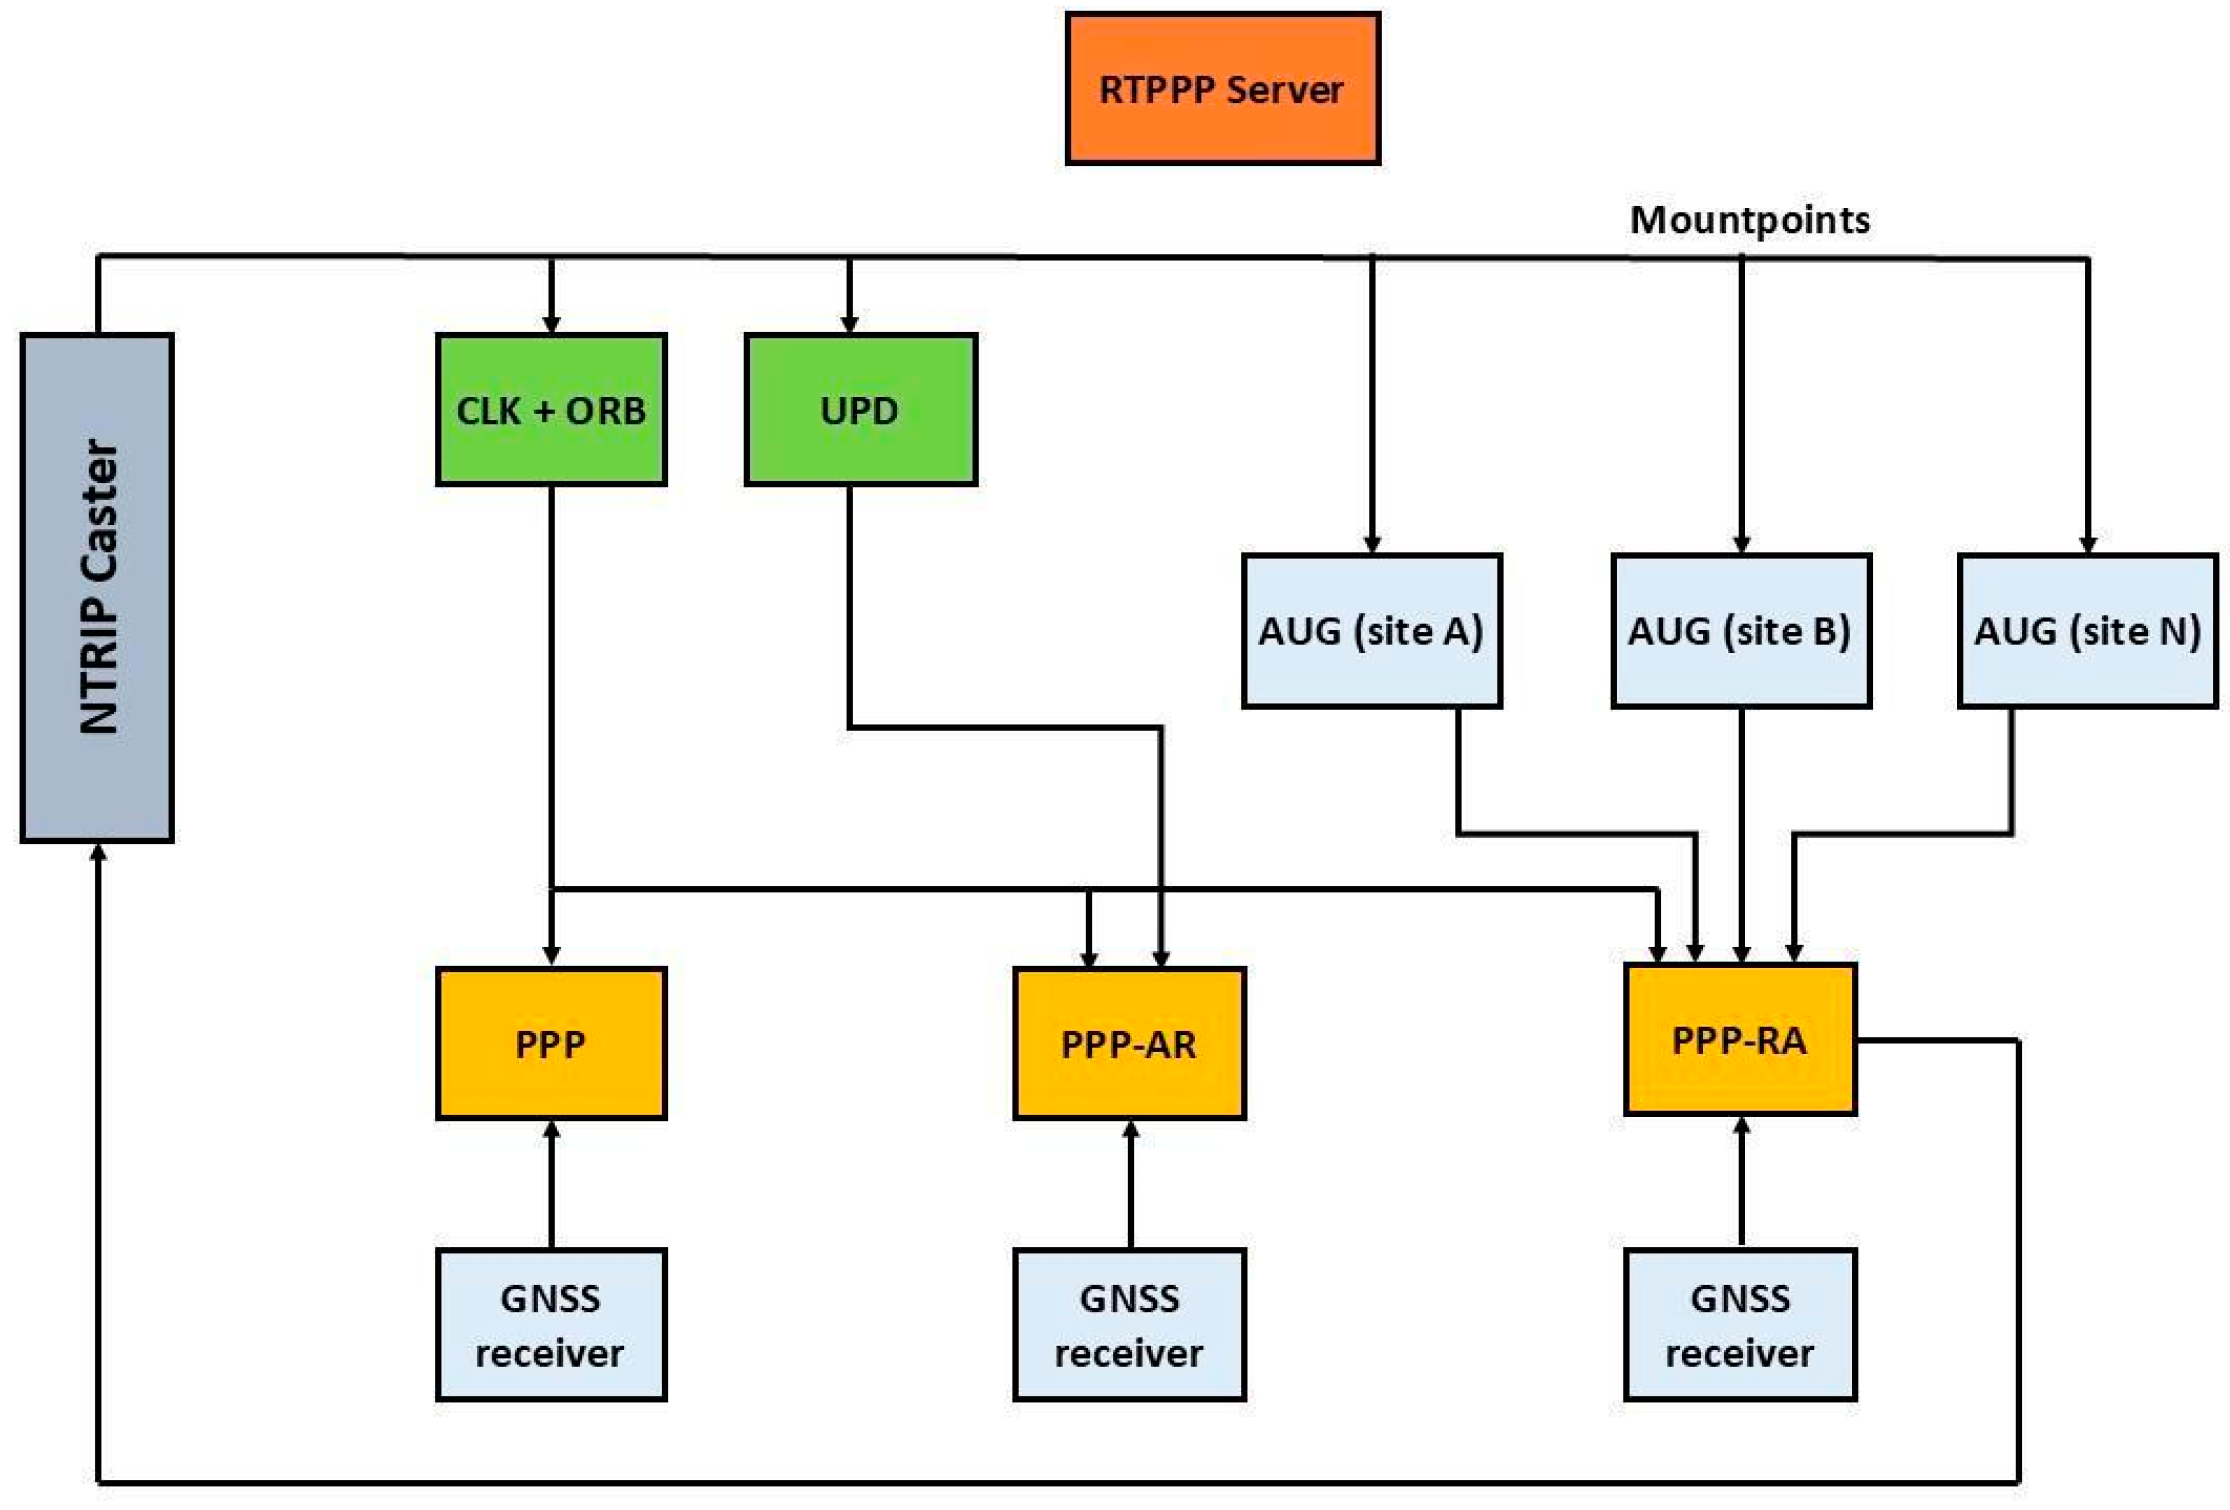
The RING real-time GNSS data analysis presented in this study was carried out using the RTPPP software (v1.4), developed by the German Research Centre for Geosciences (GFZ) [39]. The RTPPP is a high-precision system for monitoring the real-time displacement of reference stations. It uses undifferenced, dual-frequency code and carrier-phase observations with available real-time satellite orbits and clock products to achieve positioning results with a centimeter-level precision at each station [39]. The RTPPP environment consists of three parts: (i) PPP client software, (ii) a database, and (iii) a website (Figure 2) (https://www.gfz.de/en/section/space-geodetic-techniques/projects/rt-ppp-real-time-gnss-precise-positioning (accessed on 10 June 2025)). In this work we will focus on the first part (i) to assess the accuracy of the real-time RTPPP products for the RING network. The PPP client supports different data sources, including real-time replay and post-processing. Data processing can be conducted considering multi-GNSS constellations, including the GPS, GLONASS, Galileo, and BDS. Different positioning modes are supported, e.g., fixed coordinate, static, and kinematic modes [49].
Following the strategies proposed in previous works dealing with the development of the RTPPP software [38,50], the real-time RING data analysis is briefly described, as the main focus of this paper is related to the accuracy assessment of the RING real-time time series. We followed three main steps (Figure 2). In the first step, for each RING station, PPP-float position time series (defined PPP solution) were obtained by analyzing the raw data streaming by using external real-time satellite products (orbits and clocks) available on the IGS portal (https://igs.org/rts/products/ (accessed on 10 June 2025)), the ionosphere-free linear combination was used to reduce the first-order ionosphere effect, the GMF mapping function was used for troposphere ZTD estimations, and the IGS14 absolute antenna calibration was used for better modeling of the antennas delays. In this first step, the phase integer ambiguities were estimated and uploaded, in real time (UPD), to the RING NTRP Caster (Section 2.1). In the second step, these UDP streams were used, in addition to the real-time satellite orbits and clock products and the raw data streaming from the stations, to resolve ambiguities station by station. By applying the UPD corrections, the atmospheric correction (AUG) of the ionospheric slant and troposphere zenith wet delay were derived for each station from the PPP-fixed solutions and uploaded to the RING Ntrip Caster. This includes the use of a real-time spatial common mode for each station, estimated by using data from at least three other closer and surrounding sites (defined PPP-RA solution). Further details on the UPD and AUG estimations can be found in previous works [39,49].
By applying UPD corrections, integer undifferenced ambiguities on receiver frequencies can be fixed in PPP mode at all regional monitoring stations. The constraints imposed on the kinematic coordinates of adjacent epochs are fine-tuned using an adaptive filter in real time to strengthen the solution. Moreover, the atmospheric delay is often quite stable over short periods and can be represented by a constant or linear function. Therefore, even in periods of strong shaking, the station position and atmosphere are distinguishable during parameter estimation because of the significant difference in their temporal characters. For regional reference networks with moderate-to-short baselines (an inter-station distance of a few tens of kilometers), a cm-level accuracy can be achieved for the interpolated atmospheric delay corrections. These corrections are imposed as a strong constraint on the related parameters of the monitoring station, while the coordinates are estimated in kinematic mode. By applying this atmospheric delay model (AUG) to the PPP-fixed solution, in addition to the orbit and clock products used, both an instantaneous ambiguity resolution and Regional Augmentation can be achieved at the monitoring station [38,50]. In the RTPPP environment, this latest PPP solution is named PPP-RA.
The aim of this work is to compare GPS-only and GNSS real-time solutions developed from RING data by using different PPP strategies: standard PPP and PPP with Regional Augmentation (PPP-RA). Our investigation period is from 19 January to 9 February 2024 (three weeks). For all the solutions, we used products derived from multi-constellation data available through the IGS portal (https://igs.org/rts/ (accessed on 10 June 2025)). Specifically, we used the CLK93 (APC) stream for SSR orbit/clock corrections and the RTCM3EPH-MGEX stream for multi-GNSS broadcast ephemeris.

2.3. Data Accuracy Estimation

To assess the positioning accuracy of real-time estimated PPP time series, we adopted two different strategies:
  • In the first approach, for each station, RMS values for the East, North, and Up components were computed using all epochs acquired throughout the day. The RMS values were calculated considering all the epochs for which the position had been estimated (up to 86,400 at a 1 Hz sampling frequency for a 24 h session). In addition, we also distinguished the RMS calculated for the epochs in which Regional Augmentation (RA) had been applied to the positioning. These two different approaches were carried out for both GPS-only and full GNSS solutions, resulting in a single RMS value per component, per station, and per day of measurement. These RMS values will hereafter be referred to as “daily RMS”.
  • In the second approach, RMS values were computed for each time series (i.e., each component) using sub-daily overlapping sliding windows. While this method generally yields lower RMS values due to the smaller number of samples, it is particularly useful for detecting sudden transient deformations, such as co-seismic static and dynamic displacements, over shorter time scales. Given the time duration of the co-seismic shaking (30–60 s) during most of the past moderate-magnitude earthquakes in Italy (references), we decided to use 300 s sliding windows with an overlap of 150 s for each step. The 300 s time window is considered enough to sample either the noise or co-seismic dynamic and static displacements for moderate-magnitude earthquakes (M6). The overlaps are used to increase the number of RMS estimations. These RMS values will hereafter be named “sub-daily RMS”.
Both strategies were applied to assess the accuracy of the following datasets: (a) standard PPP GPS solutions; (b) PPP-RA GPS solutions; (c) standard PPP GNSS solutions; and (d) PPP-RA GNSS solutions.
Moreover, the performance of the RING network was evaluated using the average RMS, allowing us to categorize GNSS sites in terms of performance and reliability over the time span considered.

3. Results

This section is divided by subheadings illustrating the experimental results obtained by following the two previously described approaches.
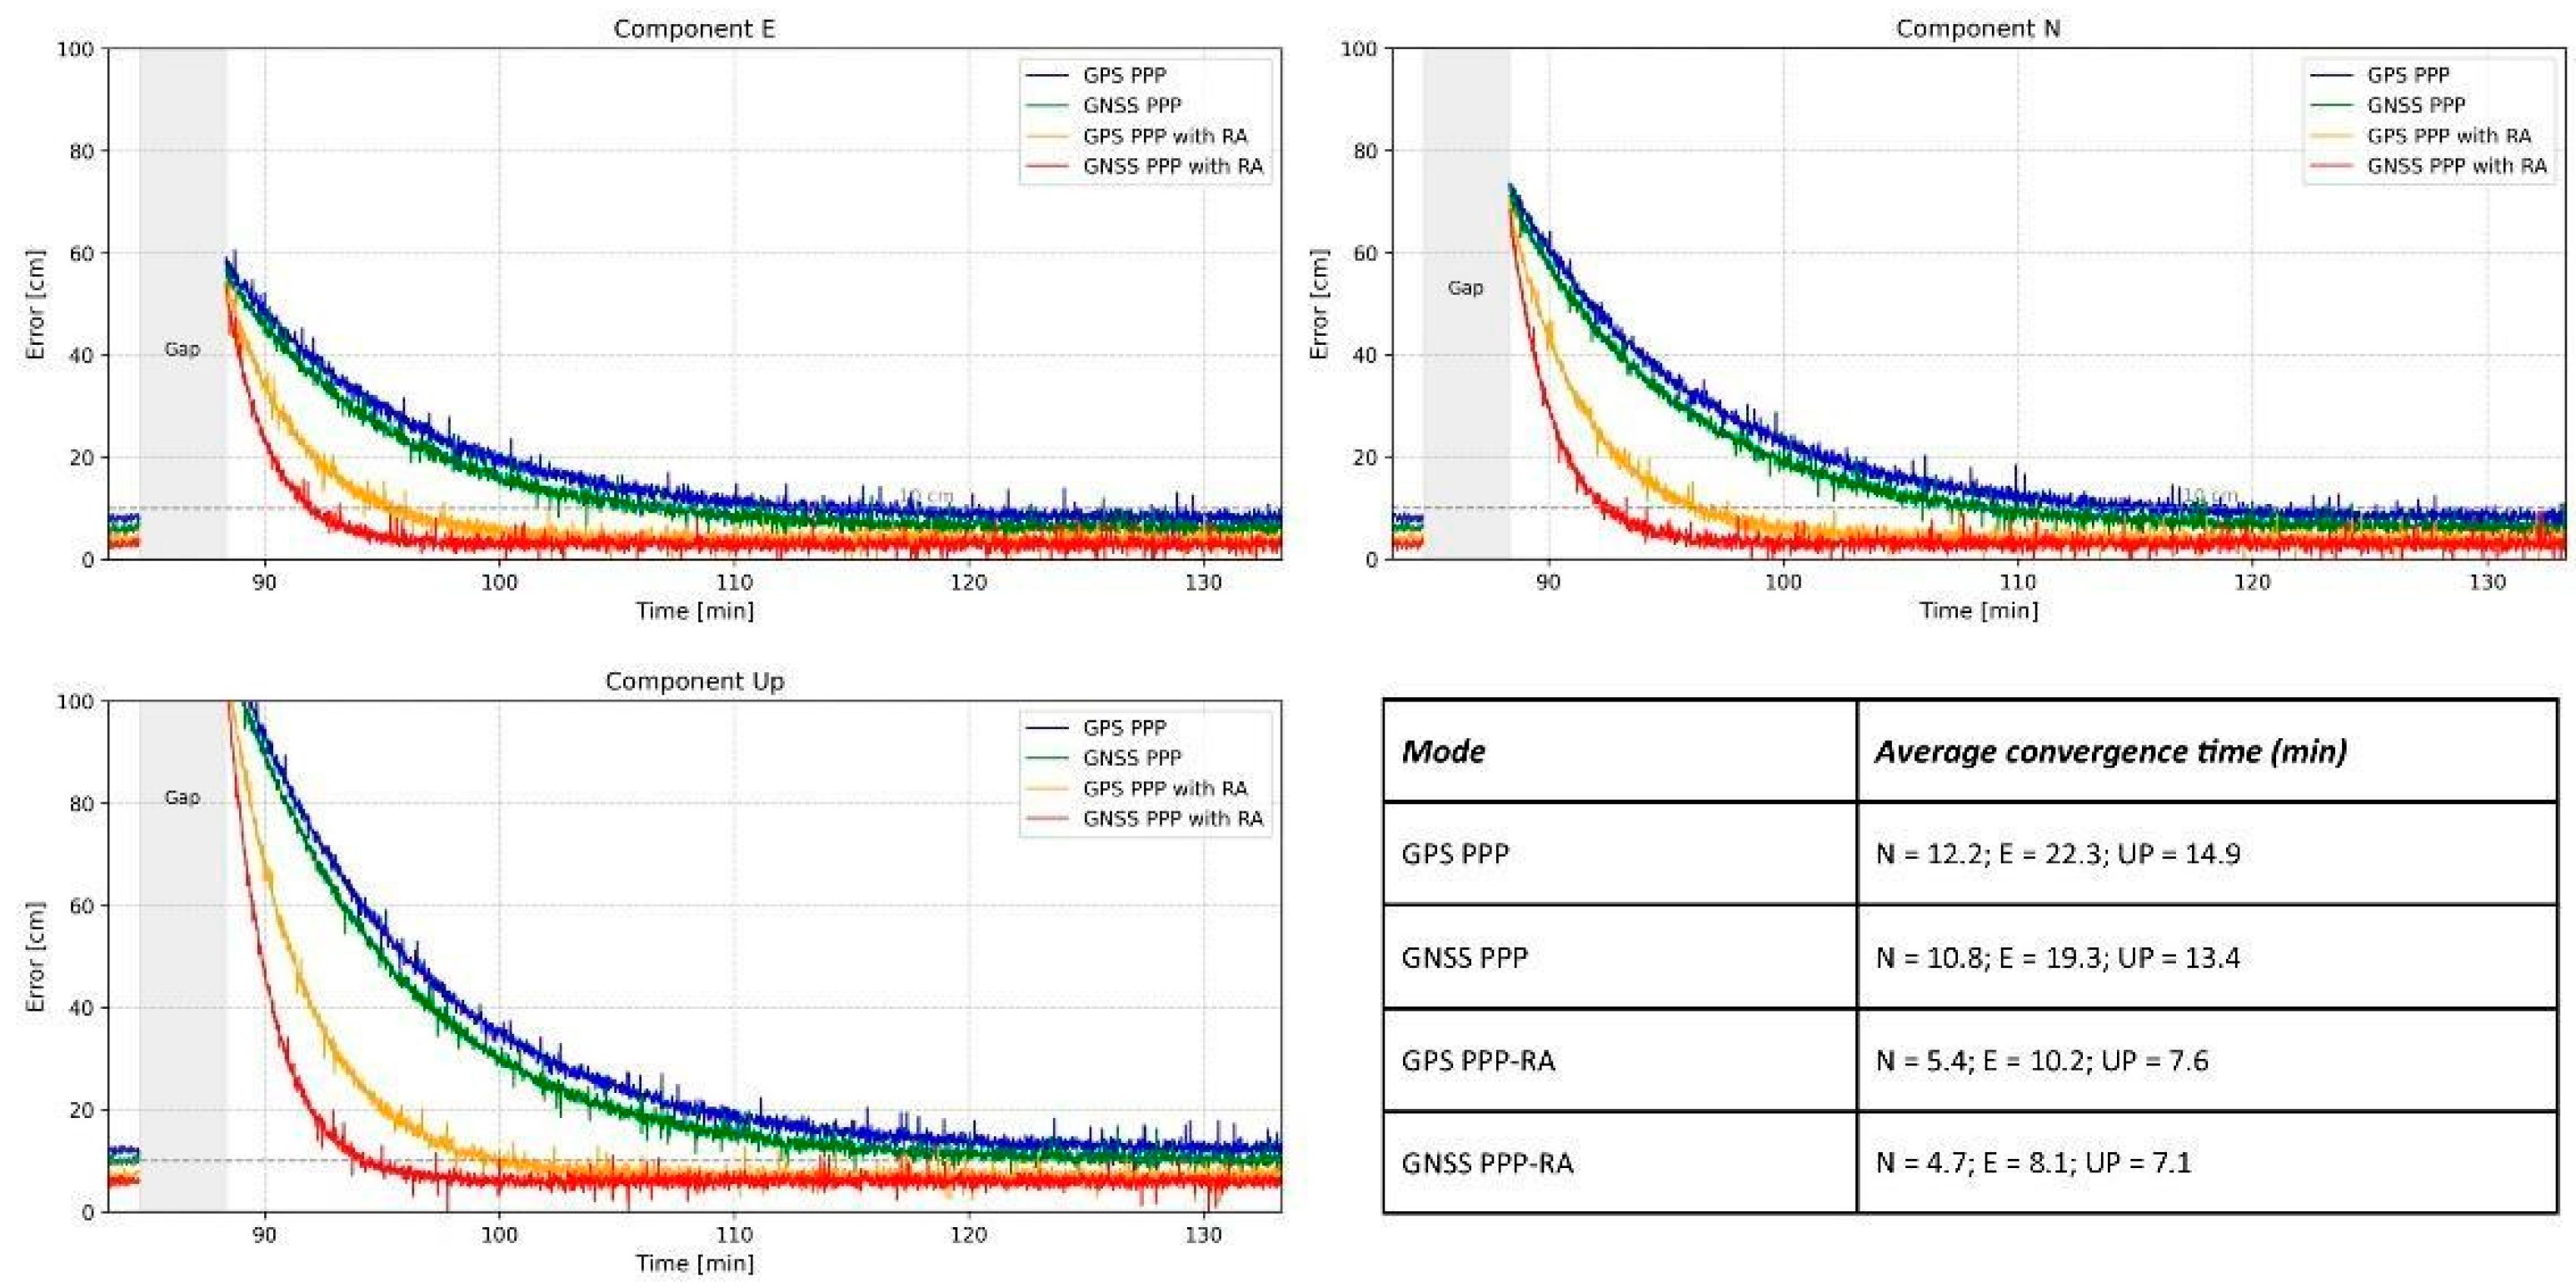
Taking into account that the convergence time is a key metric for real-time GNSS applications [48], this aspect was investigated for the analyzed datasets. Acquisition gaps may occur due to various factors, such as environmental conditions, technical issues, or interruptions in data transmission. Previous works define [48] the “convergence time” as the time required to reach a positioning error below 10 cm after a gap. In this work, for each component, for each station, and for each solution (GPS PPP, GPS PPP-RA, GNSS PPP, and GNSS PPP-RA) we estimated the defined convergence time after any gap occurring during the whole period of investigation (Section 2.2). The results of this huge analysis are described and shown in the Supplementary Materials. In Figure 3, we show an example for the CONI station.
The convergence times resumed in Figure 3 may also depend on the characteristics of each acquisition site. Indeed, among the considered RING stations, there is significant variability in the geographical location, which directly affects the contribution of the Regional Augmentation. In Figure 3, we also show a table that displays the average convergence time estimations carried out for all the solutions and for all the RING stations. Most sites (87.5%) show convergence times shorter than five minutes (e.g., CONI site), even when considering GPS-only PPP data (see Supplementary Materials). In any case, it is important to highlight the significant impact of both the larger number of satellites used in the full GNSS solutions and the contribution of the Regional Augmentation for both the GPS-only and full GNSS datasets.

3.1. Daily RMS

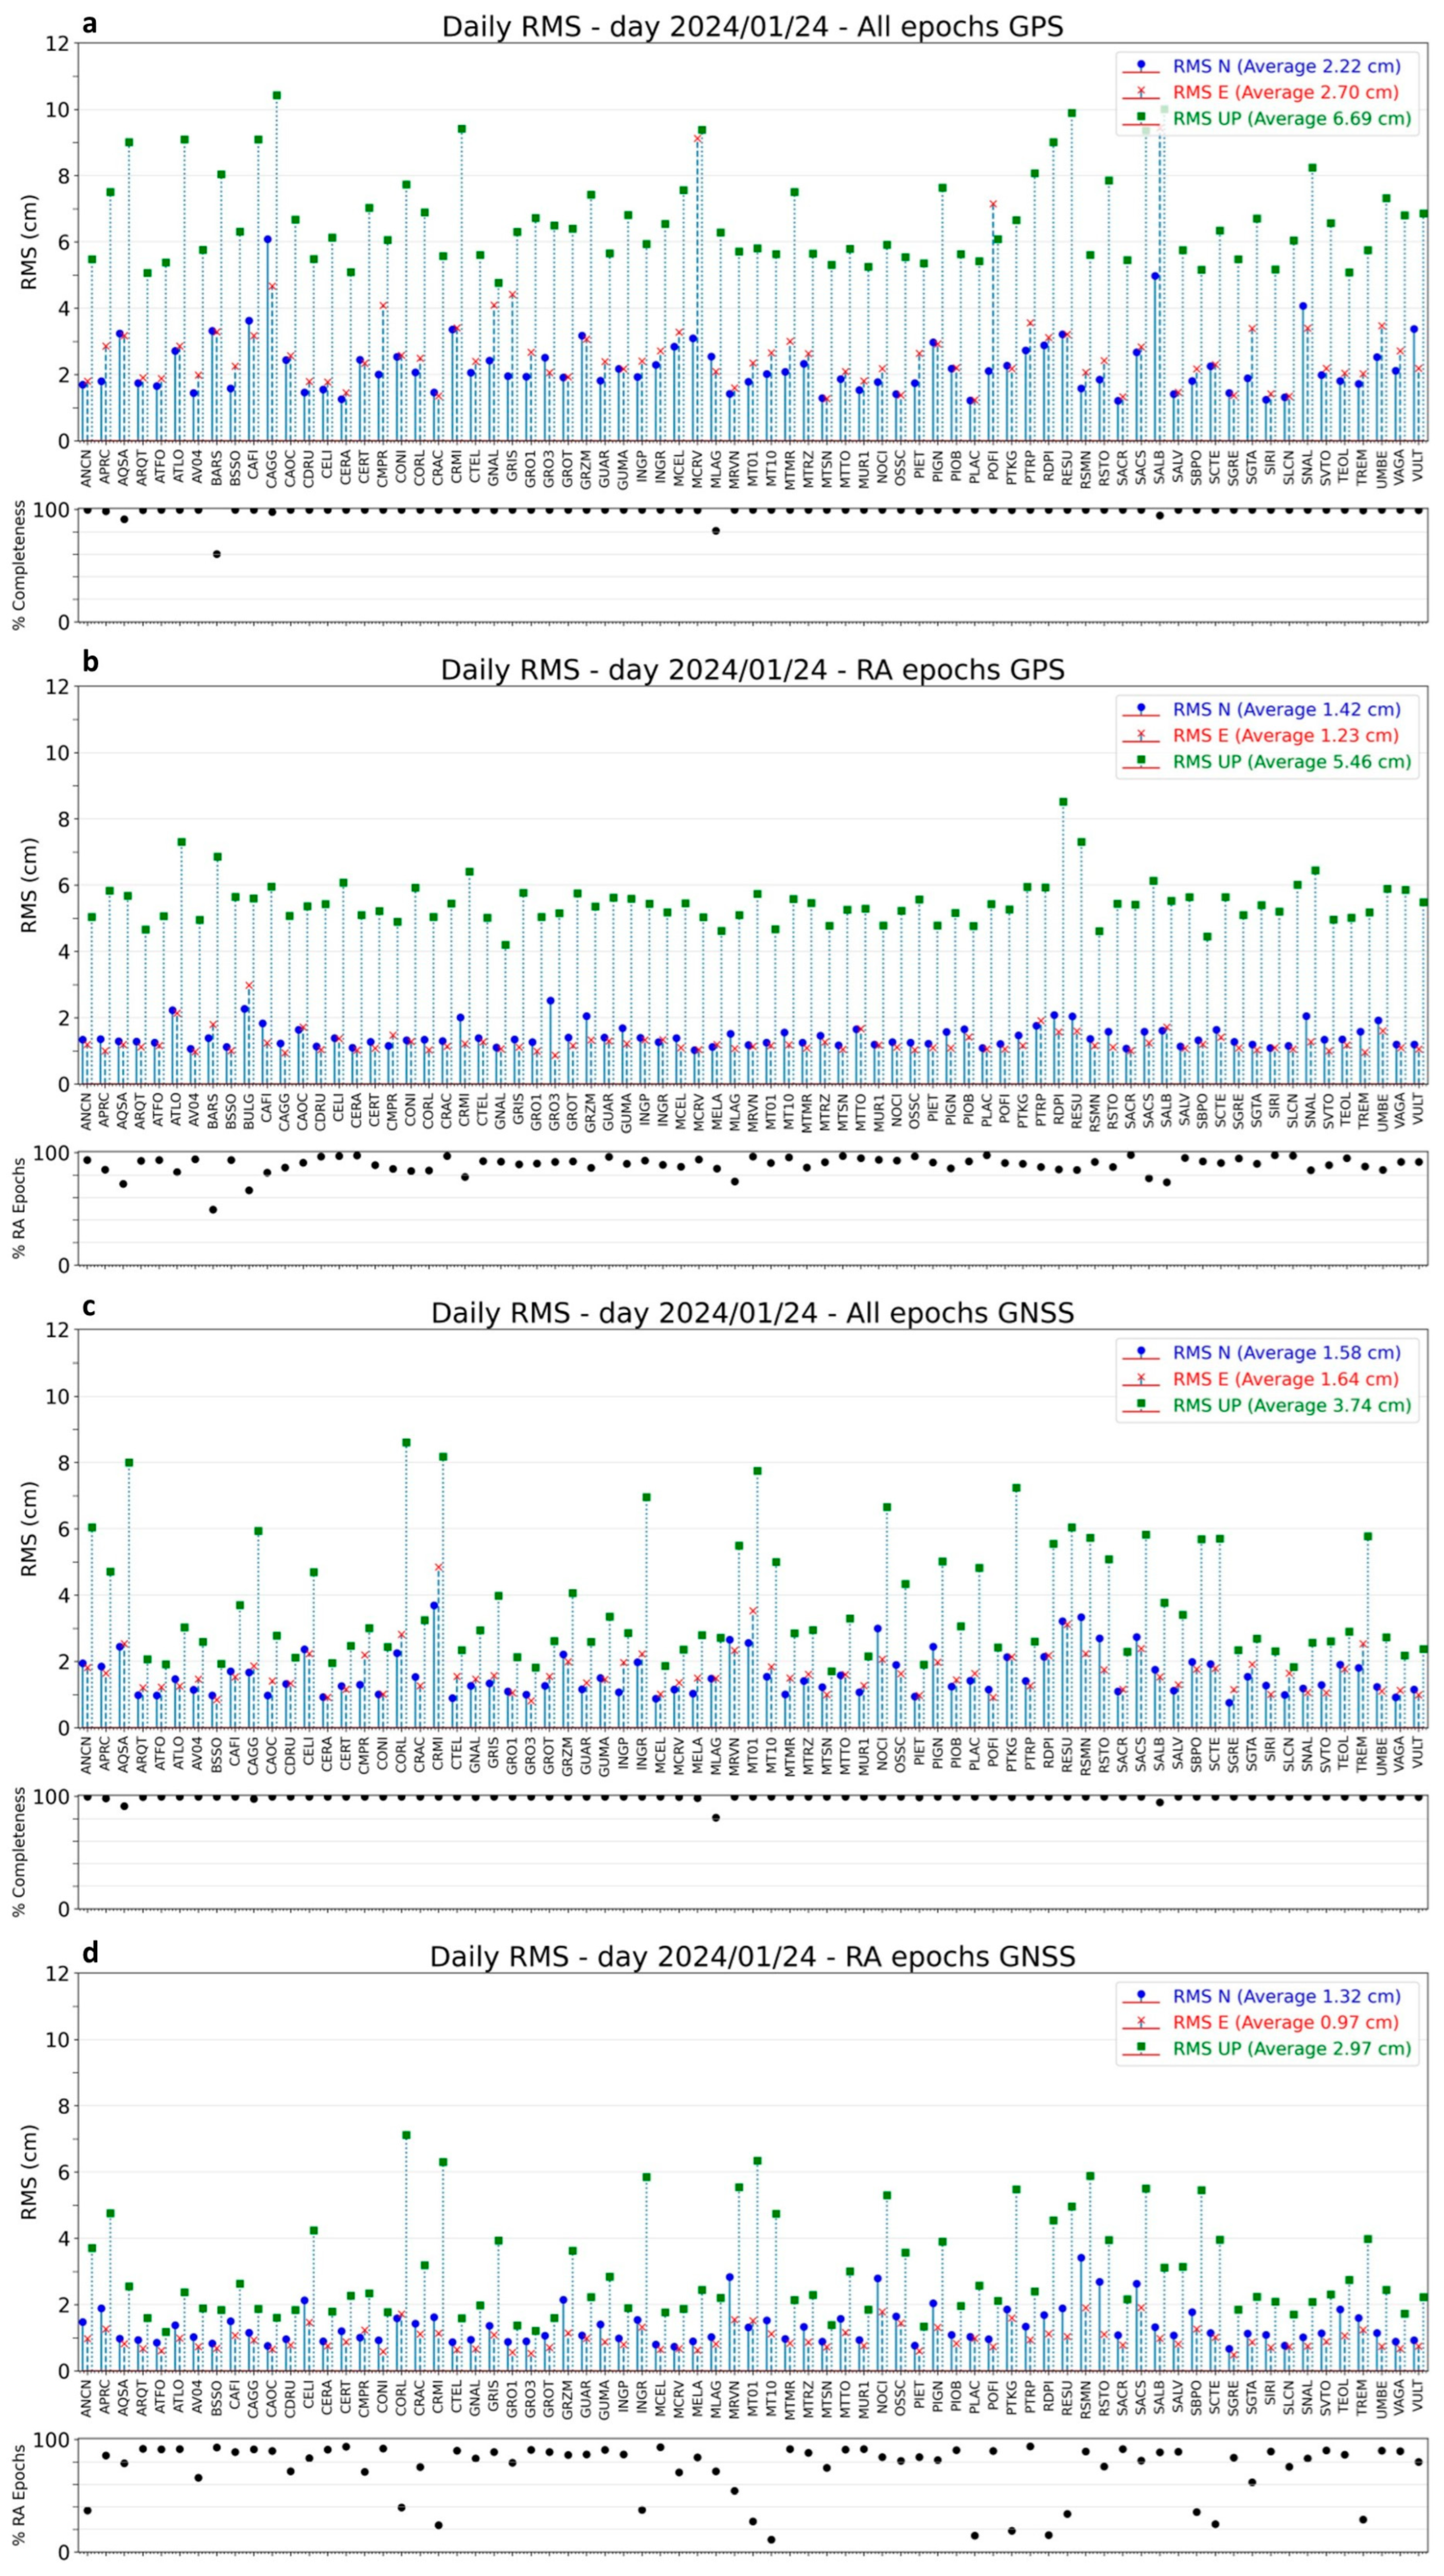
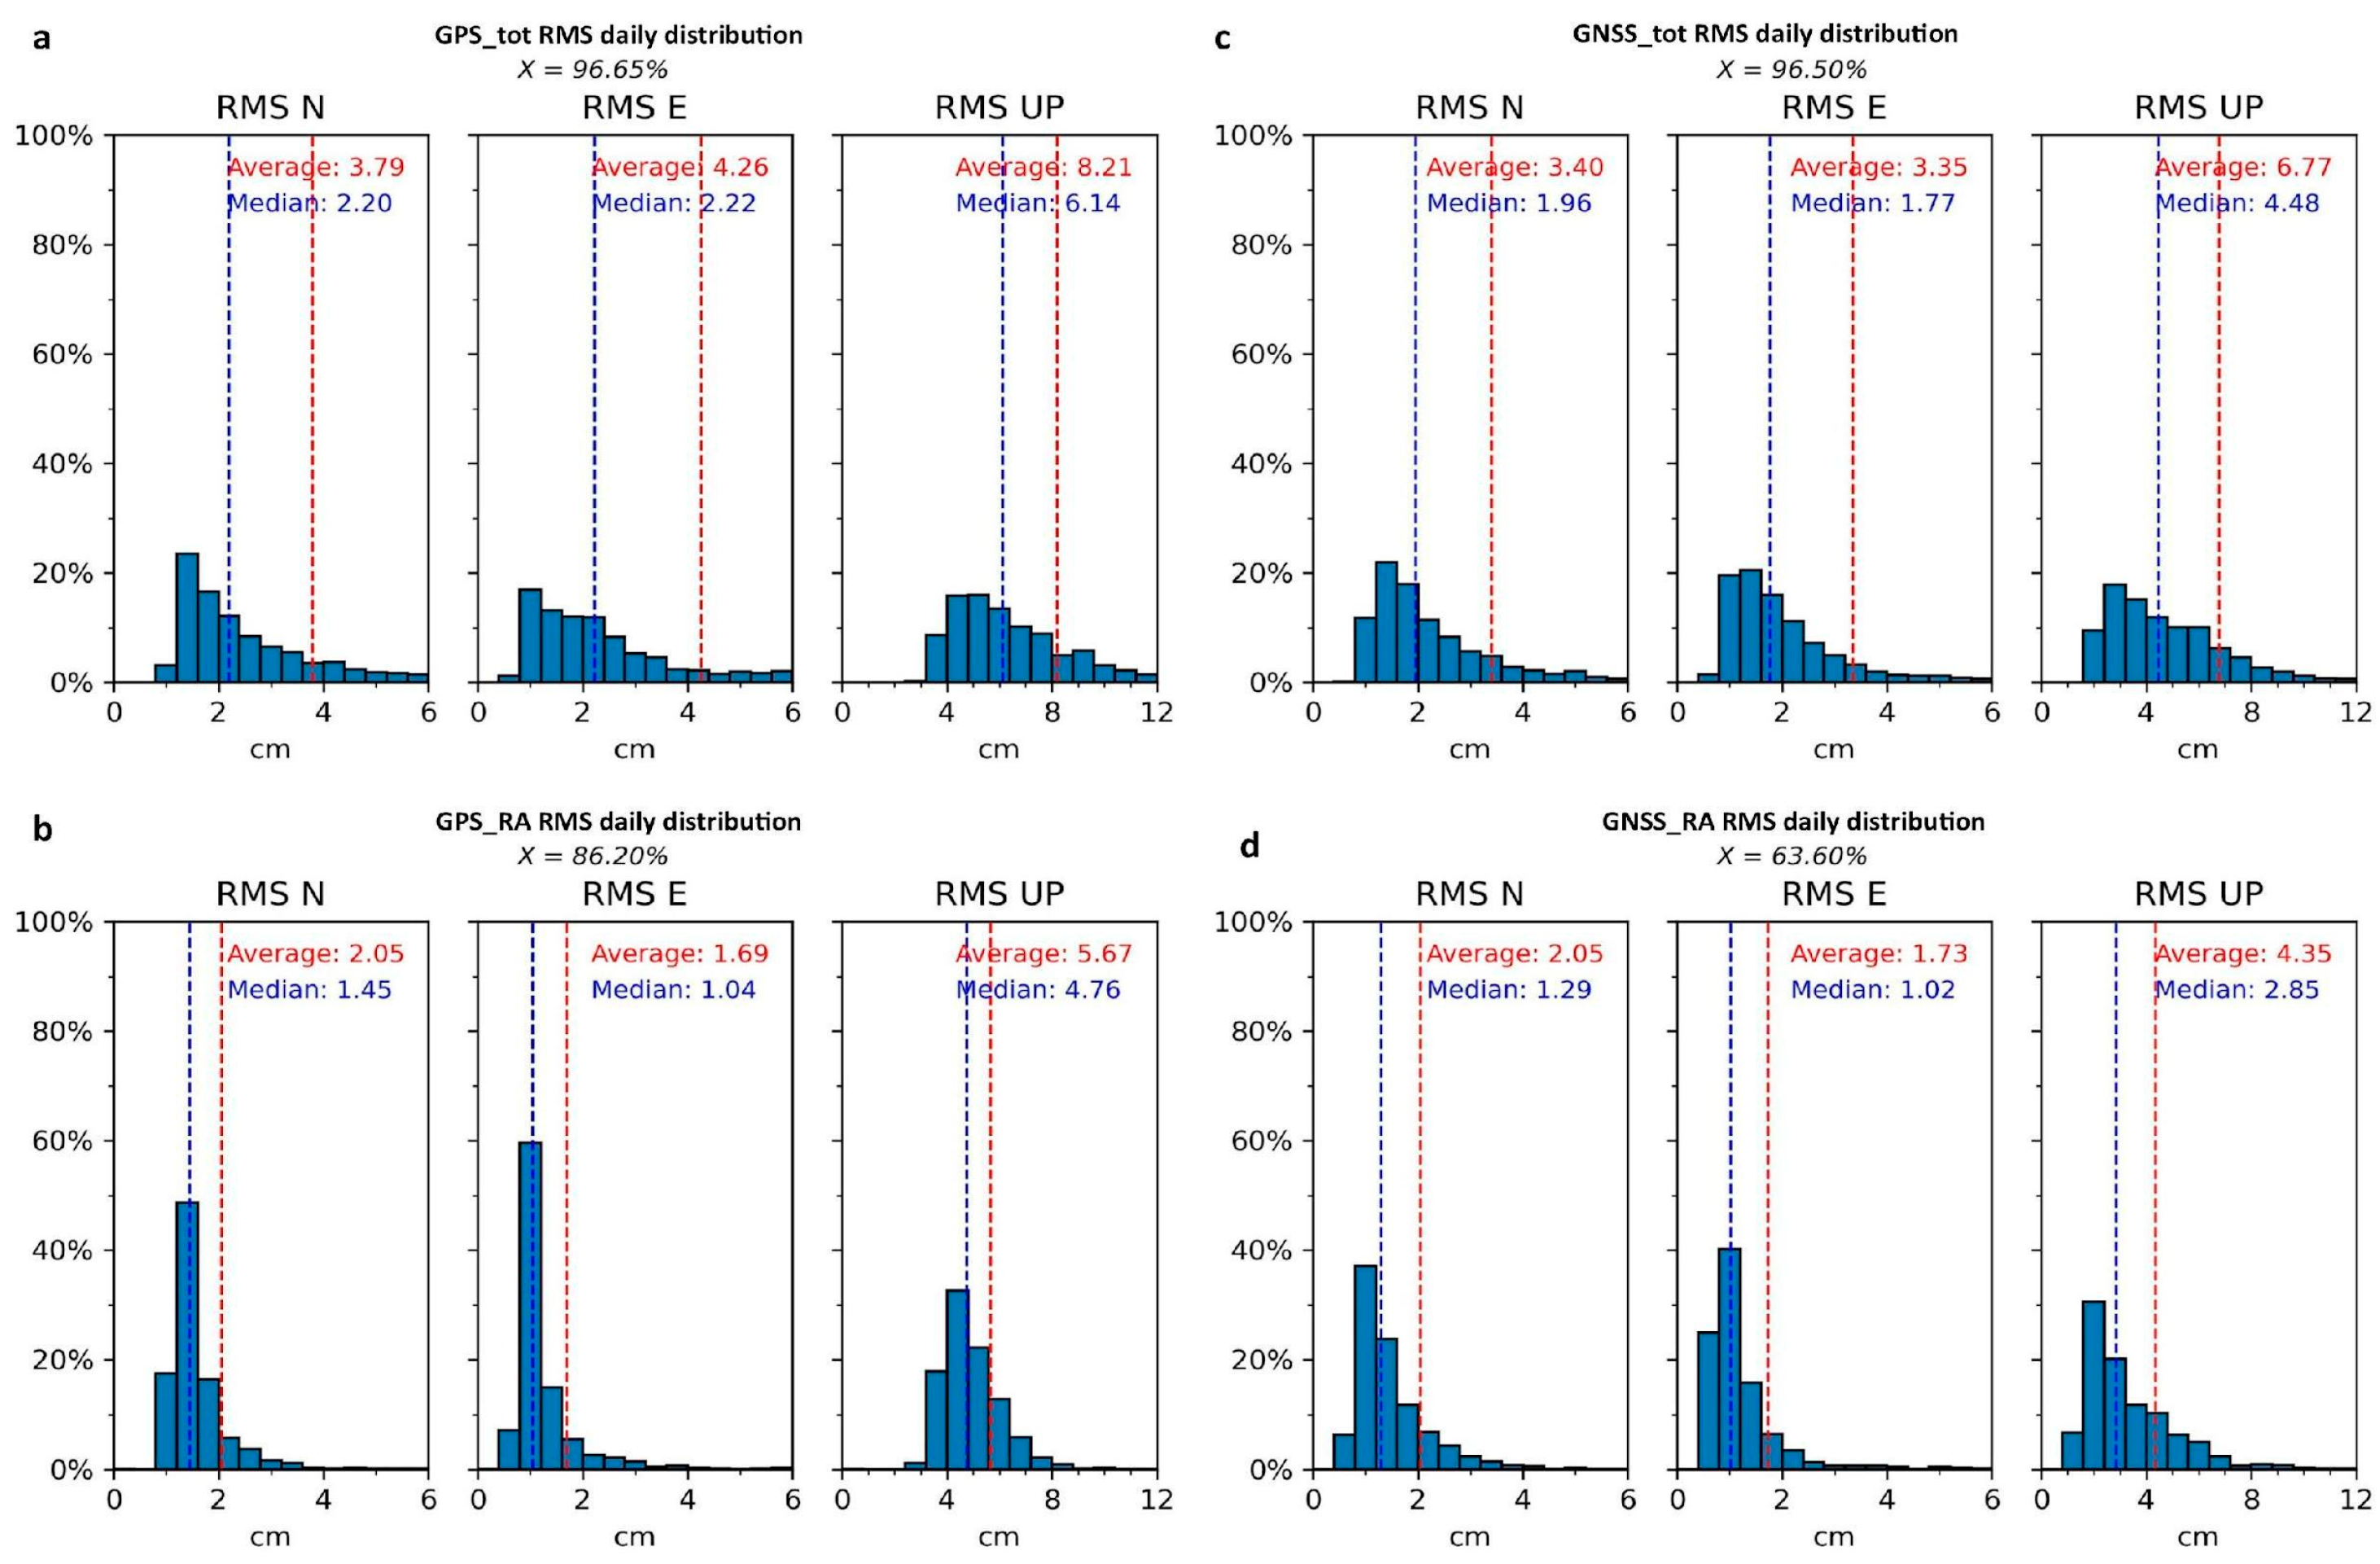
The RMS values obtained with the “Daily RMS approach” are illustrated in Figure 4, which consists of four subplots showing an example of the daily RMS values computed for all the analyzed RING sites (see Figure 1) and for the following different datasets: Figure 4a, the GPS time series for all the available epochs sampled at 1 Hz, including both PPP and PPP-RA solutions; Figure 4b, the GPS time series sampled at 1 Hz considering only higher-accuracy PPP-RA solutions; Figure 4c, the GNSS the time series sampled at 1 Hz for all the available epochs, including both PPP and PPP-RA solutions; and Figure 4d, the GNSS time series sampled at 1 Hz considering only higher-accuracy PPP-RA solutions. Below each subplot, we have included a graph quantifying the completeness of the considered time series. The graphs in Figure 4a,c show the percentage of the epochs with any available solutions with respect to the expected ones (i.e., 86,400 for a 24 h solution); meanwhile, graphs in Figure 4b,d show the percentage of the epochs with available PPP-RA solutions with respect to the expected (i.e., total) epochs. All the solutions in Figure 4 are for 24 January 2024, and blue, red, and green markers correspond to values for the North, East, and Up components, respectively. As expected, the vertical component is systematically (two to three times) noisier than the horizontal ones, as the Up component is often affected by tropospheric and ionospheric residuals during the analysis. The GPS solution (Figure 4a) shows average accuracies of 2.22, 2.70, and 6.69 cm for the North, East, and Up components, respectively. By applying the Regional Augmentation (PPP-RA) in the GPS solution (Figure 4b), we were able to largely improve the average accuracies: 36% for North (1.42 cm), 54% for East (1.23 cm), and 18% for Up (5.46 cm). A further significant improvement is clearly visible in the full GNSS solutions (Figure 4c,d). Considering all the presented solutions, it is important to underline that there is no clear correlation between daily RMS values and their completeness.
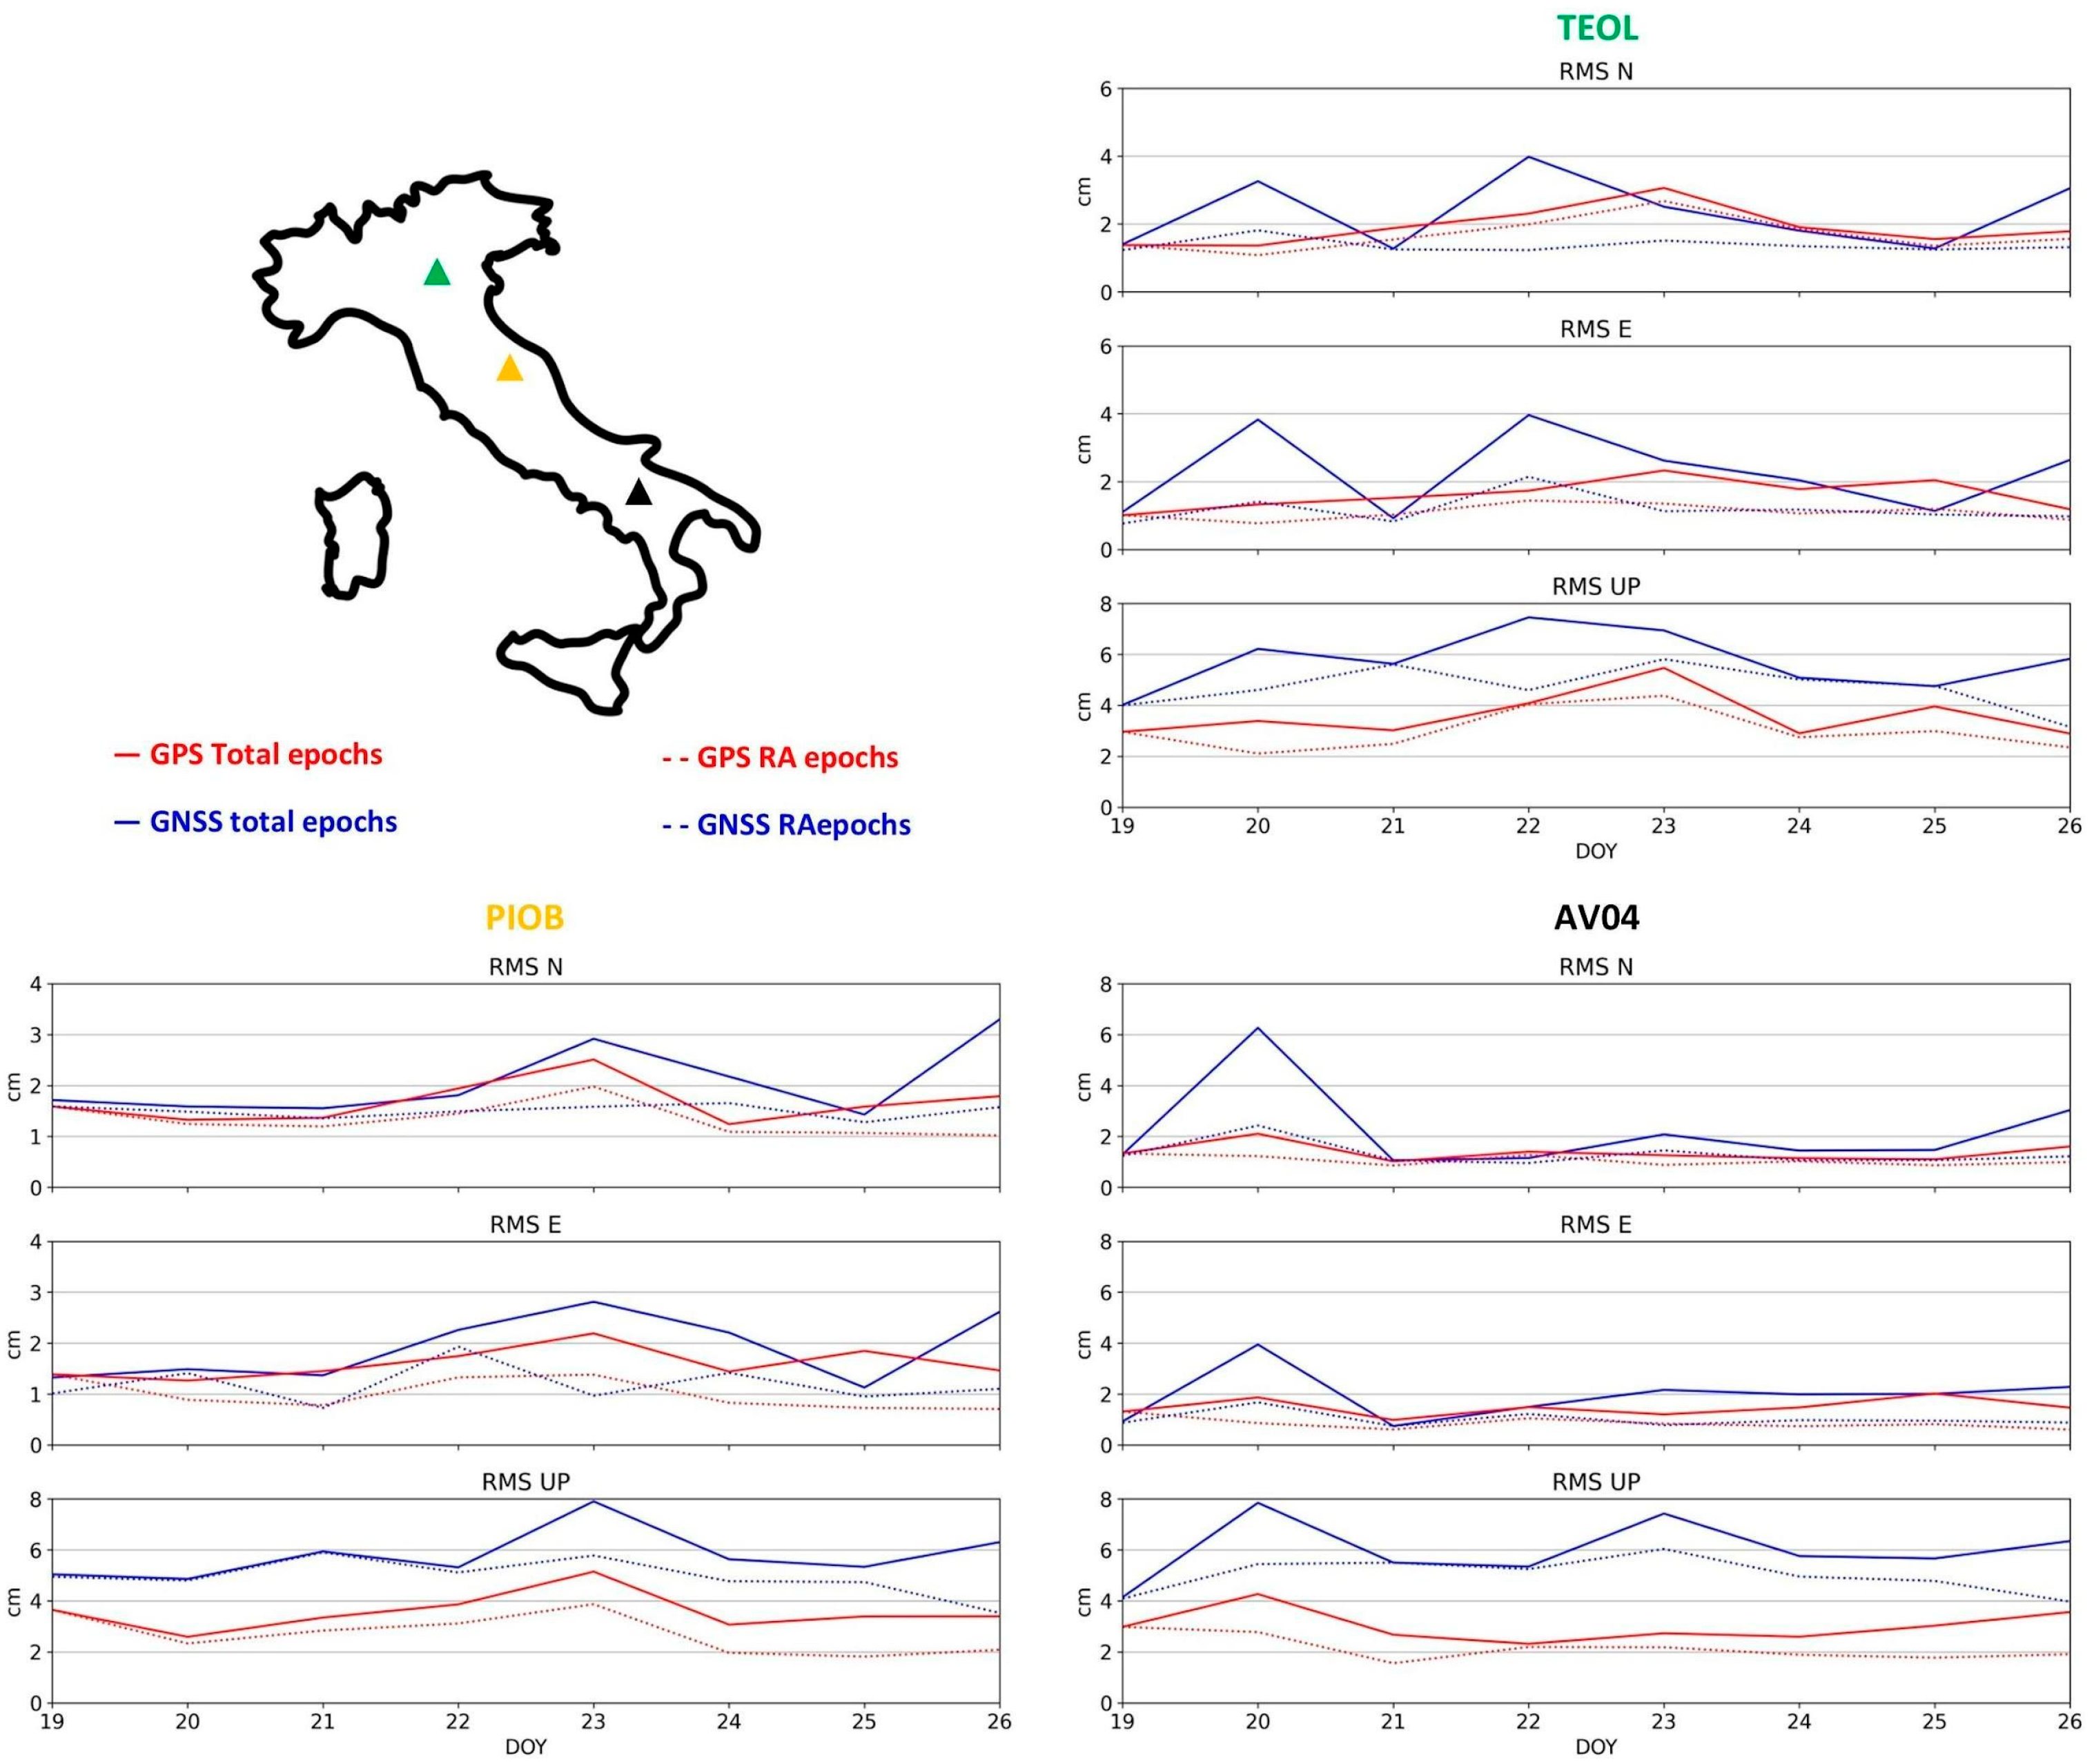
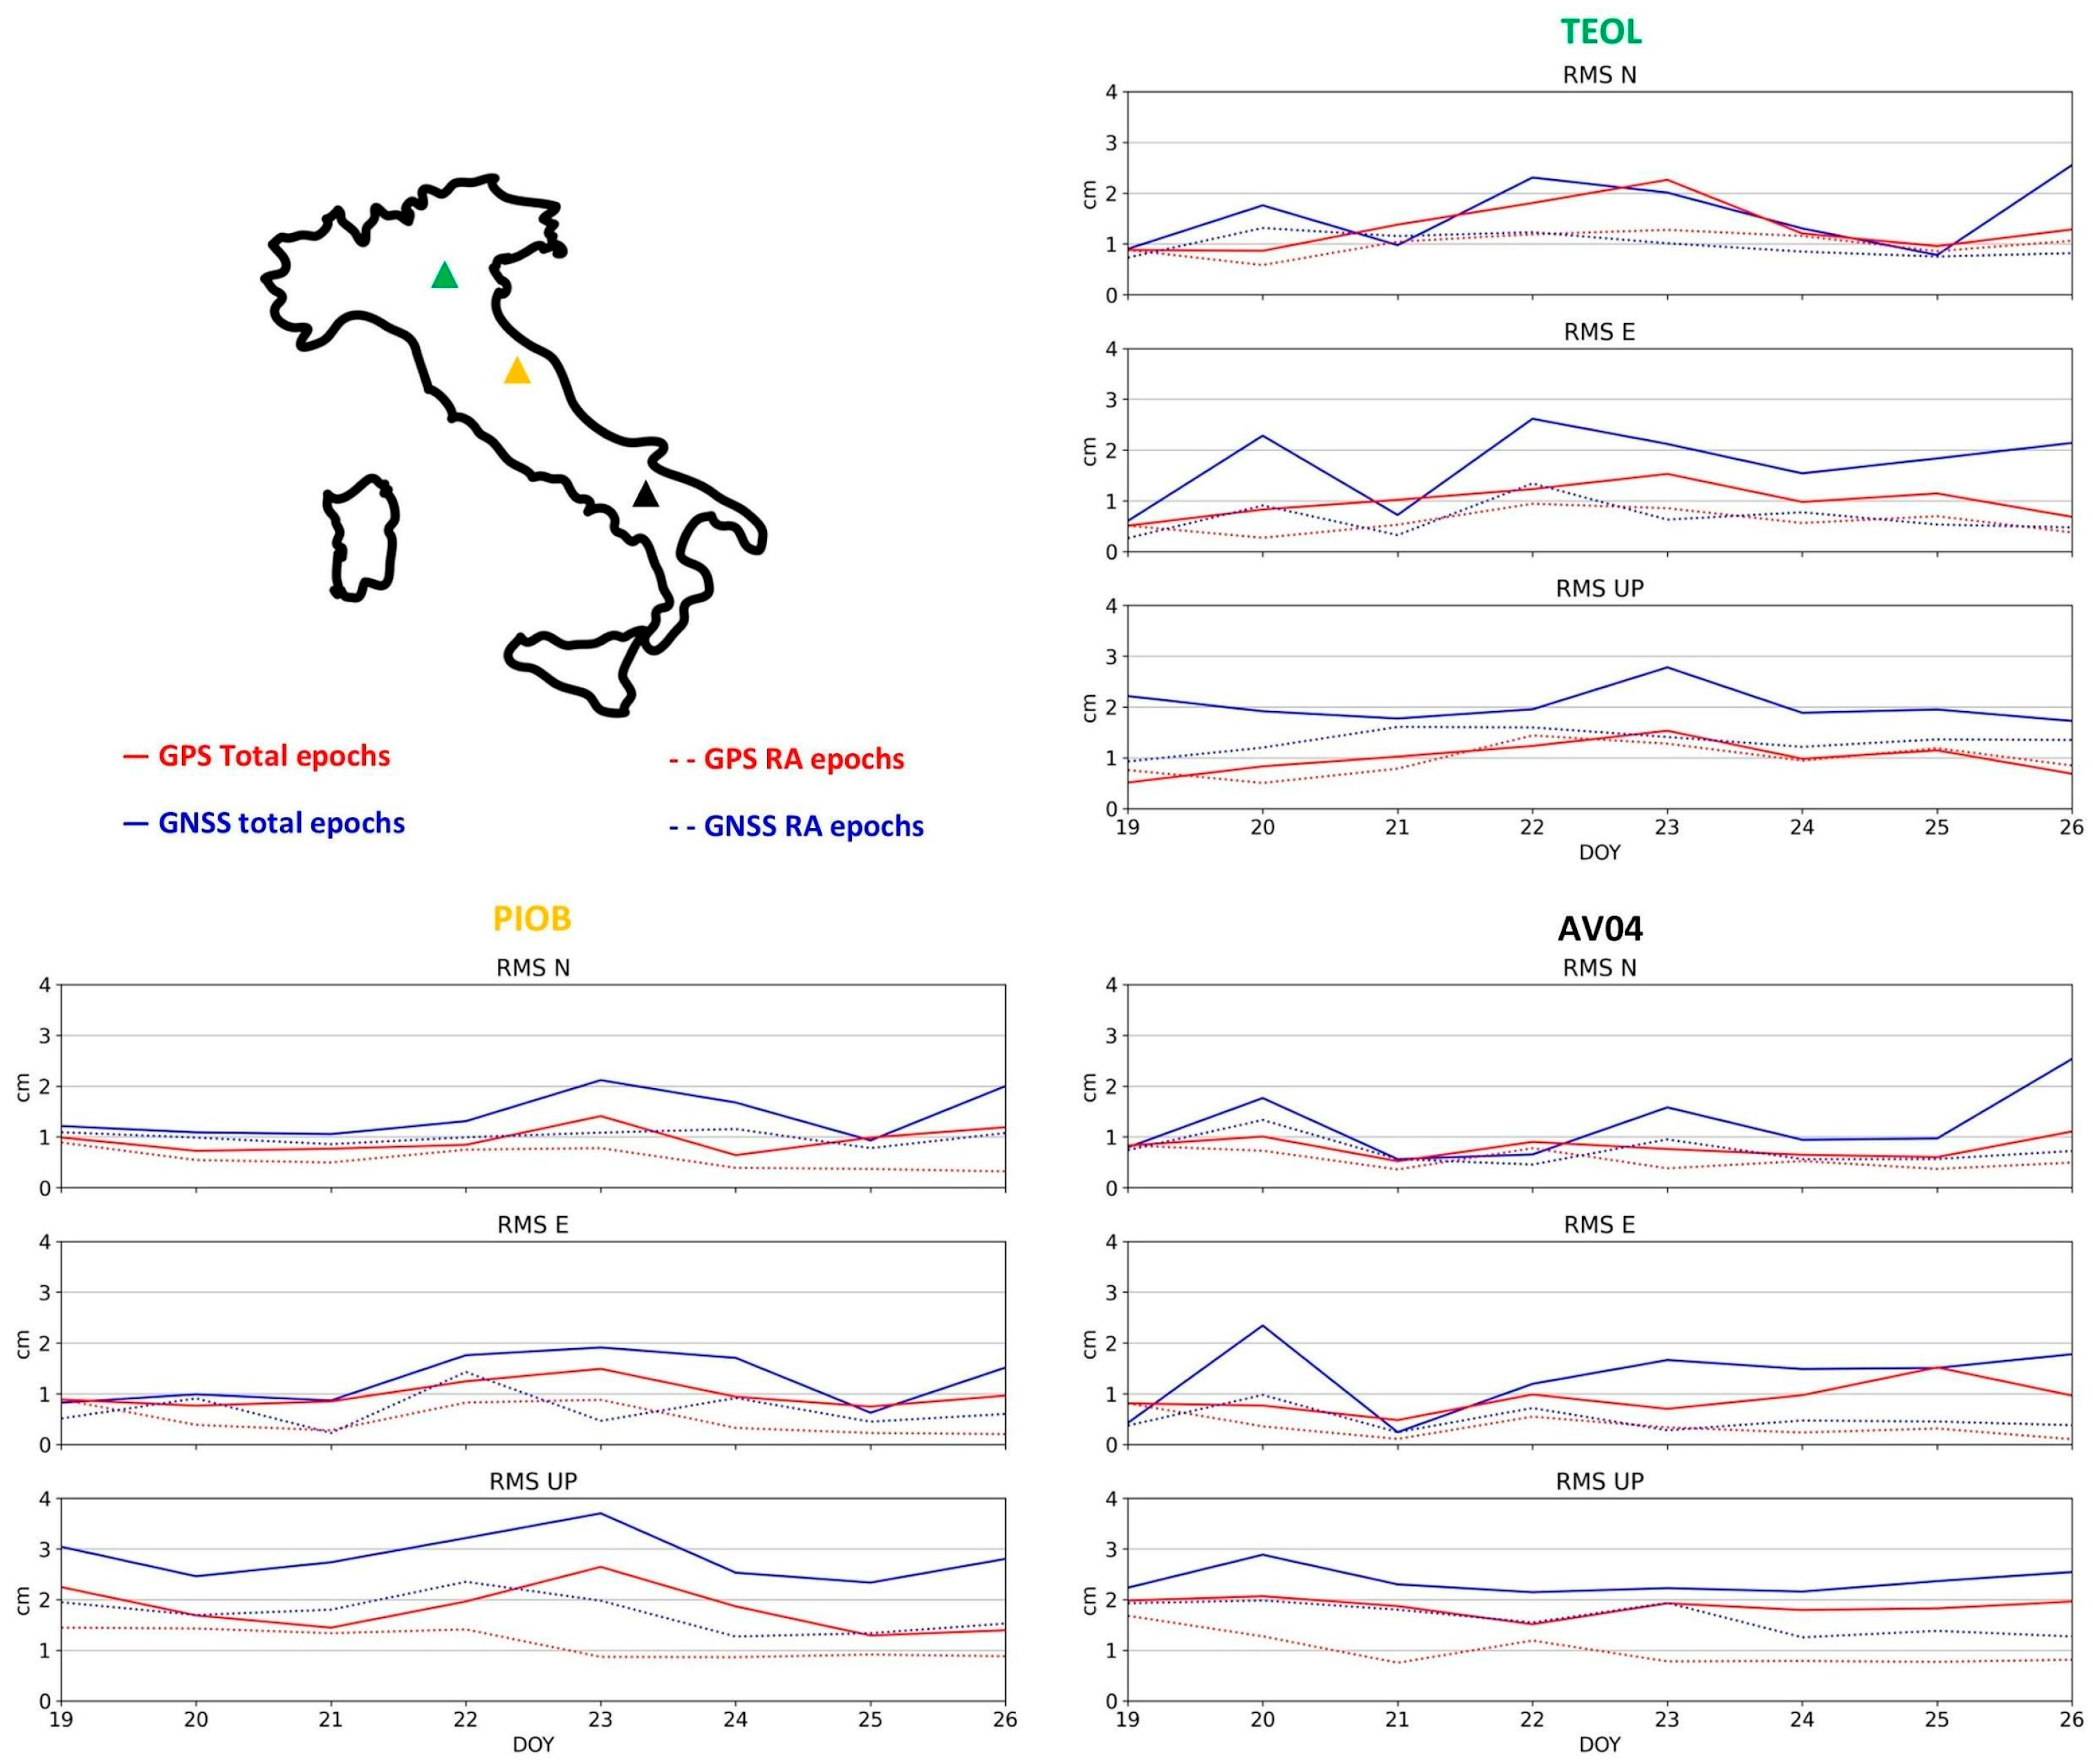
The full GNSS solution, including the standard PPP strategy (Figure 4c), exhibited accuracies of 1.58, 1.64, and 3.74 cm for North, East, and Up components, respectively, whereas the full GNSS PPP-RA solution (Figure 4d) exhibited uncertainties of 1.32 cm, 0.97 cm, and 2.97 cm for North, East, and Up, respectively. Comparable accuracies were generally observed for the same types of solutions in the whole dataset. In Figure 4, the time series of the daily RMS values are shown for some examples of sites, spanning all measurement days. The sites are TEOL, PIOB, and AV04, whose locations are shown in the map in Figure 5.
For these sites, the RMS values calculated considering all acquired epochs are significantly higher than those obtained when RA epochs are estimated, for both the GPS-only and GNSS datasets. Improvements are especially appreciable in the vertical component. The advantages of RA products are more evident in the time series for each station, shown in Figure 5, where the dotted lines representing RMS values for RA-only epochs are consistently lower than the solid lines (i.e., RMSs for all epochs). For the horizontal components, the dotted lines are more stable, with values below 2 cm in both the GPS-only and GNSS configurations, while for the vertical component, the enhancement due to RA is substantial, leading to RMS values below 4 cm, particularly with GNSS products.
The frequency distribution of the North (N), East (E), and Up (UP) components over the entire analyzed period is shown in Figure 6.
As can be seen, compared with the median RMS of the total epochs for all three components, the PPP-RA products have lower median RMS values for the N, E, and UP components than the PPP ones. The histograms also depict decreasing average values for all three components. For the GPS-only dataset, the RMS is generally higher, and the difference in median and average values between the histogram that includes all epochs and the one that considers only those with RA is more marked.

3.2. Sub-Daily RMS

We calculated RMS values by splitting the full 24 h daily observations into 300 s sliding windows with a 150 shift period, resulting in 576 sub-daily samples for each acquisition day. The differences between the GPS-only and GNSS datasets were also analyzed.
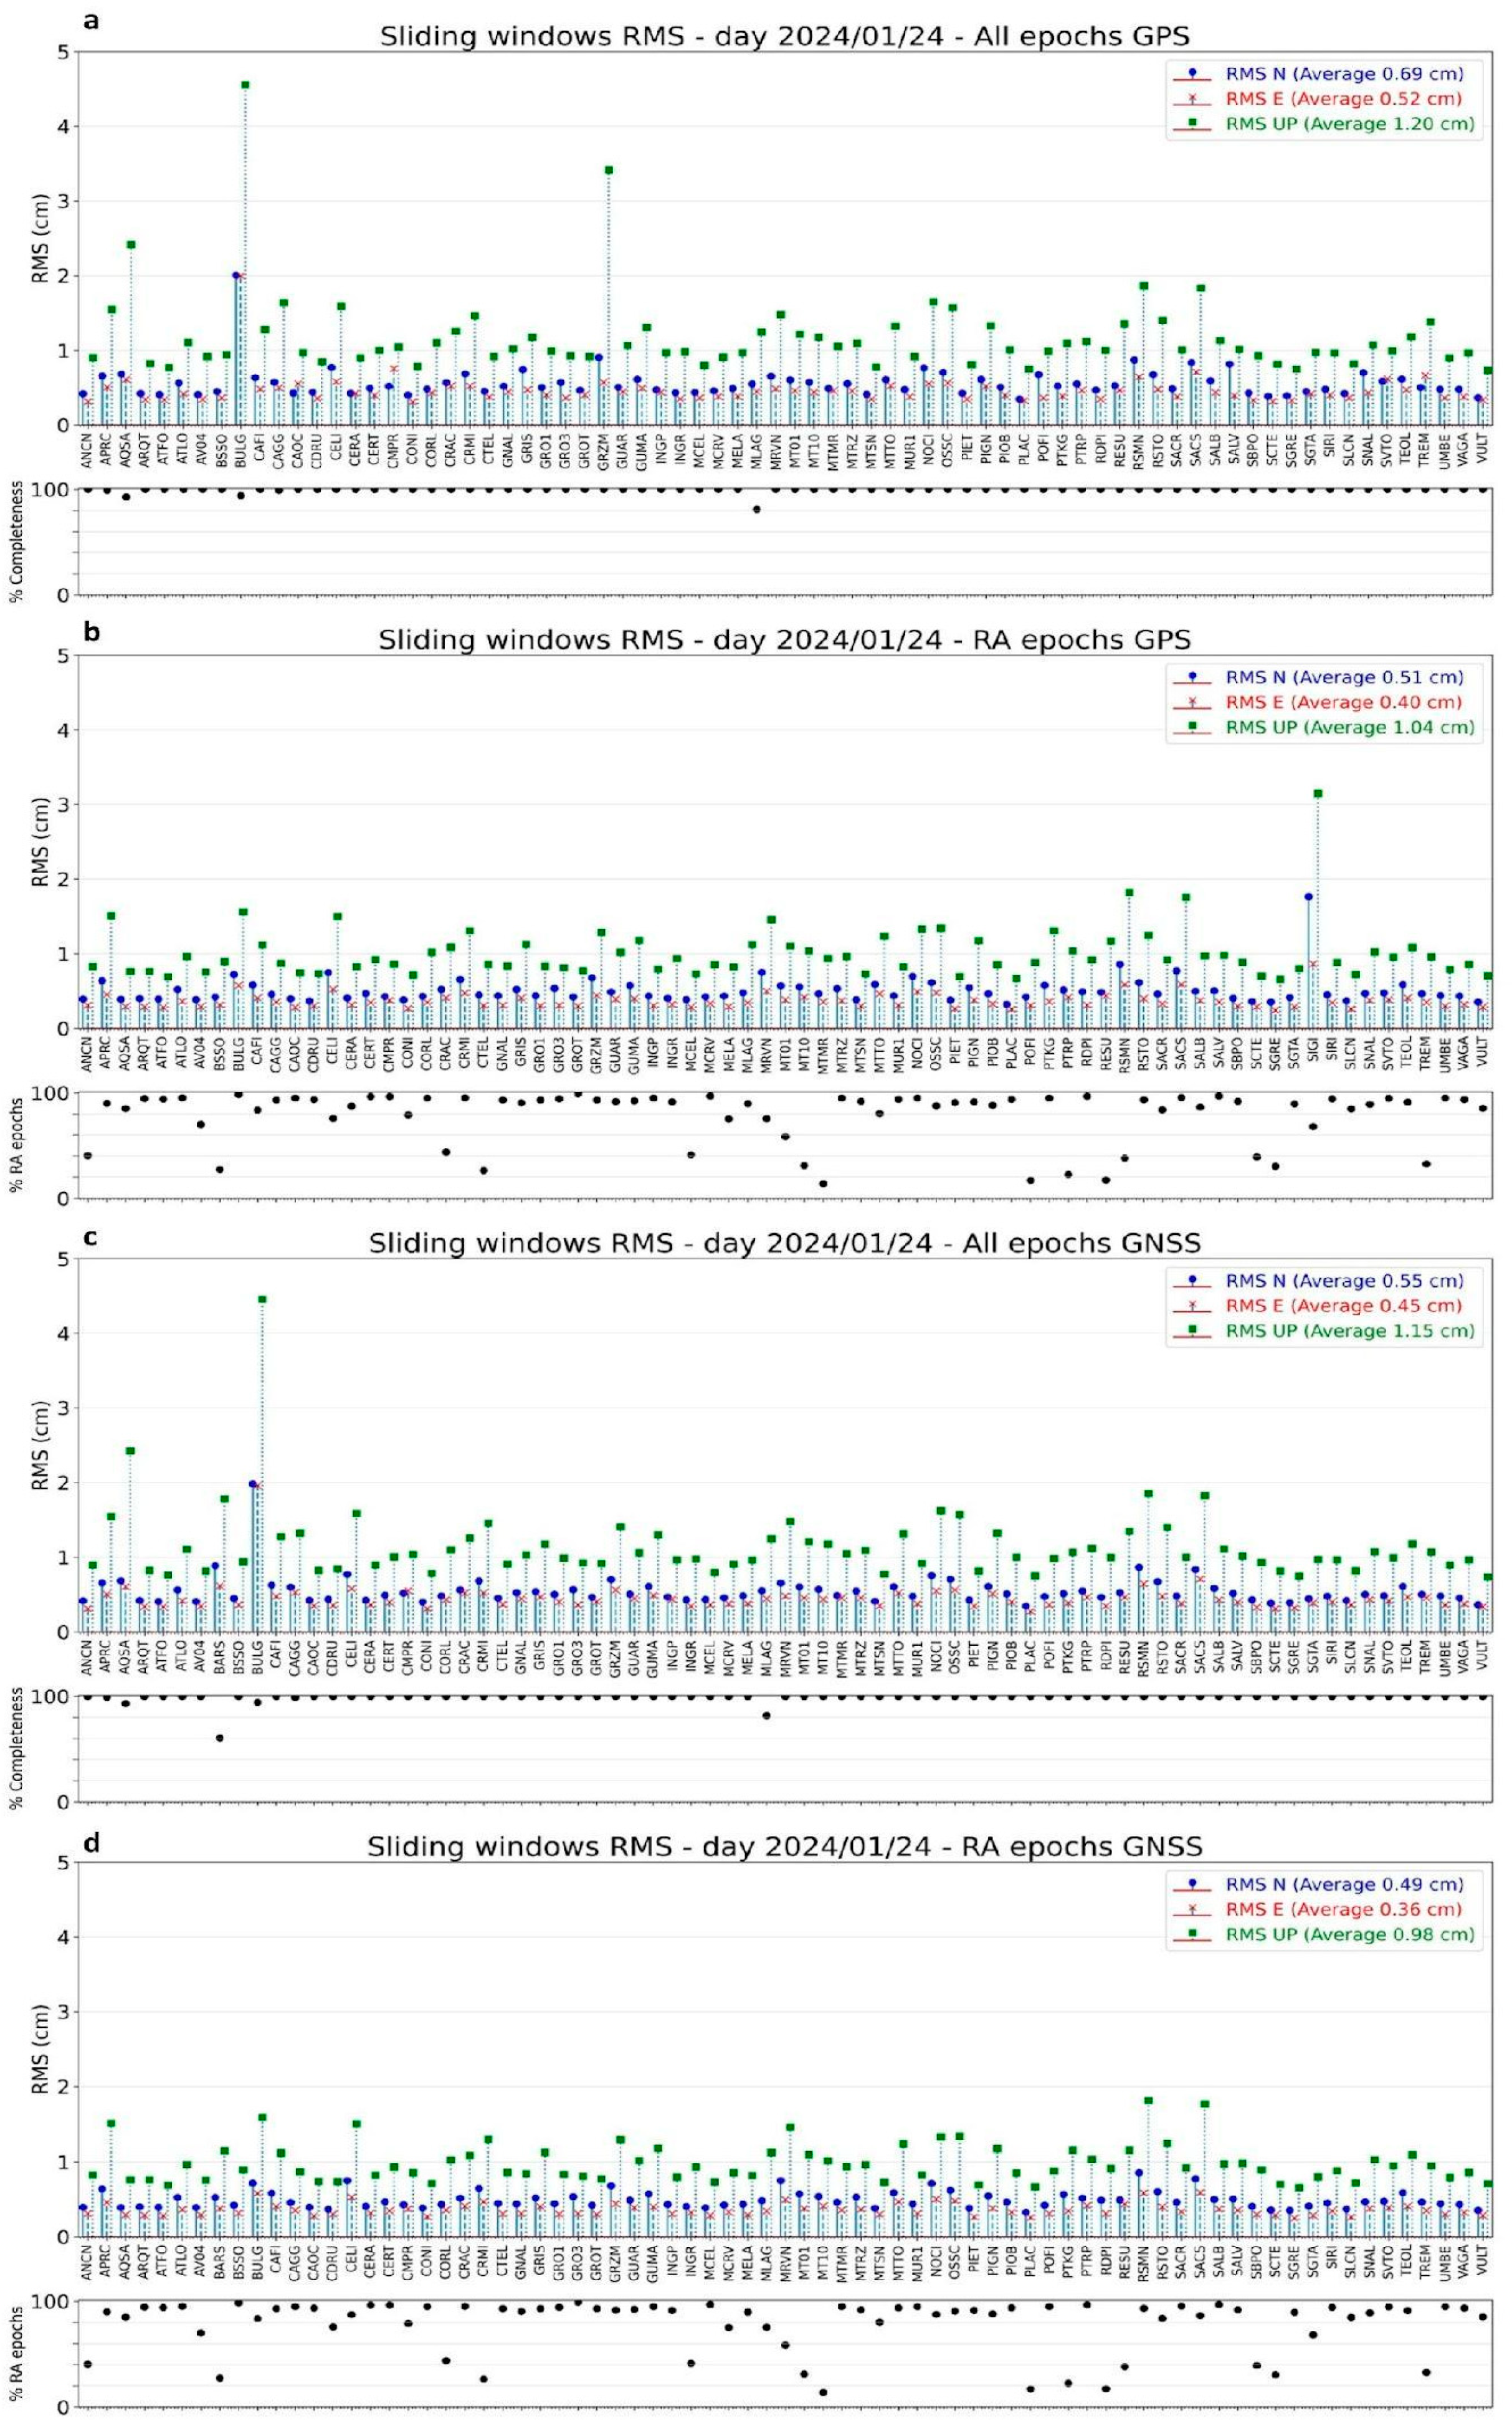
Figure 7 shows the data for all stations of the network on 24 January 2024, as in Figure 4. As can be clearly seen, the short-term analysis using sliding windows yields significantly smaller RMS values than those calculated for the entire day, even when all epochs are considered (Figure 7a,c).
Figure 8 shows the average RMS values computed for the AV04, TEOL, and PIOB stations using the aforementioned sliding windows. Notably, the sliding windows based on RA-only epochs (blue and red dotted lines) demonstrate sub-centimeter accuracy, even for the vertical component in the GNSS RA datasets. However, the GPS-only products also exhibit sub-centimeter RMS values, particularly for the horizontal components.
The histograms of the RMS for the three components of the GPS-only dataset are shown in Figure 9a,b, considering all epochs and only those with RA, respectively. All distributions are characterized by sub-centimeter average and median values for the horizontal components and values close to 1 cm for the vertical component.
In the distribution shown in Figure 9a, RMS values are concentrated in the 0–2 cm interval, with a median value of 0.50 cm and 0.41 cm for the North and East components, respectively. For the vertical component, the histogram shows a dense distribution of values within the 0–4 cm range, with a median value of 1.06 cm. When considering only the GPS epochs with RA (Figure 9b), a general leftward shift is observed, with median values of 0.46 cm for the North component, 0.39 cm for the East component, and 1.08 cm for the vertical component.
The distribution of RMS values for the GNSS dataset is shown in Figure 9c,d. As expected, these values calculated within the selected sliding windows using full GNSS solutions are lower than those for the GPS-only dataset. The most favorable results are shown in Figure 9d, which corresponds to the GNSS solution with the Regional Augmentation. The median values are 0.41 cm for the North component, 0.32 cm for the East component, and 0.82 cm for the vertical component.

3.3. RING Network Overview

Finally, to evaluate the performance of the RING network, it is crucial to identify the stations that demonstrate optimal performance and reliability. In this study, the average daily RMS was selected from different parameters for this purpose. Classification was based on daily values for both the GPS-only and full GNSS datasets, as illustrated by the statistics shown in Figure 4, for example. Furthermore, we compared both GPS-only and full GNSS solutions via a short-term accuracy analysis (sliding windows) considering all the epochs acquired.
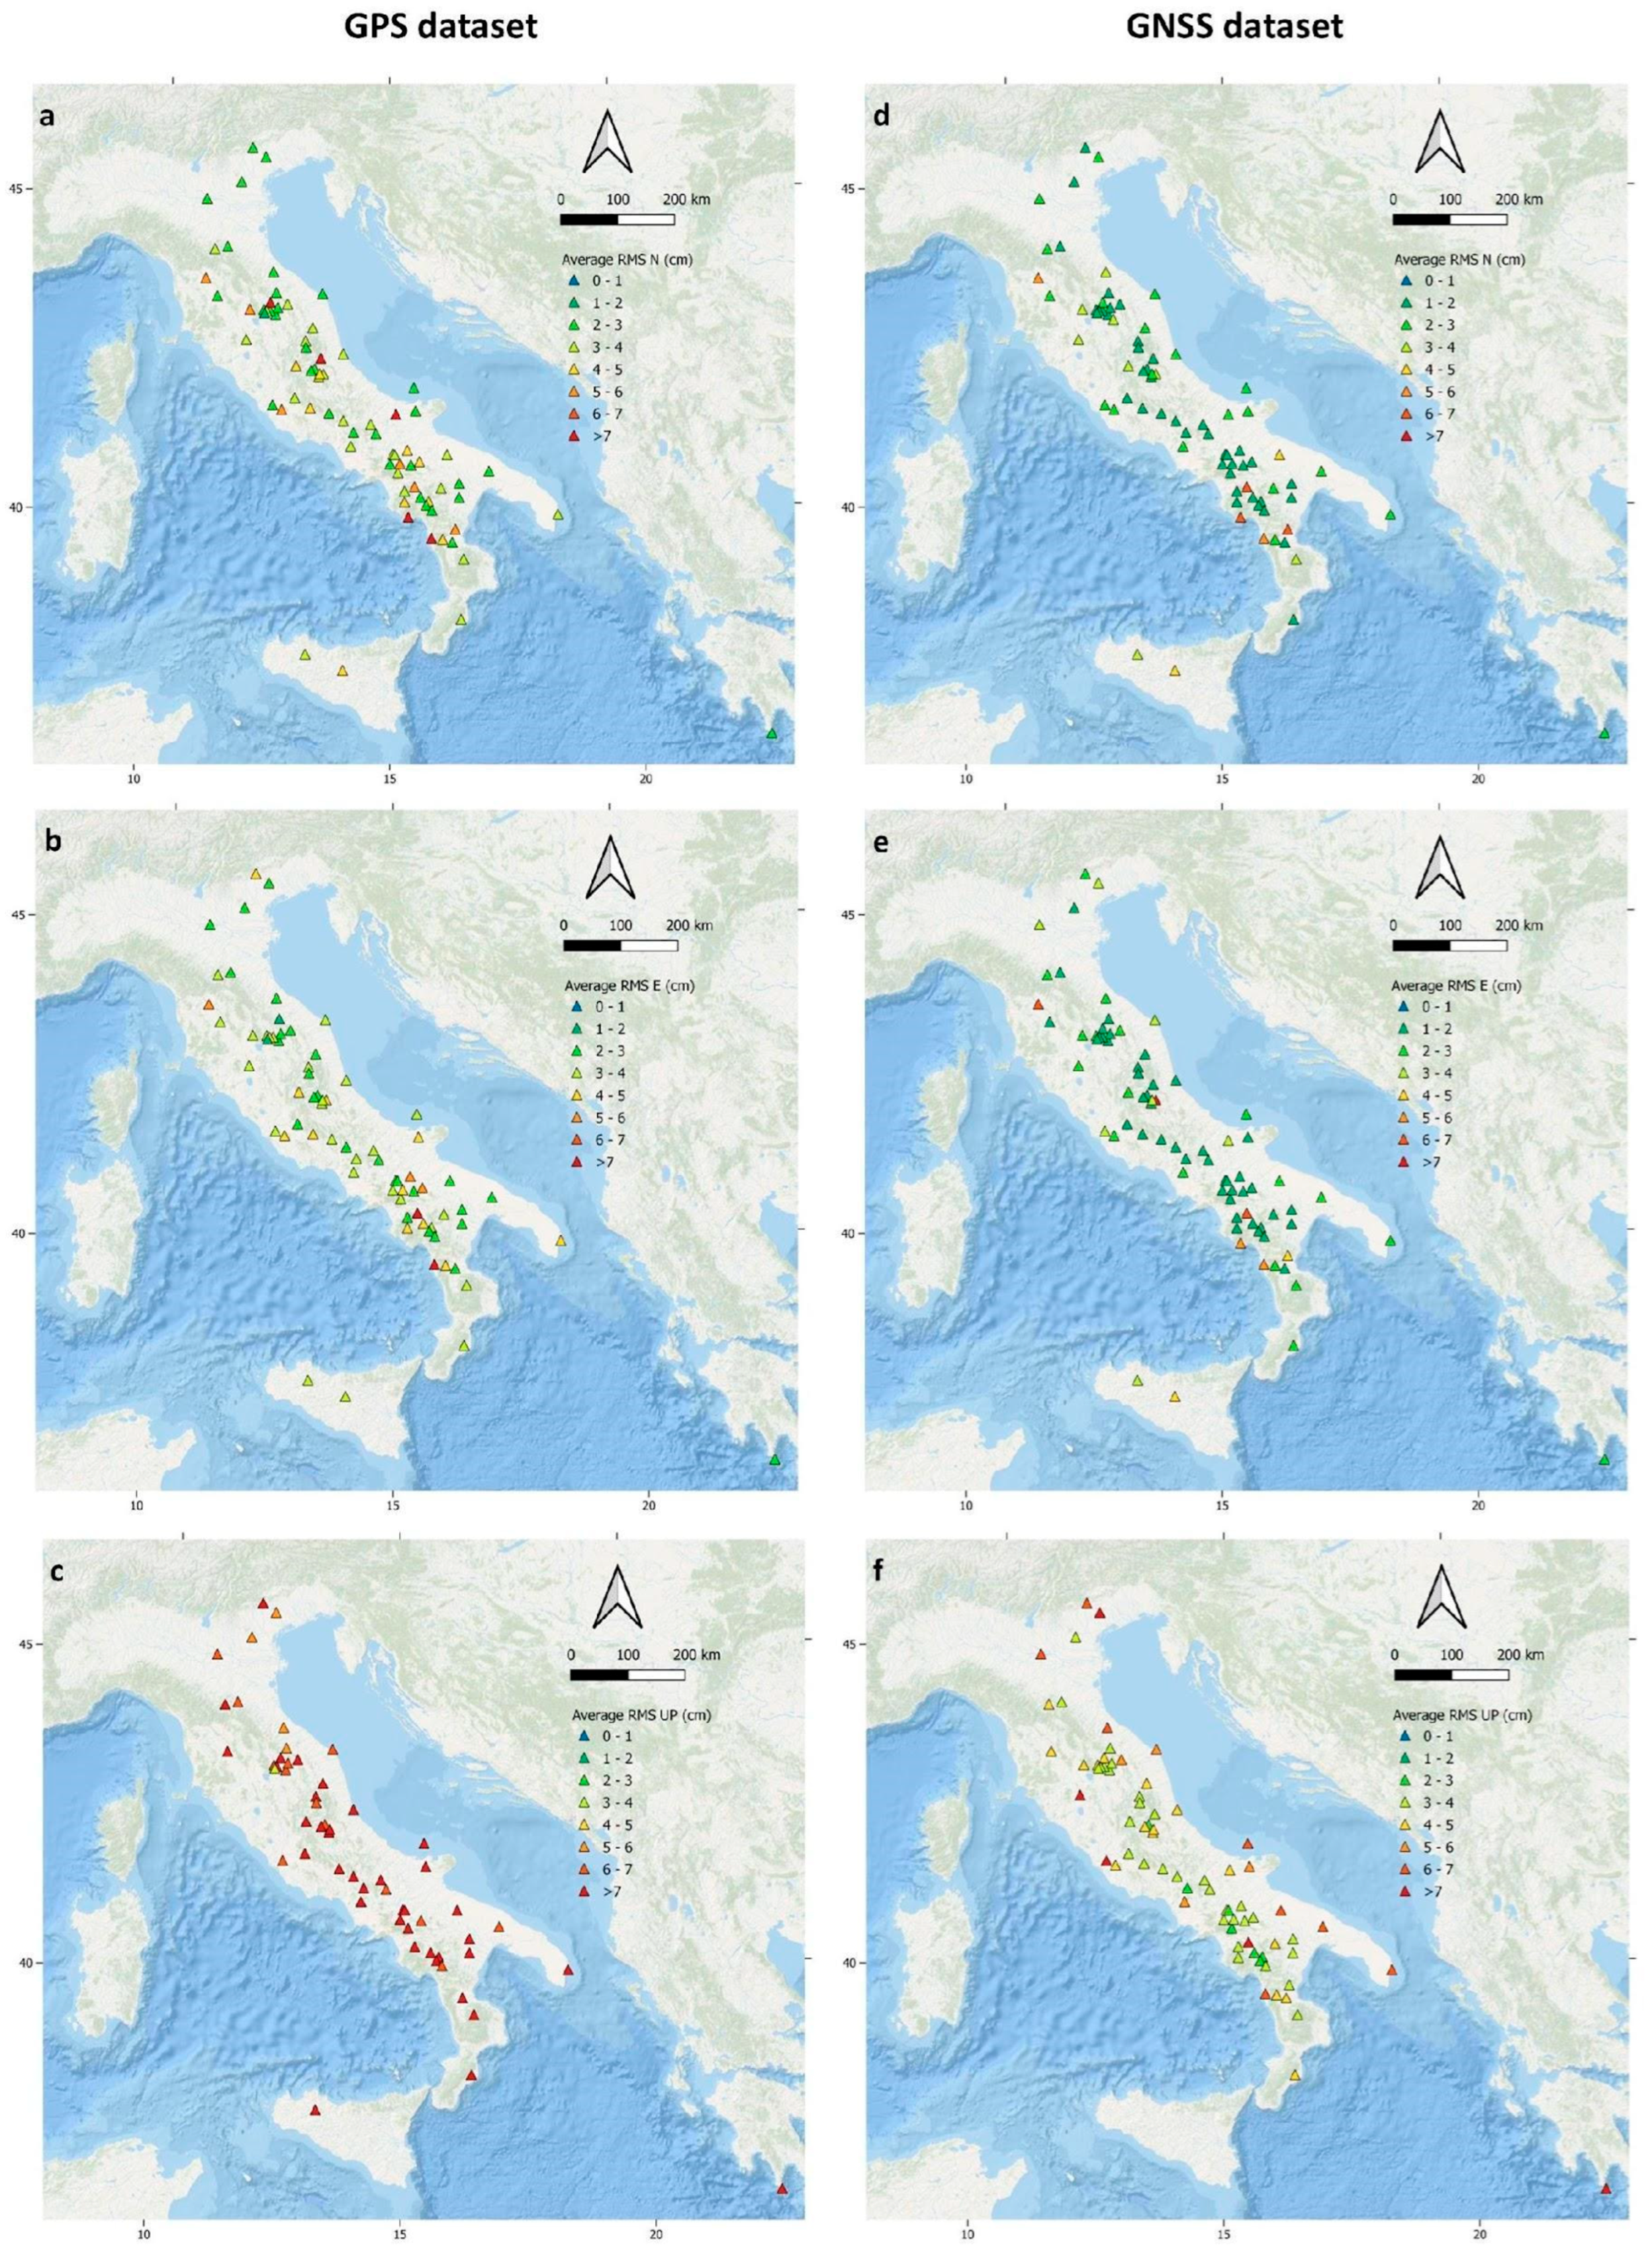
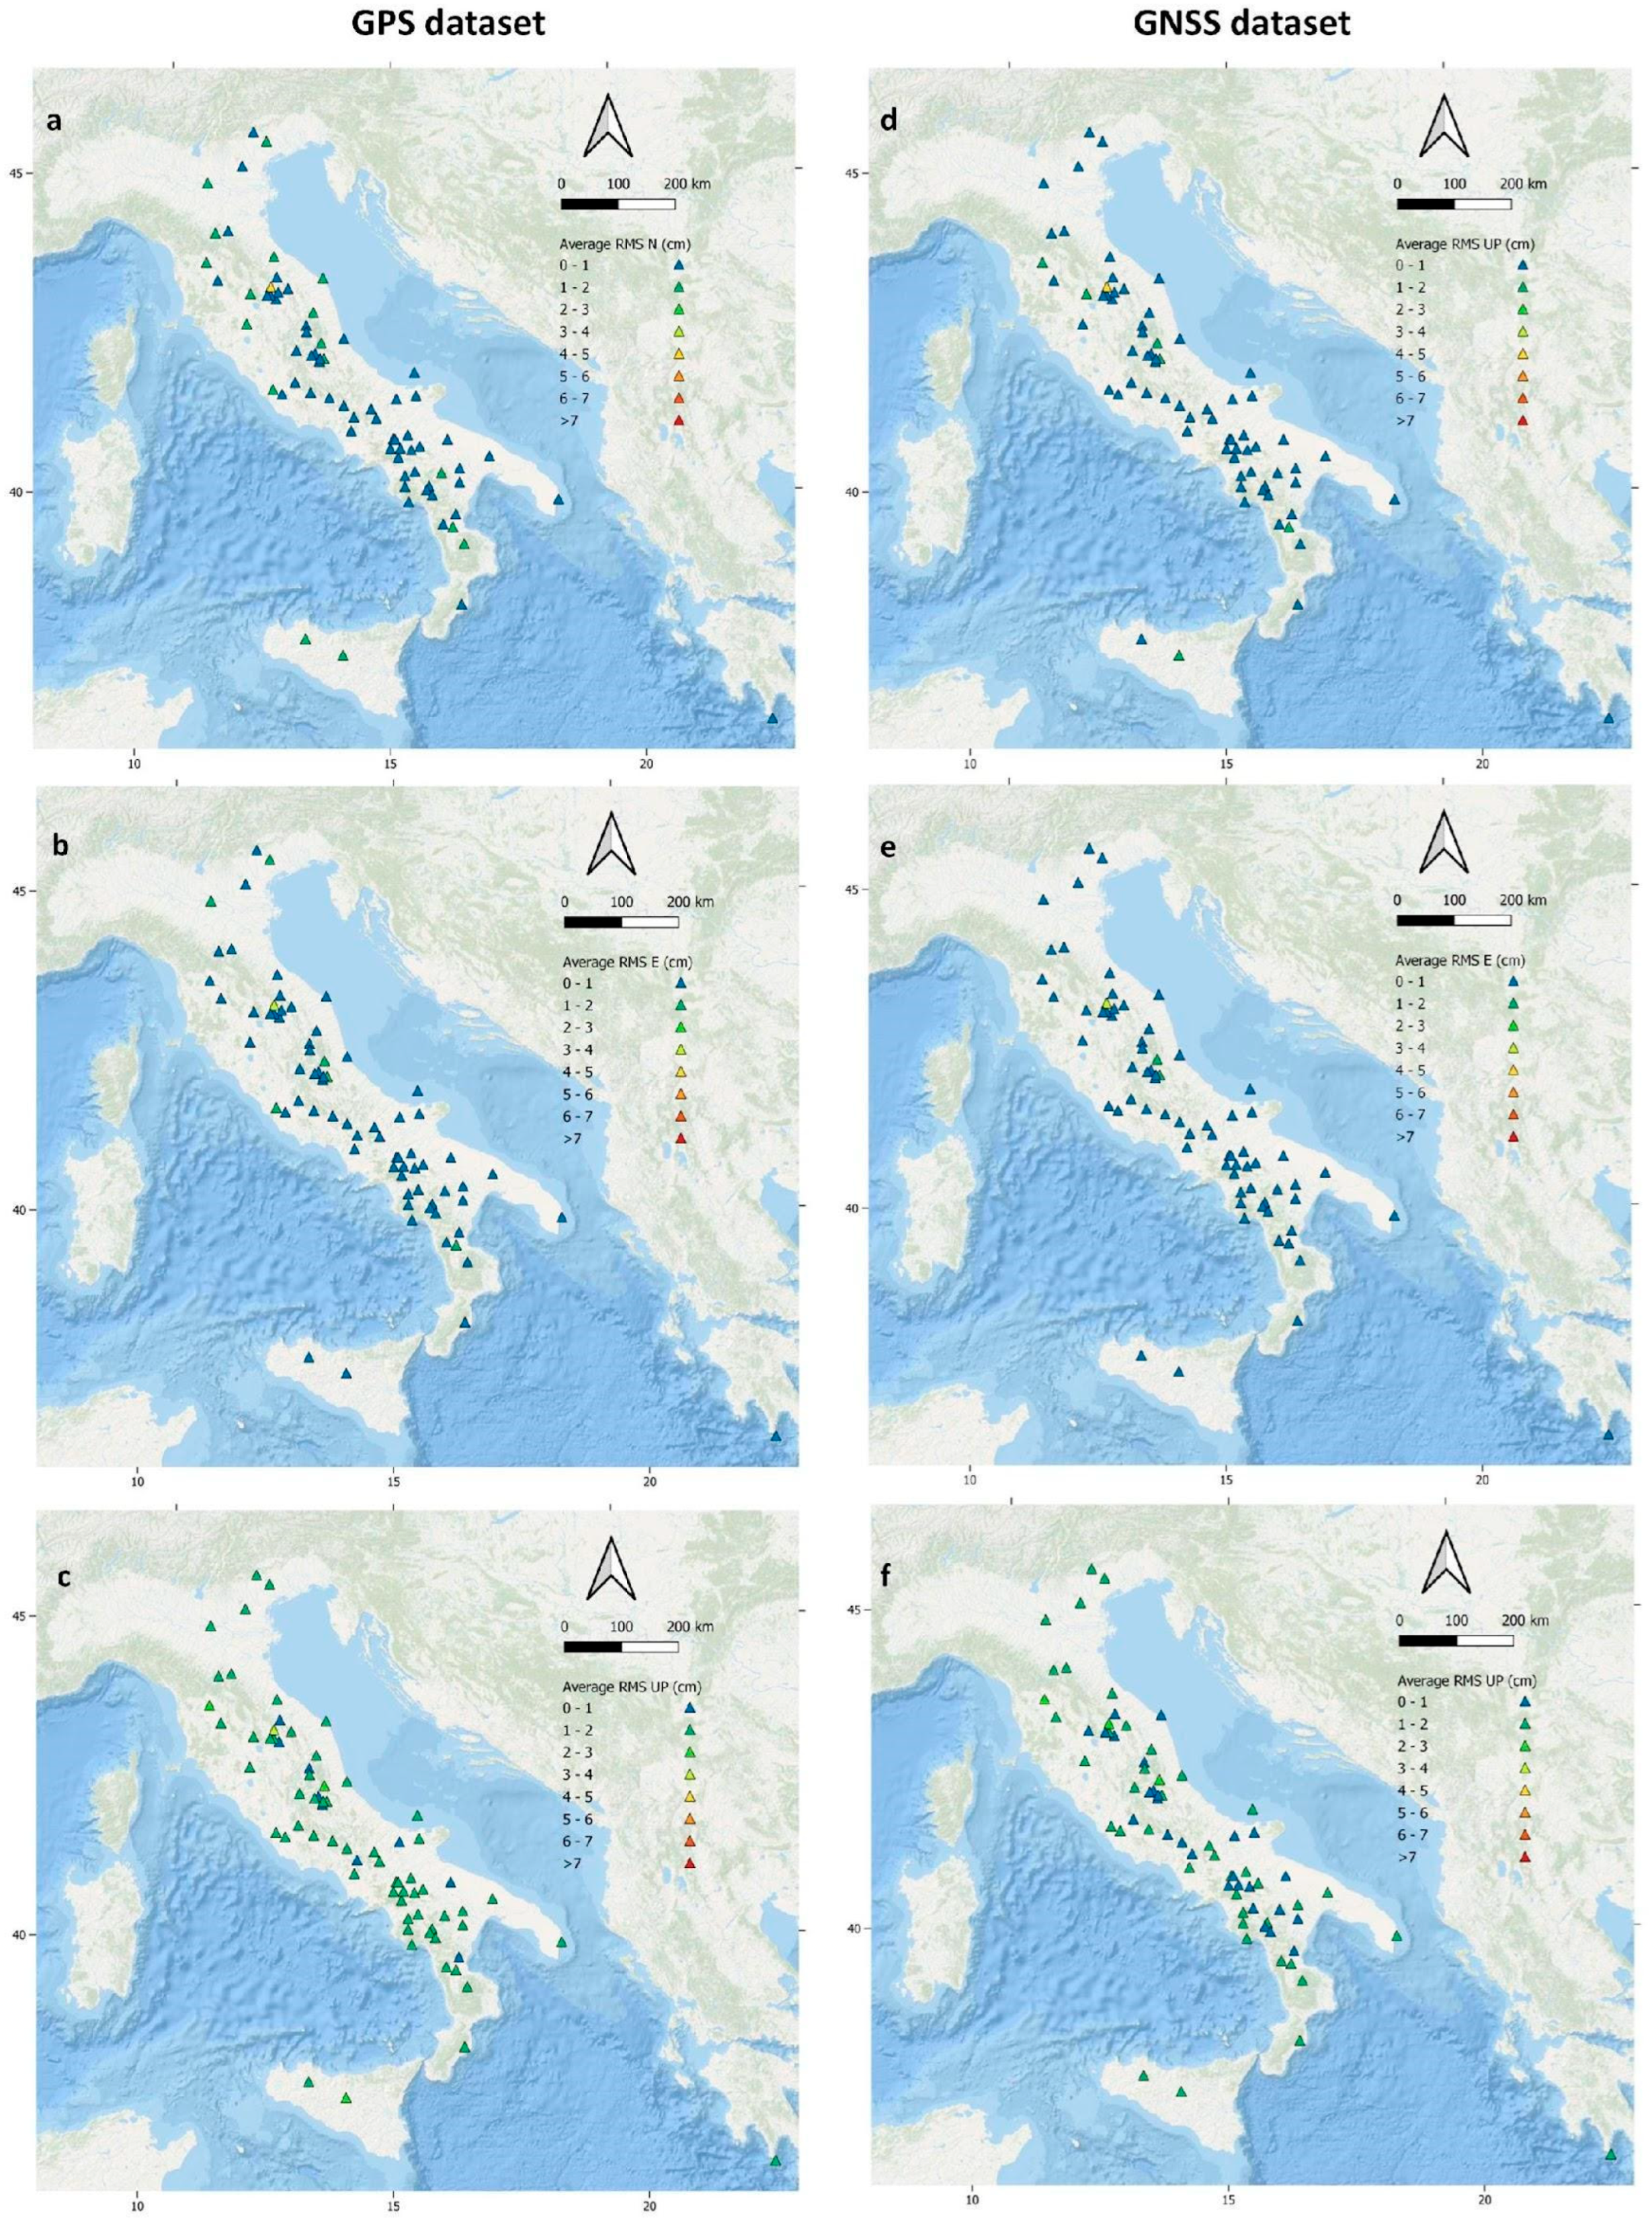
The maps in Figure 10 depict the spatial distribution of the analyzed RING stations for both the GPS-only and full GNSS datasets, classified according to the average RMS values for each component.
For the horizontal components (Figure 10a,b,d,e), most RING stations are represented by green and yellow markers, indicating an average RMS of less than 5 cm. However, some stations display significantly higher RMS values (>5 cm), particularly in the GPS-only dataset (Figure 10a,b, orange and red triangles). In contrast, the average vertical RMSs (Figure 10c,f) reveal a different pattern. Specifically, in the GPS-only dataset (Figure 10c), the average value of most stations exceeds 5 cm, as also indicated in the histograms (see Figure 6a). Conversely, in the map in Figure 10f, corresponding to the full GNSS dataset, an overall improvement is observed, with many stations exhibiting average RMSs of just a few centimeters, with the RMSs exceeding 7 cm at only nine stations.
The comparison between the two datasets clearly underscores the improvements achieved with a full GNSS configuration. This is further illustrated in Figure 11, which shows the spatial distribution of the average RMS, calculated using the sliding windows approach. The maps highlight significantly different scenarios compared to the daily solution analysis. For both the GPS-only and GNSS datasets, nearly all average RMS values fall within the 0–2 cm range (blue and dark green triangles); the accuracies for the vertical component (Figure 11c,f) are also within this range. Overall, this approach demonstrates the potential to achieve a sub-centimeter RMS resolution.

4. Discussion

This paper presents the first assessment of real-time position time series from the RING network. Positioning was performed using the PPP method, which, unlike network-based solutions, relies solely on data from a single designated station and the precise positions of satellites. In this study, a real-time data analysis was conducted with the RTPPP software at 88 RING stations using two distinct datasets: one based on the GPS only and the other based on full GNSS solutions.
For both daily solution datasets, the application of Regional Augmentation proved effective in enhancing the positioning precision for the North, East, and vertical components, achieving values close to the centimeter level. Overall, the comparison between RMSs of GPS-only and full GNSS datasets showed a general improvement for both horizontal and vertical components employing the latter configuration.
Additionally, we compared GPS-only and full GNSS solutions by performing a short-term accuracy analysis over the entire study period, considering the fact that the main earthquakes in Italy over the past 15 years (Mw 6.3 L’Aquila, 2009; Mw 5.6 and 5.8 Emilia, 2012; Mw 6.0 Amatrice, 2016; and Visso and Norcia, 2016) exhibited dynamic displacements concentrated within just a few tens of seconds [32,50]. Accordingly, accuracy assessments for short time windows are valuable for applications where deformations are concentrated in a very limited temporal window (e.g., detecting co-seismic displacements).
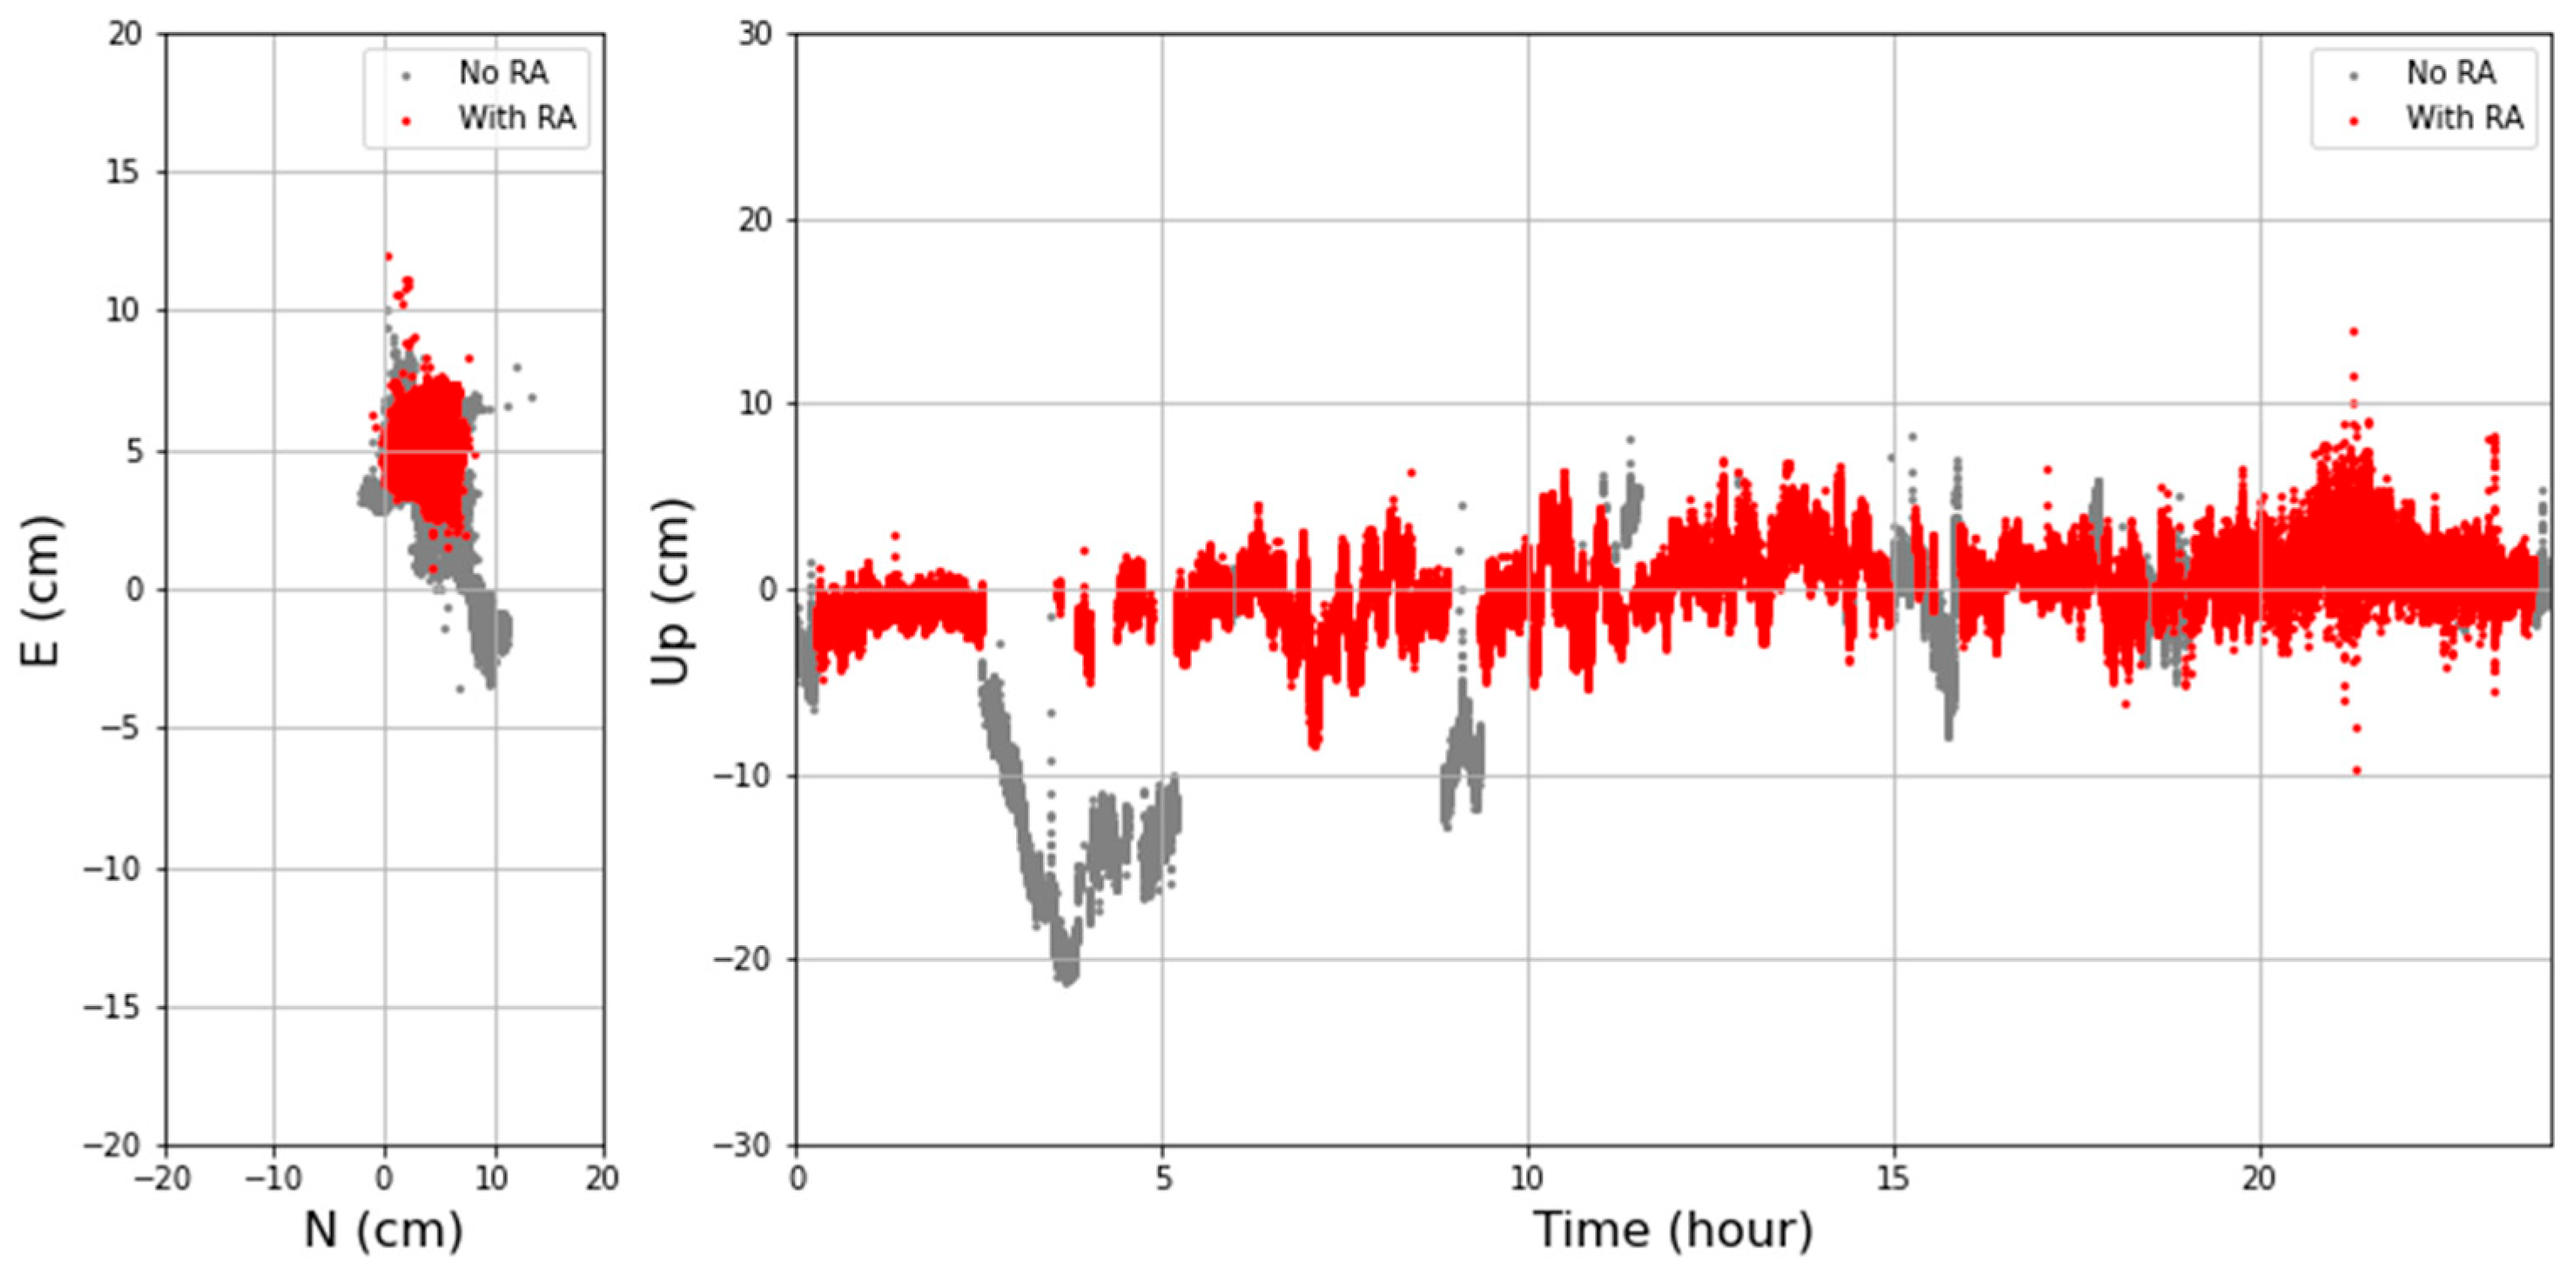
This analysis revealed that sub-centimeter RMS errors can be achieved within short sub-daily windows. The 300 s time windows for full GNSS solutions exhibited median values of 0.41, 0.32, and 0.9 cm for the North, East, and vertical components, respectively. However, the outcomes highlight that a continuous RA contribution is required to ensure stable performance over time; interruptions in the augmentation contribution may lead to degraded and inconsistent solutions (Figure 12). Furthermore, as shown in previous studies, various factors can affect the quality of the products, including instrumental errors, environmental conditions, and site-specific features [51].
To evaluate the performance of the RING network, daily average RMS values were considered to identify the best and worst stations, as well as their spatial distribution. The classification provides robust information, representing a starting point for future studies with the aim of identifying factors that affect data acquisition and transmission, ultimately improving the overall network performance. The results confirm the capability of real-time PPP for rapidly delivering a centimeter-level positioning accuracy. Over the 22-day investigation period, RING stations exhibited accuracies of within a few centimeters, with significant improvements observed for the full GNSS configuration. The current approach relies on a Continuously Operating Reference Station (CORS) network to enable high-accuracy, fast-converging, and real-time positioning for both GPS-only and full GNSS configurations. The locations of the stations, strategically placed along the Apennine chain or the coast, make the RING network a valuable resource for geodetic data supporting EEW and TEW systems, similar to those developed by researchers in other countries, such as the USA, Chile, or Japan.

5. Conclusions

The preliminary results presented in this study demonstrate the effectiveness of the RING network as a research infrastructure for real-time PPP data analysis. The application of Regional Augmentation within the RTPPP environment further enhances the accuracy of real-time products, even when full GNSS configurations are unavailable. However, multi-frequency and multi-GNSS observations can further improve PPP-RA performance, as shown in the network-wide maps. The accuracies achieved, particularly through short-term window analyses, are particularly relevant for seismic applications, for example, for detecting co-seismic displacements in low-to-moderate-magnitude events (M6) in the Mediterranean Basin. These results are valuable from an interdisciplinary perspective, as geodetic data from GNSS methods can support practical applications and experts in other research fields.

Supplementary Materials

The following supporting information can be downloaded at https://www.mdpi.com/article/10.3390/rs17223661/s1, Figure S1: Histograms showing the distribution of convergence times for the different positioning modes considered in this study: GPS PPP, GNSS PPP, GPS PPP-RA, and GNSS PPP-RA. These histograms represent the time required to achieve positioning errors below 5 and 10 cm for each acquisition gap that occurred during the analyzed time span, taking into account all the RING stations examined in this paper. Most of the RING stations exhibit very short convergence times (a few minutes), particularly when Regional Augmentation is applied, for both GPS-only and full GNSS datasets. However, for some samples (i.e., gaps affecting specific RING sites), convergence times can reach several tens of minutes.

Author Contributions

Conceptualization, P.M. and A.A.; methodology, P.M. and A.A.; software, P.M., M.G. and S.D.; validation, P.M. and A.A.; formal analysis, P.M., A.A. and S.D.; resources, A.A. and M.G.; data curation, P.M. and A.A.; writing—original draft preparation, P.M. and A.A.; writing—review and editing, P.M., A.A., L.F., C.D., S.D., M.G., R.D., N.A.F., C.G., G.P., R.M. and A.V.; visualization, P.M., A.A. and R.M.; supervision, A.A.; project administration, A.A.; funding acquisition, A.A. and M.G. All authors have read and agreed to the published version of the manuscript.

Funding

This research is part of the EWRICA and CIR01-00013 GRINT project, funded by the Italian Ministry of Research.

Data Availability Statement

Data acquired by the RING infrastructure network are available at https://webring.gm.ingv.it/.

Acknowledgments

The authors would like to thank the RING INGV working group for their ongoing efforts and technical support. We also thank GFZ researchers for providing the software used to perform the real-time analysis.

Conflicts of Interest

The authors declare no conflicts of interest.

References

  1. Torge, W.; Müller, J.; Pail, R. Geodesy; De Gruyter: Berlin, Germany, 2023; ISBN 978-3-11-072329-8. [Google Scholar]
  2. Nikolaidis, R.M.; Bock, Y.; de Jonge, P.J.; Shearer, P.; Agnew, D.C.; Van Domselaar, M. Seismic Wave Observations with the Global Positioning System. J. Geophys. Res. Solid Earth 2001, 106, 21897–21916. [Google Scholar] [CrossRef]
  3. Larson, K.M.; Bodin, P.; Gomberg, J. Using 1-Hz GPS Data to Measure Deformations Caused by the Denali Fault Earthquake. Science 2003, 300, 1421–1424. [Google Scholar] [CrossRef]
  4. Bock, Y.; Melgar, D.; Crowell, B.W. Real-Time Strong-Motion Broadband Displacements from Collocated GPS and Accelerometers. Bull. Seismol. Soc. Am. 2011, 101, 2904–2925. [Google Scholar] [CrossRef]
  5. Melgar, D.; Melbourne, T.I.; Crowell, B.W.; Geng, J.; Szeliga, W.; Scrivner, C.; Santillan, M.; Goldberg, D.E. Real-Time High-Rate GNSS Displacements: Performance Demonstration during the 2019 Ridgecrest, California, Earthquakes. Seismol. Res. Lett. 2019, 91, 1943–1951. [Google Scholar] [CrossRef]
  6. Boore, D.M.; Bommer, J.J. Processing of Strong-Motion Accelerograms: Needs, Options and Consequences. Soil Dyn. Earthq. Eng. 2005, 25, 93–115. [Google Scholar] [CrossRef]
  7. Zumberge, J.F.; Heflin, M.B.; Jefferson, D.C.; Watkins, M.M.; Webb, F.H. Precise Point Positioning for the Efficient and Robust Analysis of GPS Data from Large Networks. J. Geophys. Res. Solid Earth 1997, 102, 5005–5017. [Google Scholar] [CrossRef]
  8. Crowell, B.W.; Melgar, D.; Bock, Y.; Haase, J.S.; Geng, J. Earthquake Magnitude Scaling Using Seismogeodetic Data. Geophys. Res. Lett. 2013, 40, 6089–6094. [Google Scholar] [CrossRef]
  9. Melgar, D.; Crowell, B.W.; Geng, J.; Allen, R.M.; Bock, Y.; Riquelme, S.; Hill, E.M.; Protti, M.; Ganas, A. Earthquake Magnitude Calculation without Saturation from the Scaling of Peak Ground Displacement. Geophys. Res. Lett. 2015, 42, 5197–5205. [Google Scholar] [CrossRef]
  10. O’Toole, T.B.; Valentine, A.P.; Woodhouse, J.H. Centroid–Moment Tensor Inversions Using High-Rate GPS Waveforms. Geophys. J. Int. 2012, 191, 257–270. [Google Scholar] [CrossRef]
  11. Riquelme, S.; Bravo, F.; Melgar, D.; Benavente, R.; Geng, J.; Barrientos, S.; Campos, J. W Phase Source Inversion Using High-Rate Regional GPS Data for Large Earthquakes. Geophys. Res. Lett. 2016, 43, 3178–3185. [Google Scholar] [CrossRef]
  12. Chen, K.; Liu, Z.; Song, Y.T. Automated GNSS and Teleseismic Earthquake Inversion (AutoQuake Inversion) for Tsunami Early Warning: Retrospective and Real-Time Results. Pure Appl. Geophys. 2020, 177, 1403–1423. [Google Scholar] [CrossRef]
  13. Kawamoto, S.; Hiyama, Y.; Ohta, Y.; Nishimura, T. First Result from the GEONET Real-Time Analysis System (REGARD): The Case of the 2016 Kumamoto Earthquakes. Earth Planets Space 2016, 68, 190. [Google Scholar] [CrossRef]
  14. Crowell, B.W.; Melgar, D.; Geng, J. Hypothetical Real-Time GNSS Modeling of the 2016 Mw 7.8 Kaikōura Earthquake: Perspectives from Ground Motion and Tsunami Inundation Prediction. Bull. Seismol. Soc. Am. 2018, 108, 1736–1745. [Google Scholar] [CrossRef]
  15. Murray, J.R.; Bartlow, N.; Bock, Y.; Brooks, B.A.; Foster, J.; Freymueller, J.; Hammond, W.C.; Hodgkinson, K.; Johanson, I.; López--Venegas, A.; et al. Regional Global Navigation Satellite System Networks for Crustal Deformation Monitoring. Seismol. Res. Lett. 2019, 91, 552–572. [Google Scholar] [CrossRef]
  16. Crowell, B.W. Chapter 6—Earthquake and Tsunami Early Warning with GNSS Data. In GNSS Monitoring of the Terrestrial Environment; Aoki, Y., Kreemer, C., Eds.; Elsevier: Amsterdam, The Netherlands, 2024; pp. 111–127. ISBN 978-0-323-95507-2. [Google Scholar]
  17. Collins, P.; Lahaye, F.; Heroux, P.; Bisnath, S. Precise Point Positioning with Ambiguity Resolution Using the Decoupled Clock Model. In Proceedings of the 21st international technical meeting of the satellite division of the Institute of Navigation, Savannah, Georgia, 16–19 September 2008; Volume 263, pp. 1315–1322. [Google Scholar]
  18. Laurichesse, D.; Mercier, F.; Berthias, J.-P.; Broca, P.; Cerri, L. Integer Ambiguity Resolution on Undifferenced GPS Phase Measurements and Its Application to PPP and Satellite Precise Orbit Determination. Navigation 2009, 56, 135–149. [Google Scholar] [CrossRef]
  19. Cai, C.; Gao, Y. Modeling and Assessment of Combined GPS/GLONASS Precise Point Positioning. GPS Solut. 2013, 17, 223–236. [Google Scholar] [CrossRef]
  20. Yigit, C.O.; Gikas, V.; Alcay, S.; Ceylan, A. Performance Evaluation of Short to Long Term GPS, GLONASS and GPS/GLONASS Post-Processed PPP. Surv. Rev. 2014, 46, 155–166. [Google Scholar] [CrossRef]
  21. Cai, C.; Gao, Y.; Pan, L.; Zhu, J. Precise Point Positioning with Quad-Constellations: GPS, BeiDou, GLONASS and Galileo. Adv. Space Res. 2015, 56, 133–143. [Google Scholar] [CrossRef]
  22. Tsushima, H.; Ohta, Y. Review on Near-Field Tsunami Forecasting from Offshore Tsunami Data and Onshore GNSS Data for Tsunami Early Warning. J. Disaster Res. 2014, 9, 339–357. [Google Scholar] [CrossRef]
  23. Melgar, D.; Allen, R.M.; Riquelme, S.; Geng, J.; Bravo, F.; Baez, J.C.; Parra, H.; Barrientos, S.; Fang, P.; Bock, Y.; et al. Local Tsunami Warnings: Perspectives from Recent Large Events. Geophys. Res. Lett. 2016, 43, 1109–1117. [Google Scholar] [CrossRef]
  24. Báez, J.C.; Leyton, F.; Troncoso, C.; del Campo, F.; Bevis, M.; Vigny, C.; Moreno, M.; Simons, M.; Kendrick, E.; Parra, H.; et al. The Chilean GNSS Network: Current Status and Progress toward Early Warning Applications. Seismol. Res. Lett. 2018, 89, 1546–1554. [Google Scholar] [CrossRef]
  25. Jamil, H.; Mohamed, D.A.; Chang, D. The Malaysia Real-Time Kinematic GNSS Network (MyRTKnet) in 2010 and Beyond. In Proceedings of the FIG Congress 2010, Sydney, Australia, 11–16 April 2010. [Google Scholar]
  26. Hodgkinson, K.M.; Mencin, D.J.; Feaux, K.; Sievers, C.; Mattioli, G.S. Evaluation of Earthquake Magnitude Estimation and Event Detection Thresholds for Real-Time GNSS Networks: Examples from Recent Events Captured by the Network of the Americas. Seismol. Res. Lett. 2020, 91, 1628–1645. [Google Scholar] [CrossRef]
  27. Chousianitis, K.; Papanikolaou, X.; Drakatos, G.; Tselentis, G. Akis NOANET: A Continuously Operating GNSS Network for Solid--Earth Sciences in Greece. Seismol. Res. Lett. 2021, 92, 2050–2064. [Google Scholar] [CrossRef]
  28. Avallone, A.; Selvaggi, G.; D’Anastasio, E.; D’Agostino, N.; Pietrantonio, G.; Riguzzi, F.; Serpelloni, E.; Anzidei, M.; Casula, G.; Cecere, G.; et al. The RING Network: Improvement of a GPS Velocity Field in the Central Mediterranean. Ann. Geophys. 2010, 53, 39–54. [Google Scholar] [CrossRef]
  29. Devoti, R.; Pietrantonio, G.; Riguzzi, F. GNSS Networks for Geodynamics in Italy. Física Tierra 2014, 26, 11–24. [Google Scholar] [CrossRef]
  30. Chiarabba, C.; De Gori, P.; Chiaraluce, L.; Bordoni, P.; Cattaneo, M.; De Martin, M.; Frepoli, A.; Michelini, A.; Monachesi, A.; Moretti, M.; et al. Mainshocks and Aftershocks of the 2002 Molise Seismic Sequence, Southern Italy. J. Seismol. 2005, 9, 487–494. [Google Scholar] [CrossRef]
  31. Serpelloni, E.; Anderlini, L.; Belardinelli, M.E. Fault Geometry, Coseismic-Slip Distribution and Coulomb Stress Change Associated with the 2009 April 6, Mw 6.3, L′Aquila Earthquake from Inversion of GPS Displacements. Geophys. J. Int. 2012, 188, 473–489. [Google Scholar] [CrossRef]
  32. Cheloni, D.; De Novellis, V.; Albano, M.; Antonioli, A.; Anzidei, M.; Atzori, S.; Avallone, A.; Bignami, C.; Bonano, M.; Calcaterra, S.; et al. Geodetic Model of the 2016 Central Italy Earthquake Sequence Inferred from InSAR and GPS Data. Geophys. Res. Lett. 2017, 44, 6778–6787. [Google Scholar] [CrossRef]
  33. Melgar, D.; Crowell, B.W.; Bock, Y.; Haase, J.S. Rapid Modeling of the 2011 Mw 9.0 Tohoku-Oki Earthquake with Seismogeodesy. Geophys. Res. Lett. 2013, 40, 2963–2968. [Google Scholar] [CrossRef]
  34. Alkan, R.M.; Erol, S.; Ozulu, I.M.; Ilci, V. Accuracy Comparison of Post-Processed PPP and Real-Time Absolute Positioning Techniques. Geomat. Nat. Hazards Risk 2020, 11, 178–190. [Google Scholar] [CrossRef]
  35. Wabbena, G.; Schmitz, M.; Bagge, A. PPP-RTK: Precise Point Positioning Using State-Space Representation in RTK Networks. In Proceedings of the 18th international technical meeting of the satellite division of the Institute of navigation, Long Beach, CA, USA, 13–16 September 2005; Volume 259, pp. 2584–2594. [Google Scholar]
  36. Geng, J.; Teferle, F.N.; Meng, X.; Dodson, A.H. Towards PPP-RTK: Ambiguity Resolution in Real-Time Precise Point Positioning. Adv. Space Res. 2011, 47, 1664–1673. [Google Scholar] [CrossRef]
  37. Teunissen, P.J.G.; Odijk, D.; Zhang, B. PPP-RTK: Results of CORS Network-Based PPP with Integer Ambiguity Resolution. J. Aeronaut. Astronaut. Aviat. Ser. A 2010, 42, 223–230. [Google Scholar]
  38. Zhang, X.; Li, X.; Guo, F. Satellite Clock Estimation at 1 Hz for Realtime Kinematic PPP Applications. GPS Solut. 2011, 15, 315–324. [Google Scholar] [CrossRef]
  39. Li, X.; Ge, M.; Dai, X.; Ren, X.; Fritsche, M.; Wickert, J.; Schuh, H. Accuracy and Reliability of Multi-GNSS Real-Time Precise Positioning: GPS, GLONASS, BeiDou, and Galileo. J. Geod. 2015, 89, 607–635. [Google Scholar] [CrossRef]
  40. Amato, A.; Mele, F. Performance of the INGV National Seismic Network from 1997 to 2007. Ann. Geophys. 2008, 51, 417–431. [Google Scholar] [CrossRef]
  41. D’Agostino, N.; Avallone, A.; Cheloni, D.; D’Anastasio, E.; Mantenuto, S.; Selvaggi, G. Active Tectonics of the Adriatic Region from GPS and Earthquake Slip Vectors. J. Geophys. Res. Solid Earth 2008, 113, B12413. [Google Scholar] [CrossRef]
  42. Chiarabba, C.; De Gori, P.; Mele, F.M. Recent Seismicity of Italy: Active Tectonics of the Central Mediterranean Region and Seismicity Rate Changes after the Mw 6.3 L’Aquila Earthquake. Tectonophysics 2015, 638, 82–93. [Google Scholar] [CrossRef]
  43. Serpelloni, E.; Cavaliere, A.; Martelli, L.; Pintori, F.; Anderlini, L.; Borghi, A.; Randazzo, D.; Bruni, S.; Devoti, R.; Perfetti, P.; et al. Surface Velocities and Strain-Rates in the Euro-Mediterranean Region From Massive GPS Data Processing. Front. Earth Sci. 2022, 10, 907897. [Google Scholar] [CrossRef]
  44. Falco, L. Implementazione e Gestione di una Rete di Monitoraggio GPS e Sismica Mediante Tecnologie GPRS/EDGE/UMTS/HSDPA. 2008. Available online: https://editoria.ingv.it/archivio_pdf/rapporti/68/pdf/rapporti_69.pdf (accessed on 10 June 2025).
  45. Margheriti, L.; Nostro, C.; Cocina, O.; Castellano, M.; Moretti, M.; Lauciani, V.; Quintiliani, M.; Bono, A.; Mele, F.M.; Pintore, S.; et al. Seismic Surveillance and Earthquake Monitoring in Italy. Seismol. Res. Lett. 2021, 92, 1659–1671. [Google Scholar] [CrossRef]
  46. Devoti, R.; D’Agostino, N.; Serpelloni, E.; Pietrantonio, G.; Riguzzi, F.; Avallone, A.; Cavaliere, A.; Cheloni, D.; Cecere, G.; D’Ambrosio, C.; et al. A Combined Velocity Field of the Mediterranean Region. Ann. Geophys. 2017, 60, S0215. [Google Scholar] [CrossRef]
  47. Malys, S.; Jensen, P.A. Geodetic Point Positioning with GPS (Global Positioning System) Carrier Beat Phase Data from the CASA (Central and South America) Uno Experiment. Geophys. Res. Lett. 1990, 17, 5. [Google Scholar] [CrossRef]
  48. Li, X.; Wang, B.; Li, X.; Huang, J.; Lyu, H.; Han, X. Principle and Performance of Multi-Frequency and Multi-GNSS PPP-RTK. Satell. Navig. 2022, 3, 7. [Google Scholar] [CrossRef]
  49. Ge, M.; Douša, J.; Li, X.; Ramatschi, M.; Nischan, T.; Wickert, J. A Novel Real-Time Precise Positioning Service System: Global Precise Point Positioning With Regional Augmentation. J. Glob. Position. Syst. 2012, 11, 2–10. [Google Scholar] [CrossRef]
  50. Avallone, A.; Marzario, M.; Cirella, A.; Piatanesi, A.; Rovelli, A.; Di Alessandro, C.; D’Anastasio, E.; D’Agostino, N.; Giuliani, R.; Mattone, M. Very High Rate (10 Hz) GPS Seismology for Moderate-Magnitude Earthquakes: The Case of the Mw 6.3 L’Aquila (Central Italy) Event. J. Geophys. Res. Solid Earth 2011, 116, B02305. [Google Scholar] [CrossRef]
  51. Karaim, M.; Elsheikh, M.; Noureldin, A.; Karaim, M.; Elsheikh, M.; Noureldin, A. GNSS Error Sources. In Multifunctional Operation and Application of GPS; IntechOpen: London, UK, 2018; ISBN 978-1-78923-215-8. [Google Scholar]
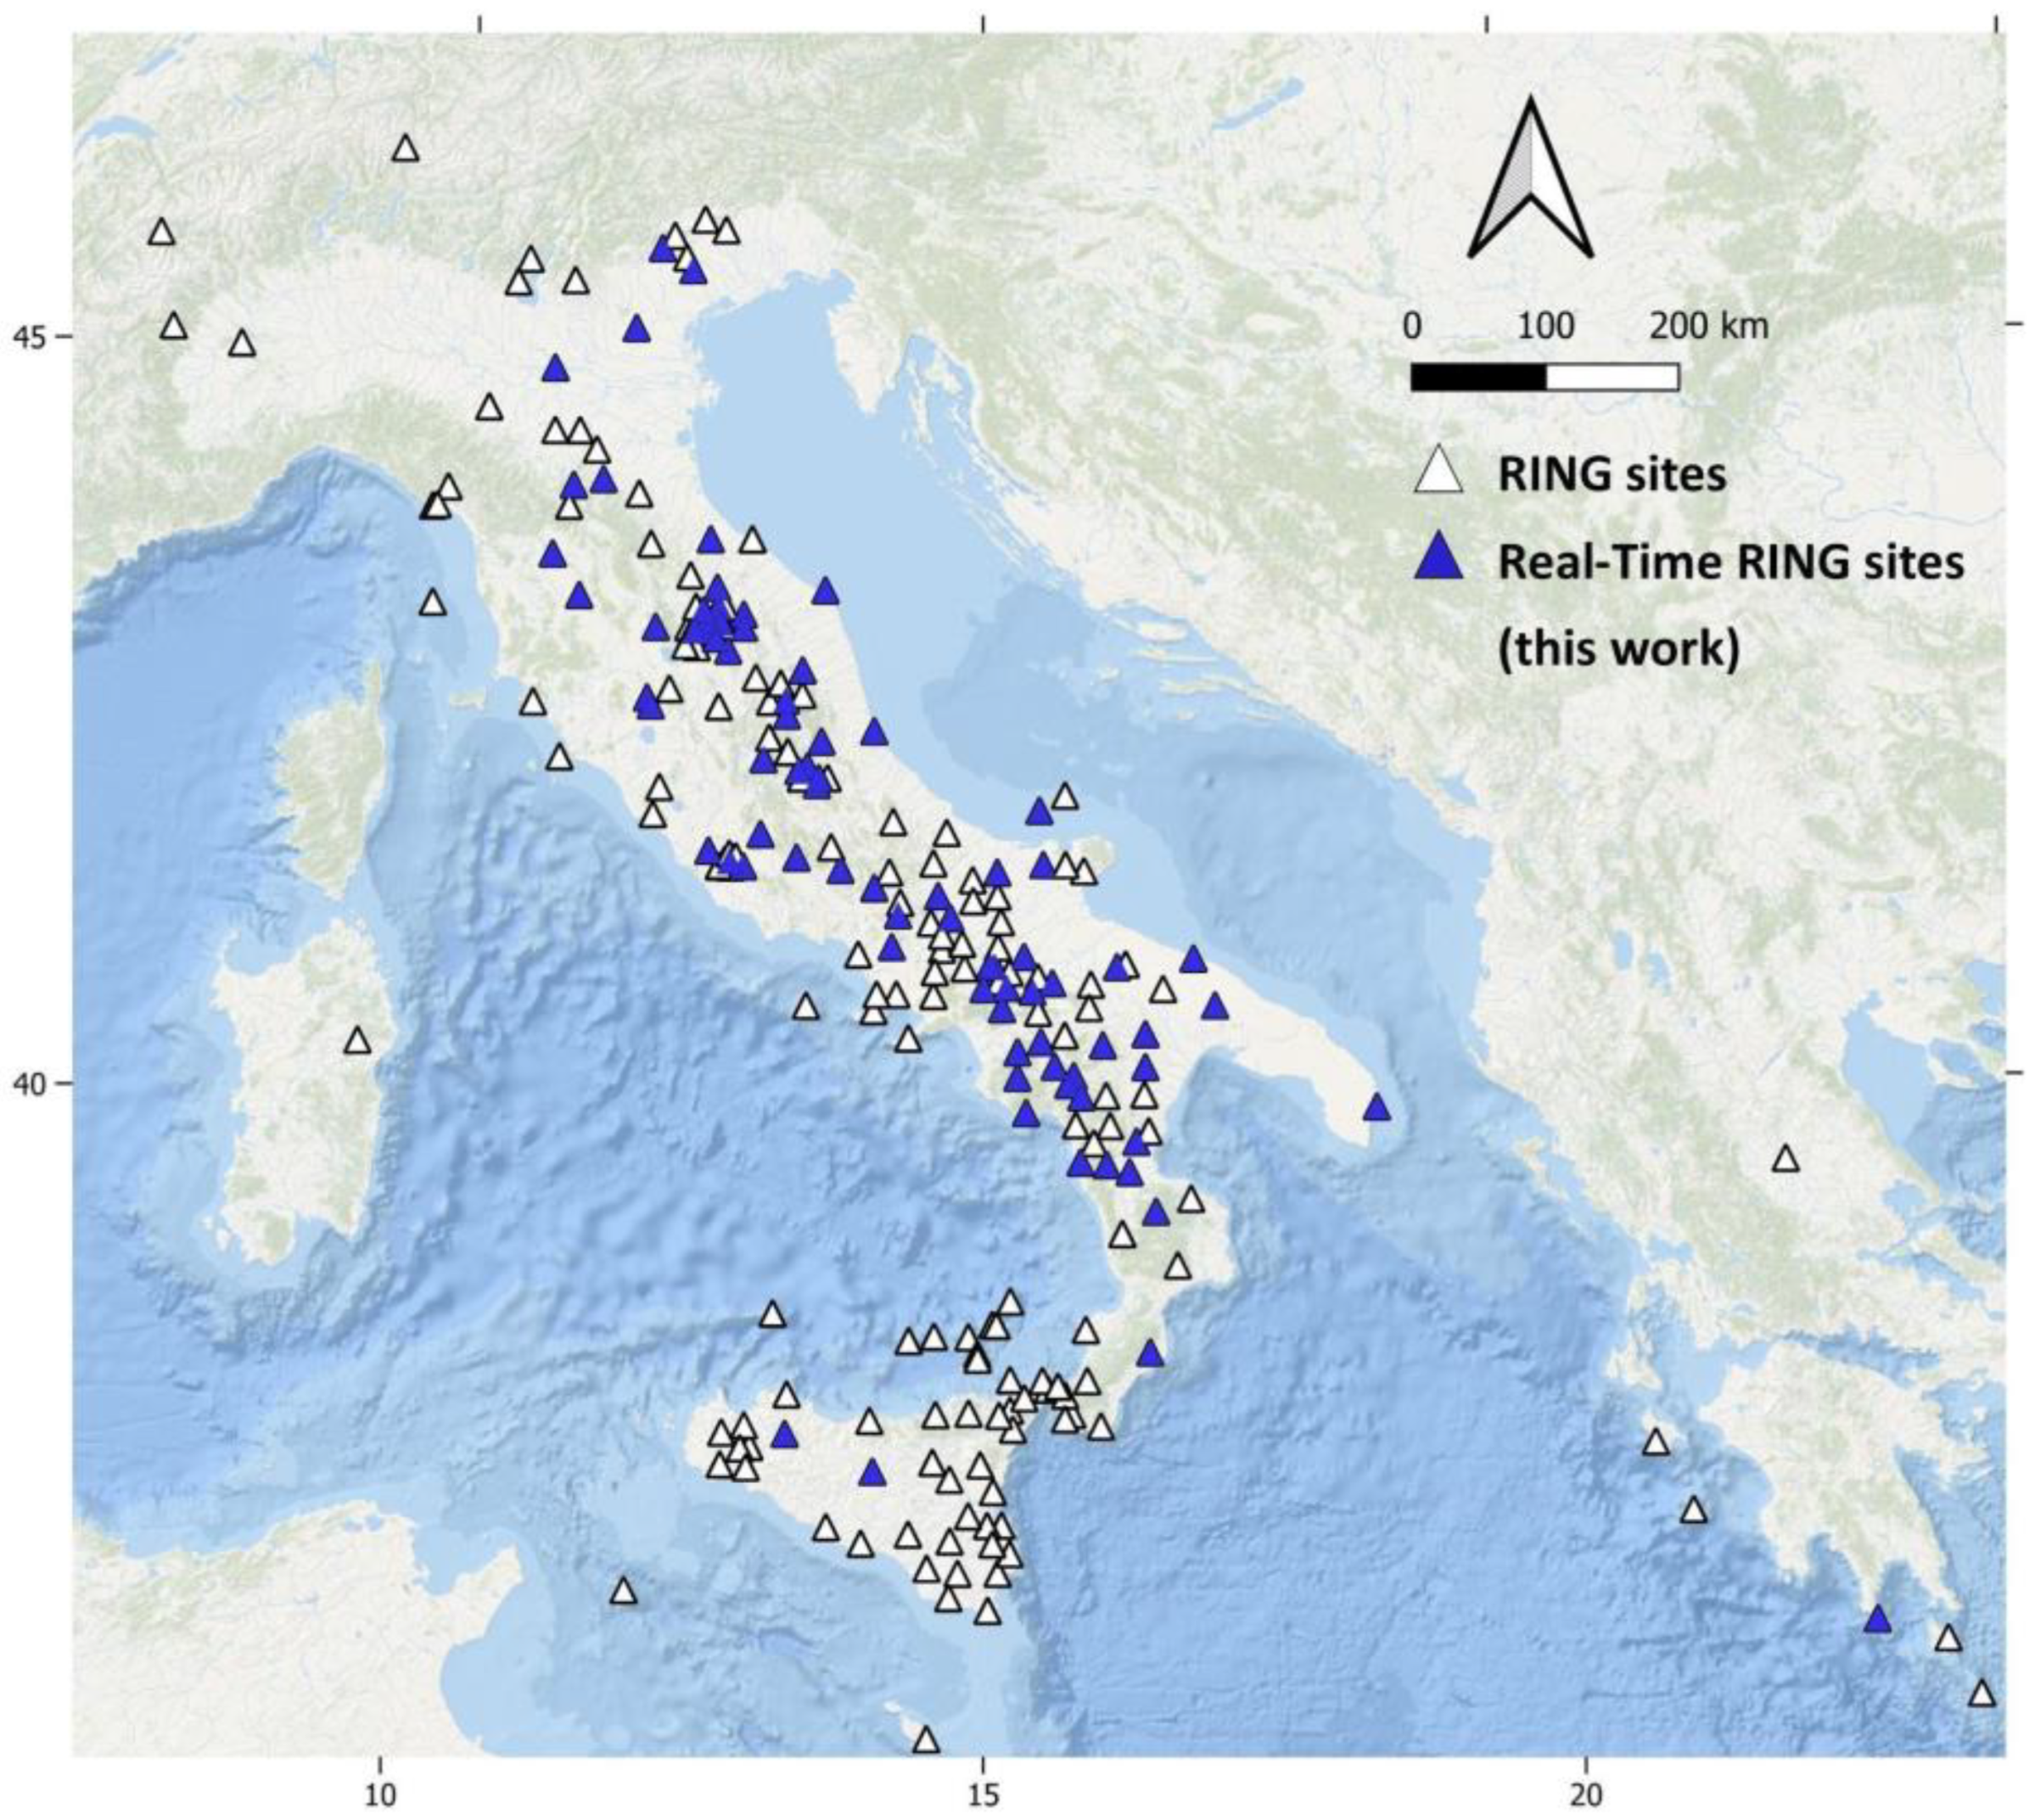
Figure 1. The spatial distribution of the RING network: each marker corresponds to a GPS/GNSS station. The blue filled triangles represent sites equipped with GNSS receivers considered in this study.
Remotesensing 17 03661 g001
Figure 2. Overall simplified structure of RTPPP software (modified from [49]).
Remotesensing 17 03661 g002
Figure 3. Convergence curves of the three positioning components for the CONI station after a gap that occurred on 24 January 2024. The values in the table refer to the average convergence times for the different acquisition modes considered in this study across all RING sites.
Remotesensing 17 03661 g003
Figure 4. RMS distribution for RING stations on 24 January 2024, considering GPS total epochs (a), GPS RA epochs (b), GNSS total epochs (c), and GNSS RA epochs (d). The percentage of acquired epochs and those with Regional Augmentation are shown in the scatter plot below each stem plot.
Remotesensing 17 03661 g004
Figure 5. Time series for the TEOL, PIOB, and AV04 stations. The RMS values for the three components were calculated using the daily solutions for the entire period considered. Colored triangles show the locations of the sample stations selected.
Remotesensing 17 03661 g005
Figure 6. Distribution of daily RMSs over the GPS-only and full GNSS datasets. In the upper part (a,c), the histograms show the values for all acquired epochs, while in the lower part (b,d), the histograms represent only the RA epochs. The blue dotted line indicates the median values, and the red line represents the average values. The “X” value in subplots (a,c) denotes the percentage of acquired epochs during the considered period (3 weeks), while in subplots (b,d), it represents the percentage of epochs with Regional Augmentation.
Remotesensing 17 03661 g006
Figure 7. The RMS distribution along the RING network for 24 January 2024, using the sliding windows approach. RMS values computed for the (a) PPP GPS solution; (b) PPP-RA GPS solution; (c) PPP GNSS solution; and (d) PPP-RA GNSS solution. The percentage of acquired epochs and those with Regional Augmentation is shown in the scatter plot below each stem plot.
Remotesensing 17 03661 g007
Figure 8. Time series of average RMS value computed on 300 s sliding windows for TEOL, PIOB, and AV04 stations. Colored triangles show the locations of the sample stations selected.
Remotesensing 17 03661 g008
Figure 9. The distribution of the RMS for short-term solutions over the GPS-only and full GNSS datasets: (a) GPS total epochs dataset; (b) GPS RA epochs dataset; (c) GNSS total epochs dataset; and (d) GNSS RA epochs dataset. The blue dotted line identifies the median value, and the red dotted line represents the average values. The “X” value for subplots (a,c) represents the percentage of acquired epochs during the considered period (3 weeks), while for subplots (b,d), it indicates the percentage of epochs with Regional Augmentation.
Remotesensing 17 03661 g009
Figure 10. A comparison of the performance of RING stations, taking into account the GPS-only dataset (left column; (ac) for N, E, and Up components, respectively) and the full GNSS dataset (right column; (df) for N, E, and Up components, respectively). The average values represented for each site were calculated using the daily solutions covering the considered analysis period.
Remotesensing 17 03661 g010
Figure 11. A comparison between the performance of RING stations, taking into account the GPS-only dataset (left column; (ac) for N, E, and Up components, respectively) and the full GNSS dataset (right column; (df) for N, E, and Up components, respectively), with average RMS values computed using the sliding window approach.
Remotesensing 17 03661 g011
Figure 12. Real-time horizontal (left) and vertical (right) positioning errors at the MTMR station on 24 January 2024. The GNSS PPP-RA solution (red dots) shows higher precision compared to GNSS PPP epochs (gray dots).
Remotesensing 17 03661 g012
Disclaimer/Publisher’s Note: The statements, opinions and data contained in all publications are solely those of the individual author(s) and contributor(s) and not of MDPI and/or the editor(s). MDPI and/or the editor(s) disclaim responsibility for any injury to people or property resulting from any ideas, methods, instructions or products referred to in the content.