Abstract
Applying deep learning algorithms in the construction industry holds tremendous potential for enhancing site management, safety, and efficiency. The development of such algorithms necessitates a comprehensive and diverse image dataset. This study introduces the Aerial Image Dataset for Construction (AIDCON), a novel aerial image collection containing 9563 construction machines across nine categories annotated at the pixel level, carrying critical value for researchers and professionals seeking to develop and refine object detection and segmentation algorithms across various construction projects. The study highlights the benefits of utilizing UAV-captured images by evaluating the performance of five cutting-edge deep learning algorithms—Mask R-CNN, Cascade Mask R-CNN, Mask Scoring R-CNN, Hybrid Task Cascade, and Pointrend—on the AIDCON dataset. It underscores the significance of clustering strategies for generating reliable and robust outcomes. The AIDCON dataset’s unique aerial perspective aids in reducing occlusions and provides comprehensive site overviews, facilitating better object positioning and segmentation. The findings presented in this paper have far-reaching implications for the construction industry, as they enhance construction site efficiency while setting the stage for future advancements in construction site monitoring and management utilizing remote sensing technologies.
1. Introduction
Traditional construction monitoring and management methods are based on manual interpretations, which are labor-intensive and costly. Therefore, they are not suitable for large-scale constructions. Automated methods have replaced manual ones with the development and accessibility of remote sensing and data collection technologies. Many data-gathering devices are tested and reported in the literature. Compared to other technologies like laser scanners and radiofrequency-based methods (RFID, Wi-Fi, UWB), digital cameras are easy to use and require fewer human resources [1]. Prior research has demonstrated that automated processes based on digital images increase productivity, decrease safety risks, and speed up processes [2,3,4]. They support project managers in cost estimation, resource allocation, and work schedules.
In addition to developing data collection methods, recent advancements in deep learning (DL) algorithms have shown superior performance for object detection and tracking [5]. The availability of large datasets such as COCO [6] and Pascal VOC [7] drew academics’ attention to the need for DL-based solutions for conventional applications. For the construction fields, several vision-based DL applications have been developed, aided by Convolutional Neural Networks (CNNs) that facilitate the automatic identification of working activities of excavators, dump trucks, and workers [8]. Consequently, this allows for surveilling machinery productivity during site operations [9]. Additionally, the automatic detection of equipment enables the measurement of proximities among construction entities, promoting a safer working environment for construction workers [10]. Identifying workers and their hardhat usage is a crucial safety measure that protects construction workers from accidents [11].
Vision-based construction applications highly rely on the accurate detection of construction objects. Accurate detection can be achieved using a well-established dataset and a robust DL algorithm. DL algorithms demonstrated their effectiveness on the benchmark datasets. However, there are few open datasets available for construction. Most research in the construction industry uses datasets unique to the suggested strategy, and most of them are not accessible to other researchers. The majority of them were gathered through CCTV cameras and mobile device cameras.
On the other hand, unlike ground-level devices, Unmanned Aerial Vehicles (UAVs) offer several advantages. First, UAV-based aerial imaging enables views of a wide range of hard-to-reach areas quickly and effectively, which is comparably difficult or sometimes impossible for ground-level conventional devices [12,13]. Ground cameras, due to their fixed positions, typically require more time and effort to survey large areas, which can be a major drawback in extensive projects. Second, obstacles like buildings, trees, or large equipment can hinder ground camera view and create data gaps [14,15]. UAV technology effectively prevents occlusion problems from frequently happening at the site. From this perspective, static ground cameras lack the flexibility and comprehensive coverage that UAVs provide. In addition, a top-down view of a construction site allows for precise proximity monitoring of construction objects. UAVs equipped with high-resolution cameras and GPS allow for aerial-guided positioning of workers, equipment, and machines [10]
In contrast to static ground cameras, which require permanent installation and maintenance on-site, UAVs do not need fixed setups, which reduces the logistical burden and costs of maintaining a network of cameras. UAVs can be rapidly deployed and repositioned as needed, offering greater adaptability to changing site conditions compared to the fixed positions of ground cameras. While continuous monitoring is not possible with UAVs, periodic flights can be strategically scheduled to capture critical stages of the construction process. This targeted approach ensures that key milestones are documented without the need for constant surveillance. The use of UAVs was, therefore, intended to complement, rather than replace, traditional ground-based methods, providing critical insights at the key stages of construction. Although there are several applications for UAV imagery in the construction field, there is a limited and less open dataset of aerial images considering the current literature.
In this study, we present an open aerial image dataset named the Aerial Image Dataset for Construction (AIDCON), including nine object types, namely, dump truck, excavator, backhoe loader, wheel loader, compactor, dozer, grader, car, and other construction machinery grouped in a particular category. A total of 2155 images were collected from 25 different locations via UAV bird’s-eye view from various cities of Türkiye. The aerial images were captured from multiple sites, including excavation fields, steel structures, reinforced concrete structures, transportation projects, and parking areas designated for construction machinery. An intense amount of work has been performed to annotate construction machines at the pixel level. In total, 9563 objects with their boundaries have been annotated in the images rather than the commonly used bounding box annotation method. Providing machine layouts enables us to understand the poses and activities of machines. Image similarity index and location-based clustering were proposed to group images for appropriate train-test splitting. Finally, the performance of the dataset has been evaluated using five different DL-based instance segmentation algorithms, including Mask R-CNN [16], Cascade Mask R-CNN [17], Mask Scoring R-CNN [18], Hybrid Task Cascade [19], and Pointrend [20]. A webpage was created to provide open access to the dataset and facilitate future research contributions.
2. Literature Review
This literature review examines the crucial role of large-scale datasets in advancing computer vision applications, especially within the construction industry. It starts with general-purpose datasets before shifting focus to construction-specific datasets, emphasizing their unique challenges and innovative data capture methods. These datasets are essential for developing techniques that enhance object detection, productivity measurement, and safety monitoring in construction settings. This review highlights the evolution and significance of these datasets and their broad applications across various domains.
2.1. General-Purpose Datasets
The availability of large-scale datasets is crucial in developing and evaluating deep learning algorithms. One of the first open datasets was published by the California Institute of Technology researchers. The Caltech-101 [21] and Caltech-256 [22] datasets, as their names imply, contain 101 and 256 classes (such as cars, motorbikes, airplanes), 9146 and 30,607 photos, respectively. Similarly, the CIFAR-10 and CIFAR-100 datasets have 10 and 100 classes of 60,000 32 × 32 images [23]. The Pascal Visual Object Classes (Pascal VOC) challenge [7] is one of the significant competitions in early computer vision research. The challenge datasets were published between 2010 and 2015. It started with four classes and 1578 images and eventually ended up with 20 categories and 11,530 images. A variety of classes are labeled, such as the chair, dog, and person. Microsoft COCO (Common Objects in Context) dataset [6] is among the most used image datasets, containing 330,000 images with more than 200,000 labels. Images, tiny objects compared to Pascal VOC, were labeled in 80 categories. ImageNet [24] and Open Images Dataset by Google [25] are large-scale datasets with 14 million and 9 million images with thousands of classes, from balloons to strawberries. Recently, Facebook AI Researchers published the LVIS (Large Vocabulary Instance Segmentation) dataset with a higher number of categories—over 1000 entry-level object categories—compared to previous ones [26]. Following a meticulous approach, 2 million items were masked in 164,000 images.
2.2. Construction-Specific Datasets
In construction, one of the first standard datasets was created by Tajeen and Zhu [27]. It covers five pieces of construction equipment (excavator, loader, dozer, roller, and backhoe) with various viewpoints, poses, and sizes in 2000 images. Not very popular when the dataset was created, deep learning detectors were not used to evaluate dataset performance, and the images were not provided to the public. Kim et al. [28] proposed a benchmark dataset, the so-called Advanced Infrastructure Management (AIM) dataset, filtering construction equipment in the ImageNet database. Performance evaluation was conducted using Faster R-CNN with ResNet-101. This study shows the capability of deep learning algorithms for detecting heavy construction equipment. An image dataset particularly developed for construction equipment, Alberta Construction Image Dataset (ACID), was published by Xiao and Kang [29]. ACID contains 10,000 images collected from the ground and in ten construction object classes. The dataset was trained by YOLO-v3, Inception-SSD, R-FCN-ResNet101, and Faster-R-CNN-ResNet101 to test its feasibility. Xuehui et al. [30] presented the Moving Objects in Construction Sites (MOCS) image dataset that contains 41,668 images and 13 categories of pixel-level annotations. Deep learning algorithms were used for benchmark analysis, object detection, and instance segmentation. Unlike the ACID dataset, MOCS has UAV footage images. The images are captured from low altitudes and collected around the construction machines, but no top-view pictures are provided in the dataset. Duan et al. [15] developed a Site Object Detection Dataset (SODA) that contains 15 object classes, such as scaffold, hook, and fence, which do not overlap with existing construction datasets. The aim is to create a distinct dataset that can be used for a wide range of construction applications, but SODA does not include any construction machinery categories. Del Savio et al. [31] presented a dataset of 1046 images from four static cameras around a construction site. The images were manually classified into eight object classes commonly found in a construction environment. Recently, Yan et al. [32] created one of the most extensive datasets, the Construction Instance Segmentation (CIS) dataset. This significant contribution includes 50,000 images with ten object categories and 104,021 annotated instances. This dataset spans a wide range of construction sites and is taken with various imaging equipment. It also includes many construction aspects, such as workers wearing and not wearing safety helmets and different types of construction trucks. These datasets can be helpful for developing computer vision techniques in the engineering and construction fields. A comparison of existing datasets with our proposed dataset AIDCON is tabulated in Table 1.

Table 1.
Comparison of datasets.
Since manually gathering and annotating a huge image dataset takes much time, synthetic datasets were presented in the literature. Soltani et al. [33] and Barrera-Animas and Davila Delgado [34] created a dataset from the 3D models of construction machines combined with various background images taken from construction sites. Bang et al. [35] proposed a method of image augmentation that is based on cut and paste and image inpainting techniques to create variations of original images. Hwang et al. [36,37] used web crawling-based image collection to build a large dataset. The dataset includes only a limited number of equipment types. The techniques of synthetically developing datasets are not reliable enough due to the conditions and terrain of the construction, and further customization is required.
2.3. Applications in Construction
The datasets concerning construction equipment available in the literature provide various opportunities for application areas. Recognizing equipment from the images helps to perform productivity measurement, performance control, and proactive work-zone safety applications. Detection of equipment is the first step of these applications [38]. In this regard, Faster R-CNN, a deep learning algorithm, has been adapted to detect people and objects associated with a construction site, such as workers, excavators, and dump trucks [39,40,41].
According to Golparvar-Fard et al. [42], a multi-class SVM classifier can recognize excavator and dump truck actions from images captured by a fixed camera. Zhu et al. [43] reported high precision and recall in identifying construction workers and equipment. Another study by Luo et al. [44] presented a technique capable of detecting 22 construction-related objects and 17 types of construction activities. Roberts and Golparvar-Fard [8] introduced a method for identifying the operational activities of excavators and dump trucks using the AIM dataset. Additionally, Xiao and Kang [9] proposed the construction machine tracker (CMT) system to track multiple construction machines based on a method of image hashing features and assisted by the ACID dataset.
By leveraging object detection and tracking algorithms, the productivity of construction equipment, such as working cycles, cycle times, and delays, can be recognized and measured [2,45,46]. Kim et al. [47] estimated earthwork productivity using CNN-based excavator and dump truck detection. Knowing the equipment’s pose from a productivity perspective makes it easier to calculate the time the operator spent on each stage of their activities [4]. Soltani et al. [48] introduced a method to process each camera from the job site and create the 2D skeleton of the excavator; then, the relative rotation and translation data between the cameras’ coordinate systems were used to determine the 3D posture. A synthetic dataset was created by Mahmood et al. [49] to train a vision-based model that predicts the 3D posture of an excavator. 3D pose detection helps to monitor safety and excavator activity analysis [3]. Chi and Caldas [50] and Rezazadeh Azar and McCabe [51] presented object recognition and background subtraction algorithms based on proactive work-zone safety automation. Rezazadeh Azar et al. [52] and Kim et al. [53] created a framework for identifying vision-based activities that consider interactive features of earthmoving machinery operation. Utilizing a deep active learning methodology and a few-shot learning strategy can significantly reduce the number of images required for training purposes [54,55]. By including a new machine class and suggesting an enhanced version of the SSD MobileNet object detector appropriate for embedded devices, Arabi et al. [56] enhanced the AIM construction machine dataset.
With the introduction of UAVs, equipment detection and tracking were widely used in aerial imaging. Guo et al. [57] suggested using UAV images to identify numerous construction machines with orientation-aware feature fusion single-stage detection (OAFF-SSD). Meanwhile, Meng et al. [58] proposed a real-time detection of excavators for pipeline safety utilizing the widely used YOLO v3 algorithm and 350 collected images via a UAV DJI M600 Pro. Since aerial views enable information to be obtained from larger areas compared to ground images, UAVs are mainly utilized for proximity monitoring applications. Kim et al. [10] collected 4512 frames, including excavator, wheel loader, and worker, by UAVs and proposed a YOLO-v3-based automated proximity measurement technique. Similarly, Bang et al. [59] offered a Mask R-CNN-based method to segment, predict, and monitor the proximities of workers and heavy equipment.
In conclusion, the ongoing evolution of deep learning and large datasets is significantly enhancing the efficiency of construction applications. The integration of UAVs and object detection algorithms is paving the way for sophisticated applications that were once deemed challenging. The remaining sections delve into details of proposed AIDCON datasets, which helps researchers and practitioners develop more accurate and reliable methods for tracking and analyzing construction equipment.
3. Materials and Methods
This section details the comprehensive methodologies used to develop and evaluate the AIDCON dataset. We begin by describing the dataset’s development process and then outline the performance evaluation strategy used to validate the effectiveness of the dataset with various deep learning algorithms. This methodical documentation provides clarity on the processes involved in creating and utilizing AIDCON.
3.1. Dataset Development
The development of an extensive and varied image dataset, AIDCON, spanned a long period. Aerial images were gathered during the construction monitoring processes and organized for use in this dataset creation. The dataset development procedure can be categorized into four main parts: image collection, privacy protection, image segmentation, and clustering (Figure 1).

Figure 1.
Stages of the dataset development process. First, aerial images were captured from construction sites. Then, to ensure privacy, sensitive details were blurred in the images. Next, construction machinery was segmented and annotated into categories by annotators manually. Finally, images were clustered based on similarity and proximity metrics to organize training and testing splits, ensuring to prevent model’s memorization.
3.1.1. Image Collection
Over the eight years spanning from 2015 to 2023, aerial images were collected from 25 distinct locations within the borders of Türkiye, as illustrated in Figure 2. The altitudes of the images range from 10 to 150 m. The earlier images were obtained for the purpose of construction monitoring, productivity measurement, and quality control research studies for construction projects by the authors. A subset of this image archive, including construction machinery, was identified and selected for the AIDCON dataset. In addition to the existing images, supplementary images were collected to account for less frequently encountered construction machinery.
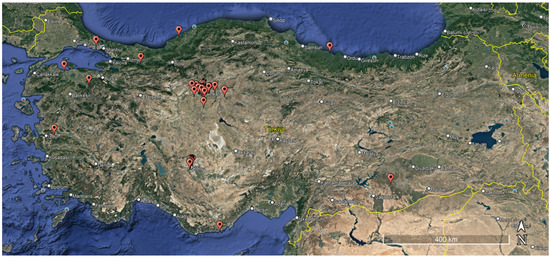
Figure 2.
Geographic distribution of data collection sites.
Four UAVs were employed to collect data, including DJI’s Phantom 4 RTK, Mavic Pro, Mavic 2 Pro, and Yuneec’s H520, as shown in Figure 3. Each drone was distinguished by a unique set of specifications, including camera resolution, sensor type, flight time, and range (Table 2). The Phantom 4 RTK has a high-resolution camera and extended range, which makes it ideal for capturing aerial images from a longer distance. On the other hand, the Mavic Pro and Mavic 2 Pro were portable, easy to use, and capable of capturing stable footage in flight. The Yuneec H520 has a six-rotor system, which provides excellent stability in windy conditions. High-quality images were captured by these UAVs, ensuring coverage of different types of construction machines from the different construction sites. Construction image datasets that include UAV imagery in the literature are low-altitude, and most images were taken from the side view [30]. In contrast, we present top-view images taken by UAVs with a camera angle between 60–90 degrees facing downwards.

Figure 3.
Specific UAV models employed for collecting aerial images (Images retrieved from [60,61]).

Table 2.
UAV specifications; the key parameters of the UAVs used in the study.
Most of the locations from which data were gathered are construction job sites such as excavation fields, steel structures, reinforced concrete structures, and transportation projects (Figure 4a). Before being transported to the job sites, construction machines are generally parked in the parking areas for not being assigned to job sites or maintenance purposes. A diverse range of machines was gathered in the same place, which makes this place a perfect spot for data collection. Therefore, UAV footage over parking areas was deployed, and the AIDCON dataset was enlarged by taking parked construction machines (Figure 4b). The machines’ various poses and scales for construction job sites and parking areas have been achieved. In addition, a small portion of images from construction job sites that do not include any construction machines were added to the image set to represent negative samples (Figure 4c). Incorporating negative samples in the dataset can help deep learning algorithms achieve higher accuracy by improving their ability to distinguish between relevant and irrelevant patterns in the data and by increasing their generalizability to new and unseen data.
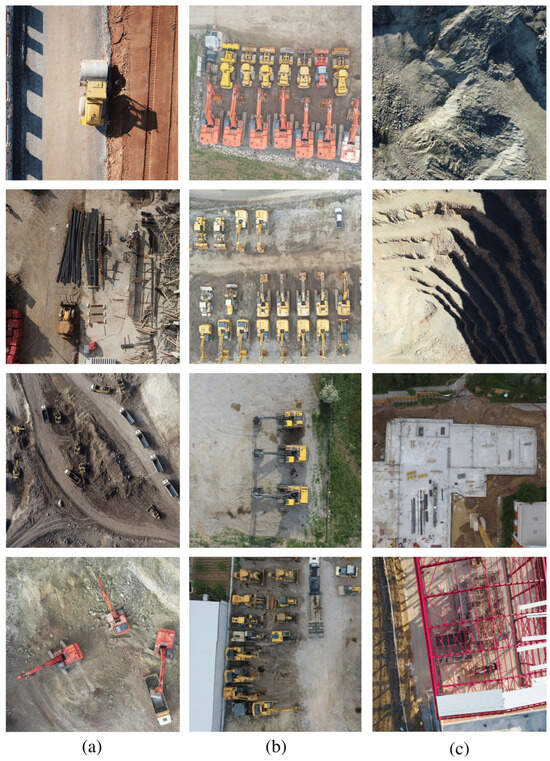
Figure 4.
Example images from the AIDCON dataset. (a) Images gathered from ongoing construction sites, (b) UAV footage of parking areas with parked construction machines, (c) Negative samples, images without machines.
During such a long data collection period, construction sites’ weather conditions change from summer to winter (Figure 5). Therefore, the dataset was carefully curated to include various images captured under different weather. Sunny and snowy images were included in the dataset to enable the model to recognize construction machines under varying environmental conditions. Additionally, all images were captured during daytime hours to ensure consistency across the dataset. The image format selected for the dataset was JPG, as it is a commonly used and widely accepted format. Furthermore, WGS-84 coordinates, specifically the latitude and longitude of the UAV, were embedded in the images’ metadata to facilitate their location identification, thereby enabling the grouping of images taken on the same construction sites.

Figure 5.
Weather variations at the same construction site during data collection.
3.1.2. Privacy Protection
The privacy of individuals and corporate entities was considered during the dataset’s development. Building windows and the faces of individuals who might have been captured looking up at the UAV camera were intentionally blurred to prevent potential privacy concerns. Additionally, the names, logos, and slogans of companies visible in the images were acknowledged and appropriately covered to avoid any unintended consequences of privacy violations. This approach ensured that the dataset complied with ethical considerations and was developed following best practices in data privacy (Figure 6).
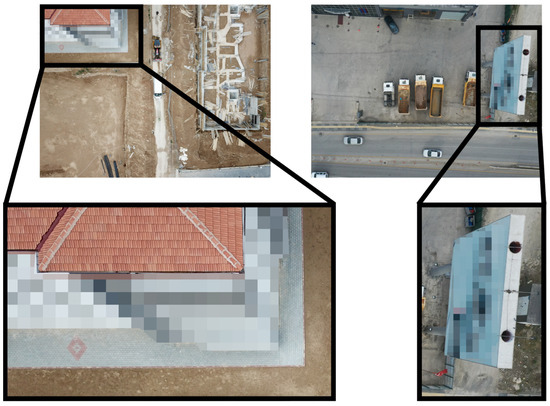
Figure 6.
Privacy protection techniques applied within the AIDCON dataset (The left image demonstrates the blurring of building windows, the right image shows the masking of company names and logos).
3.1.3. Image Segmentation
Considering the construction machine datasets in the literature and field expert opinions, construction machine categories were selected. The chosen construction machine categories are dump truck, excavator, backhoe loader, wheel loader, compactor, dozer, and grader (Figure 7). Machines with fewer occurrences, like asphalt paving machines and drilling machines, were grouped and named the “other” category. Cars frequently appeared inside or near the construction area in the aerial images; therefore, they were labeled and grouped separately.
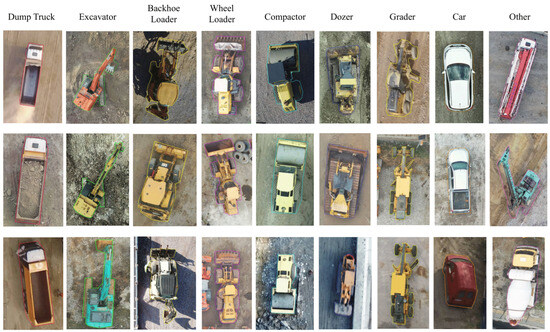
Figure 7.
Examples of selected categories.
In image segmentation and annotation, five experts were assembled to constitute the team, and they were informed of the annotation methodology. The dataset was divided into 100 image subsets and subsequently allocated to the annotators. A cloud-based image annotation tool, CVAT [62], was utilized in this study. The CVAT application was deployed on a web server within the Amazon Web Services infrastructure, enabling parallel execution of the procedure through cloud-based services (Figure 8). In total, annotators devoted 82.38 person-hours to the task of image segmentation and annotation. Since the boundaries of instances were drawn rather than only bounding boxes, the annotation procedure is more labor-intensive than preparing only an object detection dataset. The image dataset was composed in COCO data format and saved in JSON file format. Eventually, 9563 instances were segmented and labeled in 2155 images.
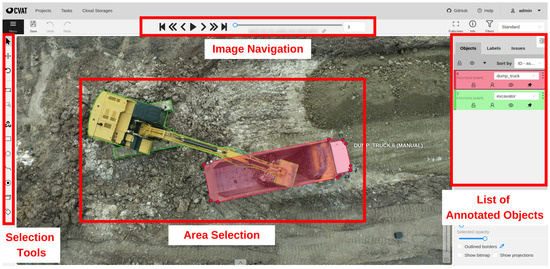
Figure 8.
CVAT annotation interface (Red boxes illustrate: Selection tools, Image Navigation, Area Selection, List of Annotated objects).
3.1.4. Clustering
When previous studies were reviewed, image shots of the same scenes were not grouped separately and were placed in train-test splits. Similar, even duplicate images, were found on the construction datasets in the literature. Because of the similar images, although overall accuracy increases, overlapping images between training and test sets cause memorization problems. The trained model should be tested with unseen images during training. In the study of Xiao and Kang [29], the duplication removal procedure was completed manually. They noted that the possibility of automating the removal of duplicated images by utilizing algorithms that can measure image similarity would be explored. In our proposed AIDCON dataset, there are also overlapping images. Although view angles differ, some machines have included more than one image. Therefore, it is necessary to identify and group them to organize training and test splits appropriately. From this perspective, images were clustered using image similarity and proximity metrics. Example images with similarity and proximity metrics are given in Figure 9.
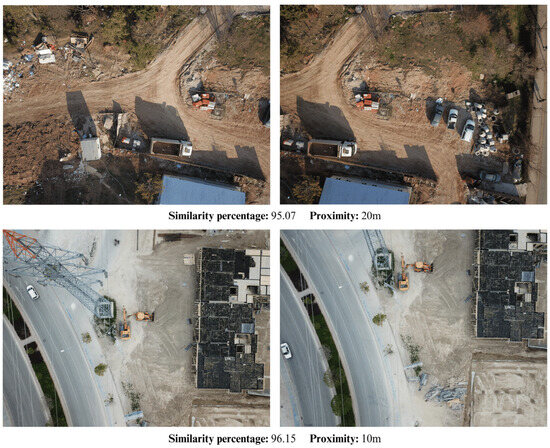
Figure 9.
Two examples of clustering demonstrating clustering metrics, similarity and proximity.
Similarity percentage and proximity metrics were computed to cluster similar images. A Sentence Transformers-based image similarity calculation approach was employed to calculate the similarity percentage [63]. This technique measures the similarity between images by leveraging their textual descriptions. This approach converts each image’s content into fixed-size vector representations, or sentence embeddings, using Sentence Transformers. The resulting embeddings capture the semantic information of the descriptions, allowing for the computation of similarity scores between pairs of images using metrics such as cosine similarity or Euclidean distance. This method transforms visual comparison into semantic comparison, making it applicable for image clustering. Secondly, GPS coordinates extracted from images’ metadata were used to calculate distances as a proximity calculation. Images with more than 95% similarities and closer by 500 m were allocated in the same cluster, resulting in 1386 clusters. Cluster IDs were added to the labeling JSON file. Considering these cluster IDs, the number of images that have identical IDs was used in the same split, such as training or testing.
The annotation file format includes three main arrays: images, annotations, and categories. The images array contains objects with properties such as id, width, height, file_name, hasCategories (an array of category IDs associated with the image), and clusterID (the cluster ID assigned based on similarity and proximity calculations). The annotations array includes objects detailing the annotations for each image, with properties like id, image_id (the ID of the image to which this annotation belongs), category_id (indicating what is depicted), segmentation (coordinates defining the segmentation mask), and bbox (bounding box coordinates). The categories array lists the categories with properties such as id and name. This structured format facilitates efficient clustering with cluster IDs organizing images into groups based on similarity scores and proximity metrics, aiding in dataset splitting for training and testing purposes. Metadata such as altitude and sensor information are also available in the images’ EXIF data. Table 3 shows an example of elements of JSON file format.

Table 3.
Annotation file format.
The graphs given below outline the characteristics of the AIDCON dataset. Figure 10 shows the number of objects and the number of images for each type of construction machine. Excavators, dump trucks, cars, and backhoe loaders have the most instances per image. Figure 11 shows the number of objects per image. A total of 254 negative samples were added to the dataset. Thus, 11.79% of images do not include any objects of construction machines. Compared to previously presented ground-level construction datasets, the proposed dataset has more objects per image due to the broader area of the UAV’s wide-angle camera. Figure 12 demonstrates the number of categories per image, and Figure 13 shows the distribution of the bounding box size containing objects. Most objects are small because of the high altitude of most UAV footage.
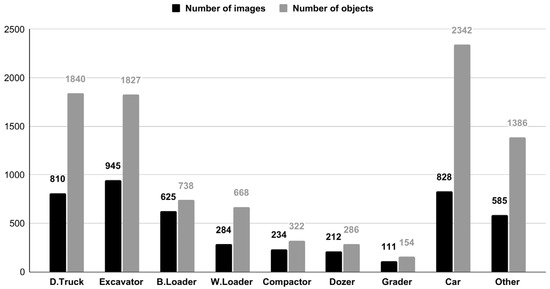
Figure 10.
Number of objects and number of images for each type of construction machine.
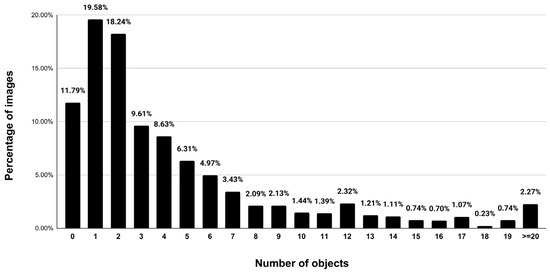
Figure 11.
Number of objects per image (%).
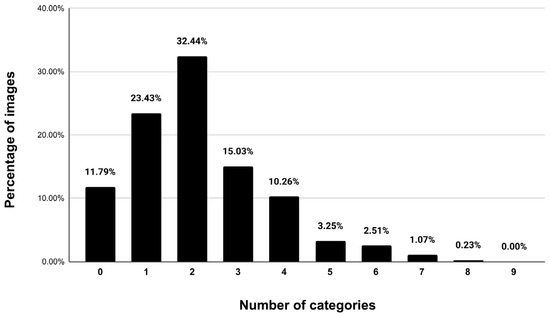
Figure 12.
Number of categories per image (%).
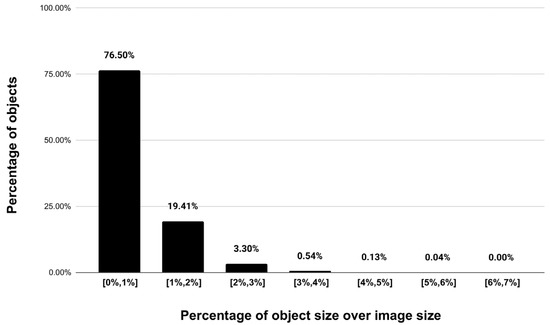
Figure 13.
Distribution of the object size (%).
3.2. Performance Evaluation
Evaluating the performance of a dataset is essential to ensure the effectiveness and reliability of machine learning models. By understanding the dataset’s strengths and weaknesses, researchers can make decisions on its suitability for a specific application. For the proposed AIDCON dataset, we performed a performance analysis using DL algorithms and presented the results in the following parts.
Performance analysis was performed using five different DL algorithms commonly used in computer vision-based research. The detectors were primarily selected from two-stage algorithms since they have better accuracy rates than one-stage algorithms [64,65]. Although one-stage algorithms performed much faster results in the construction datasets, we do not aim to create real-time applications [29,30].
The selected algorithms are Mask R-CNN [16], Cascade Mask R-CNN [17], Mask Scoring R-CNN [18], Hybrid Task Cascade [19] and Pointrend [20]. The image sizes were downsampled into 1300 × 500 pixels to optimize computational resources. ResNet50+FPN was chosen as the backbone for all algorithms. The algorithms were trained for a total of 20 epochs, with an initial learning rate of 0.02. To improve convergence and reduce overfitting, the learning rate was reduced by a factor of 0.1 at the end of the 16th and 19th epochs; a common technique is known as the learning rate schedule.
Two training rounds were conducted to examine the impact of clustering similar images in the same splits—one utilizing a clustering strategy and the other without clustering. The dataset was split into 80% training and 20% testing images. COCO dataset metrics [6] were used for the evaluation of the performance of the AIDCON dataset. The primary metric is mean average precision (mAP), which depends on precision and recall calculations defined below.
In Equations (1) and (2), true positives (TP) denote correct detections, false positives (FP) are the instances belonging to negative classes but labeled as positive, and false negatives (FN) are the ones that belong to positive classes but are labeled as negative ones. Correct detection is determined if the intersection over union (IoU) is above 50%, in which IoU is the ratio of the predicted segmentation mask with the ground truth mask. Average precision (AP) is calculated by measuring average precision via different recall levels for each class (Equation (3)).
The mAP is the mean of all APs of all classes. mAPs of different IoU threshold levels of each algorithm are presented in Table 4 and Table 5. The mAP metric is the average of all APs for IoU, which ranges from 50% to 95%, with a step size of 5%. mAP50 and mAP75 denote IoU 50% and 75% threshold level mAPs, respectively. mAPs, mAPm, and mAPl are the mean average precision of small, medium, and large-sized objects. Small objects’ area is less than 322 pixels, medium objects’ area is between 322 and 962 pixels, and large objects’ area is greater than 962 pixels. The mAPs is not presented in the tables since no objects within the dataset have an area smaller than 32 pixels.

Table 4.
Results of the clustered data (mAPm and mAPl are the mAP of medium- and large-sized objects).

Table 5.
Results of the unclustered data (mAPm and mAPl are the mAP of medium- and large-sized objects).
The training was performed on a computer with Intel(R) Core(TM) i7-10700K CPU @ 3.0 GHz with 12 cores, 128 GB memory, and an NVIDIA GeForce RTX 2080 Ti graphics card with Ubuntu 18.04 operating system. Model training was completed via open source object detection toolbox MMDetection 2.18.1, based on the PyTorch framework [66].
The classwise AP of the best-performed DL algorithm is tabulated in Table 6, in which the IoU threshold is selected at 50%. All IoUs are calculated considering segmentation masks rather than bounding boxes.

Table 6.
Classwise AP Results (IoU = 50%) (D.T: Dump Truck, Exc: Excavator, B.L.: Backhole Loader, W.L.: Wheel Loader, Com.: Compactor, Doz.: Dozer, Gra.: Grader).
4. Results and Discussion
Current construction-related datasets have images taken using fixed or mobile cameras taken on a ground level. Although many applications are based on UAV imagery, there is no large-scale and open aerial image set. This study’s main contribution to the literature is the presentation of an open on-site image dataset, including aerial views of construction machines annotated at the pixel level. Example detections of deep learning algorithms are demonstrated in Figure 14, and results and discussions of the proposed dataset are given below.
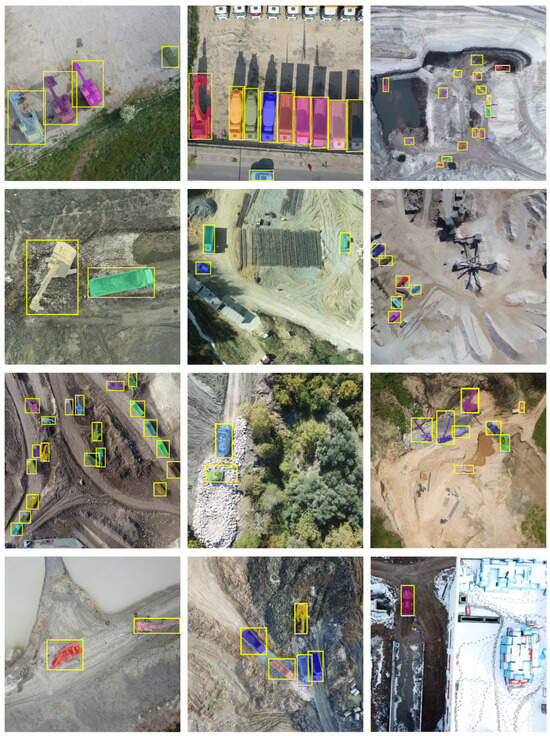
Figure 14.
Examples of correctly segmented objects.
Table 4 and Table 5 present the mean average precision (mAP) values of five object segmentation algorithms: Hybrid Task Cascade, Cascade Mask R-CNN, Mask Scoring R-CNN, Pointrend, and Mask R-CNN. These algorithms are evaluated on a clustered and unclustered dataset. The evaluation metrics used are mAP, mAP50, mAP75, mAPm, and mAPl. These metrics assess the performance of the algorithms on different aspects, such as overall mAP, precision at different Intersections over Union (IoU) levels, and precision on different-sized objects.
The results show that Pointrend performs the best in clustered and unclustered datasets, achieving a maximum mAP50 of 92.6% and 94.2%, respectively. The other four algorithms’ mAP50 range from 92.4% to 88.4% and 93.9% to 93.4% for clustered and unclustered datasets, respectively. The tables also show the mAP values for different IoU threshold levels and medium- and large-sized objects. The results indicate that the proposed AIDCON dataset performs relatively better detecting large objects than medium-sized ones.
Utilizing UAV-captured images offers several benefits over CCTV and mobile camera imagery. The top-down view of construction sites using UAV-mounted high-resolution cameras and GPS technology enables the accurate positioning of objects. UAVs provide fast and safe imaging while minimizing occlusion problems when capturing ground-level images.
The AIDCON dataset comprises images from various construction sites, such as excavation fields, steel structures, reinforced concrete structures, and transportation projects. By capturing images from diverse construction environments, the dataset provides a comprehensive resource for researchers and professionals to develop and refine machine learning algorithms and address construction management challenges across different project types.
Segmenting construction machines in images offers several advantages over merely detecting them, providing a comprehensive understanding of objects. By generating pixel-wise masks for each construction machine, object segmentation allows for a more precise representation of the machines’ boundaries, shapes, and orientations. Providing machine layouts enables us to understand the poses and activities of machines. Object segmentation makes it possible to analyze the spatial relationships between machines and workers. This information can be leveraged to assess and optimize the use of machinery, identify potential hazards or inefficiencies, and plan future activities more effectively. Moreover, segmenting construction machines can aid in detecting anomalies, such as unauthorized access to restricted areas or machinery operated in unsafe conditions. This level of automation can enhance the site’s overall safety, reduce the reliance on manual inspections, and minimize the risk of accidents.
The mean average precision (mAP) of a model trained on an unclustered set is higher than that trained on a clustered set. This is because the unclustered data have utilized similar images in both the training and testing phases, leading the model to memorize the training data. Consequently, the accuracy of the testing set is optimistic and does not reflect how well it will perform on new and unseen images. To avoid this problem, ensuring that the training and testing sets are distinct and do not contain overlapping images is essential. This study followed an image similarity and proximity-based clustering process, dividing the dataset into multiple clusters. Each cluster is used for training and testing. This ensures that the model is evaluated on data not seen during training. Therefore, compared to the unclustered set, the results of the clustered set are more reliable and appropriate for real-world applications.
The table of classwise AP results indicates that Pointrend achieves the highest AP for most classes, including dump truck, excavator, backhoe loader, wheel loader, compactor, dozer, grader, and car (Table 6). However, the algorithm encounters difficulty in accurately identifying objects belonging to the “other” category, which comprises a diverse range of classes such as mobile cranes, concrete pumpers, cement trucks, drilling machines, asphalt-making machines, and forklifts, among others. This difficulty arises due to the limited availability of images representing these classes, which were thus grouped for analysis. Given the varied shapes and features of the objects within the “other” category, learning the distinctive characteristics of this class from a limited number of images presents a considerable challenge. Consequently, there is a need for additional images to improve the performance of the deep learning algorithms on this class of objects.
In construction sites, excavators and dump trucks generally work together to move materials such as soil, rock, or debris. When excavators and dump trucks work closely together, it can be challenging for algorithms to distinguish between them accurately. One of the main issues that can arise is the merging of machine boundaries between the excavator and dump truck at the top view, which can be seen in Figure 15. This can cause confusion when trying to classify these machines separately, leading to erroneously labeling them as one machine, and decreasing accuracy.
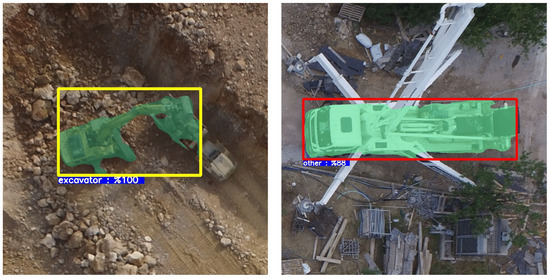
Figure 15.
Examples of misclassified machinery.
Identifying thinner parts of machines, particularly those falling under the “other” category, has been challenging. This issue is highlighted by the incomplete representation of certain parts of a concrete pumper machine in Figure 15. To address this limitation, capturing the varied poses of these machine classes is critical. This approach would provide a more comprehensive representation of the machines, facilitating more accurate identification of their thinner components. Furthermore, when images are downsampled to smaller sizes (in this case, 1300 × 500 pixels), the thinner parts of the objects may lose essential details or become indistinct. This loss of information can make it difficult for the algorithms to identify and segment those parts accurately.
As indicated in the evaluation results, there are no objects within the dataset with an area smaller than 322 pixels. This lack of small objects can be a problem when detecting construction machines that appear smaller in aerial images due to factors such as the altitude of UAV footage. Limiting the flight altitude to a maximum of 150 m is recommended to ensure optimal performance.
The number of images in the AIDCON dataset is crucial for enhancing the performance of machine learning models. By increasing the number of images, the dataset can better represent the variability and complexity of construction machines, leading to improved model generalizability and performance on unseen data. To address the limitations observed in the current dataset, increasing the dataset size with diverse and representative images, including varied poses and machine types, is recommended to ensure more accurate detection and classification.
5. Conclusions
In conclusion, this paper presents the AIDCON dataset, an open, on-site image dataset containing 2155 aerial images of 9563 construction machines annotated at the pixel level belonging to 9 categories. The dataset enables researchers and professionals to develop and refine machine learning algorithms for construction site management applications across different project types, such as steel and reinforced concrete structures and transportation projects.
The main contributions of this study can be summarized as follows: (i) An aerial construction image dataset is proposed, which captures a wide variety of construction environments and machinery types. It provides a valuable resource for researchers leveraging aerial imagery for construction site analysis. (ii) The images in the dataset are labeled at the pixel level, which enables an understanding of the poses and activities of machines. (iii) A clustering strategy is introduced in this study. This strategy helps to create appropriate training and testing splits and ensures reliable performance for real-world applications. (iv) Finally, this study evaluates five state-of-the-art deep learning algorithms on the aerial construction image dataset. The results provide insights into their performance and areas for improvement, which can guide future research in this domain.
Challenges remain in accurately identifying objects in the “other” category and distinguishing between machines working in close proximity. To address these limitations and improve the performance of deep learning algorithms on the AIDCON dataset, increasing the dataset size with diverse and representative images, including varied poses and machine types, is recommended.
The AIDCON dataset offers a valuable resource for advancing machine learning algorithms in the construction industry, with the potential to transform site management, improve safety, decrease dependency on manual inspections, and reduce accident risks. As computer vision technology progresses, we expect the AIDCON dataset to underpin future breakthroughs in monitoring and managing construction sites.
Author Contributions
Data curation, A.B.E.; methodology, A.B.E. and E.A.; writing—Original draft preparation, A.B.E. and O.P.; writing—review and editing E.A.; project administration, O.P.; All authors have read and agreed to the published version of the manuscript.
Funding
This research is funded by a grant from the Scientific and Technological Research Council of Türkiye (TUBITAK), Grant No. 122M055. TUBITAK’s support is gratefully acknowledged.
Data Availability Statement
Upon request, the corresponding author of this study is willing to provide some or all of the data gathered during the research. These materials can be accessible through the website http://ai2lab.org/aidcon (accessed on 27 June 224).
Conflicts of Interest
The authors declare no conflicts of interest.
References
- Tamin, M.A.; Darwin, N.; Majid, Z.; Mohd Ariff, M.F.; Idris, K.M.; Manan Samad, A. Volume Estimation of Stockpile Using Unmanned Aerial Vehicle. In Proceedings of the 9th IEEE International Conference on Control System, Computing and Engineering, ICCSCE 2019, Penang, Malaysia, 29 November–1 December 2019; pp. 49–54. [Google Scholar]
- Chen, C.; Zhu, Z.; Hammad, A. Automated Excavators Activity Recognition and Productivity Analysis from Construction Site Surveillance Videos. Autom. Constr. 2020, 110, 103045. [Google Scholar] [CrossRef]
- Zhang, S.; Zhang, L. Construction Site Safety Monitoring and Excavator Activity Analysis System. Constr. Robot. 2022, 6, 151–161. [Google Scholar] [CrossRef]
- Rezazadeh Azar, E.; McCabe, B. Part Based Model and Spatial-Temporal Reasoning to Recognize Hydraulic Excavators in Construction Images and Videos. Autom. Constr. 2012, 24, 194–202. [Google Scholar] [CrossRef]
- Zou, Z.; Chen, K.; Shi, Z.; Guo, Y.; Ye, J. Object Detection in 20 Years: A Survey. Proc. IEEE 2023, 111, 257–276. [Google Scholar] [CrossRef]
- Lin, T.Y.; Maire, M.; Belongie, S.; Hays, J.; Perona, P.; Ramanan, D.; Dollár, P.; Zitnick, C.L. Microsoft COCO: Common Objects in Context. In Proceedings of the Computer Vision–ECCV 2014: 13th European Conference, Zurich, Switzerland, 6–12 September 2014; Proceedings, Part V 13. pp. 740–755. [Google Scholar]
- Everingham, M.; Van Gool, L.; Williams, C.K.I.; Winn, J.; Zisserman, A. The Pascal Visual Object Classes (VOC) Challenge. Int. J. Comput. Vis. 2010, 88, 303–338. [Google Scholar] [CrossRef]
- Roberts, D.; Golparvar-Fard, M. End-to-End Vision-Based Detection, Tracking and Activity Analysis of Earthmoving Equipment Filmed at Ground Level AAA. Autom. Constr. 2019, 105, 102811. [Google Scholar] [CrossRef]
- Xiao, B.; Kang, S.-C. Vision-Based Method Integrating Deep Learning Detection for Tracking Multiple Construction Machines. J. Comput. Civ. Eng. 2021, 35, 04020071. [Google Scholar] [CrossRef]
- Kim, D.; Liu, M.; Lee, S.; Kamat, V.R. Remote Proximity Monitoring between Mobile Construction Resources Using Camera-Mounted UAVs. Autom. Constr. 2019, 99, 168–182. [Google Scholar] [CrossRef]
- Fang, Q.; Li, H.; Luo, X.; Ding, L.; Luo, H.; Rose, T.M.; An, W. Detecting Non-Hardhat-Use by a Deep Learning Method from Far-Field Surveillance Videos. Autom. Constr. 2018, 85, 1–9. [Google Scholar] [CrossRef]
- Kim, S.; Irizarry, J.; Bastos Costa, D. Potential Factors Influencing the Performance of Unmanned Aerial System (UAS) Integrated Safety Control for Construction Worksites. In Proceedings of the Construction Research Congress 2016, San Juan, Puerto Rico, 31 May–2 June 2016; pp. 2039–2049. [Google Scholar]
- Liu, P.; Chen, A.Y.; Huang, Y.N.; Han, J.Y.; Lai, J.S.; Kang, S.C.; Wu, T.H.; Wen, M.C.; Tsai, M.H. A Review of Rotorcraft Unmanned Aerial Vehicle (UAV) Developments and Applications in Civil Engineering. Smart Struct. Syst. 2014, 13, 1065–1094. [Google Scholar] [CrossRef]
- Akinsemoyin, A.; Awolusi, I.; Chakraborty, D.; Al-Bayati, A.J.; Akanmu, A. Unmanned Aerial Systems and Deep Learning for Safety and Health Activity Monitoring on Construction Sites. Sensors 2023, 23, 6690. [Google Scholar] [CrossRef]
- Duan, R.; Deng, H.; Tian, M.; Deng, Y.; Lin, J. SODA: A Large-Scale Open Site Object Detection Dataset for Deep Learning in Construction. Autom. Constr. 2022, 142, 104499. [Google Scholar] [CrossRef]
- He, K.; Gkioxari, G.; Dollár, P.; Girshick, R. Mask R-CNN. IEEE Trans. Pattern Anal. Mach. Intell. 2018, 42, 386–397. [Google Scholar] [CrossRef]
- Cai, Z.; Vasconcelos, N. Cascade R-CNN: High Quality Object Detection and Instance Segmentation. IEEE Trans. Pattern Anal. Mach. Intell. 2021, 43, 1483–1498. [Google Scholar] [CrossRef]
- Huang, Z.; Huang, L.; Gong, Y.; Huang, C.; Wang, X. Mask Scoring R-CNN. In Proceedings of the IEEE Computer Society Conference on Computer Vision and Pattern Recognition, Long Beach, CA, USA, 16–20 June 2019; Volume 2019, pp. 6402–6411. [Google Scholar]
- Chen, K.; Pang, J.; Wang, J.; Xiong, Y.; Li, X.; Sun, S.; Feng, W.; Liu, Z.; Shi, J.; Ouyang, W.; et al. Hybrid Task Cascade for Instance Segmentation. In Proceedings of the IEEE Computer Society Conference on Computer Vision and Pattern Recognition, Long Beach, CA, USA, 16–20 June 2019; Volume 2019, pp. 4969–4978. [Google Scholar] [CrossRef]
- Kirillov, A.; Wu, Y.; He, K.; Girshick, R. Pointrend: Image Segmentation as Rendering. In Proceedings of the IEEE Computer Society Conference on Computer Vision and Pattern Recognition, Seattle, WA, USA, 14–19 June 2020; pp. 9799–9808. [Google Scholar]
- Fei-Fei, L.; Fergus, R.; Perona, P. One-Shot Learning of Object Categories. IEEE Trans. Pattern Anal. Mach. Intell. 2006, 28, 594–611. [Google Scholar] [CrossRef] [PubMed]
- Griffin, G.; Holub, A.; Perona, P. Caltech-256 Object Category Dataset. Available online: http://www.vision.caltech.edu/datasets/ (accessed on 19 August 2024).
- Krizhevsky, A. Learning Multiple Layers of Features from Tiny Images. Master’s Thesis, Department of Computer Science, University of Toronto, Toronto, ON, Canada, 2009. [Google Scholar]
- Russakovsky, O.; Deng, J.; Su, H.; Krause, J.; Satheesh, S.; Ma, S.; Huang, Z.; Karpathy, A.; Khosla, A.; Bernstein, M.; et al. Imagenet Large Scale Visual Recognition Challenge. Int. J. Comput. Vis. 2015, 115, 211–252. [Google Scholar] [CrossRef]
- Kuznetsova, A.; Rom, H.; Alldrin, N.; Uijlings, J.; Krasin, I.; Pont-Tuset, J.; Kamali, S.; Popov, S.; Malloci, M.; Kolesnikov, A.; et al. The Open Images Dataset V4: Unified Image Classification, Object Detection, and Visual Relationship Detection at Scale. Int. J. Comput. Vis. 2018, 128, 1956–1981. [Google Scholar] [CrossRef]
- Gupta, A.; Dollar, P.; Girshick, R. LVIS: A Dataset for Large Vocabulary Instance Segmentation. In Proceedings of the IEEE Computer Society Conference on Computer Vision and Pattern Recognition, Long Beach, CA, USA, 16–20 June 2019; Volume 2019, pp. 5351–5359. [Google Scholar]
- Tajeen, H.; Zhu, Z. Image Dataset Development for Measuring Construction Equipment Recognition Performance. Autom. Constr. 2014, 48, 1–10. [Google Scholar] [CrossRef]
- Kim, H.; Kim, H.; Hong, Y.W.; Byun, H. Detecting Construction Equipment Using a Region-Based Fully Convolutional Network and Transfer Learning. J. Comput. Civ. Eng. 2018, 32, 04017082. [Google Scholar] [CrossRef]
- Xiao, B.; Kang, S.-C. Development of an Image Data Set of Construction Machines for Deep Learning Object Detection. J. Comput. Civ. Eng. 2021, 35, 1–18. [Google Scholar] [CrossRef]
- Xuehui, A.; Li, Z.; Zuguang, L.; Chengzhi, W.; Pengfei, L.; Zhiwei, L. Dataset and Benchmark for Detecting Moving Objects in Construction Sites. Autom. Constr. 2021, 122, 103482. [Google Scholar] [CrossRef]
- Del Savio, A.; Luna, A.; Cárdenas-Salas, D.; Vergara, M.; Urday, G. Dataset of Manually Classified Images Obtained from a Construction Site. Data Br. 2022, 42, 108042. [Google Scholar] [CrossRef] [PubMed]
- Yan, X.; Zhang, H.; Wu, Y.; Lin, C.; Liu, S. Construction Instance Segmentation (CIS) Dataset for Deep Learning-Based Computer Vision. Autom. Constr. 2023, 156, 105083. [Google Scholar] [CrossRef]
- Soltani, M.M.; Zhu, Z.; Hammad, A. Automated Annotation for Visual Recognition of Construction Resources Using Synthetic Images. Autom. Constr. 2016, 62, 14–23. [Google Scholar] [CrossRef]
- Barrera-Animas, A.Y.; Davila Delgado, J.M. Generating Real-World-like Labelled Synthetic Datasets for Construction Site Applications. Autom. Constr. 2023, 151, 104850. [Google Scholar] [CrossRef]
- Bang, S.; Baek, F.; Park, S.; Kim, W.; Kim, H. Image Augmentation to Improve Construction Resource Detection Using Generative Adversarial Networks, Cut-and-Paste, and Image Transformation Techniques. Autom. Constr. 2020, 115, 103198. [Google Scholar] [CrossRef]
- Hwang, J.; Kim, J.; Chi, S.; Seo, J.O. Development of Training Image Database Using Web Crawling for Vision-Based Site Monitoring. Autom. Constr. 2022, 135, 104141. [Google Scholar] [CrossRef]
- Hwang, J.; Kim, J.; Chi, S. Site-Optimized Training Image Database Development Using Web-Crawled and Synthetic Images. Autom. Constr. 2023, 151, 104886. [Google Scholar] [CrossRef]
- Memarzadeh, M.; Golparvar-Fard, M.; Niebles, J.C. Automated 2D Detection of Construction Equipment and Workers from Site Video Streams Using Histograms of Oriented Gradients and Colors. Autom. Constr. 2013, 32, 24–37. [Google Scholar] [CrossRef]
- Fang, W.; Ding, L.; Zhong, B.; Love, P.E.D.; Luo, H. Automated Detection of Workers and Heavy Equipment on Construction Sites: A Convolutional Neural Network Approach. Adv. Eng. Informatics 2018, 37, 139–149. [Google Scholar] [CrossRef]
- Xiang, X.; Lv, N.; Guo, X.; Wang, S.; El Saddik, A. Engineering Vehicles Detection Based on Modified Faster R-CNN for Power Grid Surveillance. Sensors 2018, 18, 2258. [Google Scholar] [CrossRef] [PubMed]
- Lin, Z.-H.; Chen, A.Y.; Hsieh, S.-H. Temporal Image Analytics for Abnormal Construction Activity Identification. Autom. Constr. 2021, 124, 103572. [Google Scholar] [CrossRef]
- Golparvar-Fard, M.; Heydarian, A.; Niebles, J.C. Vision-Based Action Recognition of Earthmoving Equipment Using Spatio-Temporal Features and Support Vector Machine Classifiers. Adv. Eng. Inform. 2013, 27, 652–663. [Google Scholar] [CrossRef]
- Zhu, Z.; Ren, X.; Chen, Z. Integrated Detection and Tracking of Workforce and Equipment from Construction Jobsite Videos. Autom. Constr. 2017, 81, 161–171. [Google Scholar] [CrossRef]
- Luo, X.; Li, H.; Cao, D.; Dai, F.; Seo, J.; Lee, S. Recognizing Diverse Construction Activities in Site Images via Relevance Networks of Construction-Related Objects Detected by Convolutional Neural Networks. J. Comput. Civ. Eng. 2018, 32, 1–16. [Google Scholar] [CrossRef]
- Gong, J.; Caldas, C.H. An Object Recognition, Tracking, and Contextual Reasoning-Based Video Interpretation Method for Rapid Productivity Analysis of Construction Operations. Autom. Constr. 2011, 20, 1211–1226. [Google Scholar] [CrossRef]
- Kim, J.; Chi, S. Action Recognition of Earthmoving Excavators Based on Sequential Pattern Analysis of Visual Features and Operation Cycles. Autom. Constr. 2019, 104, 255–264. [Google Scholar] [CrossRef]
- Kim, H.; Bang, S.; Jeong, H.; Ham, Y.; Kim, H. Analyzing Context and Productivity of Tunnel Earthmoving Processes Using Imaging and Simulation. Autom. Constr. 2018, 92, 188–198. [Google Scholar] [CrossRef]
- Soltani, M.M.; Zhu, Z.; Hammad, A. Skeleton Estimation of Excavator by Detecting Its Parts. Autom. Constr. 2017, 82, 1–15. [Google Scholar] [CrossRef]
- Mahmood, B.; Han, S.; Seo, J. Implementation Experiments on Convolutional Neural Network Training Using Synthetic Images for 3D Pose Estimation of an Excavator on Real Images. Autom. Constr. 2022, 133, 103996. [Google Scholar] [CrossRef]
- Chi, S.; Caldas, C.H. Automated Object Identification Using Optical Video Cameras on Construction Sites. Comput. Civ. Infrastruct. Eng. 2011, 26, 368–380. [Google Scholar] [CrossRef]
- Rezazadeh Azar, E.; McCabe, B. Automated Visual Recognition of Dump Trucks in Construction Videos. J. Comput. Civ. Eng. 2012, 26, 769–781. [Google Scholar] [CrossRef]
- Rezazadeh Azar, E.; Dickinson, S.; McCabe, B. Server-Customer Interaction Tracker: Computer Vision–Based System to Estimate Dirt-Loading Cycles. J. Constr. Eng. Manag. 2013, 139, 785–794. [Google Scholar] [CrossRef]
- Kim, J.; Chi, S.; Seo, J. Interaction Analysis for Vision-Based Activity Identification of Earthmoving Excavators and Dump Trucks. Autom. Constr. 2018, 87, 297–308. [Google Scholar] [CrossRef]
- Kim, J.; Hwang, J.; Chi, S.; Seo, J.O. Towards Database-Free Vision-Based Monitoring on Construction Sites: A Deep Active Learning Approach. Autom. Constr. 2020, 120, 103376. [Google Scholar] [CrossRef]
- Kim, J.; Chi, S. A Few-Shot Learning Approach for Database-Free Vision-Based Monitoring on Construction Sites. Autom. Constr. 2021, 124, 103566. [Google Scholar] [CrossRef]
- Arabi, S.; Haghighat, A.; Sharma, A. A Deep-Learning-Based Computer Vision Solution for Construction Vehicle Detection. Comput. Civ. Infrastruct. Eng. 2020, 35, 753–767. [Google Scholar] [CrossRef]
- Guo, Y.; Xu, Y.; Li, S. Dense Construction Vehicle Detection Based on Orientation-Aware Feature Fusion Convolutional Neural Network. Autom. Constr. 2020, 112, 103124. [Google Scholar] [CrossRef]
- Meng, L.; Peng, Z.; Zhou, J.; Zhang, J.; Lu, Z.; Baumann, A.; Du, Y. Real-Time Detection of Ground Objects Based on Unmanned Aerial Vehicle Remote Sensing with Deep Learning: Application in Excavator Detection for Pipeline Safety. Remote Sens. 2020, 12, 182. [Google Scholar] [CrossRef]
- Bang, S.; Hong, Y.; Kim, H. Proactive Proximity Monitoring with Instance Segmentation and Unmanned Aerial Vehicle-Acquired Video-Frame Prediction. Comput. Civ. Infrastruct. Eng. 2021, 36, 800–816. [Google Scholar] [CrossRef]
- DJI Camera Drones. Available online: https://www.dji.com/global/products/camera-drones (accessed on 19 August 2024).
- Yuneec Drones. Available online: https://yuneec.online/drones/ (accessed on 19 August 2024).
- CVAT Powerful and Efficient Computer Vision Annotation Tool (CVAT). Available online: https://github.com/opencv/cvat (accessed on 19 August 2022).
- Reimers, N.; Gurevych, I. Sentence-BERT: Sentence Embeddings Using Siamese BERT-Networks. In Proceedings of the 2019 Conference on Empirical Methods in Natural Language Processing and the 9th International Joint Conference on Natural Language Processing (EMNLP-IJCNLP), Hong Kong, China, 3–7 November 2019; pp. 3982–3992. [Google Scholar]
- Soviany, P.; Ionescu, R.T. Optimizing the Trade-off between Single-Stage and Two-Stage Deep Object Detectors Using Image Difficulty Prediction. In Proceedings of the Proceedings—2018 20th International Symposium on Symbolic and Numeric Algorithms for Scientific Computing, SYNASC 2018, Timisoara, Romania, 20–23 September 2018; pp. 209–214. [Google Scholar]
- Carranza-García, M.; Torres-Mateo, J.; Lara-Benítez, P.; García-Gutiérrez, J. On the Performance of One-Stage and Two-Stage Object Detectors in Autonomous Vehicles Using Camera Data. Remote Sens. 2021, 13, 89. [Google Scholar] [CrossRef]
- MMDetection Contributors OpenMMLab Detection Toolbox and Benchmark. Available online: https://github.com/open-mmlab/mmdetection (accessed on 19 August 2024).
Disclaimer/Publisher’s Note: The statements, opinions and data contained in all publications are solely those of the individual author(s) and contributor(s) and not of MDPI and/or the editor(s). MDPI and/or the editor(s) disclaim responsibility for any injury to people or property resulting from any ideas, methods, instructions or products referred to in the content. |
© 2024 by the authors. Licensee MDPI, Basel, Switzerland. This article is an open access article distributed under the terms and conditions of the Creative Commons Attribution (CC BY) license (https://creativecommons.org/licenses/by/4.0/).