Article

Extending AVHRR Climate Data Records into the VIIRS Era for Polar Climate Research

1
Cooperative Institute for Meteorological Satellite Studies, University of Wisconsin-Madison, 1225 West Dayton Street, Madison, WI 53706, USA
2
Earth System Science Interdisciplinary Center—ESSIC, University of Maryland, College Park, MD 20740, USA
3
Knapp WeatherSat Services LLC, Asheville, NC 28806, USA
*
Author to whom correspondence should be addressed.
Remote Sens. 2025, 17(20), 3495; https://doi.org/10.3390/rs17203495
Submission received: 14 August 2025 / Revised: 13 October 2025 / Accepted: 15 October 2025 / Published: 21 October 2025

Abstract

Highlights

What are the main findings?
  • A statistical method for intercalibrating VIIRS bands to AVHRR channels allows for the use of previously developed AVHRR algorithms with VIIRS data.
  • Two existing AVHRR climate data records are now being continued with VIIRS: the Polar Pathfinder Fundamental Climate Data Record (FCDR) and the Polar Pathfinder Extended Thematic Climate Data Record (TCDR). The TCDR provides high latitude surface properties, cloud characteristics, and the radiation budget.
What are the implication of the main finding?
  • Combining AVHRR and VIIRS data into long-term, continuous, consistent, and traceable CDRs provides the fundamental tools for monitoring the polar environment, its weather, and climate.
  • The use of the original AVHRR Polar Pathfinder CDRs has resulted in many discoveries about polar climate trends and interactions. Extending the time series with VIIRS will allow the scientific community to continue polar climate research with these products well into the future.

Abstract

The Advanced Very High-Resolution Radiometer (AVHRR) onboard NOAA-7 through NOAA-19 satellites has been the primary data source for two Climate Data Records (CDRs) that were developed specifically for Arctic and Antarctic studies: the AVHRR Polar Pathfinder (APP) and Extended AVHRR Polar Pathfinder (APP-x). With the decommissioning of these satellites and the loss of the AVHRR, a method for extending the CDRs with the Visible Infrared Imaging Radiometer Suite (VIIRS) on NOAA’s recent satellites is presented. The goal is to produce long-term, continuous, consistent, and traceable CDRs for polar climate research. As a result, APP and APP-x can now be continued as the VIIRS Polar Pathfinder (VPP) and Extended VIIRS Polar Pathfinder (VPP-x) CDRs. To ensure consistency, a VIIRS Global Area Coverage (VGAC) dataset that is comparable to AVHRR GAC data was used to develop an analogous VIIRS Polar Pathfinder suite. Five VIIRS bands (I1, I2, M12, M15, and M16) were selected to correspond to AVHRR Channels 1, 2, 3b, 4, and 5, respectively. A multivariate regression approach was used to intercalibrate these VIIRS bands to AVHRR channels based on data from overlapping AVHRR and VIIRS observations from 2013 to 2018. The data from 2012 and 2019 were reserved for independent validation. For the Arctic region north of 60°N at 14:00/04:00 Local Solar Time (LST) during 2012–2019, mean biases between APP and VPP composites at a spatial resolution of 5 km are −0.85%/3.03% (Channel 1), −1.22%/3.65% (Channel 2), −0.18 K/0.81 K (Channel 3b), 0.01 K/0.24 K (Channel 4), and 0.07 K/0.19 K (Channel 5). Mean biases between APP-x and VPP-x at a spatial resolution of 25 km for the same region and period are −1.52%/−1.48% for surface broadband albedo, 0.69 K/0.61 K for surface skin temperature, and −0.011 m/−0.017 m for sea ice thickness. Similar results were observed for the Antarctic region south of 60°S at 14:00/02:00 LST, indicating strong agreement between APP and VPP, and between APP-x and VPP-x.

1. Introduction

Weather satellite data-based climate data records (CDRs) are long-term, scientifically validated, consistent, and continuous time-series datasets derived from satellite measurements for climate research. Organizations like NOAA, NASA, and EUMETSAT have generated these CDRs operationally that are available for users to check and download at https://www.ncei.noaa.gov/products/climate-data-records, (accessed on 10 October 2025) https://www.earthdata.nasa.gov/data (accessed on 10 October 2025), and https://www.eumetsat.int/climate-data-records (accessed on 10 October 2025). Our AVHRR Polar Pathfinder (APP) and the Extended AVHRR Polar Pathfinder (APP-x) Climate Data Records (CDRs) [1] have been generated, uploaded, and archived operationally at NOAA at https://www.ncei.noaa.gov/products/climate-data-records/avhrr-polar-pathfinder (accessed on 10 October 2025) and https://www.ncei.noaa.gov/products/climate-data-records/extended-avhrr-polar-pathfinder (accessed on 10 October 2025). The APP and APP-x CDRs include a wide range of climate variables for both Arctic and Antarctic regions for short-term and long-term climate research, and their detailed validation information can be found in the reference [1] as well.
With Visible Infrared Imaging Radiometer Suite (VIIRS) data from NOAA’s Joint Polar Satellite System (JPSS) being available starting from 2012, and NOAA-19 Advanced Very High-Resolution Radiometer (AVHRR) now reaching the end of its lifetime, there is an urgent need to incorporate VIIRS data into two Climate Data Records (CDRs) that were developed specifically for polar climate research. APP is a Fundamental Climate Data Record (FCDR) providing calibrated brightness temperatures and reflectances for the AVHRR channels, viewing and illumination geometry, and time. APP-x is a Thematic Climate Data Record (TCDR), utilizing APP to produce 20 geophysical variables including cloud properties (binary mask, particle phase, optical depth, particle effective radius, temperature, pressure, and type), sea ice thickness, surface broadband albedo and skin temperature (both all-sky), and radiative fluxes (upwelling and downwelling shortwave and longwave, surface and top-of-atmosphere). Both are generated twice daily over the Arctic and Antarctic at local solar times for each grid point and provide data from 1982 through the present. APP and APP-x are updated daily and delivered to the National Centers for Environmental Information (NCEI) where they are made available to the public. Additional information is available in [1].
Adding VIIRS data in a way that retains consistency in the time series will extend those CDRs well into the future, providing long-term, robust, and traceable data for polar climate research. The need to continue AVHRR-based satellite climate data records by incorporating VIIRS has been recognized internationally, though methods to accomplish the merging are varied and few. For example, Karlsson et al. [2], derived Spectral Band Adjustment Factors (SBAFs) using linear regression and neural networks (NNs) to match data from the two instruments with an application to the third edition of the Cloud, Albedo, and Radiation climate data record, CLARA-A3, developed by the EUMETSAT Climate Monitoring Satellite Application Facility (CM SAF). VIIRS is now the primary sensor used in the generation of the NOAA AVHRR Surface Reflectance CDR (Version 5) [3], and bias-corrected VIIRS sea surface temperature (SST) is now incorporated in an AVHRR SST CDR [4].
The purpose of this paper is to describe the method for continuing the Polar Pathfinder climate data records with VIIRS, present quantitative assessments of the differences between them, and provide examples of geophysical variables from the AVHRR- and VIIRS-based CDRs. The procedure begins with a new dataset of calibrated VIIRS data that resembles AVHRR sensor data. Periods of overlap between AVHRR and VIIRS are used to fit VIIRS reflectances and brightness temperatures to the corresponding AVHRR data with a multivariate regression method. Geophysical variables are then calculated from the AVHRR-like VIIRS data. For clarity, in this paper we refer to the CDRs that incorporate VIIRS data as “VPP” and “VPP-x”, analogous to APP and APP-x. However, the CDRs for the entire time series as distributed by NCEI are called the “Polar Pathfinder FCDR” and the “Polar Pathfinder Extended CDR”.

2. VIIRS Global Area Coverage

To extend the AVHRR time series with VIIRS data, we employ a VIIRS version of AVHRR GAC data, called VIIRS Global Area Coverage (VGAC) [5,6]. VGAC from the Suomi NPP (SNPP), NOAA-20 and NOAA-21 satellites was developed by the National Centers for Environmental Information (NCEI). It is available through NOAA/CLASS and University of Maryland. The main challenge of coupling AVHRR and VIIRS data is their spectral differences. Some VIIRS bands are nearly identical to AVHRR channels; others are not. VIIRS bands that are spectrally closest to AVHRR’s five channels were selected and used in the VIIRS Polar Pathfinder (VPP) and Extended VIIRS Polar Pathfinder (VPP-x) CDRs, for better intercalibration and consistency with the APP and APP-x CDRs both spatially and temporarily. The selected VIIRS bands are I1, I2, M12, M15, and M16, corresponding to AVHRR channels 1, 2, 3b, 4, and 5 [7,8]. More information about AVHRR and VIIRS spectral response functions can be found at https://www.star.nesdis.noaa.gov/smcd/emb/vci/VH/npp_SpectralResponseFunctions.php (accessed on 10 October 2025).
To apply current algorithms developed for AVHRR data in APP and APP-x CDRs, the selected NOAA-20 VIIRS band data need to be spectrally intercalibrated to the NOAA-19 AVHRR channel data as closely as possible. While VIIRS is a more advanced instrument than AVHRR, the time series that in this dataset starts in 1982 can only be continued in a consistent manner if VIIRS is made to spectrally match AVHRR, thereby losing some of the more advanced features of VIIRS. A multivariate regression approach was adopted for the intercalibration work. Overlapped AVHRR and VIIRS data from 2013 to 2018 were used in multivariate regression, and the overlapped data for 2012 and 2019 were used as an independent two-year dataset to examine and verify the intercalibration regression model, as described in detail in the next section.

3. Intercalibration

The NOAA-19 AVHRR and NOAA-20 VIIRS GAC data were used to generate the Polar Pathfinder FCDR [9]. The significant variations in the Equatorial Crossing Time (ECT) of a satellite will impact the accuracy in generating a consistent time series of channel signals, as discussed elsewhere [10,11,12,13,14]. There have been considerable orbital drifts over time in the NOAA POES ECTs, as shown in Figure 1. APP and VPP swath data are composited at 0400 and 1400 Local Solar Time (LST) for the Arctic, and 0200 and 1400 LST for the Antarctic for location (pixel). Both ascending and descending orbits are used. These are target times; composites can include data within two hours of those times. The five AVHRR-like VIIRS channels have been selected from NOAA-20 satellite to match NOAA-19 AVHRR channels and have also been calibrated to NOAA-19 five AVHRR channels as described later. The specifications of the AVHRR and VIIRS channels are listed in Table 1.
Overlapped AVHRR and VIIRS data from 2013 through 2018 were used in a multivariate regression approach for both poles, and the overlapped data from 2012 and 2019 were used as an independent dataset to examine and verify the regression model. We selected the overlapped data based on their locations, dates and times, scan angles, solar zenith angles, and relative azimuth angles. If those three angles’ differences between AVHRR and VIIRS are all in the range of +0.1 to −0.1 degrees, then the data from AVHRR and VIIRS are deemed sufficiently close in space and time (by virtue of the solar zenith angle) and are used in the multivariable regression for constructing an intercalibration model. Given the minimal differences in space and time of the matched data, errors due to spectral differences, observation times, geolocation, and differences in cloud cover will be minimized and accounted for empirically in the regression model.
The model equation used to calibrate NOAA-20 VIIRS channel reflectance and brightness temperature to NOAA-19 AVHRR reflectance and brightness temperature is as
C a v = a 0 + a 1 C v i + a 2 A s c + a 3 A s z + a 4 A r a
where Cav is the calculated equivalent AVHRR channel reflectance (channel 1 or 2) or brightness temperature (channel 3b, 4, or 5) using VIIRS channels after calibration, Cvi is VIIRS channel reflectance (I1 or I2) or brightness temperature (M12, M15, or M16), Asc is VIIRS scan angle, Asz is VIIRS solar zenith angle, Ara is VIIRS relative azimuth angle, a0, a1, a2, a3, and a4 are the regression coefficients dependent upon the channel selection, hemisphere selection, and time selection. The regression coefficients are listed in Table 2, along with the multivariate regression correlation coefficients to show the regression model performance for each pole and time. The correlation coefficients are never below 0.91, indicating good model performance overall for both poles. NOAA-20 VIIRS data were used to build the model. Therefore, the model coefficients should be recalculated with data from VIIRS on NOAA-21 and future VIIRS on JPSS-3 and −4 if there are significant spectral differences.

4. Validation

4.1. VPP vs. APP

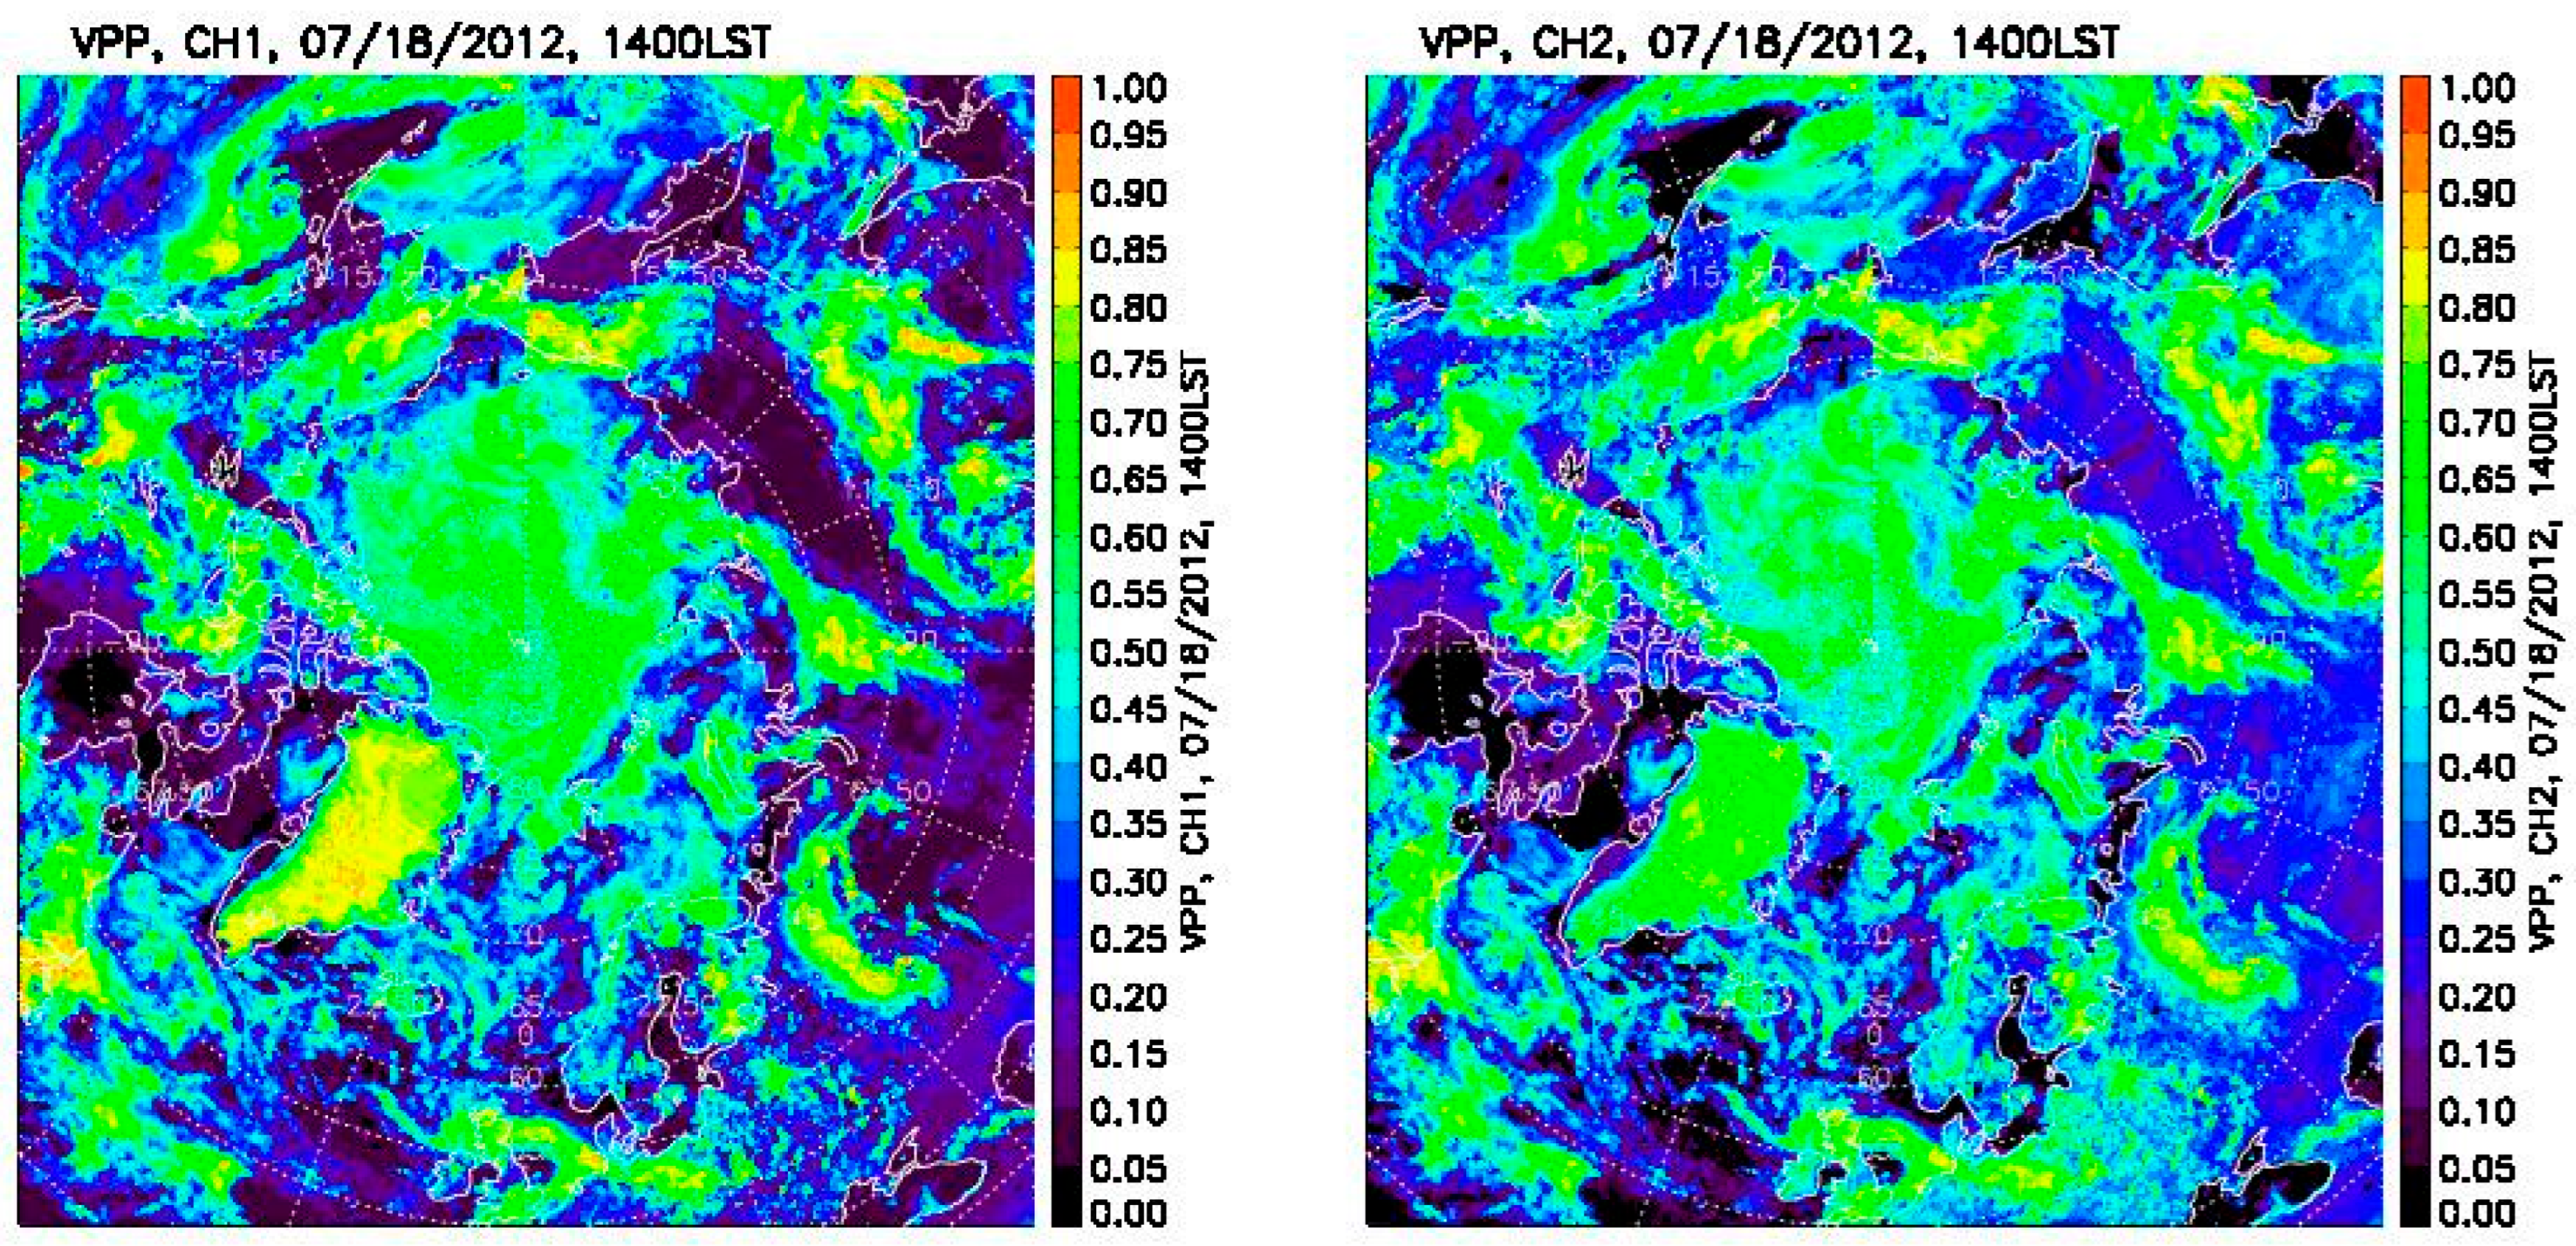
The overlapped data from 2012 and 2019 for AVHRR and VIIRS were used as an independent dataset to examine and verify the regression model derived from the 2013–2018 data. Figure 2 provides an example of NOAA-19 AVHRR channel 1 and 2 reflectances versus NOAA-20 VIIRS band I1 and I2 reflectances after intercalibration on 18 July 2012, at 14:00 LST for the Arctic region. For this case, the overall biases between APP and VPP composites at 1400 LST are −1.00% and −1.58% for channel 1 and channel 2, respectively. It should be noted that these two composites are at somewhat different wavelengths, times, and viewing angles even after intercalibration. Differences of this magnitude are therefore reasonable and within the accuracy requirement for climate research.
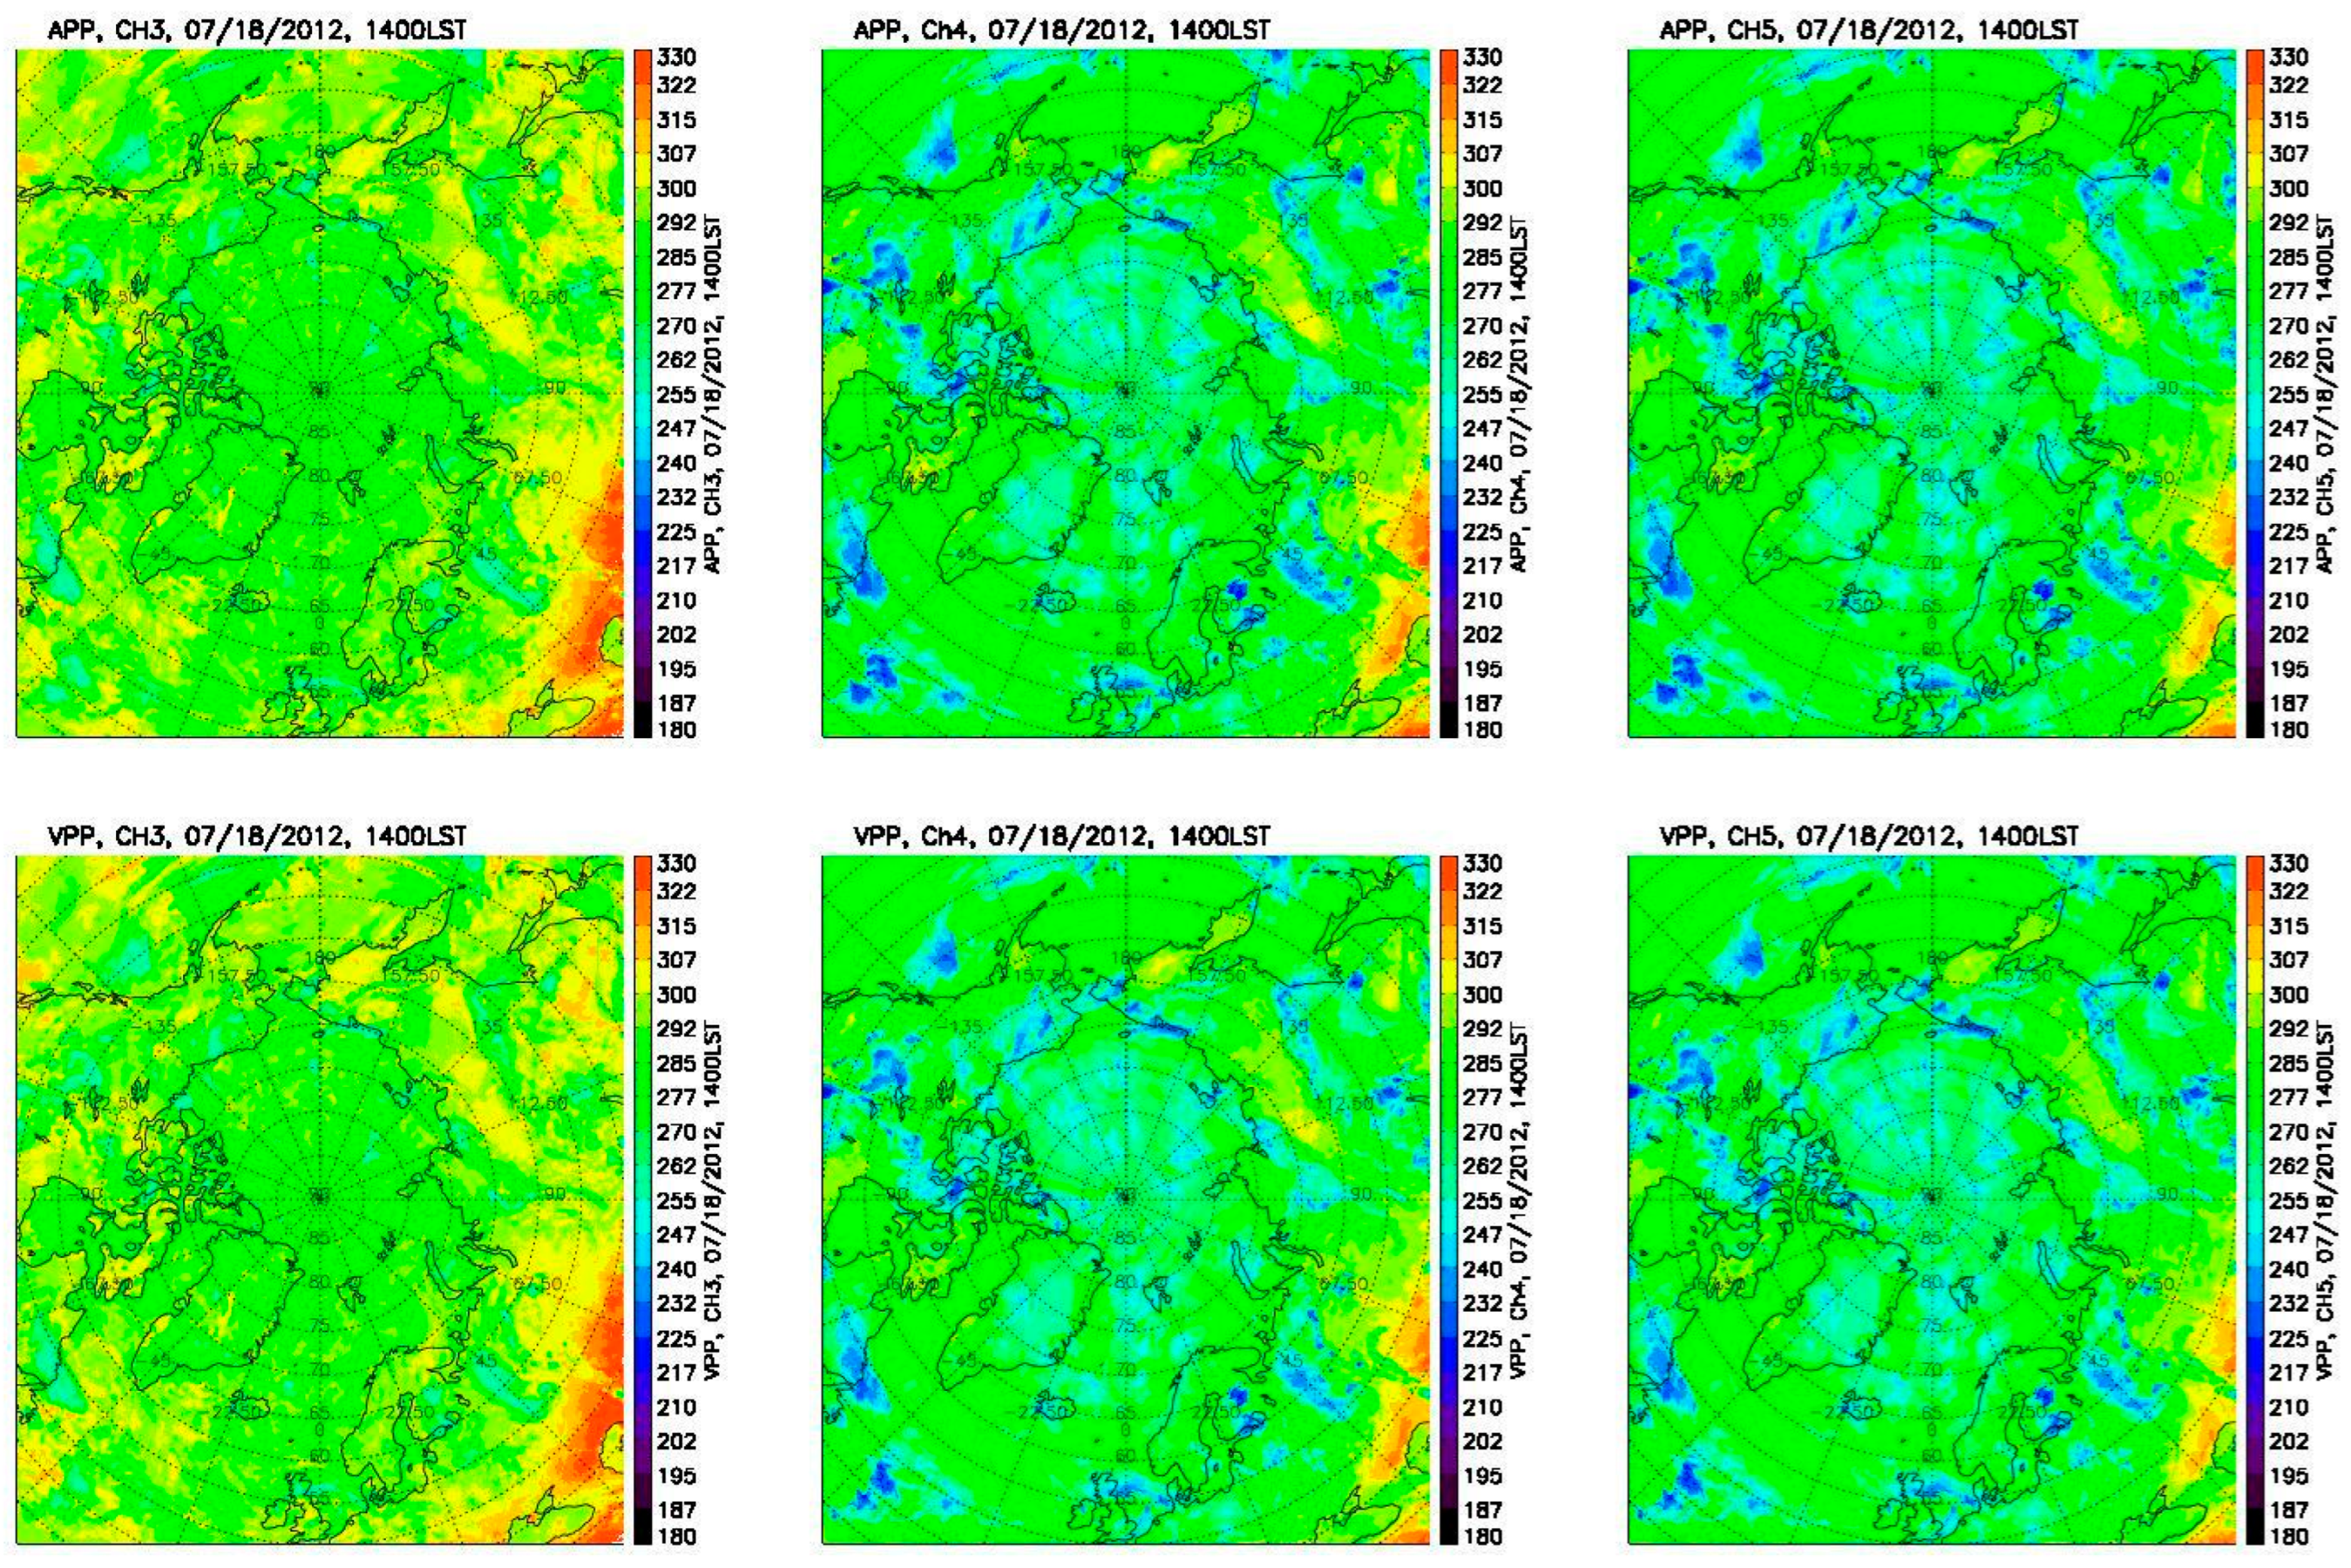
Figure 3 provides an example of AVHRR channels 3b, 4, and 5 brightness temperature versus VIIRS band M12, M15, and M16 brightness temperature after intercalibration on 18 July 2012, at 14:00 LST for the Arctic region. For this case, the overall biases between APP and VPP composites at 1400 LST are −0.38 K, 0.18 K, and −0.04 K for channels 3b, 4, and 5, respectively.
Figure 4 provides an example of AVHRR channel 1 and 2 reflectances versus VIIRS band I1 and I2 reflectances after intercalibration on 31 January 2012, at 14:00 LST for the Antarctic region. For this case, the overall biases between APP and VPP composites at 1400 LST are 1.03% and 1.07% for channel 1 and channel 2, respectively. The larger differences in the east side of Antarctica in AVHRR channel 1 and 2 are due to the larger differences in the viewing and illumination angles between APP and VPP at that target time from AVHRR and VIIRS orbital data for the daily composites.
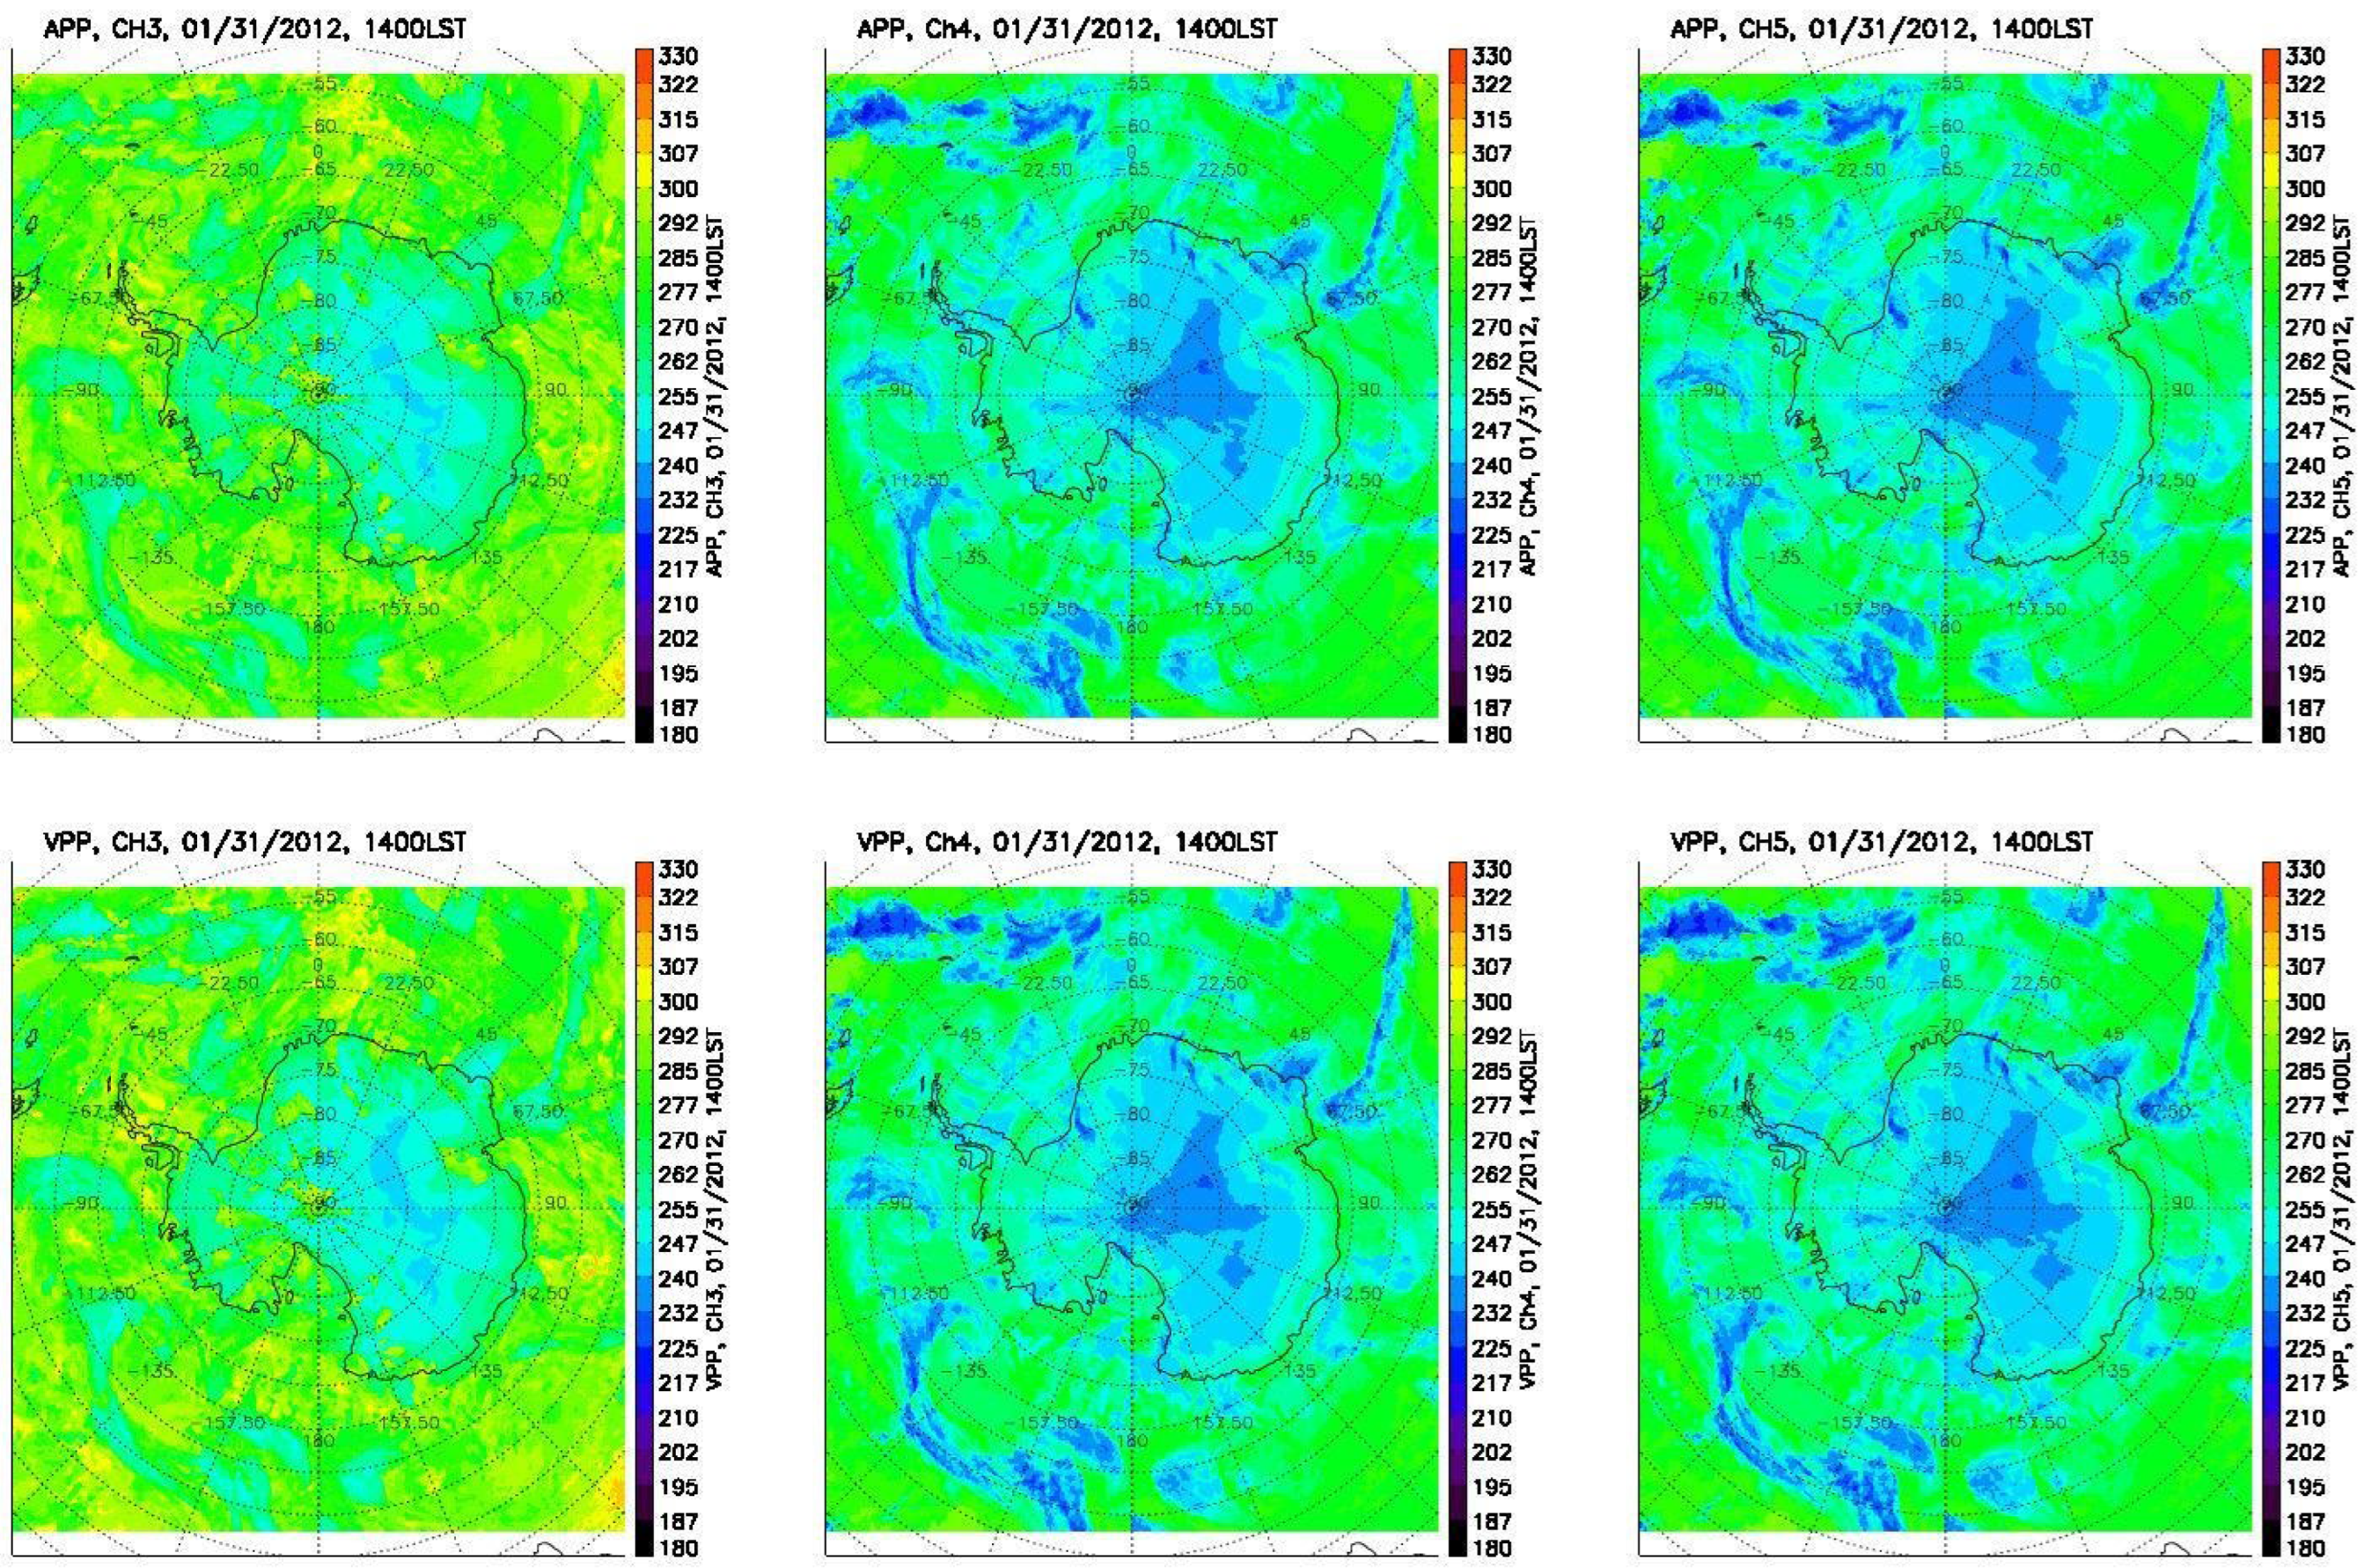
Figure 5 provides another example of AVHRR channels 3b, 4, and 5 brightness temperature versus VIIRS band M12, M15, and M16 brightness temperature after intercalibration on 31 January 2012, at 14:00 LST for the Antarctic region. For this case, the overall biases between APP and VPP composites at 14:00 LST are 1.03 K, 0.24 K, and 0.06 K for channels 3b, 4, and 5, respectively.
Table 3 lists the mean biases of all AVHRR 5 channels between APP and VPP for the Arctic and Antarctic areas poleward of 60 degrees latitude. The data from 2012 and 2019 were used as an independent dataset for intercalibration model validation at local solar times of 14:00/04:00 (Arctic) and 14:00/02:00 (Antarctic), these two years statistical results listed in the table together with the statistical results for the entire period 2012–2019. The bias is defined as APP minus VPP, and the number of cases indicate how many days of data are used in the statistics.
Overall, the mean biases between AVHRR channels 1 and 2 and the corresponding VIIRS bands after intercalibration are less than 3.5% for both poles and both local solar times (LST), with much smaller biases for 14:00 LST than 04:00 LST. The larger uncertainties in AVHRR visible channels at 04:00 and 02:00 LST are caused by low sun conditions, as well as the relatively small matched sample sizes and larger time differences between AVHRR and VIIRS. Regarding the infrared AVHRR channels 3b, 4, and 5, the mean biases between them and VIIRS bands are less than 0.70 K, 0.40 K, and 0.50 K, respectively, for both poles and both local solar times. The larger uncertainties in AVHRR infrared channels are caused by larger time differences between AVHRR and VIIRS, especially later in the NOAA-19 record when orbit drift was large.

4.2. VPP-x vs. APP-x

The five selected VIIRS bands were intercalibrated to AVHRR five channels to make APP and VPP compatible and consistent in value for the purpose of applying current AVHRR algorithms to VIIRS data to generate VPP-x, thereby extending the current Polar Pathfinder Extended climate data record into the future [15], avoiding discontinuities and inconsistencies to the extent possible. Details of the algorithms to estimate cloud properties, surface temperature and albedo, and radiative fluxes are beyond the scope of this paper. Instead, the reader is referred to [15] and references therein. Validation studies are summarized in [1,15,16], and [17]. Implications of errors in cloud detection on feedback mechanisms and the impact of trends in one variable, e.g., cloud cover, on trends in other variables are addressed in [18,19].
To verify APP-x and VPP-x, they were compared to each other in overlapped locations and times to confirm that the full time series is appropriate for climate research. Figure 6 shows surface broadband albedo from AVHRR and VIIRS data for 18 July and the July monthly mean in 2012 at 14:00 LST for the Arctic region. For this case, the mean biases in surface broadband albedo for the Arctic region north of 60 degrees between APP-x and VPP-x are −2.40% for 18 July 2012, and −2.45% for the 2012 July monthly mean.
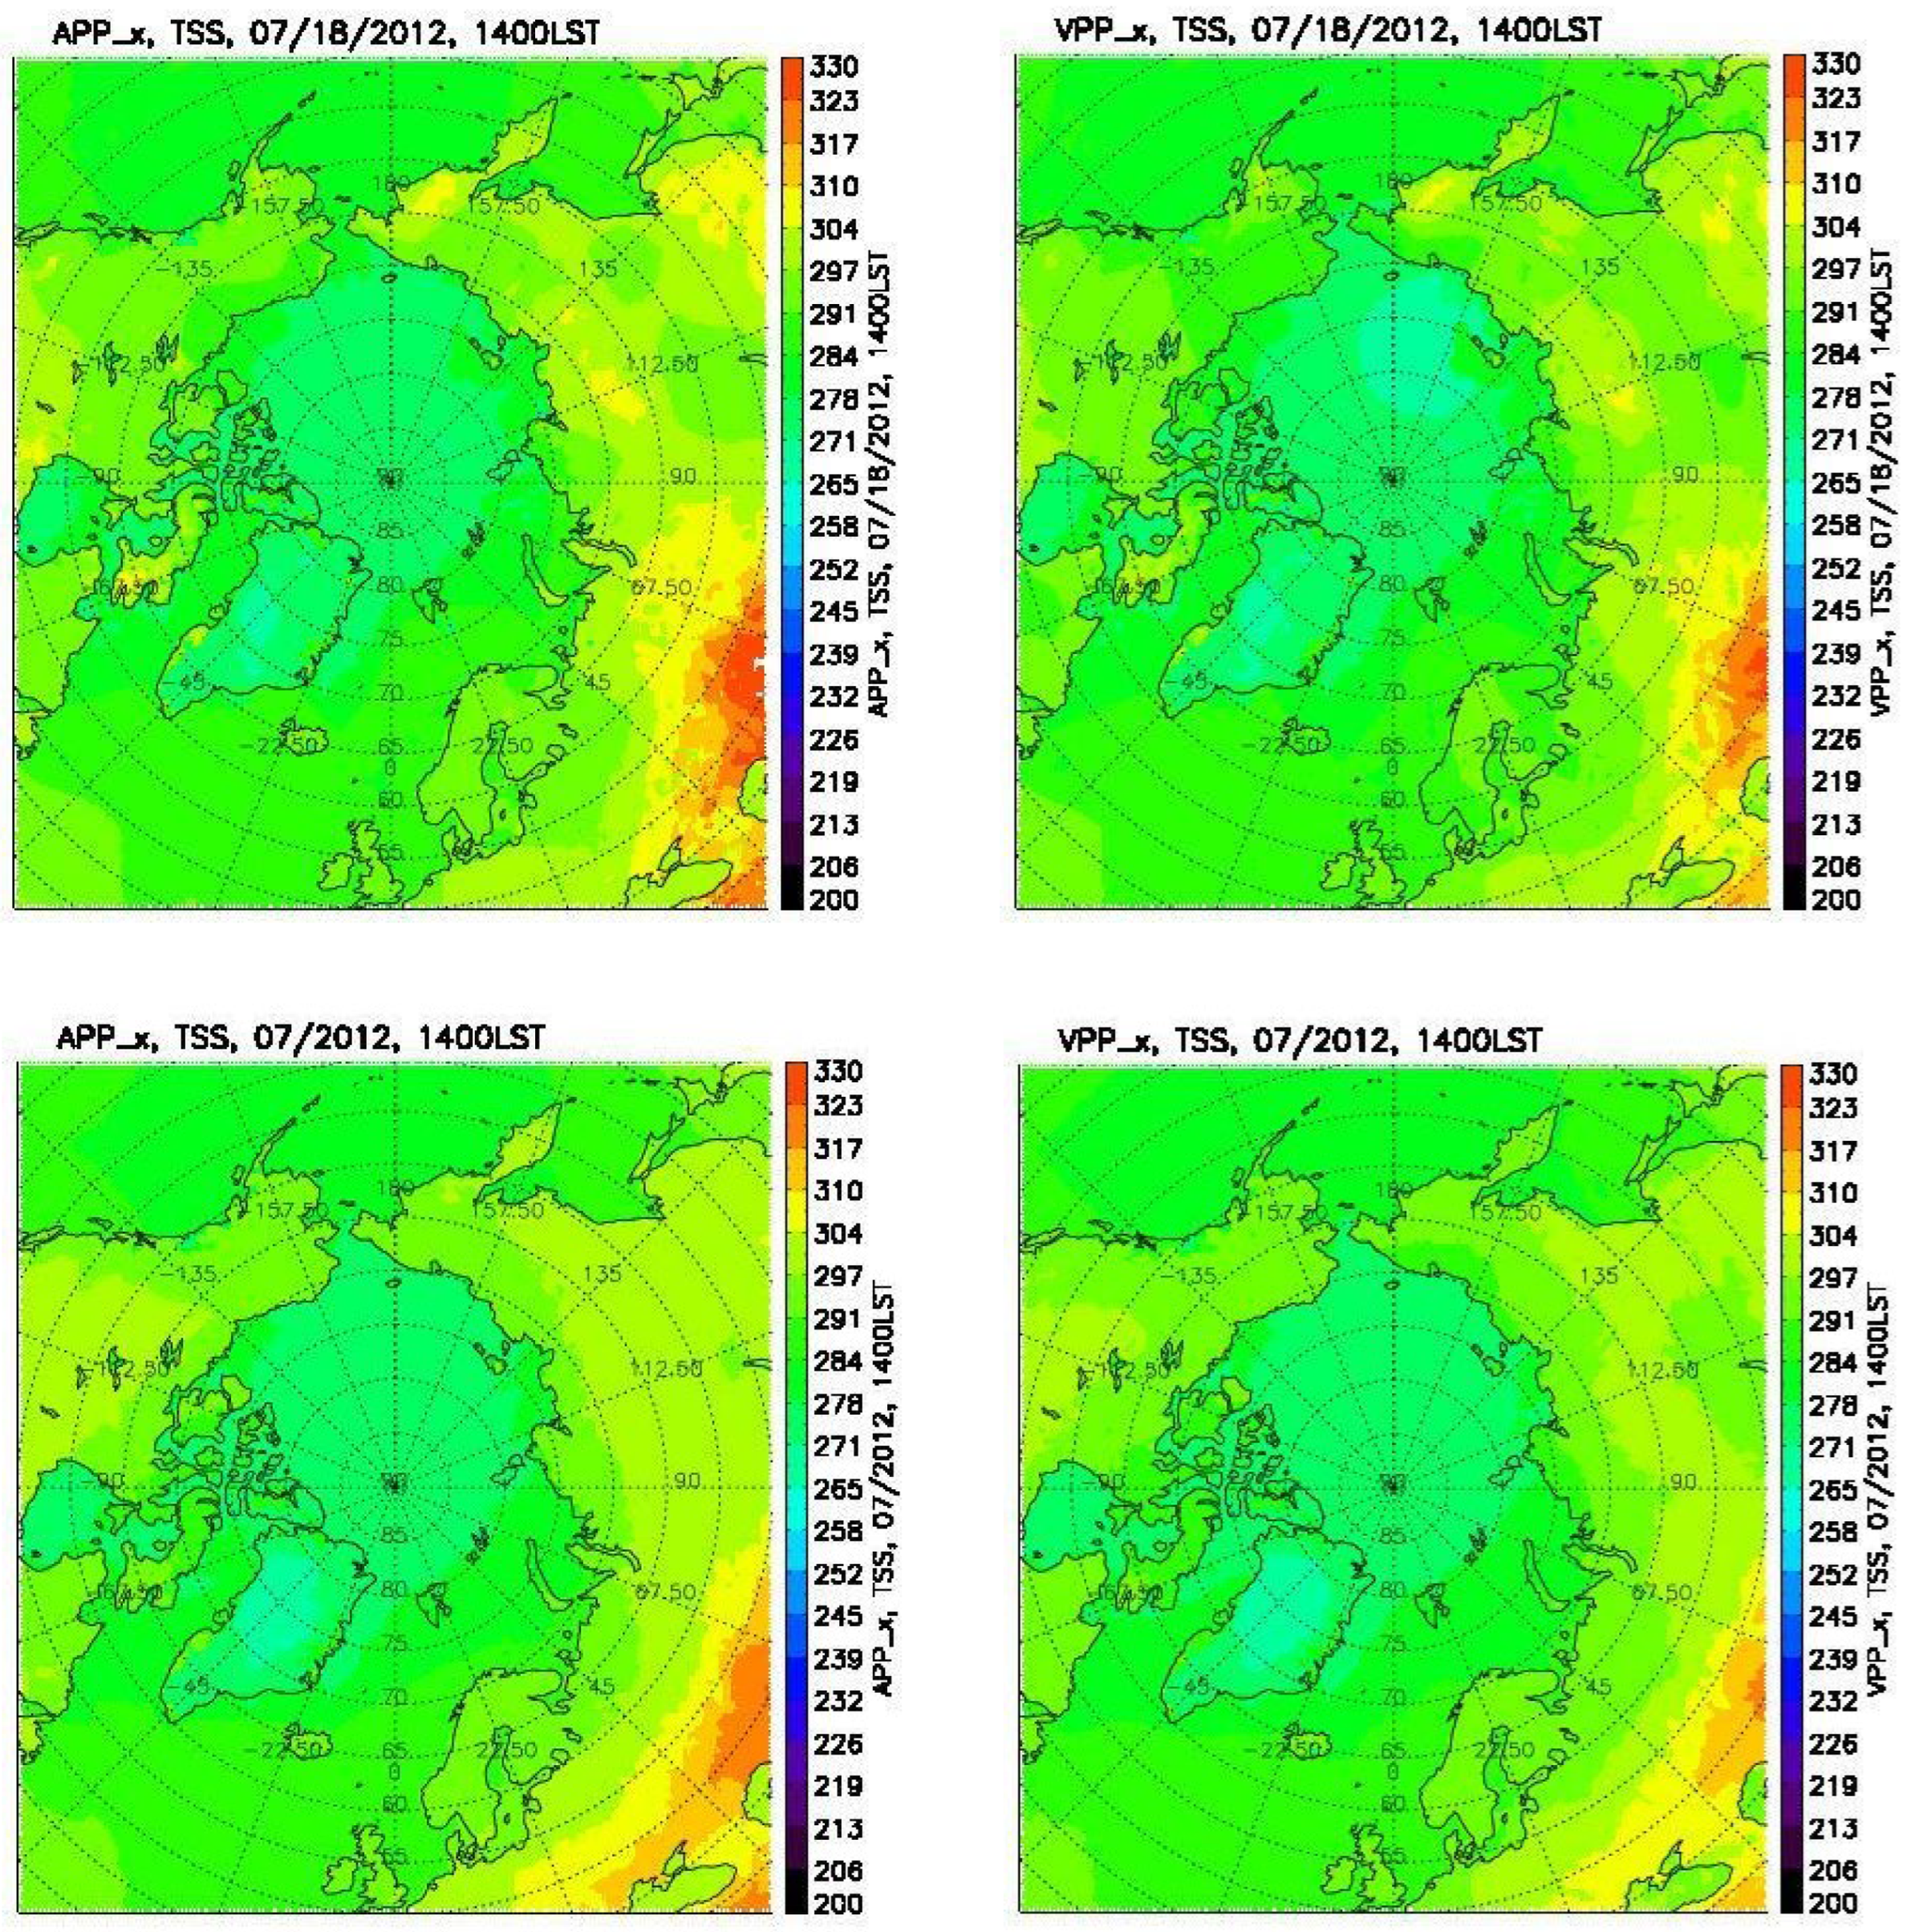
Figure 7 shows surface skin temperature from AVHRR and VIIRS for 18 July and the July monthly mean in 2012 at 14:00 LST for the Arctic region. For this case, the mean biases in surface skin temperature for the Arctic are 1.10 K for 18 July 2012, and 1.41 K for the 2012 July monthly mean.
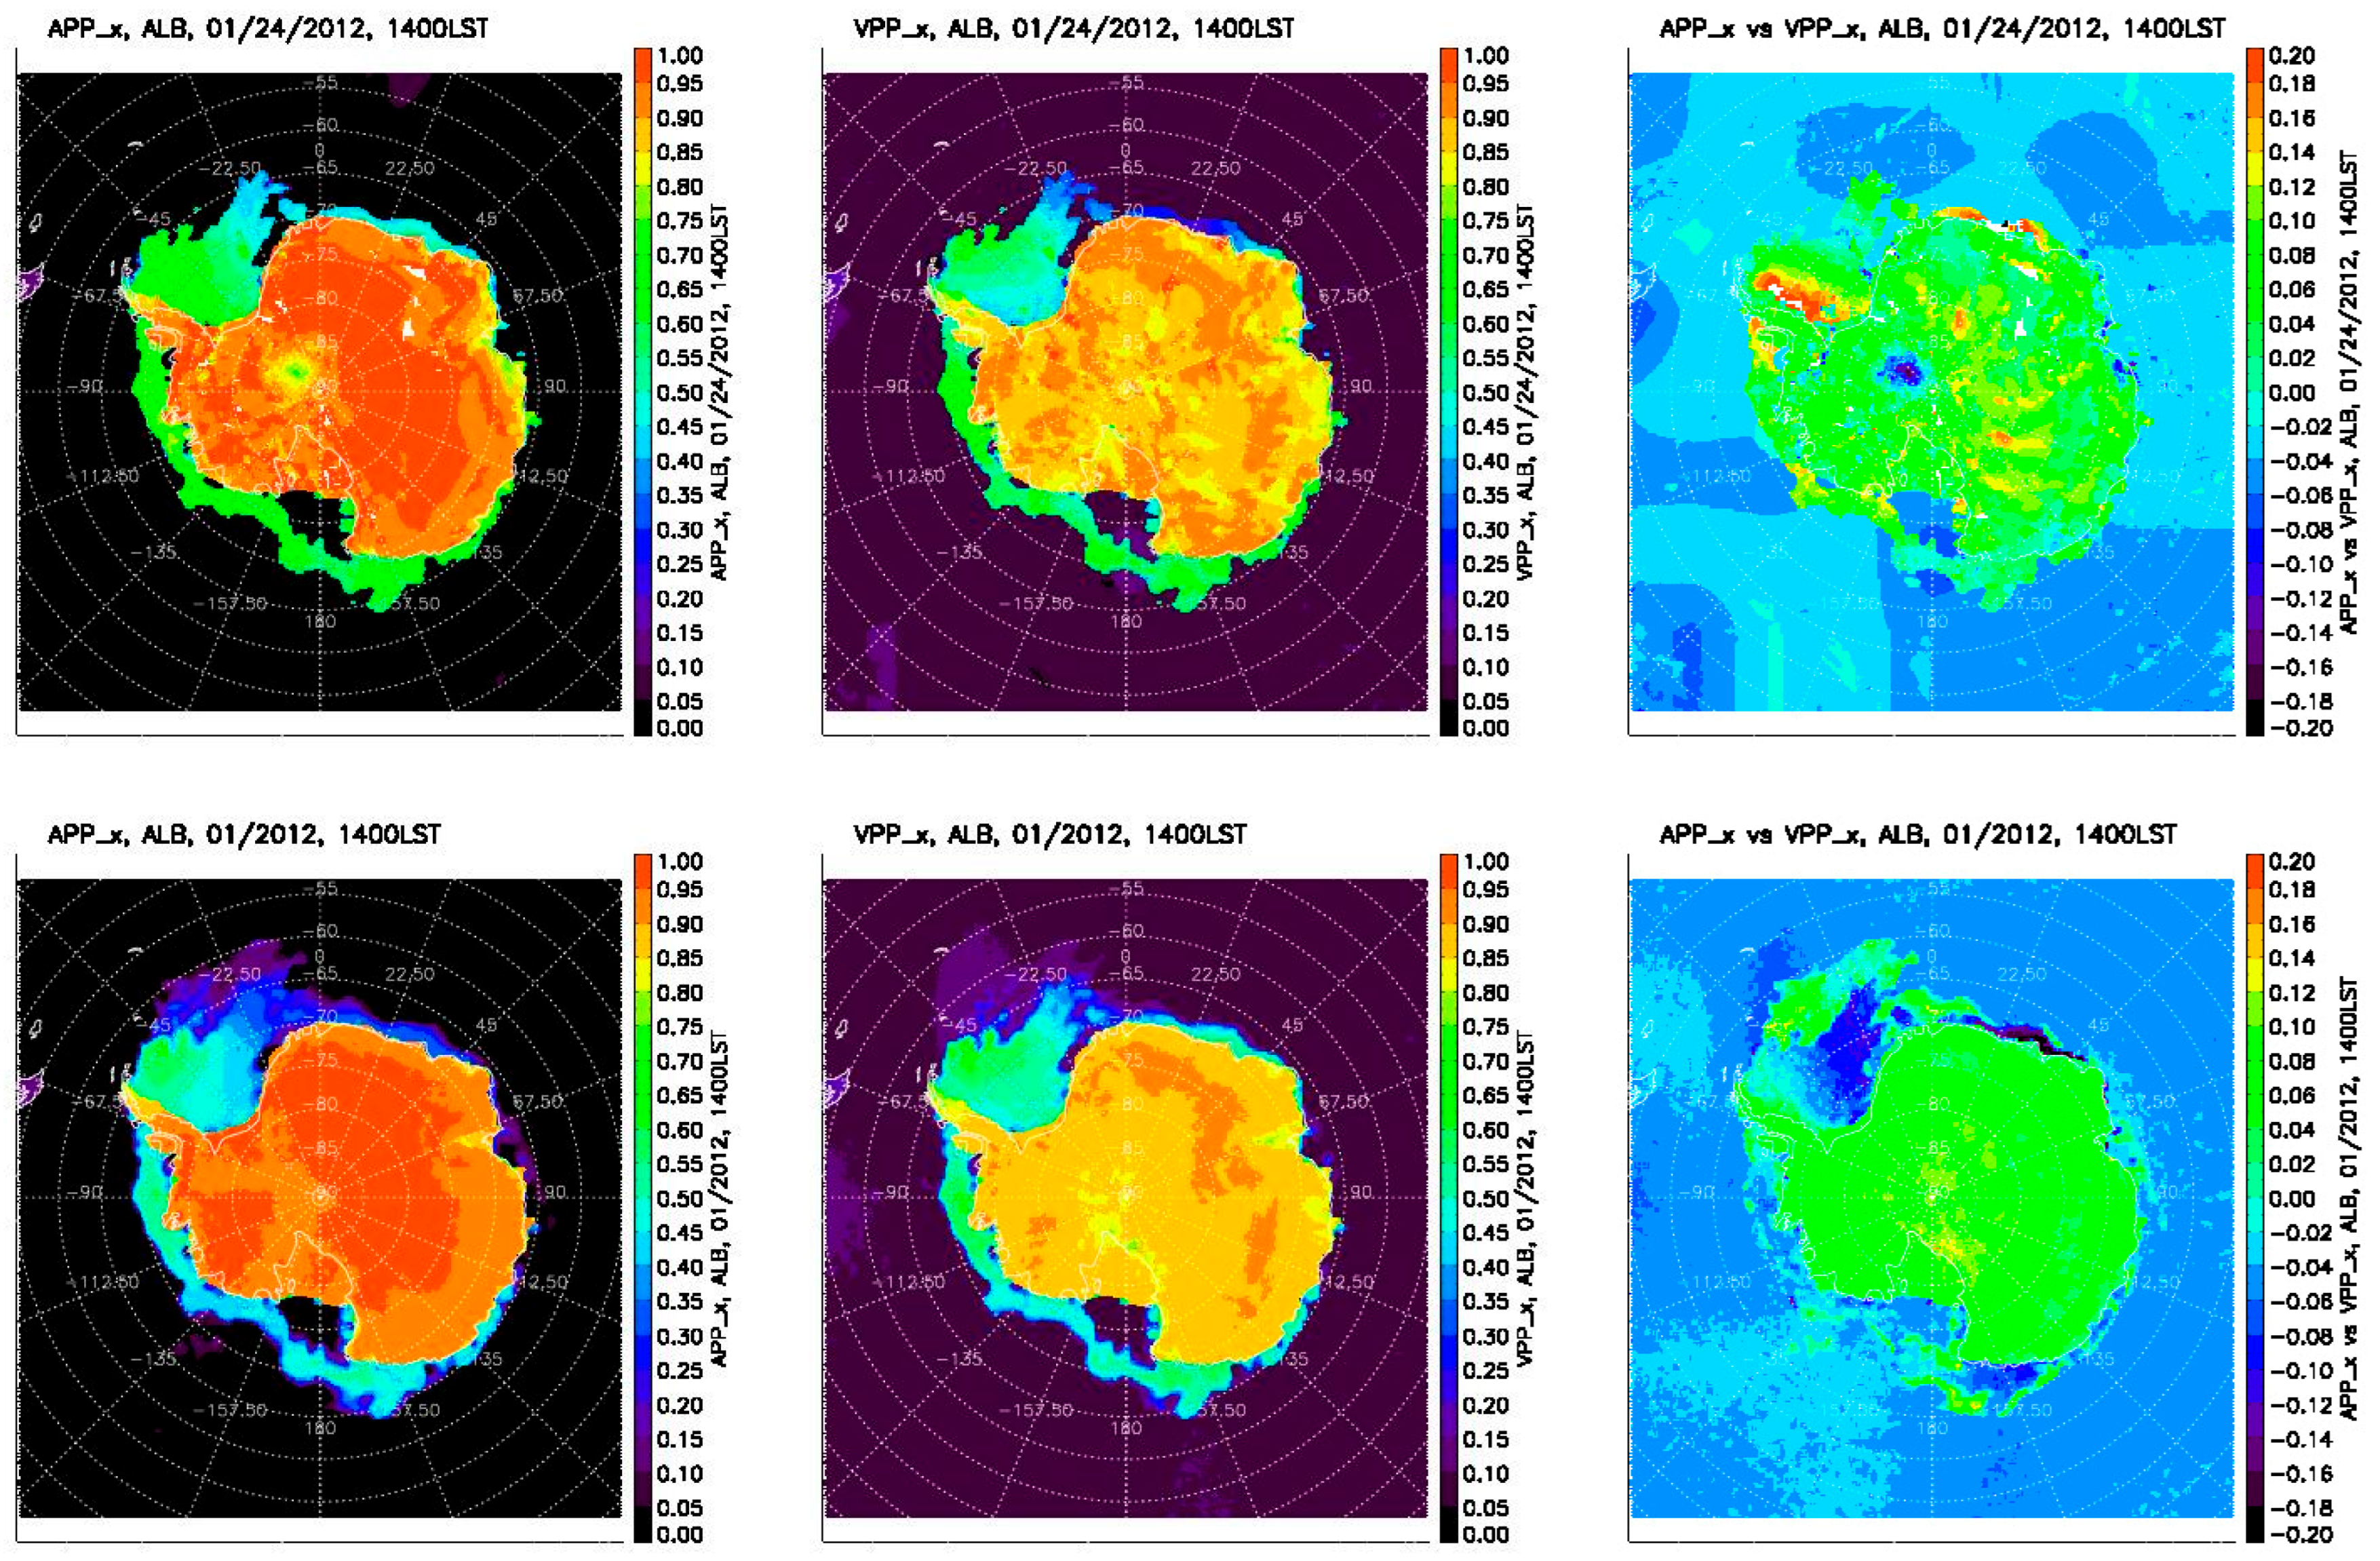
Figure 8 shows surface broadband albedo for 24 January and the January monthly mean in 2012 at 14:00 local solar time for the Antarctic region. For this case, the mean biases in surface broadband albedo for the Antarctic region south of 60 degrees between APP-x and VPP-x are 2.6% for 24 January and 2.0% for the 2012 January monthly mean.
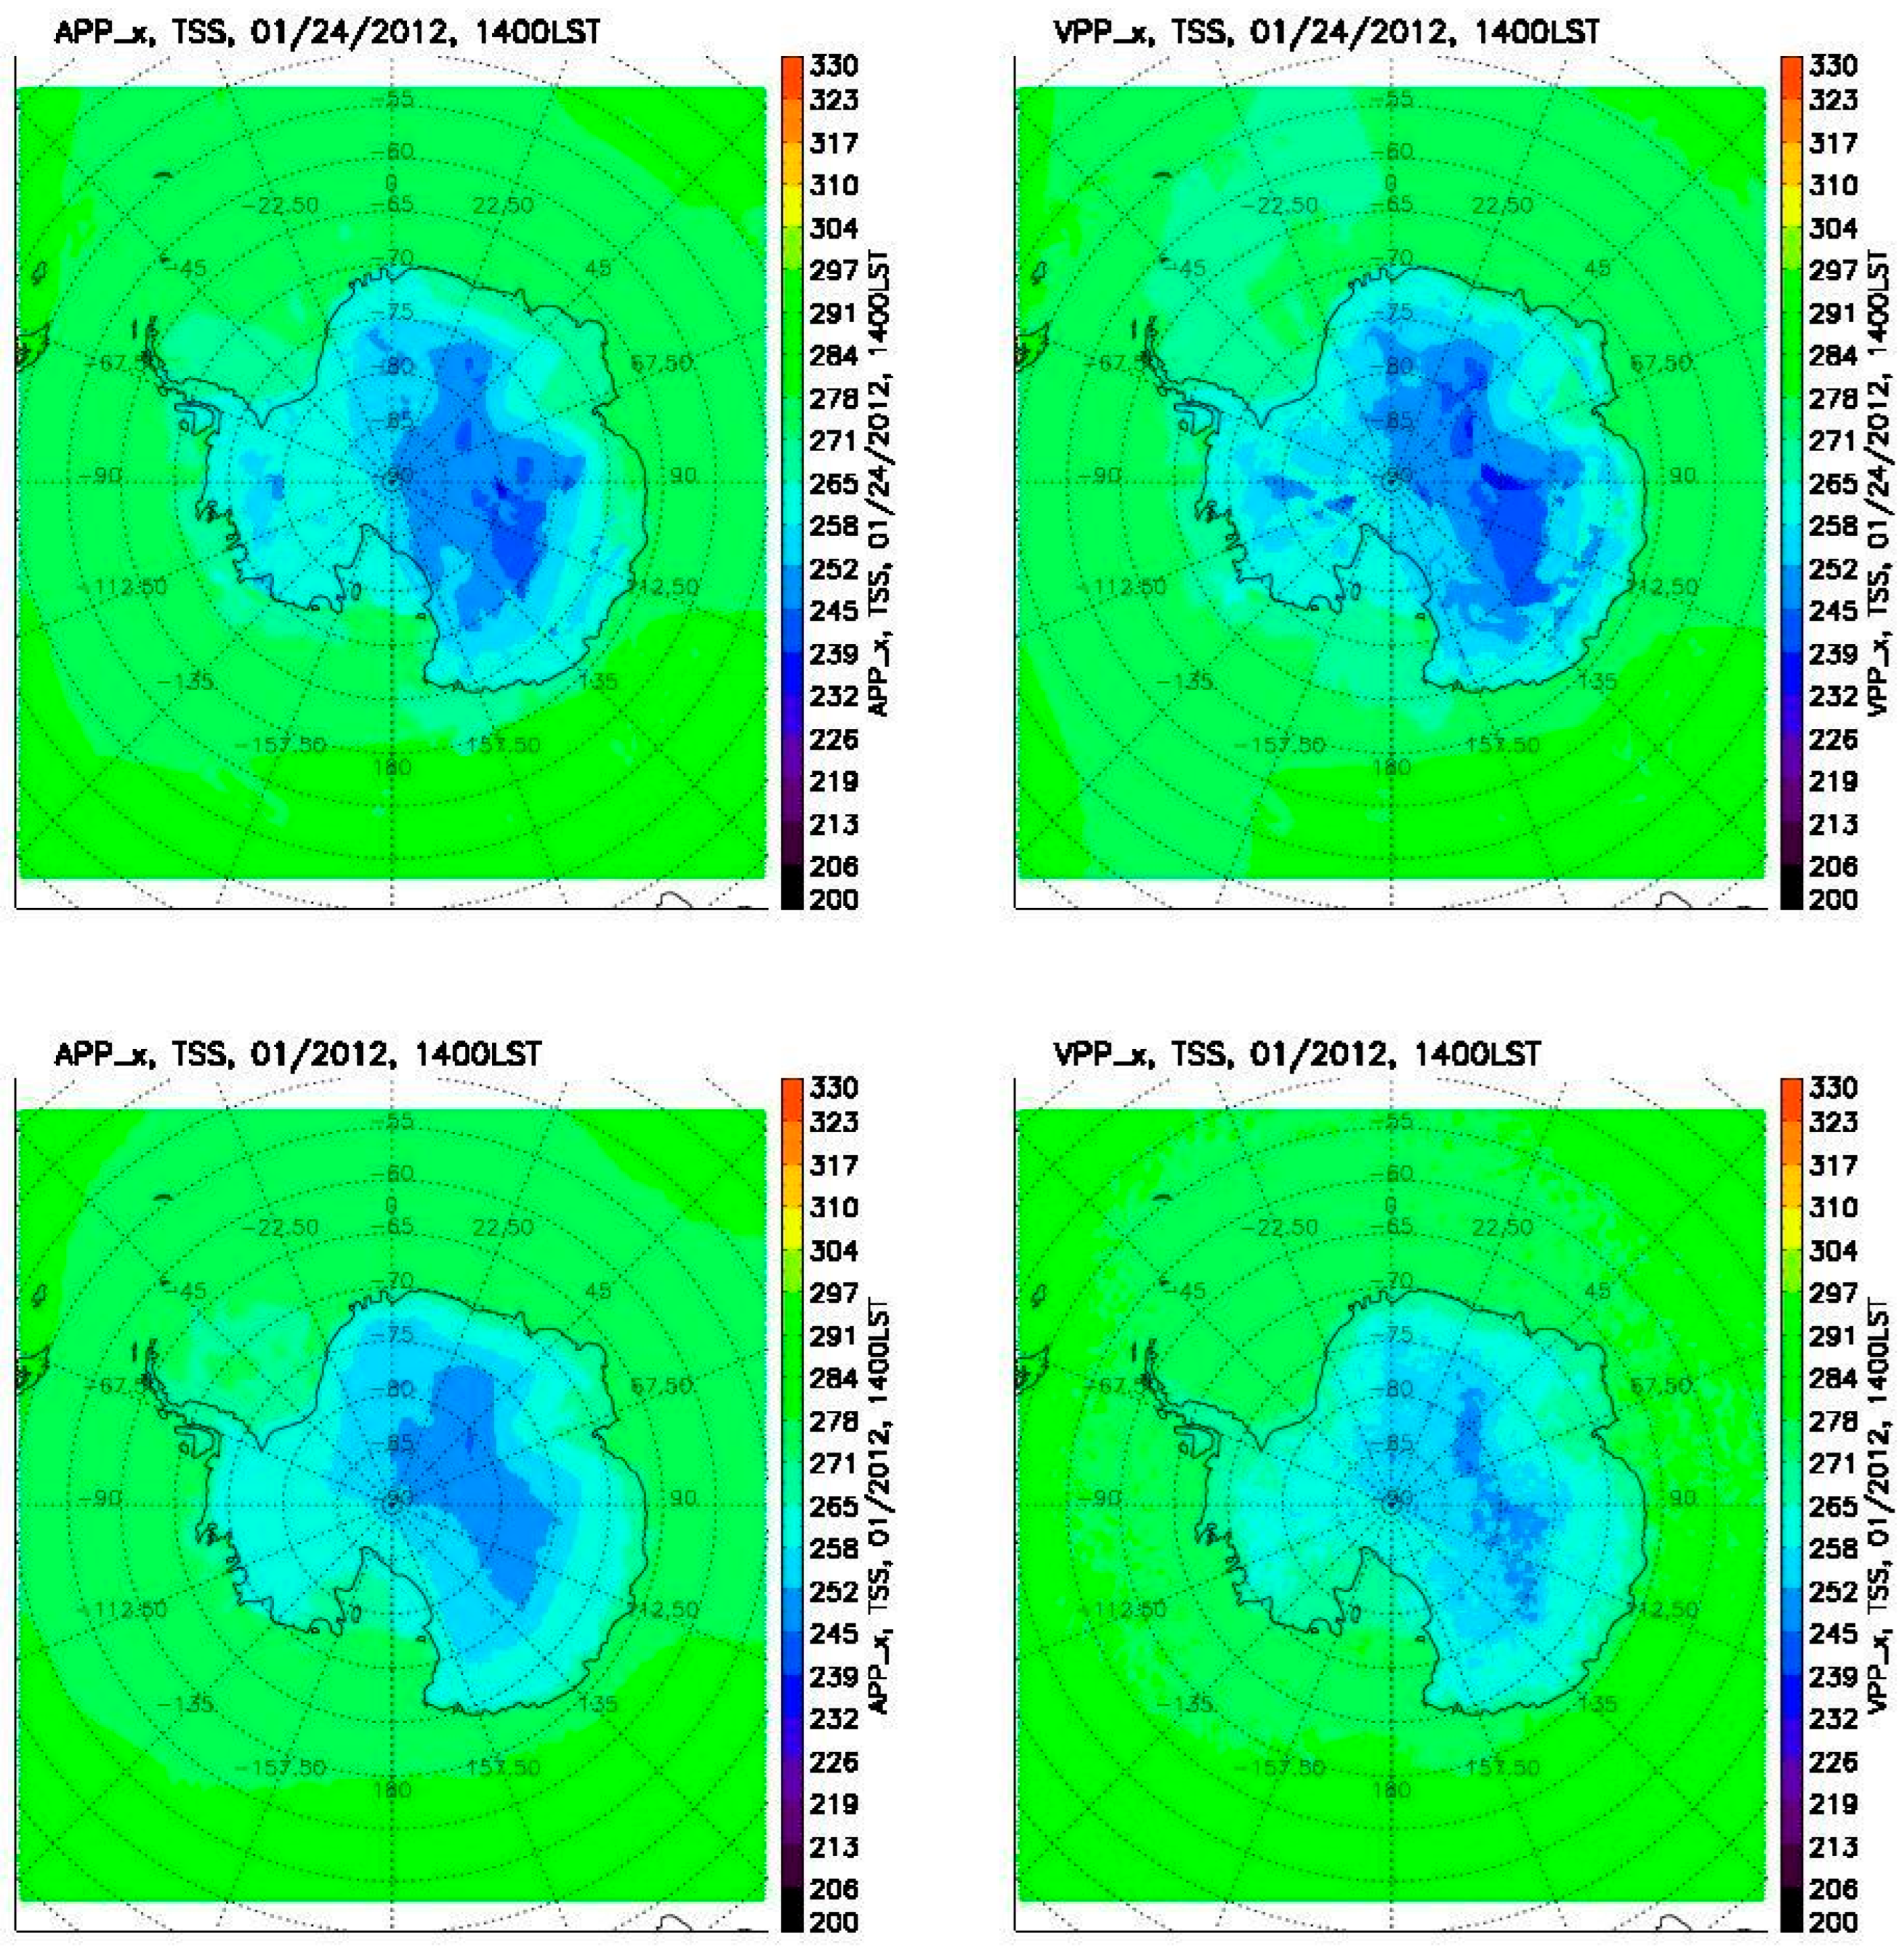
Figure 9 shows surface skin temperature from AVHRR and VIIRS data for 24 January and the January monthly mean in 2012 at 14:00 local solar time for the Antarctic region. For this case, the mean biases in surface skin temperature for the Antarctic region south of 60 degrees between APP-x and VPP-x are 1.12 K for 24 January 2012, and −0.96 K for the 2012 January monthly mean.
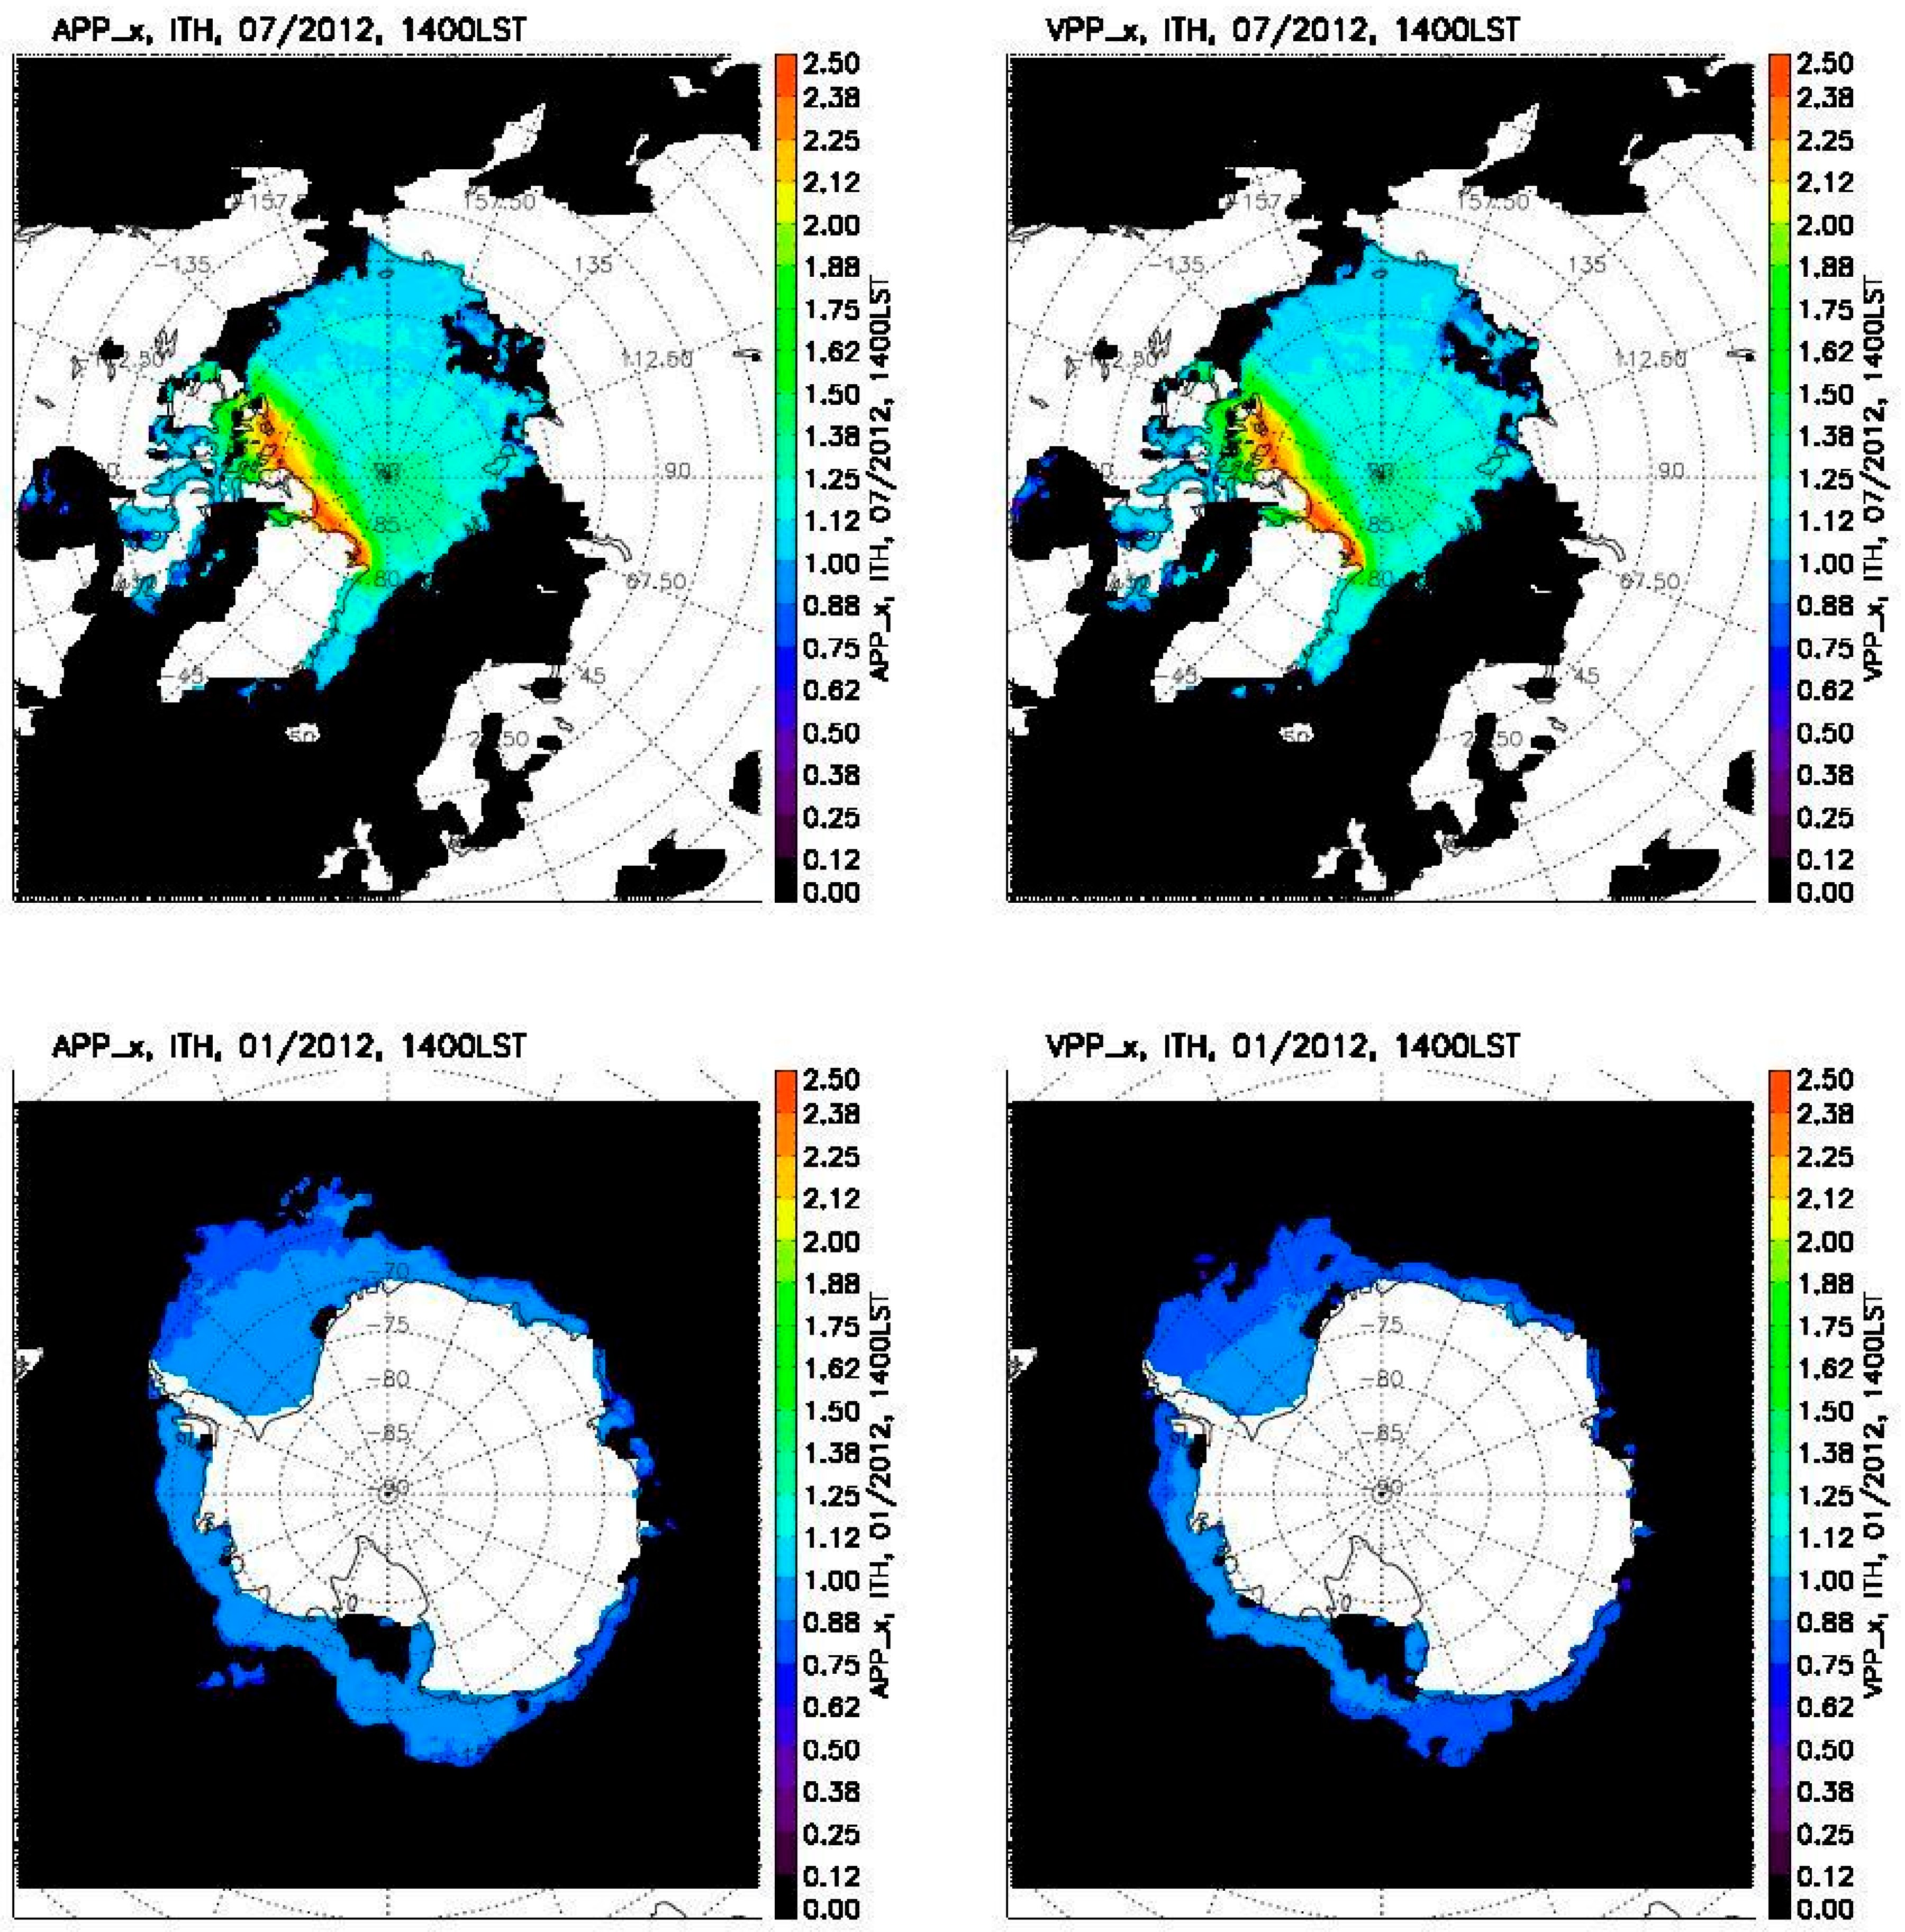
Figure 10 shows sea ice thickness from AVHRR and VIIRS data for the July monthly mean in 2012 over the Arctic Ocean, and for the January monthly mean in 2012 over the Antarctic Ocean. For this case, the mean biases in sea ice thickness are −0.001 m for the Arctic Ocean north of 60 degrees and 0.033 m for the Antarctic Ocean south of 60 degrees.
Table 4 lists the mean biases between APP-x and VPP-x for many of the geophysical variables in the climate data record. The statistics are for the Arctic and Antarctic poleward of 60 degrees. As with Table 3, the bias is defined as APP-x minus VPP-x, and the number of cases indicates how many days of the data from APP-x and VPP-x used in the statistics.
Overall, the mean biases in surface broadband albedo are less than 2.0% for both polar regions and both local solar times, which is smaller than the product retrieval uncertainty [9,16]. The surface skin temperature biases between the two are less than 1.4 K for the Antarctic, and less than 0.7 K for the Arctic. The larger surface skin temperature bias for the Antarctic is due to the larger time differences between AVHRR and VIIRS for the target times. Sea ice thickness from AVHRR and VIIRS are in good agreement, with a mean difference of less than 0.02 m for the Southern Ocean and also for the Arctic Ocean. All of these biases are within the range of product retrieval uncertainty. The cloud cover fractions are also in good agreement overall, with the mean biases of less than 5% and 3% for the Antarctic and the Arctic, respectively. The mean biases in shortwave downwelling radiation flux at the surface are less than 4 Wm−2 for the Arctic, and less than 8 Wm−2 for the Antarctic over 2012–2019. The mean biases in longwave downwelling radiation flux at the surface are less than 4 Wm−2 for the Arctic, and less than 8 Wm−2 for the Antarctic.

5. Verification of Time Series

5.1. VPP and APP

For climate research a long-term climate data record should be carefully examined to guarantee that the data products ingested from different satellites are consistent and traceable in value over a long period of time. The time series of APP/APP-x and VPP/VPP-x data products were compared to each other when and where they were overlapped in space and time to ensure that the data products in the CDRs have sufficient accuracy and consistency to be used for climate research.
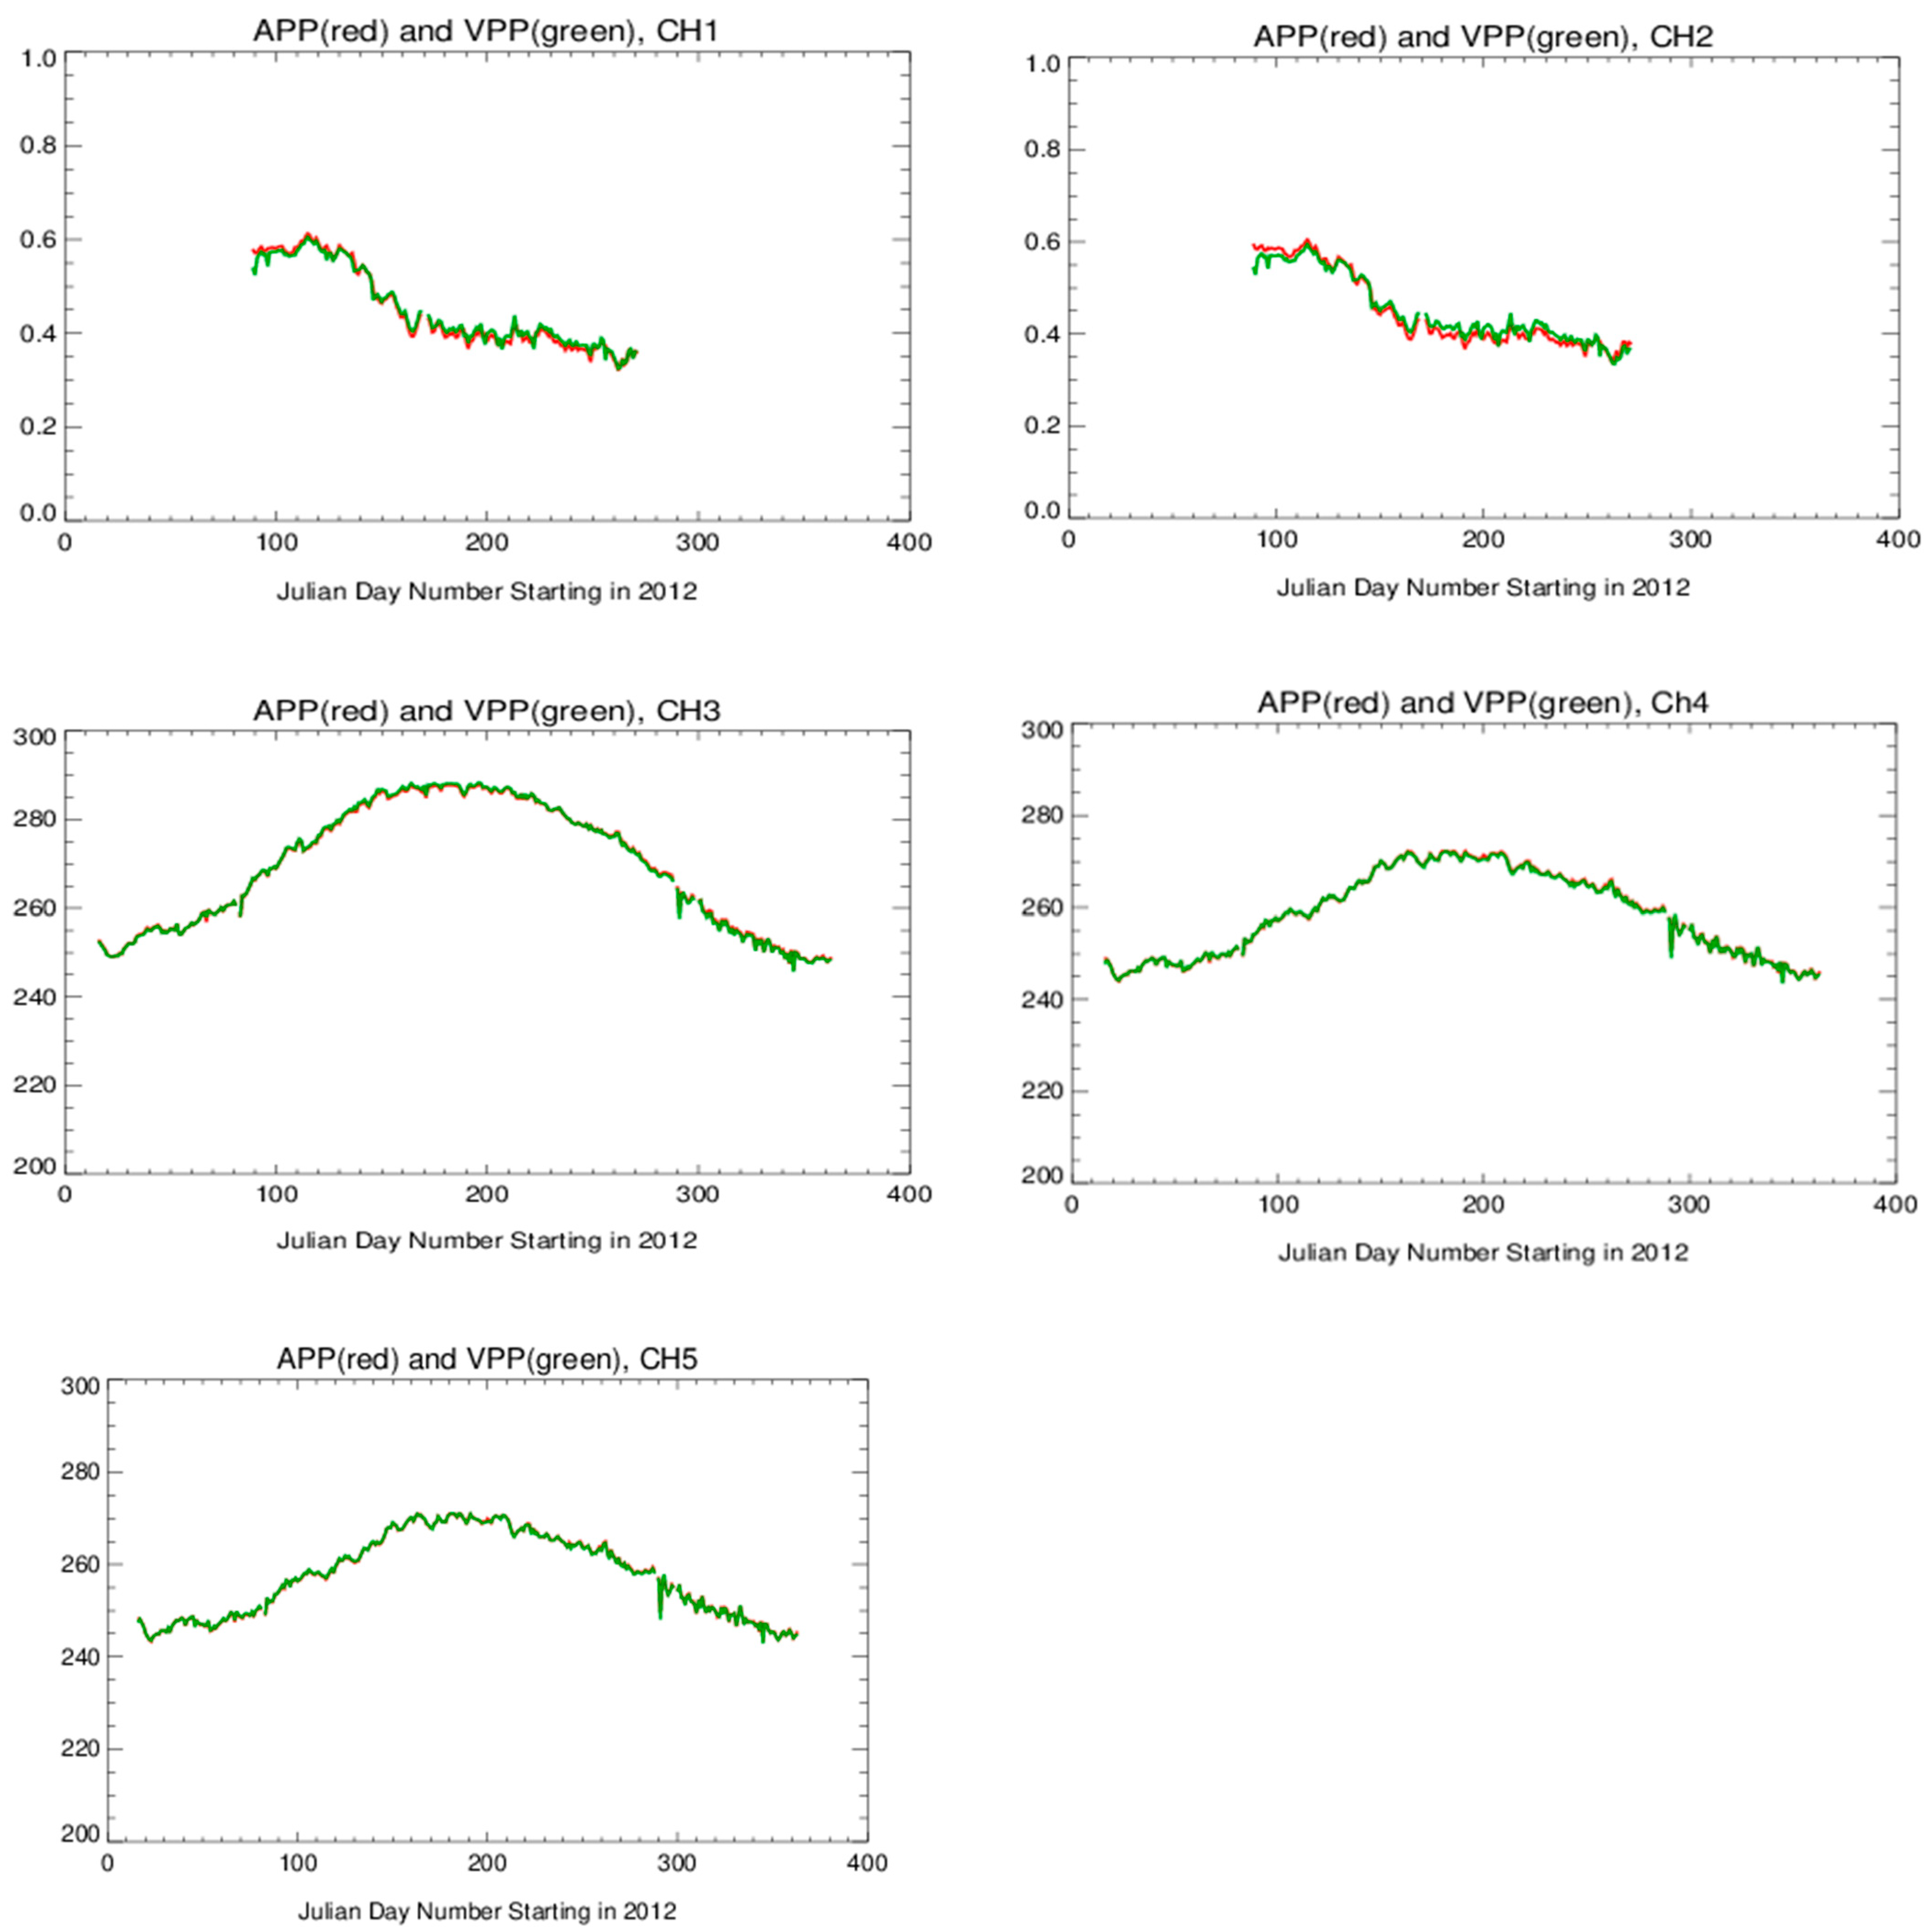
Figure 11 provides some examples of the times series of AVHRR channel 1 and 2 reflectances, channel 3b, 4, and 5 brightness temperatures versus those of VIIRS band I1 and I2 reflectances, M12, M15, and M16 brightness temperatures after intercalibration over 2012 at 14:00 local solar time for the Arctic. For this case, the biases between APP and VPP composites are −0.18%, −0.33%, −0.02 K, 0.11 K, and 0.02 K for five AVHRR channels, respectively.

5.2. VPP-x and APP-x

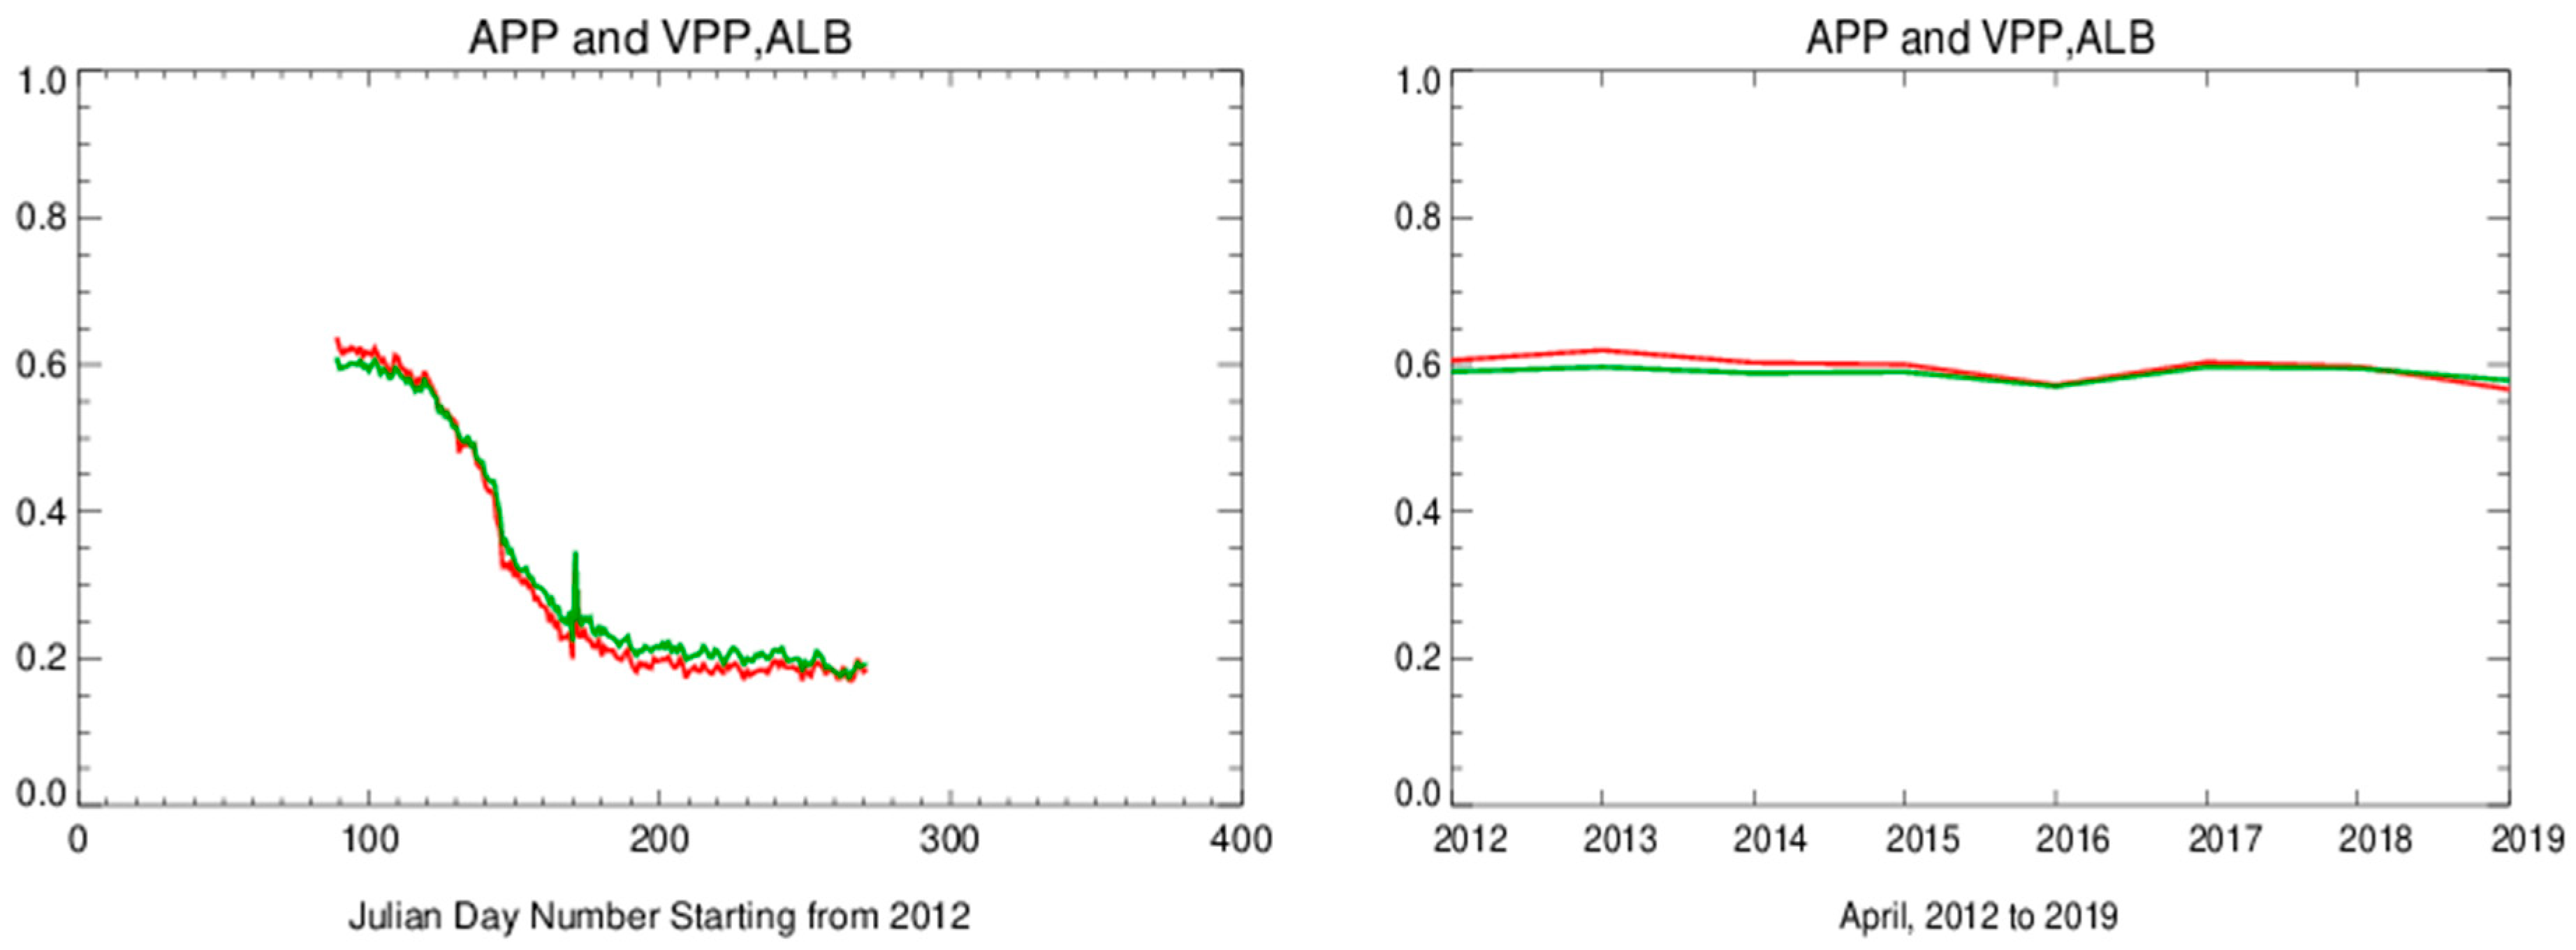
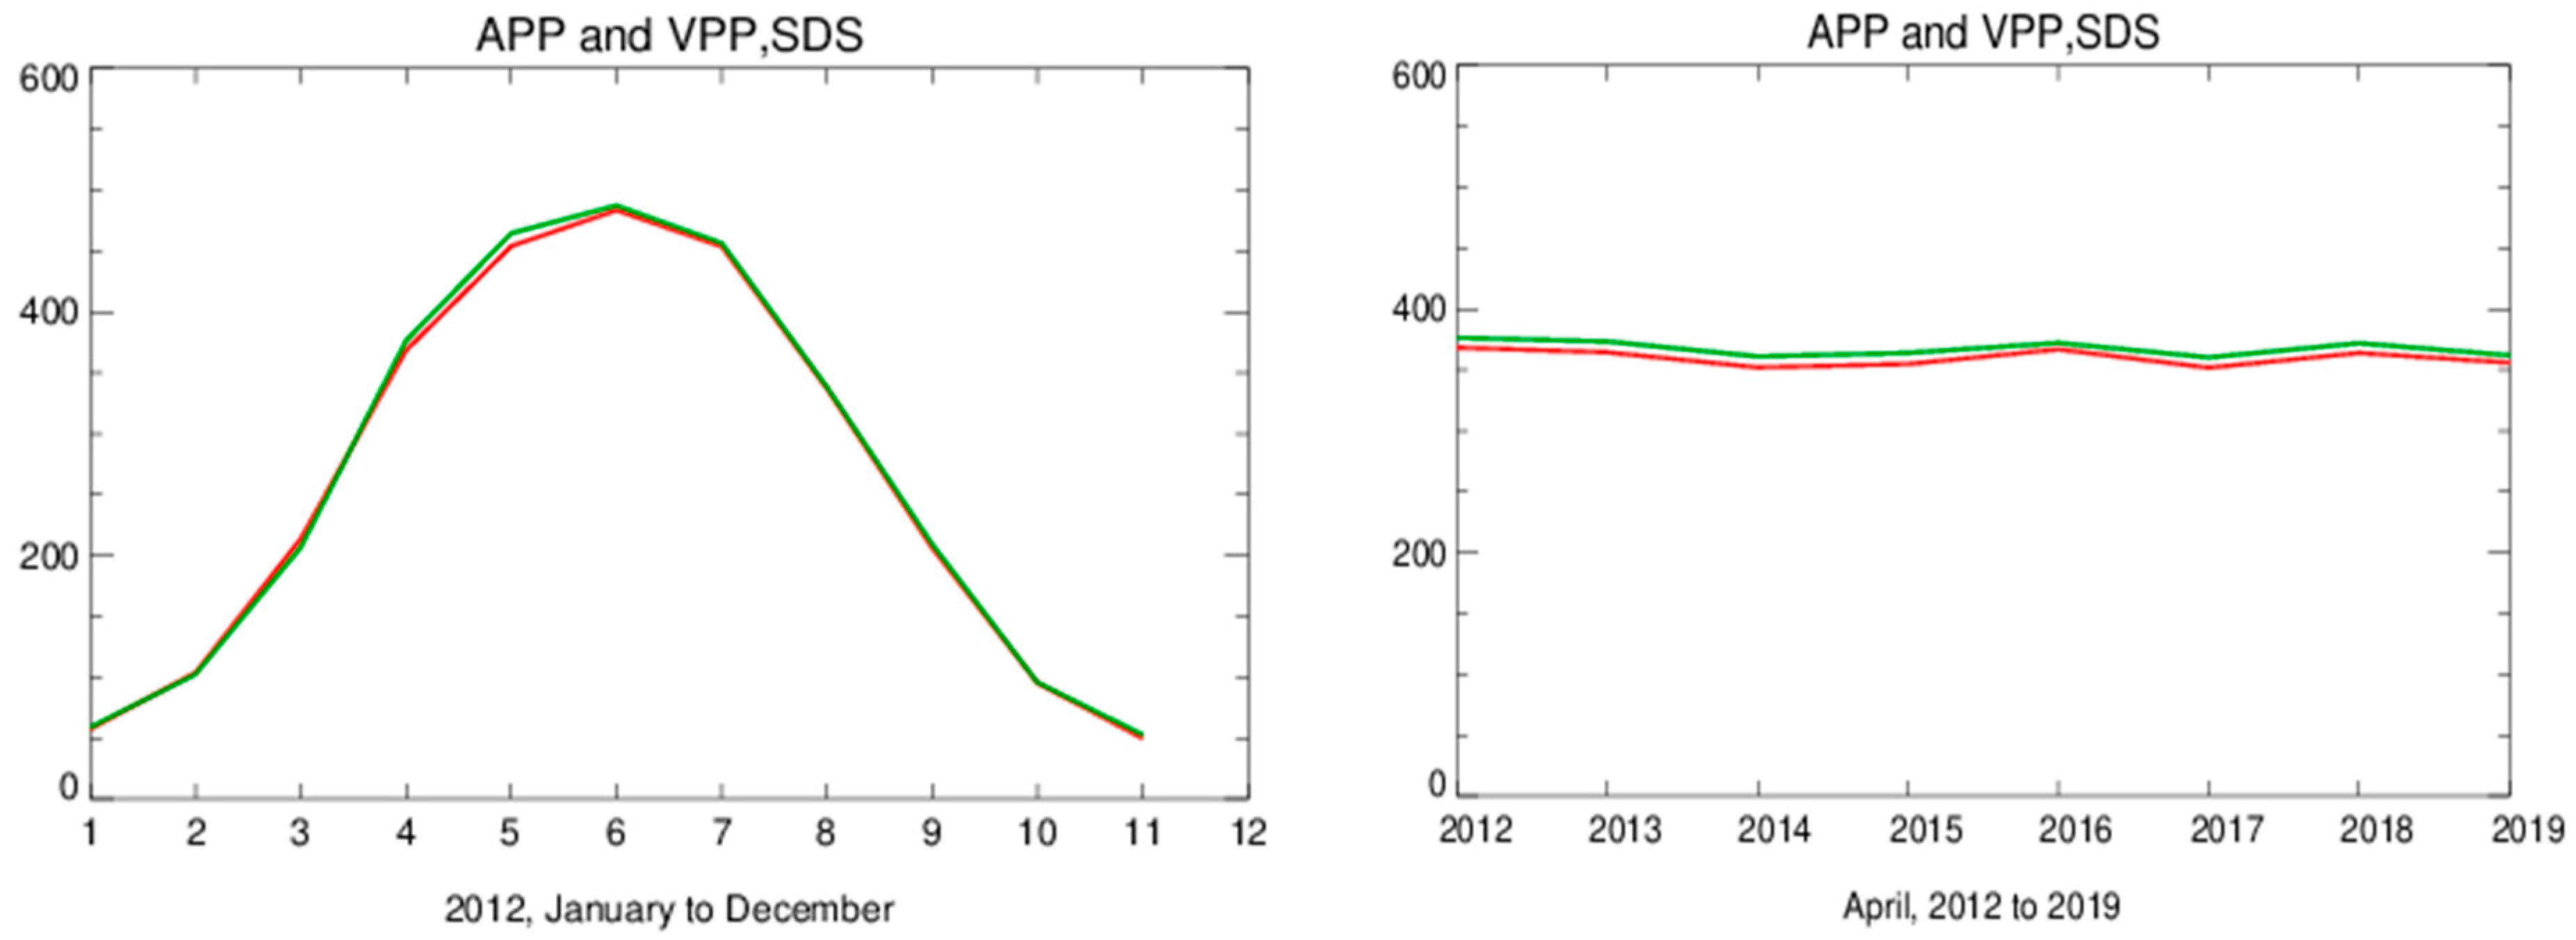
Figure 12 shows the time series of surface broadband albedo from NOAA-19 AVHRR and NOAA-20 VIIRS data at 14:00 LST for daily means over the year of 2012 and April monthly means over 2012-2019, for the Arctic region north of 60 degrees. The mean biases between APP-x and VPP-x are −0.99% for daily means and 0.76% for April monthly means, which are less than surface broadband albedo retrieval uncertainty and indicate good agreement between APP-x and VPP-x in surface broadband albedo overall.
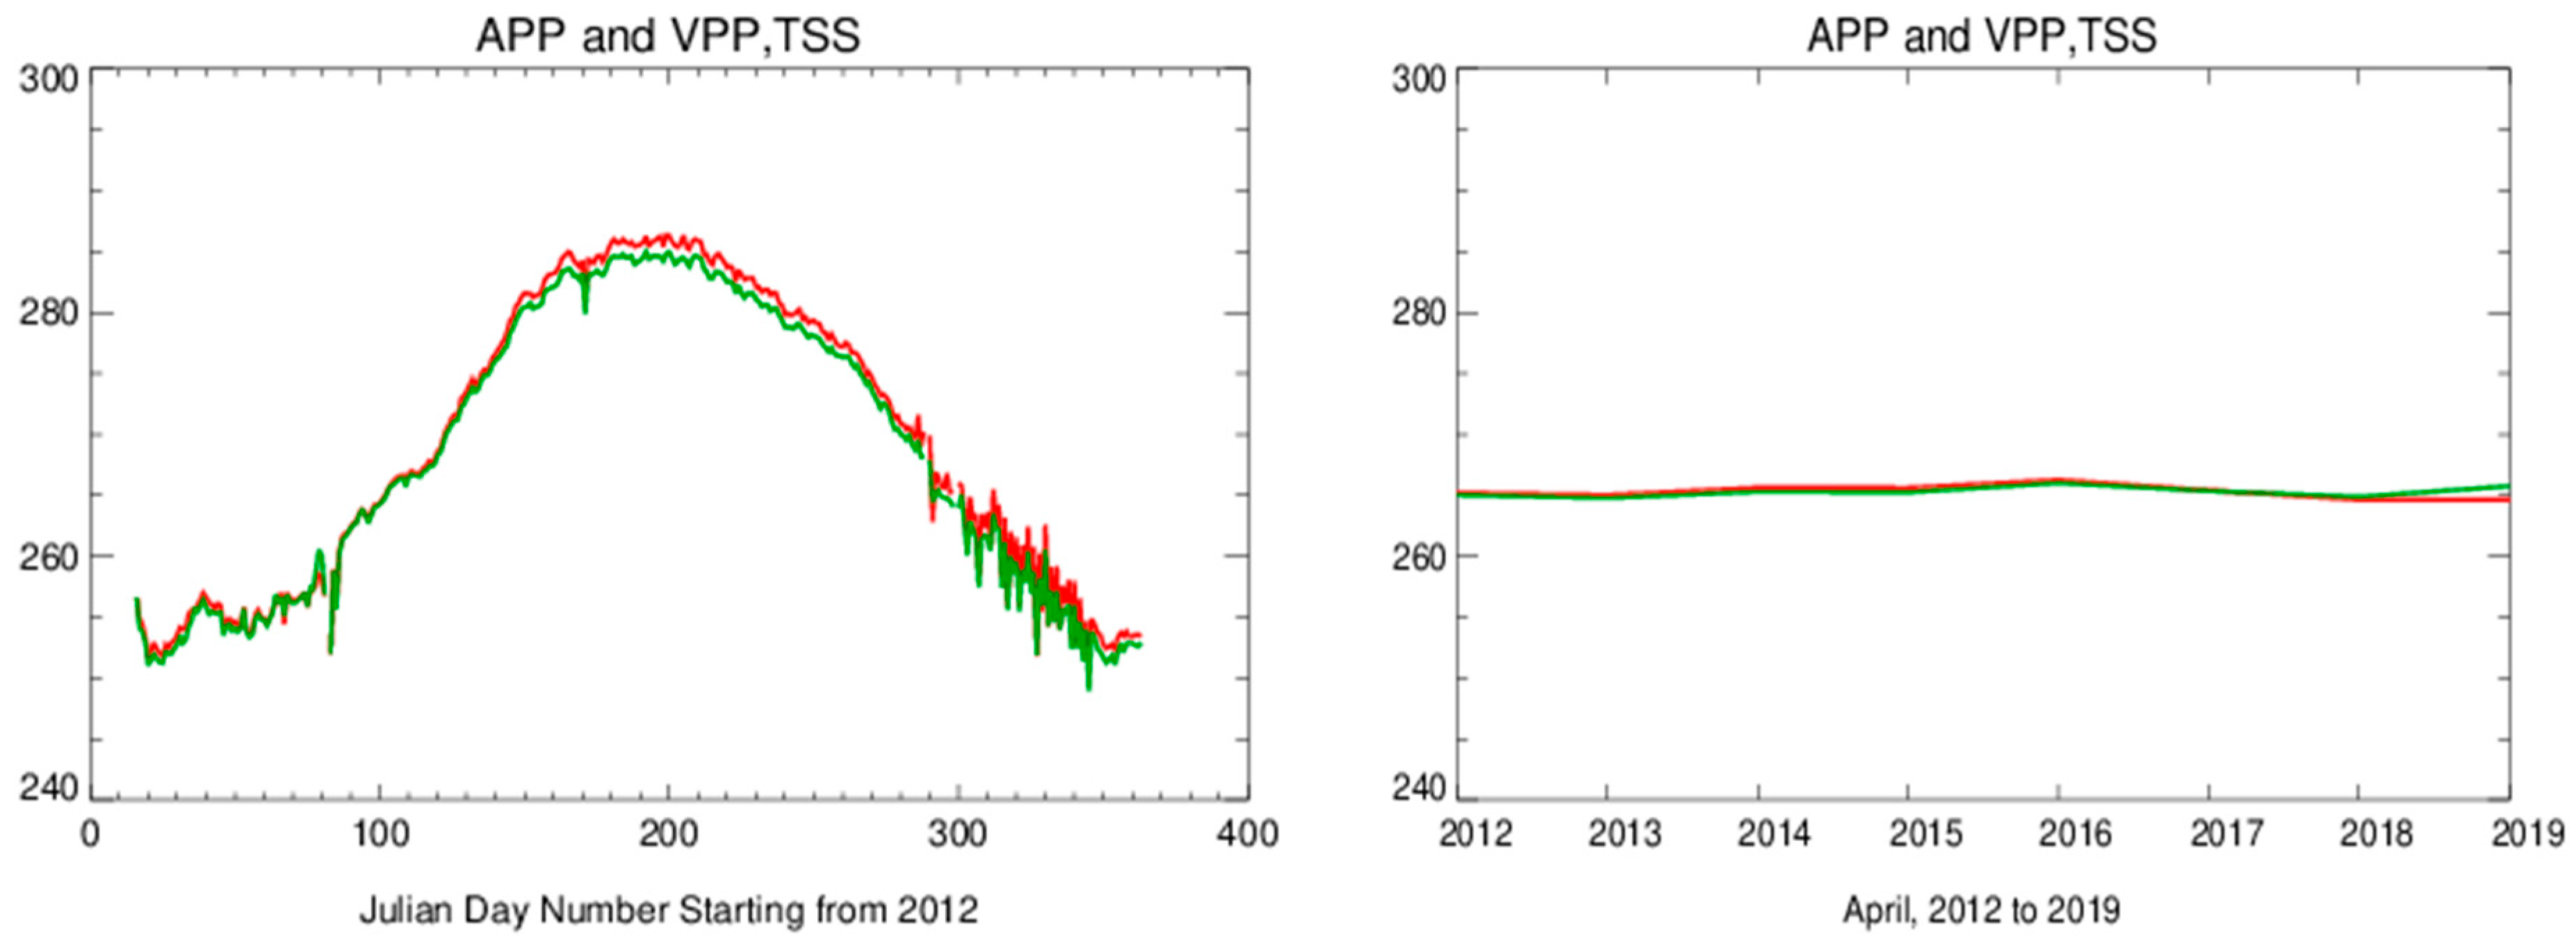
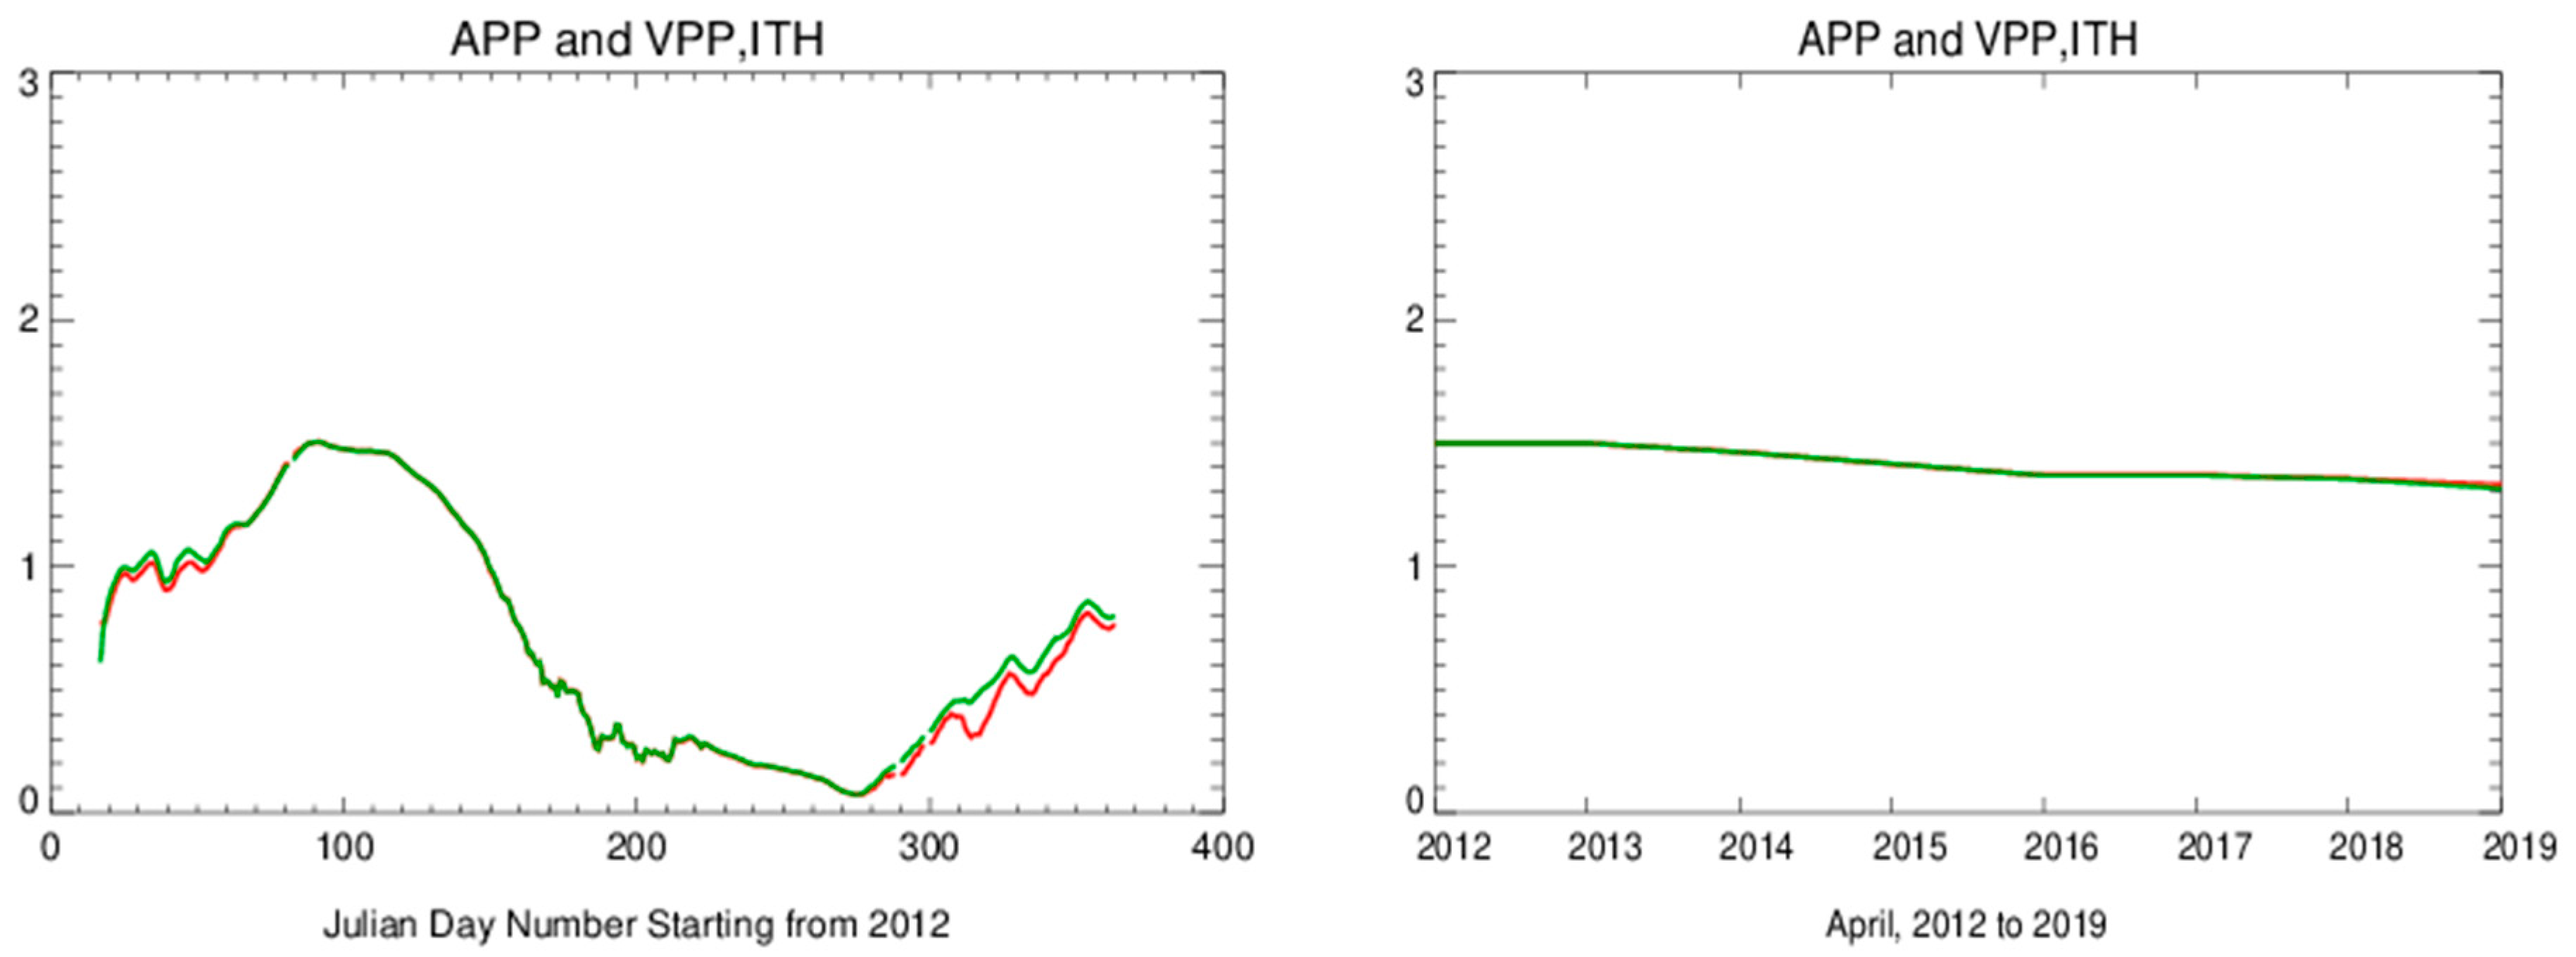
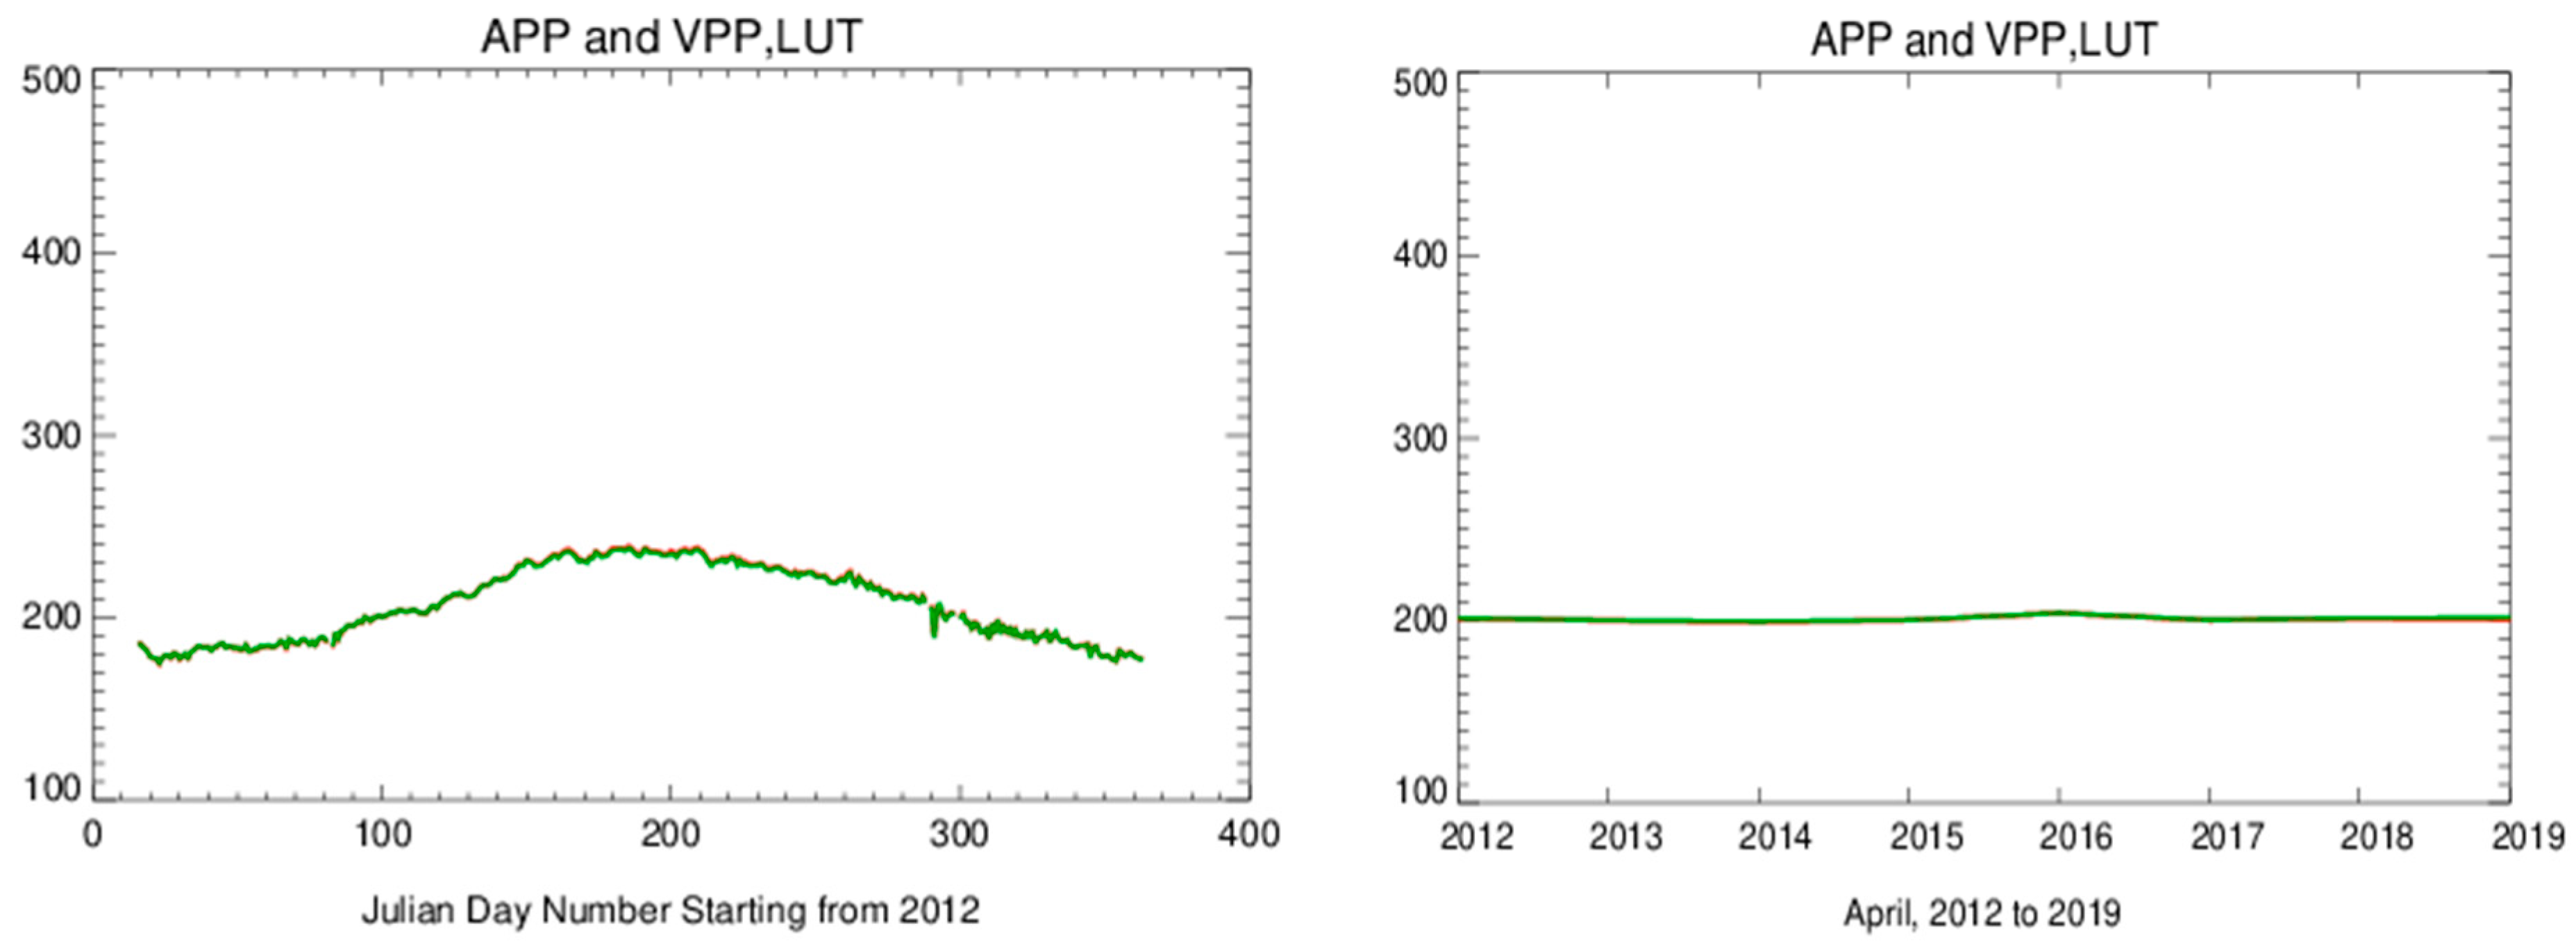
Figure 13 shows the time series of Arctic surface skin temperature from the same dataset as in Figure 12. The mean biases are −0.77 K for daily means and 0.01 K for April monthly means. Figure 14 gives the time series of sea ice thickness. The mean biases are −0.02 m for daily means and 0.003 m for April monthly means. Figure 15 shows the time series of longwave radiation flux at the top of the atmosphere in the Arctic. The mean biases are 0.32 Wm−2 for daily means and −0.34 Wm−2 for April monthly means. Figure 16 shows the time series of shortwave downwelling radiation flux at the surface. The mean biases are −2.32 Wm−2 for daily means and −7.84 Wm−2 for April monthly means.

6. Summary and Conclusions

Using polar orbiting satellite observations to conduct long-term climate research in the polar regions has the merits of broad spatial coverage and high temporal frequency. In this study, we employed the VIIRS Global Area Coverage (VGAC) data that is similar to AVHRR GAC data to build fundamental and thematic climate data records, herein termed the VIIRS Polar Pathfinder (VPP) and the Extended VIIRS Polar Pathfinder (VPP-x). Some VIIRS bands are nearly identical to AVHRR channels; others are not. The selected VIIRS bands are I1, I2, M12, M15, and M16, corresponding to AVHRR channels 1, 2, 3b, 4, and 5, respectively. To apply current retrieval algorithms that were developed for the Extended AVHRR Polar Pathfinder CDR (APP-x), the selected VIIRS band data need to be “calibrated” to the AVHRR channel data as closely as possible. This allows for the generation of VPP-x geophysical variables with only minor modifications to some algorithms. A multivariate regression approach was adopted to build a model for calibrating the five selected VIIRS bands that correspond to the five AVHRR channels.
The mean biases between AVHRR channels 1 and 2 and the corresponding VIIRS bands after intercalibration are less than 3.5% for both poles and both local solar times (LST), with much smaller biases for 14:00 LST than 04:00 LST. Regarding the infrared AVHRR channels 3b, 4, and 5, the mean biases are less than 0.70 K, 0.40 K, and 0.50 K, respectively, for both poles and both local solar times. The larger uncertainties in AVHRR infrared channels are caused by larger time differences between AVHRR and VIIRS, especially in the latter part of the NOAA-19 record when orbital drift became much larger.
Comparing APP-x and VPP-x, the mean biases in surface broadband albedo are less than 2.0% for both polar regions and both local solar times. The surface skin temperature bias is less than 1.4 K for the Antarctic, and less than 0.7 K for the Arctic. Sea ice thickness from AVHRR and VIIRS is in good agreement, with a mean difference of less than 0.02 m for the Southern Ocean and also for the Arctic Ocean. All of these biases are within the range of product retrieval uncertainty. The cloud cover fractions from AVHRR and VIIRS are also in good agreement overall, with the mean biases of less than 5% and 3% for the Antarctic and the Arctic, respectively. The mean biases in shortwave downwelling radiation flux at the surface are less than 4 Wm−2 for the Arctic and less than 8 Wm−2 for the Antarctic over 2012–2019. The mean biases in longwave downwelling radiation flux at the surface are less than 4 Wm−2 for the Arctic and less than 8 Wm−2 for the Antarctic.
Overall, the intercalibration approach described here resulted in consistent time series of AVHRR and VIIRS fundamental climate data records, though some differences exist due to acquisition time differences. Nevertheless, demonstrated agreement between the variables that comprise the APP-x and VPP-x thematic climate data records indicates that the geophysical data provided by APP-x starting in 1982 can be continued well into the future with VIIRS, providing robust information for high-latitude climate research [20].

Author Contributions

Conceptualization: X.W., J.R.K. and K.R.K.; Methodology: X.W.; Software: X.W., S.M. and R.J.D.; Validation: X.W. and J.R.K.; Formal analysis: X.W., J.R.K. and K.R.K.; Investigation: X.W.; Resources: X.W., J.R.K. and S.M.; Data curation: X.W., S.M., R.J.D., X.S. and K.R.K.; Writing—original draft: X.W.; Writing—review & editing: X.W., J.R.K., K.R.K., S.M., R.J.D. and X.S.; Visualization: X.W.; Supervision, X.W.; Project administration: X.W.; Funding acquisition: X.W., J.R.K. and K.R.K. All authors have read and agreed to the published version of the manuscript.

Funding

Funding support is from NOAA NESDIS through the subcontract with Riverside Technology, Inc.

Data Availability Statement

The Polar Pathfinder Fundamental Climate Data Record (FCDR) is available at https://www.ncei.noaa.gov/products/climate-data-records/avhrr-polar-pathfinder (accessed on 10 October 2025), and the Polar Pathfinder Extended Thematic Climate Data Record (TCDR) is available at https://www.ncei.noaa.gov/products/climate-data-records/extended-avhrr-polar-pathfinder (accessed on 10 October 2025).

Acknowledgments

This work was supported by the National Oceanic and Atmospheric Administration (NOAA) National Environmental Satellite Data and Information Service (NESDIS). K.R. Knapp was supported by NOAA through the Cooperative Institute for Satellite Earth System Studies under Cooperative Agreement NA24NESX432C0001T101. We thank NCEP–NCAR and the NASA Langley Research Center for their global profile data and ozone data, respectively, in their reanalysis products. The VGAC data are accessible through NOAA/CLASS (Comprehensive Large Array-data Stewardship System) at https://www.aev.class.noaa.gov/saa/products/welcome (accessed on 10 October 2025) and the anonymous FTP site at snpp.umd.edu. The views, opinions, and findings contained in this paper are those of the authors and should not be construed as an official National Oceanic and Atmospheric Administration or U.S. Government position, policy, or decision.

Conflicts of Interest

Author Kenneth R. Knapp was employed by the company Knapp WeatherSat Services LLC. The remaining authors declare that the research was conducted in the absence of any commercial or financial relationships that could be construed as a potential conflict of interest.

References

  1. Key, J.; Wang, X.; Liu, Y.; Dworak, R.; Letterly, A. The AVHRR Polar Pathfinder Climate Data Records. Remote Sens. 2016, 8, 167. [Google Scholar] [CrossRef]
  2. Karlsson, K.-G.; Håkansson, N.; Eliasson, S.; Wolters, E.; Scheirer, R. Extension of AVHRR-based climate data records: Exploring ways to simulate AVHRR radiances from Suomi-NPP VIIRS data. EGUsphere 2025, 18, 3833–3855. [Google Scholar] [CrossRef]
  3. Vermote, E.; Justice, C.; Csiszar, I.; Eidenshink, J.; Myneni, R.; Baret, F.; Masuoka, E.; Wolfe, R.; Claverie, M.; NOAA CDR Program. NOAA Climate Data Record (CDR) of AVHRR Surface Reflectance; Version 4; NOAA National Climatic Data Center: Asheville, NC, USA, 2014.
  4. Kilpatrick, K.; Williams, E.J.; Walsh, S.; Evans, R.; Szczodrak, M.D.; Izaguirre, M.A.; Minnett, P.J. Extending the Satellite Derived Climate DATA Record of Sea Surface Temperature with VIIRS. In Proceedings of the American Geophysical Union, Fall Meet, San Francisco, CA, USA, 15–19 December 2014; p. IN12A-05. [Google Scholar]
  5. Knapp, K.; Young, A.; Inamdar, A.; Hankins, W. ISCCP and VIIRS: Adapting New Instruments to Extend Historical Climate Data Records. In Proceedings of the 2019 AMS Joint Satellite Conference, Boston, MA, USA, 28 September–4 October 2019. [Google Scholar]
  6. Kidwell, K.B. NOAA KLM User’s Guide with NOAA-N, -P Supplement; February 2009 Revisions; NOAA/NESDIS: Washington, DC, USA, 2009.
  7. Cao, C.; Xiong, X.; Blonski, S.; Liu, Q.; Uprety, S.; Shao, X.; Bai, Y.; Weng, F. Suomi NPP VIIRS Sensor Data Record Verification, Validation and Long-Term Performance Monitoring. J. Geophys. Res.-Atmos. 2013, 118, 11664–11678. [Google Scholar] [CrossRef]
  8. Cao, C.; Deluccia, F.; Qiu, S.; NOAA JPSS Program Office. NOAA JPSS Visible Infrared Imaging Radiometer Suite (VIIRS) Sensor Data Record (SDR) from IDPS; NOAA National Centers for Environmental Information: Mississippi State, MS, USA, 2012. [CrossRef]
  9. Key, J.; Liu, Y.; Wang, X.; NOAA CDR Program. NOAA Climate Data Record (CDR) of AVHRR Polar Pathfinder (APP) Cryosphere; Version 2.0; NOAA National Centers for Environmental Information (NCEI): Mississippi State, MS, USA, 2019. [CrossRef]
  10. Lyapustin, A.I.; Wang, Y.; Choi, M.; Xiong, X.; Angal, A.; Wu, A.; Doelling, D.R.; Bhatt, R.; Go, S.; Korkin, S.; et al. Calibration of the SNPP and NOAA 20 VIIRS sensors for continuity of the MODIS climate data records. Remote Sens. Environ. 2023, 295, 113717. [Google Scholar] [CrossRef]
  11. Cao, C.; Weinreb, M.; Xu, H. Predicting Simultaneous Nadir Overpasses among Polar-Orbiting Meteorological Satellites for the Intersatellite Calibration of Radiometers. J. Atmos. Ocean. Technol. 2004, 21, 537–542. [Google Scholar] [CrossRef]
  12. Cao, C.; Xiong, X.; Wu, A.; Wu, X. Assessing the consistency of AVHRR and MODIS L1B reflectance for generating Fundamental Climate Data Records. J. Geophys. Res. 2008, 113, D09114. [Google Scholar] [CrossRef]
  13. Chander, G.; Hewison, T.J.; Fox, N.; Wu, X.; Xiong, X.; Blackwell, W.J. Overview of Intercalibration of Satellite Instruments. In IEEE Transactions on Geoscience and Remote Sensing; IEEE: Hoboken, NJ, USA, 2013; Volume 51, pp. 1056–1080. [Google Scholar] [CrossRef]
  14. Wang, L.; Hu, X.; Chen, L.; He, L. Consistent Calibration of VIRR Reflective Solar Channels Onboard FY-3A, FY-3B, and FY-3C Using a Multisite Calibration Method. Remote Sens. 2018, 10, 1336. [Google Scholar] [CrossRef]
  15. Key, J.; Wang, X.; Liu, Y.; NOAA CDR Program. NOAA Climate Data Record of AVHRR Polar Pathfinder Extended (APP-X); Version 2; NOAA National Centers for Environmental Information: Mississippi State, MS, USA, 2019. [CrossRef]
  16. Wang, X.; Key, J. Arctic Surface, Cloud, and Radiation Properties Based on the AVHRR Polar Pathfinder Data Set. Part I: Spatial and Temporal Characteristics. J. Clim. 2005, 18, 2558–2574. [Google Scholar] [CrossRef]
  17. Wang, X.; Key, J.; Kwok, R.; Zhang, J. Comparison of sea ice thickness from satellites, aircraft, and PIOMAS data. Remote Sens. 2016, 8, 713. [Google Scholar] [CrossRef]
  18. Liu, Y.; Ackerman, S.; Maddux, B.; Key, J.; Frey, R. Errors in cloud detection over the Arctic using a satellite imager and implications for observing feedback mechanisms. J. Clim. 2010, 23, 1894–1907. [Google Scholar] [CrossRef]
  19. Liu, Y.; Key, J.; Wang, X. Influence of changes in sea ice concentration and cloud cover on recent Arctic surface temperature trends. Geophys. Res. Lett. 2009, 36, L20710. [Google Scholar] [CrossRef]
  20. Wang, X.; Liu, Y.; Key, J.; Dworak, R. A New Perspective on Four Decades of Changes in Arctic Sea Ice from Satellite Observations. Remote Sens. 2022, 14, 1846. [Google Scholar] [CrossRef]
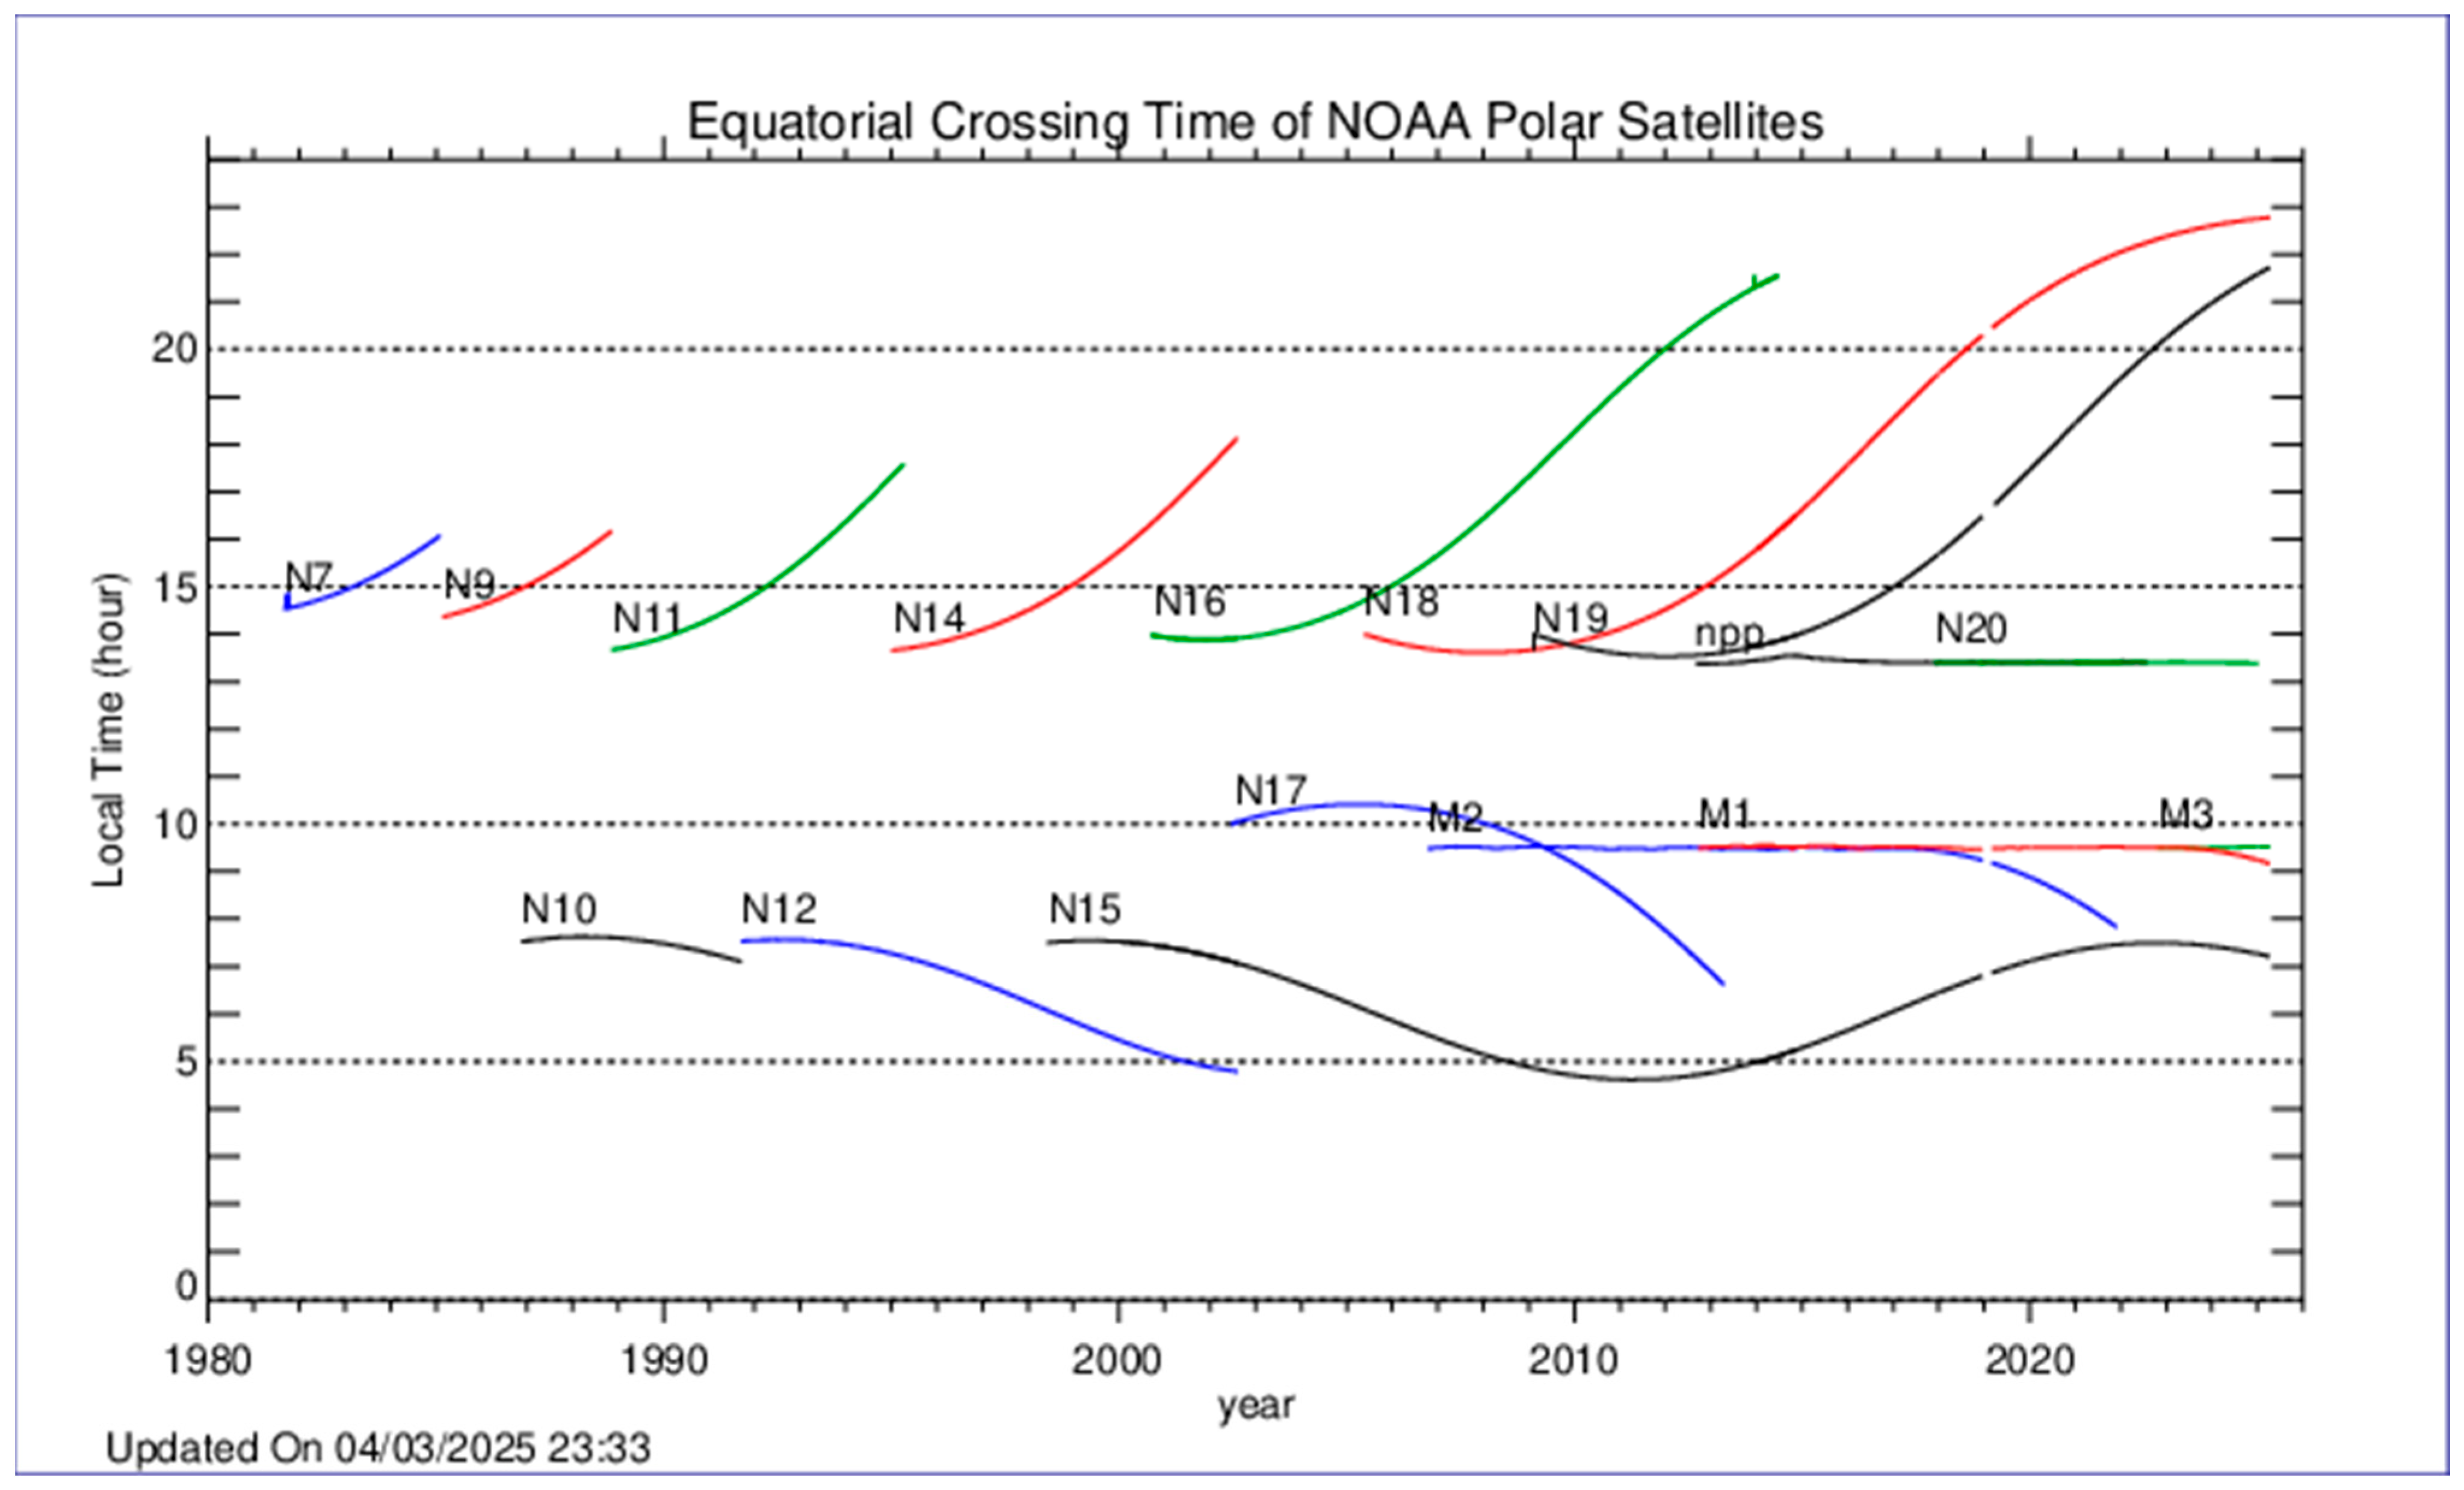
Figure 1. Equatorial Crossing Time (ECT) of NOAA POES. (Figure is from www.star.nesdis.noaa.gov/smcd/emb/vci/VH/vh_avhrr_ect.php (accessed on 10 October 2025). The original ECT data are from www.ospo.noaa.gov/Products/ppp/navpage.html (accessed on 10 October 2025)).
Remotesensing 17 03495 g001
Figure 2. AVHRR channel 1 and channel 2 reflectances (0~1) at 14:00 LST in the Arctic on 18 July 2012 from APP (upper row) and VPP (lower row).
Remotesensing 17 03495 g002aRemotesensing 17 03495 g002b
Figure 3. AVHRR channel 3b, 4, and 5 brightness temperature (K) at 14:00 LST in the Arctic on 18 July 2012, from APP (upper row) and VPP (lower row).
Remotesensing 17 03495 g003
Figure 4. AVHRR channel 1 and channel 2 reflectances (0~1) at 14:00 LST in the Antarctic on 31 January 2012, from APP (upper row) and VPP (lower row).
Remotesensing 17 03495 g004
Figure 5. AVHRR channel 3b, 4, and 5 brightness temperature (K) at 14:00 LST in the Antarctic on 31 January 2012, from APP (upper row) and VPP (lower row).
Remotesensing 17 03495 g005
Figure 6. Surface broadband albedo (0~1) from AVHRR (left), VIIRS (middle), and their difference (right) data for 18 July (upper) and the July monthly mean (lower) in 2012 at 14:00 LST for the Arctic region.
Remotesensing 17 03495 g006aRemotesensing 17 03495 g006b
Figure 7. Surface skin temperature (K) from AVHRR (left) and VIIRS (right) data for 18 July (upper) and the July monthly mean (lower) in 2012 at 14:00 LST for the Arctic region.
Remotesensing 17 03495 g007
Figure 8. Surface broadband albedo (0~1) from AVHRR (left), VIIRS (middle), and their difference (right) data for 24 January (upper) and the January monthly mean (lower) in 2012 at 14:00 LST for the Antarctic region.
Remotesensing 17 03495 g008
Figure 9. Surface skin temperature (K) from AVHRR (left) and VIIRS (right) data for 24 January (upper) and the January monthly mean (lower) in 2012 at 14:00 LST for the Antarctic region.
Remotesensing 17 03495 g009
Figure 10. Sea ice thickness from (m) AVHRR (left) and VIIRS (right) for the July monthly mean in 2012 for the Arctic Ocean (upper), and for the January monthly mean (lower) in 2012 for the Southern (Antarctic) Ocean.
Remotesensing 17 03495 g010
Figure 11. Times series of NOAA-19 AVHRR channel 1 and 2 reflectances (0~1), channel 3b, 4, and 5 brightness temperatures (K) (red lines) vs. the time series of NOAA-20 VIIRS band I1 and I2 reflectances (0~1), M12, M15, and M16 brightness temperatures (K) (green lines) after intercalibration over 2012 at 14:00 LST for the Arctic region north of 60 degrees.
Remotesensing 17 03495 g011
Figure 12. Time series of surface broadband albedo (0~1) from NOAA-19 AVHRR (red lines) and NOAA-20 VIIRS (green lines) data at 14:00 local solar time for the Arctic region north of 60 degrees. (Left): daily means for 2012; (right): April monthly means for 2012–2019.
Remotesensing 17 03495 g012
Figure 13. Time series of surface skin temperature (K) from NOAA-19 AVHRR (red line) and NOAA-20 VIIRS (green lines) data at 14:00 local solar time for the Arctic region north of 60 degrees. (Left): daily means for 2012; (right): April monthly means for 2012–2019.
Remotesensing 17 03495 g013
Figure 14. Time series of sea ice thickness (m) from NOAA-19 AVHRR (red lines) and NOAA-20 VIIRS (green lines) data at 14:00 local solar time for the Arctic region north of 60 degrees. (Left): daily means for 2012; (right): April monthly means for 2012–2019.
Remotesensing 17 03495 g014
Figure 15. Time series of the longwave radiation flux (W/m2) on the top of the atmosphere from NOAA-19 AVHRR (red lines) and NOAA-20 VIIRS (green lines) data at 14:00 local solar time for the Arctic region north of 60 degrees. (Left): daily means for 2012; (right): April monthly means for 2012–2019.
Remotesensing 17 03495 g015
Figure 16. Time series of the surface downwelling radiation flux (W/m2) from NOAA-19 AVHRR (red lines) and NOAA-20 VIIRS (green lines) data at 14:00 local solar time for the Arctic region north of 60 degrees. (Left): monthly means for 2012; (right): April monthly means for 2012–2019.
Remotesensing 17 03495 g016
Table 1. Spectral Specifications of AVHRR and VIIRS Channels.
AVHRR/VIIRSTIROS-NNOAA-6, 8, 10NOAA-7, 9, 11, 12, 14NOAA-15 and OnwardSuomi NPP, NOAA-20, NOAA-21GAC/VGAC Nadir Resolution (km)
AVHRR/1AVHRR/1AVHRR/2AVHRR/3VIIRS4.0
1/I10.55–0.90 μm0.58–0.68 μm0.58–0.68 μm0.58–0.68 μm0.60–0.68 μm4.0
2/I20.725–1.10 μm0.725–1.10 μm0.725–1.10 μm0.725–1.00 μm0.85–0.88 μm4.0
3a/M10 1.58–1.64 μm1.58–1.64 μm4.0
3b/M123.55–3.93 μm3.55–3.93 μm3.55–3.93 μm3.55–3.93 μm3.61–3.79 μm4.0
4/M1510.50–11.50 μm10.50–11.50 μm10.30–11.30 μm10.30–11.30 μm10.26–11.26 μm4.0
5/M16Ch4 repeatedCh4 repeated11.50–12.50 μm11.50–12.50 μm11.06–12.96 μm4.0
Table 2. Equation (1) coefficients a0, a1, a2, a3, and a4, and the multivariate regression equation correlations.
ChannelArcticAntarctica
AVHRRVIIRSCoefficientLocal Solar Time (LST)Local Solar Time (LST)
14:0004:0014:0002:00
Channel 1
(unitless)
I 1a00.04447980.1413760.08322670.333388
a10.9508180.8335800.8668250.625409
a216.18118 × 10−5−0.0001543969.89594 × 10−5−6.33436 × 10⁻⁶
a3−0.000511533−0.00168859−0.00102623−0.00380498
a4−0.0001152400.000135720−5.24421 × 10−53.31371 × 10−6
Correlation Coefficient 0.98300.97910.98530.9596
Channel 2
(unit-less)
I 2a00.03492080.08526990.06962030.275838
a10.8987620.8487460.8487460.617322
a2−0.000150966−8.79787 × 10⁻⁵−0.000212826−5.60397 × 10⁻⁵
a3−0.000271385−0.00104449−0.000755311−0.00308326
a4−0.0001709800.000180242−0.0001203863.52749 × 10−6
Correlation Coefficient 0.97840.96780.98040.9138
Channel 3b
(K)
M 12a00.771362−4.27588− 24.5507−10.2141
a11.004701.019251.078631.03415
a20.00633876−0.0268919−0.06378150.0232074
a3−0.0296343−0.02103680.05070040.00150771
a4−0.006688370.0156104−0.01336550.00209493
Correlation Coefficient 0.99120.98680.99320.9794
Channel 4
(K)
M 15a07.686174.65945−1.684922.17236
a10.9744100.9867691.005980.988380
a20 0.00610216−0.00839578−0.006268530.0185437
a3−0.0137250−0.006331990.01041640.00225882
a4−0.00101397−0.0102910−0.009139210.00304020
Correlation Coefficient 0.98650.98470.99620.9861
Channel 5
(K)
M 16a09.585374.96841−1.346042.97693
a10.9664090.9836101.004600.984615
a20.00531683−0.00977714−0.003877290.0175073
a3−0.0150232−0.005204820.01069720.00188959
a4−0.000868135−0.00686013−0.01245730.00237256
Correlation Coefficient 0.98650.98420.99580.9864
Table 3. The mean biases and standard deviations (STD) of all AVHRR 5 channels between APP and VPP at two local solar times.
PoleArcticAntarctic
Year201220192012–2019201220192012–2019
LST14:00/04:0014:00/04:0014:00/04:0014:00/02:0014:00/02:0014:00/02:00
CH1 (%)0.18/0.42−2.85/6.72−0.85/3.032.69/−0.21−5.73/1.422.47/1.47
STD1.05/1.170.97/4.761.25/1.531.00/2.713.57/2.771.31/1.25
No. of cases181/182180/0141425/994131/158037/0881133/1239
CH2 (%)0.33/1.18−3.17/8.28−1.22/3.653.07/0.94−3.78/1.383.10/2.38
STD1.44/1.631.14/1.781.48/1.580.99/3.135.02/2.791.02/1.56
No. of cases181/182180/0351425/999131/156002/0781121/1195
CH3b (K)−0.02/0.68−1.80/−0.91−0.18/0.810.16/−0.74−0.16/0.010.07/−0.68
STD0.33/0.250.28/0.770.48/0.421.08/0.770.77/1.221.06/0.78
No. of cases345/346110/0161996/1615335/300113/0882165/2165
CH4 (K)0.10/0.27−0.34/0.21−0.01/0.240.10/0.15−1.79/−0.40−0.32/−0.02
STD0.24/0.160.26/0.670.25/0.340.19/0.140.23/0.270.60/0.27
No. of cases346/346364/3652860/2861347/345216/3642695/2861
CH5 (K)0.01/0.23−0.39/0.14−0.07/0.20−0.07/0.09−1.94/−0.35−0.45/−0.04
STD0.21/0.140.25/0.600.23/0.300.20/0.150.17/0.250.49/0.24
No. of cases346/346364/3652860/2860347/345247/3642575/2861
Table 4. The mean biases and standard deviations (STD) between APP-x and VPP-x: surface broadband albedo (ALB in percent), surface skin temperature (TSS in K), sea ice thickness (ITH in meter), cloud coverage (CMK in percent), shortwave downwelling radiation at the surface (SDS in W/m2), longwave downwelling radiation at the surface (LDS in W/m2), shortwave upwelling radiation at the surface (SUS in W/m2), longwave upwelling radiation at the surface (LUS in W/m2), shortwave upwelling radiation at the TOA (SUT in W/m2), and longwave upwelling radiation at the TOA (LUT in W/m2).
PoleArcticAntarctic
Year201220192012–2019201220192012–2019
LST14:00/04:0014:00/04:0014:00/04:0014:00/02:0014:00/02:0014:00/02:00
ALB (%)−0.99/−1.70−2.69/−1.89 −1.52/−1.48 0.20/1.95 −3.00/2.44 0.98/2.28
STD1.44/2.140.93/2.081.45/2.261.87/2.070.11/1.611.98/1.80
No. of cases183/167183/1681427/1305164/109170/1261414/0999
TSS (K)0.84/0.48 0.28/1.18 0.70/0.61 1.20/0.53 1.68/−0.61 1.39/0.04
STD0.60/0.691.03/0.900.84/0.760.57/0.490.94/0.910.64/0.84
No. of cases347/344364/3642852/2844347/344345/3622830/2844
ITH (m)−0.02/−0.02 −0.01/−0.03 −0.01/−0.02 −0.01/0.01 −0.02/0.01 −0.01/0.01
STD0.03/0.030.02/0.030.02/0.020.02/0.020.03/0.030.03/0.03
No. of cases347/344364/3642878/2879347/344345/3622830/2844
CMK (%)2.58/3.77 2.35/4.66 2.10/−2.02 3.87/4.32 2.38/2.15 4.79/2.70
STD5.02/6.7410.1/6.88 5.35/6.605.46/4.028.51/6.8611.0/4.92
No. of cases347/346364/3642852/2850347/346354/3622843/2850
SDS (W/m2)−3.21/0.61 −2.69/−7.10 −3.16/−1.67 −5.79/4.94 −1.90/9.70 −7.45/7.01
STD4.20/3.087.90/5.445.83/5.096.77/7.9814.87/7.466.62/6.85
No. of cases301/159265/1562392/1231221/104005/101993/917
LDS (W/m2)4.29/−0.91 0.80/5.59 3.17/0.33 4.56/2.50 9.12/−1.91 6.31/0.73
STD3.73/5.586.60/7.354.40/5.774.33/2.939.52/6.395.43/4.67
No. of cases335/336349/3632823/2832344/342162/3592587/2829
SUS (W/m2)−2.73/−2.95 −9.98/−8.15 −4.94/−4.07 −1.35/7.63 −9.83/8.31 −4.78/9.44
STD5.95/4.465.95/5.526.46/5.147.06/9.783.48/10.07.85/9.42
No. of cases303/159248/1582368/1233237/081023/0571198/645
LUS (W/m2)4.48/2.08 1.59/5.45 3.54/2.41 4.20/1.32 9.44/−2.44 5.47/−0.01
STD3.47/4.034.76/5.224.06/3.963.05/2.376.83/4.444.67/3.81
No. of cases344/342361/3642845/2840347/344297/3622767/2838
SUT (W/m2)−2.73/−3.61 −5.50/0.39 −1.23/−1.97 6.68/7.78 2.29/10.58 6.58/9.13
STD6.37/3.748.39/3.947.44/4.675.04/5.8010.8/6.437.10/6.22
No. of cases303/160248/1592409/1238285/108033/1241699/982
LUT (W/m2)0.31/0.35 −0.43/0.24 0.12/0.35 0.11/0.41 −4.68/−0.31 −1.29/0.23
STD0.55/0.360.77/1.070.83/0.910.39/0.402.29/0.582.21/0.56
No. of cases347/344364/3642851/2843347/344353/3622840/2843
Disclaimer/Publisher’s Note: The statements, opinions and data contained in all publications are solely those of the individual author(s) and contributor(s) and not of MDPI and/or the editor(s). MDPI and/or the editor(s) disclaim responsibility for any injury to people or property resulting from any ideas, methods, instructions or products referred to in the content.