Article

Development of a Drought Assessment Index Coupling Physically Based Constraints and Data-Driven Approaches

1
College of Information Technology, Jilin Agricultural University, Changchun 130118, China
2
State Key Laboratory of Black Soils Conservation and Utilization, Northeast Institute of Geography and Agroecology, Chinese Academy of Sciences, Changchun 130102, China
*
Author to whom correspondence should be addressed.
Remote Sens. 2025, 17(20), 3452; https://doi.org/10.3390/rs17203452 (registering DOI)
Submission received: 26 August 2025 / Revised: 11 October 2025 / Accepted: 13 October 2025 / Published: 16 October 2025

Abstract

Highlights

What are the main findings?
  • Developed a Multivariate Drought Index combining mechanism constraints with data-driven approaches.
  • MDI detects drought 16–20 days earlier and identifies <10 ha patches at 250 m.
What is the implication of the main finding?
  • Provides a reliable tool for early drought warning and precision agricultural water management.
  • Offers a transferable framework for scalable, interpretable drought monitoring under climate change.

Abstract

To improve the physical consistency and interpretability of traditional drought indices, this study proposes a drought assessment model that couples physically based constraints with data-driven approaches, leading to the development of a Multivariate Drought Index (MDI). The model employs convolutional neural networks to achieve physically consistent downscaling, thereby obtaining a high-resolution Normalized Difference Water Index (NDWI), Temperature Vegetation Dryness Index (TVDI), Vegetation Condition Index (VCI), and Temperature Condition Index (TCI). Objective weights are determined using the Criteria Importance Through Intercriteria Correlation method, while random forest and Shapley Additive Explanations are integrated for nonlinear interpretation and physics-guided calibration, forming an ensemble framework that incorporates multi-source and multi-scale factors. Validation with multi-source data from 2000 to 2024 in the major maize-growing areas of Heilongjiang Province demonstrates that MDI outperforms single indices and the Vegetation Health Index (VHI), achieving a correlation coefficient (r = 0.87), coefficient of determination (R2 = 0.87), RMSE (0.08), and classification accuracy (87.4%). During representative drought events, MDI identifies signals 16–20 days earlier than the Standardized Precipitation Evapotranspiration Index (SPEI) and the Soil Moisture Condition Index (SMCI), and effectively captures localized drought patches at a 250 m scale. Feature importance analysis indicates that the NDWI and TVDI are consistently identified as dominant factors across all three methods, aligning physically interpretable analysis with statistical contribution. Long-term risk zoning reveals that the central–western region of the study area constitutes a high-risk zone, accounting for 42.6% of the total. This study overcomes the limitations of single indices by integrating physical consistency with the advantages of data-driven methods, achieving refined spatiotemporal characterization and enhanced overall performance, while also demonstrating potential for application across different crops and regions.

1. Introduction

Under global climate change, the increasing frequency of droughts and other extreme weather events poses growing threats to China’s food security [1,2]. As a nationally important black soil region and a major grain production base, Heilongjiang Province holds strategic significance for China’s food security. However, its production of spring maize—a dominant crop in the region—has been severely impacted by drought [3]. Since the 1990s, the frequency of drought in Heilongjiang Province has risen significantly, with spring maize increasingly affected. Projections suggest this trend will persist until the mid-21st century, making drought a key limiting factor for maize production in the region [4,5]. Drought severely constrains crop water availability. Prolonged drought conditions can lead to stunted growth and yield reduction. Therefore, accurately characterizing regional drought patterns and predicting drought occurrence are critical for guiding precision irrigation in high-standard farmland. Such measures are essential to improve crop yields and safeguard national food security [6,7].
A variety of drought indices have been developed to assess and monitor different types of drought conditions, each with distinct characteristics tailored to specific monitoring needs and research objectives. Traditional drought indices primarily rely on ground-based meteorological station observations, analyzing parameters such as temperature, precipitation, relative humidity, wind speed, evapotranspiration, and soil moisture [8,9]. Among these, the most widely used indices for meteorological drought monitoring include the Palmer Drought Severity Index (PDSI) [10], the Standardized Precipitation Index (SPI) [11], and the Standardized Precipitation Evapotranspiration Index (SPEI) [12]. While continuous meteorological measurements enable effective drought monitoring, this approach suffers from limitations such as uneven station distribution and limited spatial representativeness [13,14]. To address these challenges, researchers have increasingly turned to remote sensing technology, which provides real-time, large-scale monitoring of vegetation and soil moisture with cost-effective solutions. The application of remote sensing in drought monitoring originated with soil moisture studies and has since expanded significantly. Recent advances in remote sensing models have shifted from single-band or single-index applications to multi-band synergy and multi-index fusion approaches. Commonly used indices now include the Normalized Difference Vegetation Index (NDVI) [15,16,17], Temperature Vegetation Dryness Index (TVDI), Vegetation Condition Index (VCI), and Temperature Condition Index (TCI) [18,19]. However, these indices often capture only one aspect of drought (e.g., vegetation stress or temperature anomalies) and fail to provide a comprehensive characterization of drought conditions.
These limitations are particularly critical for maize drought monitoring because of the crop’s physiological and agronomic characteristics. Maize has a relatively short growing season, rapid phenological transitions, and high water requirements during key developmental stages, making it extremely sensitive to fluctuations in soil moisture and temperature. Even brief water deficits can cause significant stress and yield reduction. Under such conditions, vegetation-based indices such as NDVI and VCI often fail to capture the early onset of drought due to the canopy’s physiological buffering [20], while temperature-based indices such as TCI may misinterpret transient heat anomalies as drought signals [21]. Moreover, the coarse spatial resolution of conventional indices (typically 500 m–1 km) limits their ability to capture fine-scale hydrothermal heterogeneity that strongly influences field-level water stress and yield formation [22,23]. These challenges underscore the need for an integrated, high-resolution framework capable of accurately characterizing drought dynamics in maize-growing regions.
Developing a universally applicable drought index remains challenging due to the complex interplay of multiple influencing factors. This challenge underscores the importance of selecting region-specific and temporally relevant parameters for composite drought index development, an approach that carries both theoretical significance and practical value. In recent years, the research community has shown growing interest in constructing comprehensive drought monitoring indices that integrate multiple drought-related variables. The predominant mathematical frameworks for such composite indices include principal component analysis (PCA) [24], the entropy weight method (EWM) [25], and various machine learning approaches [26]. While these composite indices have proven valuable for drought monitoring applications, their underlying mathematical models exhibit significant limitations in parameter weighting. Principal component analysis, while effective for dimensionality reduction, proves suboptimal for direct weighting applications due to its poor interpretability and failure to account for parameter correlations. Similarly, the entropy weight method demonstrates limitations through its dependence on data discretization, neglect of parameter relationships, and general instability. Machine learning techniques, though powerful, present practical challenges including substantial data requirements, implementation complexity, and limited scalability. These collective shortcomings highlight the pressing need for developing more robust weighting methodologies and constructing simpler, more reliable composite models [27,28].
To comprehensively represent drought-related processes, the proposed MDI integrates five complementary factors—NDWI, TVDI, VCI, TCI, and DEM—corresponding to canopy water status, hydrothermal stress, vegetation vigor, thermal condition, and topographic constraint, respectively (see Table 1 for details).
Furthermore, most existing composite drought indices operate at spatial resolutions of 500 m–1 km and temporal resolutions on a monthly scale. While useful for regional assessments, these resolutions prove inadequate for agricultural applications, as individual pixels often encompass multiple vegetation types and land cover classes [14,21]. At finer field scales, the inherent spatial heterogeneity of vegetation conditions and topographic features creates substantial variability in drought stress patterns. Consequently, the current resolution limitations of composite drought indices fail to meet the precision requirements for effective field-scale monitoring, particularly for typical agricultural fields ranging from 0.1 to 10 ha.
To address these challenges, recent research has increasingly focused on integrating physical process understanding with data-driven techniques to enhance both interpretability and robustness. In this context, the present study emphasizes a physically driven data-driven coupling framework. Here, the term physically driven refers to the physically based processes that govern drought formation and its remote-sensing manifestations, including surface energy balance, soil–vegetation–atmosphere water transfer, and the spectral–thermal response of vegetation. The so-called physically based constraints denote the incorporation of these physical relationships as prior constraints in the data-driven model, ensuring that the outputs remain consistent with actual drought dynamics in spatial, temporal, and physical terms. Compared with purely empirical or statistical models, such physically constrained approaches improve interpretability and generalization across different climatic zones and cropping systems.
Heilongjiang Province is the core maize production region in China, characterized by a unique agro-ecological environment with high-latitude cold climate, concentrated distribution of black soils, and pronounced spatiotemporal variability in precipitation, making it highly sensitive to drought. Previous drought monitoring studies in Heilongjiang have primarily used meteorological indices such as the SPEI and PDSI to assess regional drought conditions. These studies have indicated increasing drought frequency and severity, particularly in the central and western parts of the province. Remote sensing-based indices like TVDI and VCI have also been applied to monitor vegetation stress and drought impacts on crop production. However, these studies often rely on coarse spatial resolutions (e.g., 1 km) and broader temporal scales, which may not fully capture the fine-scale variability in drought conditions affecting crop health. This study aims to address these gaps by developing a high-resolution drought monitoring index (MDI) that is specifically designed for maize-growing regions in Heilongjiang. Based on this context, the present study focuses on the maize-growing season (May–September) from 2000 to 2024, and selects the maize cultivation areas of Heilongjiang Province as the study region. A high-spatiotemporal-resolution Multivariate Drought Index (MDI), applicable at the farmland scale, is constructed. This index integrates multi-source remote sensing data and incorporates multidimensional information such as precipitation dynamics, vegetation cover conditions, temperature gradients, and topographic variations, with the aim of enhancing both the comprehensiveness and regional applicability of drought monitoring.
The specific objectives of this study are as follows:
(1)
To propose an MDI that integrates multiple drought-related factors while maintaining high spatiotemporal resolution, thereby enabling more accurate characterization of drought evolution in maize-growing regions;
(2)
To systematically evaluate the performance and advantages of the MDI in drought monitoring through comparative analysis with commonly used indices, highlighting its improvements in capturing spatiotemporal dynamics;
(3)
To identify and analyze the spatiotemporal patterns and evolutionary processes of drought in maize cultivation areas of Heilongjiang Province based on the MDI, thereby providing scientific reference for regional agricultural drought mitigation and water resource management.

2. Research Data and Methodology

2.1. Overview of the Study Area

Heilongjiang Province is geographically located between 121°11′E to 135°05′E and 43°25′N to 53°33′N [20]. A cold-temperate to temperate continental monsoon climate prevails, featuring concurrent precipitation and heat during summer; summers are hot and rainy but short, while winters are cold, dry, and prolonged. The annual average temperature ranges from −6 °C to 4 °C, with a frost-free period of 100–140 days. Annual precipitation varies from 400 mm to 650 mm, distributed unevenly across the province: highest in the central region, moderate in the east, and lowest in the northern and western areas. The terrain exhibits distinct topographic variation, sloping from higher elevations in the northwest to lower elevations in the southeast. As a typical dryland farming region, Heilongjiang operates under one-crop-per-year system [22,23,29,30]. The area is renowned for its black soils, characterized by dark black humus-rich topsoil layers with excellent physical properties and high fertility, providing ideal conditions for maize cultivation. As the predominant crop, maize occupies a stable cultivation area of approximately 6 million ha with production reaching 43.79 million tons in 2023—representing 56.23% of grain output. Drought stands as one of the most severe agricultural disasters in this region [31]. According to the National Bureau of Statistics, the average annual drought-affected area reached 2,128,700 ha during 2000–2019 [32]. An overview of the study area is presented in Figure 1.
Table 1. Core Indicators Used for the Construction of MDI.
IndicatorData SourceObservation DimensionPhysical SignificanceFormula
NDWIMOD09Canopy moistureSensitivity to vegetation water stress [33] N D W I = ρ N I R ρ S W I R ρ N I R + ρ S W I R
TVDIMOD11Hydrothermal conditionDegree of relative soil drought [34] T V D I = L S T L S T m i n L S T m a x L S T m i n
VCIMOD13Vegetation vigorVegetation growth anomaly [35] V C I = N D V I N D V I m i n N D V I m a x N D V I m i n
TCIMOD11Thermal conditionHigh-temperature/heat stress [35] T C I = L S T m a x L S T L S T m a x L S T m i n
DEMRESDCTopographySpatial hydrothermal constraint factor
The spatial extent of maize cultivation used in this study was derived from the China Cropland Dataset for Maize (CCD-Maize, 2001–2023). This dataset provides nationwide maize distribution maps at a spatial resolution of 30 m, referenced to the WGS84 coordinate system (EPSG:4326), and covers 22 maize-producing provinces in China. The dataset was generated from high spatiotemporal resolution fused NDVI time series using the Time-Weighted Dynamic Time Warping (TWDTW) algorithm. It was trained with 54,281 ground samples and achieved an overall accuracy of approximately 80% at the provincial level. At the county level, the correlation coefficient (R2) between the identified maize area and statistical records ranged from 0.657 to 0.903. Specifically, the 2001–2020 dataset was derived from fused MODIS/Landsat NDVI, while the 2021–2023 dataset incorporated fused Landsat/Sentinel-2 NDVI. This dataset was published and made freely available through the National Science & Technology Resource Sharing Service Platform (https://cstr.cn/31253.11.sciencedb.08490; accessed on 4 March 2025). In this study, maize planting areas within Heilongjiang Province were extracted as the target cropland mask. The spatial extent of maize cultivation was obtained from the China Cropland Dataset for Maize (CCD-Maize, 2001–2023). To ensure a consistent spatial framework for long-term drought monitoring, the temporal coverage of the remote sensing data was extended to 2000–2024. Considering the continuous distribution of maize fields in Heilongjiang Province and the negligible interannual variation in cropland boundaries, the CCD-Maize dataset was regarded as representing a stable maize cultivation extent for the entire study period.

2.2. Indicator Groups and Observation Dimension Configuration

To ensure the multidimensional coverage of MDI in process-based representation, this study integrated multi-source remote sensing, meteorological, and environmental data to construct a two-tier indicator system consisting of “core construction indicators” and “external validation indicators” (See Table 2 for details). In terms of data sources, vegetation and hydrothermal condition indices were primarily derived from MODIS products, including surface reflectance (MOD09), vegetation index (MOD13), and land surface temperature (MOD11). The temporal resolution was composited into 16-day intervals to align with the phenological rhythm of maize growth. Meteorological data were obtained from the China Meteorological Data Service Center (http://data.cma.cn; accessed on 5 May 2025), covering monthly precipitation, temperature (maximum, mean, and minimum), wind speed, relative humidity, and atmospheric pressure. Based on these variables, SPEI was calculated to characterize meteorological drought processes at different time scales [36].
Soil moisture data were derived from the SMCI1.0 dataset (Soil Moisture of China by in situ data, version 1.0) released by the Northwest Institute of Eco-Environment and Resources, Chinese Academy of Sciences, with a spatial resolution of 1 km, daily coverage from 2000 to 2020, and 10 soil layers spanning 0–100 cm depth [37]. Soil moisture data for the major maize cultivation areas within the study region were extracted through spatial clipping, and SMCI was subsequently calculated. DEM data were obtained from the Resource and Environment Science and Data Center, Chinese Academy of Sciences (https://www.resdc.cn; accessed on 29 May 2025), with a spatial resolution of 250 m, and were used to constrain terrain effects.
The datasets were selected to represent distinct but complementary physical processes controlling drought evolution: surface reflectance (MOD09) for canopy spectral moisture, land surface temperature (MOD11) for hydrothermal condition, and vegetation index products (MOD13) for growth and vigor anomalies. NDWI is sensitive to liquid water content in vegetation canopies, making it a direct indicator of short-term moisture stress. TVDI captures the coupled effect of temperature and vegetation greenness, reflecting soil moisture deficit under heat stress. VCI represents relative greenness and vegetation vigor, suitable for cumulative drought monitoring. TCI measures canopy temperature anomalies, indicative of heat and evapotranspiration stress. These indices together describe the water–energy–vegetation continuum central to drought processes.
Due to data availability, the validation datasets for SPEI-3, SMCI-3, and VHI were selected for the period 2002–2018. To ensure consistency in the validation process, all validation data were resampled to a uniform spatial resolution of 1 km. While the MDI was calculated using data from 2000 to 2024, the validation datasets provide a robust means of assessing model performance during this period.

2.3. Methodology for Constructing the Comprehensive Drought IndexOther

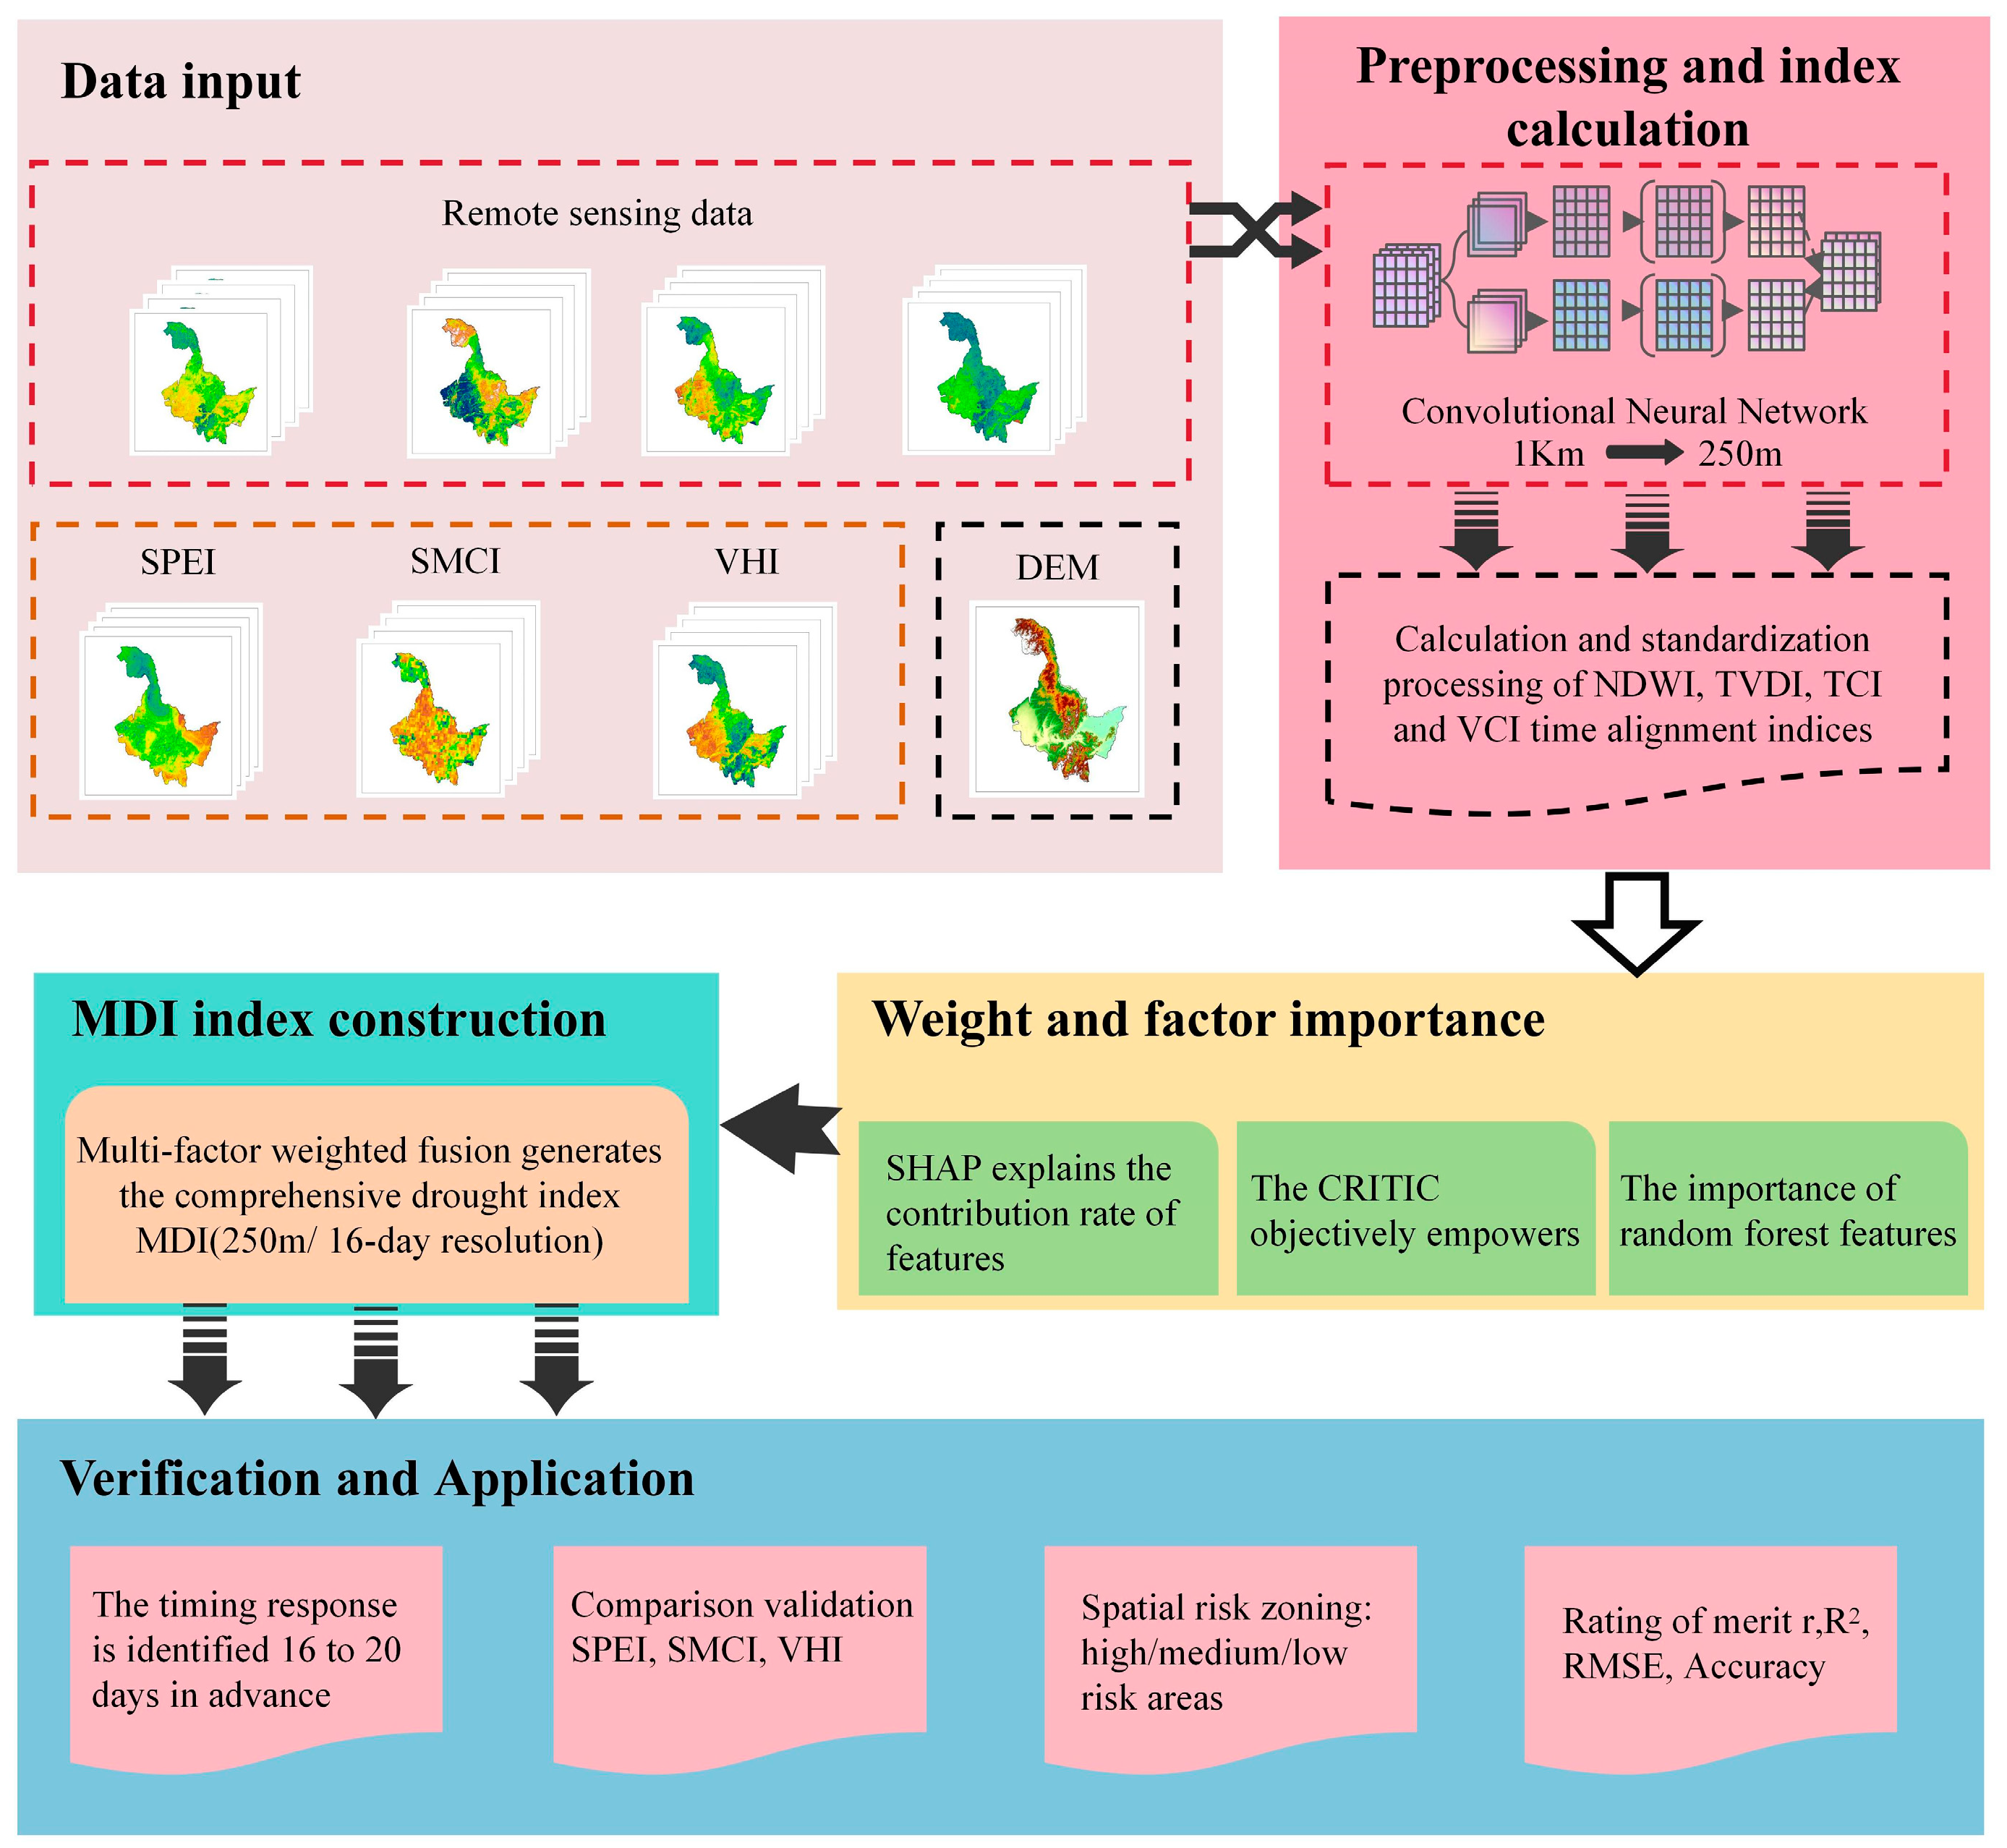
To achieve refined monitoring of maize drought processes at the regional scale, this study developed a multi-source integrated drought index (MDI). The construction process involves four core components: input configuration, index calculation and standardization, weight determination, and integrated output. The methodological framework is illustrated in Figure 2.

2.3.1. Input Construction

Although TVDI is derived from the temperature–vegetation feature space defined by NDVI and LST, it was retained alongside VCI and TCI because it represents an integrated hydrothermal constraint rather than a simple arithmetic function of its components. To assess potential redundancy, we conducted pairwise correlation analysis among NDWI, TVDI, VCI, and TCI, which showed moderate intercorrelations (|r| = 0.43−0.58), indicating that each index captures distinct drought-related information. Therefore, all four indices were preserved to maintain the multidimensional characterization of hydrothermal stress.
To achieve physically consistent spatial downscaling of drought-related indices (NDWI, TVDI, VCI, and TCI), this study employed a convolutional neural network (CNN) framework to enhance spatial resolution while preserving the underlying hydrothermal relationships. The CNN architecture incorporated multi-scale convolutional and deconvolutional layers with ReLU activations and batch normalization, enabling efficient feature extraction and reconstruction of fine-scale spatial patterns at 250 m resolution. To stabilize training and improve gradient propagation, residual connections were introduced within the network structure [37,38].
The training was based on paired datasets, with MODIS indices (1 km) serving as low-resolution inputs and fused Landsat 8/Sentinel-2 surface reflectance and LST products (30 m, aggregated to 250 m) as high-resolution references. To ensure generalization, the samples were randomly divided into training (70%), validation (15%), and testing (15%) subsets. The loss function integrated a mean squared error (MSE) term with a physical-consistency regularization that penalized discrepancies between the spatial gradients of NDWI and TVDI, thereby constraining the negative hydrothermal coupling between canopy water content and surface temperature.
In addition, auxiliary covariates such as topography (DEM) and vegetation coverage (NDVI/EVI) were incorporated to capture local energy–moisture dynamics and enhance the physical realism of the model outputs. Considering that certain indices (e.g., NDVI) have an 8-day temporal resolution, while the monitoring cycle of this study was 16 days, a Maximum Value Composite (MVC) approach [39] was adopted to harmonize temporal alignment and reduce cloud contamination.
Overall, this physically guided CNN downscaling approach effectively maintained both statistical accuracy and physical interpretability, generating spatially coherent drought-related indices at 250 m resolution. These high-fidelity products provide a robust foundation for the subsequent construction of the Multivariate Drought Index (MDI).

2.3.2. Index Calculation and Normalization

To assess potential redundancy or multicollinearity among the selected indices, we performed pairwise correlation analysis. The results indicate that while there are moderate correlations between TVDI and TCI (r ≈ 0.58), each index represents a unique aspect of drought stress. TVDI integrates the effect of both temperature and vegetation, whereas VCI and TCI focus on vegetation status and temperature extremes, respectively. Therefore, all three indices were retained to ensure that the model captures multiple facets of drought dynamics, which is especially important for complex drought conditions in Northeast China.
Based on the prepared input datasets, a suite of representative remote sensing indices was derived to characterize the spatiotemporal dynamics of agricultural drought. The selected indices—NDWI, TVDI, VCI, and TCI—respectively describe the canopy water content, soil moisture stress, vegetation vigor, and thermal condition of the land surface, collectively capturing the coupled hydrothermal–vegetation responses during drought evolution [18,36,40]. Each index was computed following established formulations reported in the literature and subsequently normalized at the pixel level to a dimensionless range of 0–1. This normalization ensured the comparability and integrability of multiple indicators by eliminating differences in physical units and scaling effects, thereby providing a consistent foundation for multi-source drought information fusion and subsequent index synthesis.
To account for topographic effects on surface temperature, soil moisture, and vegetation water status, the Digital Elevation Model (DEM) was incorporated as an auxiliary variable in the MDI framework. DEM values were first normalized to a [0, 1] scale and then integrated into the composite index through a terrain adjustment coefficient T i , which modifies the drought intensity according to elevation-related hydrothermal conditions. The final MDI for each pixel i is expressed as:
M D I i = k = 1 n w k X i k × 1 + α T i
where X i k represents the normalized drought-related indices (NDWI, TVDI, VCI, and TCI), w k denotes their CRITIC-based weights, and α is a scaling parameter (set to 0.2 in this study) that adjusts the relative influence of terrain on drought intensity. This formulation ensures that areas at higher elevations, which typically exhibit lower temperatures and slower vegetation stress responses, are not overestimated in drought severity, thereby improving the spatial coherence of the MDI under complex topographic conditions.

2.3.3. Weight Determination

Since individual drought indices often exhibit limitations in responsiveness, an objective weighting scheme was applied to more accurately represent the relative importance of each factor. Specifically, the CRITIC (Criteria Importance Through Intercriteria Correlation) method was employed to quantify indicator weights by jointly considering both the information content of each variable and the degree of conflict among indicators, thereby minimizing subjective bias and enhancing the objectivity of weight assignment [37].
Building upon this, Random Forest (RF) modeling combined with Shapley Additive Explanations (SHAP) was incorporated to conduct a comprehensive sensitivity analysis, elucidating the relative importance and interaction effects of different indices under varying drought conditions. This machine learning–based interpretability analysis also provided a reference for the robustness calibration of the CRITIC-derived weights [41].
By integrating statistical weighting with model-based interpretability, this hybrid framework offers a novel and rigorous approach to weighting optimization in agricultural drought monitoring, effectively improving both the rationality and stability of the resulting weight configuration.

2.3.4. Integrated Output

After determining the weighting coefficients, the multi-source drought-related indices were integrated through weighted aggregation to construct the Multivariate Drought Index (MDI). The fusion process followed the principle of weight conservation, ensuring that the contribution of each component index was proportionally maintained. To address missing pixels and preserve spatial continuity, a valid-information-based normalization adjustment was applied to the composite results. The final MDI product was generated at a 16-day temporal resolution and 250 m spatial resolution, enabling the seamless spatial integration of multidimensional drought information. This methodological framework not only ensured the consistency and temporal comparability of the input datasets but also established a unified and physically consistent indicator system for refined drought monitoring at the regional scale.

2.4. Validation Metrics

To systematically evaluate the performance of MDI and individual remote sensing indices across multiple spatiotemporal scales, this study employed four evaluation metrics: Pearson’s r, R2, root mean square error (RMSE), and classification accuracy (Accuracy). These metrics have been widely applied in studies of climate change and remote sensing accuracy assessment, and are recognized as essential tools for testing model performance and the reliability of spatial classification [38,39,42].
Pearson’s r and R2 were used to assess the linear correlation and goodness of fit between the MDI and reference datasets. An R2 close to 1 indicates strong agreement between the monitored and observed drought conditions, while r reflects the strength and direction of the relationship.
RMSE was employed to evaluate the accuracy of the MDI in monitoring observed drought conditions or yield anomalies. A lower RMSE value signifies better performance in matching observed data.
Accuracy was used to assess how well the MDI classified drought and non-drought areas. This was measured by comparing the monitored drought areas with observed drought conditions. Higher accuracy values indicate better classification performance.
In addition to remote sensing indices, we validated the MDI using maize yield anomalies to assess its real-world applicability. The correlation between MDI and yield anomalies was used to evaluate its relevance in agricultural drought monitoring.

3. Results

3.1. Performance Evaluation of Single Remote Sensing Drought Indices

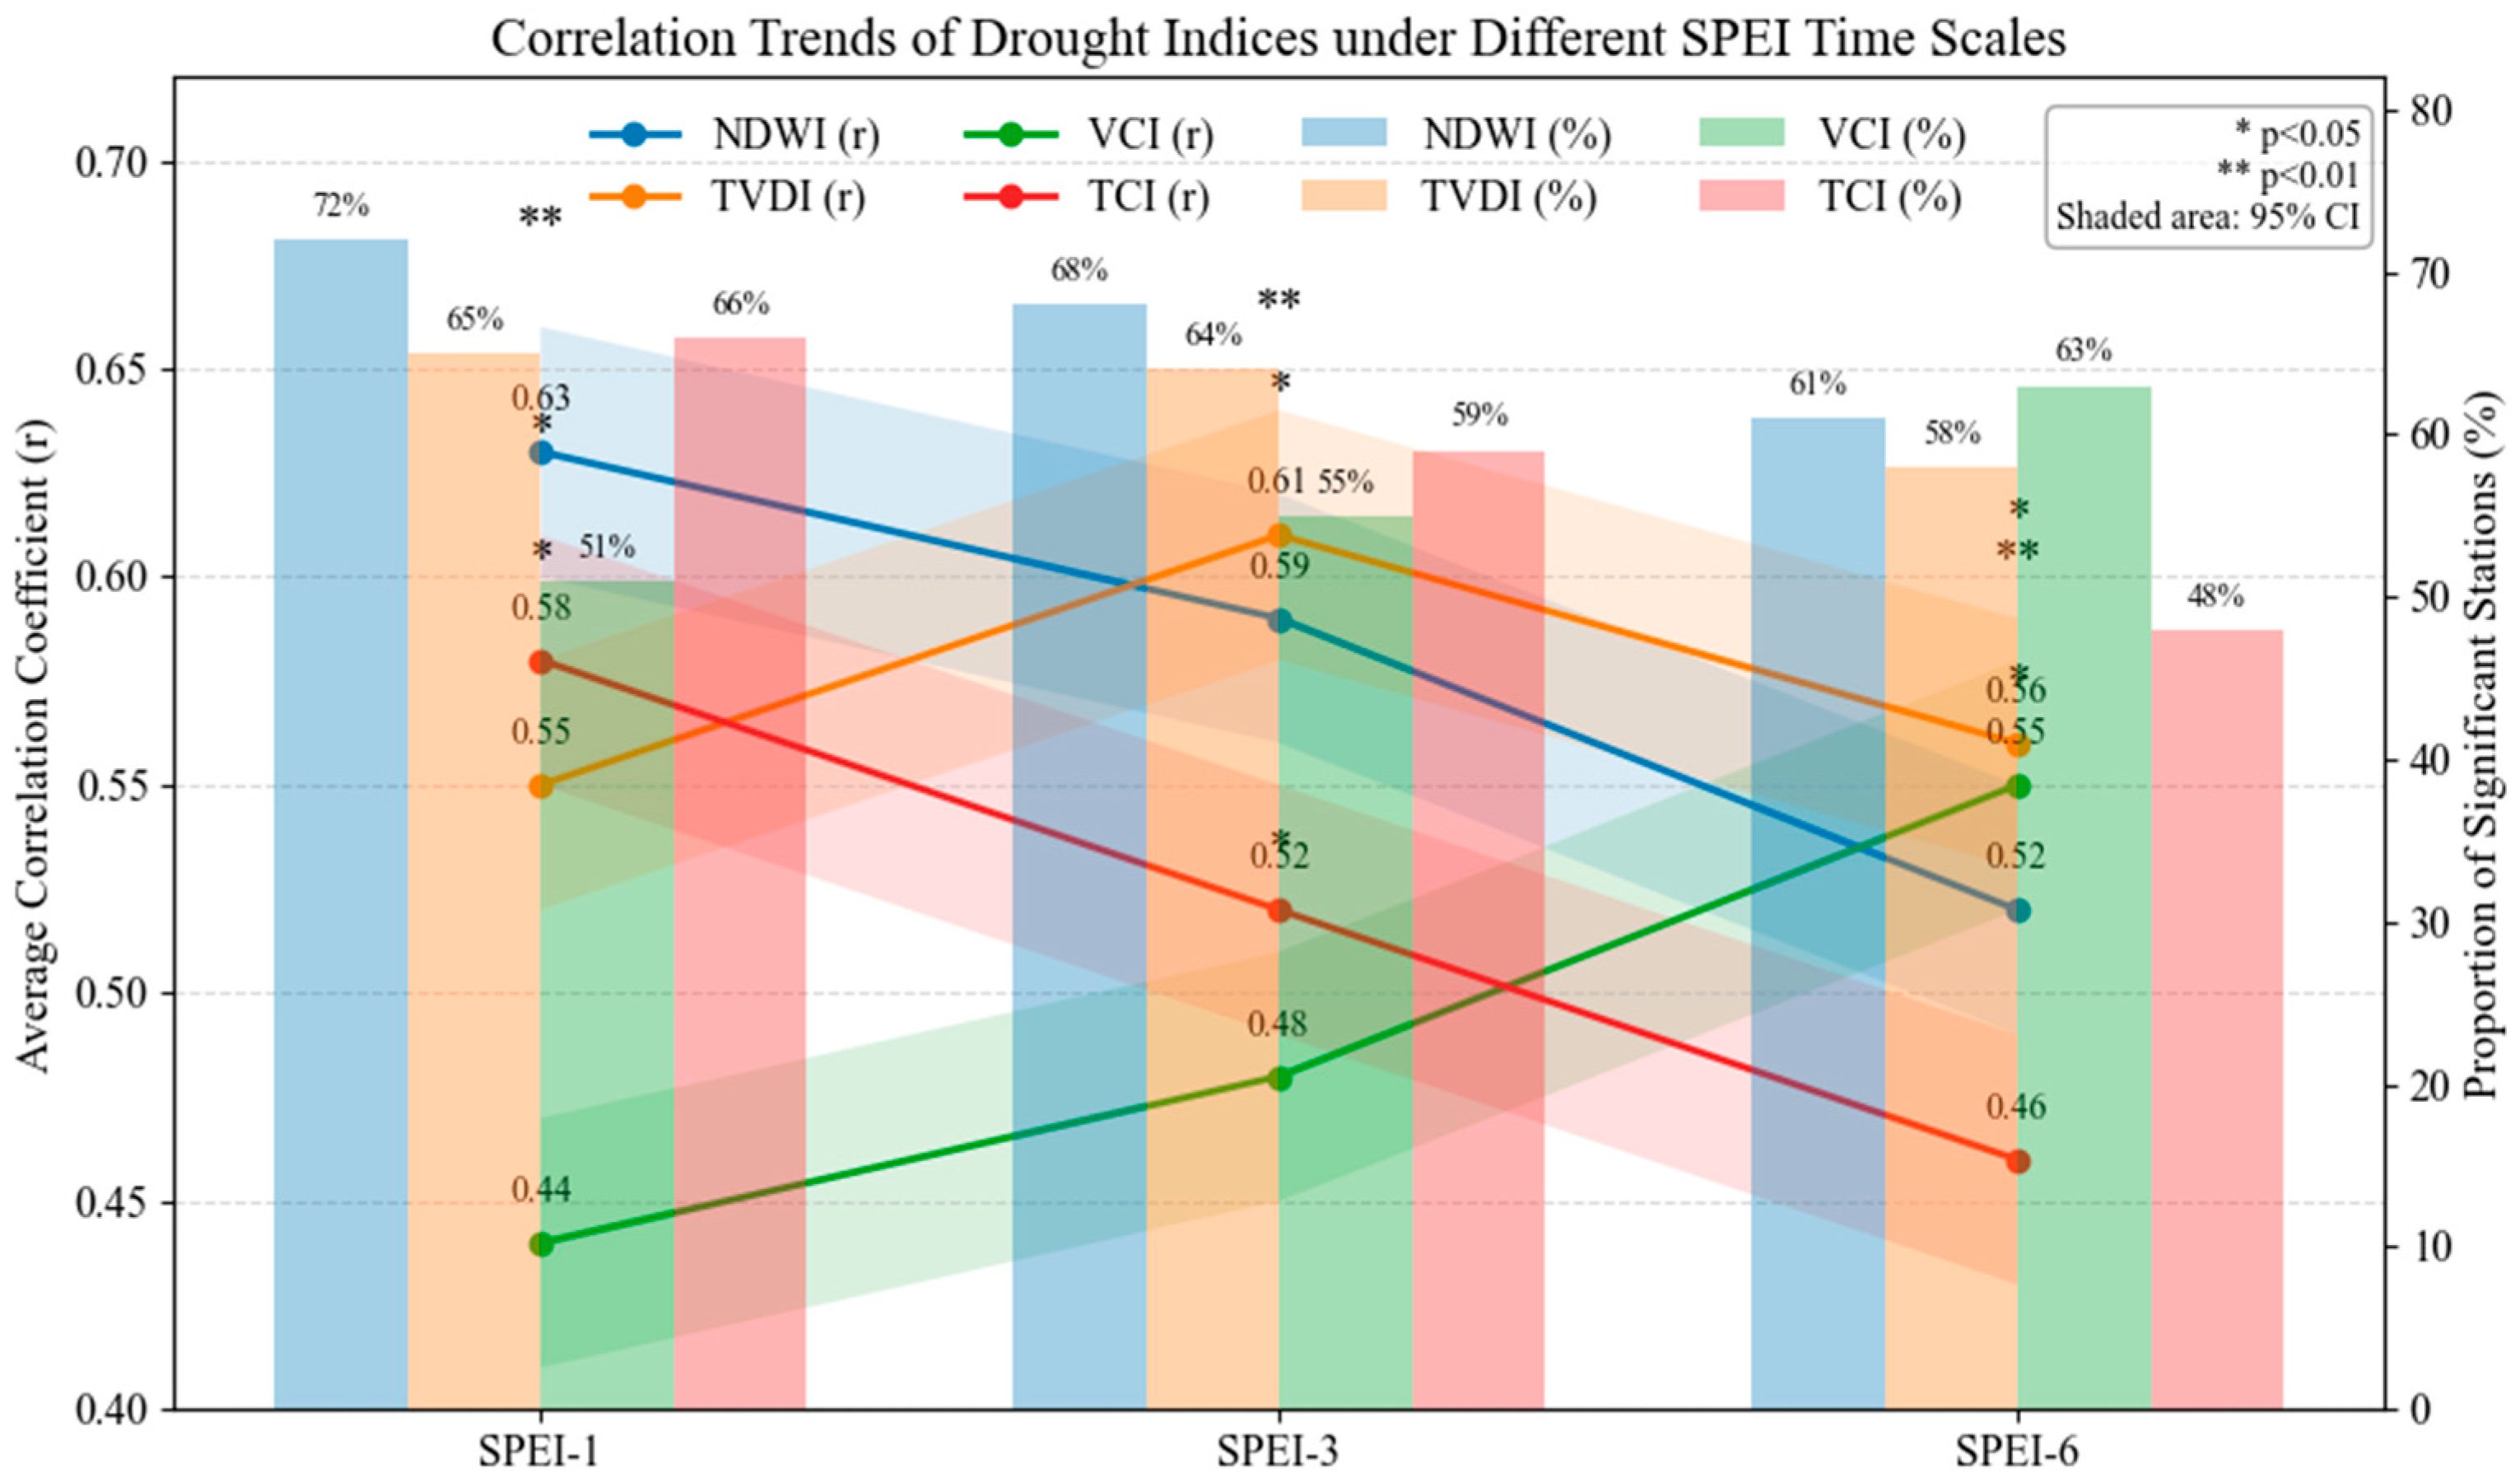
NDWI, TVDI, VCI, and TCI were calculated and validated annually during the maize growing season (May–September) from 2000 to 2024. For each index, values were extracted from pixels corresponding to 34 meteorological stations within the study area, and correlation analyses were conducted against SPEI at 1-, 3-, and 6-month time scales on both station-level and interannual bases. The results revealed significant differences in the responses of individual indices across time scales. NDWI exhibited the highest mean correlation under SPEI-1 (r = 0.63), with more than 72% of stations showing consistent short-term responses. TVDI performed best at SPEI-3 (r = 0.61), where over 60% of stations demonstrated significant correlations (p < 0.05), reflecting its sensitivity to medium-term soil moisture variability. VCI showed stronger correlations at SPEI-1 and SPEI-6 (r = 0.44 and 0.55, respectively), indicating an enhanced response with temporal accumulation across most stations. TCI displayed relatively high short-term correlations (r = 0.58), with particularly pronounced effects during years of extreme heat. Figure 3 illustrates the correlation trends of the different indices across time scales.

3.2. Weight Allocation and Validation of Feature Importance

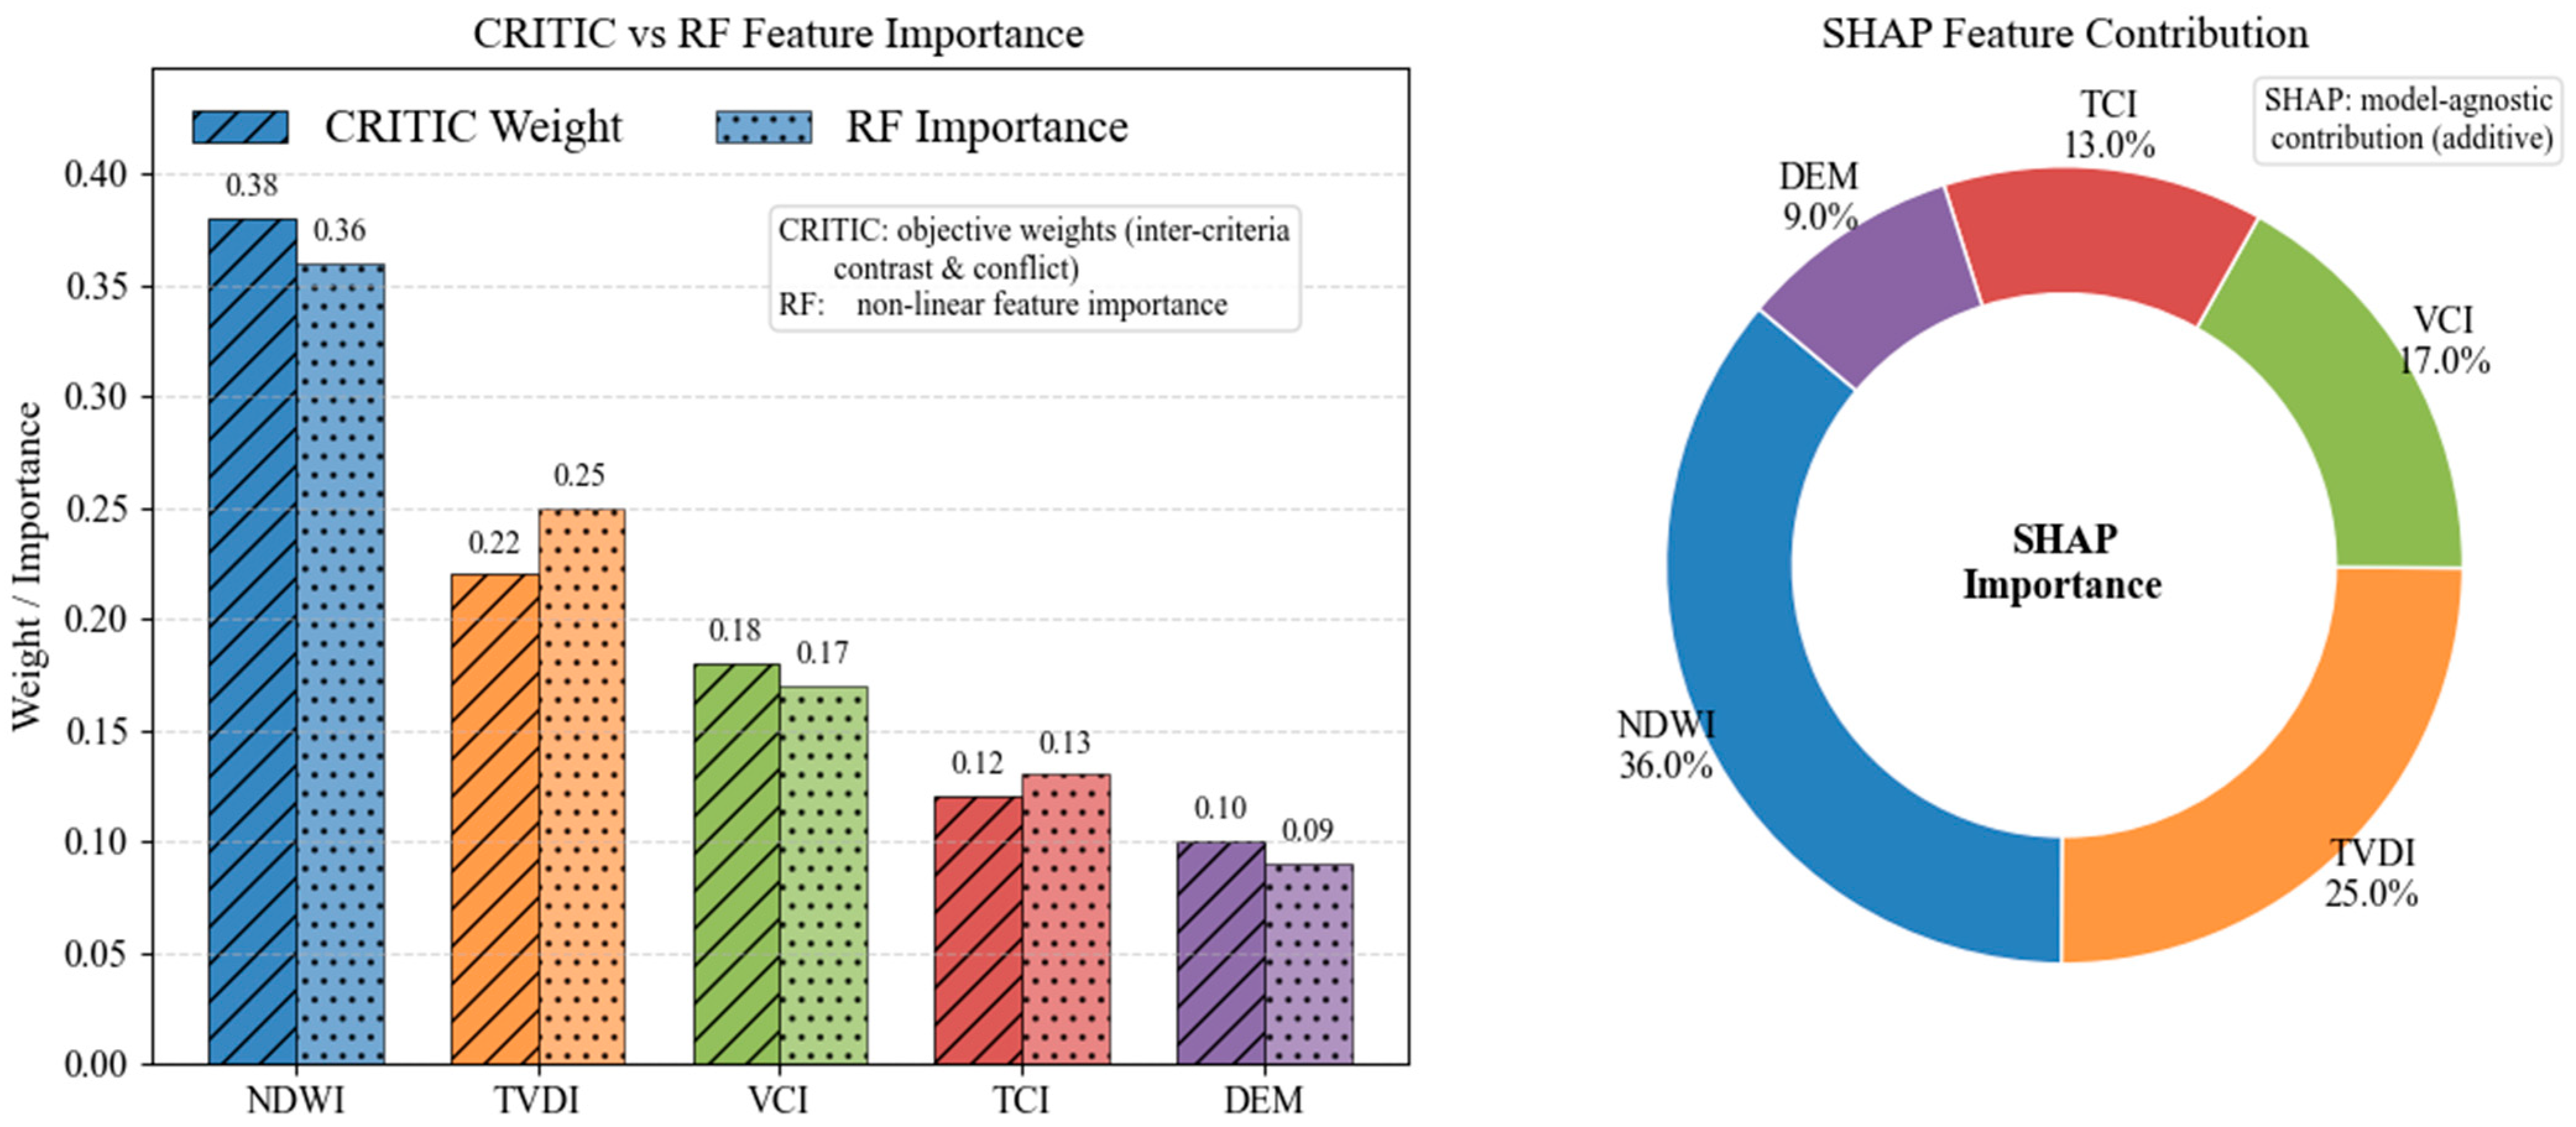
Based on standardized multi-factor time series data, the CRITIC method was applied to calculate the objective weight of each factor. The results showed that NDWI (0.38) was significantly higher than the other factors, approximately 2.8 times greater than DEM (0.10), which had the lowest weight. TVDI ranked second (0.22), followed by VCI (0.18) and TCI (0.12). In the nonlinear importance validation, feature importance derived from Random Forest was generally consistent with the CRITIC ranking. NDWI (0.36) and TVDI (0.25) remained the top two contributors, approximately 3.9 and 2.8 times higher than DEM (0.09), respectively, and together accounted for more than half of the model’s explanatory power. VCI (0.17) and TCI (0.13) exhibited comparable contributions across both methods, whereas DEM, despite its localized importance in complex terrain areas, remained the lowest overall.
Further SHAP analysis indicated that NDWI and TVDI contributed 36.0% and 25.7%, respectively, fully consistent with the rankings from CRITIC and Random Forest. VCI and TCI contributed 17.0% and 13.1%, respectively, while DEM accounted for 9.1%. The three methods—CRITIC, Random Forest, and SHAP—were consistent in identifying the dominant high-contribution factors, with differences mainly reflected in the relative ranking of medium-contribution factors, where VCI and TCI were slightly higher in CRITIC compared to their proportions in RF and SHAP. Spatially, high-weight factors demonstrated stable performance across most stations: NDWI maintained strong explanatory power in high-, medium-, and low-risk zones, while the importance of TVDI was particularly pronounced in high-risk areas. Notably, NDWI directly reflects canopy water status and is highly sensitive to short- to medium-term drought processes, whereas TVDI characterizes the coupled effects of thermal and moisture stress, effectively capturing the combined impact of soil moisture deficit and heat stress. This physically grounded rationale explains their consistently dominant contributions across methods.
Figure 4 provides a comprehensive visualization of these results: the bar chart on the left compares CRITIC weights and Random Forest feature importance, while the annular chart on the right presents the SHAP-derived feature contribution proportions, clearly revealing the dominant role of NDWI and TVDI in the construction of MDI.

3.3. Comparative Performance and Responsiveness of MDI

Using a site-level cross-validation approach, 34 meteorological stations within the study area were selected. Time series data of 16-day intervals at 250 m spatial resolution during the maize growing seasons from 2000 to 2024 were employed. Four evaluation metrics—Pearson’s r, R2, RMSE, and classification accuracy—were used to systematically compare the performance of MDI with other drought indices downscaled to the same spatiotemporal resolution (NDWI, TVDI, VCI, TCI, and VHI) (Table 3). To avoid scale bias introduced by differences in spatiotemporal resolution, SPEI and SMCI were excluded from the quantitative comparisons in Table 3 but retained as references in the temporal response analysis. Results showed that MDI outperformed all other indices across evaluation metrics: the mean correlation coefficient reached 0.87, which was 0.04–0.11 higher than the best single index; R2 was also 0.87, an improvement of 0.09 over the next best index; RMSE decreased to 0.08; and classification accuracy reached 87.4%, significantly exceeding both traditional and single indices.
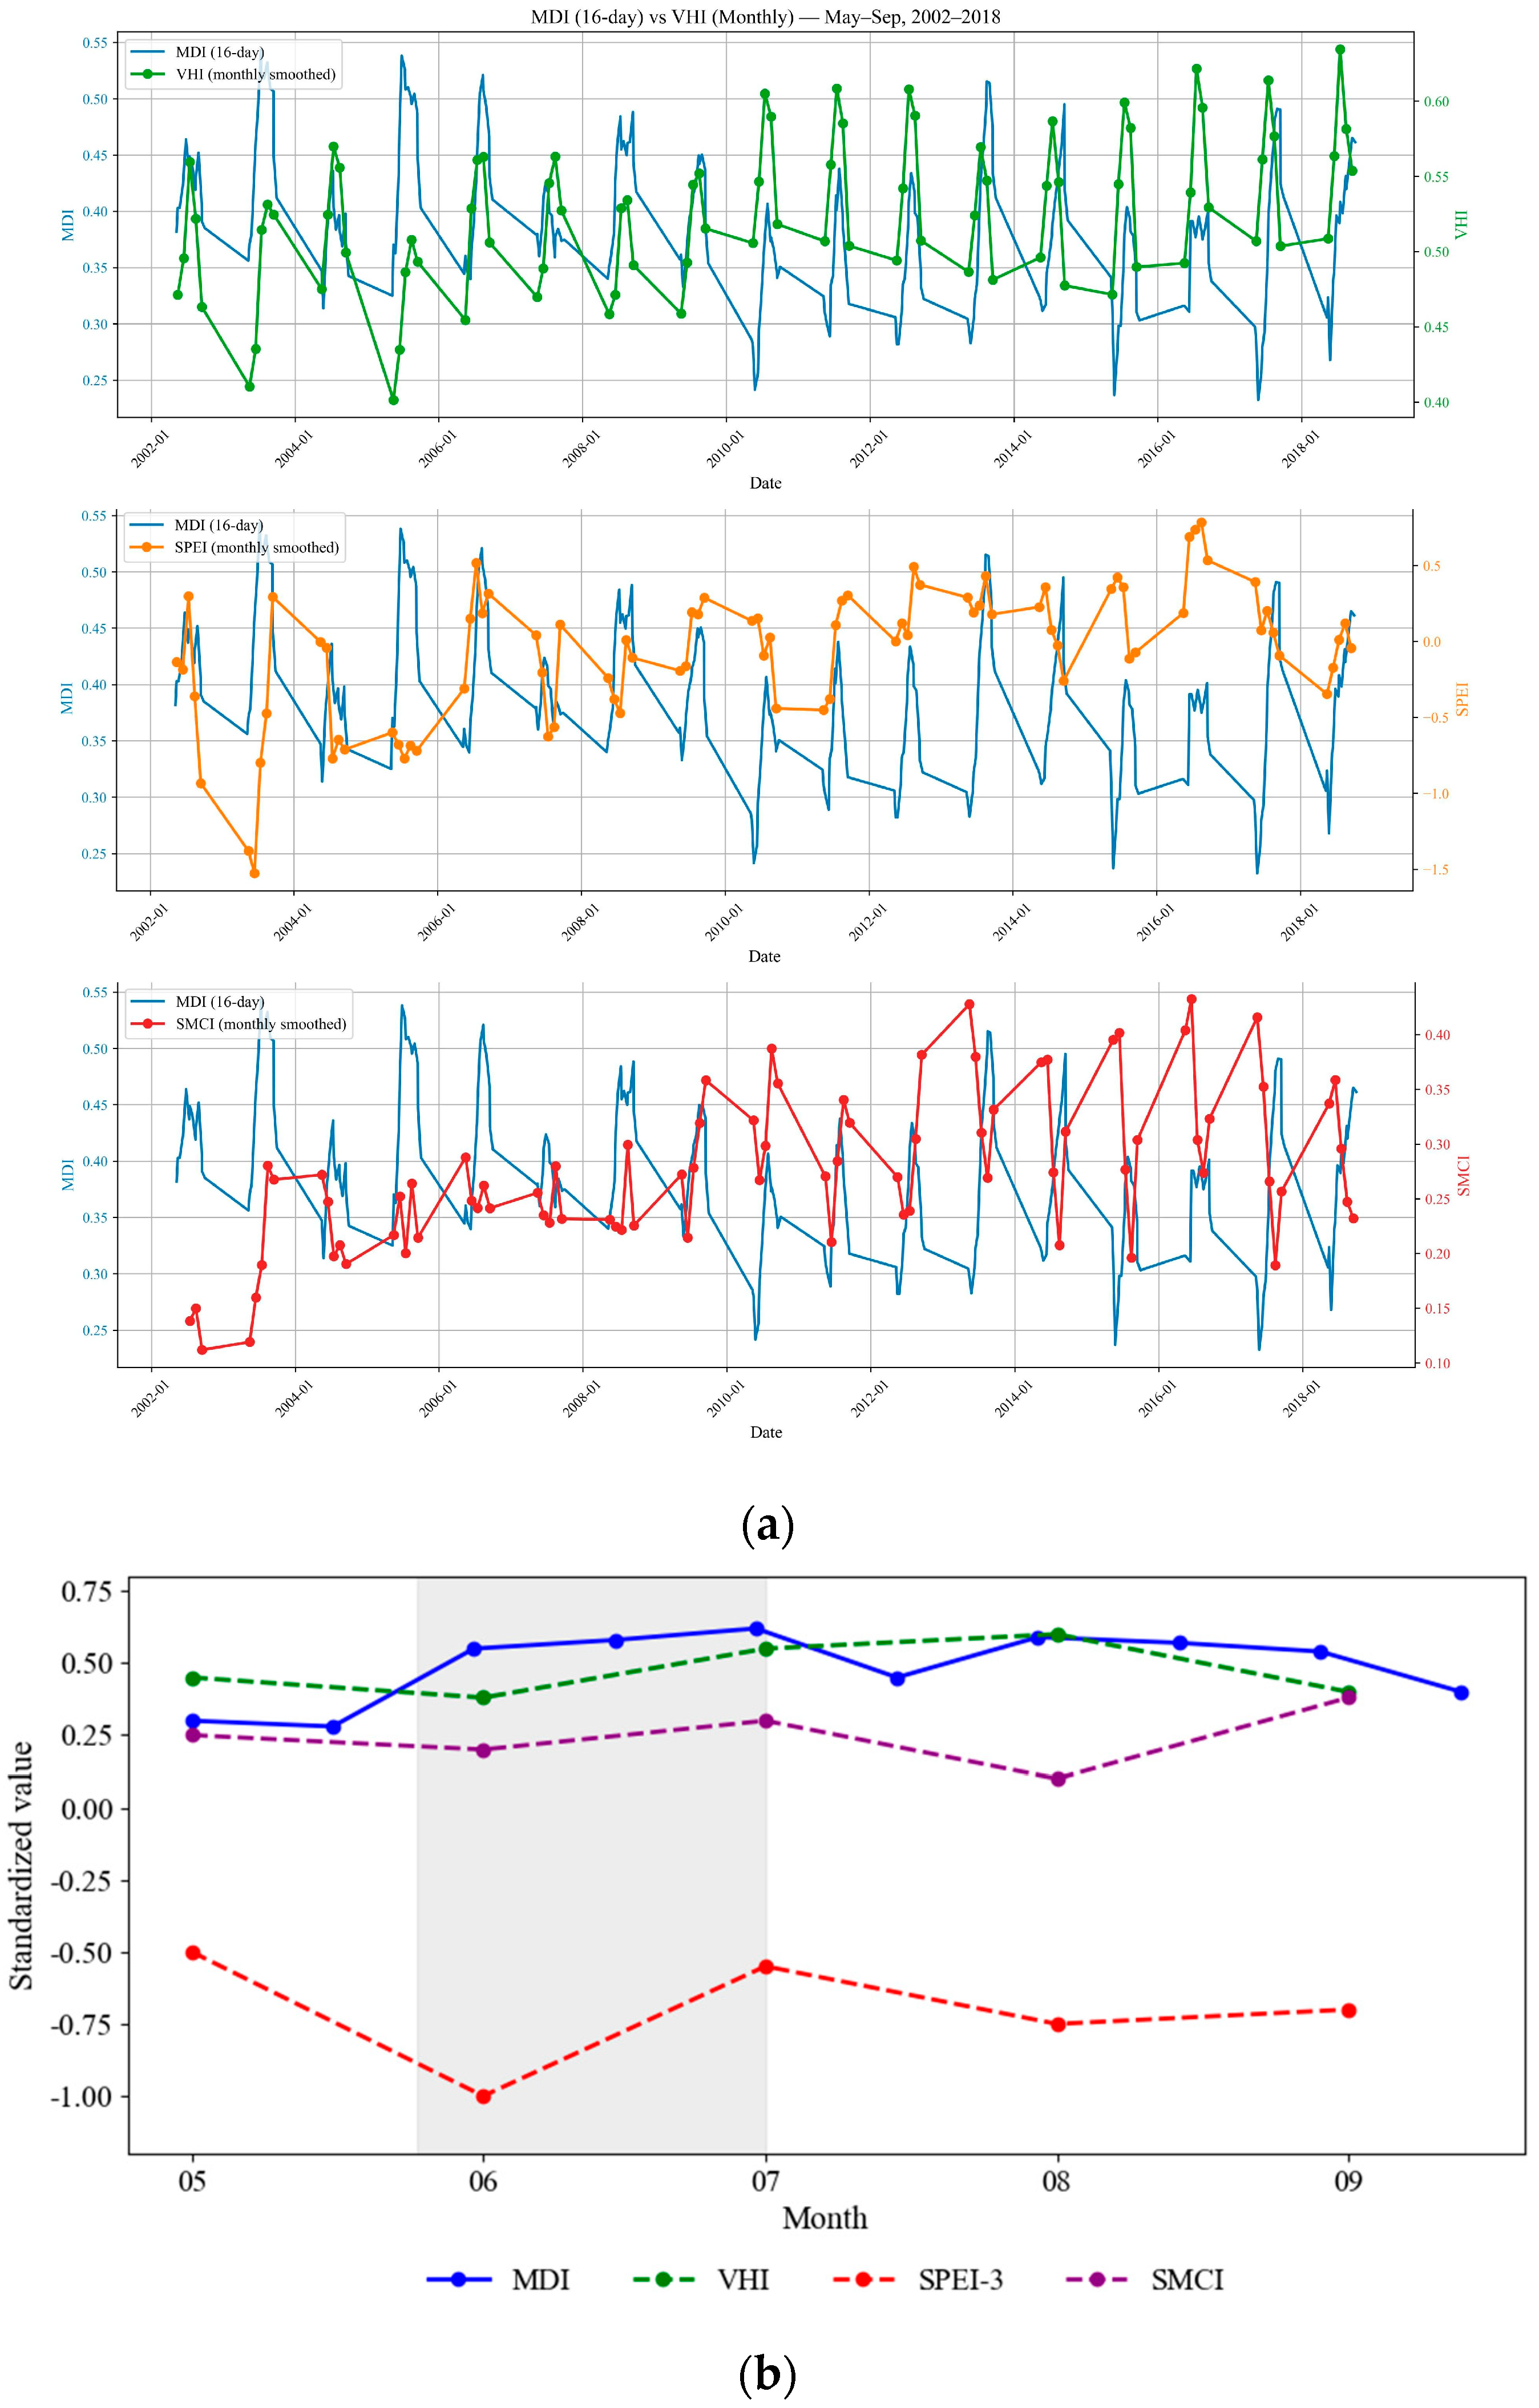
Multi-year comparisons of time series curves for MDI, VHI, SPEI-3, and SMCI (Figure 5a) revealed that MDI exhibited earlier response characteristics during drought onset and evolution, with curve inflection points appearing earlier and with greater amplitude variation. For the spring drought event in 2007 (event information from the Heilongjiang Meteorological Disaster Bulletin), single-event analysis (Figure 5b) showed that MDI began to decline markedly on 25 May, whereas declines in VHI, SPEI-3, and SMCI were delayed until after 10 June, indicating an early detection advantage of 16–20 days. During the rapid drought development phase (gray shaded area), MDI showed higher sensitivity in the rate of curve change, while in the drought relief stage, MDI also recovered earlier than the monthly-scale indices, reflecting its ability to capture the details of drought onset and recovery under high temporal resolution.
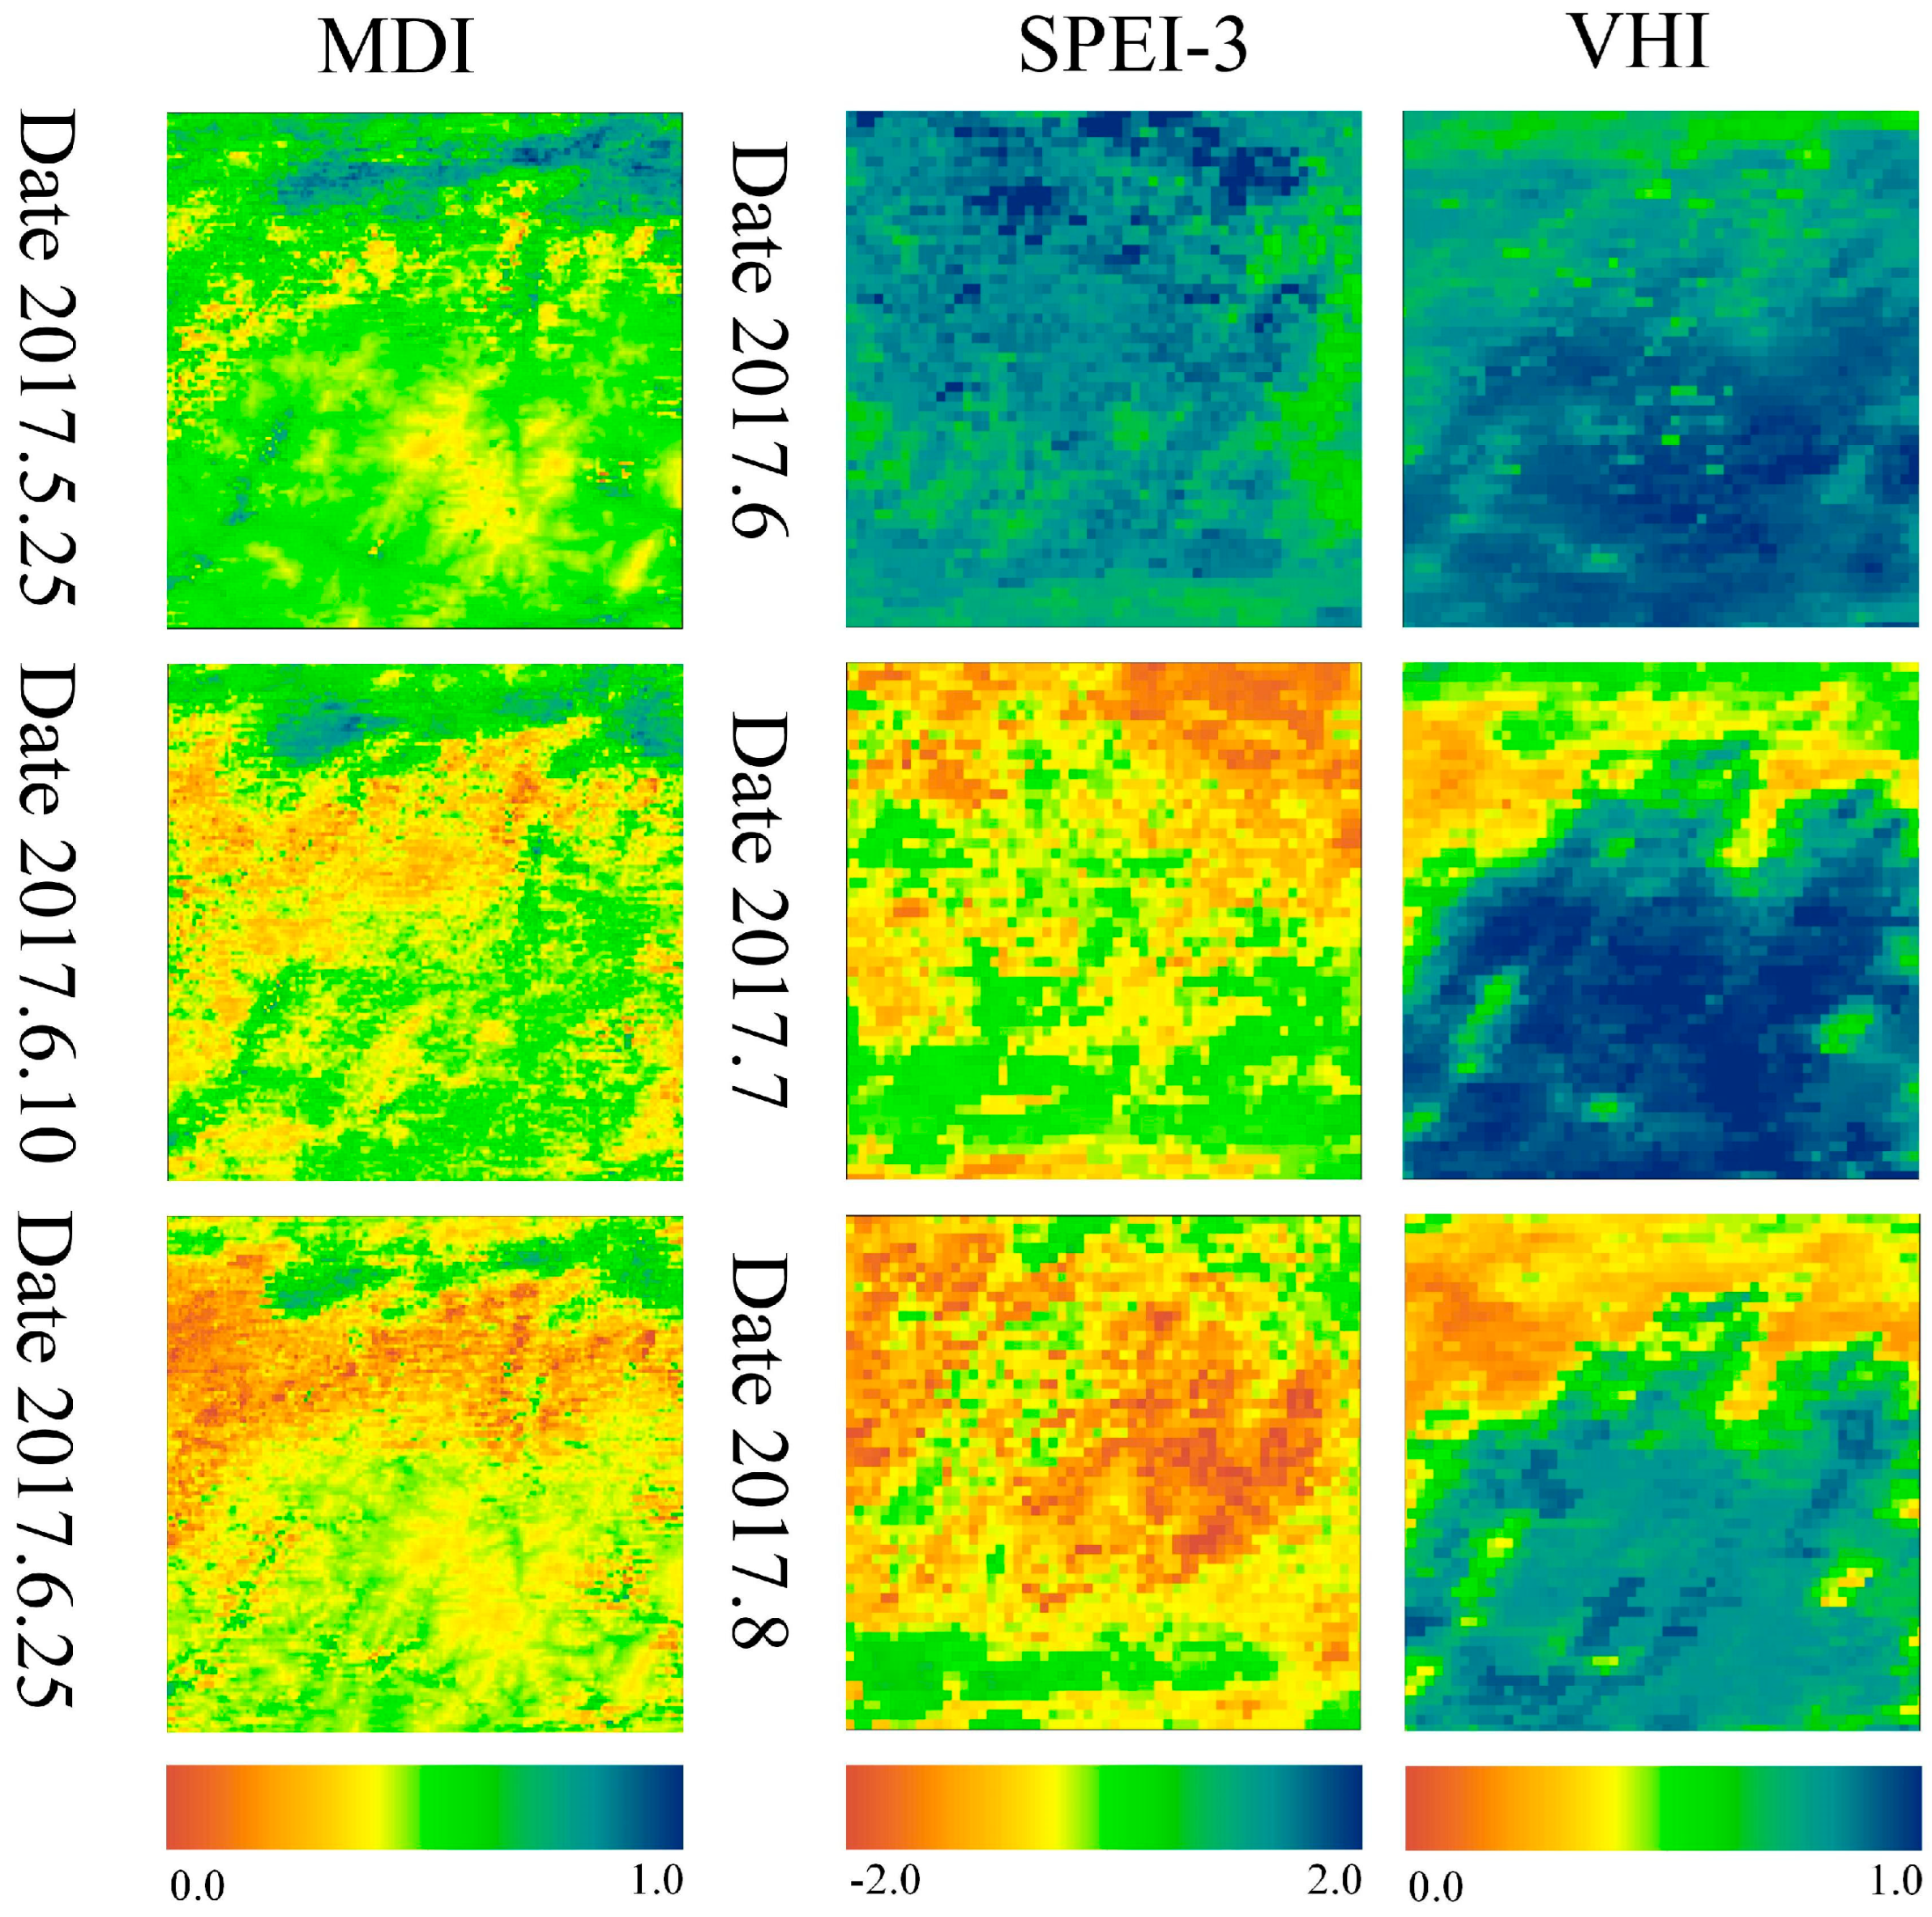
To further validate the spatial capability of MDI in characterizing localized drought features, the spring drought event of 2017 was selected as a representative case. This event, one of the most typical early-season droughts in Heilongjiang in recent years (event extent based on the Heilongjiang Meteorological Disaster Bulletin), was characterized by early onset and long duration, making it suitable for fine-scale temporal–spatial monitoring and comparison. Spatial validation was conducted using the retrieved monthly drought-affected area (Figure 6), combined with comparative analysis of multiple historical drought events. Results indicated that at the early stage of the drought (25 May), MDI was able to identify more localized drought patches smaller than 10 ha. Compared with traditional 1 km resolution indices (SPEI, VHI), MDI exhibited significant advantages in spatial granularity and in delineating patch-scale drought features. Particularly during the drought development phase (10–25 June), MDI more accurately captured the expansion pathways and morphological changes in localized drought, clearly reflecting the heterogeneous expansion patterns of drought at small and medium scales. This high-resolution identification capability remained robust across multiple historical regional drought events, further confirming the applicability and advantages of MDI in fine-scale spatial drought monitoring.

3.4. Spatial Patterns of MDI

To systematically characterize drought severity across space and time, a monthly MDI dataset was constructed for the maize growing season (May–September) from 2000 to 2024. The classification thresholds for MDI-based drought categories were determined using a hybrid approach that integrates percentile analysis with the Grades of meteorological drought (GB/T 20481–2017) [43]. First, the cumulative distribution of MDI values was examined to identify percentile breakpoints (e.g., 5%, 15%, 30%, 50%) representing natural divisions of drought severity. These statistical thresholds were then calibrated through regression-based mapping between MDI and conventional drought indices (NDWI, TVDI, and VCI) defined in the national standard, enabling the projection of standard-defined severity ranges onto the MDI scale. Accordingly, MDI was divided into five categories: extreme drought (MDI ≤ 0.10), severe drought (0.10 < MDI ≤ 0.20), moderate drought (0.20 < MDI ≤ 0.30), mild drought (0.30 < MDI ≤ 0.40), and non-drought (MDI > 0.40). Drought classification was performed at the pixel level, and the proportion of drought-affected pixels within each category relative to the total maize planting area was calculated to derive the long-term spatiotemporal distribution of drought severity.
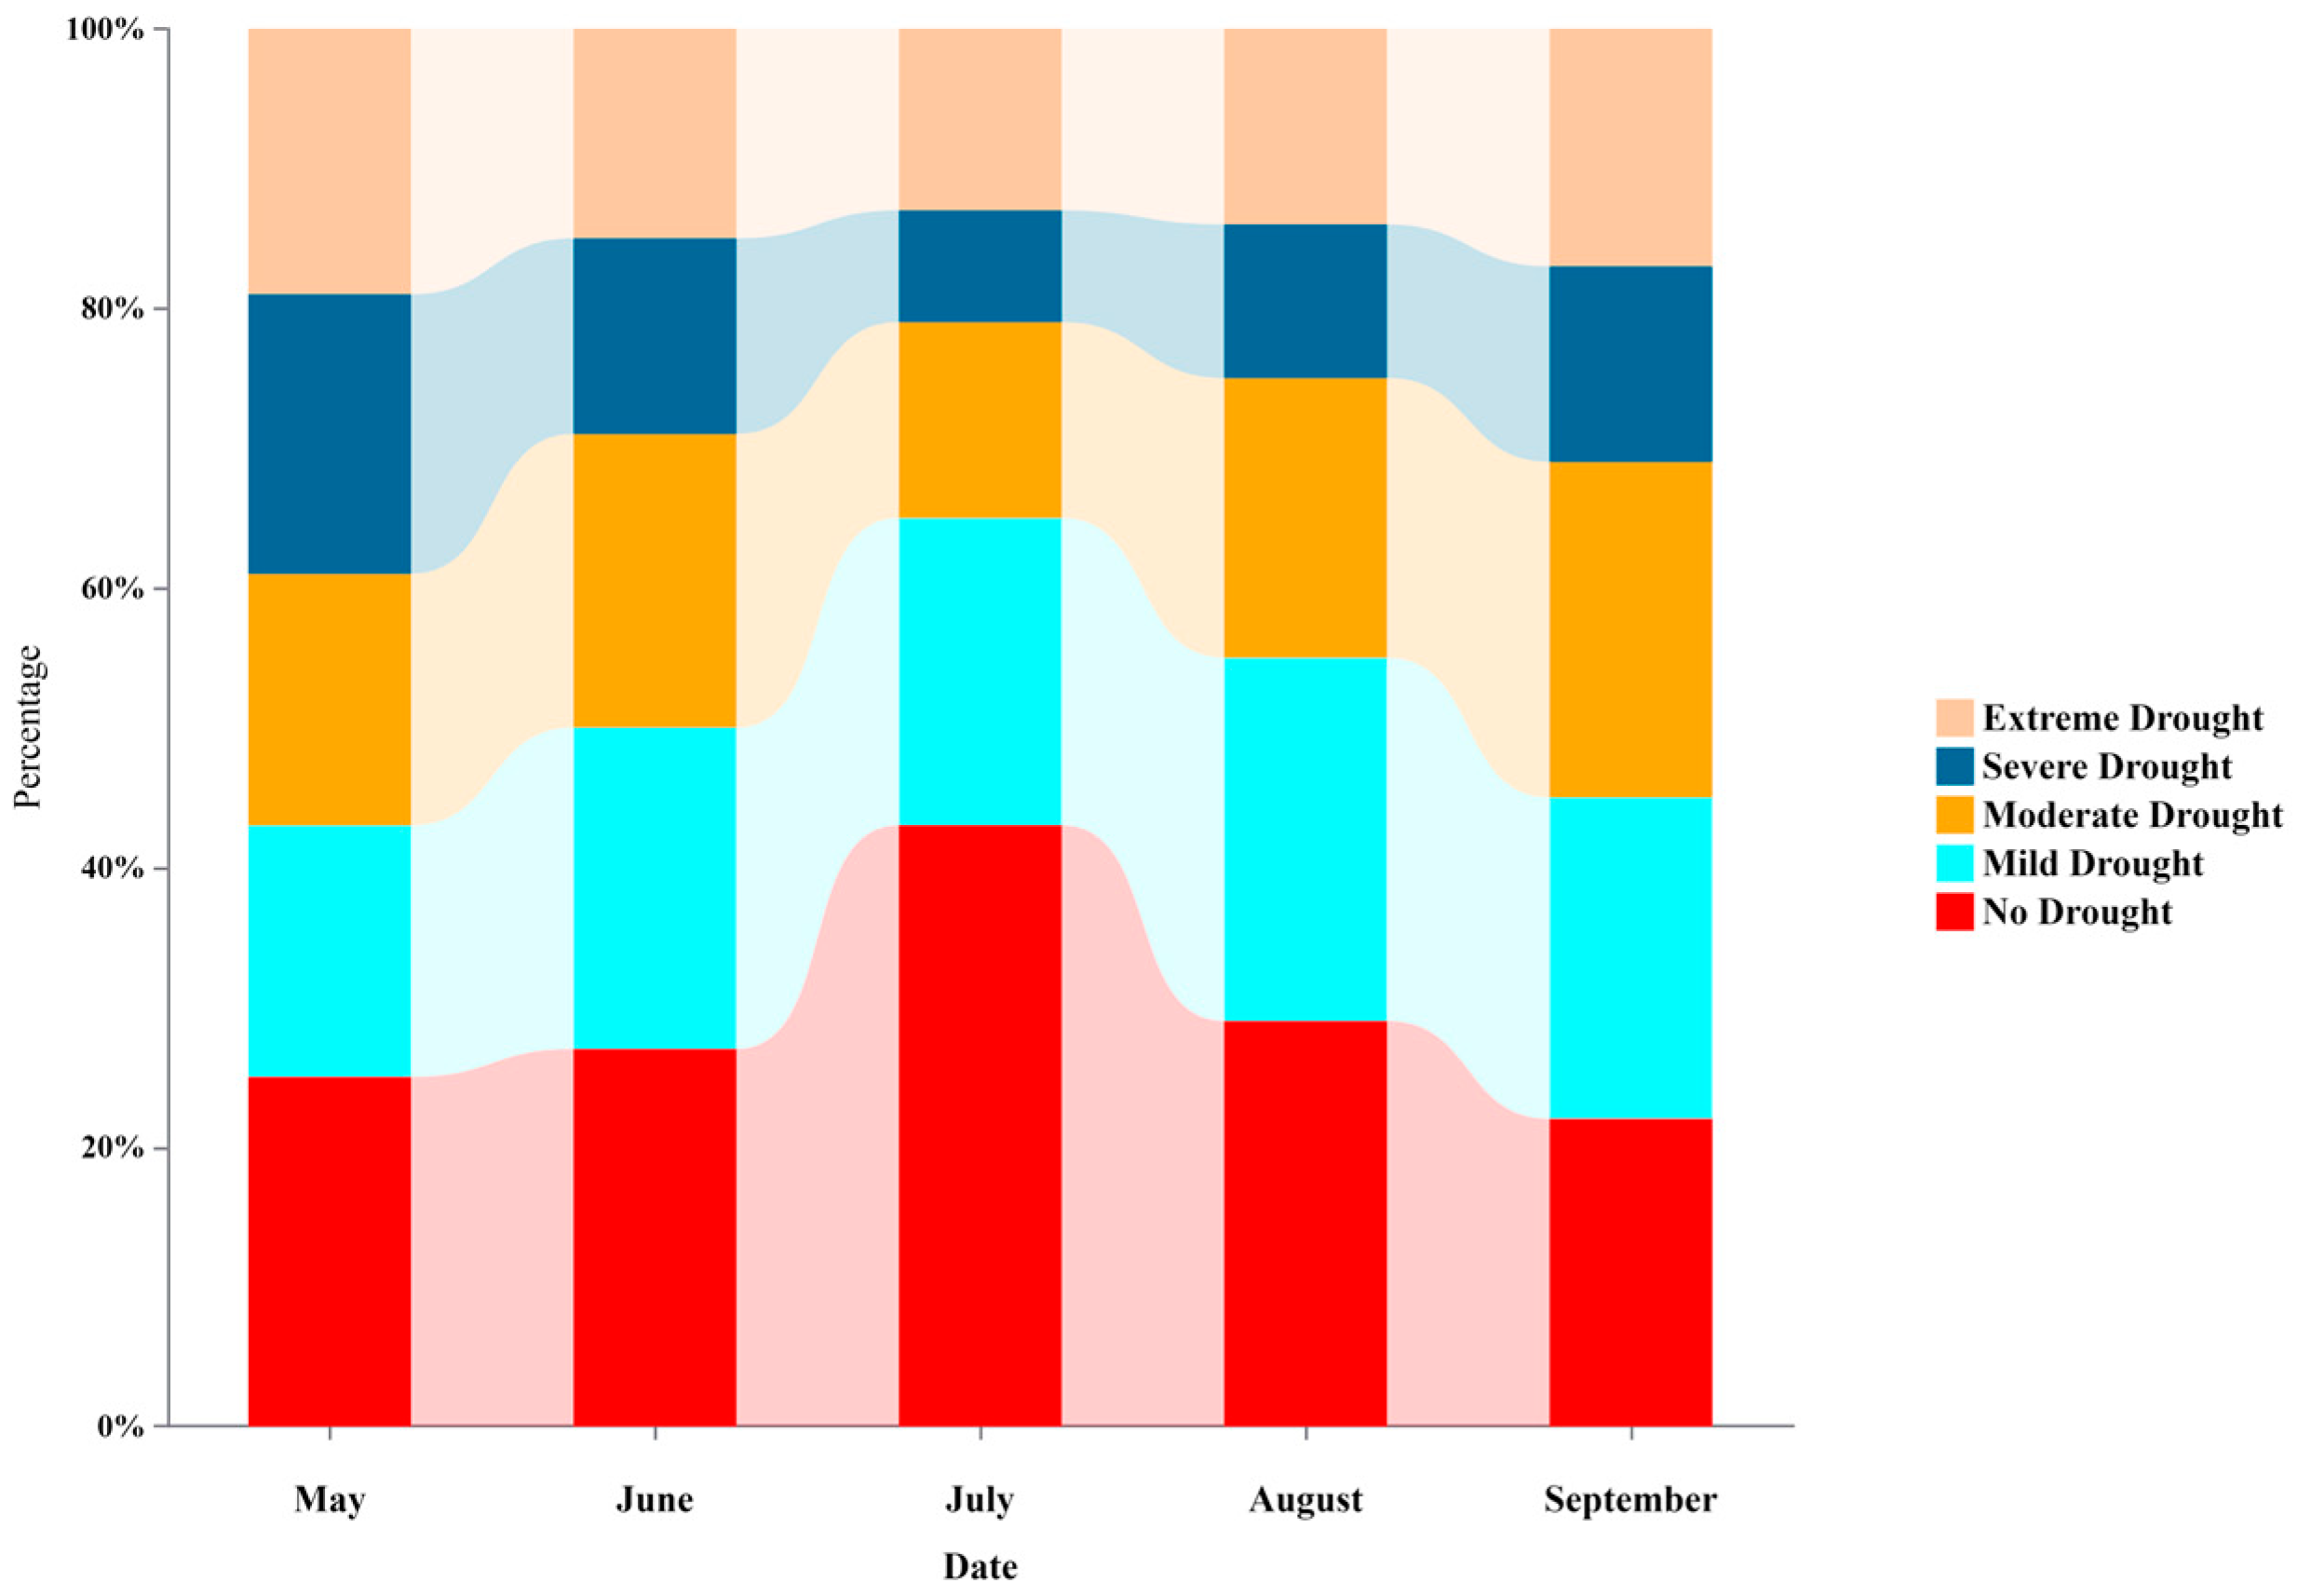
The frequency of drought events was defined as the proportion of drought-affected periods within the total observation sequence during the study period (May–September, 2000–2024). Based on the 16-day temporal resolution of the MDI, each year contained ten composite periods. For each pixel, the number of periods classified as drought (MDI ≤ 0.40) was counted and divided by the total number of periods (250 in total), yielding a drought frequency value ranging from 0 to 1. Higher frequency values indicate areas experiencing drought conditions more persistently or recurrently, and were used to delineate drought-risk zones. Figure 7 illustrates the monthly proportions of different drought categories averaged across May–September from 2000 to 2024. Statistical results indicate that mild drought was the most common category, accounting for 34.7% of the maize cultivation area, followed by moderate drought (22.5%), severe drought (12.3%), and extreme drought (7.8%). At the seasonal scale, drought categories exhibited pronounced intermonthly variations, with severe and extreme drought proportions being markedly higher in July and August compared to other months.
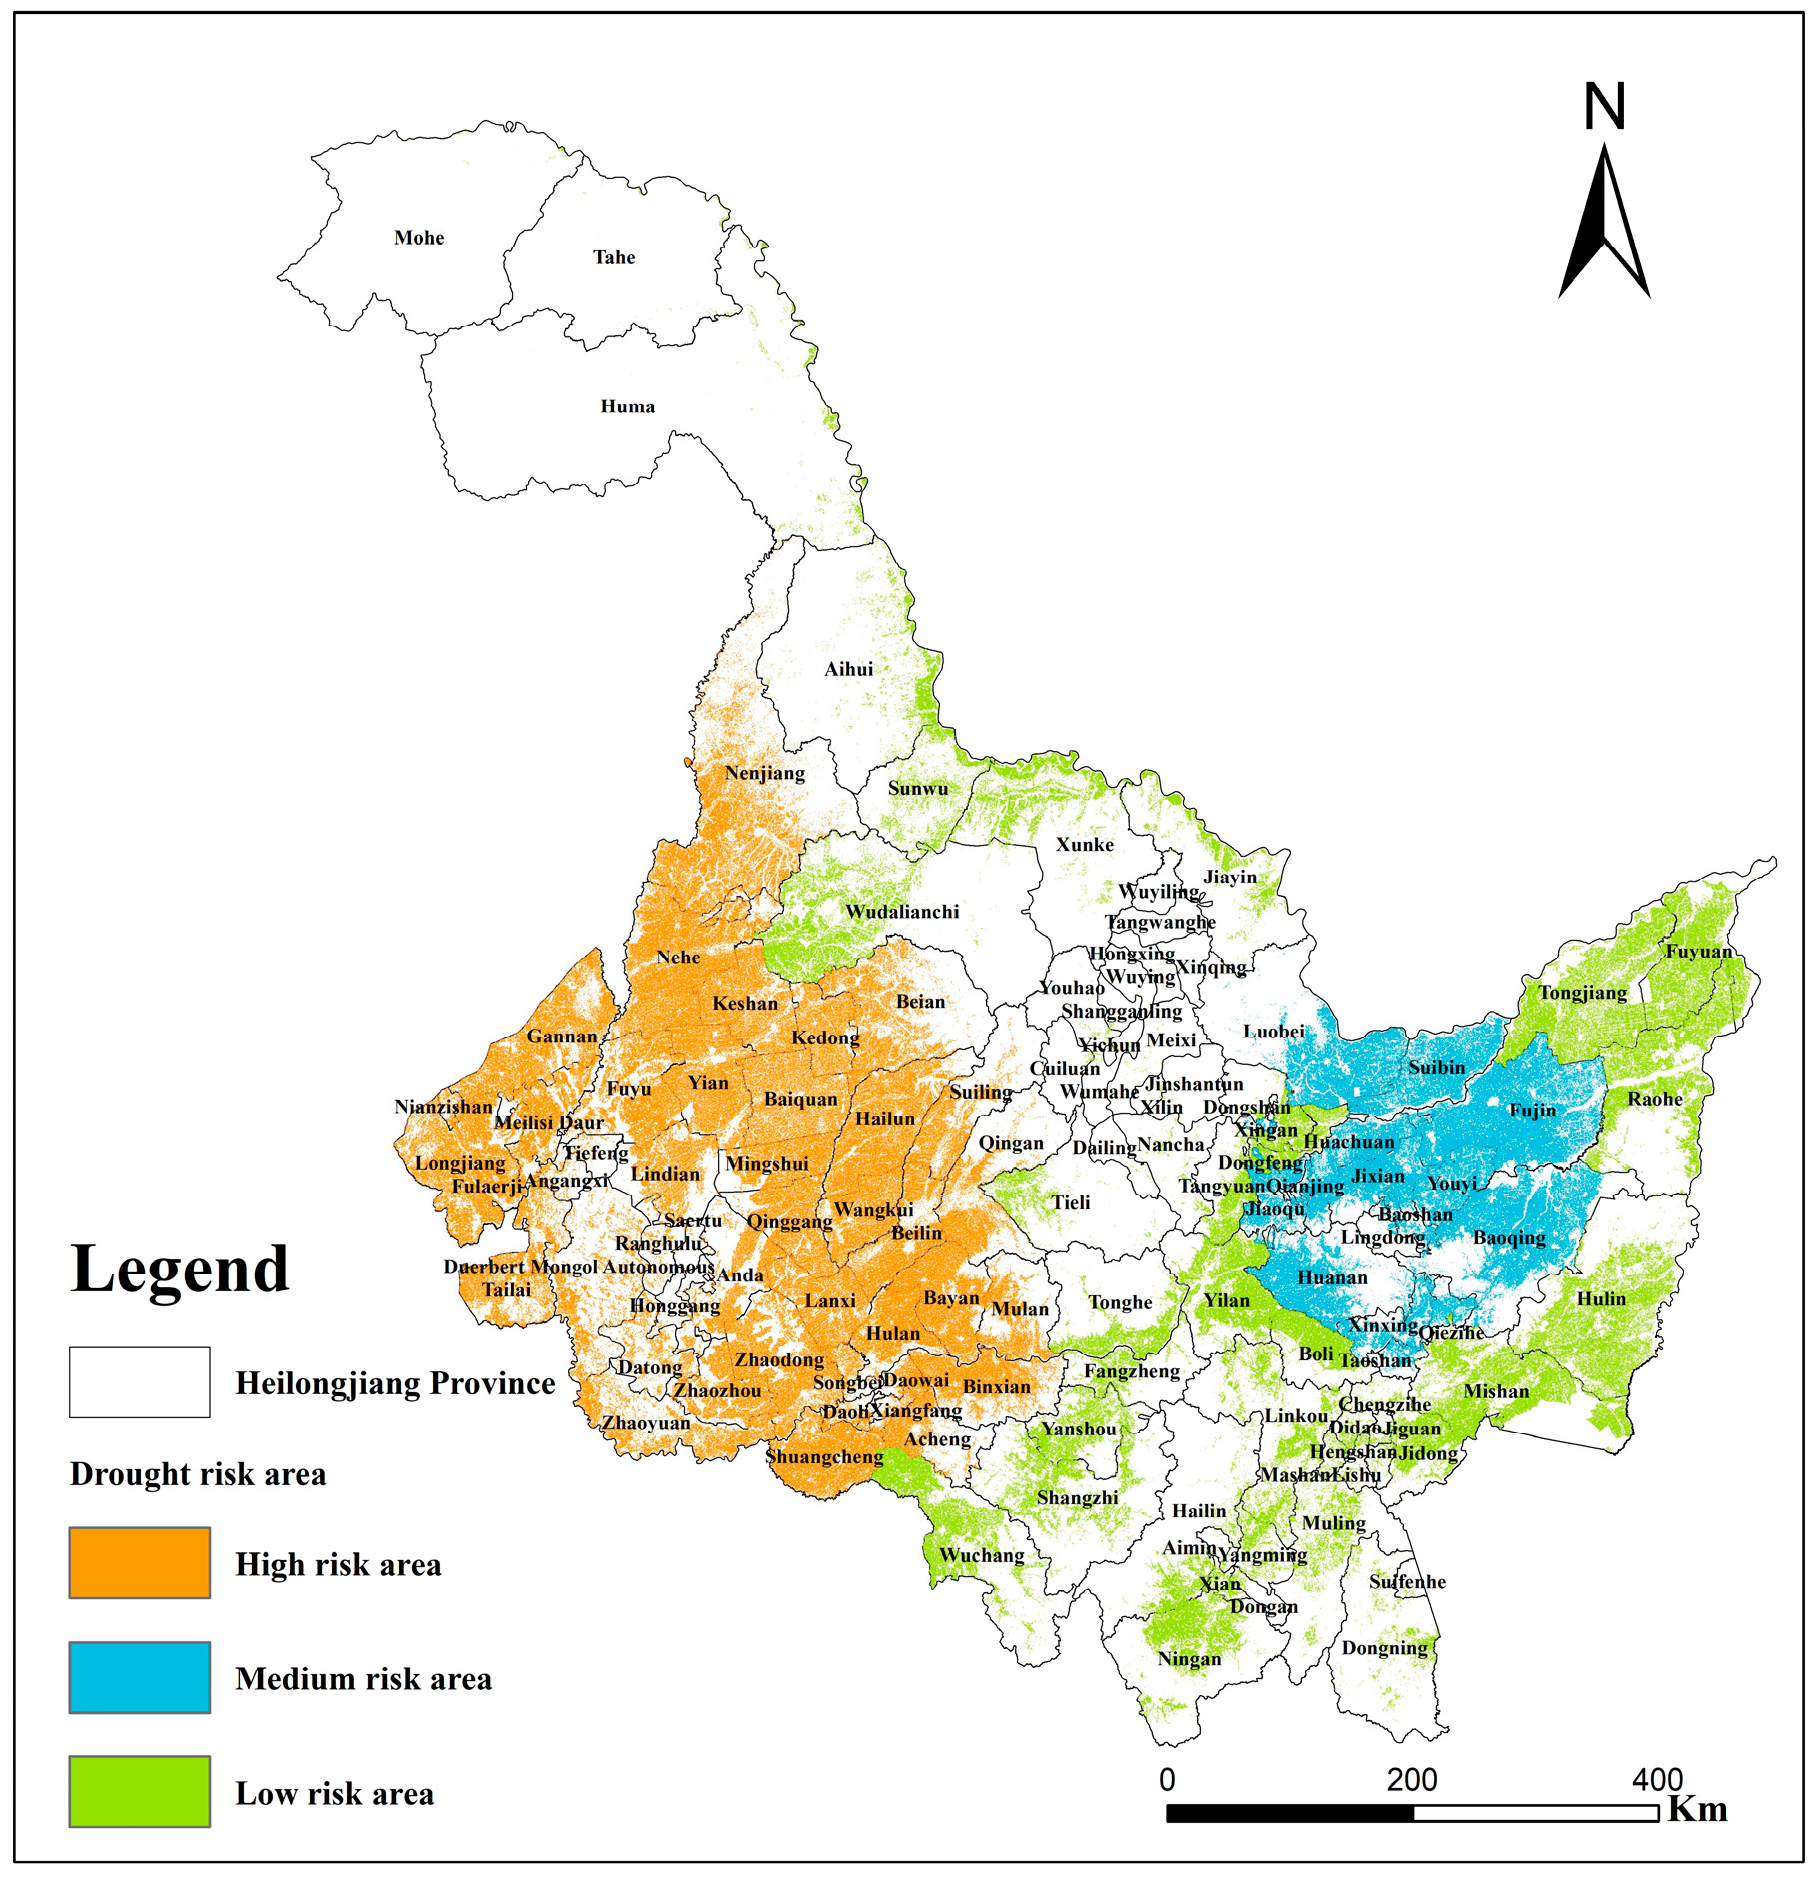
To further identify high-risk drought-prone areas, the frequency of drought events at or above the moderate level was calculated for each pixel across the 120 months from 2000 to 2024, and drought risk zones were delineated accordingly: high risk (frequency > 50%), medium risk (30–50%), and low risk (<30%). Figure 8 shows the spatial distribution of drought risk levels. Results reveal that high-risk zones accounted for 42.6% of the total maize cultivation area, primarily concentrated in the central-western region. Medium-risk zones represented 36.1%, while low-risk zones accounted for 21.3%, predominantly distributed in the eastern hills and northeastern mountainous areas.

4. Discussion

4.1. Driving Factors and Interpretation of Index Contributions

The dominant role of NDWI and TVDI across multiple weighting and feature-importance analyses is rooted in their mechanistic sensitivity to key drought processes. NDWI directly represents canopy liquid-water content, providing a rapid spectral response to transient meteorological stress and early vegetation dehydration [33,44]. TVDI, in contrast, integrates surface temperature and greenness information within the temperature–vegetation feature space, thereby capturing medium-term cumulative hydrothermal deficits [33,45]. Their complementary functions reveal that drought evolution in maize-growing regions is simultaneously governed by instantaneous canopy moisture fluctuations and the gradual accumulation of energy imbalance at the land–atmosphere interface.
This spectral–thermal complementarity explains why both indices consistently achieve higher explanatory power and spatial robustness than purely vegetation- or temperature-based indicators such as VCI and TCI. The latter tend to underrepresent soil–vegetation coupling and cannot fully reflect sub-seasonal drought transitions [46,47]. Although DEM contributed less overall (weight ≈ 0.10), it effectively constrained terrain-induced hydrothermal differences and improved spatial coherence in complex landscapes [48]. The consistency among CRITIC, Random Forest, and SHAP results confirms that the ranking of variable importance corresponds well with physical interpretability, supporting the reliability of the weighting design and providing a mechanistic foundation for the subsequent integration in MDI [44,45,49].

4.2. Advantages of the MDI

The Multivariate Drought Index (MDI) demonstrated markedly superior performance to all single indicators, underscoring the advantage of integrating diverse drought-relevant variables within a physically consistent framework. Rather than relying solely on spectral or thermal responses, the MDI captures the joint behavior of soil, vegetation, and atmospheric interactions, thereby reflecting the dynamic coupling that governs drought evolution in maize-growing systems. This multi-domain synergy allows the index to respond more promptly and continuously to hydrothermal fluctuations, yielding a more coherent and spatially detailed depiction of drought conditions across complex agricultural landscapes [14,44,50].
A crucial enhancement arises from the use of convolutional neural networks (CNNs) for physically consistent downscaling of input indices. While traditional interpolation or regression techniques often disrupt the intrinsic relationship between surface temperature and vegetation moisture, the CNN approach preserves these hydrothermal dependencies through its learned feature representations. This ensures that high-resolution patterns of water and heat stress remain physically plausible, strengthening both the reliability and interpretability of the resulting MDI fields [51,52].
In comparison with conventional indices such as VHI or SPEI, which often exhibit temporal delays and coarse spatial sensitivity, the MDI’s physically guided structure offers a more realistic reflection of early drought onset and progression. Such improvements align with the growing body of research on hybrid physical–data-driven drought models [14,52], which demonstrate that embedding process-based constraints enhances both predictive skill and scientific transparency. Consequently, the MDI represents not only a methodological advance but also a conceptual bridge linking empirical machine learning with physical understanding, providing a robust foundation for future drought early-warning applications in high-latitude agroecosystems.

4.3. Limitations and Future Prospects

Although the MDI demonstrated clear advantages in spatiotemporal responsiveness and overall accuracy, its extrapolation boundaries still require further refinement and validation. The current validation region is limited to the major maize-producing areas of Heilongjiang, without encompassing broader climatic gradients and cropping systems [47]. Systematic evaluations across regions and crops (e.g., rice, wheat, and soybean) will help assess the transferability and robustness of the model in diverse agroecosystems [44,49].
From a methodological perspective, while the convolutional neural network (CNN)–based downscaling effectively ensured physical consistency between spectral and thermal indices, its performance remains dependent on the representativeness of training samples and the quality of high-resolution reference data. Spatial or temporal inconsistencies in surface reflectance and temperature products may introduce bias during model generalization, especially under extreme meteorological conditions. Furthermore, the implicit learning mechanism of CNNs limits interpretability, making it difficult to explicitly trace how physical constraints influence the downscaled outputs. Future studies could explore physics-informed neural networks or hybrid energy-balance loss functions to further strengthen physical consistency and transparency in the downscaling process [51,52].
In terms of spatial resolution, the 250 m scale is adequate for regional drought monitoring but remains insufficient for field- or plant-level management. To bridge the gap between the “observation” and “management” scales, future work may integrate spatiotemporal fusion and multi-sensor data assimilation frameworks capable of reaching finer resolutions using emerging approaches such as STARFM, ESTARFM, and GAN-based reconstructions, combined with high-resolution satellite, UAV, and ground-based sensor networks [14,45].
Future research will further explore the impact of human activities (e.g., irrigation, crop rotation, management practices) on drought manifestations, particularly in agricultural settings where such interventions may significantly influence the performance of the MDI. We plan to quantify the effect of these anthropogenic practices on drought monitoring results as more data becomes available.
Moreover, assimilating crop-growth models, in situ soil-moisture observations, and crop yield data, together with hyperspectral and radar information, would enhance the sensitivity and physical realism of early detection and drought-process simulation. Incorporating these diverse data sources can provide a more holistic understanding of how crops respond to drought stress, particularly in agricultural systems where yield anomalies are critical indicators of drought impacts. For uncertainty quantification, incorporating cross-validation, Bayesian post-updating, and multi-index confidence propagation could improve the reliability of early-warning thresholds and the effectiveness of drought-risk communication mechanisms [52].
Looking ahead, under the context of intensifying climate variability and increasing extreme events, constructing a multi-scale drought monitoring and early-warning system—extending from regional to global levels, applicable across cropping systems, and grounded in interpretable physical principles—represents a key direction for future research.

5. Conclusions

This study developed a physically guided, data-driven framework for integrated drought assessment in maize-growing regions of Northeast China. By coupling hydrothermal indicators derived from optical and thermal remote sensing with topographic information, the proposed Multivariate Drought Index (MDI) provides a more comprehensive and physically interpretable representation of agricultural drought dynamics.
The results demonstrated that combining complementary indices reflecting both spectral moisture status and surface thermal conditions effectively captures the soil–vegetation–atmosphere interactions driving drought evolution. Through objective weighting and physically consistent downscaling, the MDI enhances spatial resolution and sensitivity to early stress signals, enabling more accurate identification of localized drought conditions. This physically guided integration approach represents a conceptual shift from purely empirical models toward mechanism-informed machine learning in drought monitoring.
Beyond methodological advances, the findings carry broader implications for agricultural drought management. The high spatiotemporal resolution and early-detection capability of the MDI can support operational early-warning systems, irrigation scheduling, and regional drought risk zoning. Moreover, the methodological framework can be extended to other crops and regions, contributing to the development of generalized, physically interpretable drought indices at multiple scales.
Future work should focus on refining the physical constraints within deep-learning architectures, incorporating additional environmental variables such as soil texture, evapotranspiration, and precipitation, and validating the framework under diverse climatic conditions. Integrating MDI with real-time meteorological data and crop-growth models could further enhance its applicability in precision agriculture and climate-resilient policy planning.

Author Contributions

Author Contributions: Conceptualization, H.Y. and H.L.; methodology, H.Y. and Z.A.; software, B.Q.; validation, J.L., C.Q. and H.Z.; formal analysis, Z.A.; investigation, J.L.; resources, C.Q.; data curation, Z.A.; writing—original draft preparation, Z.A.; writing—review and editing, B.Q.; visualization, H.Z.; supervision, X.Z.; project administration, X.H.; funding acquisition, Y.W. and Y.M. All authors have read and agreed to the published version of the manuscript.

Funding

This research was supported by the Jilin Provincial Key Laboratory of Light Agriculture (YDZJ202502CXJD006), International Partnership Program, International Cooperation Bureau, Chinese Academy of Sciences (131323KYSB20210004).

Data Availability Statement

Data are subject to privacy restrictions. Please contact the corresponding author.

Acknowledgments

We thank the National Earth System Science Data Center for providing geographic information data.

Conflicts of Interest

The authors declare no conflicts of interest.

References

  1. Battisti, D.S.; Naylor, R.L. Historical warnings of future food insecurity with unprecedented seasonal heat. Science 2009, 323, 240–244. [Google Scholar] [CrossRef]
  2. Mao, H.; Sun, Z.; Chai, A.; Fang, L.; Shi, C. Extreme weather, agricultural insurance and farmer’s climate adaptation technologies adoption in China. Ecol. Econ. 2025, 228, 108456. [Google Scholar] [CrossRef]
  3. Chen, J.; Chan, F.K.S.; Wang, J.; Feng, M.; Wang, Z.; Altansukh, O.; Shao, Y.; Li, P.; Wang, J. Potential challenges and food security responses to climate change in China and Mongolia in the post-COP28 era. J. Resour. Ecol. 2025, 16, 22–35. [Google Scholar] [CrossRef]
  4. Shi, Y.; Wang, F.; Wang, Y.; Jia, L. The Maize Supply Chain Coordination Mechanism under Yield Uncertainty Caused by Drought: A Study in the Heilongjiang Province of China. Sustainability 2023, 15, 11319. [Google Scholar] [CrossRef]
  5. Guo, E.; Liu, X.; Zhang, J.; Wang, Y.; Wang, C.; Wang, R.; Li, D. Assessing spatiotemporal variation of drought and its impact on maize yield in Northeast China. J. Hydrol. 2017, 553, 231–247. [Google Scholar] [CrossRef]
  6. Li, Q.; Gao, Y.; Hamani, A.K.M.; Wang, G.; Liu, J.; Fu, Y.; Wang, X. Effects of warming and drought stress on the growth characteristics, photosynthetic-transpiration rates, and yield of winter wheat. Int. J. Agric. Biol. Eng. 2024, 17, 121–129. [Google Scholar] [CrossRef]
  7. Wang, Y.; Zhang, S.; Xu, Y.; Que, L.; Li, X.; Huang, Y.; Chen, X.; Wang, L. Meteorological drought and atmospheric circulation anomalies characteristics in Heilongjiang Province from May to September in recent 50 years. Arid Meteorol. 2023, 41, 540–549. [Google Scholar]
  8. Park, S.-Y.; Sur, C.; Kim, J.-S.; Lee, J.-H. Evaluation of multi-sensor satellite data for monitoring different drought impacts. Stoch. Environ. Res. Risk Assess. 2018, 32, 2551–2563. [Google Scholar] [CrossRef]
  9. Alahacoon, N.; Edirisinghe, M. A comprehensive assessment of remote sensing and traditional based drought monitoring indices at global and regional scale. Geomat. Nat. Hazards Risk 2022, 13, 762–799. [Google Scholar] [CrossRef]
  10. Yu, H.; Zhang, Q.; Xu, C.Y.; Du, J.; Sun, P.; Hu, P. Modified palmer drought severity index: Model improvement and application. Environ. Int. 2019, 130, 104951. [Google Scholar] [CrossRef]
  11. Šebenik, U.; Brilly, M.; Šraj, M. Drought analysis using the standardized precipitation index (SPI). Acta Geogr. Slov. 2017, 57, 31–49. [Google Scholar] [CrossRef]
  12. Guttman, N.B. Comparing the palmer drought index and the standardized precipitation index 1. J. Am. Water Resour. Assoc. 1998, 34, 113–121. [Google Scholar] [CrossRef]
  13. Feng, P.; Wang, B.; Liu, D.L.; Yu, Q. Machine learning-based integration of remotely-sensed drought factors can improve the estimation of agricultural drought in South-Eastern Australia. Agric. Syst. 2019, 173, 303–316. [Google Scholar] [CrossRef]
  14. Xu, Z.; Sun, H.; Zhang, T.; Xu, H.; Wu, D.; Gao, J.H. The high spatial resolution Drought Response Index (HiDRI): An integrated framework for monitoring vegetation drought with remote sensing, deep learning, and spatioteporal fusion. Remote Sens. Environ. 2024, 312, 114324. [Google Scholar] [CrossRef]
  15. Watson, K.; Hummer-Miller, S. A simple algorithm to estimate the effective regional atmospheric parameters for thermal-inertia mapping. Remote Sens. Environ. 1981, 11, 455–462. [Google Scholar] [CrossRef]
  16. Price, J.C. On the analysis of thermal infrared imagery: The limited utility of apparent thermal inertia. Remote Sens. Environ. 1985, 18, 59–73. [Google Scholar] [CrossRef]
  17. Tucker, C.J. Red and photographic infrared linear combinations for monitoring vegetation. Remote Sens. Environ. 1979, 8, 127–150. [Google Scholar] [CrossRef]
  18. Kogan, F.; Sullivan, J. Development of global drought-watch system using NOAA/AVHRR data. Adv. Space Res. 1993, 13, 219–222. [Google Scholar] [CrossRef]
  19. Kogan, F.N. Application of vegetation index and brightness temperature for drought detection. Adv. Space Res. 1995, 15, 91–100. [Google Scholar] [CrossRef]
  20. Wang, W.; Zang, Y.; Li, G. Estimation and spatial character analysis of vegetation net primary productivity in Heilongjiang Province. In MIPPR 2011: Remote Sensing Image Processing, Geographic Information Systems, and Other Applications, Proceedings of the Seventh International Symposium on Multispectral Image Processing and Pattern Recognition (MIPPR2011), Guilin, China, 4–6 November 2011; SPIE: Bellingham, DC, USA, 2011; Volume 8006, pp. 192–199. [Google Scholar]
  21. Zhou, X.; Wang, P.; Tansey, K.; Zhang, S.; Li, H.; Wang, L. Developing a fused vegetation temperature condition index for drought monitoring at field scales using Sentinel-2 and MODIS imagery. Comput. Electron. Agric. 2020, 168, 105144. [Google Scholar] [CrossRef]
  22. Wu, L.; Zhang, Y.; Wang, L.; Xie, W.; Song, L.; Zhang, H.; Bi, H. Analysis of 22-year Drought Characteristics in Heilongjiang Province Based on Temperature Vegetation Drought Index. Comput. Intell. Neurosci. 2022, 2022, 1003243. [Google Scholar] [CrossRef] [PubMed]
  23. Xing, Z.; Yang, Z.; Fu, Q.; Li, H.; Gong, X.; Wu, J. Characteristics and risk assessment of agricultural meteorological disasters based on 30 years’ disaster data from Heilongjiang Province of China. Int. J. Agric. Biol. Eng. 2017, 10, 144–154. [Google Scholar] [CrossRef]
  24. Du, L.; Tian, Q.; Yu, T.; Meng, Q.; Jancso, T.; Udvardy, P.; Huang, Y. A comprehensive drought monitoring method integrating MODIS and TRMM data. Int. J. Appl. Earth Obs. Geoinf. 2013, 23, 245–253. [Google Scholar] [CrossRef]
  25. Rajsekhar, D.; Singh, V.P.; Mishra, A.K. Multivariate drought index: An information theory based approach for integrated drought assessment. J. Hydrol. 2015, 526, 164–182. [Google Scholar] [CrossRef]
  26. Adnan, R.M.; Dai, H.-L.; Kuriqi, A.; Kisi, O.; Zounemat-Kermani, M. Improving drought modeling based on new heuristic machine learning methods. Ain Shams Eng. J. 2023, 14, 102168. [Google Scholar] [CrossRef]
  27. Cai, S.; Zuo, D.; Wang, H.; Xu, Z.; Wang, G.; Yang, H. Assessment of agricultural drought based on multi-source remote sensing data in a major grain producing area of Northwest China. Agric. Water Manage. 2023, 278, 108142. [Google Scholar] [CrossRef]
  28. Schwartz, C.; Ellenburg, C.W.; Mishra, V.; Mayer, T.; Griffin, R.; Qamer, F.; Matin, M.; Tadesse, T. A statistical evaluation of Earth-observation-based composite drought indices for a localized assessment of agricultural drought in Pakistan. Int. J. Appl. Earth Obs. Geoinf. 2022, 106, 102646. [Google Scholar] [CrossRef]
  29. Fu, Q.; Zhou, Z.; Li, T.; Liu, D.; Hou, R.; Cui, S.; Yan, P. Spatiotemporal characteristics of droughts and floods in northeastern China and their impacts on agriculture. Stoch. Environ. Res. Risk Assess. 2018, 32, 2913–2931. [Google Scholar] [CrossRef]
  30. Zhao, Q.; Zou, C.H.; Wang, K.F.; Gao, Q.; Yao, T. Spatial and temporal distribution characteristics of drought and its influencing factors in Heilongjiang Province, China from 1956 to 2015. Appl. Ecol. Environ. Res. 2019, 17, 2631–2650. [Google Scholar] [CrossRef]
  31. Xu, X.Z.; Xu, Y.; Chen, S.C.; Xu, S.G.; Zhang, H.W. Soil loss and conservation in the black soil region of Northeast China: A retrospective study. Environ. Sci. Policy 2010, 13, 793–800. [Google Scholar] [CrossRef]
  32. Heilongjiang Provincial Bureau of Statistics. Heilongjiang Statistical Yearbook; Heilongjiang People’s Publishing House: Harbin, China, 2019.
  33. Vicente-Serrano, S.M.; Beguería, S.; López-Moreno, J.I. A multiscalar drought index sensitive to global warming: The standardized precipitation evapotranspiration index. J. Clim. 2010, 23, 1696–1718. [Google Scholar] [CrossRef]
  34. Cai, X.; Zhang, X.; Pan, M.; Zhu, Q. SMCI1.0: A high-quality soil moisture dataset for China (2000–2020) derived from in situ observations. Earth Syst. Sci. Data 2021, 13, 3217–3236. [Google Scholar]
  35. Gao, B.-C. NDWI—A normalized difference water index for remote sensing of vegetation liquid water from space. Remote Sens. Environ. 1996, 58, 257–266. [Google Scholar] [CrossRef]
  36. Sandholt, I.; Rasmussen, K.; Andersen, J. A simple interpretation of the surface temperature/vegetation index space for assessment of surface moisture status. Remote Sens. Environ. 2002, 79, 213–224. [Google Scholar] [CrossRef]
  37. Diakoulaki, D.; Mavrotas, G.; Papayannakis, L. Determining objective weights in multiple criteria problems: The critic method. Comput. Oper. Res. 1995, 22, 763–770. [Google Scholar] [CrossRef]
  38. Willmott, C.J. Some comments on the evaluation of model performance. Bull. Am. Meteorol. Soc. 1982, 63, 1309–1313. [Google Scholar] [CrossRef]
  39. Congalton, R.G. A review of assessing the accuracy of classifications of remotely sensed data. Remote Sens. Environ. 1991, 37, 35–46. [Google Scholar] [CrossRef]
  40. Jackson, R.D.; Idso, S.B.; Reginato, R.J.; Pinter, P.J., Jr. Canopy temperature as a crop water stress indicator. Water Resour. Res. 1981, 17, 1133–1138. [Google Scholar] [CrossRef]
  41. Lundberg, S.M.; Lee, S.-I. A unified approach to interpreting model predictions. Adv. Neural Inf. Process. Syst. 2017, 30, 4768–4777. [Google Scholar]
  42. Montgomery, D.C.; Runger, G. Applied Statistics and Probability for Engineers; John Wiley & Sons: Hoboken, NJ, USA, 2010. [Google Scholar]
  43. GB/T 20481–2017; Grades of Meteorological Drought. China Meteorological Administration: Beijing, China, 2017.
  44. Xiao, X.; Ming, W.; Luo, X.; Yang, L.; Li, M.; Yang, P.; Ji, X.; Li, Y. Leveraging multisource data for accurate agricultural drought monitoring: A hybrid deep learning model. Agric. Water Manag. 2024, 293, 108692. [Google Scholar] [CrossRef]
  45. Hao, Z.; Singh, V.P. Drought characterization from a multivariate perspective: A review. J. Hydrol. 2015, 527, 668–678. [Google Scholar] [CrossRef]
  46. Qin, H.; Schaefer, D.A.; Shen, T.; Wang, J.; Liu, Z.; Chen, H.; Hu, P.; Zhu, Y.; Cheng, J.; Wu, J.; et al. Drought Driving Factors as Revealed by Geographic Detector Model and Random Forest in Yunnan, China. Forests 2025, 16, 505. [Google Scholar] [CrossRef]
  47. Li, J.; Li, Y.; Yin, L.; Zhao, Q. A novel composite drought index combining precipitation, temperature and evapotranspiration used for drought monitoring in the Huang-Huai-Hai Plain. Agric. Water Manag. 2024, 291, 108626. [Google Scholar] [CrossRef]
  48. Xu, Z.; Sun, H.; Zhang, T.; Xu, H.; Wu, D.; Gao, J. Evaluating established deep learning methods in constructing integrated remote sensing drought index: A case study in China. Agric. Water Manag. 2023, 286, 108405. [Google Scholar] [CrossRef]
  49. Li, X.; Lyu, Y.; Zhu, B.; Liu, L.; Song, K. Maize yield estimation in Northeast China’s black soil region using a deep learning model with attention mechanism and remote sensing. Sci. Rep. 2025, 15, 12927. [Google Scholar] [CrossRef]
  50. Kennedy, B.; Pouliot, D.; Manseau, M.; Fraser, R.; Duffe, J.; Pasher, J.; Chen, W.; Olthof, I. Assessment of Landsat-based terricolous macrolichen cover retrieval and change analysis over caribou ranges in northern Canada and Alaska. Remote Sens. Environ. 2020, 240, 111694. [Google Scholar] [CrossRef]
  51. Zhu, X.; Xu, K.; Liu, Y.; Guo, R.; Chen, L. Assessing the vulnerability and risk of maize to drought in China based on the AquaCrop model. Agric. Syst. 2021, 189, 103040. [Google Scholar] [CrossRef]
  52. He, K.; Zhang, X.; Ren, S.; Sun, J. Deep residual learning for image recognition. In Proceedings of the IEEE Conference on Computer Vision and Pattern Recognition, Las Vegas, NV, USA, 27–30 June 2016; pp. 770–778. [Google Scholar]
Figure 1. Overview map of the study area Maize cultivation area is the common area for maize cultivation from 2000 to 2024 (a) DEM in Heilongjiang Province, (b) TMP in Heilongjiang Province, (c) PRE in Heilongjiang Province.
Remotesensing 17 03452 g001
Figure 2. Workflow of the construction and application of the comprehensive drought index (MDI). The workflow illustrates the overall methodological framework, including data input (remote sensing indices, SPEI, SMCI, VHI, DEM), preprocessing and index calculation (standardization of NDWI, TVDI, TCI, and VCI, and downscaling using convolutional neural networks), construction of the comprehensive drought index (MDI), analysis of feature weights and importance (SHAP, CRITIC, and random forest), and verification and application (lead time detection, validation against multiple drought indices, spatial risk zoning, and accuracy assessment).
Remotesensing 17 03452 g002
Figure 3. Correlation trends of NDWI, TVDI, VCI, and TCI with SPEI at different time scales during the maize growing season (2000–2024). Solid lines represent the mean correlation coefficients (r) between each drought index and SPEI at 1-, 3-, and 6-month time scales across 34 meteorological stations. Shaded areas indicate the 95% confidence intervals (CI) estimated using the bootstrap method (n = 1000). The bar charts on the right vertical axis show the proportion of stations with statistically significant correlations (p < 0.05). Asterisks denote significance levels: * p < 0.05, ** p < 0.01.
Remotesensing 17 03452 g003
Figure 4. Comparison of factor weights and importance based on CRITIC, Random Forest, and SHAP. The left panel shows the comparison of CRITIC objective weights and Random Forest feature importance for NDWI, TVDI, VCI, TCI, and DEM. The right panel presents the annular chart of feature contribution proportions derived from SHAP. NDWI directly reflects canopy water status, while TVDI characterizes the coupled effects of hydrothermal stress. Both consistently ranked highest across the three methods, with their combined contributions exceeding half of the model’s explanatory power.
Remotesensing 17 03452 g004
Figure 5. (a) Multi-year time series comparison of MDI with other drought indices (VHI, SPEI-3, and SMCI) during the maize growing season from 2000 to 2018. MDI is presented at a 16-day scale, while VHI, SPEI-3, and SMCI are at a monthly scale. The comparison highlights the earlier response and higher sensitivity of MDI in capturing drought onset and evolution. (b) Single-event temporal response comparison of MDI with other drought indices (VHI, SPEI-3, and SMCI) during the spring drought event of 2007. The shaded area indicates the rapid drought development phase. Results show that MDI identified drought signals earlier in the initial stage (late May), with a lead time of 16–20 days compared to other indices, and exhibited higher sensitivity during both the development and recovery phases.
Remotesensing 17 03452 g005
Figure 6. Monthly spatial distribution and fine-scale identification comparison of MDI, SPEI-3, and VHI during the spring drought event of 2017. The maps illustrate spatial distribution changes at the early stage (25 May), development stage (10 June), and peak stage (25 June). The grayscale–color gradients represent varying drought index values. The results demonstrate that MDI exhibits higher sensitivity and accuracy than SPEI-3 and VHI in detecting small-scale drought patches and characterizing spatial heterogeneity.
Remotesensing 17 03452 g006
Figure 7. Multi-year average distribution of the monthly proportions of different drought categories during the maize growing season (May–September) from 2000 to 2024. Results indicate that mild drought was the most common category, followed by moderate, severe, and extreme drought. The proportions of severe and extreme drought were markedly higher in July and August compared to other months, reflecting the cumulative seasonal drought risk.
Remotesensing 17 03452 g007
Figure 8. Spatial distribution of drought risk levels based on MDI during the maize growing season from 2000 to 2024. High-risk zones (frequency > 50%) were primarily concentrated in the central-western part of the study area, medium-risk zones (30–50%) were widely distributed across transitional regions, and low-risk zones (<30%) were mainly located in the eastern hills and northeastern mountainous areas. Statistical results indicate that high-risk zones accounted for 42.6% of the total maize cultivation area, medium-risk zones for 36.1%, and low-risk zones for 21.3%.
Remotesensing 17 03452 g008
Table 2. Indicators used for validation and comparison.
IndicatorData SourceObservation
Dimension
Application RoleFormula
SMCISMCI1.0 (CAS NWIEER)Soil moistureSoil moisture reference [19] S M C I = S M S M m i n S M m a x S M m i n
VHIMODIS compositeVegetation + temperatureClassical remote sensing reference [35] V H I = a · N D V I + ( 1 a ) · ( 1 L S T L S T m i n L S T m a x L S T m i n )
SPEIMeteorological dataWater balanceMeteorological benchmark [36] S P E I = P P E T σ P P E T
Table 3. Performance comparison of MDI with single remote sensing indices and VHI.
IndexR2RMSECorrelation (r)Accuracy (%)
NDWI0.750.120.7974.5
TVDI0.780.110.8176.8
VCI0.690.140.7469.2
TCI0.710.130.7671
VHI0.70.130.7370.4
MDI0.870.080.8787.4
Disclaimer/Publisher’s Note: The statements, opinions and data contained in all publications are solely those of the individual author(s) and contributor(s) and not of MDPI and/or the editor(s). MDPI and/or the editor(s) disclaim responsibility for any injury to people or property resulting from any ideas, methods, instructions or products referred to in the content.