Article

Multiscale Precipitating Characteristics of Categorized Extremely Persistent Flash Heavy Rainfalls over the Sichuan Basin in China Based on SOM and Multi-Source Datasets

1
State Key Laboratory of Climate System Prediction and Risk Management/Key Laboratory of Meteorological Disaster, Ministry of Education/Collaborative Innovation Center on Forecast and Evaluation of Meteorological Disasters/School of Atmospheric Sciences, Nanjing University of Information Science & Technology, Nanjing 210044, China
2
Chongqing Meteorological Observatory/Key Open Laboratory of Transforming Climate Resources to Economy, Chinese Meteorological Administration, Chongqing 401147, China
*
Author to whom correspondence should be addressed.
Remote Sens. 2025, 17(16), 2761; https://doi.org/10.3390/rs17162761 (registering DOI)
Submission received: 2 July 2025 / Revised: 4 August 2025 / Accepted: 7 August 2025 / Published: 9 August 2025

Abstract

Extremely persistent flash heavy rainfalls (EPHRs) over the Sichuan Basin in China are influenced by both multiscale weather systems and complex underlying surfaces, making it difficult to understand the favorable dynamic mechanisms and to further improve operational numerical forecasting skills. In this study, EPHRs from 2010 to 2024 are objectively identified and then classified into three categories based on the SOM method. Precipitating characteristics for each category are further investigated from the perspective of the diurnal cycle and spatial features with the use of rain-gauge-based observations. Evaluations of the ERA5 reanalysis dataset, MSWX bias-corrected meteorological product, and CMORPH satellite-based precipitation product are performed to determine their capabilities in representing precipitating characteristics of different EPHR categories at different stages. The following results are obtained. During EPHR events, CMORPH outperforms MSWX and ERA5 in capturing heavy precipitation distribution, diurnal cycles, and evolution over the central basin. Both MSWX and ERA5 miss the central precipitation core, with MSWX showing premature peaks and ERA5 generating secondary evening peaks while overestimating precipitation duration. During events influenced by small-scale weather systems, all three products exhibit minimal false alarms but show the largest errors in intensity and diurnal variation. Under certain circulation types, MSWX and ERA5 significantly underestimate precipitation development with comparable metrics, while CMORPH achieves superior accuracy in precipitation intensity and correlations, yet it underestimates nighttime precipitation occurrences in steep western terrain. This study may help to facilitate not only theoretical studies but also numerical model developments for precipitation extremes.

1. Introduction

The Sichuan Basin, situated at the transitional zone between the first and second topographic steps, represents the most morphologically typical, lowest-elevation, and agriculturally fertile basin in southwestern China, with a population of approximately 100 million. Surrounded by complex topography with the Hengduan Mountains and eastern Tibetan Plateau to the west, the Yunnan–Guizhou Plateau to the south, the Dalou and Wuling Mountains to the east, and the Qinling and Daba Mountains to the north, the Sichuan Basin is influenced by sensitive geological structures and fragile ecosystems. Influenced by the East Asian monsoon system, this region frequently experiences mesoscale weather systems, including southwest vortices (SWVs), shear lines, and low-level jets (LLJs) during warm seasons, leading to heavy rainfalls characterized by nocturnal onset, high intensity, and secondary disasters. These geological and meteorological features pose significant forecasting challenges and severe socioeconomic risks [1,2,3,4].
Under the climatological background of global warming, the increasing frequency, intensity, and compound nature of extreme precipitation events further complicate rainfall mechanisms in this region. The IPCC Sixth Assessment Report (AR6) confirms accelerated global water cycling since the 1950s, with a 7% increase in atmospheric moisture per 1 °C warming, intensifying extreme weather and climate events [5]. Both statistical analyses of observational datasets and numerical simulations demonstrate rising trends in daily extreme precipitation globally [6,7], while sub-daily extremes increase more rapidly [8]. Hourly precipitation extremes over the Sichuan Basin exhibit higher frequencies and increasing trends compared to adjacent regions [9,10]. Data availability is another non-negligible factor for studying extreme precipitation research over the Sichuan Basin. Due to historically insufficient observations over the basin, previous studies have rarely addressed the evolutionary characteristics of multiscale vortices within SWVs or their interaction mechanisms with heavy rainfalls. Recent advances in datasets of high spatiotemporal resolution include networks of wind profilers, X-band and S-band radars in observational fields, and high-resolution numerical modeling outputs suitable for complex underlying surfaces [11]. These developments favor thorough investigations of the precipitating characteristics of heavy rainfalls and their possible mechanisms over the Sichuan Basin.
Previous studies on hourly precipitation extremes over the Sichuan Basin have predominantly focused on short-duration heavy rainfall [8,12] while largely neglecting persistent flash heavy rainfalls (PHRs). Zhang et al. [13] defined extremely PHRs (EPHRs) over South China as PHR events with hourly precipitation exceeding 20 mm and lasting over 5 h. Xia et al. [3] found that EPHRs over the Sichuan Basin primarily occur nocturnally from June to September and are predominantly modulated by LLJs and SWVs. These EPHR events over complex terrain exhibit notable asymmetries, with intensification phases proceeding more rapidly than decay phases [13,14].
Some studies have evaluated the capability and applicability of various precipitation datasets in capturing extreme precipitation events [15,16,17,18,19] and orographic precipitation characteristics [20,21,22]. For example, the Climate Prediction Center morphing technique (CMORPH) precipitation dataset provides high spatiotemporal resolution capable of capturing spatial details of short-duration heavy rainfall [23,24]. The Multi-Source Weather (MSWX) dataset significantly improves meteorological representation over complex terrain through statistical harmonization and ensures temporal consistency across historical, real-time, and forecast data. Meanwhile, it maintains compatibility with the Multi-Source Weighted-Ensemble Precipitation (MSWEP) product to support hydrological model calibration and extreme event monitoring [25]. However, the accuracy and applicability of these datasets in describing EPHRs over the Sichuan Basin remain uncertain, especially in describing precipitating characteristics during the evolutionary processes of EPHR events. Therefore, a thorough investigation is required to evaluate the performance of different precipitation products in depicting EPHR events over this region.
With a focus on evaluating the ability of MSWX, CMORPH, and ERA5 to characterize the spatiotemporal distribution and evolution of different EPHR events, this study is organized as follows. Section 2 describes multi-source datasets since 2010 and methods for identifying, categorizing, and depicting EPHR events over the Sichuan Basin. Precipitating characteristics are investigated in Section 3, followed by evaluations among four datasets. Discussions and conclusions are presented in Section 4 and Section 5, respectively.

2. Data and Method

2.1. Reanalysis Datasets, Observations, and Satellite Precipitation Products

Rain gauge observations provided by the National Meteorological Information Center (NMIC) of the Chinese Meteorological Administration are regarded as the most accurate source of precipitation data and play a crucial role in quantitative studies related to rainfall. This study focuses on the Sichuan Basin, and the distribution of the rain gauge stations is illustrated as the black dots in Figure 1.
The ERA5 dataset, developed by the European Centre for Medium-Range Weather Forecasts (ECMWF), is the fifth-generation global climate reanalysis product and represents a major advancement over its predecessor, the ERA-Interim dataset. Its precipitation data has been widely utilized in meteorological and hydrological studies. Although the ERA5 precipitation reanalysis has undergone considerable improvements compared to ERA-Interim, it still exhibits larger errors in regions dominated by convective storms and orographically driven precipitation [26].
The CMORPH precipitation dataset integrates multi-satellite microwave and infrared retrievals and provides high spatiotemporal resolution capable of capturing spatial details of short-duration heavy rainfall. However, in complex terrain regions, like the Sichuan Basin, it presents characterization biases in local convective precipitation intensity due to cloud shielding and orographic lifting mechanisms, and it is prone to missing precipitation events [27].
The MSWX dataset offers key advantages over other global meteorological products: (1) near-real-time updates for operational monitoring; (2) consistent and freely available forecasts for early warning systems; (3) high spatial resolution (0.1°) to resolve complex terrain; and (4) compatibility with satellite-enhanced precipitation products. It significantly improves meteorological representation over complex terrain through statistical harmonization and ensures temporal consistency across historical, real-time, and forecast data. Although MSWX outperforms traditional reanalysis data in topographically complex regions via enhanced resolution and targeted bias correction, it remains limited in resolving fine-scale meteorological processes modulated by extreme terrain [28,29].
In this study, the rain gauge, CMORPH, MSWX, and ERA5 datasets are adopted with the temporal coverages and spatial resolutions described in Table 1. All data utilized were collected during June and September of each year from 2010 to 2024. Because of the absence of September 2024 data updates in the CMORPH dataset, the analysis of one EPHR event occurring in that month is excluded from the precipitation data comparisons.

2.2. Identification of EPHRs, EPHR Events, and Their Different Phases

For each station within the Sichuan Basin, EPHRs are identified when hourly precipitation exceeds 20 mm h−1 for a minimum duration of 4 h, allowing ≤1 h interruptions. The 4 h threshold corresponds to the 97.56th percentile of heavy rainfall duration in the basin (Figure 1b). An EPHR event initiates when precipitation first drops below 0.1 mm h−1 prior to the EPHR onset and terminates when precipitation first falls below 0.1 mm h−1 after the EPHR phase [3,30,31]. In this study, both EPHRs and EPHR events are defined based on rain gauge station data, with EPHR representing the heavy precipitation phase within the EPHR event cycle.
Given the 3-hourly temporal resolution of MSWX-Past data and the exclusion of short-duration extremes through hourly EPHR screening, the 3 h resolution is considered sufficient for characterizing EPHR features. To ensure consistency across the multiple precipitation products, namely, MSWX, CMORPH, and ERA5, all the datasets are aggregated to and reported as 3 h cumulative precipitation amounts. This temporal alignment is referenced to local standard time (LST = UTC + 8). Specifically, the precipitation amount reported at each LST time stamp (0200, 0500, 0800, 1100, 1400, 1700, 2000, and 2300) represents the total accumulated precipitation over the preceding three hours. Therefore, the data units are mm/3 h.
Growing time (GT) is calculated as follows. For the station or grid point exhibiting the maximum accumulated precipitation during each EPHR event, GT is defined as the period from event start to the first occurrence of precipitation exceeding 50 mm/3 h (designating the occurrence of the EPHR). If the 50 mm/3 h threshold is not satisfied during the event, GT is instead calculated as the period from event start to the time of the precipitation peak. Similarly, fading time (FT) is determined as follows: it is the period from the last occurrence of >50 mm/3 h precipitation to event end. If the 50 mm/3 h threshold is not reached at all during the event, FT is instead calculated as the period from the precipitation peak to event end. This conditional calculation accounts for the potential underestimation of precipitation intensity in certain datasets.

2.3. SOM Classification

The Self-Organizing Map (SOM), an unsupervised artificial neural network based on competitive learning [32], projects high-dimensional input data onto a low-dimensional topological space through nonlinear dimensionality reduction while preserving the spatial distribution and topological structure of the original data. The SOM demonstrates significant advantages in climate classification studies: it effectively captures nonlinear types in circulation fields, overcoming limitations of traditional linear methods in characterizing complex systems, and visually reveals transitional features and spatial continuity among circulation types through neighborhood relationships on the grid, making it suitable for weather system evolution analysis [33]. Mathematically, SOM training involves the following expressions.
Best Matching Unit (BMU) Selection: Finding the neuron c with the closest weight vector w j to the input vector x:
c = a r g m i n j / / x w j / / ,
Topological Neighborhood Update: Adjusting weights of c and its neighbors within radius σ t :
h j , c t = e x p / / r j r c / / 2 2 σ 2 t , σ t = σ 0 e t / τ ,
where r j and r c are the position coordinates of neuron j and winning neuron c in the grid, τ is a time constant, and σ t is the neighborhood radius that decays over time.
Weight Adaptation: Updating weights with decaying learning rate α t :
w j t + 1 = w j t + α t h j , c t x w j t , α t = α 0 e t / τ .
The SOM was configured with a 1 × 3 topology (i.e., 3 clusters). The training employed a Gaussian neighborhood function with initial radius σ 0 = 0.5 and initial learning rate α 0 = 0.5. The model underwent t = 50,000 iterations with exponential decay governed by τ = t/log( σ 0 ). Given the dominant importance of the SWVs and LLJs during EPHR events over the Sichuan Basin [3], this study applied the SOM to classify atmospheric circulation types based on the standardized 850 hPa geopotential height fields over the basin.

2.4. Diagnostic and Evaluation Metrics

In this study, the Barnes filter [34,35] is applied to the geopotential height data, by effectively removing small-scale noise while remaining synoptic or sub-synoptic scale flows. This method has been extensively employed in studies of Meiyu rainfalls over the Yangtze River Basin and other heavy rainfalls over the North China Plain, South China, and the Sichuan Basin [3,30,36,37,38,39]. According to recent studies over the Sichuan Basin [3], the filter parameters are adopted and found to dampen wavelengths shorter than 300 km and thus retain over 80% of wavelengths longer than 500 km. To quantify the ageostrophic component in LLJ over the eastern Yunnan–Guizhou Plateau southeast of the Sichuan Basin, the geostrophic wind component derived from geopotential height fields is subtracted from the horizontal wind using the following equations:
V g = 1 f p Φ f × k ,
V a = V V g .
where Φ f denotes the filtered geopotential height, V g represents the geostrophic wind, and V a indicates the ageostrophic wind.
To quantitatively evaluate discrepancies between the precipitation products and rain gauge precipitation, grid values are interpolated to the nearest station for comparison with the rain gauge measurements. Four statistical metrics are employed to assess the performance of different precipitation datasets: Mean Error (ME), relative Bias (rBIAS), Root Mean Square Error (RMSE), and the Correlation Coefficient (CORR).
M E = 1 n i = 1 n y i x i ,
r B I A S = i = 1 n y i x i / i = 1 n x i ,
R M S E = i = 1 n y i x i 2 n ,
C O R R = i = 1 n y i y ¯ x i x ¯ i = 1 n y i y ¯ 2 i = 1 n x i x ¯ 2 .
where n denotes the total number of samples, y represents rain gauge precipitation, and x indicates precipitation estimates from other products. The index of rBIAS quantifies the deviation between the precipitation products and rain gauge precipitation, while CORR measures their statistical correlations.
The capability of the precipitation products to capture EPHR events is assessed using the Probability of Detection (POD), False Alarm Ratio (FAR), Frequency Bias Index (FBI), and Threat Score (TS), which quantify the consistency between rain-gauge-observed events and those estimated by the other precipitation datasets.
P O D = H H + M ,
F A R = F H + F ,
F B I = H + F H + M ,
T S = H H + F + M .
where H (abbreviation for ‘Hit’) denotes the frequency of precipitation events simultaneously detected by both the precipitation products and rain gauges, F (false alarm) represents occurrences where the products indicate precipitation but none is recorded by the gauges, and M (miss) indicates events observed by the gauges but undetected by the precipitation products.

3. Results

3.1. Circulation Classification of EPHRs and Associated Precipitating Characteristics from Multi-Source Datasets

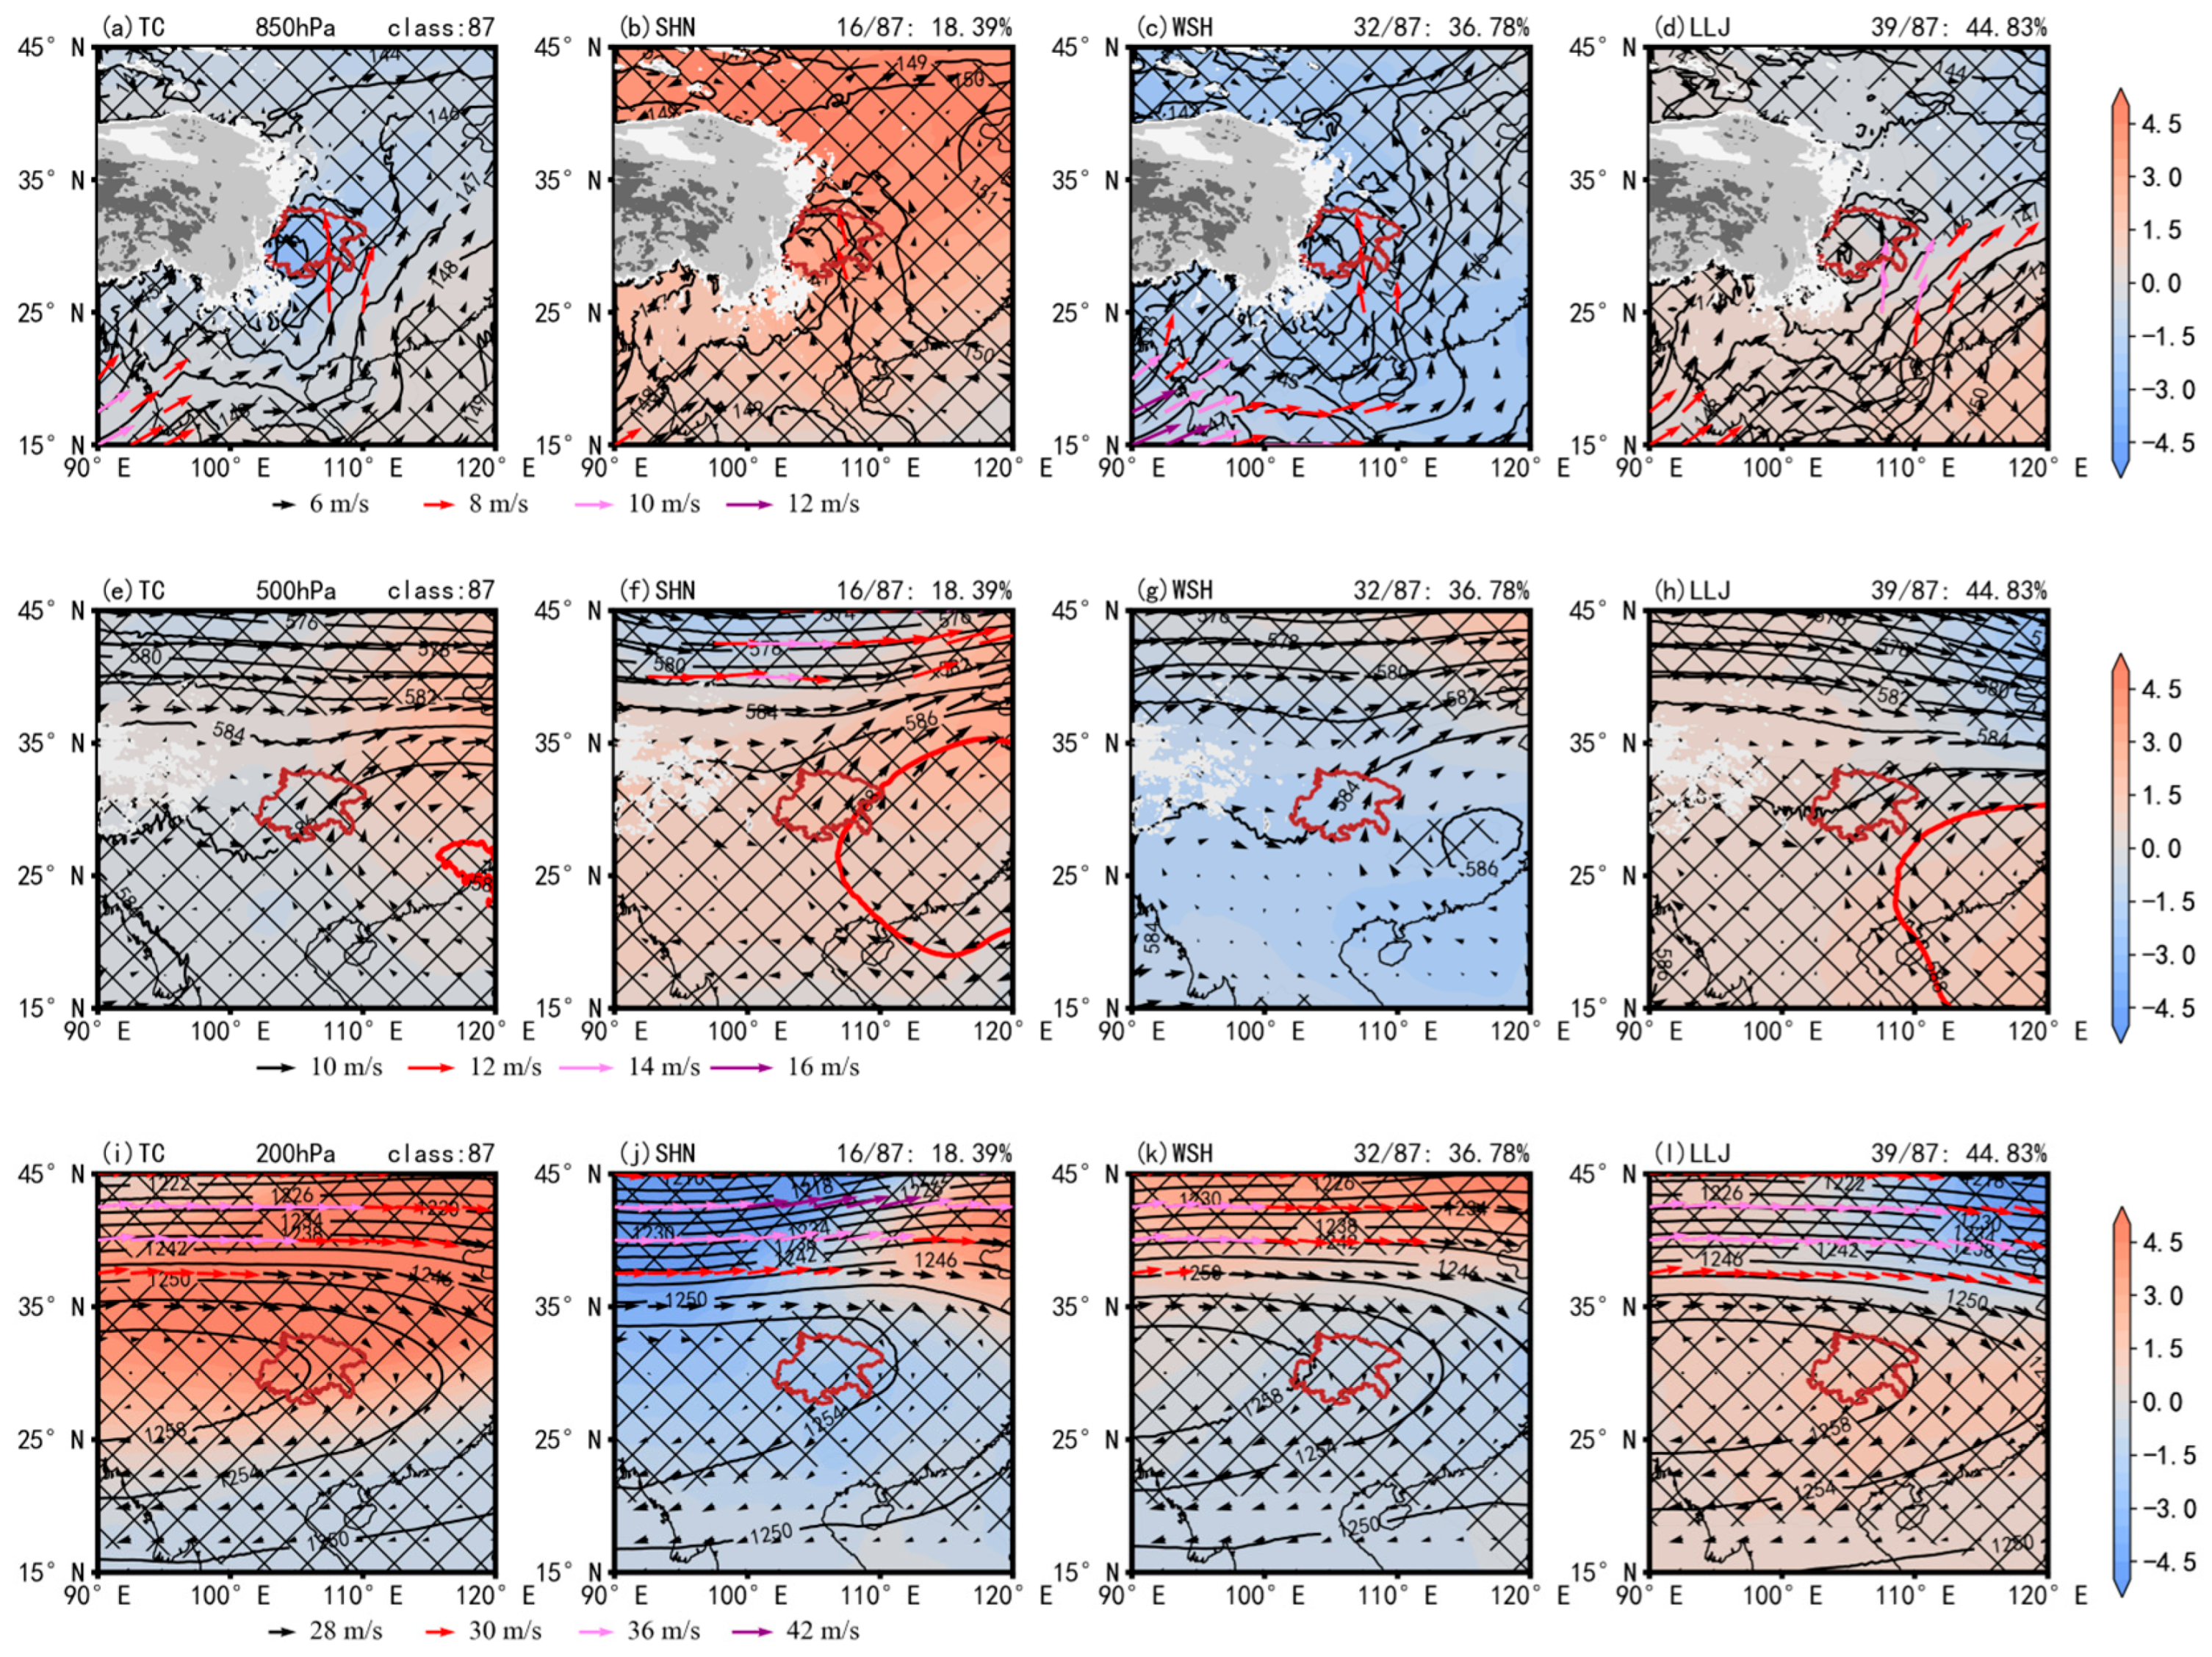
The synoptic systems influencing EPHRs over the Sichuan Basin exhibit distinct circulation types [3]. To evaluate the applicability of these precipitation datasets across these patterns, we classify EPHR-related circulations using the SOM into three primary types: the subtropical high northward shift type (SHN type), weak subtropical high type (WSH type), and LLJ type. As shown in Figure 2, EPHRs feature the composite total circulation (TC) type influenced by the upper-level South Asian High (SAH) and upper-level jets (ULJs), mid-level shortwave troughs and the Western Pacific Subtropical High (WPSH), and lower-level SWVs with LLJs. The WPSH regulates moisture access: its northward shift (SHN type) or southward position (LLJ type) opens pathways for humid air, while its retreat (WSH type) allows inland penetration of disturbances. The SHN type displays a northward-shifted WPSH with weaker SWVs and SAH intensities (Figure 2b,f,j). The WSH type exhibits negative 850 hPa geopotential height anomalies over the basin, accompanied by the most intense SWV development (Figure 2c). At 500 hPa, the absence of the 5880 gpm contour confirms subtropical high retreat eastward over the ocean (Figure 2g), suggesting that SWVs dominate the precipitating characteristics. Meanwhile, stronger SAH intensity compared to the SHN type is evident at 200 hPa (Figure 2k). The LLJ type demonstrates westward extension of the WPSH to the basin’s southeastern flank with pronounced LLJ activities (Figure 2d,h), controlling moisture inflow, while positive 200 hPa geopotential height anomalies indicate maximum SAH intensity (Figure 2i).
It should be noted that not all events strictly conform to these three archetypes. For instance, in the SHN type, one event exhibited an unusually weak WPSH, while in the WSH type, two events featured a westward-extending WPSH to the eastern basin, with over ten events showing typhoon influences (likely due to the weakened WPSH facilitating moisture transport from oceanic typhoons). Over 80% of the LLJ-type events demonstrated significant low-level jet impacts, and more than 90% of all the events featured ULJs at 200 hPa and SWVs at 850 hPa (figure omitted). Despite occasional deviations in individual events lacking typical circulation features within each category, the dominant synoptic patterns remain representative for the majority of cases. This validates the classification framework’s utility in evaluating precipitation datasets under canonical circulation types.
Spatial distributions of the average annual EPHR event precipitation from multiple datasets (Figure 3a–d) reveal that EPHR events during the recent 15 years produced over 200 mm of accumulated rainfall annually in the western, northwestern, and central Sichuan Basin. MSWX, ERA5, and CMORPH generally underestimate precipitation magnitudes. MSWX better captures the spatial positioning of high precipitation zones in the western and northwestern basins, while ERA5 locates its primary accumulation core in the northwest. Both datasets exhibit precipitation gradients decreasing radially from western topographic margins, yet they fail to represent the central basin’s high-precipitation zones. CMORPH demonstrates superior performance in depicting western basin accumulation zones and outperforms the other products in characterizing central basin precipitation, though it still underestimates amounts, particularly severely in the northwest. Diurnal cycle characteristics during EPHR events (Figure 3e) show that rain gauge observations, ERA5, and CMORPH share a 0500 LST precipitation peak, whereas MSWX advances it to 0200 LST. All the datasets except ERA5 and MSWX exhibit afternoon minima. CMORPH most accurately represents precipitation intensity, while ERA5 and MSWX underestimate nocturnal rainfall but overestimate afternoon precipitation, with ERA5 generating a secondary evening peak (1700LST) exceeding 2.5 mm/3 h.
The spatiotemporal precipitation distributions across three EPHR circulation types (Figure 3f–t) reveal discernible dataset discrepancies. During SHN-type events, the northward-shifted WPSH induces subsidence over the eastern basin (Figure 2f), while southeasterly low-level winds converge against steep western terrain (Figure 2b), so precipitation primarily concentrates over the western basin. Both MSWX and ERA5 substantially underestimate rainfall totals, while CMORPH better captures heavy rainfall regions. The rain gauge observations peak earliest at 0200 LST, while MSWX advances this peak to 2300 LST. ERA5 and CMORPH maintain 0500 LST peaks (Figure 3j). During WSH-type events, the absence of WPSH blocking (Figure 2g) enables stronger SWV development and migration (Figure 2c), triggering central basin EPHRs, but both MSWX and ERA5 exhibit concurrent underestimation of precipitation magnitudes over the central basin, with MSWX nonetheless effectively representing western precipitation cores. CMORPH accurately identifies all heavy precipitation zones while underestimating rainfall magnitudes. SWV-driven nocturnal precipitation dominates the diurnal cycle [1,3,4], and CMORPH best matches observed diurnal intensity variations (Figure 3o). During LLJ-type events, LLJ–terrain interactions trigger western precipitation, while migrating SWVs in coordination with eastward-extending SAH affect central-eastern regions (Figure 2d,i). MSWX and ERA5 also underestimate central basin precipitation, whereas CMORPH better represents the rainfall distribution across the central and western regions but underestimates northwestern basin accumulations. LLJ dominates the diurnal variation in precipitation of this type, characterized by rapid nighttime intensification and slow daytime weakening [3,31], but all three datasets erroneously enhance precipitation intensity after 1100 LST, contradicting the observations. MSWX exhibits the least diurnal variation, while ERA5 produces artificial evening (1700LST) rainfall peaks (Figure 3t). To sum up, MSWX consistently underestimates nocturnal precipitation intensity while prematurely advancing peak timing. ERA5 generates evening precipitation peaks across all circulation patterns. CMORPH achieves optimal performance during WSH-type events but misplaces peak timing in SHN-type events and overestimates afternoon precipitation intensity during LLJ-type events.
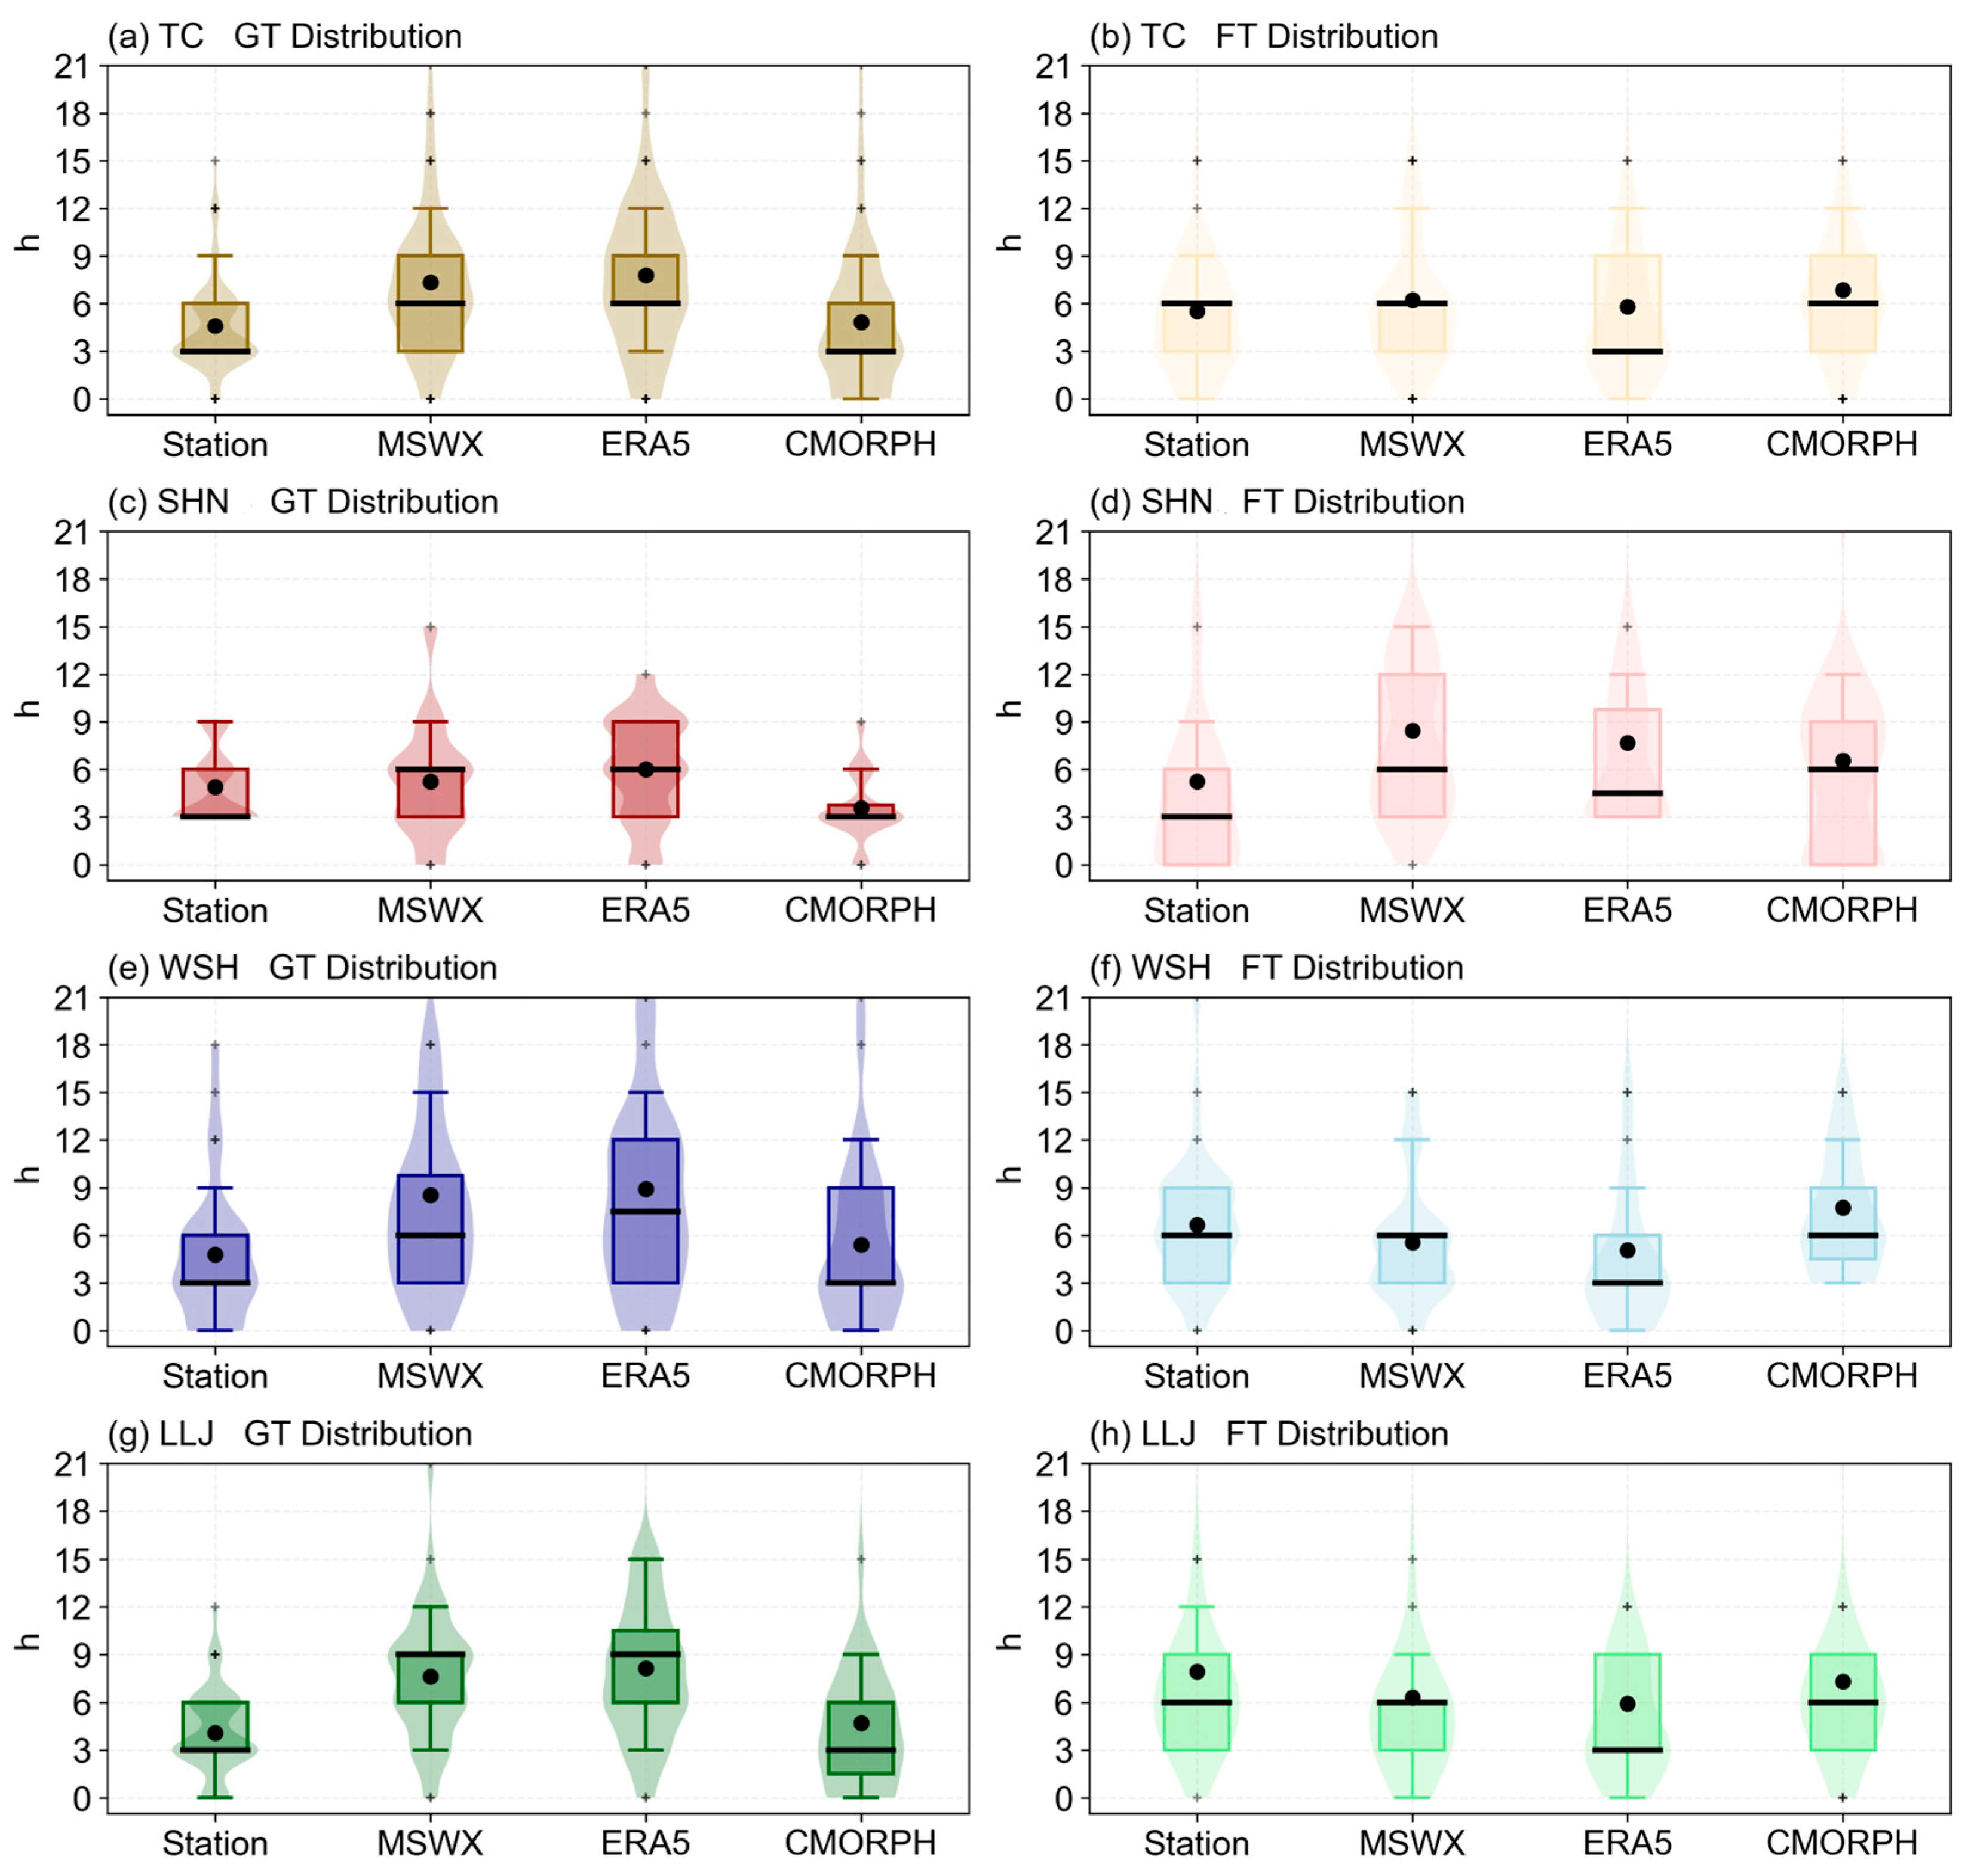
To evaluate the precipitation datasets’ capabilities in depicting the development and decay phases of Sichuan Basin EPHR events, we constructed boxplots for GT and FT durations across the datasets (Figure 4a,b). Basin EPHR events exhibit asymmetric precipitation evolution, characterized by shorter mean GT than FT—indicating more rapid intensification than weakening. Only CMORPH accurately captures this asymmetry, with its GT durations approximating observations within ~1.2 h. Conversely, both MSWX and ERA5 overestimate GT by approximately 3 h. For FT durations, MSWX and ERA5 show mean values consistent with the observations, while CMORPH overestimates the mean and ERA5 yields a lower median. Collectively, MSWX and ERA5 underestimate EPHR event development rates, whereas CMORPH underestimates decay rates. The systematic GT overestimation by MSWX and ERA5 likely relates to their precipitation intensity underestimation, as partially depicted EPHR events fail to reach the 50 mm/3 h intensity threshold.
Further statistical analysis of the GT and FT durations for three EPHR circulation types across datasets (Figure 4c–h) reveals distinct characteristics. For SHN-type events (Figure 4c,d), both MSWX and ERA5 demonstrate improved GT representation compared to the other circulation patterns, with mean GT values approximating the observations, though the medians exceed them. CMORPH yields lower mean GT values but matches the observed median. All three datasets overestimate FT durations, with CMORPH showing the closest mean agreement and ERA5 best matching the median. During WSH-type events (Figure 4e,f), MSWX and ERA5 substantially overestimate GT while underestimating FT. CMORPH outperforms both in representing both phases. LLJ-type events exhibit the most pronounced asymmetry (Figure 4g,h), characterized by the shortest mean GT (4.1 h) and longest mean FT (7.9 h), with CMORPH best matching the observations. Systematic GT overestimation by MSWX and ERA5 primarily occurs during WSH-type and LLJ-type events, where CMORPH demonstrates superior performance. However, for SHN-type events, while MSWX and ERA5 still overestimate GT (albeit less severely than in the other types), and CMORPH underestimates GT, all three datasets consistently overestimate FT durations.
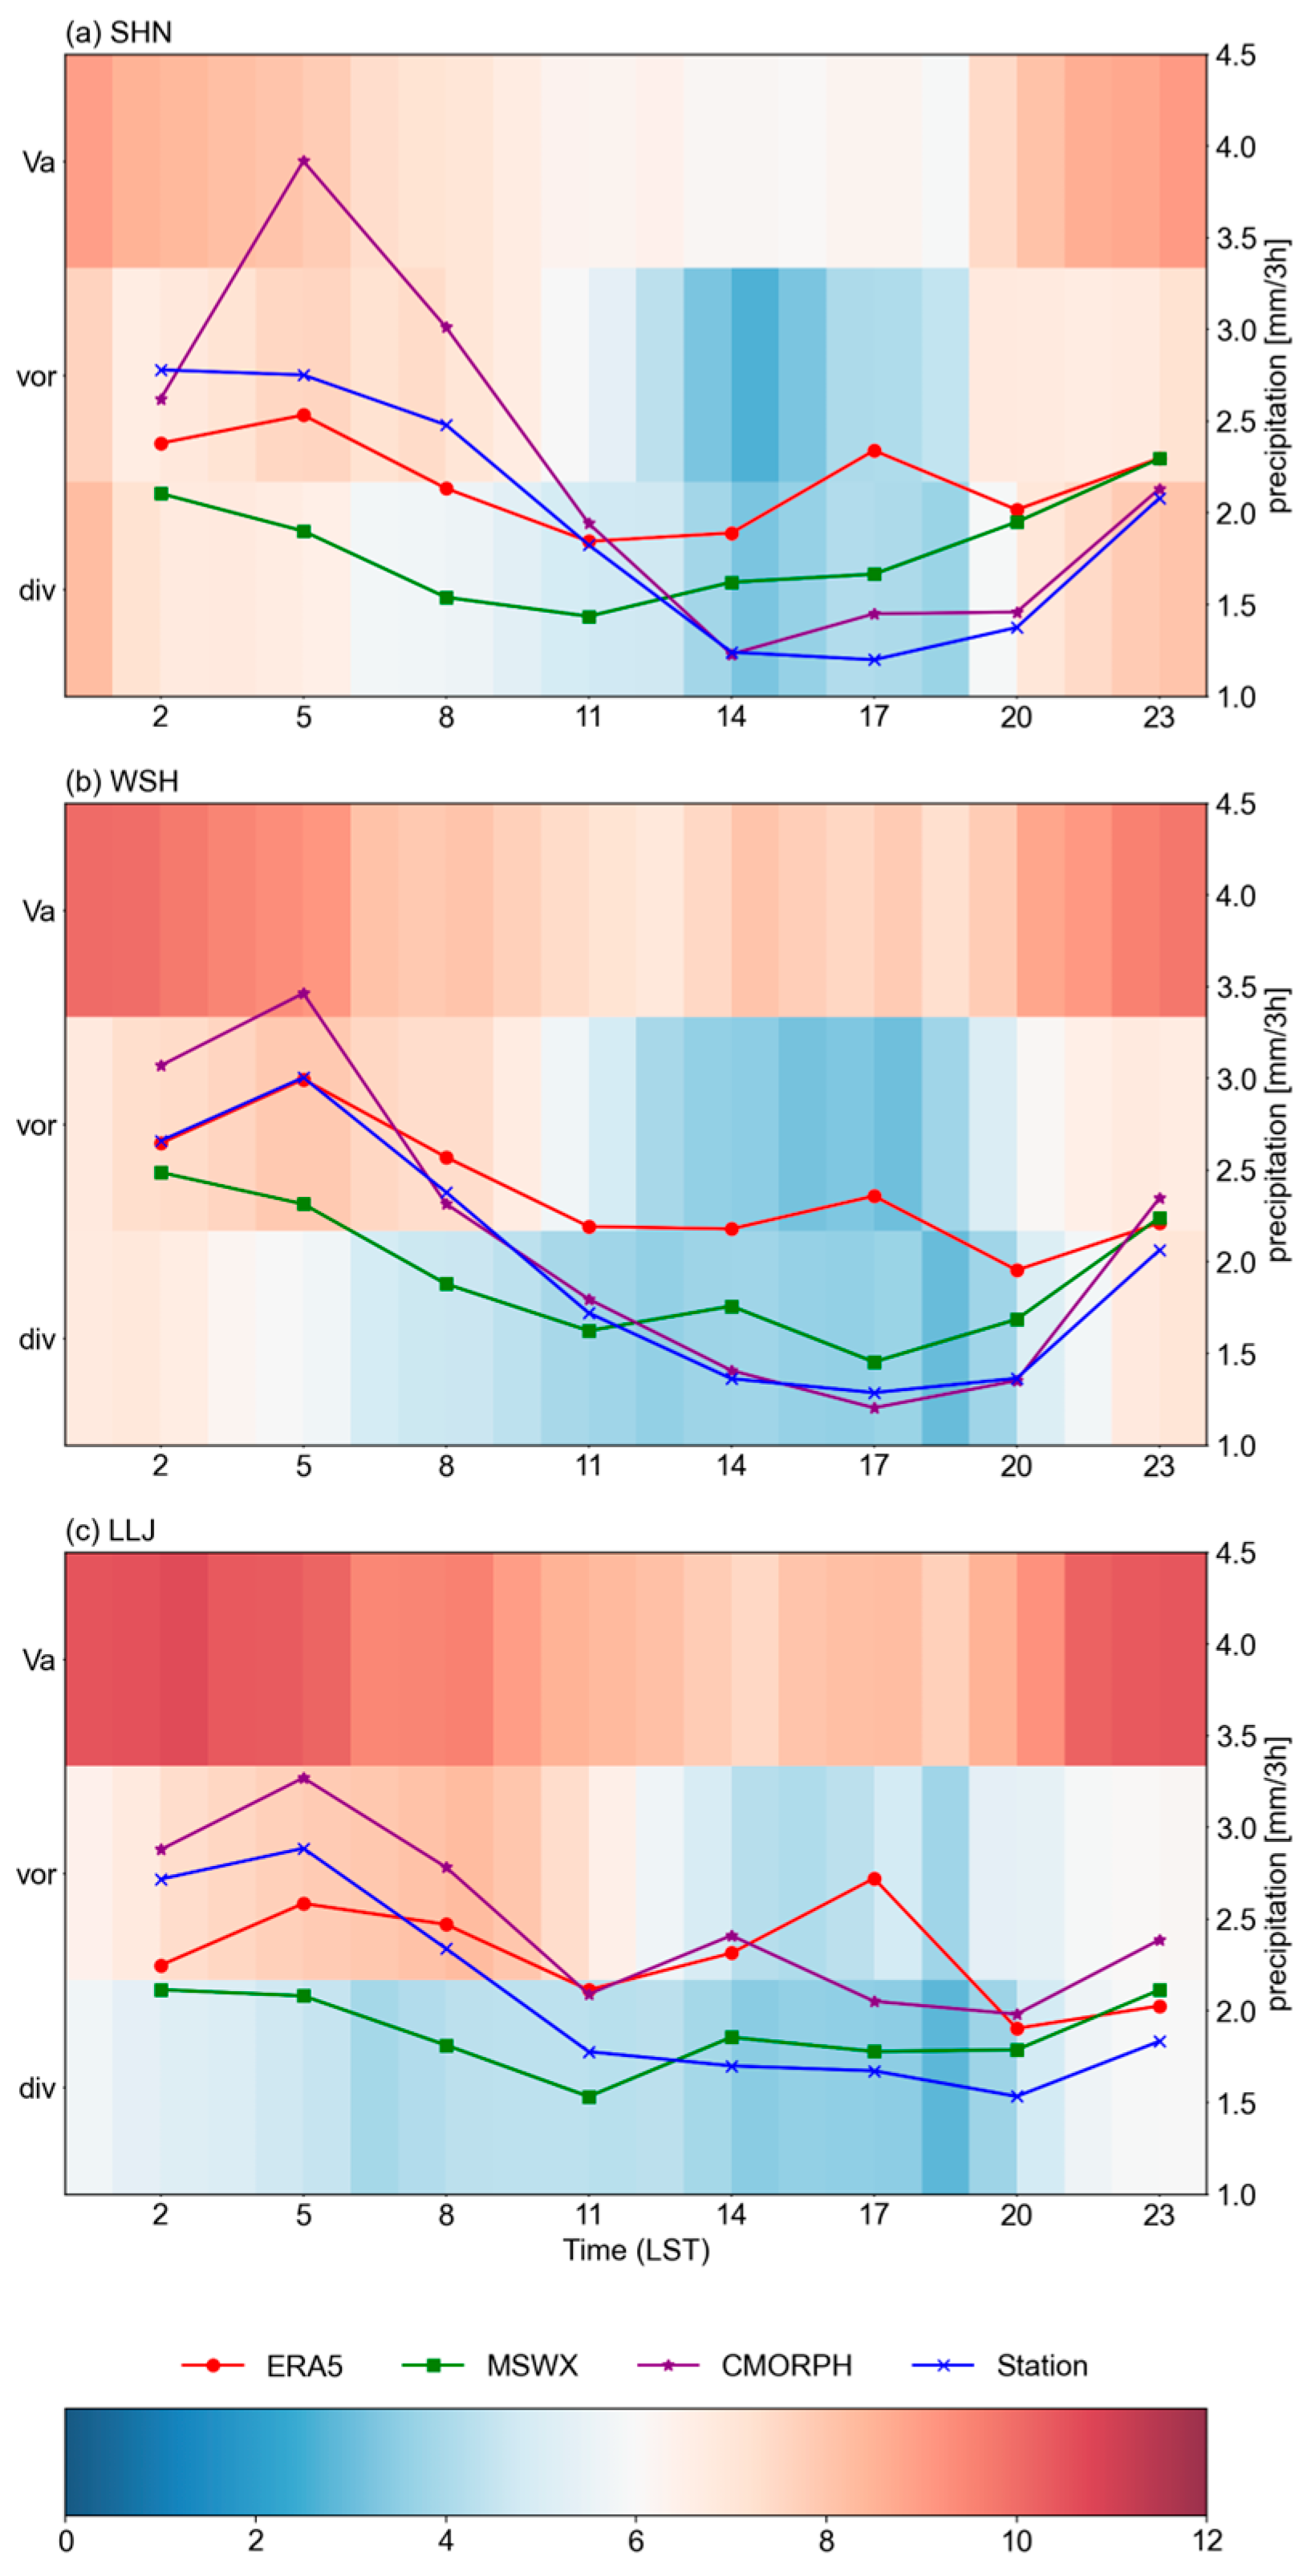
The Barnes filtering method was employed to isolate synoptic-scale and sub-synoptic-scale geopotential height fields, enabling preliminary diagnosis of different-scale weather systems’ impacts on precipitation under three circulation types. In the SHN type, the basin exhibits the strongest nocturnal ageostrophic low-level convergence (Figure 5a), alongside the lowest vortex intensity (Figure 2b and Figure 5a) and weakest low-level ageostrophic winds (Figure 5a). This indicates predominant influence from meso-β systems. For the WSH type, peak rainfall timing coincides with maximum large-scale vorticity intensity, demonstrating primary control by the SWVs. In the LLJ type, the strongest low-level ageostrophic winds occur southeast of the basin. The maximum ageostrophic wind leads the rainfall peak by 3 h, corresponding to the moisture transport duration from the eastern Yunnan–Guizhou Plateau to the basin [40,41]. Notably, the SWV intensity peaks at 0800 LST, while the 3 h rainfall maximum occurs at 0500 LST, confirming that the LLJs primarily modulate the diurnal rainfall variation rather than the SWVs. Although both the WSH and LLJ types exhibit similar diurnal precipitation variations in Figure 5, their precipitation decay phases show distinct differences. The LLJ type displays a longer mean fading time (FT) of 7.9 h, compared to 6.7 h for the WSH type (Figure 4f,h), indicating slower weakening of daytime precipitation in the LLJ type (Figure 5b,c). The CMORPH data exhibit overestimations in the afternoon precipitation (14–20 LST) for the LLJ type (Figure 5c) because it amplifies annual precipitation over steep western terrain (Figure 3p), where infrared algorithms mistakenly identify persistent afternoon stratiform clouds as convective systems.

3.2. Evaluations Among Datasets

The preceding analysis primarily characterized the spatiotemporal distributions and precipitation evolution features of EPHR events under three circulation types in the Sichuan Basin across multiple datasets. To quantitatively evaluate discrepancies between these precipitation products and observational data, this study performed a multi-dataset quantitative evaluation.
The spatial distributions of ME, RMSE, CORR, and TS values comparing ERA5, MSWX, and CMORPH against station observations are presented in Figure 6, with principal focus on the high-precipitation zones in the western, northwestern, and central sectors of the basin. Across the western and northwestern basins, all three datasets systematically underestimate precipitation at multiple stations by approximately −6 mm/3 h. The MSWX product exhibits lower RMSE (~15 mm/3 h) in the Ya’an region (28.5°–30.5°N, 102°–103°E) of the western basin than the other products. CMORPH achieves higher CORR values, exceeding 0.5 at multiple stations, whereas MSWX and ERA5 show inferior performance, with most CORR values below 0.4. Regarding the TS values in the northwestern basin, CMORPH consistently exceeds 0.5, while ERA5 and MSWX exhibit TS values clustered near 0.4 at a considerable number of stations. However, both ERA5 and MSWX attain higher TS values (~0.6) than CMORPH in the Ya’an region.
In the central basin sector, CMORPH exhibits an ME of approximately −2 mm/3 h, whereas ERA5 and MSWX show higher negative biases near −4 mm/3 h. All three datasets display RMSE values exceeding 21 mm/3 h at a small number of stations within this region. For CORR, CMORPH achieves values above 0.5 at multiple stations, with maxima surpassing 0.7, demonstrating superior correlation relative to the other products. Similarly, CMORPH outperforms the others in TS values, containing the largest number of stations exceeding 0.5, followed by ERA5, while MSWX exhibits the poorest performance.
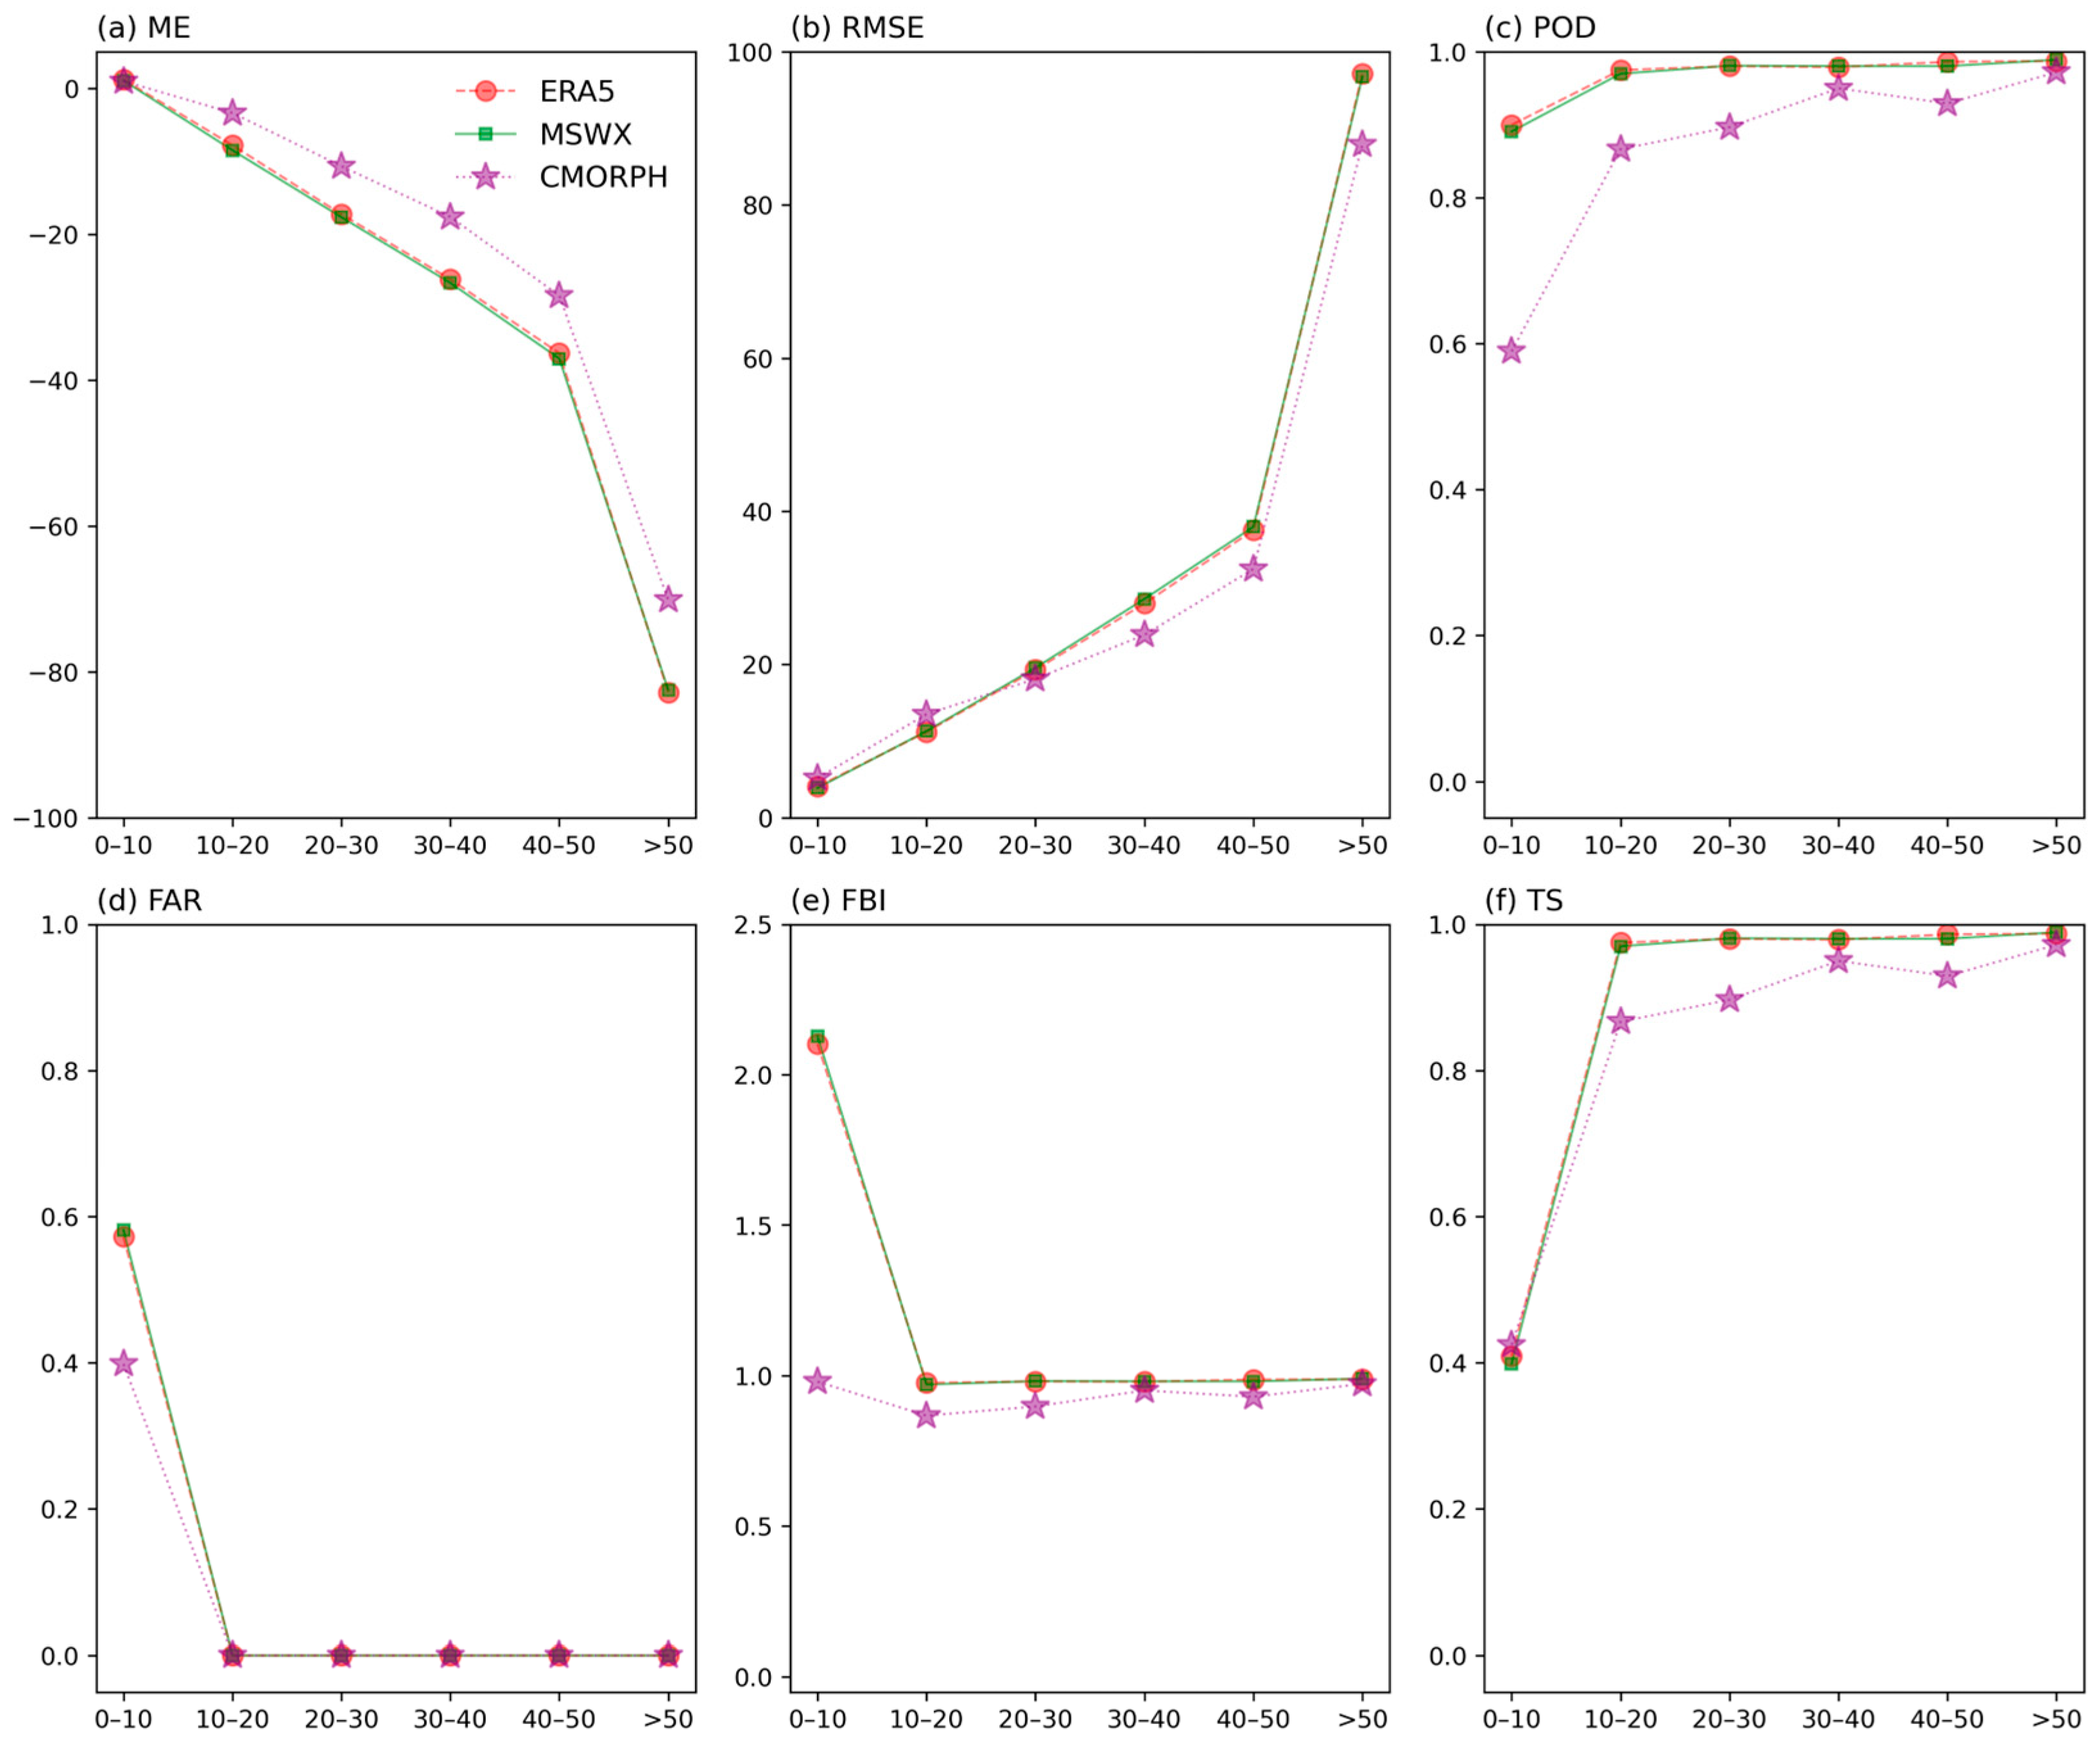
Further evaluation was conducted on the capability of MSWX, ERA5, and CMORPH to depict precipitation across varying intensity thresholds (Figure 7). All three products systematically underestimate precipitation, with errors substantially increasing at thresholds exceeding 40 mm/3 h. Among them, CMORPH demonstrates superior performance in both ME and RMSE. The POD for MSWX and ERA5 approaches unity when precipitation exceeds 10 mm/3 h, whereas CMORPH achieves comparable POD only above 50 mm/3 h. Below 10 mm/3 h, CMORPH maintains POD values under 0.6, indicating detection failure for heavy precipitation at some stations. All datasets exhibit FAR diminishing to zero for precipitation > 10 mm/3 h, confirming the absence of false alarms for heavy precipitation events. CMORPH shows better performance for precipitation < 10 mm/3 h. The FBI for CMORPH remains near 1 across all the thresholds, while the other products exhibit FBI values of ~2.5 below 10 mm/3 h and ~1 above this threshold. At the <10 mm/3 h intensity level, all datasets yield TS values around 0.4. Above 10 mm/3 h, the TS values of CMORPH become notably lower than the other products. Meanwhile, combined with its reduced basin mean POD and lower TS scores in the western basin, this confirms systematic underestimation of EPHR events and underestimation of precipitation frequency in the western basin, consistent with known limitations in satellite precipitation retrievals over steep terrain regions.
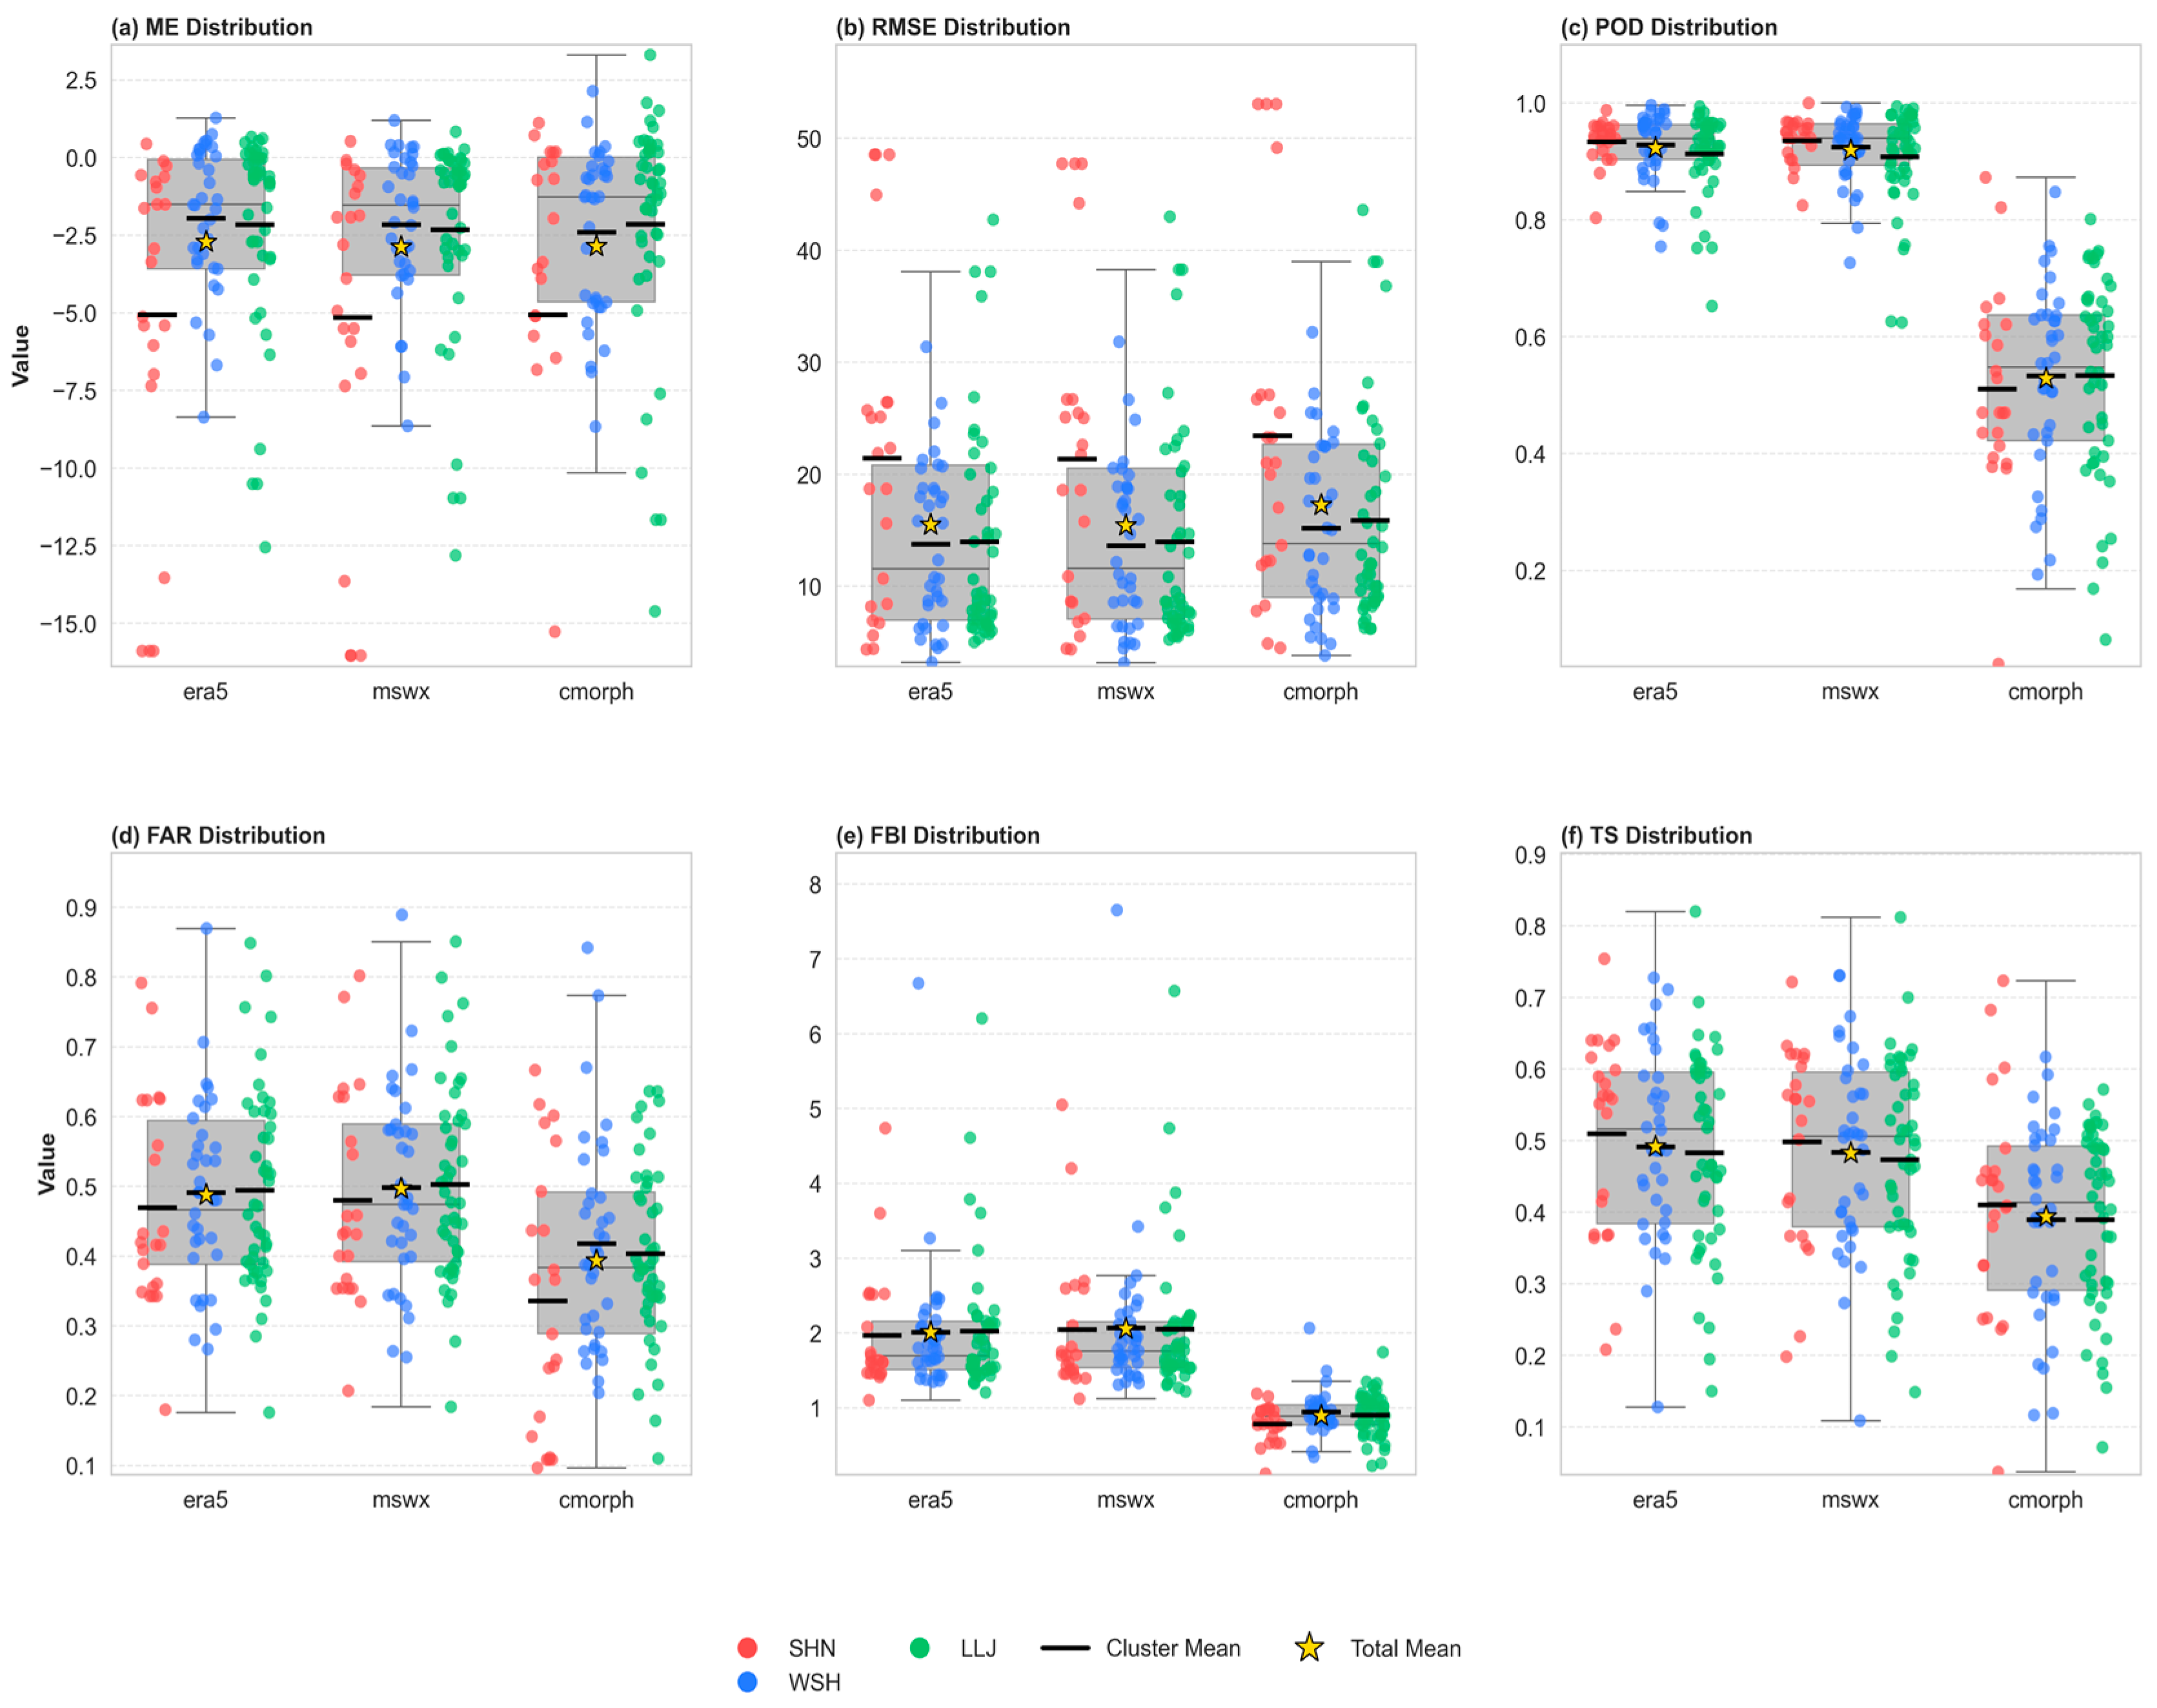
Event frequency distributions for each circulation type were statistically analyzed (Figure 8). All three datasets exhibit more severe underestimation for SHN-type events compared to the other types, with ME near −5 mm/3 h and RMSE around 22 mm/3 h. CMORPH consistently shows POD values below 0.6 across all three circulation types, while MSWX and ERA5 demonstrate slightly lower POD values for LLJ-type events. CMORPH achieves lower average FAR, FBI, and TS values, though all datasets exhibit the lowest FAR values for SHN-type events among the three circulation types. Overall, precipitation intensity in SHN-type events tends to be underestimated, yet these events maintain fewer false alarms. CMORPH displays systematic detection failures for heavy precipitation across all circulation types.
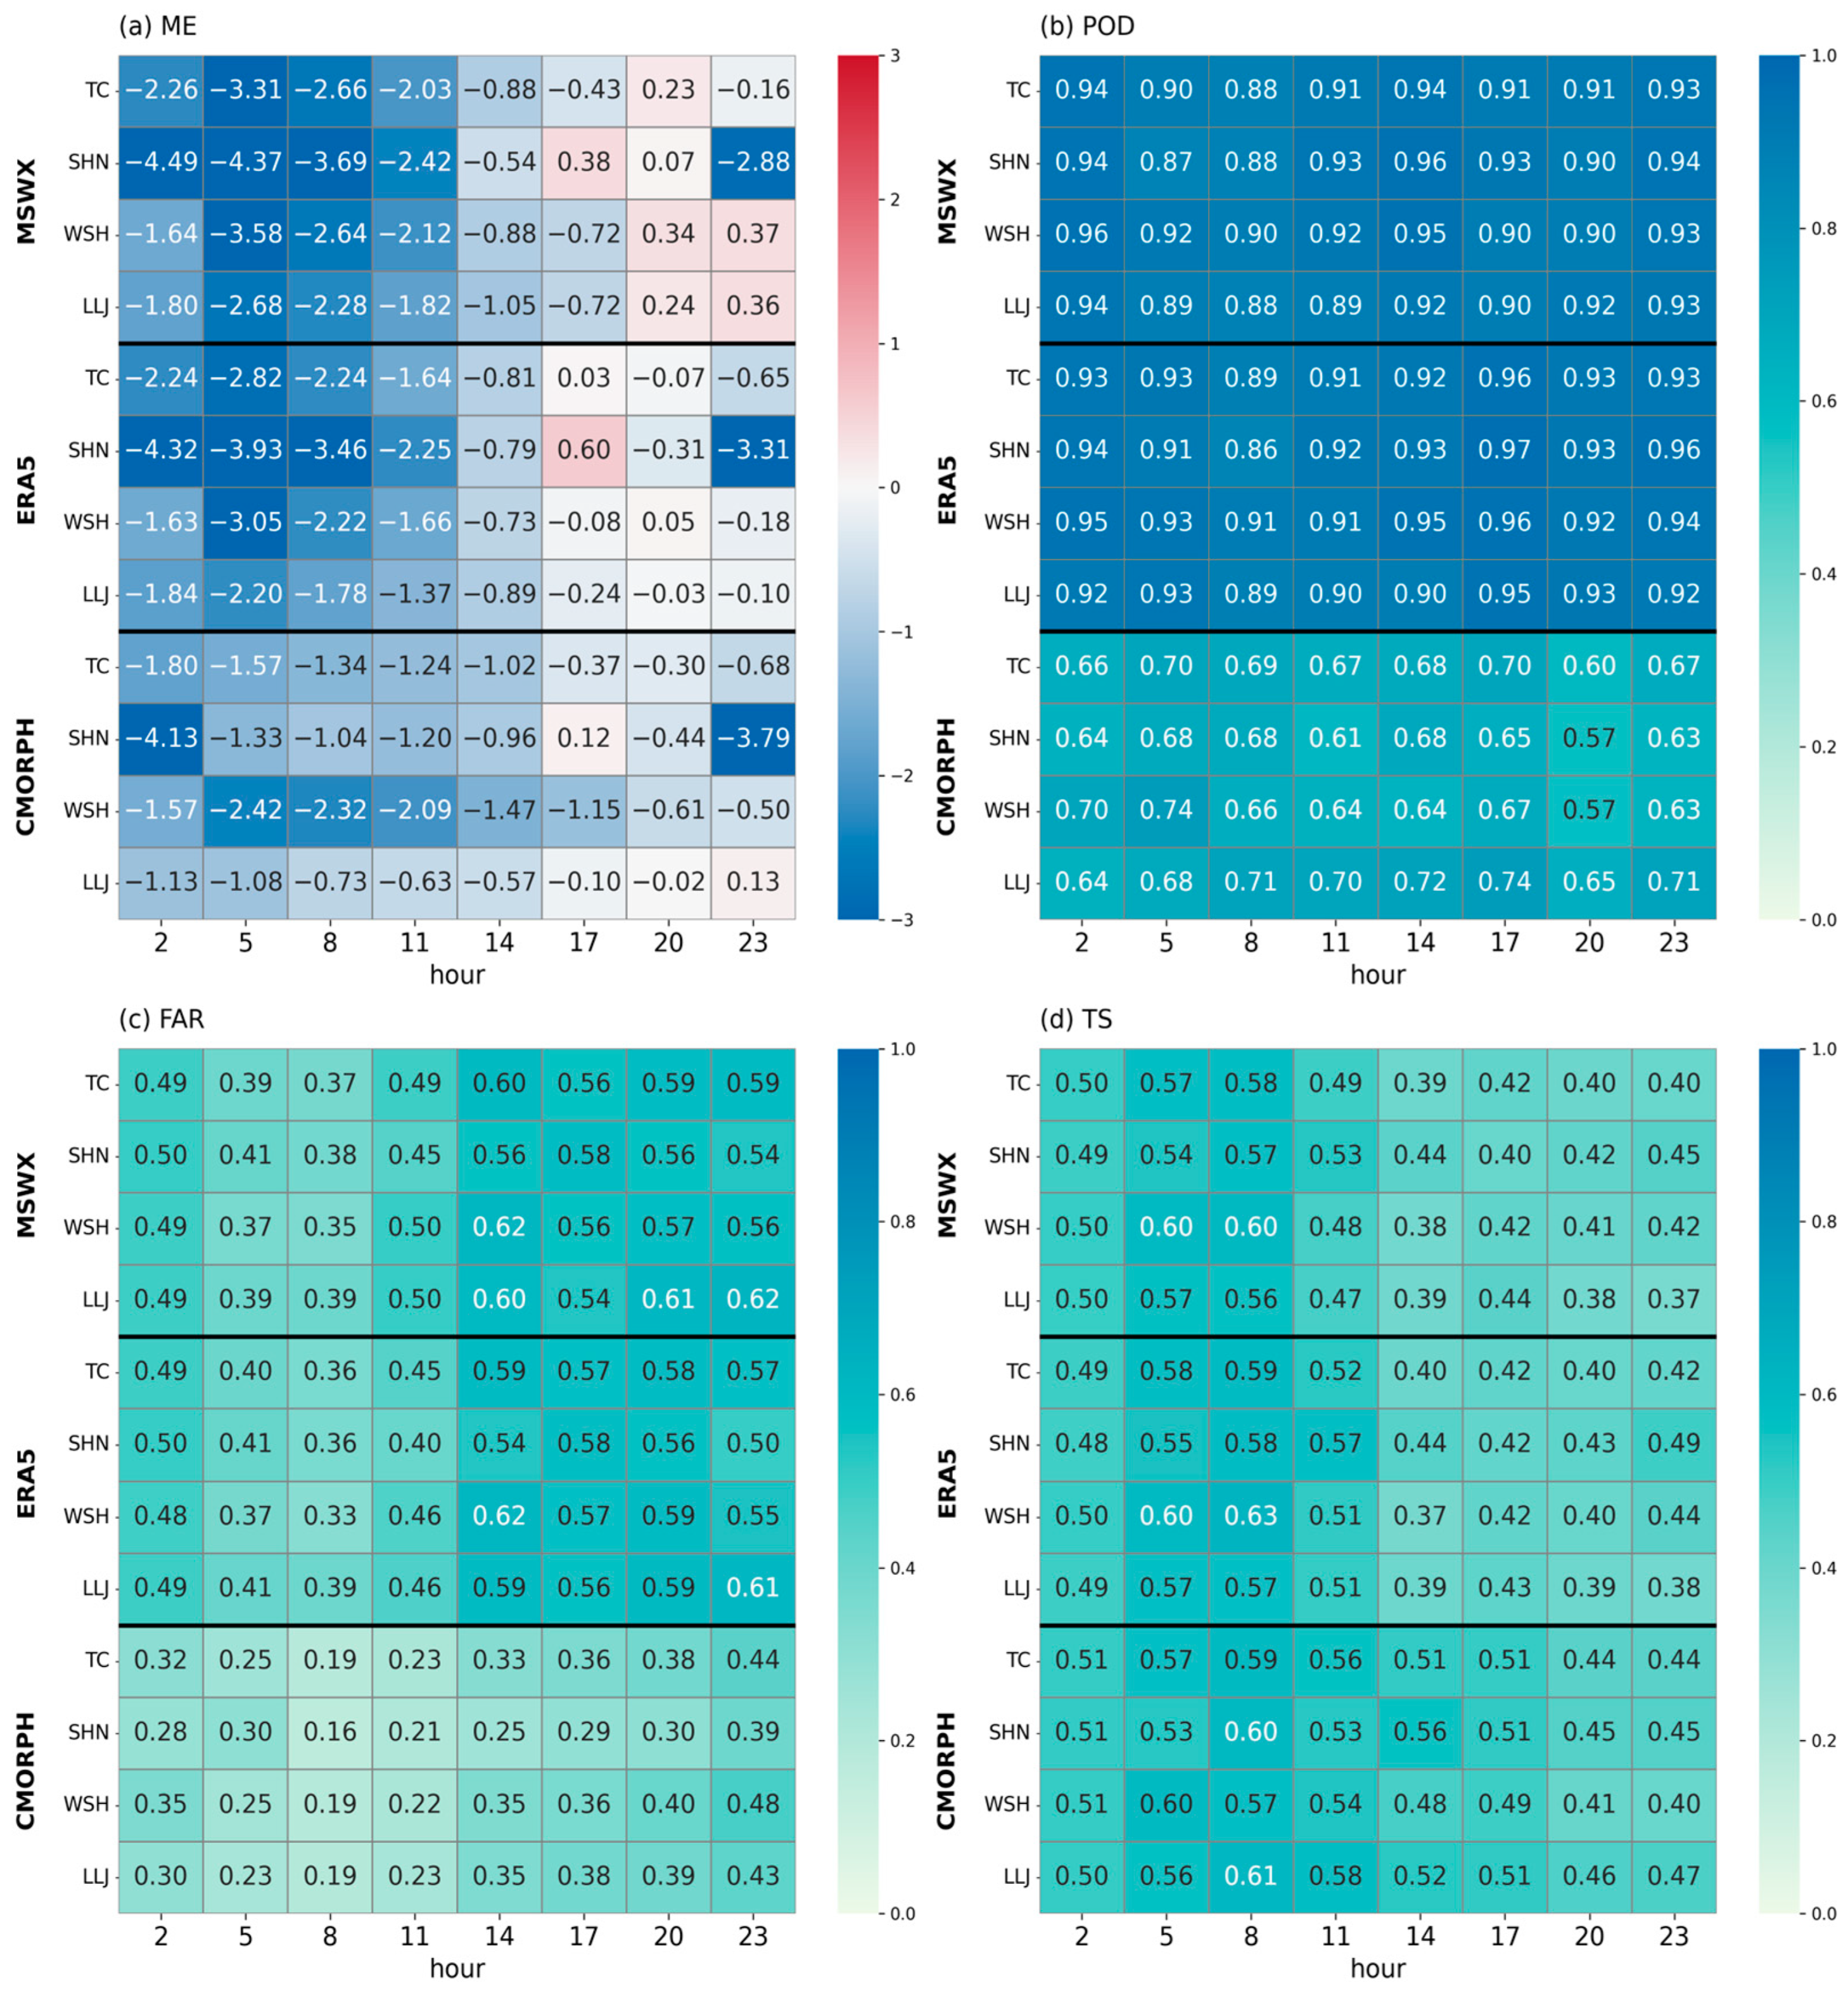
To evaluate the diurnal variations across the three datasets, Figure 9 was obtained by performing a quantitative assessment of rain gauge data against the ERA5, MSWX, and CMORPH datasets at each recording time and averaging the evaluation values across the basin for each recording time. All datasets consistently underestimate nocturnal precipitation while overestimating afternoon precipitation. Although the basin-averaged diurnal precipitation of the CMORPH curve aligns closely with the station observations (Figure 3), its quantitative evaluation at individual stations reveals the most severe overestimation of basin afternoon precipitation, particularly within the SHNS type (Figure 9a). Both MSWX and ERA5 maintain POD scores near 0.9 at all recorded times, whereas CMORPH exhibits generally lower POD values than the other datasets. The POD of CMORPH falls below 0.5 during nighttime, and within the SHNS type, it registers lower values than other circulation types during nighttime (2300–0500 LST) and morning (0800–1100 LST) (Figure 9b). For FAR, CMORPH outperforms the other datasets, especially in the SHNS type. All datasets show higher FAR from afternoon to early night (1400–2300 LST), with MSWX exhibiting FAR ≥0.6 at three time points in the LLJ type (Figure 9c). The TS values of MSWX and ERA5 exceed those of CMORPH during early morning (0500–0800 LST), achieving the highest TS values within the WSH type (Figure 9d).

4. Discussion

This study provides a comprehensive evaluation of the spatiotemporal characteristics, error metrics, and evolution features of precipitation from satellite-based (CMORPH), reanalysis (ERA5), and multi-system integration (MSWX) products during EPHR events in the Sichuan Basin. Furthermore, this research classifies EPHR events into distinct circulation types, enabling detailed analysis of the applicability of each precipitation product across different circulation types. The key findings reveal that CMORPH frequently fails to detect precipitation in the western basin. ERA5 severely overestimates afternoon precipitation, with this bias is exaggerated in LLJ-type events. MSWX exhibits earlier nocturnal precipitation peaks. All precipitation products exhibit their greatest errors in SHN-type events.
Systematic errors in the precipitation products likely arise from their inherent limitations. CMORPH’s underreporting and underestimation in western basins may stem from infrared channel saturation during nocturnal convection, where excessively cold cloud tops can mask orographic precipitation signals [25]. ERA5’s afternoon peak bias could be related to its convective parameterization oversensitivity to solar heating, potentially leading to premature triggering of moisture convergence [42,43]. MSWX’s early precipitation peaks may reflect inadequacies in representing nocturnal low-level jet activity within its driving models. Given that SHN-type events are predominantly influenced by meso-β systems, all three datasets exhibit significantly higher RMSE for this type compared to others, along with inadequate diurnal cycle representations. This pattern reflects persistent limitations of multiple datasets in capturing the microphysical processes and intensity development of convective systems at sub-synoptic scales.
Despite the identified limitations and uncertainties, particularly CMORPH’s under-detection in the western part of the basin and ERA5/MSWX’s intensity underestimation and erroneous diurnal features, satellite precipitation estimates like CMORPH, along with high-resolution integrated products like MSWX, offer significant value for EPHR studies in the Sichuan Basin. Our evaluation demonstrates that CMORPH provides superior accuracy (higher CORR and TS values, lower ME) and much finer spatial resolution (8 km) and temporal resolution (30 min) for characterizing EPHRs over the central Sichuan Basin. CMORPH’s particular strength in capturing the critical central basin precipitation core, and its good performance during WSH and LLJ types, suggests its utility for improving understanding of EPHR dynamics and associated impacts. Additionally, the MSWX product demonstrates improved representation of afternoon precipitation peaks compared to ERA5 while maintaining its high POD characteristic. Therefore, the application of high-resolution satellite-based (CMORPH) and advanced integrated (MSWX) precipitation products offers substantial promise for enhancing ecological and hydrological studies related to EPHRs in the Sichuan Basin and similar complex terrain regions, complementing traditional gauge data and model outputs.
To advance our understanding of the fundamental causes of precipitation product errors, future investigations will focus on assessing the influence of various topographic factors on integrated product performance.

5. Conclusions

This study establishes a circulation classification framework to evaluate precipitation products during EPHR events in the Sichuan Basin. The principal conclusions are outlined below.
  • Regarding the spatiotemporal distribution and evolution characteristics of all EPHR events, ERA5 and CMORPH accurately depict the basin-averaged peak 3 h precipitation around 0500 LST, consistent with rain gauge observations. In contrast, MSWX produces an earlier peak at 0200 LST. ERA5 overestimates afternoon precipitation, generating a secondary peak around 1700 LST. Both ERA5 and MSWX underestimate nocturnal precipitation intensity across the basin, while CMORPH achieves better consistency with station observations. The primary regions of heavy accumulated precipitation are located in the western basin according to CMORPH and MSWX, whereas ERA5 indicates a northwestern concentration. Only CMORPH capably captures precipitation over the central basin, though it still underestimates intensity. CMORPH outperforms the other datasets in describing precipitation development despite overestimating GT by approximately 1 h on average. For precipitation decay phases, MSWX most closely reproduces the FT distribution observed by rain gauges.
  • Analysis of EPHR event characteristics across the three circulation types reveals that in SHN-type events, CMORPH depicts peak precipitation around 0500 LST, exhibiting a 3 h delay compared to observations, with accumulated precipitation primarily concentrated in the western basin. For WSH-type events, CMORPH produces superior spatial distribution and diurnal variation representations relative to the other datasets, though it underestimates precipitation magnitude. During LLJ-type events, CMORPH underestimates precipitation in the northwestern basin. While CMORPH effectively captures precipitation evolution in the WSH and LLJ types, it underestimates the GT for SHN-type precipitation. MSWX consistently exhibits the lowest mean precipitation intensity across all circulation types. ERA5 shows a distinct peak around 17 LST, exceeding its nocturnal peak intensity during LLJ-type events. Both ERA5 and MSWX overestimate precipitation GT in WSH- and LLJ-type events and FT in SHN-type events.
  • CMORPH demonstrates significantly higher CORR than the other datasets at most stations. However, its TS in the western basin is approximately 0.1 lower than the other products at several stations. The basin-averaged POD and TS values for CMORPH remain below those of the other datasets across all precipitation thresholds, confirming systematic detection failures for certain precipitation events in the western basin. This under-detection occurs consistently across all circulation types and may stem from satellite retrieval limitations: precipitation mechanisms influenced by cloud shielding and orographic lifting in the western basin, coupled with reduced observational capability for nighttime cloud-top brightness temperatures in infrared satellite data. While MSWX and ERA5 exhibit comparable performance metrics across various precipitation thresholds and tend to generate more false alarms during low-intensity precipitation periods, regional differences exist. Specifically, MSWX achieves lower RMSE than ERA5 at some stations in the western basin, while ERA5 produces higher TS values in the south-central basin region.

Author Contributions

Conceptualization, J.C. and C.D.; methodology, C.L. and J.C.; software, C.L.; validation, C.L., J.C., and C.D.; formal analysis, C.L. and J.C.; investigation, C.L. and J.C.; resources, J.C.; data curation, C.L. and C.D.; writing—original draft preparation, C.L. and J.C.; writing—review and editing, J.C. and C.D.; visualization, C.L. and F.Q.; supervision, project administration and funding acquisition, J.C. and C.D. All authors have read and agreed to the published version of the manuscript.

Funding

This work was supported by the National Natural Science Foundation of China (Grants U2242202 and 42475007) and the Jiangsu SC Project (202230553).

Data Availability Statement

Datasets for identified extremely heavy flash rainfalls are available upon request. Please contact Cao J. at caoj@nuist.edu.cn.

Acknowledgments

We acknowledge the High-Performance Computing Center of NUIST for their support. The authors would like to thank the two anonymous reviewers for their constructive suggestions that greatly improve and complement the representations of this study.

Conflicts of Interest

The authors declare no conflicts of interest.

References

  1. Li, Q.; Wu, F.; Yang, S.; Cui, X.; Zhang, Y.; Zhang, W. Statistics of warm-season hourly extreme precipitation in the Sichuan Basin, China during 2002–2021. Theor. Appl. Climatol. 2024, 155, 4465–4480. [Google Scholar] [CrossRef]
  2. Zhao, R.; Chen, B.; Zhang, W.; Yang, S.; Xu, X. Formation mechanisms of persistent extreme precipitation events over the eastern periphery of the Tibetan Plateau: Synoptic conditions, moisture transport and the effect of steep terrain. Atmos. Res. 2024, 304, 107341. [Google Scholar] [CrossRef]
  3. Xia, F.; Huang, X.; Fei, J.; Wang, J.; Cheng, X.; Zhang, C. Influence of Synoptic Pattern on the Spatiotemporal Features and Diurnal Variation of Extremely Persistent Heavy Rainfall over the Sichuan Basin, China. Adv. Atmos. Sci. 2025, 42, 527–550. [Google Scholar] [CrossRef]
  4. Xu, X.; Huang, A.; Zhang, Y.; Yang, X.; Zhao, W. Impact of Large-Scale Topography Surrounding the Sichuan Basin on Its Regional Precipitation. J. Geophys. Res. Atmos. 2025, 130, e2024JD042239. [Google Scholar] [CrossRef]
  5. Trenberth, K. Uncertainty in hurricanes and global warming. Science 2005, 308, 1753–1754. [Google Scholar] [CrossRef] [PubMed]
  6. Min, S.K.; Zhang, X.; Zwiers, F.W.; Hegerl, G.C. Human contribution to more-intense precipitation extremes. Nature 2011, 470, 378–381. [Google Scholar] [CrossRef]
  7. Donat, M.; Lowry, A.; Alexander, L.; O’Gorman, P.A.; Maher, N. More extreme precipitation in the world’s dry and wet regions. Nat. Clim. Change 2016, 6, 508–513. [Google Scholar] [CrossRef]
  8. Li, X.; Zhang, K.; Bao, H.; Zhang, H. Climatology and changes in hourly precipitation extremes over China during 1970–2018. Sci. Total Environ. 2022, 839, 156297. [Google Scholar] [CrossRef]
  9. Xiang, Y.; Li, Z.; Wu, Y.; Wang, K.; Yang, J. Spatiotemporal Characteristics of Hourly-Scale Extreme Precipitation in the Sichuan Basin and Its Impact on Normalized Difference Vegetation Index Values. Atmosphere 2023, 14, 1719. [Google Scholar] [CrossRef]
  10. Liu, Y.; Wang, Z.; Deng, C.; Zhai, D.; Han, Y.; Pang, Y.; Zhou, Y.; Luo, F. Climatic characteristics of hourly extreme precipitation during the warm season in Chongqing. Geomatics. Nat. Hazards Risk 2024, 15, 2278893. [Google Scholar] [CrossRef]
  11. Sheridan, P.; Xu, A.; Li, J.; Furtado, K. Use of targeted orographic smoothing in very high resolution simulations of a downslope windstorm and rotor in a sub-tropical highland location. Adv. Atmos. Sci. 2023, 40, 2043–2062. [Google Scholar] [CrossRef]
  12. Jiang, R.; Cui, X.; Lin, J.; Tian, J. 40-Year Statistics of Warm-Season Extreme Hourly Precipitation over Southwest China. J. Appl. Meteor. Climatol. 2023, 62, 1891–1908. [Google Scholar] [CrossRef]
  13. Zhang, C.; Huang, X.; Fei, J.; Luo, X.; Zhou, Y. Spatiotemporal characteristics and associated synoptic patterns of extremely persistent heavy rainfall in southern China. J. Geophys. Res. Atmos. 2021, 126, e2020JD033253. [Google Scholar] [CrossRef]
  14. Liu, H.; Huang, X.; Fei, J.; Zhang, C.; Cheng, X. Spatiotemporal features and associated synoptic patterns of extremely persistent heavy rainfall over China. J. Geophys. Res. Atmos. 2022, 127, e2022JD036604. [Google Scholar] [CrossRef]
  15. Wang, W.; Lin, H.; Chen, N.; Chen, Z. Evaluation of multi-source precipitation products over the Yangtze River Basin. Atmos. Res. 2021, 249, 105287. [Google Scholar] [CrossRef]
  16. Tang, X.; Li, H.; Qin, G.; Huang, Y.; Qi, Y. Evaluation of Satellite-Based Precipitation Products over Complex Topography in Mountainous Southwestern China. Remote Sens. 2023, 15, 473. [Google Scholar] [CrossRef]
  17. Wu, H.; Yong, B.; Shen, Z. Research on the Monitoring Ability of Fengyun-Based Quantitative Precipitation Estimates for Capturing Heavy Precipitation: A Case Study of the “7·20” Rainstorm in Henan Province, China. Remote Sens. 2023, 15, 2726. [Google Scholar] [CrossRef]
  18. Pang, Z.; Zhang, Y.; Shi, C.; Gu, J.; Yang, Q.; Pan, Y.; Wang, Z.; Xu, B. A Comprehensive Assessment of Multiple High-Resolution Precipitation Grid Products for Monitoring Heavy Rainfall during the “7.20” Extreme Rainstorm Event in China. Remote Sens. 2023, 15, 5255. [Google Scholar] [CrossRef]
  19. Zhang, W.; Di, Z.; Liu, J.; Zhang, S.; Liu, Z.; Wang, X.; Sun, H. Evaluation of Five Satellite-Based Precipitation Products for Extreme Rainfall Estimations over the Qinghai-Tibet Plateau. Remote Sens. 2023, 15, 5379. [Google Scholar] [CrossRef]
  20. Zhang, C.; Chen, X.; Shao, H.; Chen, S.; Liu, T.; Chen, C.; Ding, Q.; Du, H. Evaluation and Intercomparison of High-Resolution Satellite Precipitation Estimates—GPM, TRMM, and CMORPH in the Tianshan Mountain Area. Remote Sens. 2018, 10, 1543. [Google Scholar] [CrossRef]
  21. Sharma, S.; Chen, Y.; Zhou, X.; Yang, K.; Li, X.; Niu, X.; Hu, X.; Khadka, N. Evaluation of GPM-Era Satellite Precipitation Products on the Southern Slopes of the Central Himalayas Against Rain Gauge Data. Remote Sens. 2020, 12, 1836. [Google Scholar] [CrossRef]
  22. Du, J.; Yu, X.; Zhou, L.; Ren, Y.; Ao, T. Precipitation Characteristics across the Three River Headwaters Region of the Tibetan Plateau: A Comparison between Multiple Datasets. Remote Sens. 2023, 15, 2352. [Google Scholar] [CrossRef]
  23. Joyce, R.J.; Xie, P. Kalman filter–based CMORPH. J. Hydrometeorol. 2011, 12, 1547–1563. [Google Scholar] [CrossRef]
  24. Joyce, R.J.; Janowiak, J.E.; Arkin, P.A.; Xie, P. CMORPH: A method that produces global precipitation estimates from passive microwave and infrared data at high spatial and temporal resolution. J. Hydrometeorol. 2004, 5, 487–503. [Google Scholar] [CrossRef]
  25. Beck, H.E.; Van Dijk, A.I.; Larraondo, P.R.; McVicar, T.R.; Pan, M.; Dutra, E.; Miralles, D.G. MSWX: Global 3-Hourly 0.1° Bias-Corrected Meteorological Data Including Near-Real-Time Updates and Forecast Ensembles. Bull. Am. Meteorol. Soc. 2022, 103, E710–E732. [Google Scholar] [CrossRef]
  26. Beck, H.E.; Pan, M.; Roy, T.; Weedon, G.P.; Pappenberger, F.; van Dijk, A.I.J.M.; Huffman, G.J.; Adler, R.F.; Wood, E.F. Daily evaluation of 26 precipitation datasets using Stage-IV gauge-radar data for the CONUS. Hydrol. Earth Syst. Sci. 2019, 23, 207–224. [Google Scholar] [CrossRef]
  27. Cheng, L.; Shen, R.; Shi, C.; Bai, L.; Yang, Y. Evaluation and Verification of CMORPH and TRMM 3B42 Precipitation Estimation Products. Meteorol. Mon. 2014, 40, 1372–1379. (In Chinese) [Google Scholar] [CrossRef]
  28. Hafizi, H.; Sorman, A.A. Integrating Meteorological Forcing from Ground Observations and MSWX Dataset for Streamflow Prediction under Multiple Parameterization Scenarios. Water 2022, 14, 2721. [Google Scholar] [CrossRef]
  29. Mo, C.; Wan, X.; Lei, X.; Chen, X.; Ma, R.; Huang, Y.; Sun, G. Hydrometeorological Insights into the Forecasting Performance of Multi-Source Weather over a Typical Hill-Karst Basin, Southwest China. Atmosphere 2024, 15, 236. [Google Scholar] [CrossRef]
  30. Huang, X.; Zhang, C.; Fei, J.; Cheng, X.; Ding, J.; Liu, H. Uplift mechanism of coastal extremely persistent heavy rainfall (EPHR): The key role of low-level jets and ageostrophic winds in the boundary layer. Geophys. Res. Lett. 2022, 49, e2021GL096029. [Google Scholar] [CrossRef]
  31. Xia, F.; Huang, X.; Fei, J.; Wang, J.; Cheng, X.; Zhang, C. Mechanisms of Ageostrophic Wind Convergence in the Boundary Layer of Coastal Warm-Sector Extreme Heavy Rainfall in South China. J. Geophys. Res. Atmos. 2023, 128, e2022JD038472. [Google Scholar] [CrossRef]
  32. Kohonen, T. Self-Organizing Maps; Springer: Berlin/Heidelberg, Germany, 2001; pp. 245–261. [Google Scholar] [CrossRef]
  33. Stryhal, J.; Beranová, R.; Huth, R. Representation of Modes of Atmospheric Circulation Variability by Self-Organizing Maps: A Study Using Synthetic Data. J. Geophys. Res. Atmos. 2023, 128, e2023JD039183. [Google Scholar] [CrossRef]
  34. Barnes, S.L. A technique for maximizing details in numerical weather map analysis. J. Appl. Meteor. 1964, 3, 396–409. [Google Scholar] [CrossRef]
  35. Koch, S.E.; DesJardins, M.; Kocin, P.J. An interactive Barnes objective map analysis scheme for use with satellite and conventional data. J. Appl. Meteor. Climatol. 1983, 22, 1487–1503. [Google Scholar] [CrossRef]
  36. Xu, X.; Xue, M.; Wang, Y.; Huang, H. Mechanisms of secondary convection within a Mei-Yu frontal mesoscale convective system in eastern China. J. Geophys. Res. Atmos. 2017, 122, 47–64. [Google Scholar] [CrossRef]
  37. Xue, M.; Luo, X.; Zhu, K.; Sun, Z.; Fei, J. The controlling role of boundary layer inertial oscillations in Meiyu frontal precipitation and its diurnal cycles over China. J. Geophys. Res. Atmos. 2018, 123, 5090–5115. [Google Scholar] [CrossRef]
  38. Hua, S.; Xu, X.; Chen, B. Influence of multiscale orography on the initiation and maintenance of a precipitating convective system in North China: A case study. J. Geophys. Res. Atmos. 2020, 125, e2019JD031731. [Google Scholar] [CrossRef]
  39. Zeng, W.; Chen, G.; Du, Y.; Wen, Z. Diurnal variations of low-level winds and precipitation response to large-scale circulations during a heavy rainfall event. Mon. Weather Rev. 2019, 147, 3981–4004. [Google Scholar] [CrossRef]
  40. Zhang, Y.; Xue, M.; Zhu, K.; Zhou, B. What is the main cause of diurnal variation and nocturnal peak of summer precipitation in Sichuan Basin, China? The key role of boundary layer low-level jet inertial oscillations. J. Geophys. Res. Atmos. 2019, 124, 2643–2664. [Google Scholar] [CrossRef]
  41. Xia, R.; Luo, Y.; Zhang, D.L.; Li, M.; Bao, X.; Sun, J. On the diurnal cycle of heavy rainfall over the Sichuan Basin during 10–18 August 2020. Adv. Atmos. Sci. 2021, 38, 2183–2200. [Google Scholar] [CrossRef]
  42. Chen, X.; Cao, D.; Liu, Y.; Xu, X.; Ma, Y. An observational view of rainfall characteristics and evaluation of ERA5 diurnal cycle in the Yarlung Tsangbo Grand Canyon, China. Q. J. R. Meteorol. Soc. 2023, 149, 1459–1472. [Google Scholar] [CrossRef]
  43. Su, J.; Wang, X.; Ren, W.; Liu, W. Decomposing precipitation biases into frequency and intensity components: Comparative analysis of IMERG and ERA5-Land over the Tibetan Plateau. Atmos. Res. 2025, 326, 108320. [Google Scholar] [CrossRef]
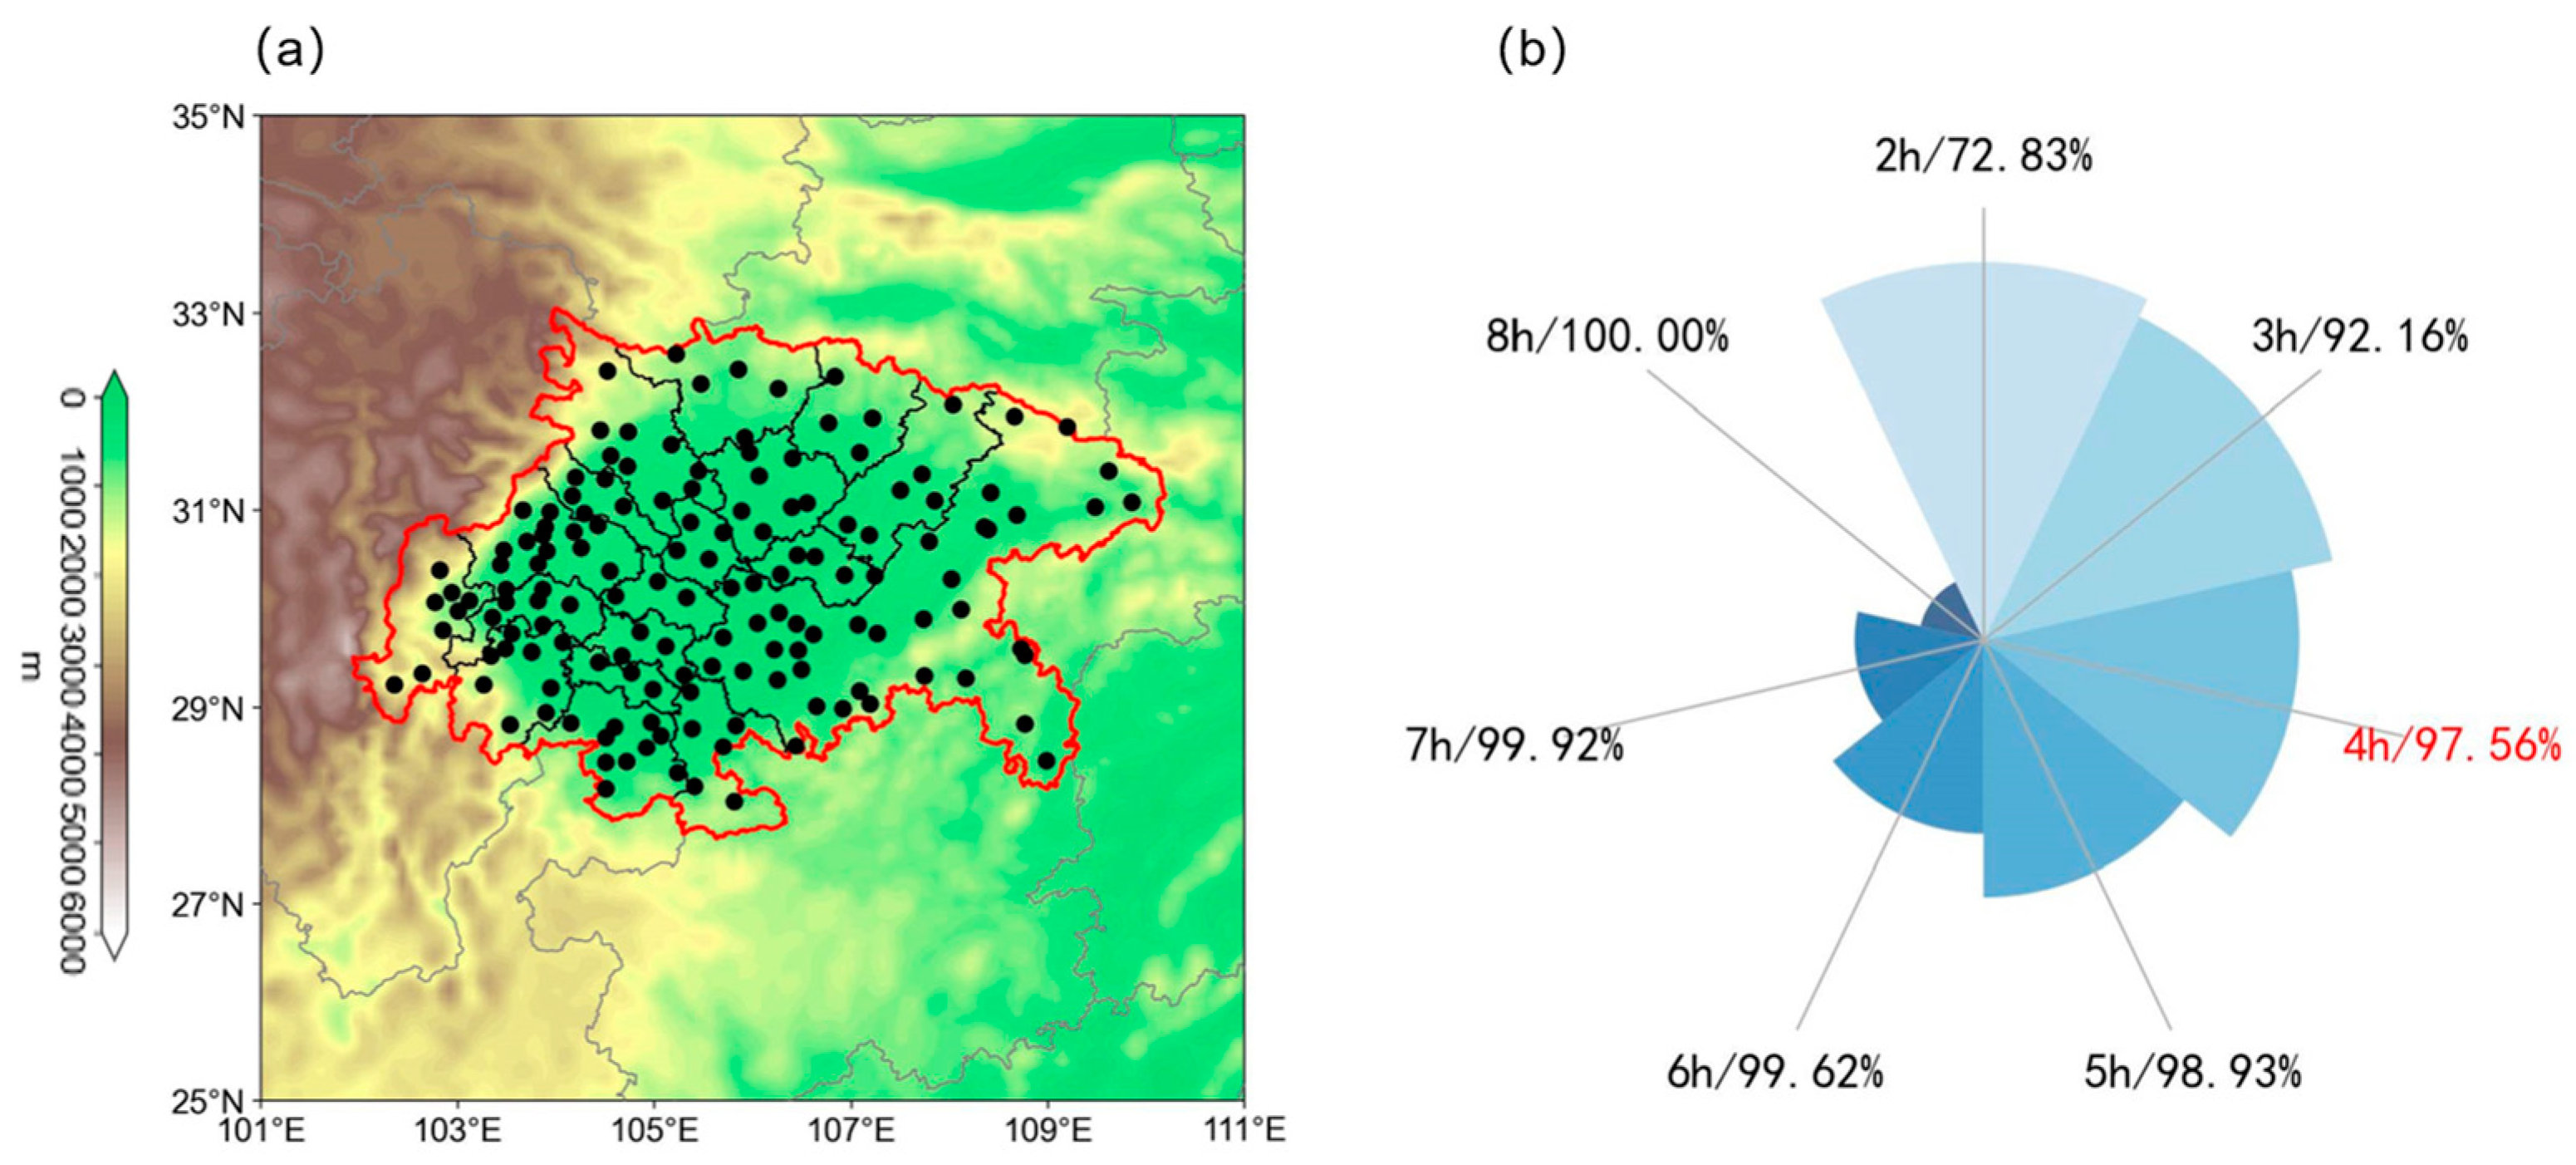
Figure 1. (a) Study area and station distribution. (b) Frequency distribution of the duration of heavy rainfalls. The red highlighted portion indicates the selected threshold.
Remotesensing 17 02761 g001
Figure 2. Composite fields of TC and the SHN type, WSH type, and LLJ type for (ad) 700 hPa, (eh) 500 hPa, and (il) 200 hPa geopotential height (contours; dagpm), wind vectors (vectors; m/s), and geopotential height anomalies (color shading) in EPHRs over the Sichuan Basin. The hatched grids indicate regions with geopotential height anomalies exceeding the 99% significance level by the significance test. Terrain is shaded in gray, the basin outline is delineated by a thick brown line, and the 5880 gpm contour is marked by a thick red line.
Remotesensing 17 02761 g002
Figure 3. Spatial distributions of annual mean precipitation and diurnal variations in precipitation intensity from 2010 to 2024 based on multiple precipitation datasets during EPHR events for the (ae) TC type, (fj) SHN type, (ko) WSH type, and (pt) LLJ type.
Remotesensing 17 02761 g003
Figure 4. Box plots of occurrence frequencies for GT and FT from 2010 to 2024 based on multiple precipitation datasets during EPHR events for the (a,b) TC type, (c,d) SHN type, (e,f) WSH type, and (g,h) LLJ type. Median values are marked by horizontal lines. Arithmetic means are marked by solid dots, with shaded areas representing kernel density estimation (KDE). The vertical axis represents time in the unit of hours (h).
Remotesensing 17 02761 g004
Figure 5. Diurnal variations in geostrophic vorticity (10−5 s−1) and ageostrophic divergence (−5 × 10⁻⁵ s−1) at 850 hPa within the basin, and ageostrophic wind (m/s) in the eastern Yunnan–Guizhou Plateau (26°–29°N, 107°–109°E) for the (a) SHN type, (b) WSH type, and (c) LLJ type.
Remotesensing 17 02761 g005
Figure 6. Spatial distributions of ME, RMSE, CORR, and TS values for site evaluation during EPHR events in the (ad) ERA5, (eh) MSWX, and (il) CMORPH datasets.
Remotesensing 17 02761 g006
Figure 7. Statistics of (a) ME, (b) RMSE, (c) POD, (d) FAR, (e) FBI, and (f) TS values across precipitation thresholds for site evaluation during EPHR events in the ERA5, MSWX, and CMORPH datasets.
Remotesensing 17 02761 g007
Figure 8. Box plots of (a) ME, (b) RMSE, (c) POD, (d) FAR, (e) FBI, and (f) TS values for site evaluation in the ERA5, MSWX, and CMORPH datasets for the SHN type, WSH type, and LLJ type.
Remotesensing 17 02761 g008
Figure 9. Heatmaps of (a) ME, (b) POD, (c) FAR, and (d) TS values at recorded times (0200, 0500, 0800, 1100, 1400, 1700, 2000, 2300 LST) for site evaluation across the TC, SHN type, WSH type, and LLJ type in the ERA5, MSWX, and CMORPH datasets.
Remotesensing 17 02761 g009
Table 1. Brief information on four datasets.
Dataset NameSpatiotemporal
Resolution
Data SourcesTime Span
Rain gauge-, 1 hNMIC2003 to present
CMORPH8 km × 8 km, 0.5 hNOAA1998 to present
MSWX-Past0.1° × 0.1°, 3 hGloH2O1979 to present
ERA50.25° × 0.25°, 1 hECMWF1940 to present
Disclaimer/Publisher’s Note: The statements, opinions and data contained in all publications are solely those of the individual author(s) and contributor(s) and not of MDPI and/or the editor(s). MDPI and/or the editor(s) disclaim responsibility for any injury to people or property resulting from any ideas, methods, instructions or products referred to in the content.