Article

Cloud-Based Solutions for Monitoring Coastal Ecosystems and the Prioritization of Restoration Efforts Across Belize

1
Earth System Science Center, The University of Alabama in Huntsville, Huntsville, AL 35805, USA
2
SERVIR Science Coordination Office, NASA Marshall Space Flight Center, Huntsville, AL 35808, USA
3
Belize Forest Department, Ministry of Sustainable Development Climate Change and Solid Waste Management, Belmopan, Belize
*
Author to whom correspondence should be addressed.
Remote Sens. 2025, 17(20), 3396; https://doi.org/10.3390/rs17203396
Submission received: 13 August 2025 / Revised: 2 October 2025 / Accepted: 6 October 2025 / Published: 10 October 2025
(This article belongs to the Special Issue Remote Sensing in Mangroves IV)

Abstract

Highlights

What are the main findings?
  • LandTrendr outperformed CCDC-SMA for mangrove change detection in Belize, achieving slightly better recall and more balanced precision-recall trade-offs across parameter variation.
  • The best performing algorithm run estimated 540 hectares of mangrove loss from 2017 to 2024 in Belize, identifying 136 hectares of disturbance within protected areas.
What is the implication of the main finding?
  • The methodology demonstrated here provides a replicable framework for applying change detection algorithms for national-level mangrove monitoring, supporting Belize’s Blue Bond commitments, REDD+ reporting requirements, and evidence-based restoration planning through annual extent updates.
  • Change areas identified provide evidence to support Belize’s National Mangrove Restoration Action Plan through data-driven restoration planning, and targeted enforcement strategies to ensure long-term resilience and the protection of coastal ecosystems.

Abstract

In recent years, the availability of automated change detection algorithms in Google Earth Engine has permitted the cloud-based processing of large quantities of satellite imagery. Models such as the Continuous Change Detection and Classification (CCDC), CCDC-Spectral Mixture Analysis (CCDC-SMA), and Landsat-based Detection of Trends in Disturbance and Recovery (LandTrendr) allow users to exploit decades of Earth Observations (EOs), leveraging the Landsat archive and data from other sensors to detect disturbances in forest ecosystems. Despite the wide adoption of these methods, robust documentation, and a growing community of users, little research has systematically detailed their tuning process in mangrove environments. This work aims to identify the best practices for applying these models to monitor changes within mangrove forest cover, which has been declining gradually in Belize the last several decades. Partnering directly with the Belizean Forest Department, our team developed a replicable, efficient methodology to annually update the country’s mangrove extent, employing EO-based change detection. We ran a series of model variations in both CCDC-SMA and LandTrendr to identify the parameterizations best suited to identifying change in Belizean mangroves. Applying the best performing model run to the starting 2017 mangrove extent, we estimated a total loss of 540 hectares in mangrove coverage by 2024. Overall accuracy across thirty variations in model runs of LandTrendr and CCDC-SMA ranged from 0.67 to 0.75. While CCDC-SMA generally detected more disturbances and had higher precision for true changes, LandTrendr runs tended to have higher recall. Our results suggest LandTrendr offered more flexibility in balancing precision and recall for true changes compared to CCDC-SMA, due to its greater variety of adjustable parameters.

1. Introduction

Globally, mangroves are critically important ecosystems, providing coastal protection, supporting biodiversity through providing a critical habitat, and sequestering carbon. Located in tropical and subtropical zones, mangrove ecosystems have been identified in 128 countries, with North and Central America accounting for approximately 14.4% of the total area [1].
Mangroves within Belize’s mainland, basin, and littoral formations account for 70% of the country’s stock, while the remaining 30% are classified as fringe and inland [2]. The country’s marine tourism and aquaculture, critical sectors of the economy, rely on a combination of healthy mangrove and seagrass ecosystems and coral reefs [2]. The averted flood damage to property relative to GDP for Belize is estimated at 28.86%, placing it among the countries that benefit the most from its mangrove ecosystems globally [3].
A set of robust policy and regulation frameworks for mangrove management and protection of coastal ecosystems exists in Belize. These include the Coastal Zone Management Plan (CZMP), established in 2016, and a permitting system created in 2018 to regulate mangrove cutting. Additionally, the National Land Use Policy (2019) and the National Biodiversity Strategy and Action Plan (2016) [2] deal with the protection and restoration of the country’s ecosystems.
In 2021, the Government of Belize signed the Belize Blue Bonds for Ocean Conservation Agreement with the Nature Conservancy, committing to protect 30% of Belize’s oceans [4]. The agreement established eight milestones, including the creation of a Marine Spatial Plan Process (Milestone 3). To achieve this milestone, the Government of Belize’s Consolidated Project, “Establishing the Enabling Environment for the Development of a Marine Spatial Plan through the Strengthened Governance, Improved Management, and Enhanced Monitoring of Belize’s Coastal and Marine resources,” put forth the goal of Improving Monitoring, Reporting, and Socialization of Mangroves and Reserves (Component 5). This paper is a collaboration with the Belize Forest Department within the context of Activity 5.1.2 Remote Sensing Data Collection and Map of Component 5.
A key target for mangrove intervention is to enhance the science of measuring and reporting on carbon emissions and removals. To meet this target requires the continued expansion of the national capacity to ensure the sustainability of the measurement, reporting, and verification of actions throughout Belize’s Blue Bond Conservation Commitments and NDC commitment period. This implies not only the establishment and measurement of carbon plots, but also a standardized remote sensing methodology to refine the national extent of mangrove boundaries and coverage.
Much research has applied different sensors, classification approaches, and indices to monitor mangrove forests [5,6]. In an ever-growing body of work, historic time-series techniques that capture long-term spectral trends [7,8,9] assess mangrove change and characteristics globally. In this paper, we compare two such time-series-based approaches, LandTrendr (Landsat-based Detection of Trends in Disturbance and Recovery) and CCDC-SMA (Continuous Change Detection and Classification—Spectral Mixture Analysis) and assess their performance in mangrove environments in Belize.

Literature Review

Prior work has employed a limited selection of satellite image composites for specific study years to classify mangrove cover in Belize through a combination of spectral mixture analysis and supervised and unsupervised classification approaches [10,11,12,13]. Post-classification, image differencing methods have been commonly used to estimate change in Belizean mangroves [10,11,13]. While image differencing is a straightforward, robust approach, its accuracy relies heavily on the quality of the classifications used to estimate changes between pre and post images. Temporal segmentation approaches, on the other hand, detect changes by distilling relationships between spectral characteristics and time [14].
Advances in cloud-based platforms, such as Google Earth Engine, for geospatial analysis have both facilitated the access to, and processing of, large quantities of satellite data [15,16] needed for temporal segmentation. Still, historical analyses that use temporal segmentation approaches are lacking for Belize. The selection of the most optimal time-series change detection approach for a particular application requires an understanding of how model specifications shape outputs. In recent years, research comparing different time-series methods has highlighted the importance of systematic approaches to determine model parameterization and suitability for different applications [16,17,18,19].
In this work, we compare the performance of two algorithms: LandTrendr and CCDC-SMA. Both algorithms have been used in mangrove environments, for example, LandTrendr in Suriname [8] and the original CCDC model (without spectral mixture analysis) in the Sundarban region of Bangladesh and India [9]. However, they have not, to the authors’ knowledge, been employed in Belize.
By determining the best practices for the parameterization of these techniques, these methodologies can be used to support Belize’s Forest Department mangrove conservation efforts and provide guidance on the use of change detection methodologies to facilitate reporting processes.

2. Materials and Methods

2.1. Determining the Study Area

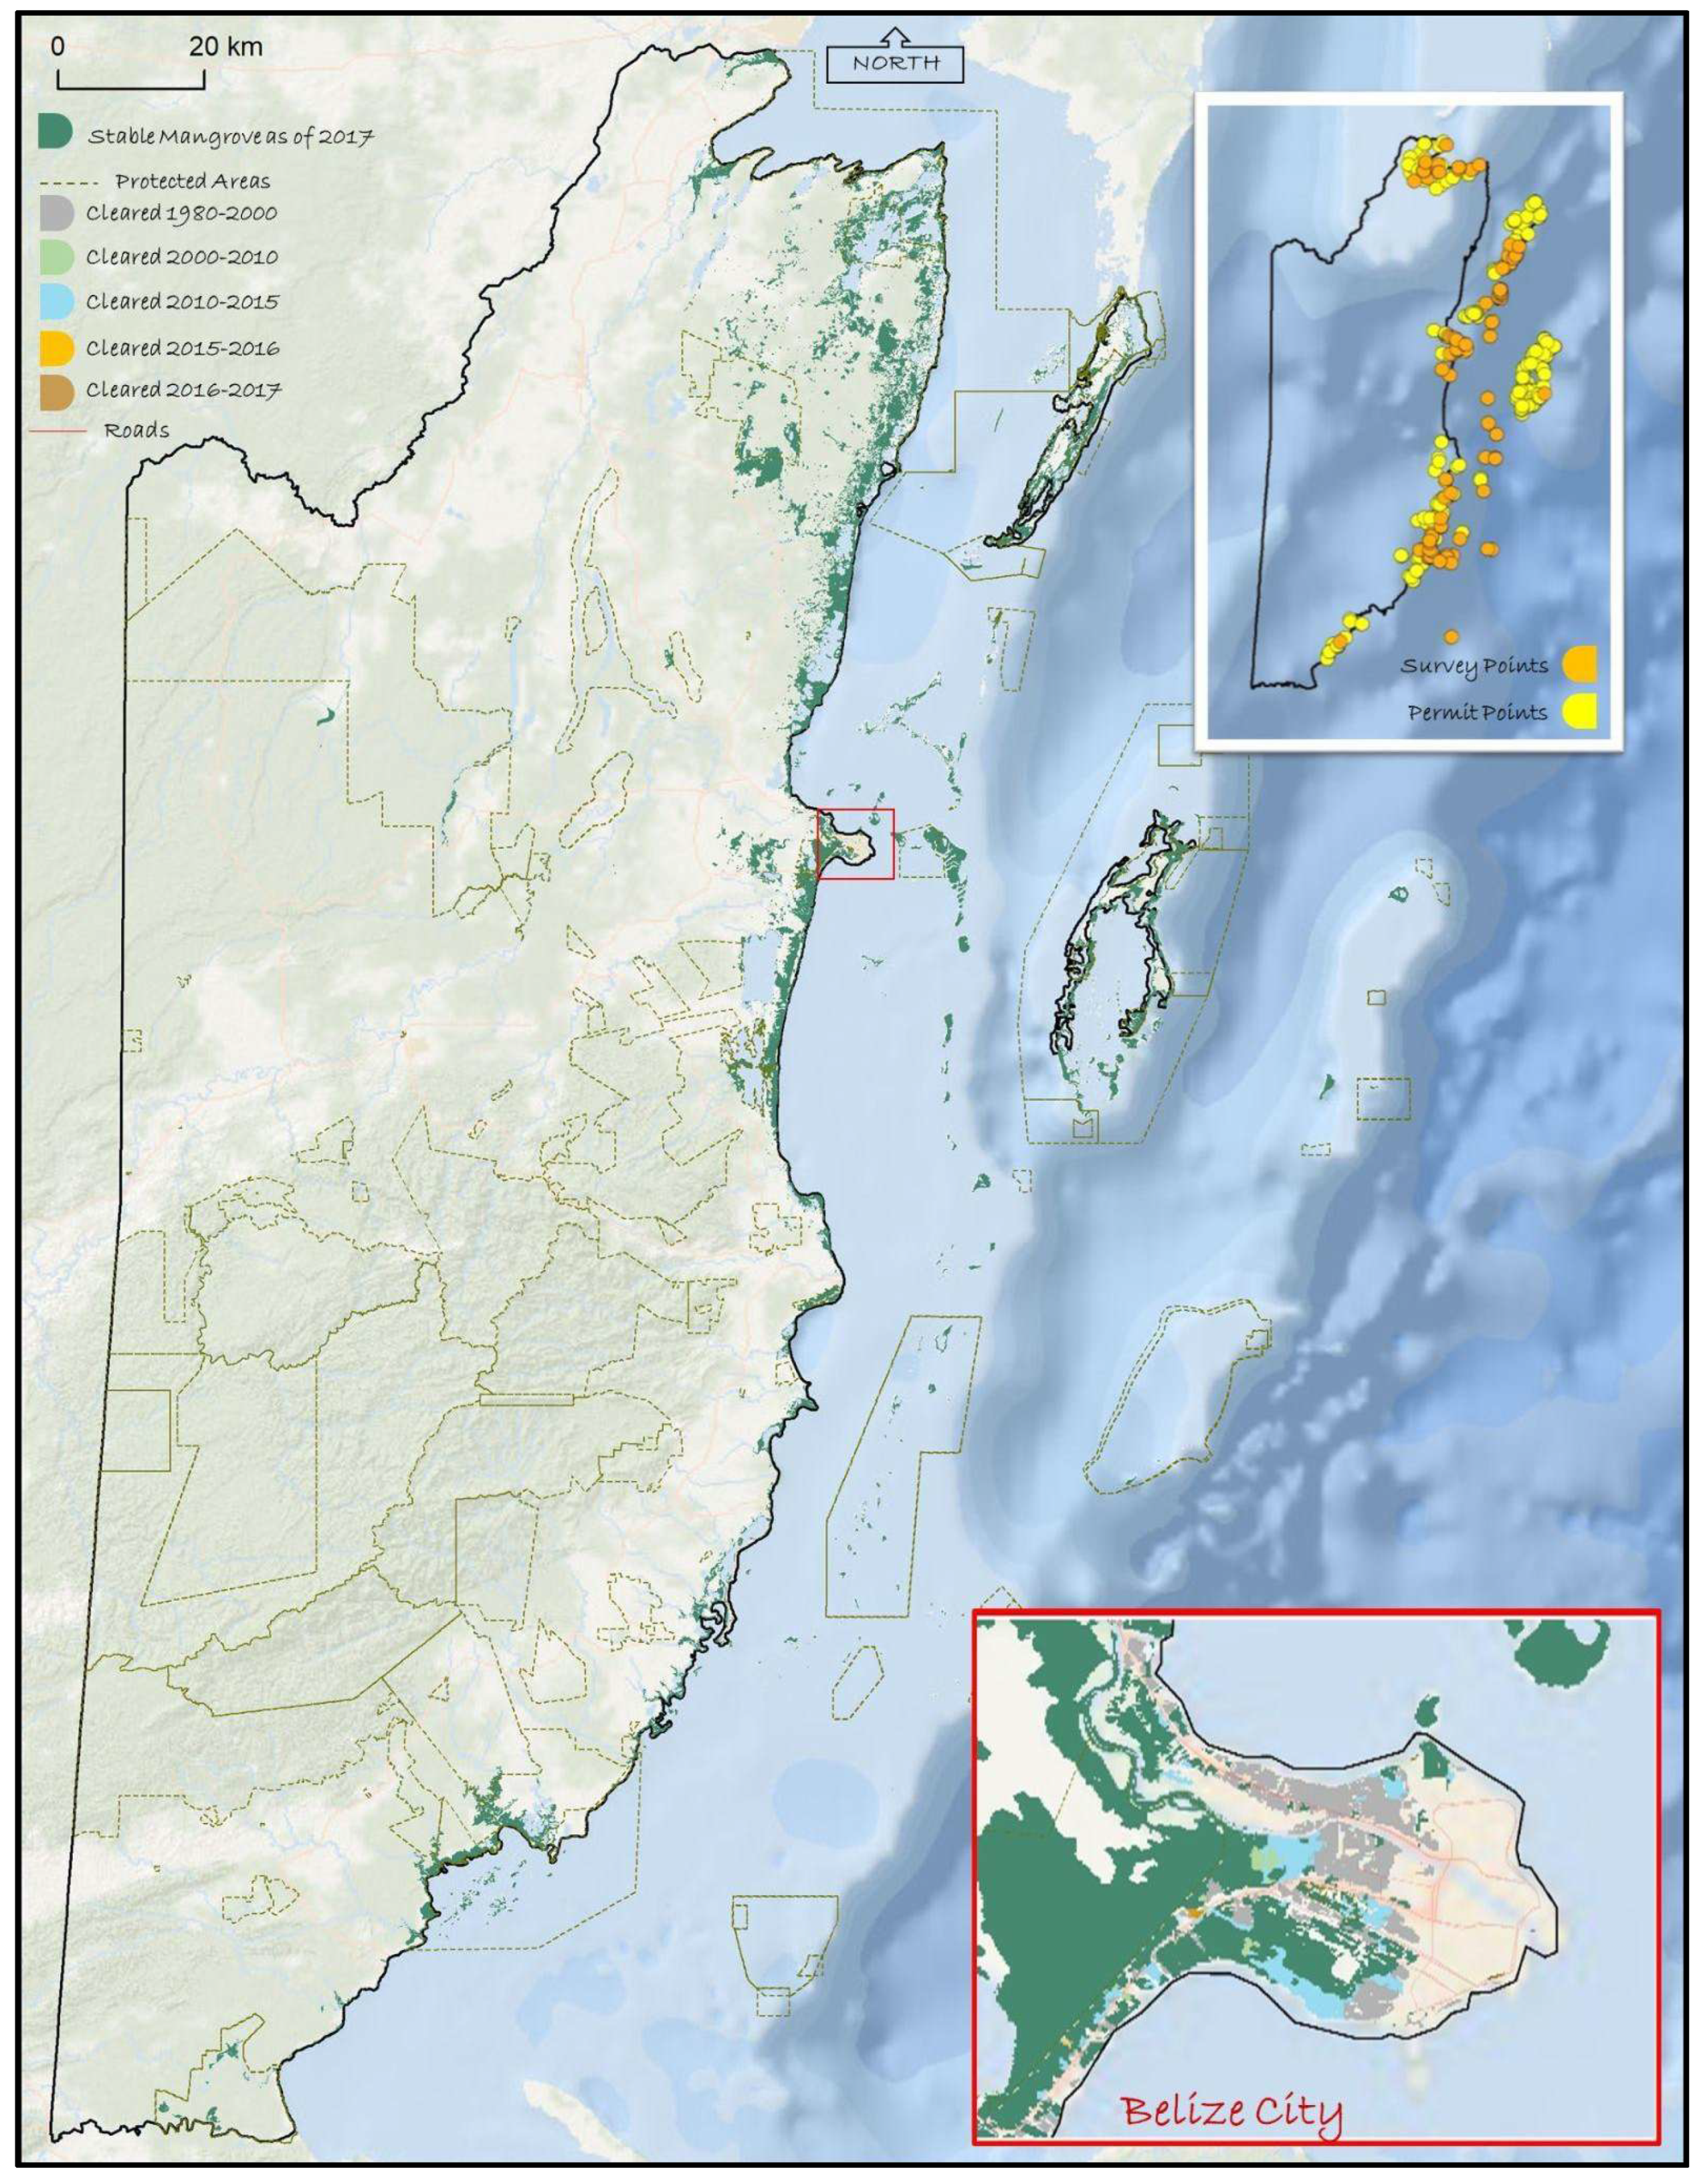
We established the starting mangrove extent, which would serve as the baseline from which we estimated change (Figure 1). This report builds on work by Cherrington et al. [10], which applied a spectral mixture analysis approach to three decades of Landsat imagery from the U.S. Geological Survey (USGS) and estimated a net loss of 1569 ha in mangroves across Belize (Figure 2). Expanding on this work through the year 2017, Cherrington et al. [11] found an average of 133.35 ha of change per year and a total mangrove extent of 72,169 ha for Belize. Other mangrove products for Belize include the CATHALAC [13] extent for 2018 [70,054 ha], Global Mangrove Watch [20] extent for 2020 [51,853 ha], and Cissell et al. [12] extent for 2020 [60,747 ha]. All four data products have an overall accuracy greater than 95%. To prevent any discontinuation of mangrove coverage estimates and reduce errors that may be introduced due to differences in the four product extents, we opted to use the extent estimated in Cherrington et al. [11] and continue the estimates of mangrove change. We further updated that extent through 2024.

2.2. Field Data for Validation

The Belize Forest Department conducted a field survey from March to May 2024, consisting of ~270 point locations across the Belizean coast. The survey locations were randomly distributed across mangrove, non-mangrove, and water land cover types but constrained by the following criteria: accessibility by car or boat, within 175 meters of roadways or the coastline, and a minimum distance of 90 meters between each point location.
Additionally, the survey point data were combined with 135 locations of mangrove clearing permits from the Belize Forestry Department (Figure 2) with both issue and expiration dates during our study period. The permit data do not include confirmation regarding when and if the permittee deforested a particular location. Rather than assume every permit represented mangrove loss, we visually examined Planet’s five-meter monthly mosaics for the Tropics to confirm whether each permit plot was disturbed during our study time period. Plots that were disturbed were assumed to be fully deforested to the extent defined by the permit.
After removing points outside our study area, a total of 182 points were included in the validation dataset, including 66 change points and 116 stable points (no change) across the years 2017 to 2024. The reference dataset size is similar to that of Cherrington et al. (2020) [11], who randomly distributed 100 points to change areas and 100 points to non-change areas, for a total reference dataset size of 200 points.

2.3. Change Detection

Both approaches were originally designed and optimized to leverage the rich USGS Landsat record [16]. We opted to use the Landsat archive over a higher-resolution sensor, such as the European Space Agency’s (ESA) Copernicus Sentinel-1 or Sentinel-2 sensors, due to the length of our study period. While cloud cover is a concern in the Tropics, the Landsat collection has been used in many other tropical forest and mangrove applications [7,8,9,10,11]. Between 2000 and 2024, there was an average of 48 Landsat images for Belize with less than 20% cloud cover per year, and most years (72%) had at least 31 images. Both algorithms apply cloud and shadow masks and ensure missing data are not registered as temporal breaks [21,22].
We parameterized both models individually for the following time periods: 2000–2024 for algorithm tuning, 2017–2024 for change output analysis and validation. Both algorithms are available on Google Earth Engine (GEE). Guidance on the parametrization and use of these resources can be found [21,22] (reference “Data Availability Statement”).

2.3.1. Continuous Change Detection and Classification—Spectral Mixture Analysis

As an “online” method, CCDC builds linear harmonic models that capture patterns in reflectance across all bands and are updated dynamically with new observations [16]. The final step of CCDC employs Random Forest to generate a land cover classification based on the change detection model’s coefficients and root mean squared error (RMSE). Change to the forest can be identified in the classified map [23].
Building on this model to incorporate spectral mixture analysis, CCDC-SMA was developed by Dr. Shijuan Chen [22]. As a relatively new approach, the CCDC-SMA model has also been applied in limited contexts to tropical forests [18,24], but work has not been published on Central America or in mangroves to the authors’ knowledge. CCDC-SMA modifies the CCDC algorithm by using the Normalized Difference Fraction Index (NDFI), rather than all the Landsat spectral bands, as the basis for the change detection threshold. The NDFI is calculated from the following pixel endmembers: green vegetation (GV), non-photosynthetic vegetation (NPV), soil, shade, and cloud [25], Equation (1).
N D F I = G V s h a d e ( N P V + S o i l ) G V s h a d e + ( N P V + S o i l ) where   G V s h a d e = G V 1 s h a d e
The remaining parameters that the user can customize include the number of consecutive changes detected and the change probability. We employed the version of CCDC-SMA developed for the Tropics [24] and iteratively tested a series of variations in the model’s parameters to determine their optimal values for our study region (Table 1). The endmember reflectance values were the default values for the Tropics (Table A1). Two variations in the change probability (0.99 and 0.98) and the number of consecutive observations (5 and 8) were run with each of the change detection thresholds (0, 2600, 7000, 10,000), for a total of sixteen variations. Based on the most optimal run from these sixteen variations, we ran an additional six variations in an attempt to improve the recall of true positives.

2.3.2. Landsat-Based Detection of Trends in Disturbance and Recovery

LandTrendr was developed by Dr. Robert Kennedy and is maintained through the Oregon State University Environmental Monitoring, Analysis, and Process Recognition Lab. This change detection algorithm is powered by spectral-temporal segmentation methods and applied to the Landsat time series. There has been extensive research both explaining [16,21,26] and applying its methods to detect changes in various land cover types [27,28,29]. The majority of these studies focus on the changes from forest cover to another land cover type: agriculture, urban, mining, etc. Few studies have focused on the change from mangrove forest; we relied on [8,30] for guidance to parameterize the LandTrendr algorithm, shown in Table 2.
Like de Jong et al. [8], we began with a default value for each parameter of the model and altered one parameter at a time for each subsequent run. Cells highlighted in green are those based on de Jong et al. [8], while those in gray were altered even further based on expert guidance for both mangrove growth patterns and area clearance practices of Belize.
de Jong et al. [8] states that the “Recovery Threshold (RT) should be set high, close to one, when recovery rates or growth of mangrove are fast.” However, according to the Belize Forest Department, natural regeneration of a disturbed mangrove area will likely take place over a span of up to five years. This meant that a setting of 0.5–0.25 (2–4 years) would be more appropriate for our study region to ensure areas of slower recovery were not excluded. We set the “Prevent One Year Recovery” parameter to “TRUE” for this same reason. This means that the algorithm ignored any spikes in Normalized Difference Vegetation Index (NDVI) within the selected RT, considering them to be noise in the imagery [31].
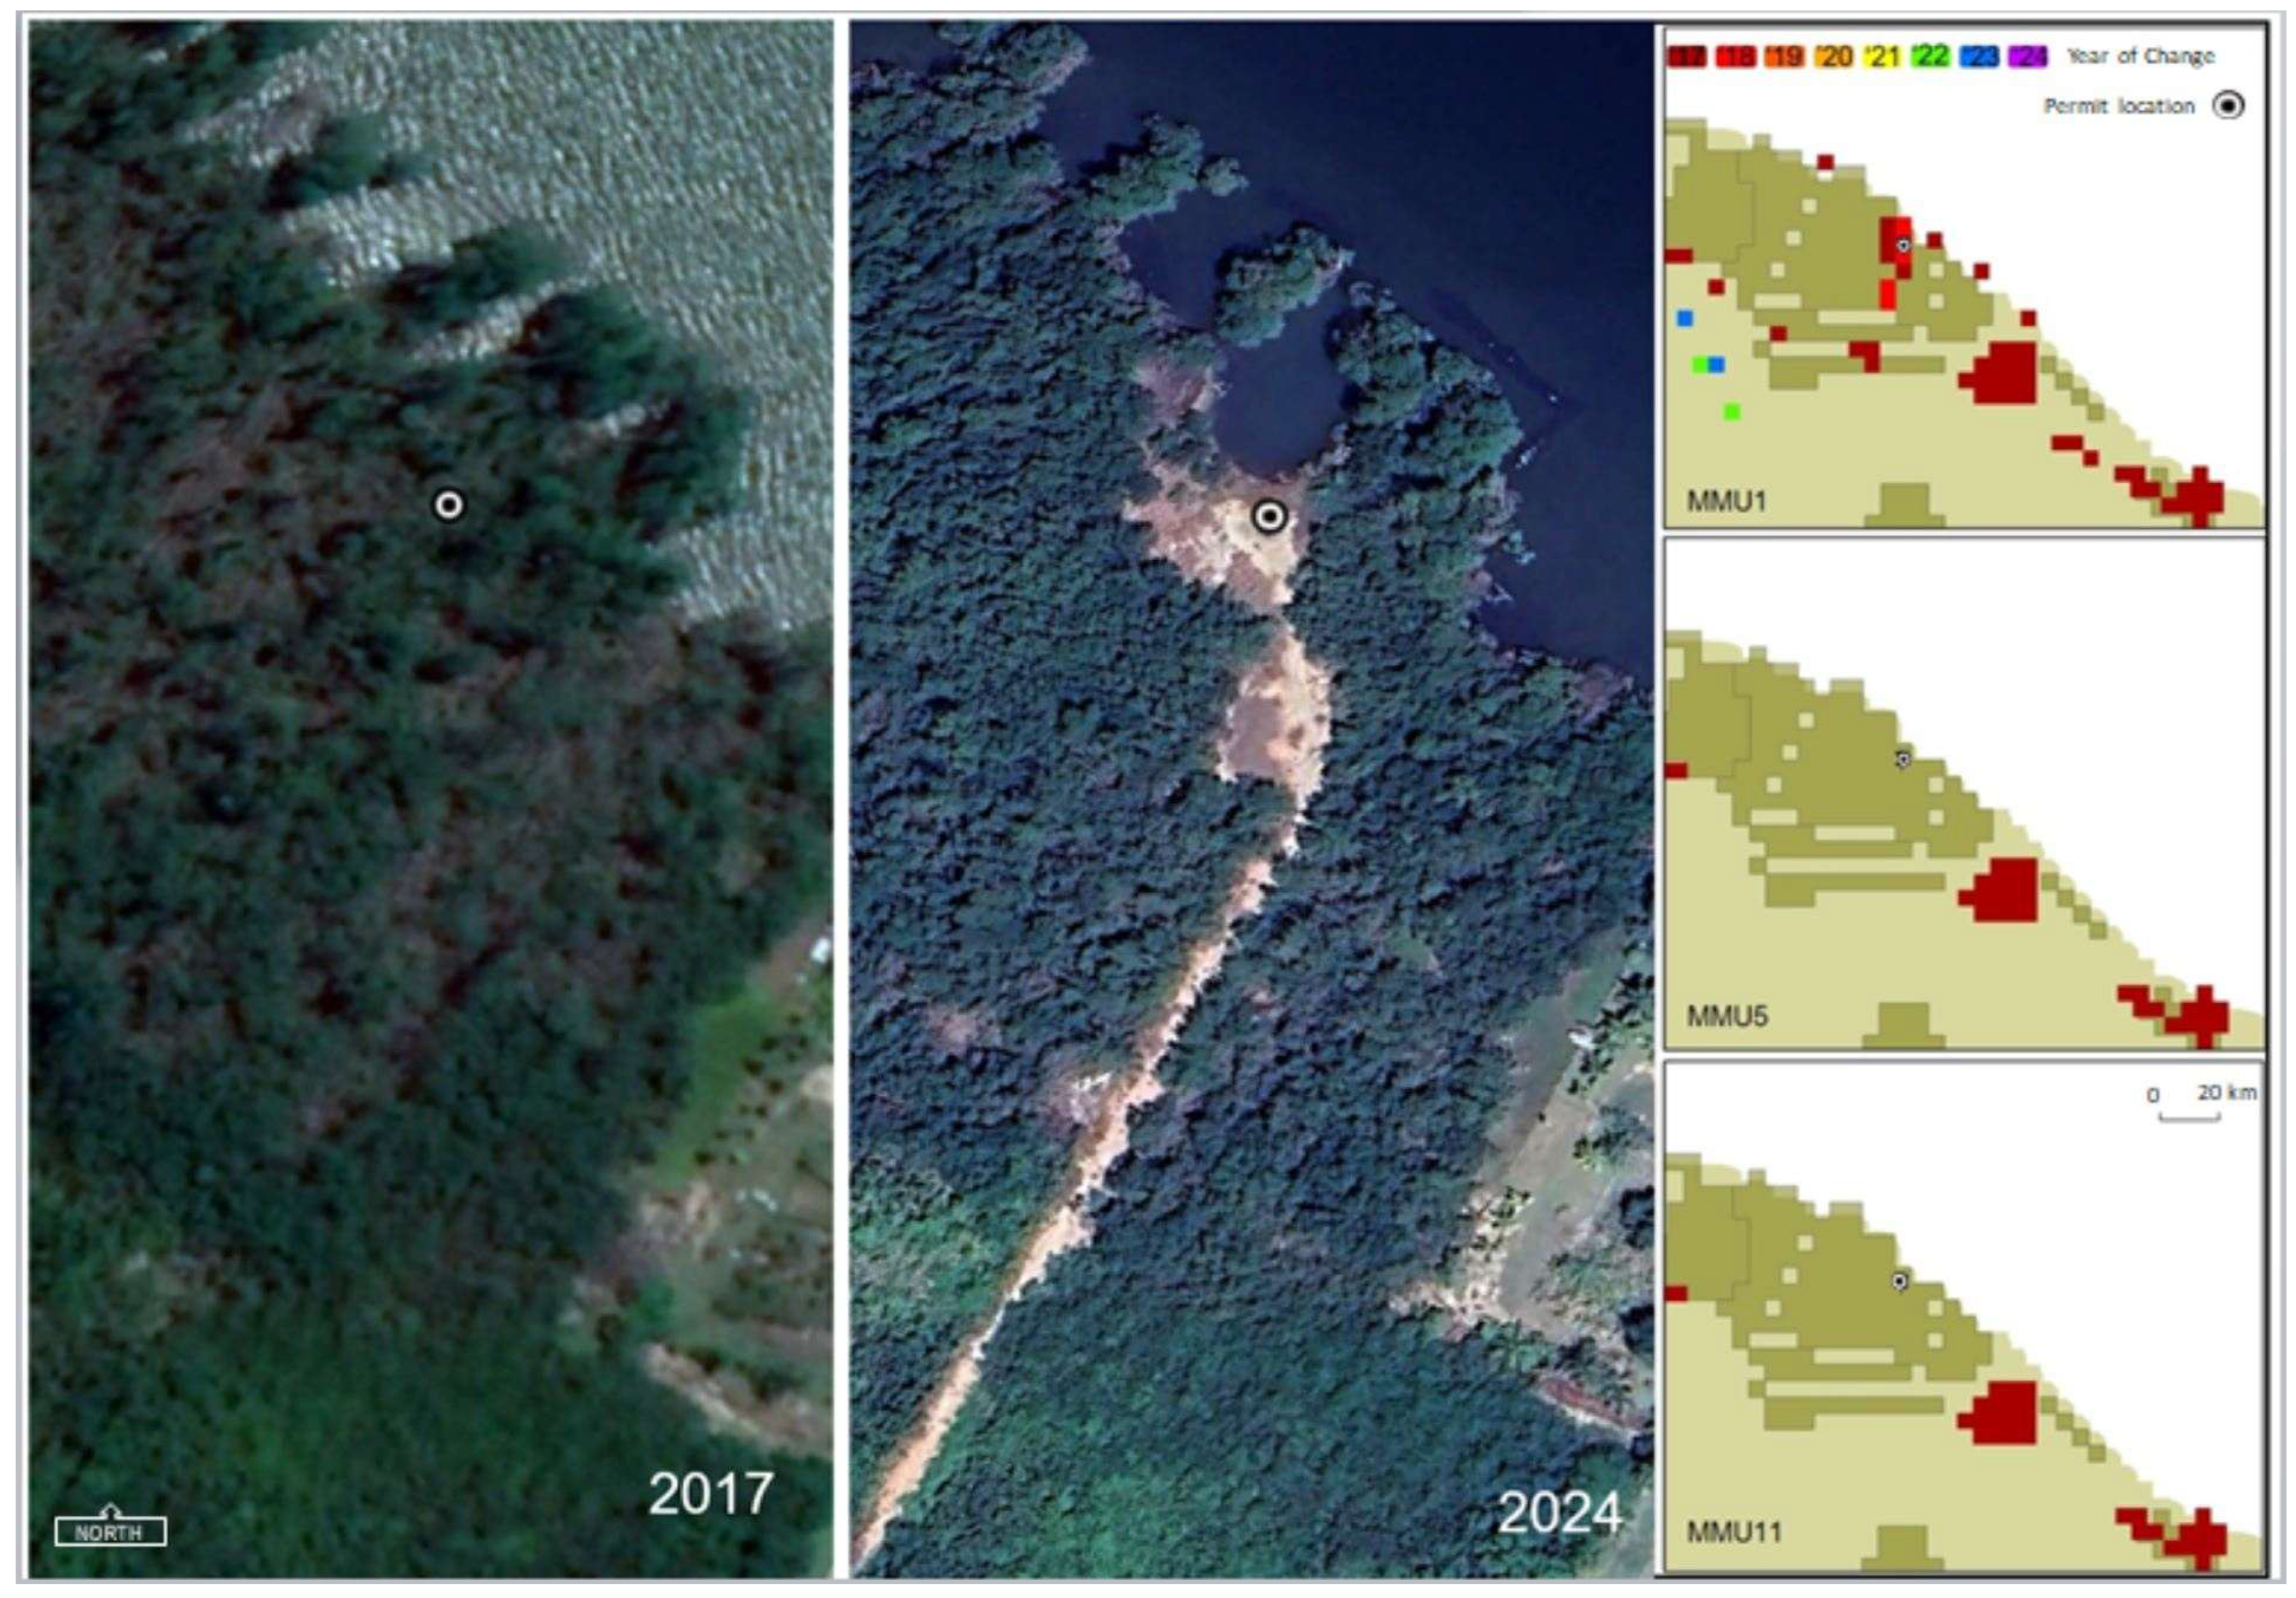
A minimum mapping unit (MMU) of five (approximately 0.5 ha) or eleven (1 ha) is generally appropriate to detect changes in forest cover, as forest clearing typically consists of large areas. In Belize, mangroves are normally cleared at a smaller scale or slower pace, thus we determined an MMU of one (0.1 ha) could capture more detail as a single pixel change output. The permit information provided by the Belize Forest Department showed that 80% of the permitted removal of mangroves accounted for an area smaller than 1 ha. Figure 3 zooms into one such permit site for approximately 0.3 ha and demonstrates the LandTrendr outputs using the three MMU options. Using the control parameter settings and changing only the MMU, MMU1 detected 41% more possible changes over MMU5.

2.4. Accuracy Assessment

We conducted a systematic accuracy assessment of both models’ outputs for the years 2017 to 2024 using the combined field survey points and permit points from the Belize Forest Department described in Section 2.2 as our reference dataset. We calculated overall accuracy, recall, precision, and false-positive rate for each run (See Table A2 and Table A3 of the Appendix A). In this context, recall and precision are equivalent to producer’s accuracy and user’s accuracy, respectively.

3. Results

3.1. Change in Mangroves

Reviewing the best performing run from each algorithm, we compared the estimated total changes in the mangrove extent from 2017 through 2024. CCDC-SMA flagged 1547 more hectares of mangrove change, almost a 300% increase in detection (Table 3). CCDC-SMA identified over 1.5 times more in the Corozal District alone, an area that contains the majority of the nation’s mangrove savannas and flagged more single-pixel changes than LandTrendr. The majority of changes identified by both LandTrendr and CCDC-SMA were from mangrove to agricultural, cropland, and urban land cover types and within the Belize and Stann Creek districts.
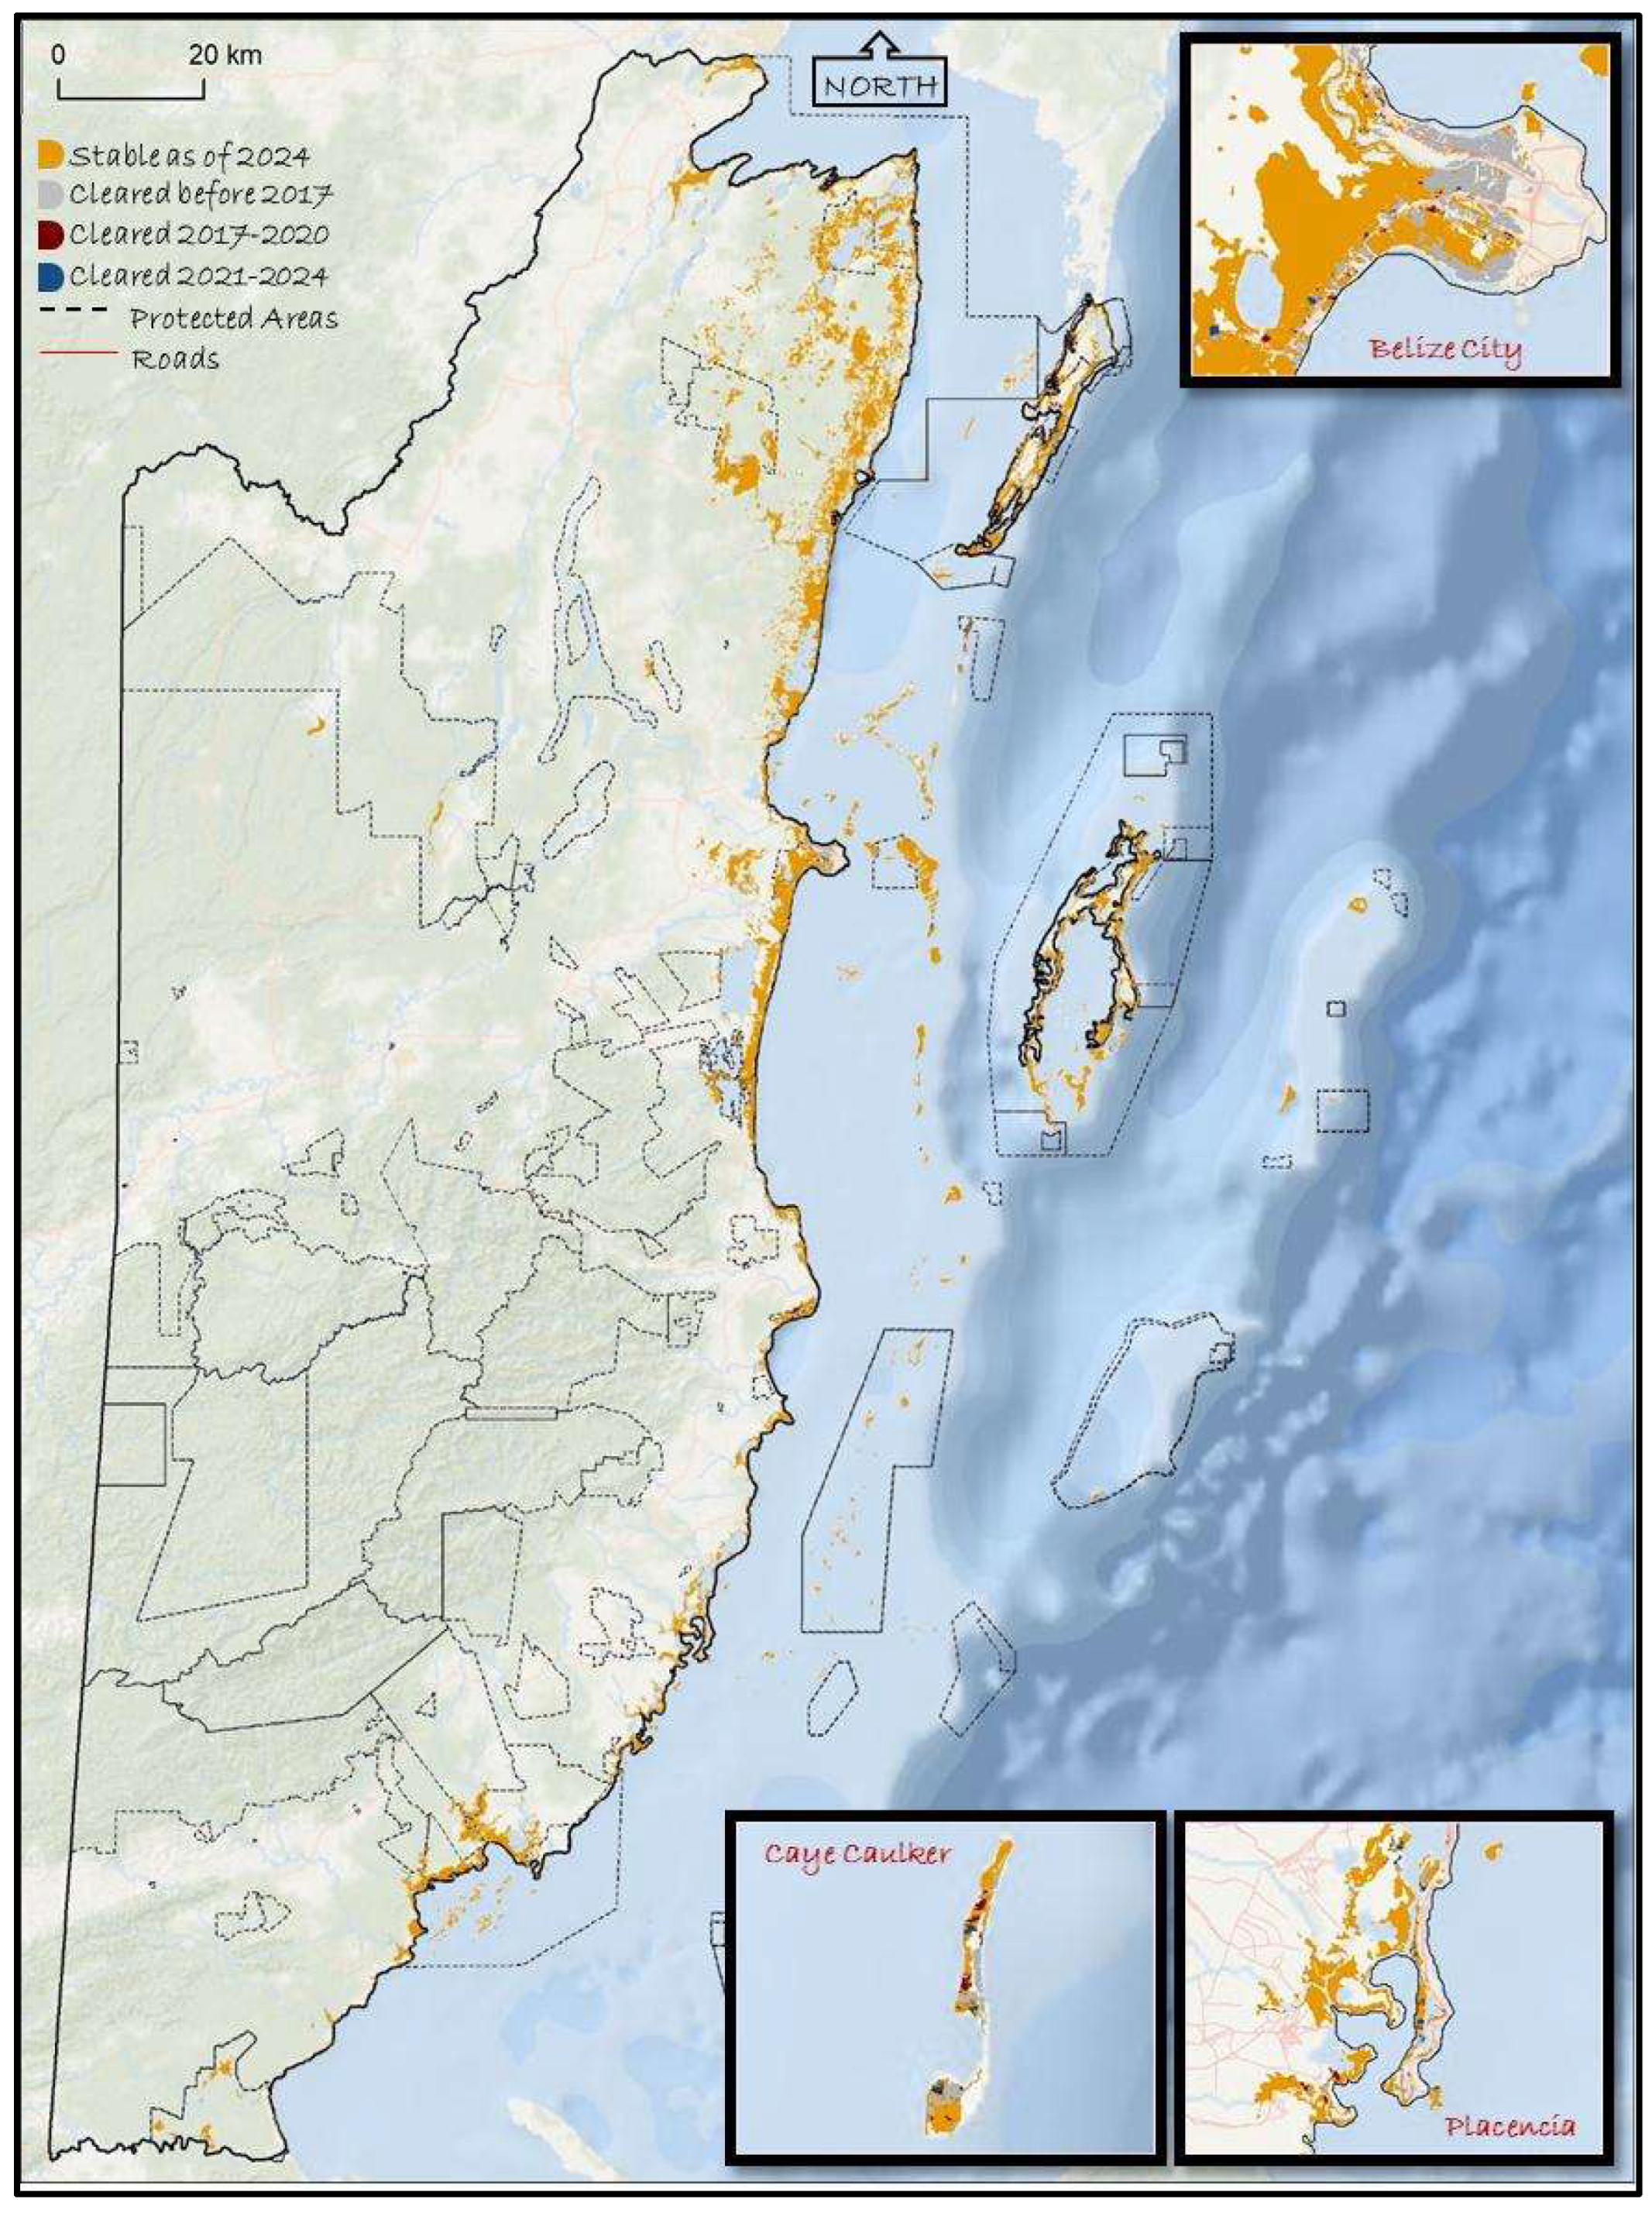
Applying the best-performing change detection output from LandTrendr to the Cherrington et al. [11] extent for 2017, we generated annual mangrove loss maps for 2018–2024. This estimated a decrease of 540 hectares in mangrove coverage by 2024 (Figure 4). From this total, 136 hectares were located within protected areas, with the majority of changes within Gra Gra Lagoon, Bacalar Chico, and Sarstoon Temash National Park (Figure A1). By determining best practices for the parameterization of these techniques, these methodologies can be used to support the Belize Forest Department’s mangrove conservation efforts and provide guidance on the use of change detection methodologies to facilitate reporting processes.
To expand upon this algorithm-focused analysis, we employed a comprehensive annual mangrove loss mapping strategy using the optimized parameters from LandTrendr. By generating yearly maps of mangrove loss for 2018–2024, this approach allows for a detailed assessment of temporal trends across Belize, highlighting areas of significant loss on a year-by-year basis. Although our analysis focused on loss rather than gain, these outputs can be combined with ground-truth data collected by the Belize Forest Department through their Blue Bond Agreements. Integrating these datasets provides a robust framework for continuously updating annual mangrove extents, supporting conservation planning, reporting, and the long-term monitoring of mangrove dynamics.

3.2. LandTrendr

Full results from all model runs can be found in Table A2 and Table A3 of the Appendix A. Overall accuracy of the parameter tests within LandTrendr ranged between 0.67 and 0.75. Changes to single parameters resulted in minimal differences while holding other parameters constant. The best performing combination of parameters consisted of MS4, RT05, BMP1, and MMU1, with an overall accuracy of 75%. Both Kennedy et al. [26] and de Jong et al. [8] state that a higher max segment (MS) value is needed to capture dynamic changes in the land cover, while our assessment found that a lower MS value maintained higher precision in detecting true change. Nevertheless, MS12 produced more false positives than the others when compared against the field survey data.
The best model proportion (BMP), when set above one, dropped significantly in accuracy due to the low true-positive rate. This was also found by de Jong et al. [8]. The model runs with the least amount of false positives (MMU11, MMU5, and BMP125) identified the least amount of change, missing some key locations of mangrove loss. Although MMU1 had the highest false positives, it also had the highest true-positive rate of the minimum mapping unit parameter group.
We also found that the RT parameter setting greatly affects the model outputs when “Prevent One Year Recovery” is set to “TRUE”. This restricts the models from rejecting any change identified if it recovers faster than the set time (4 years = 0.25). In theory, the Tropics’ recovery speed is faster compared to subtropical or temperate regions; however, areas of clear-cut mangrove take longer to recover unless actively under restoration.

3.3. CCDC-SMA

Overall accuracy was generally moderate (0.66–0.72) and differences between the runs were subtle, but the default values for threshold 2600 (run 2600c) resulted in the highest precision (0.94) and one of the higher rates of recall among the runs (0.24). For all runs, precision was between 0.59 (run pv0x3) and 1 (all runs with thresholds of 7000 and 10,000). Recall, for all runs ranged from 0.09 (run pv10000x3) to 0.26 (run pv0y1).
We expected higher recall for a threshold of zero, as decreasing the value of this parameter will result in an increased sensitivity of the model to detect change. However, the run with the highest recall (pv0y1) also produced the highest number of false positives of all run variations (n = 10), meaning it introduced more noise. Furthermore, with a recall of 0.24, the default run (2600c) is only slightly lower and had a better false-positive rate (0.01).
When the change threshold was held constant, there were no large differences in accuracy that resulted from adjustments to the change probability and the number of consecutive observations. For thresholds 7000 and 10,000, precision reached one and adjustments to other parameters caused other accuracy metrics to decline.
Given the potential outsized influence of the change threshold parameter, we performed further tests to assess whether improvements in accuracy could be made. Using the default run as the starting point (run 2600c), we adjusted the change threshold in increments of 100, from 2000 to 2500, keeping all other parameters at their default values. Three runs improved recall minimally (+0.02) but declined in precision by 0.11; those with thresholds 2300, 2400, and 2500 all produced a precision of 0.85, a recall of 0.26 and false-positive rate of 0.03.

4. Discussion

4.1. LandTrendr Compared to CCDC-SMA

Our selection of “best performing algorithm runs” were selected based on the balance between detected change with certainty of stability, prioritizing minimal false positives. We chose to use a LandTrendr output that combined the parameter tunings of its best four runs to update the mangrove extent (“Final Parameterization”, Table 2). While the overall accuracy of both models was similar, the combined LandTrendr output provided the most balanced trade-off between precision and recall for true changes compared to other runs of either approach.
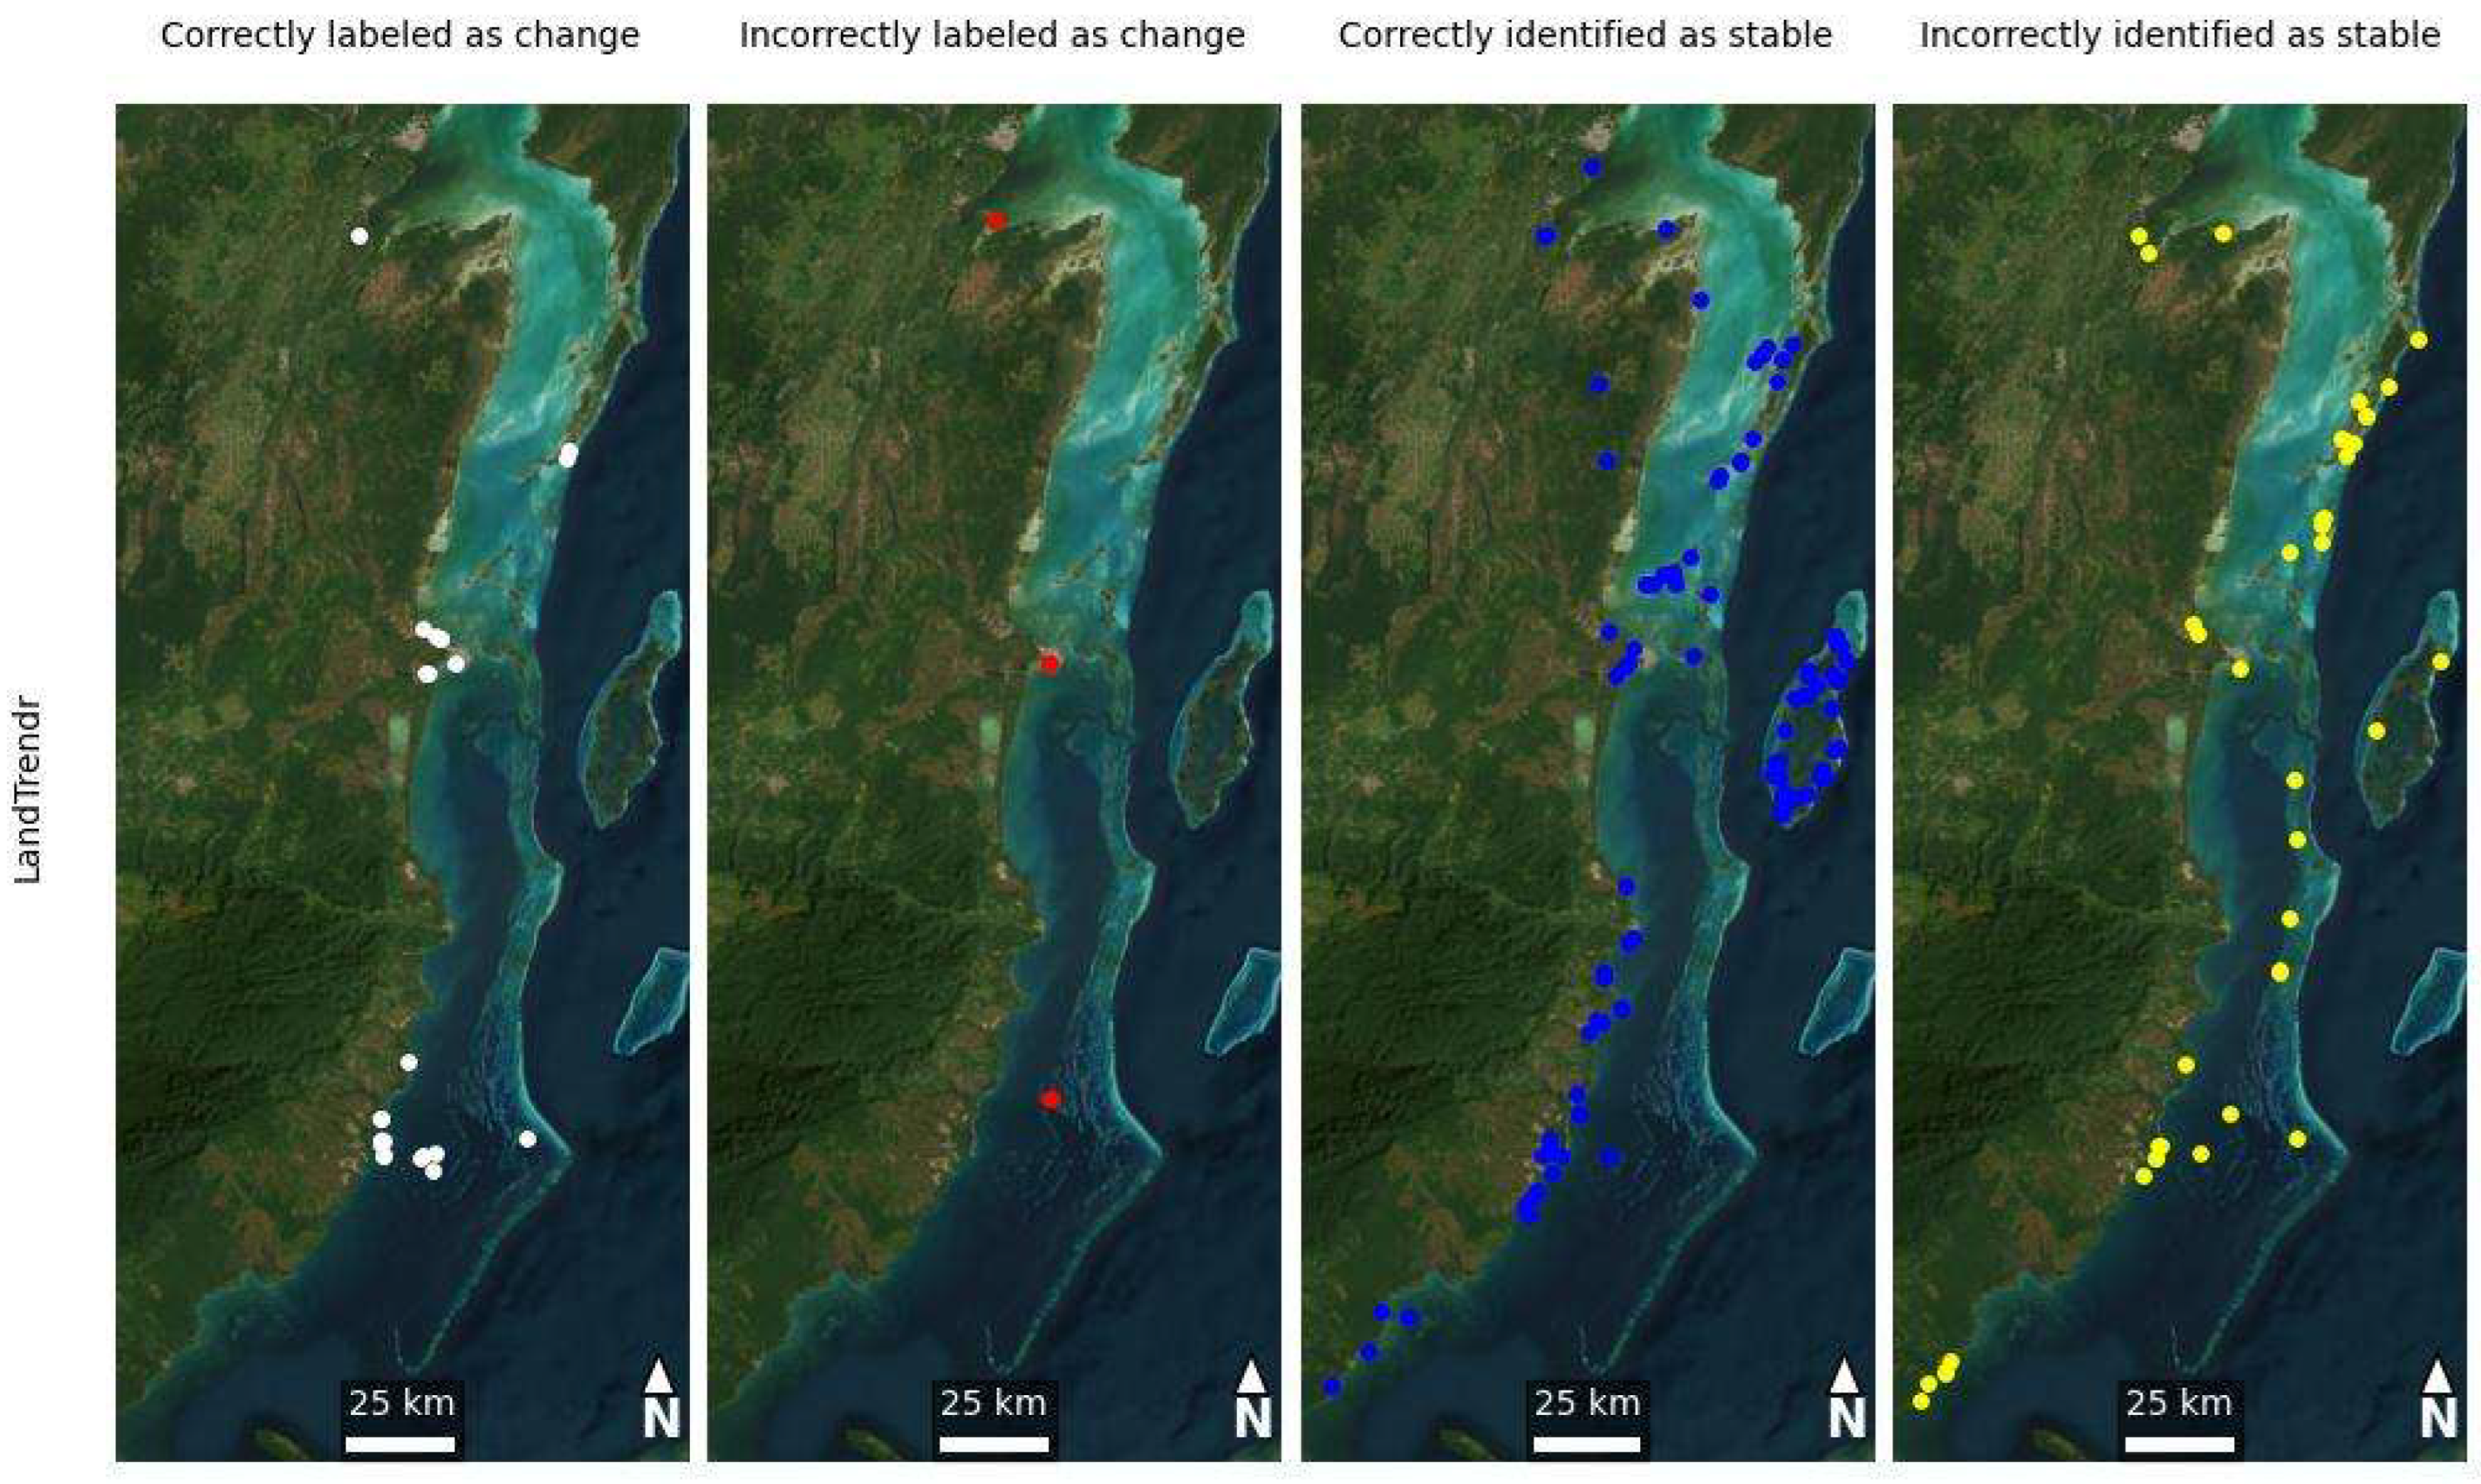
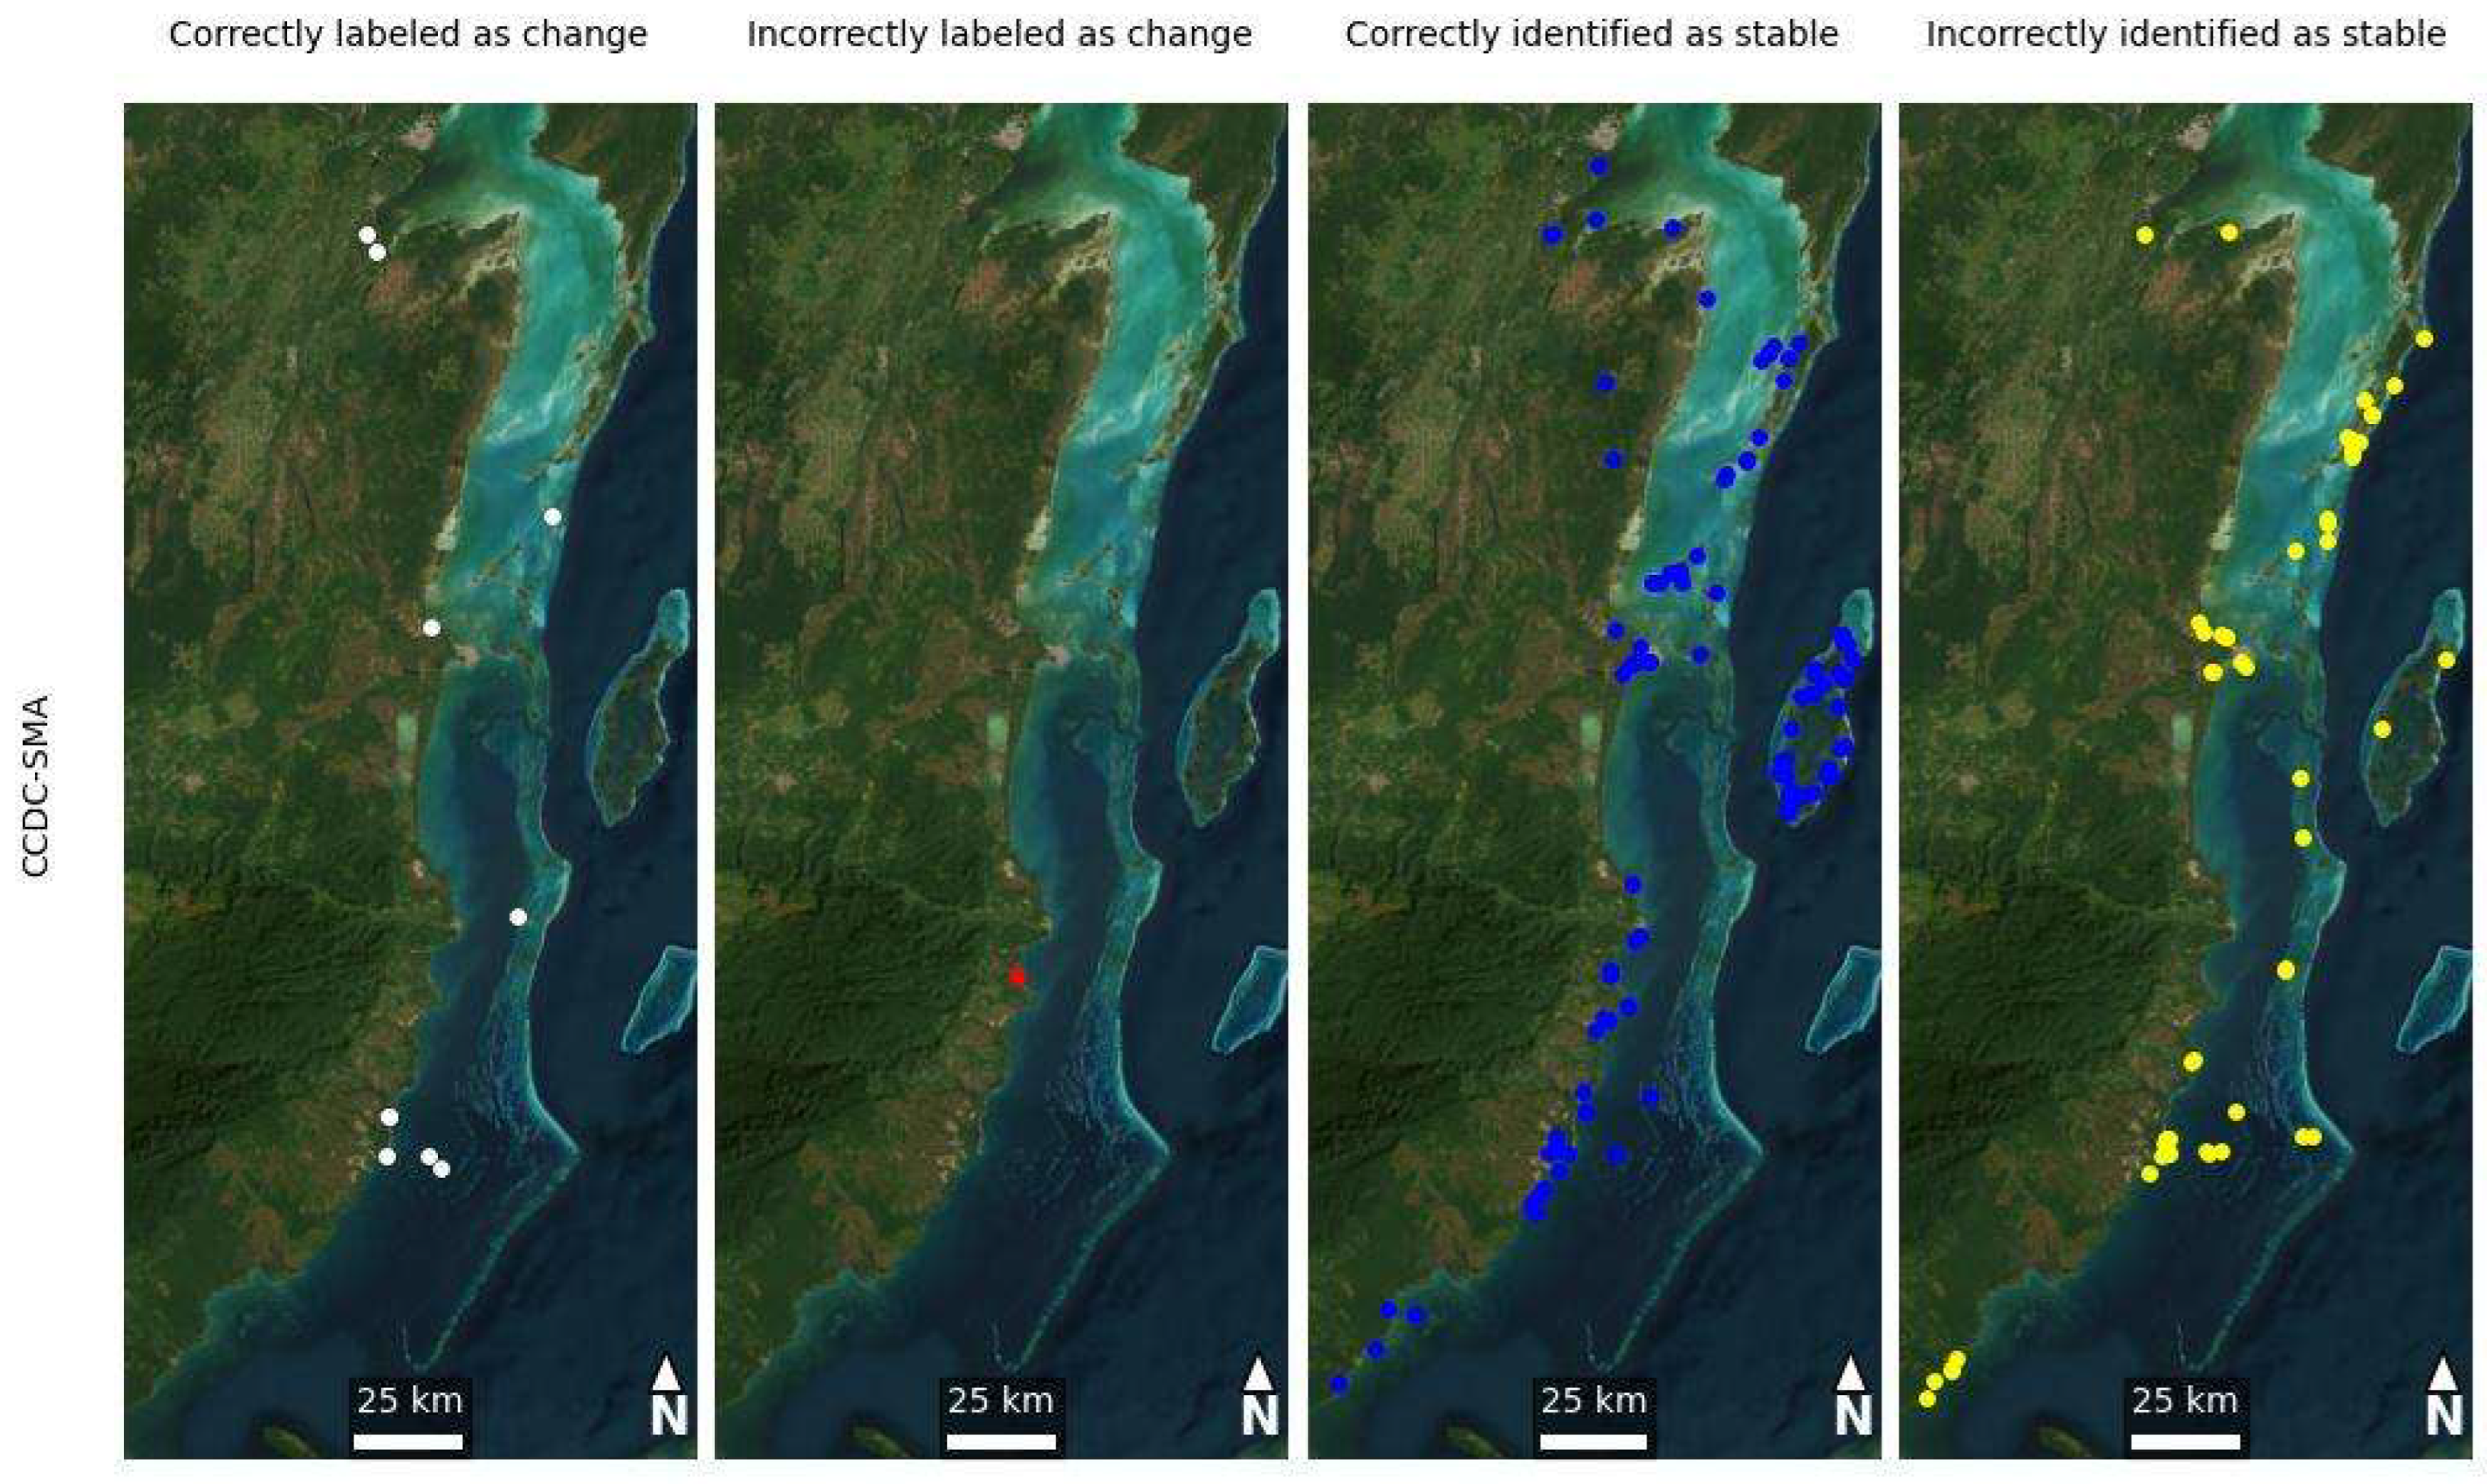
For the detection of true changes, both models had higher precision than recall and false-positive rates were relatively low. While across all runs a greater proportion of the changes detected by CCDC-SMA were true changes (precision), LandTrendr’s change detection tended to align better to the field data (recall). The spatial distribution of how the best performing output of each model aligned to the reference data is evidenced in Figure 5 and Figure 6.
CCDC-SMA runs with the highest precision also had the lowest recall (Figure 7). The change threshold parameter of CCDC-SMA appeared to drive this tradeoff (Table A3). Run configurations with a change threshold of 7000 or higher resulted in extremely restrictive change predictions, with a precision of one and no false positives.
This tradeoff between precision and recall was slightly less pronounced for LandTrendr, which could be related to the greater variety of parameters to be adjusted in the model. The recall values for LandTrendr ranged between 0.23 and 0.38, except for one run, which produced a recall of 0.12 (Table A2). Most of the runs had a higher recall than that of the CCDC-SMA runs, which ranged between 0.09 and 0.26. Furthermore, LandTrendr predicted a larger number of true positives (15 to 25) across runs than CCDC-SMA (6 to 17) (Figure 5 and Figure 6). LandTrendr’s approach is generally more sensitive to parameter adjustments compared to the original CCDC model, facilitating a deeper specificity of tuning to capture smaller and gradual changes [16]. CCDC-SMA’s addition of spectral unmixing is designed to make the original CCDC model more sensitive to gradual changes (i.e., forest degradation) by considering the fractional composition of pixels [22]. Still, parameters available only in LandTrendr, such as the RT discussed in Section 3.2, likely helped attune it slightly better to our geographic scope.
CCDC-SMA’s tendency to detect more changes in our study area overall (Table 3) could be related to the algorithm’s use of all adequate Landsat observations, rather than an annual composite. This inclusion of all available observations means that the underlying CCDC model has the potential to overdetect change due to scene path overlap and is more susceptible to fluctuations in image availability [16].
Other work has discussed how the dynamic nature of coastal and tidal processes can impact the spectral signal of mangrove canopies and underlying soil, ultimately affecting their estimation and characterization [32,33,34]. Huang et al. [32] proposed combining CCDC with a composite mangrove index (CMI), which employs the Normalized Difference Vegetation Index (NDVI), the Modified Normalized Difference Water Index (MNDWI), and the Land Surface Water Index (LSWI) to account for the effects of tidal dynamics on the spectral signal of water, green vegetation, and background soil. CCDC-SMA is underpinned by the NDFI, in which green vegetation and bare soil are important end members composing the index. The model does not, however, explicitly include a water end member.
Our recall values overall, including that of the best performing LandTrendr output (0.38), are quite low. This means that while the changes detected by both algorithms tended to be true changes on the ground, they still missed the majority of change points from our validation data. This could be related in part to our reference data. The implication for monitoring mangrove loss is that while we have a high degree of certainty for mangrove areas that have remained stable, our models also overlooked real areas of loss. This can have a direct impact by delaying intervention in areas of unpermitted clear-cutting. Still, certainty in identifying stable mangrove areas is critical, as it helps managers allocate limited monitoring resources more efficiently and provides confidence in long-term areas that remain intact.
Based on the considerations of reference data selection described in Olofsson et al. [35] (e.g., access, spatial coverage, interpretability) we deemed the in situ field data collected by domain experts from the Forest Department the best available reference dataset for the purposes of this work. Our total reference data points were also similar to Cherrington et al. [11] (182 vs. 200 randomly distributed points, respectively), whose mangrove extent served as the baseline for this work. However, our accuracy assessment was conducted for the full 2017–2024 period rather than annually.
As temporal distribution of the reference data was uneven across our study period, it is possible that changes occurring in years with less dense reference data could have been flagged as false positives, or if regrowth occurred in the years following. However, given the relatively low false-positive rates of the outputs, this would only account for a small proportion of missed true changes. An expanded reference dataset per sample size estimation in Olofsson et al. [35], for instance using high resolution Planet data, could improve future change estimations.
In addition to model accuracy, the decision as to what approach to employ in an operational context is ultimately shaped by the users’ priorities. As an example, in Table 4, we connect the trade-offs highlighted in the accuracy assessment above to different mangrove monitoring priorities. For our purposes, the Belize Forest Department prioritized the ability to detect true change, with the best possible balance of recall and precision, allowing the department to focus on monitoring and enforcement efforts.

4.2. Limitations

The LandTrendr and CCDC-SMA outputs used in this work reflect only the first year in which a change was detected. This means that changes in years subsequent to the first change flagged by the model could not be assessed in the accuracy assessment. Furthermore, if regrowth occurred between the change and the year the accuracy data were collected, then the model may have flagged a change for a pixel that was recorded as stable in the accuracy data.
Another limitation is that although we systematically tested several combinations of parameter values for both models, these values are still inherently arbitrary. Nevertheless, our results can inform the algorithms’ use in monitoring by demonstrating how incrementally adjusting individual parameters impacts the accuracy of change detection in Belizean mangroves.
Finally, we used the default endmember parameters for the Tropics in the CCDC-SMA application available in GEE. Given the importance of accurate endmember values to CCDC-SMA, updated values sampled from the study region could improve the algorithm’s detection of mangroves in Belize.

4.3. Future Directions

The methodology and results presented here offer a foundation for continued monitoring in mangrove forests across Belize. While this research utilized Landsat, future work could leverage fusion approaches that integrate SAR and optical sensors to further combat cloud cover [36] or Planet NICFI (Norway’s International Climate & Forests Initiative) for its higher spatial resolution.
While this work attempted to characterize change extent, a deeper understanding of the identified changes would benefit the Belize Forest Department for monitoring, prevention of future disturbance, and restoration efforts. For example, further investigation of LandTrendr parameters and outputs to categorize the intensity of disturbances, as well as the inclusion of other data sources to cross-reference causes of mangrove changes, would aid improved intervention with local partners. In regions such as Gra Gra Lagoon, which experienced a high percentage of the changes identified within protected areas, is known to be impacted by fires and hurricanes. Finally, while the expansion of the Neuland Community, located in the Corozal District, is known to local officials, it is important to continue monitoring any long-term eastward expansion that could affect the mangrove ecosystems in that area.
Another topic of interest for future work is to expand the application of LandTrendr and CCDC-SMA beyond loss detection to also identify and monitor areas of regeneration/restoration and colonization of new areas by mangroves. This provides a more complete understanding of mangrove dynamics and resilience directly informing community-based restoration efforts. This also ensures effective monitoring of these ecosystems that can be integrated into broader national restoration efforts, also encompassing other important ecosystems.
This methodology provides a replicable framework for mangrove management practitioners to adapt two temporal segmentation approaches to monitoring needs. It also contributes to the body of work that applies such methods to mangrove ecosystems globally [8,9]. While our parameter values reflect Belizean mangrove characteristics (small-scale clearing patterns, five-year recovery rates, etc.), our approach of iteratively testing across multiple model runs and validation against local reference data is transferable to any mangrove region with appropriate reference data. While it is naturally expected that model parameters require tuning for different contexts, little work details the parameterization process with management practitioners in mind. Current global mangrove products, while valuable in broad studies, often lack the spatial detail necessary to support national-level management decision making. Our approach demonstrates how change detection algorithms can bridge the gap between global products and local management needs.

5. Conclusions

We compared two time-series, segmentation approaches to change detection in Belizean mangroves. Both models produced results with similar overall accuracy (LandTrendr: 0.67–0.75, CCDC-SMA: 0.66–0.72) with high precision and low false-positive rates for the majority of runs. However, recall was very low for both approaches, with LandTrendr performing slightly better than CCDC-SMA. In other words, LandTrendr’s change detection was better aligned with the reference data. The uneven temporal coverage of our reference dataset likely contributed to the generally low recall results across runs. The tradeoff between precision and recall was starker for CCDC-SMA than for LandTrendr. This may have been related to the potential for more specific fine-tuning in LandTrendr and the differences in model fitting approaches.
The integration of change detection algorithms such as LandTrendr and CCDC-SMA into mangrove mapping for Belize advances the temporal and spatial resolution of change detection critical for coastal ecosystem management. By identifying mangrove disturbances, supporting restoration planning, and prioritizing intervention areas, this approach can inform blue carbon efforts essential to monitoring, reporting, and verification systems.
This information can be used to inform national policy and enhance transparency for conservation and protection efforts. Since Belize relies on mangrove ecosystems for coastal protection, fisheries, and biodiversity, combining high-resolution monitoring with local expert knowledge is crucial to ensure long-term resilience and protection of these vital ecosystems. As Belize advances work on its National Mangrove Restoration Action plan, these tools can support data-driven restoration planning and the tracking of ecosystem recovery over time.

Author Contributions

Conceptualization, C.E., L.C., F.G., E.A.C. and E.C.; data curation, C.E., L.C., F.G., E.A.C. and E.C.; formal analysis, C.E., L.C., F.G. and E.A.C.; funding acquisition, E.A.C. and E.C.; investigation, C.E., L.C. and F.G.; methodology, C.E., L.C., F.G. and E.A.C.; resources, C.E., L.C., F.G., E.A.C. and E.C.; software, C.E., L.C. and E.A.C.; supervision, E.A.C. and E.C.; validation, C.E., L.C., E.C. and D.Q.; visualization, C.E.; writing—original draft, C.E., L.C. and F.G.; writing—review and editing, E.A.C., E.C. and D.Q. All authors have read and agreed to the published version of the manuscript.

Funding

Funding for this work was provided through the cooperative agreement 80MSFC22N0004 between NASA and UAH.

Data Availability Statement

This analysis was based on the Cherrington et al., 2020 [11] stable mangrove extent for 2017 which can be found here: “Data for: use of public Earth Observation data for tracking progress in the sustainable management of coastal forest ecosystems in Belize, Central America”, Mendeley Data, V1, https://doi.org/10.17632/2fzbnpnsdp.1 (accessed on 1 January 2025). Data generated during this analysis can be found here: Evans et al. (2025) [37]. Data for cloud-based solutions for monitoring coastal ecosystems and the prioritization of restoration efforts across Belize [dataset]. Zenodo. https://doi.org/10.5281/zenodo.15328468 (accessed on 2 May 2025). Change detection algorithm sources: [https://emapr.github.io/LT-GEE/api.html (accessed on 1 January 2025)] and [https://github.com/shijuanchen/forest_degradation_georgia.git (accessed on 1 January 2025)].

Acknowledgments

SERVIR was a joint NASA- and USAID-led program. Fieldwork was conducted by the Belize Forest Department of the Ministry of Sustainable Development, Climate Change, and Solid Waste Management, including funding from the Belize Fund for a Sustainable Future, through the Government of Belize’s Government Special Allocation (GSA) through the Blue Bond and Finance Permanence Unit. The analysis for this work was carried out using Google Earth Engine, under a research license.

Conflicts of Interest

The authors report that there are no competing interests to declare.

Appendix A. Tables

Table A1. Default endmember values from the CCDC-SMA Tropics application available in GEE.
Control End-Members (c)
BandSoilGreen Veg.CloudShadeNPV
B12000500900001400
B23000900960001700
B33400400800002200
B458006100780003000
B560003000720005500
B658001000650003000
Table A2. Accuracy results for all model variations in LandTrendr for the detection of true changes.
Run AliasPrecisionRecallOverall AccuracyFalse-Positive Rate
MMU110.940.230.710.01
MMU50.950.270.730.01
MMU10.800.360.740.05
MS40.830.380.750.04
MS60.830.380.750.04
MS120.800.360.740.05
RT0250.790.330.730.05
RT050.800.360.740.05
RT0750.770.360.730.06
BMP050.790.350.730.05
BMP10.800.360.740.05
BMP1250.800.120.670.02
Final0.830.380.750.04
Table A3. Accuracy Results for all model variations in CCDC-SMA for the detection of true changes.
Run AliasPrecisionRecallOverall AccuracyFalse-Positive Rate
c00.650.230.680.07
pv0x10.670.240.670.07
pv0y10.630.260.680.09
pv0x30.590.240.660.09
c26000.940.240.720.01
pv2600x10.890.240.710.02
pv2600y10.940.230.710.01
pv2600x30.930.210.710.01
c700010.170.700
pv7000x110.170.700
pv7000y110.120.680
pv7000x310.110.680
c1000010.120.680
pv10000x110.120.680
pv10000y110.110.680
pv10000x310.090.670

Appendix B. Figures

Figure A1. Hectares of mangrove change in protected areas. Included are 15 of the 28 affected protected areas.
Remotesensing 17 03396 g0a1

References

  1. Spalding, M.D.; Leal, M. The State of the World’s Mangroves 2024; Global Mangrove Alliance: Arlington, VA, USA, 2024. [Google Scholar]
  2. Government of Belize. Updated Nationally Determined Contribution; Government of Belize: Belmopan, Belize, 2021.
  3. Menéndez, P.; Losada, I.J.; Torres-Ortega, S.; Narayan, S.; Beck, M.W. The Global Flood Protection Benefits of Mangroves. Sci. Rep. 2020, 10, 4404. [Google Scholar] [CrossRef]
  4. The Nature Conservancy. Belize Blue Bonds for Ocean Conservation; The Nature Conservancy: Arlington, VA, 2023. [Google Scholar]
  5. Maurya, K.; Mahajan, S.; Chaube, N. Remote Sensing Techniques: Mapping and Monitoring of Mangrove Ecosystem—A Review. Complex Intell. Syst. 2021, 7, 2797–2818. [Google Scholar] [CrossRef]
  6. Tran, T.V.; Reef, R.; Zhu, X. A Review of Spectral Indices for Mangrove Remote Sensing. Remote Sens. 2022, 14, 4868. [Google Scholar] [CrossRef]
  7. Zhang, Y.; Li, X.; Zhang, R.; Cheng, L.; Jia, M.; Zhao, C.; Guo, X.; Zeng, H.; Yu, W.; Shi, Q.; et al. A Robust and Efficient Approach to Estimating the Age of Secondary Mangrove Forests Employing Time-Series Landsat Images and the CCDC Model. Int. J. Appl. Earth Obs. Geoinf. 2025, 143, 104789. [Google Scholar] [CrossRef]
  8. de Jong, S.M.; Shen, Y.; de Vries, J.; Bijnaar, G.; van Maanen, B.; Augustinus, P.; Verweij, P. Mapping Mangrove Dynamics and Colonization Patterns at the Suriname Coast Using Historic Satellite Data and the LandTrendr Algorithm. Int. J. Appl. Earth Obs. Geoinf. 2021, 97, 102293. [Google Scholar] [CrossRef]
  9. Awty-Carroll, K.; Bunting, P.; Hardy, A.; Bell, G. Using Continuous Change Detection and Classification of Landsat Data to Investigate Long-Term Mangrove Dynamics in the Sundarbans Region. Remote Sens. 2019, 11, 2833. [Google Scholar] [CrossRef]
  10. Cherrington, E.A.; Hernandez, B.E.; Trejos, N.A.; Smith, O.A.; Anderson, E.R.; Flores, A.I.; BC, G. Identification of Threatened and Resilient Mangroves in the Belize Barrier Reef System; Technical Report to the World Wildlife Fund; CATHALAC/SERVIR: Clayton, Panama, 2010. [Google Scholar]
  11. Cherrington, E.A.; Griffin, R.E.; Anderson, E.R.; Hernandez Sandoval, B.E.; Flores-Anderson, A.I.; Muench, R.E.; Markert, K.N.; Adams, E.C.; Limaye, A.S.; Irwin, D.E. Use of Public Earth Observation Data for Tracking Progress in Sustainable Management of Coastal Forest Ecosystems in Belize, Central America. Remote Sens. Environ. 2020, 245, 111798. [Google Scholar] [CrossRef]
  12. Cissell, J.R.; Canty, S.W.J.; Steinberg, M.K.; Simpson, L.T. Mapping National Mangrove Cover for Belize Using Google Earth Engine and Sentinel-2 Imagery. Appl. Sci. 2021, 11, 4258. [Google Scholar] [CrossRef]
  13. CATHALAC. The Development of a Land Use Land Cover Map of 2018 Using Sentinel-2 Images under the REDD+ Project in Belize; Product 5 Final Report; CATHALAC: Clayton, Panama, 2020. [Google Scholar]
  14. Hemati, M.; Hasanlou, M.; Mahdianpari, M.; Mohammadimanesh, F. A Systematic Review of Landsat Data for Change Detection Applications: 50 Years of Monitoring the Earth. Remote Sens. 2021, 13, 2869. [Google Scholar] [CrossRef]
  15. Gorelick, N.; Hancher, M.; Dixon, M.; Ilyushchenko, S.; Thau, D.; Moore, R. Google Earth Engine: Planetary-Scale Geospatial Analysis for Everyone. Remote Sens. Environ. 2017, 202, 18–27. [Google Scholar] [CrossRef]
  16. Pasquarella, V.J.; Arévalo, P.; Bratley, K.H.; Bullock, E.L.; Gorelick, N.; Yang, Z.; Kennedy, R.E. Demystifying LandTrendr and CCDC Temporal Segmentation. Int. J. Appl. Earth Obs. Geoinf. 2022, 110, 102806. [Google Scholar] [CrossRef]
  17. Murakami, T.; Tsutsumida, N. Comparative Global Assessment and Optimization of LandTrendr, CCDC, and BFAST Algorithms for Enhanced Urban Land Cover Change Detection Using Landsat Time Series. Remote Sens. 2025, 17, 2402. [Google Scholar] [CrossRef]
  18. Yin, X.; Li, M.; Lai, H.; Kou, W.; Chen, Y.; Chen, B. Utilizing Multi-Source Data and Cloud Computing Platform to Map Short-Rotation Eucalyptus Plantations Distribution and Stand Age in Hainan Island. Forests 2024, 15, 925. [Google Scholar] [CrossRef]
  19. Ding, N.; Li, M. Mapping Forest Abrupt Disturbance Events in Southeastern China—Comparisons and Tradeoffs of Landsat Time Series Analysis Algorithms. Remote Sens. 2023, 15, 5408. [Google Scholar] [CrossRef]
  20. Bunting, P.; Rosenqvist, A.; Lucas, R.M.; Rebelo, L.-M.; Hilarides, L.; Thomas, N.; Hardy, A.; Itoh, T.; Shimada, M.; Finlayson, C.M. The Global Mangrove Watch—A New 2010 Global Baseline of Mangrove Extent. Remote Sens. 2018, 10, 1669. [Google Scholar] [CrossRef]
  21. Kennedy, R.E.; Yang, Z.; Gorelick, N.; Braaten, J.; Cavalcante, L.; Cohen, W.B.; Healey, S. Implementation of the LandTrendr Algorithm on Google Earth Engine. Remote Sens. 2018, 10, 691. [Google Scholar] [CrossRef]
  22. Chen, S.; Woodcock, C.E.; Bullock, E.L.; Arévalo, P.; Torchinava, P.; Peng, S.; Olofsson, P. Monitoring Temperate Forest Degradation on Google Earth Engine Using Landsat Time Series Analysis. Remote Sens. Environ. 2021, 265, 112648. [Google Scholar] [CrossRef]
  23. Zhu, Z.; Woodcock, C.E. Continuous Change Detection and Classification of Land Cover Using All Available Landsat Data. Remote Sens. Environ. 2014, 144, 152–171. [Google Scholar] [CrossRef]
  24. Chen, S.; Olofsson, P.; Saphangthong, T.; Woodcock, C.E. Monitoring Shifting Cultivation in Laos with Landsat Time Series. Remote Sens. Environ. 2023, 288, 113507. [Google Scholar] [CrossRef]
  25. Souza, C.M.; Roberts, D.A.; Cochrane, M.A. Combining Spectral and Spatial Information to Map Canopy Damage from Selective Logging and Forest Fires. Remote Sens. Environ. 2005, 98, 329–343. [Google Scholar] [CrossRef]
  26. Kennedy, R.E.; Yang, Z.; Cohen, W.B. Detecting Trends in Forest Disturbance and Recovery Using Yearly Landsat Time Series: I. LandTrendr—Temporal Segmentation Algorithms. Remote Sens. Environ. 2010, 114, 2897–2910. [Google Scholar] [CrossRef]
  27. Cohen, W.B.; Yang, Z.; Healey, S.P.; Kennedy, R.E.; Gorelick, N. A LandTrendr Multispectral Ensemble for Forest Disturbance Detection. Remote Sens. Environ. 2018, 205, 131–140. [Google Scholar] [CrossRef]
  28. Yang, Y.; Erskine, P.D.; Lechner, A.M.; Mulligan, D.; Zhang, S.; Wang, Z. Detecting the Dynamics of Vegetation Disturbance and Recovery in Surface Mining Area via Landsat Imagery and LandTrendr Algorithm. J. Clean. Prod. 2018, 178, 353–362. [Google Scholar] [CrossRef]
  29. Fragal, E.H.; Silva, T.S.F.; de Moura, E.M.L. Reconstructing Historical Forest Cover Change in the Lower Amazon Floodplains Using the LandTrendr Algorithm. Acta Amaz. 2016, 46, 13–24. [Google Scholar] [CrossRef]
  30. Murillo-Sandoval, P.J.; Fatoyinbo, L.; Simard, M. Mangroves Cover Change Trajectories 1984–2020: The Gradual Decrease of Mangroves in Colombia. Front. Mar. Sci. 2022, 9, 892946. [Google Scholar] [CrossRef]
  31. Fromard, F.; Vega, C.; Proisy, C. Half a Century of Dynamic Coastal Change Affecting Mangrove Shorelines of French Guiana: A Case Study Based on Remote Sensing Data Analyses and Field Surveys. Mar. Geol. 2004, 208, 265–280. [Google Scholar] [CrossRef]
  32. Huang, X.; Fu, Y.; Ding, H.; Tang, G.; Ma, P.; Liu, L.; Xue, Y.; Wu, S.; Chen, Y. Inter-Annual Changes and Growth Trends Mapping of Mangrove Using Landsat Time Series Imagery. GISci. Remote Sens. 2025, 62, 2480422. [Google Scholar] [CrossRef]
  33. Ghosh, M.K.; Kumar, L.; Roy, C. Mapping Long-Term Changes in Mangrove Species Composition and Distribution in the Sundarbans. Forests 2016, 7, 305. [Google Scholar] [CrossRef]
  34. Sun, C.; Liu, Y.; Zhao, S.; Zhou, M.; Yang, Y.; Li, F. Classification Mapping and Species Identification of Salt Marshes Based on a Short-Time Interval NDVI Time-Series from HJ-1 Optical Imagery. Int. J. Appl. Earth Obs. Geoinf. 2016, 45, 27–41. [Google Scholar] [CrossRef]
  35. Olofsson, P.; Foody, G.M.; Herold, M.; Stehman, S.V.; Woodcock, C.E.; Wulder, M.A. Good Practices for Estimating Area and Assessing Accuracy of Land Change. Remote Sens. Environ. 2014, 148, 42–57. [Google Scholar] [CrossRef]
  36. Chan-Bagot, K.; Herndon, K.E.; Puzzi Nicolau, A.; Martín-Arias, V.; Evans, C.; Parache, H.; Mosely, K.; Narine, Z.; Zutta, B. Integrating SAR, Optical, and Machine Learning for Enhanced Coastal Mangrove Monitoring in Guyana. Remote Sens. 2024, 16, 542. [Google Scholar] [CrossRef]
  37. Evans, C.; Carey, L.; Guerra, F.; Cherrington, E.; Correa, E. Data for: Cloud-Based Solutions for Monitoring Coastal Ecosystems and Prioritization of Restoration Efforts Across Belize [Data Set]. Zenodo. 2025. Available online: https://zenodo.org/records/15328468 (accessed on 2 May 2025).
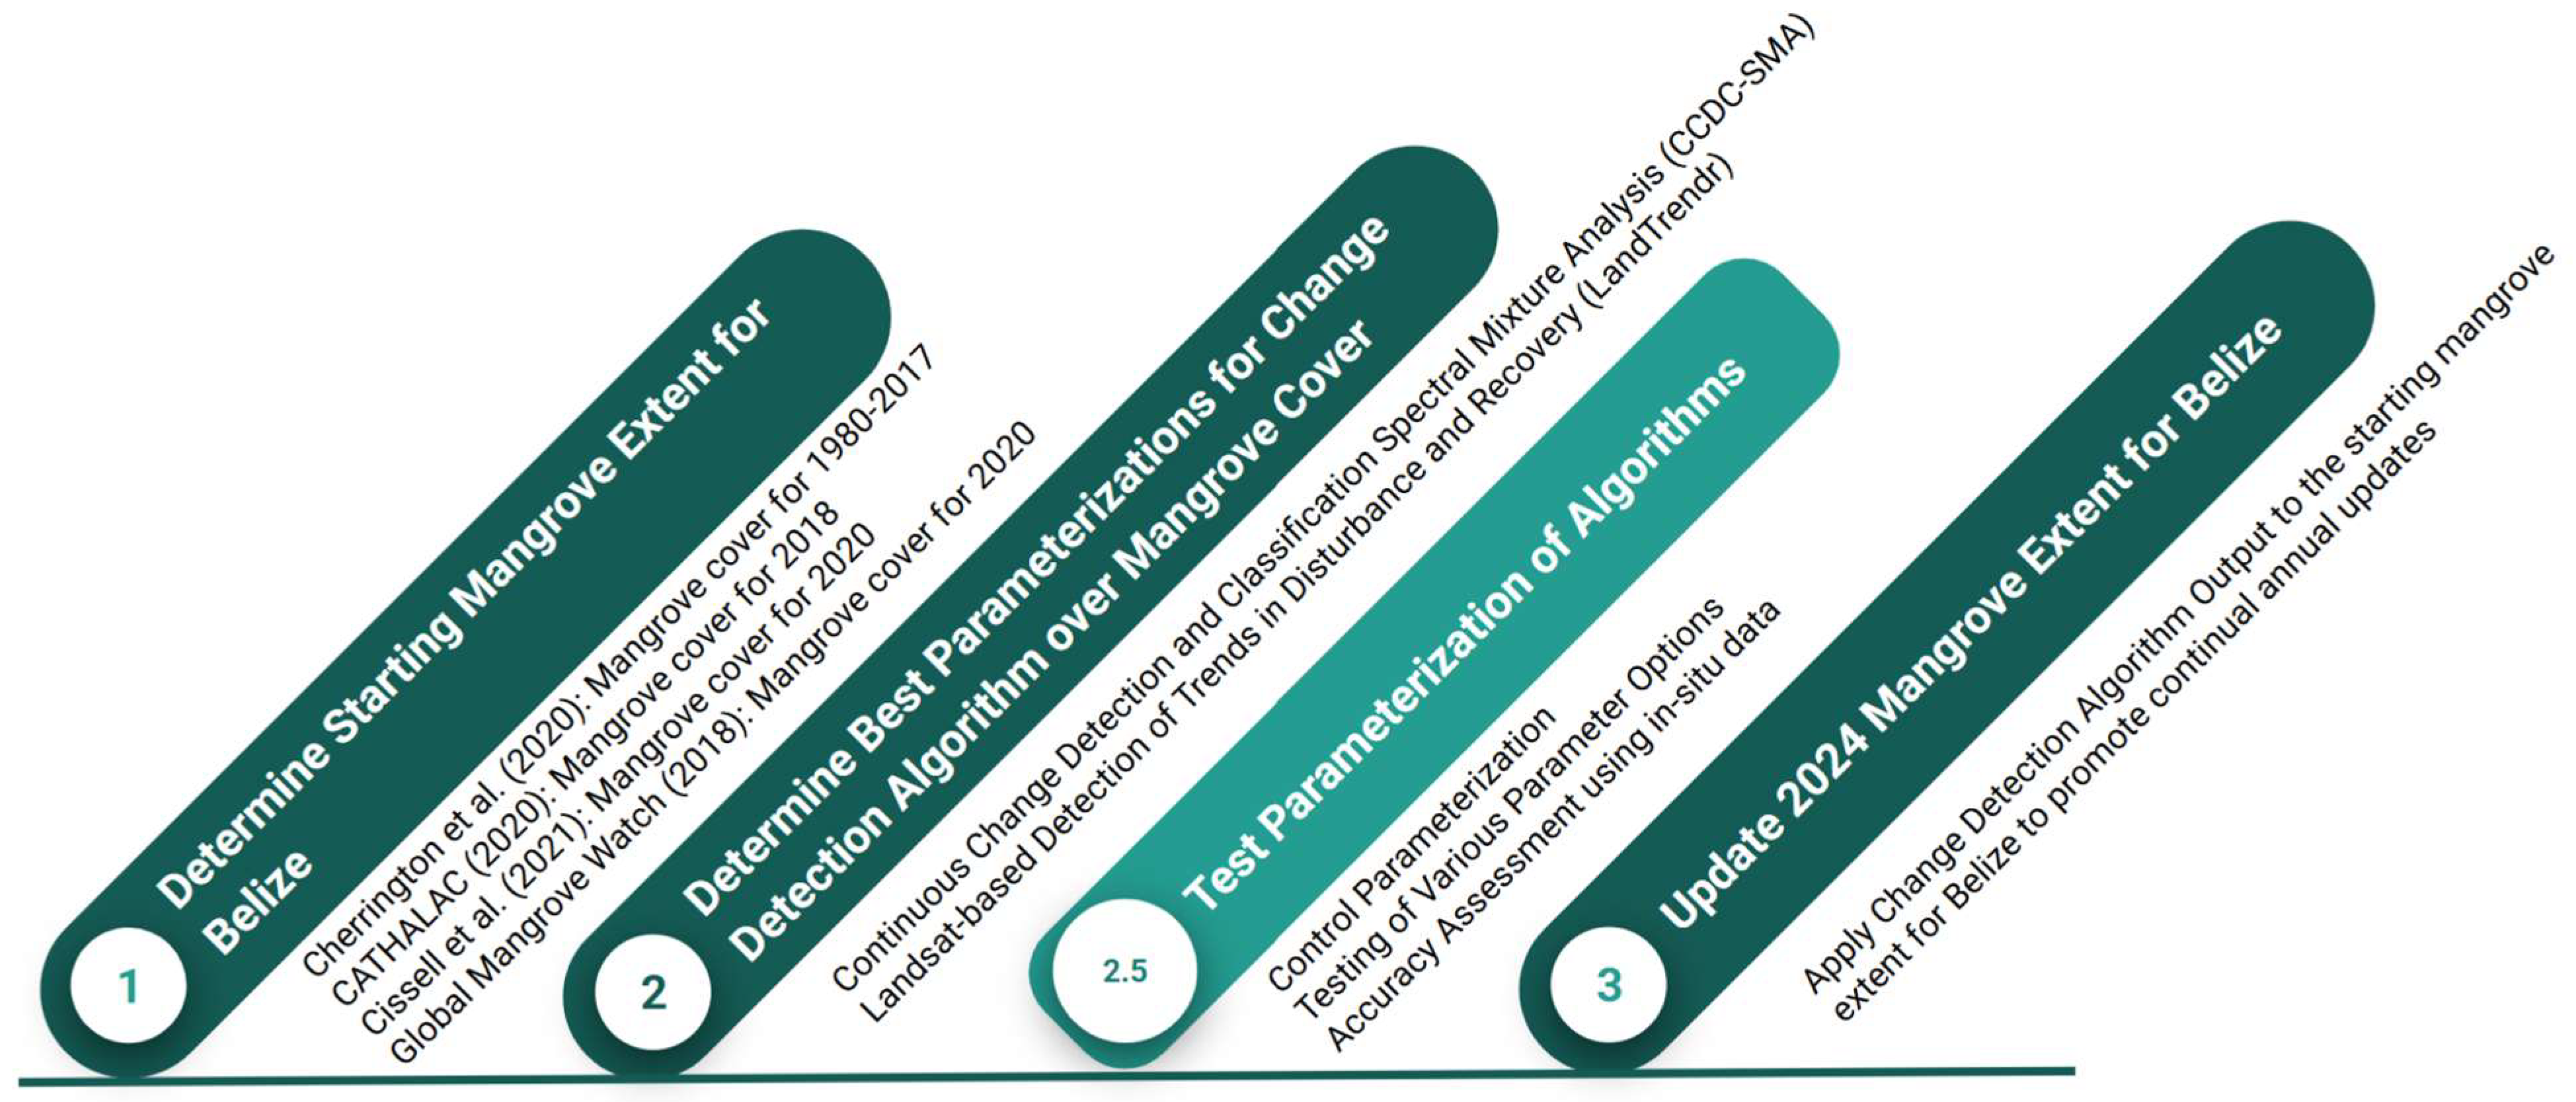
Figure 1. Research workflow, highlighting four different phases for updating Belize’s mangrove extent in 2024 [11,12,13,20].
Remotesensing 17 03396 g001
Figure 2. The Cherrington et al. (2020) [11] stable mangrove extent for 2017, which serves as the starting extent for this analysis. The survey and permit points provided by the Belize Forest Department for the validation of this study are also shown. The inset of Belize City shows mangrove loss between 1980 and 2017, alongside stable areas of mangrove.
Remotesensing 17 03396 g002
Figure 3. Example comparison of different MMU paramerizations over mangroves near Belize City, where a permit for removal of 0.3 ha was issued; 16 May 2017 Maxar imagery, 19 February 2024 Airbus imagery within Google Earth Pro. Example selected due to verified change identified though both permit data and MMU1 parameterization.
Remotesensing 17 03396 g003
Figure 4. The updated 2024 mangrove extent across Belize.
Remotesensing 17 03396 g004
Figure 5. Spatial distribution of reference dataset points used for the accuracy assessment of LandTrendr change detection results. Each panel shows the same geographic extent with reference points colored by their confusion matrix classification: reference points correctly labeled as change (white), reference points incorrectly labeled as change (red), reference points correctly identified as stable (blue), reference points incorrectly identified as stable (yellow).
Remotesensing 17 03396 g005
Figure 6. Spatial distribution of reference dataset points used for the accuracy assessment of CCDC-SMA change detection results. Each panel shows the same geographic extent with reference points colored by their confusion matrix classification: reference points correctly labeled as change (white), reference points incorrectly labeled as change (red), reference points correctly identified as stable (blue), reference points incorrectly identified as stable (yellow).
Remotesensing 17 03396 g006
Figure 7. Accuracy results of both LandTrendr and CCDC-SMA runs; boxes show the range of 50% of the metric values while vertical lines indicate minimum and maximum.
Remotesensing 17 03396 g007
Table 1. Variations in CCDC-SMA parameterizations, tailored for mangrove change detection. The control run was the starting point within each threshold group from which we adjusted the change probability and number of consecutive changes.
Run AliasThresholdChange ProbabilityNumber of Consecutive Changes
Controlc000.995
Parameter Variationspv0x100.985
pv0y100.998
pv0x300.988
Controlc260026000.995
Parameter Variationspv2600x126000.985
pv2600y126000.998
pv2600x326000.988
Controlc700070000.995
Parameter Variationspv7000x170000.985
pv7000y170000.998
pv7000x370000.988
Controlc1000010,0000.995
Parameter Variationspv10000x110,0000.985
pv10000y110,0000.998
pv10000x310,0000.988
Table 2. Variations in LandTrendr parameterizations, tailored for mangrove change detection and based on de Jong et al. [8].
Run AliasMax SegmentsSpike ThresholdVertex Count OvershootPrevent One Year RecoveryRecovery ThresholdPval ThresholdBest Model ProportionMin Observations NeededMagnitudePrevalueMMU
ControlMMU1100.93TRUE10.050.753>300>3001
Parameter VariationsMS440.93TRUE10.050.753>300>3001
MS660.93TRUE10.050.753>300>3001
MS12120.93TRUE10.050.753>300>3001
RT025100.93TRUE0.250.050.753>300>3001
RT05100.93TRUE0.500.050.753>300>3001
RT075100.93TRUE0.750.050.753>300>3001
BMP05100.93TRUE10.050.53>300>3001
BMP1100.93TRUE10.0513>300>3001
BMP125100.93TRUE10.051.253>300>3001
Final ParameterizationFinal40.93TRUE0.500.0513>300>3001
Table 3. Estimated area of change in mangrove cover (ha) by year determined by the best-performing algorithm run.
Best Performing Algorithm RunAnnual Change in Mangroves (ha.) Detected by Change Detection Algorithms Combined (2017–2024) Change Within Protected Areas
(ha.|% Total Change)
20172018201920202021202220232024Total
LandTrendr
(Final)
34.2044.0348.82144.9955.3570.6776.9365.01540.01135.5825.11%
CCDC-SMA
(c2600)
202.18123.24816.63125.9396.48111.93232.36378.362087.11356.0717.06%
Table 4. Translating model parameterization to monitoring priorities for mangroves requires users to weigh tradeoffs between how certain predictions of change are vs. those of stability.
What Is the Monitoring Priority?CCDC-SMALandTrendr
Better certainty of changeExample: run c2600Example: run MMU1
Increasing the change threshold resulted in a more restrictive change detection. A model with higher recall and lower false positives prioritizes this.Lowering the MMU, while producing more false positives, it successfully identified more actual mangrove loss events, making it suitable when the priority is ensuring real changes are not missed.
Better certainty of stability Example: run pv0x1Example: runs MMU11, MMU5, or BMP125
Lowering the change threshold resulted in a more inclusive change detection, meaning more false positives. However, there is also more certainty that pixels classified as unchanged are truly stable.Although missing some key locations of mangrove loss, increasing MMU or BMP parameters provides higher confidence that areas classified as stable are truly unchanged.
Disclaimer/Publisher’s Note: The statements, opinions and data contained in all publications are solely those of the individual author(s) and contributor(s) and not of MDPI and/or the editor(s). MDPI and/or the editor(s) disclaim responsibility for any injury to people or property resulting from any ideas, methods, instructions or products referred to in the content.