Article

Development of a Quantitative Survey Method for Pelagic Fish Aggregations Around an Offshore Wind Farm Using Multibeam Sonar

1
Formerly Atmosphere and Ocean Research Institute, The University of Tokyo, 5-1-5 Kashiwanoha, Kashiwa 277-8564, Japan
2
Engineering Development Department, Technology & Production Development Division, Takenaka Civil Engineering & Construction Co., Ltd., 1-3-3, Shinsuna, Koto-ku, Tokyo 136-0075, Japan
3
Sanyo Techno Marine., Inc., 1-2-17, Horidomecho, Nihonbashi, Chuo-ku, Tokyo 103-0012, Japan
4
Japan Fisheries Information Service Center, 6F, Toyomi Shinkou Building, 4-5, Toyomi-cho, Chuo-ku, Tokyo 104-0055, Japan
5
Japan Fisheries Resource Conservation Association, Shintomicho Building, 3-10-9, Irifune, Chuo-ku, Tokyo 104-0042, Japan
*
Author to whom correspondence should be addressed.
Remote Sens. 2025, 17(18), 3255; https://doi.org/10.3390/rs17183255
Submission received: 21 July 2025 / Revised: 14 September 2025 / Accepted: 15 September 2025 / Published: 21 September 2025

Abstract

Highlights

What are the main finding?
  • A novel method using multibeam sonar was developed to detect and quantify pelagic fish aggregations around underwater structures of an offshore wind turbine and an observation tower.
  • Fish were found to consistently cluster on the leeward side of turbine and observation tower structures, with biomass estimations derived from sonar backscatter data.
What is the implication of the main finding?
  • The method enables 3D visualization and biomass estimation of pelagic fish aggregations near a wind farm, supporting ecological assessments of artificial reef effects.
  • It provides a practical tool for fostering collaboration between offshore wind energy developers and fisheries stakeholders through shared ecological data.

Abstract

Offshore wind farms are rapidly expanding worldwide, and the submerged structures supporting wind turbines have the potential to function as artificial reefs for marine organisms. Quantitative visualization of fish aggregations around these foundations can provide valuable information for promoting collaboration between fisheries and offshore wind energy development. This study explored the use of multibeam sonar to detect spatial distributions and estimate the biomass of pelagic fish aggregations around the foundations of offshore wind power facilities. Fish distribution was extracted from multibeam water column image data using an automated sequence of filtering steps, ending with a spatial filter designed to remove common noise artifacts in multibeam sonar data. The resulting fish aggregations were visualized in three dimensions, revealing a tendency to cluster leeward of turbine and observation tower foundations, and fish biomass was successfully estimated from beam backscatter strength. The developed method can be applied to other offshore wind farms to demonstrate the role of turbine foundations as artificial reefs for fish.

Graphical Abstract

1. Introduction

Many countries are increasingly adopting renewable energy sources, such as wind and solar power [1], to mitigate the global warming crisis by reducing CO2 emissions. Among these, wind energy has become one of the most widely implemented. According to the Global Wind Energy Council, global newly built onshore wind farms generated 109 GW in 2024, while offshore wind farms added 8 GW, bringing the total installed capacity to 1136 GW—an 11% increase compared to the previous year [2]. Interest in offshore wind power is rapidly growing due to several factors: rising energy demand, global transition toward renewable resources, higher and more stable wind speeds over offshore waters compared to land, lower visual and noise impacts on local residents, the potential for greater energy production [3], and the absence of land requirements for facility installation. The successful installation and operation of offshore wind farms (OWFs) require collaboration with fisheries, as many sites overlap with traditional fishing grounds. However, spatial planning often gives insufficient attention to marine habitats and environmental conditions, which are critical for sustaining fisheries resources [4].
In Japan, opposition from local fisheries remains a major challenge for OWF development [5,6]. A major barrier to coexistence between fisheries and OWFs is the absence of regionally integrated fisheries science, monitoring, and research programs capable of effectively evaluating OWF–fisheries interactions. The scale of these interactions and their management depend not only on the extent of ecological impacts but also on the applied regulatory frameworks [7]. For instance, the underwater foundations and supporting structures of OWFs can attract marine organisms, functioning similarly to artificial reefs [8,9]. However, because pile driving and other construction activities can significantly disturb ecosystems [10,11], it is essential to assess the ecological characteristics of proposed sites, particularly their roles as spawning, feeding, and shelter habitats. Such impacts may be mitigated by avoiding sensitive periods. During the operational phase, OWFs may exert both positive and negative effects on marine ecosystems, with outcomes strongly influenced by local environmental conditions [10]. The scarcity of detailed studies on OWF impacts on fisheries has created a substantial knowledge gap, which recent research efforts are beginning to address through novel indirect approaches such as environmental DNA [12].
The use of artificial reefs for fisheries in Japan dates back to the 1600s [13]. While initially constructed primarily to aggregate fish, their functions have expanded since the 1900s to include habitat protection and restoration, with particular emphasis on supporting commercially important species [13]. Artificial reefs can provide benefits comparable to those of marine protected areas [14], but they may also produce negative effects, such as increased fishing pressure and localized overexploitation [15]. The ecological impacts of artificial reefs are influenced by a range of factors, including reef shape, structure, and spatial configuration, as well as environmental conditions such as sediment type and water currents [13]. Consequently, the evaluation of their role in coastal ecosystems requires comprehensive datasets encompassing fish distribution, biomass, and the surrounding seafloor topography [16].
Traditionally, fish distribution around artificial reefs has been investigated through visual observations by divers. This method, however, is largely restricted to benthic species associated with the seafloor [17] and is unsuitable for quantifying pelagic and mesopelagic species occurring in the water column. Consequently, acoustic fisheries surveys have been widely adopted to assess fish distribution near artificial reefs [16,18]. Single-beam echosounders remain the most commonly used tool for quantifying fish distribution and biomass in these environments [16,18,19,20,21]. However, they lack the spatial resolution necessary to accurately characterize seafloor topography and rely heavily on interpolation methods to estimate fish biomass over a given area, which inherently introduces uncertainty into the results.
In contrast, multibeam sonar systems are widely employed to map seafloor topography, providing high-resolution data that allow detection of fine-scale variations in seabed features and the morphology of artificial reefs [22,23]. Unlike single-beam echosounders, which acquire data along a linear transect, multibeam sonar collects water column and seabed information across a swath, typically covering an angle of 120–150° along the survey line. This configuration enables simultaneous acquisition of hundreds of depth soundings—often exceeding 200 per ping—offering substantially higher spatial resolution than single-beam systems and enabling cross-sectional imaging of the water column above the seafloor [24]. With this broader coverage and higher resolution, the applications of multibeam sonar have expanded rapidly, including visualization and biomass estimation of seagrass [25] and seaweed beds [26], detection of gas emissions [27,28], and monitoring of aquaculture facilities [29].
Water column image data obtained with multibeam sonars offer significant advantages for fisheries research, enabling the acquisition of high-resolution three-dimensional imagery [23,24,30,31,32]. The application of multibeam sonars to fisheries acoustics began in the late 1990s [24,30,33,34,35]. However, processing multibeam water column image data remains challenging due to the vast data volumes involved [29] and the prevalence of noise artifacts [32,36,37]. A primary issue arises from side-lobe artifacts generated by the transmit and receive array beam patterns [37,38]. These artifacts, typically produced by strong bottom echoes, generate high-intensity signals that obscure or interfere with the detection of fish targets near the seabed [24,32,37]. Accurately identifying fish echoes in areas of complex seafloor topography, therefore, remains a persistent challenge in acoustic surveys [39,40]. Furthermore, many widely used multibeam sonars are designed primarily for bathymetric applications [24], and their backscatter intensity measurements are not well-suited for fish biomass estimation.
In this study, we developed a method to quantify fish distribution and biomass around OWFs using multibeam sonar, while simultaneously mapping seafloor topography. This approach provides gap-free, three-dimensional mapping of fish aggregations around underwater foundations, allowing more accurate assessment of distribution and biomass, as well as detailed information on the shape of the underwater foundations. To address challenges associated with processing large volumes of multibeam water column image data near structures, we implemented an automated filtering procedure to extract fish echoes in close proximity to underwater foundations. Furthermore, the multibeam sonar employed in this study was calibrated for biomass estimation from water column backscatter data [41], enabling quantitative evaluation of fish biomass based on backscatter strength. The comprehensive data obtained through this type of survey can support coordination between OWFs and the fishing industry, contributing to sustainable resource management.

2. Materials and Methods

2.1. Survey Area

The New Energy and Industrial Technology Development Organization (NEDO, Kawasaki, Japan) has actively promoted offshore renewable energy development and, since 2009, has conducted a demonstration project off the coast of Kitakyushu [42]. In March 2013, an offshore wind observation tower (OT) and an offshore wind turbine (WT)—the WT having a slightly larger foundation than the OT—were installed approximately 1 km offshore from Wakinoura Port, with operations commencing in June 2013 [42]. This facility was the first bottom-fixed offshore wind turbine constructed in western Japan and was developed jointly by Electric Power Development Co., Ltd., Tokyo, Japan (J-POWER) and NEDO.
The study was conducted in the waters off Kitakyushu City, Fukuoka Prefecture, northern Kyushu Island, within the offshore wind power demonstration project area (Figure 1). Two 500 m × 500 m survey areas were designated: (1) the offshore wind farm (OWF) area, including the offshore wind turbine (WT) and observation tower (OT), and (2) a control area without underwater structures, located in an adjacent sea area approximately 1 km away from the OWF (Figure 1).

2.2. Acoustic Survey

Acoustic data were collected on 10 December 2014 in the two survey areas, where bottom depths ranged from 12 to 14 m. Data acquisition was conducted using a Sonic 2024 multibeam sonar system (R2SONIC, Inc., Austin, TX, USA) operating at 200 kHz (see Table 1 for survey settings). At this frequency, the across-track and along-track beam widths were 1° and 2°, respectively.
Water column images (WCI) and bathymetric data were acquired along 20 parallel transects spaced 25 m apart within each survey area. The multibeam sonar provided a swath coverage of approximately 97 m at a depth of 13 m (near the seafloor). Vessel position and motion parameters—including roll, pitch, heave, and heading—were measured using an inertial navigation system, POS/MV V.5 (Applanix Corp., Richmond Hill, ON, Canada). Multibeam data (WCI and bathymetric) and POS/MV data were recorded and processed using the software QINSy V.8.3 (Quality Positioning Services B.V., Zeist, The Netherlands).
To account for frequency-dependent acoustic propagation losses affected by water temperature and salinity [24], a compact CTD sensor, Smart X CTD (AML Oceanographic Ltd., Sideny, BC, Canada) was deployed to measure vertical profiles of temperature and salinity. The sound absorption coefficient in seawater was then calculated using the François-Garrison model [44].

2.3. Fish Sampling

On the same day as the acoustic survey, an underwater camera (Model FM5100, QI Inc., Yokohama, Japan) was deployed from a vessel to assess fish species around the OT, and fish specimens were collected using a fishing rod. Collected individuals were measured onboard for body length (BL) using a vernier caliper and photographed for subsequent species identification. The most frequently observed species in the underwater camera footage was designated as the dominant species for the survey, and the average BL obtained from the collected specimens was used in biomass calculations.

2.4. Bathymetric Data Processing

Bathymetric data collected with the multibeam sonar were processed using QINSy. False bottom detections were manually removed, and the remaining bottom points were interpolated to generate a 2 m resolution grid surface. The interpolated grids were then exported to GIS software (QGIS 3.36.2) for further analysis. Seafloor slope was calculated using the GDAL slope tool in QGIS based on Horn’s method and expressed as a percentage; for instance, a 12% slope corresponds to a vertical rise of 12 cm over 1 m of horizontal distance.

2.5. Water Column Image (WCI) Processing

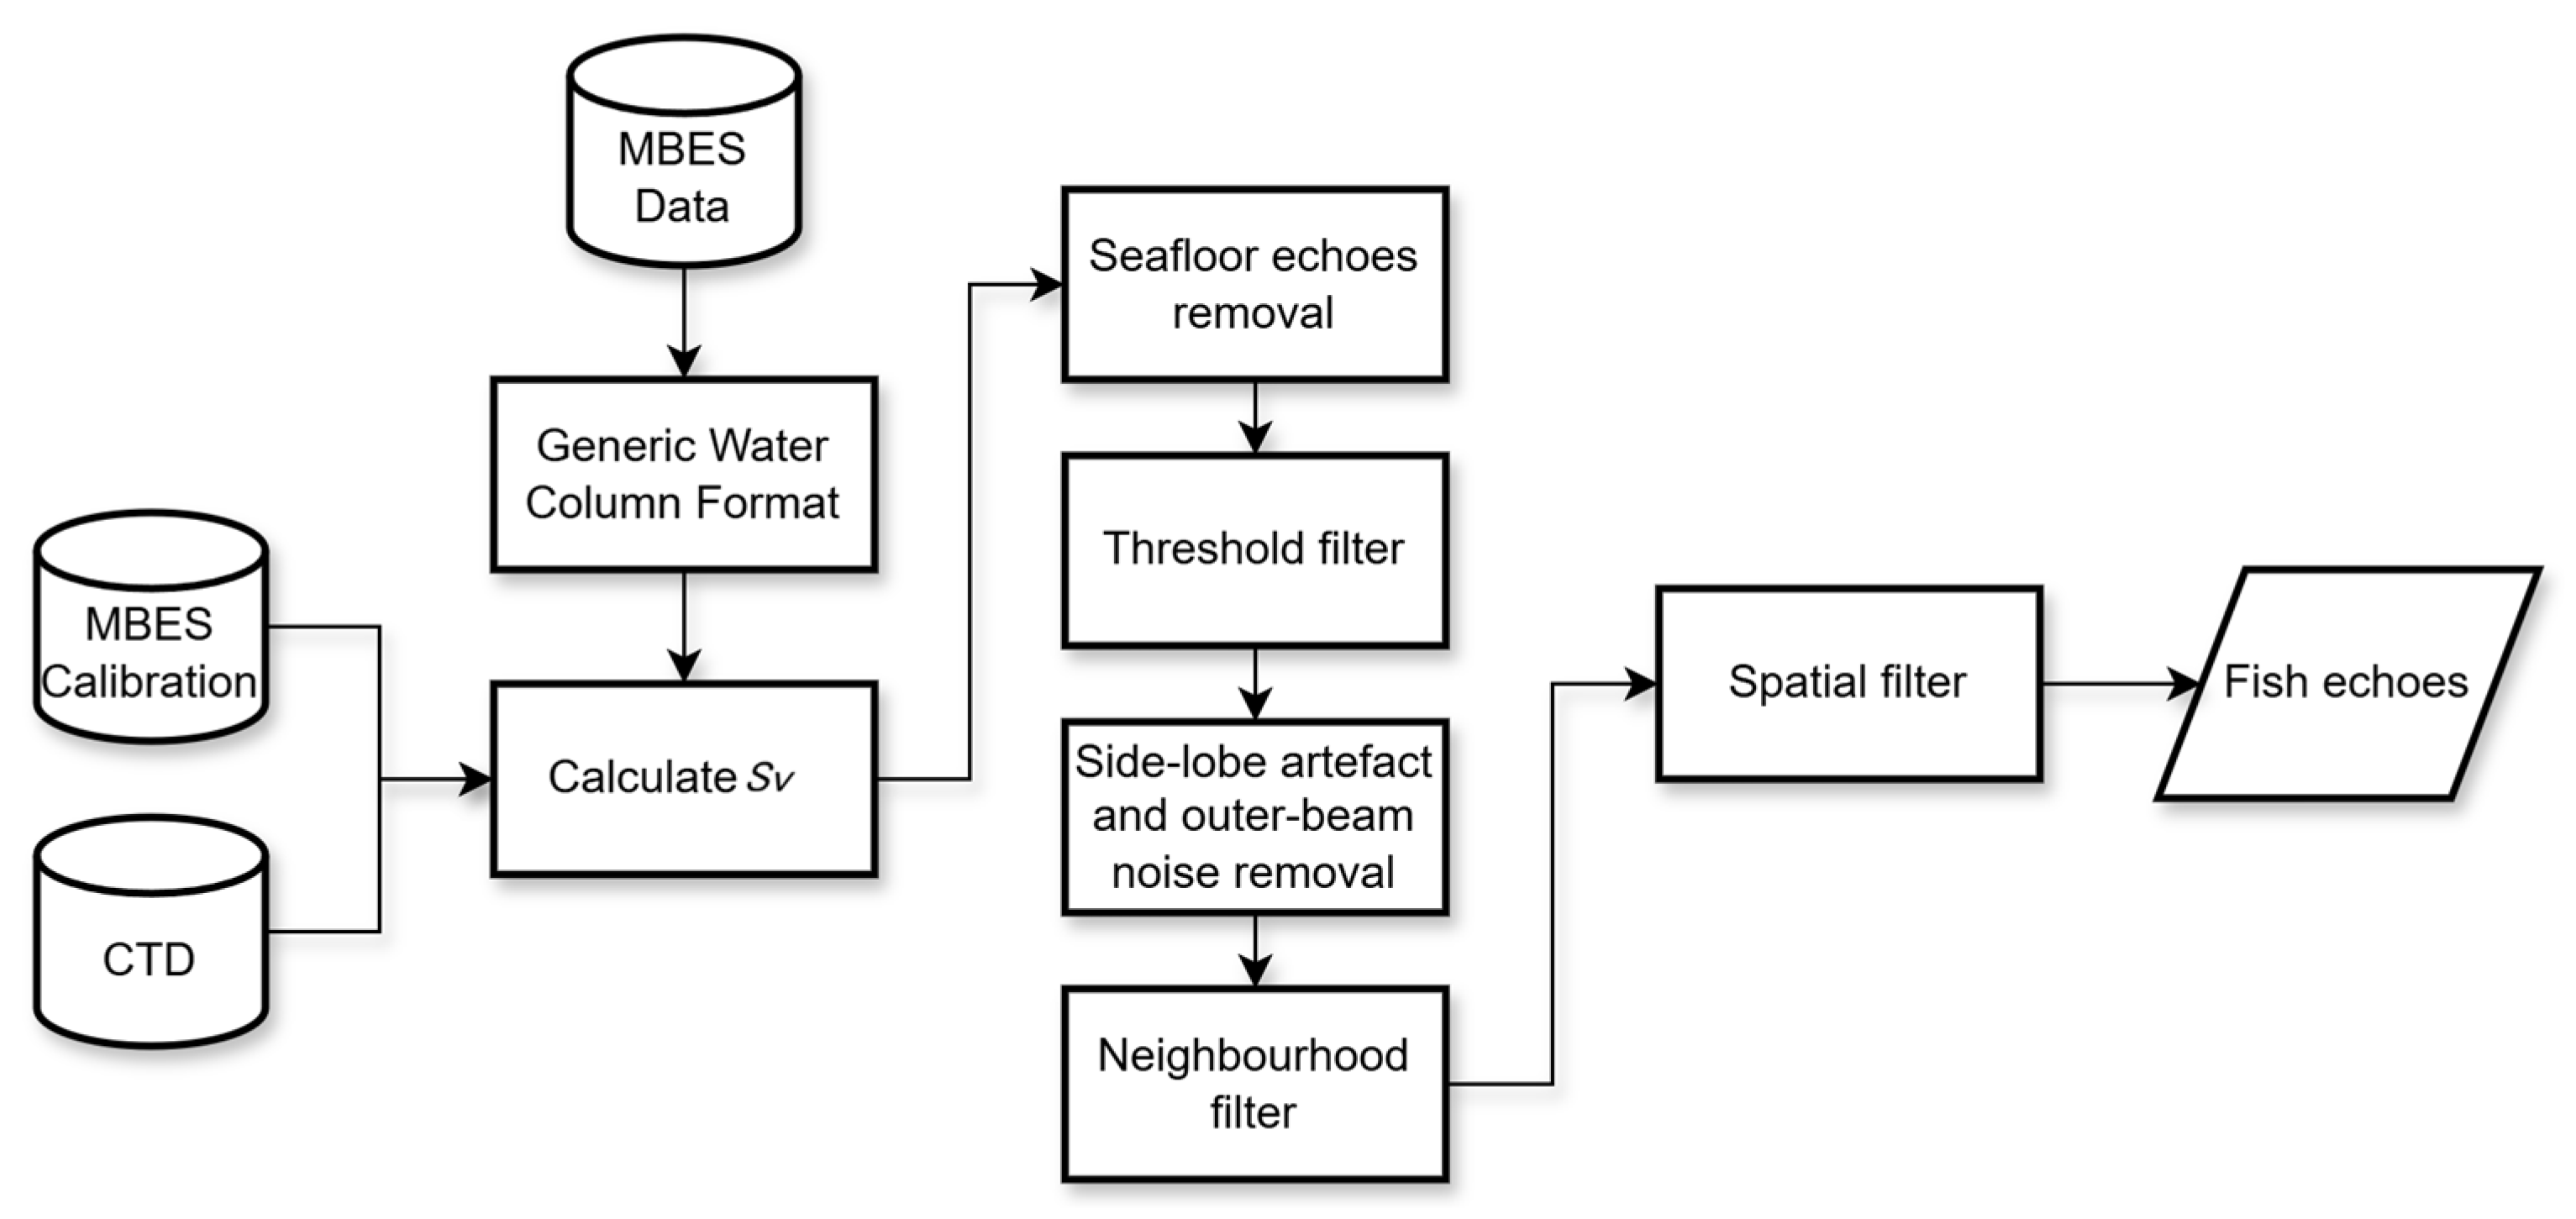
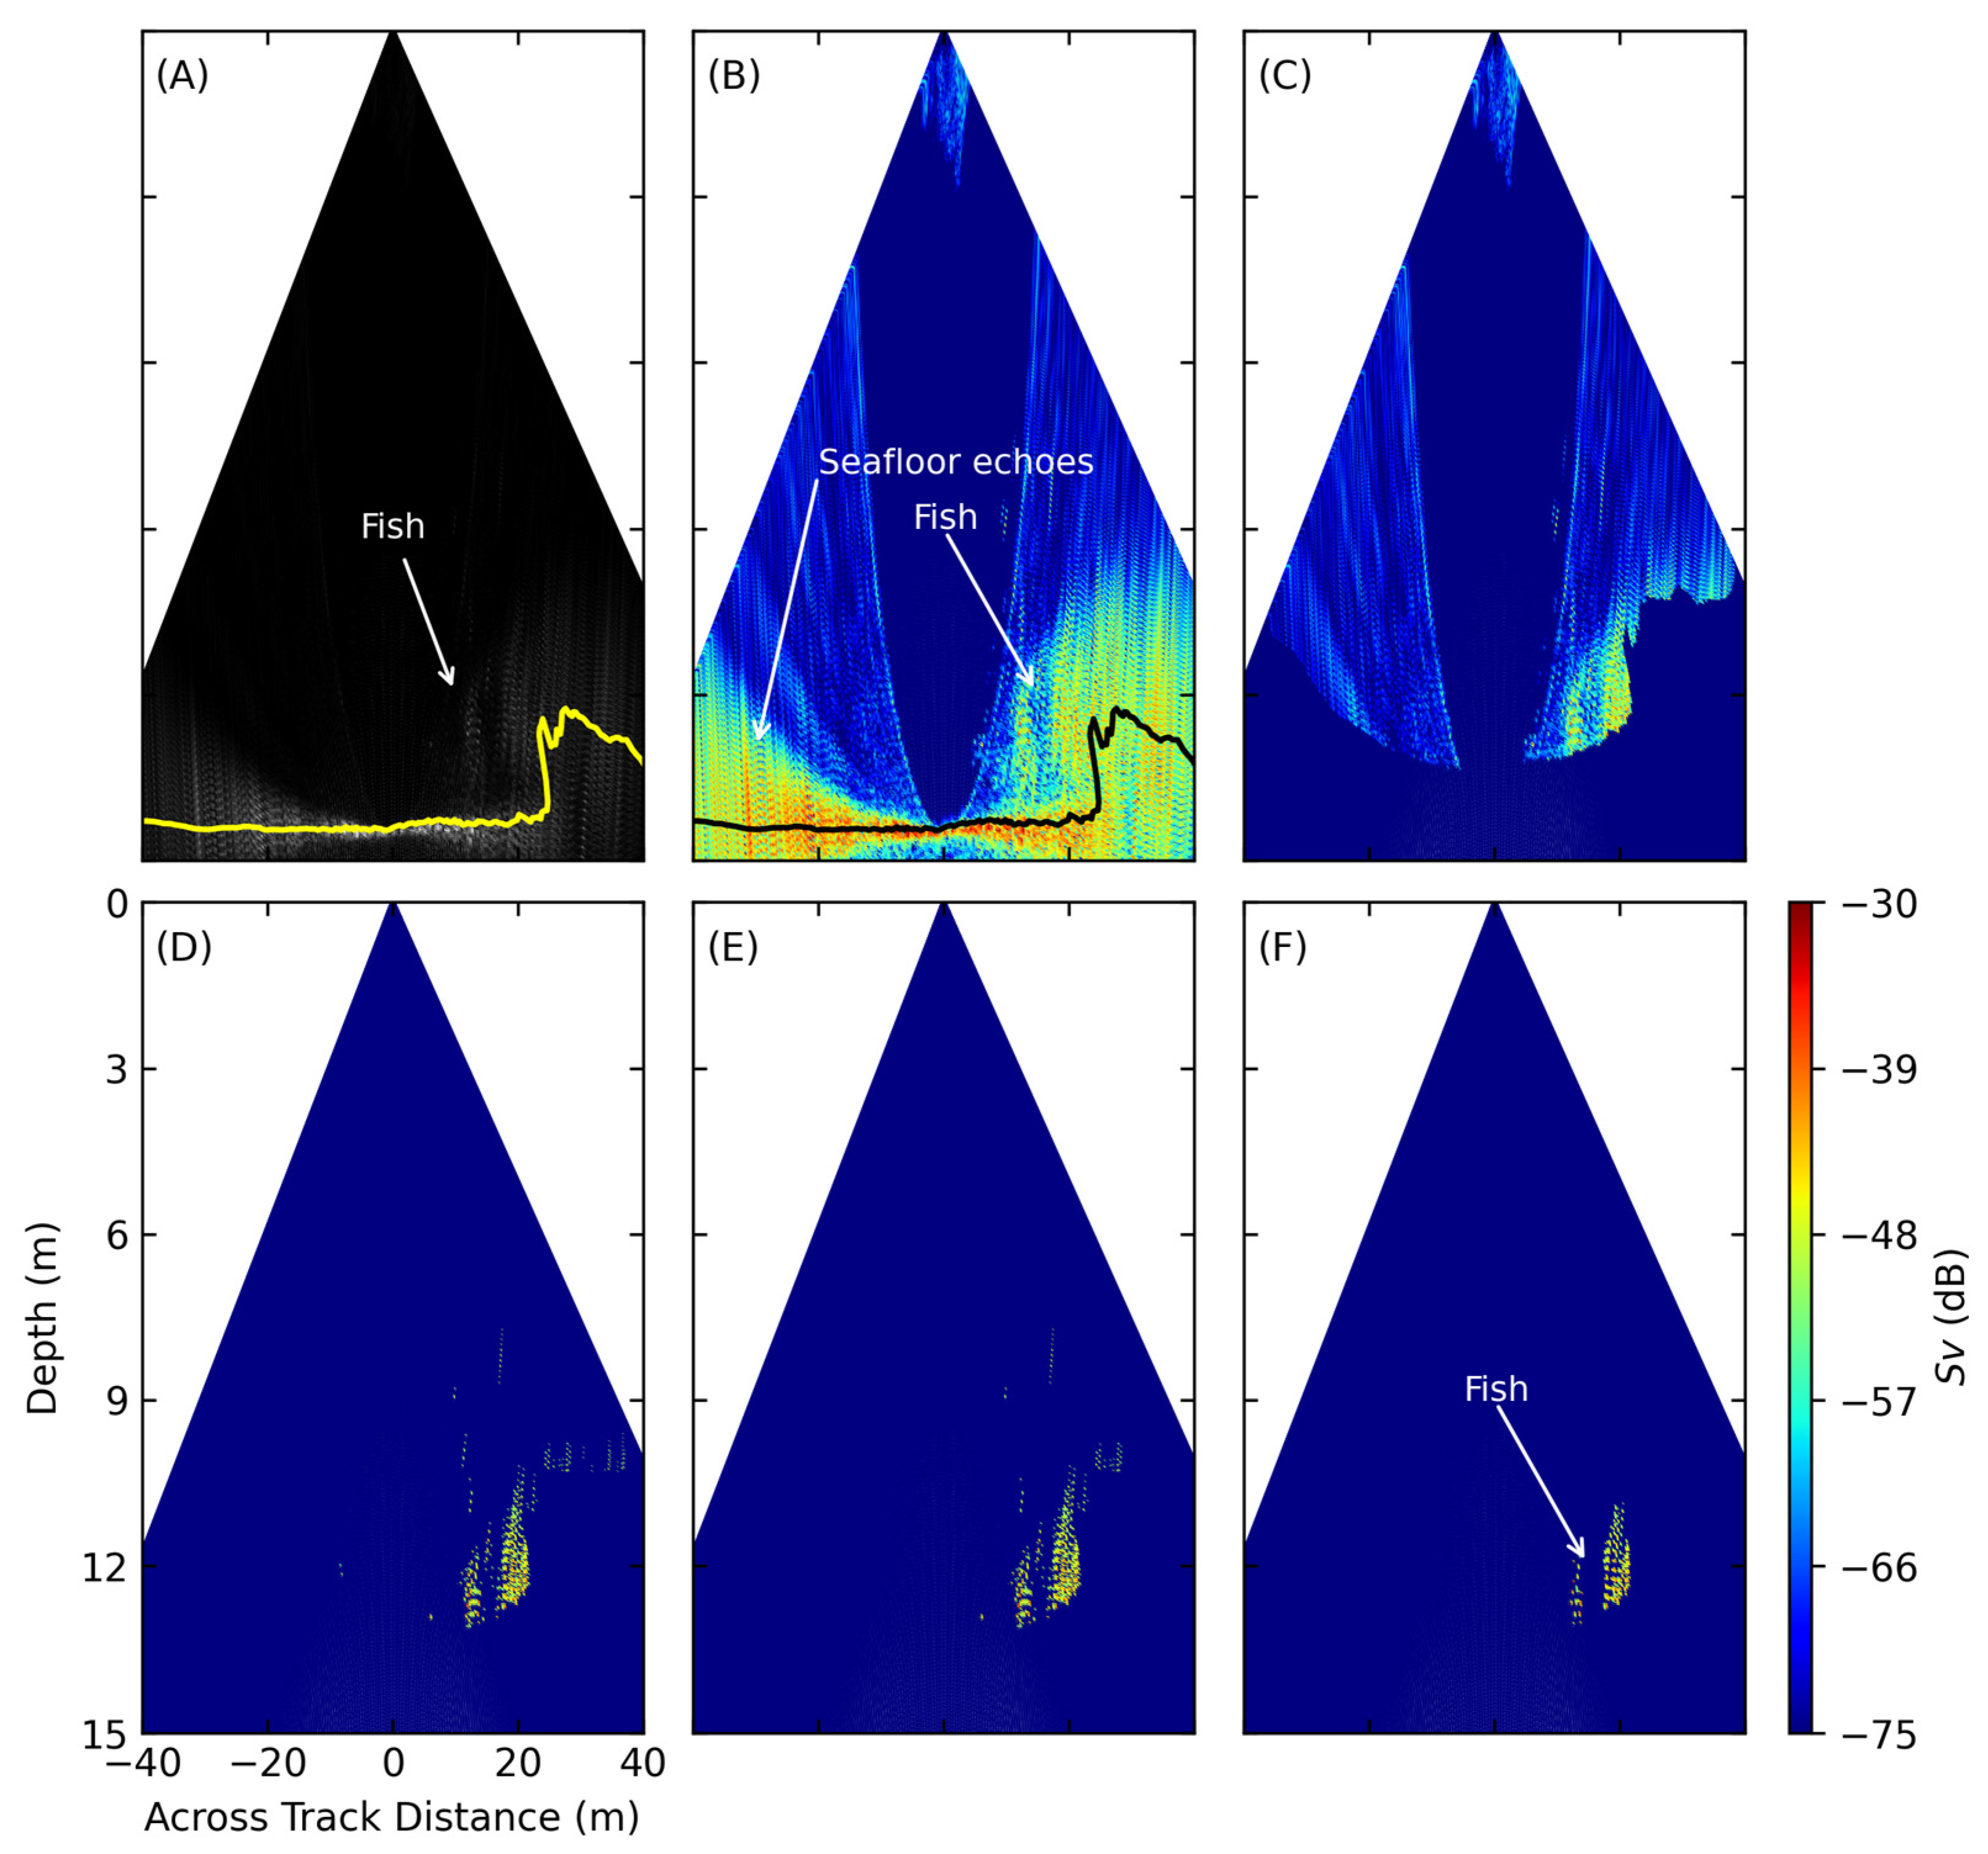
Water column image (WCI) data were converted to the Generic Water Column Format [45] using the acoustic postprocessing software FM Midwater in Fledermaus 7.7 (Quality Positioning Services B.V.) and subsequently analyzed in Python (ver. 3.12.9). A custom Python script was developed to calculate volume backscattering strength (Sv) from the WCI data. The Sv data were then filtered to remove seafloor echoes and background noise, followed by extraction of fish echoes using a spatial filter. The workflow for analyzing the WCI data is illustrated in Figure 2, with an example of the process shown in Figure 3. This methodology follows processing techniques previously described by Nagasawa and Horinouchi (2023) [36], Schimel et al. (2020) [37], Urban et al. (2017) [46], and Nau et al. (2022) [47].

2.5.1. Calibrated Sv Values

The received intensity of a multibeam sonar is described by the sonar equation [24] expressed as follows:
S E = S L 2 T L + V + S v + P G + C o n s t . ,
where SE is the received intensity of water column backscatter in decibels (dB), SL is the transmitted source level, 2TL represents the two-way transmission loss, V is the sampling volume, Sv is the volume backscattering strength, PG is the processing gain of the receiving system, and Const. is a constant correction value specific to each multibeam sonar and determined from calibration. Based on Equation (1), calibrated Sv (dB) was calculated as Equation (2):
S v = S E S L + 2 T L V P G C o n s t . ,
where TL is the sum of spreading and absorption losses, and V is determined from the beam geometry and target range. PG depends on the signal bandwidth (Bw) and pulse length (PL), which in the used multibeam sonar vary according to the pulse length and record range settings [48]. PG was calculated for each ping following Lurton (2010) [24] as described in Equation (3):
P G = 5 l o g 10 B w × P L .
The multibeam sonar employed in this study was calibrated following the procedure described by Foote et al. (2005) [49]. Calibration was conducted on the marine instrumentation barge Seatec II (OKI Com-Echoes Co., Ltd., Numazu, Japan; details in Noguchi, 2005 [50]). Using a tungsten carbide sphere with a known target strength, the Const. value was determined as –55.3 dB [41]. During calibration, a discrepancy was detected between the effective transmitted source level and the power setting in the R2SONIC 2024 operation software [48], resulting in an offset gain of +6.5 dB at 200 kHz [41]. To correct for this offset, the source level (SL) value was adjusted from the software setting of 215 dB (Table 1) to 221.5 dB.

2.5.2. Seafloor Echo Removal

Seafloor echoes within the WCI can strongly influence the calculation of threshold filters used in subsequent processing and must therefore be removed at the initial stage. These echoes spread along the seafloor according to the beam footprint in the across-track direction, with spreading increasing with incident angle, beam width, and depth (Figure 3B). In this study, the footprint was calculated following the method described by Nau et al. (2022) [47], and all echoes below the seafloor were removed from the WCI.

2.5.3. Threshold Filter

For each ping, a statistical threshold (Th) was applied to remove background noise from echoes above the seafloor. The threshold was calculated as Equation (4):
T h = μ + k σ ,
where μ and σ are the mean and standard deviation of Sv values above the seafloor, respectively, and k is a constant factor. In this study, k was set to 2 following the statistical two-sigma rule. This choice followed evaluations of multiple k settings through visual inspection of residual noise and fish echoes. The threshold filter was applied on a ping-by-ping basis, retaining echoes with Sv values exceeding Th.

2.5.4. Side-Lobe Artifacts and Outer-Beam Noise Removal

Side-lobe artifacts, typically appearing as well-defined semi-circular cluster of echoes in the WCI, are generated by strong seafloor reflections [37,38]. These artifacts usually occur near the minimum slant range, corresponding to the first detection of the seafloor, and often persist in Sv values after threshold filtering (see Section 2.5.3). To remove them, the side-lobe artifact range (ASLR) was calculated following Nau et al. (2022) [47] (Equation (5)), and all Sv values within the range from the minimum slant range to ASLR were excluded.
A S L R = r m i n × t a n θ + 0.5 b w t a n θ 0.5 b w ,
where rmin is the minimum slant range, θ is the beam angle, and bw is the across-track beamwidth. Outer-beam noise, as described by Schimel et al. (2020) [37], was removed by excluding the outermost 5° of beams.

2.5.5. Majority Filter (Neighborhood Filter)

A majority filter, a type of neighborhood filter, was applied to remove impulse noise on a ping-by-ping basis. The filter used a 3 × 3 sample matrix centered on each target sample and counted the number of samples retained after the previous WCI processing steps. If four or fewer samples within the matrix were retained, the target sample was removed.

2.5.6. Spatial Filter

A spatial filter was applied to the remaining data along each transect after completion of all previous noise removal steps. For each echo in a given ping, the filter calculated the three-dimensional distance to the nearest echo in the preceding and following pings. Echoes with distances exceeding 1.1 times the horizontal distance between pings (i.e., the distance traveled by the vessel between pings) were considered noise and removed. This value was selected based on sampling rate (10 Hz) and the speed of the vessel (~5 kn), while also considering the average body length of the primary species (see Section 2.3) and their typical inter-individual distance within the school (e.g., [51,52]). In this context, the average horizontal distance between pings was approximately 25.7 cm, with a factor of 1.1 resulting in an average distance of about 28.3 cm.
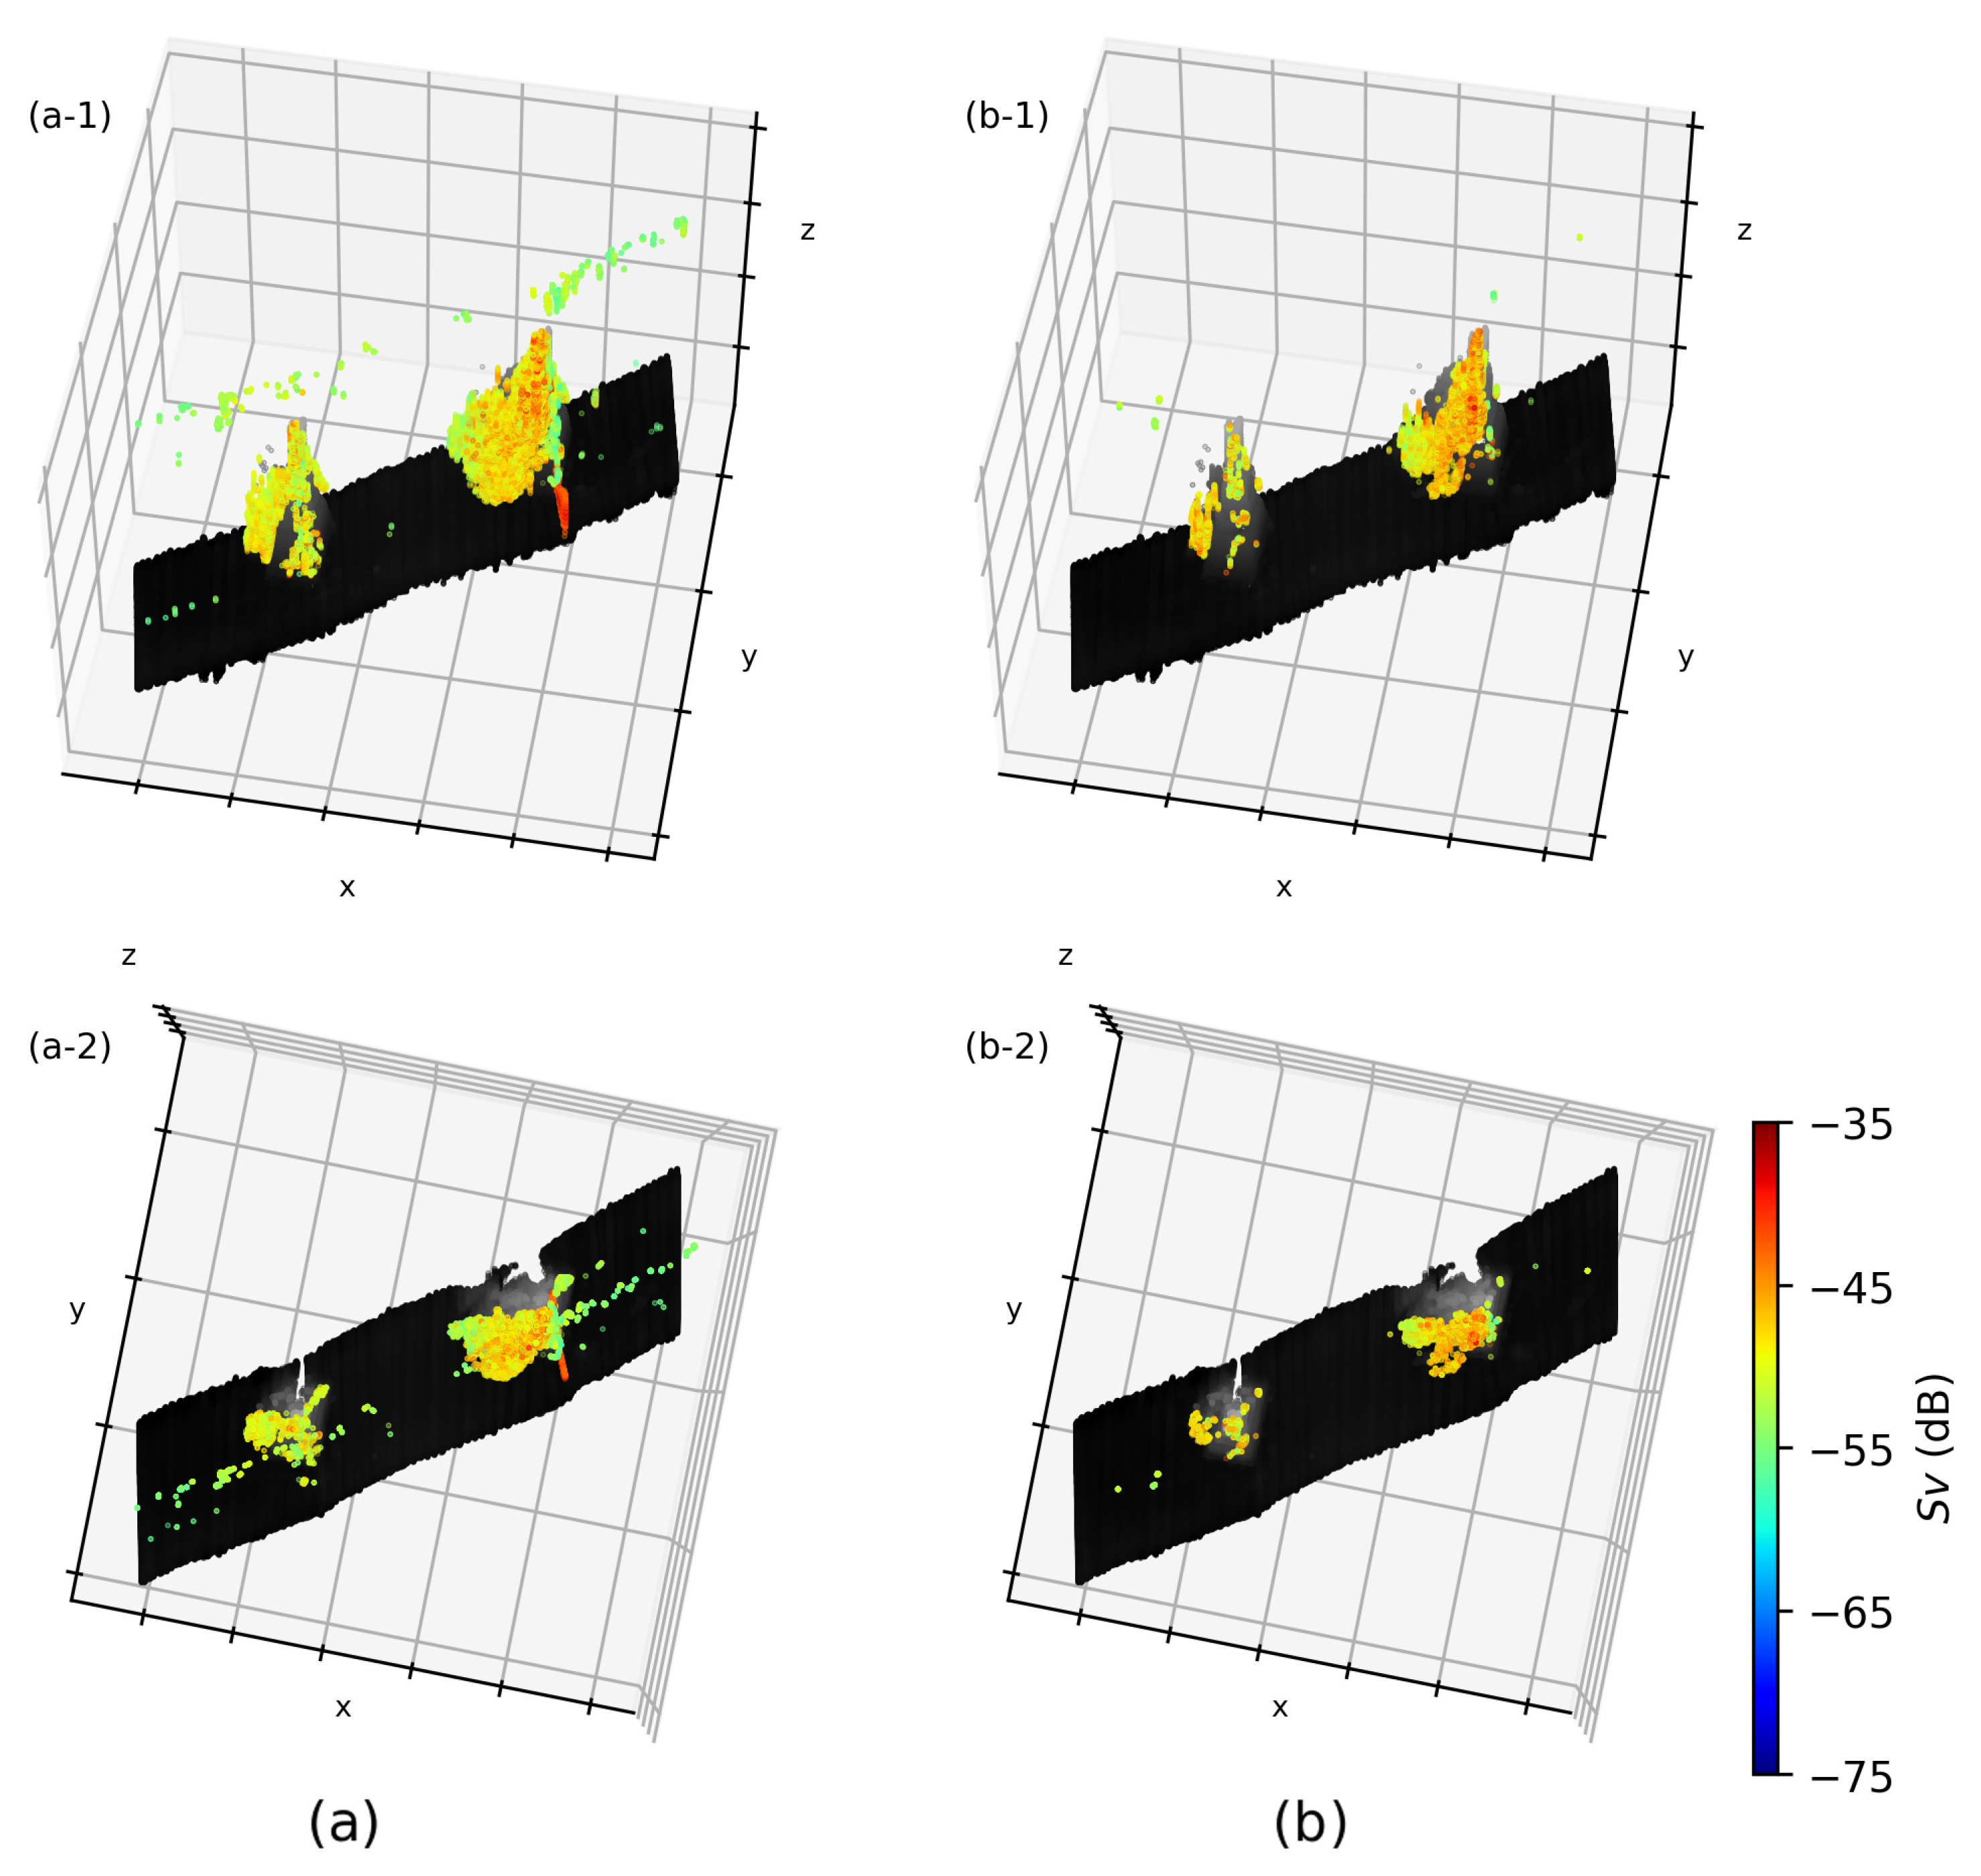
Figure 4 illustrates the effect of the spatial filter on a transect line. Figure 4(a-1,a-2) show two perspectives of the transect after prior noise removal but before application of the spatial filter, where noise near the sea surface and seafloor—likely originating from air bubbles and the seabed—is evident. Figure 4(b-1,b-2) show the Sv values after applying the spatial filter, demonstrating removal or substantial reduction in noise.

2.6. Fish Density

Processed echoes shallower than 3 m were removed as surface noise, while echoes deeper than 3 m were assumed to originate from fish. Sv values for fish were averaged over a 1 m3 grid (XYZ: 1 m × 1 m × 1 m) and exported as grid cell values for visualization and biomass estimation using GIS software. Fish density (FD, inds/m3) was calculated from Sv according to the relationship shown in Equation (6) [24]:
F D = 10 S v T S / 10 ,
where TS is the target strength of the dominant fish species observed during fish sampling (see Section 2.3). Similarly, the number of fish per cell was calculated from the Sv of the cells and the TS of the dominant fish species.

3. Results

3.1. Dominant Fish Species

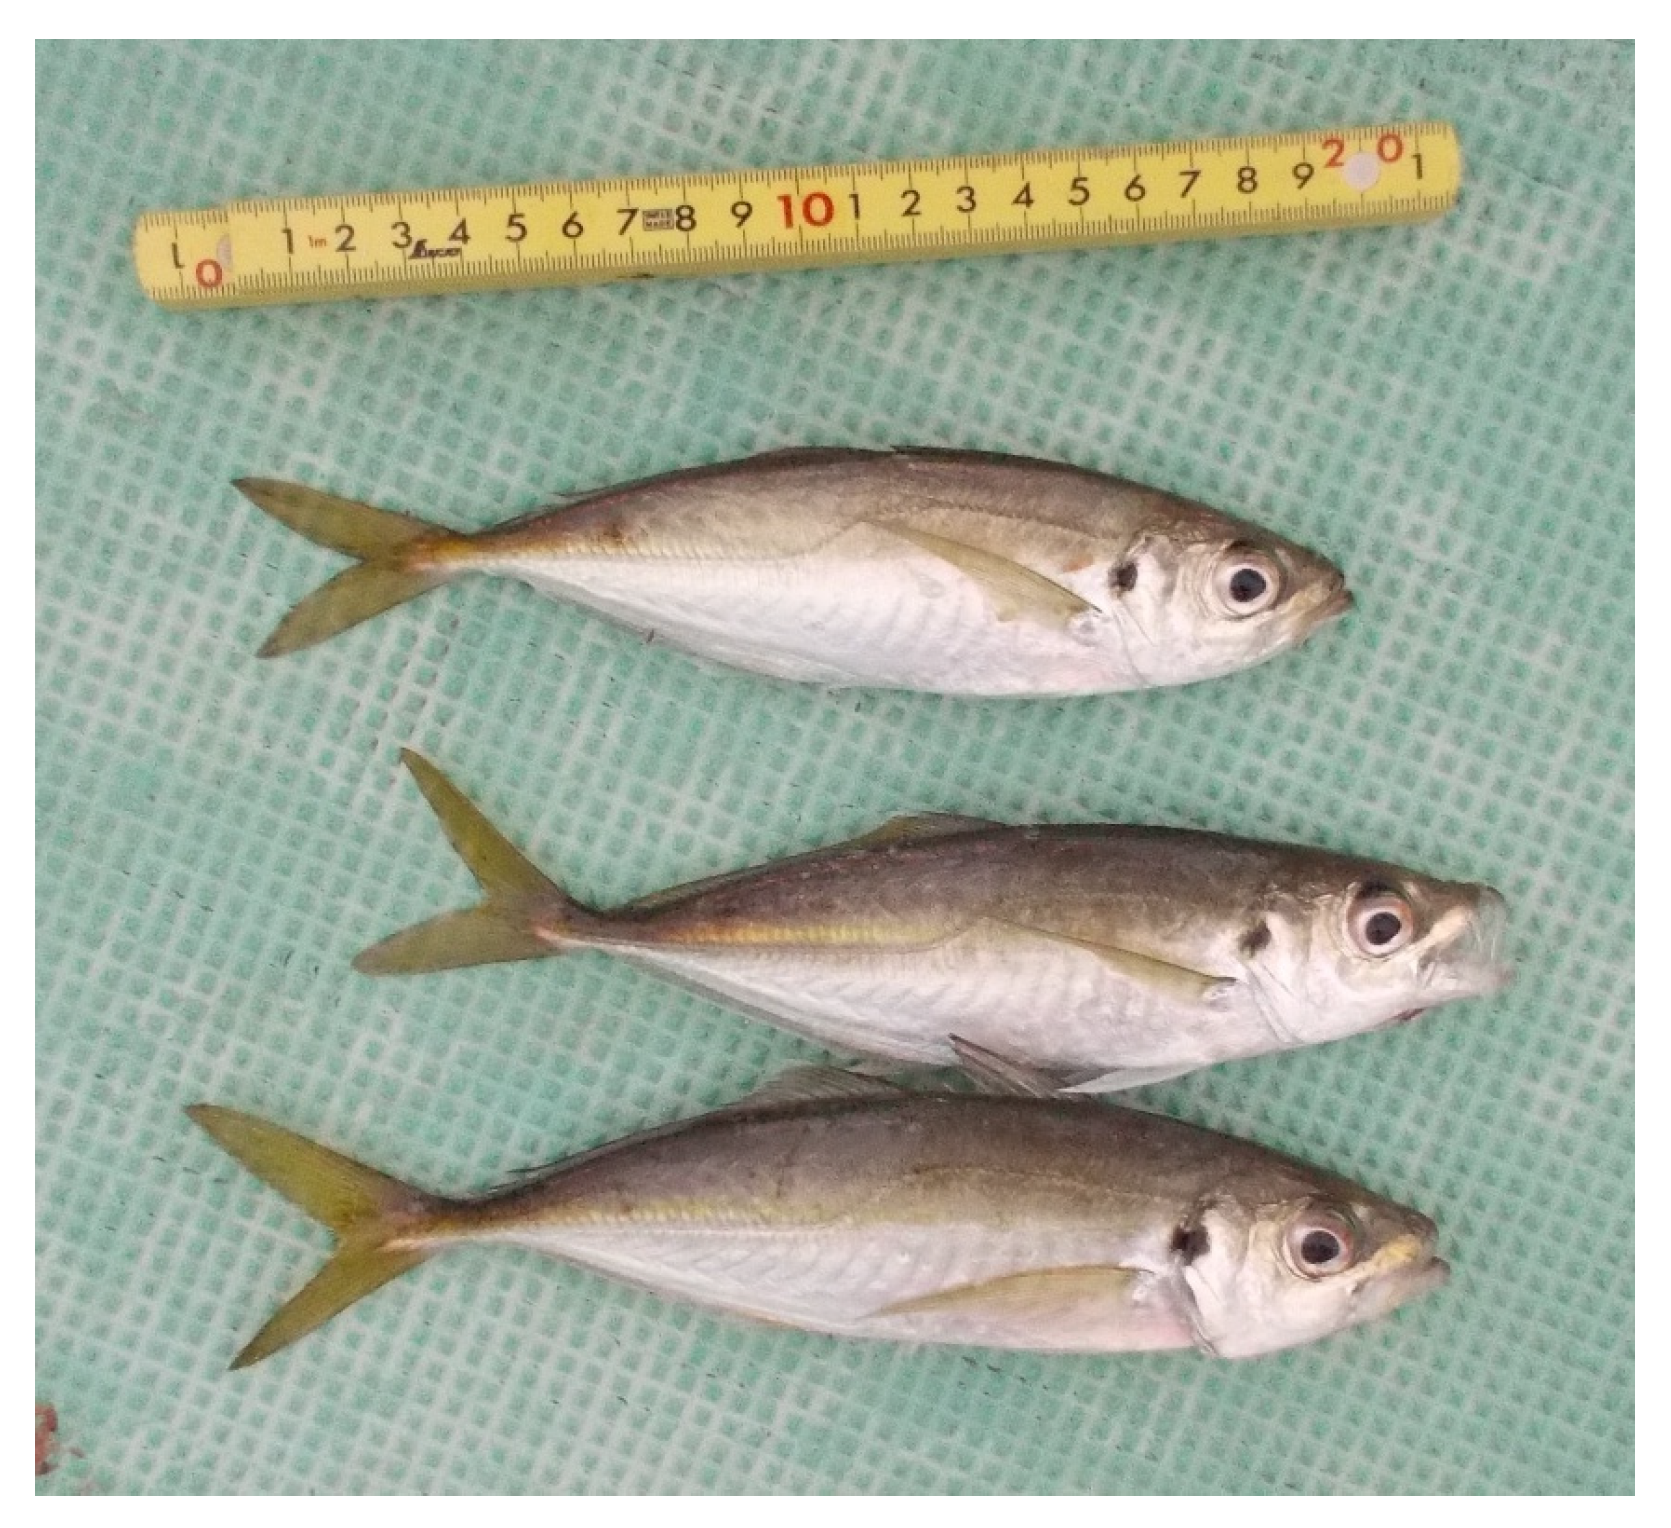
Underwater camera footage revealed schools of Japanese jack mackerel (Trachurus japonicus) around the OT, along with a few individual wrasses (Labridae) and grass puffers (Takifugu alboplumbeus). Species composition from fishing samples matched the camera observations, and Chub mackerel (Scomber japonicus) was also captured (Figure 5). Based on these observations, Japanese jack mackerel was designated as the dominant species. The average body length (BL) of Japanese jack mackerel specimens was 19.8 cm, and the target strength (TS) of this species was estimated using the BLTS relationship reported by Nakamura et al. (2013) [53] as follows:
T S d B = 20 × l o g 10 B L c m 69.9 .
The potential mixing of Chub mackerel within the observed schools of Japanese jack mackerel was considered. However, as the captured Chub mackerel had a BL of 20.1 cm, comparable to the mean size of Japanese jack mackerel (BL of 19.8 cm), and a similar body shape, the effect of potential species mixing on TS calculations was regarded as negligible.
According to Aoki et al. (1986) [51], schools of Japanese jack mackerel exhibit an average inter-individual distance of 1.43 times their BL, as determined through nearest neighbor distance analysis. With a BL of 19.8 cm, the average inter-individual distance is calculated to be 28.3 cm, which is comparable to the average horizontal distance observed with the spatial filter (see Section 2.5.6).

3.2. Fish Cells

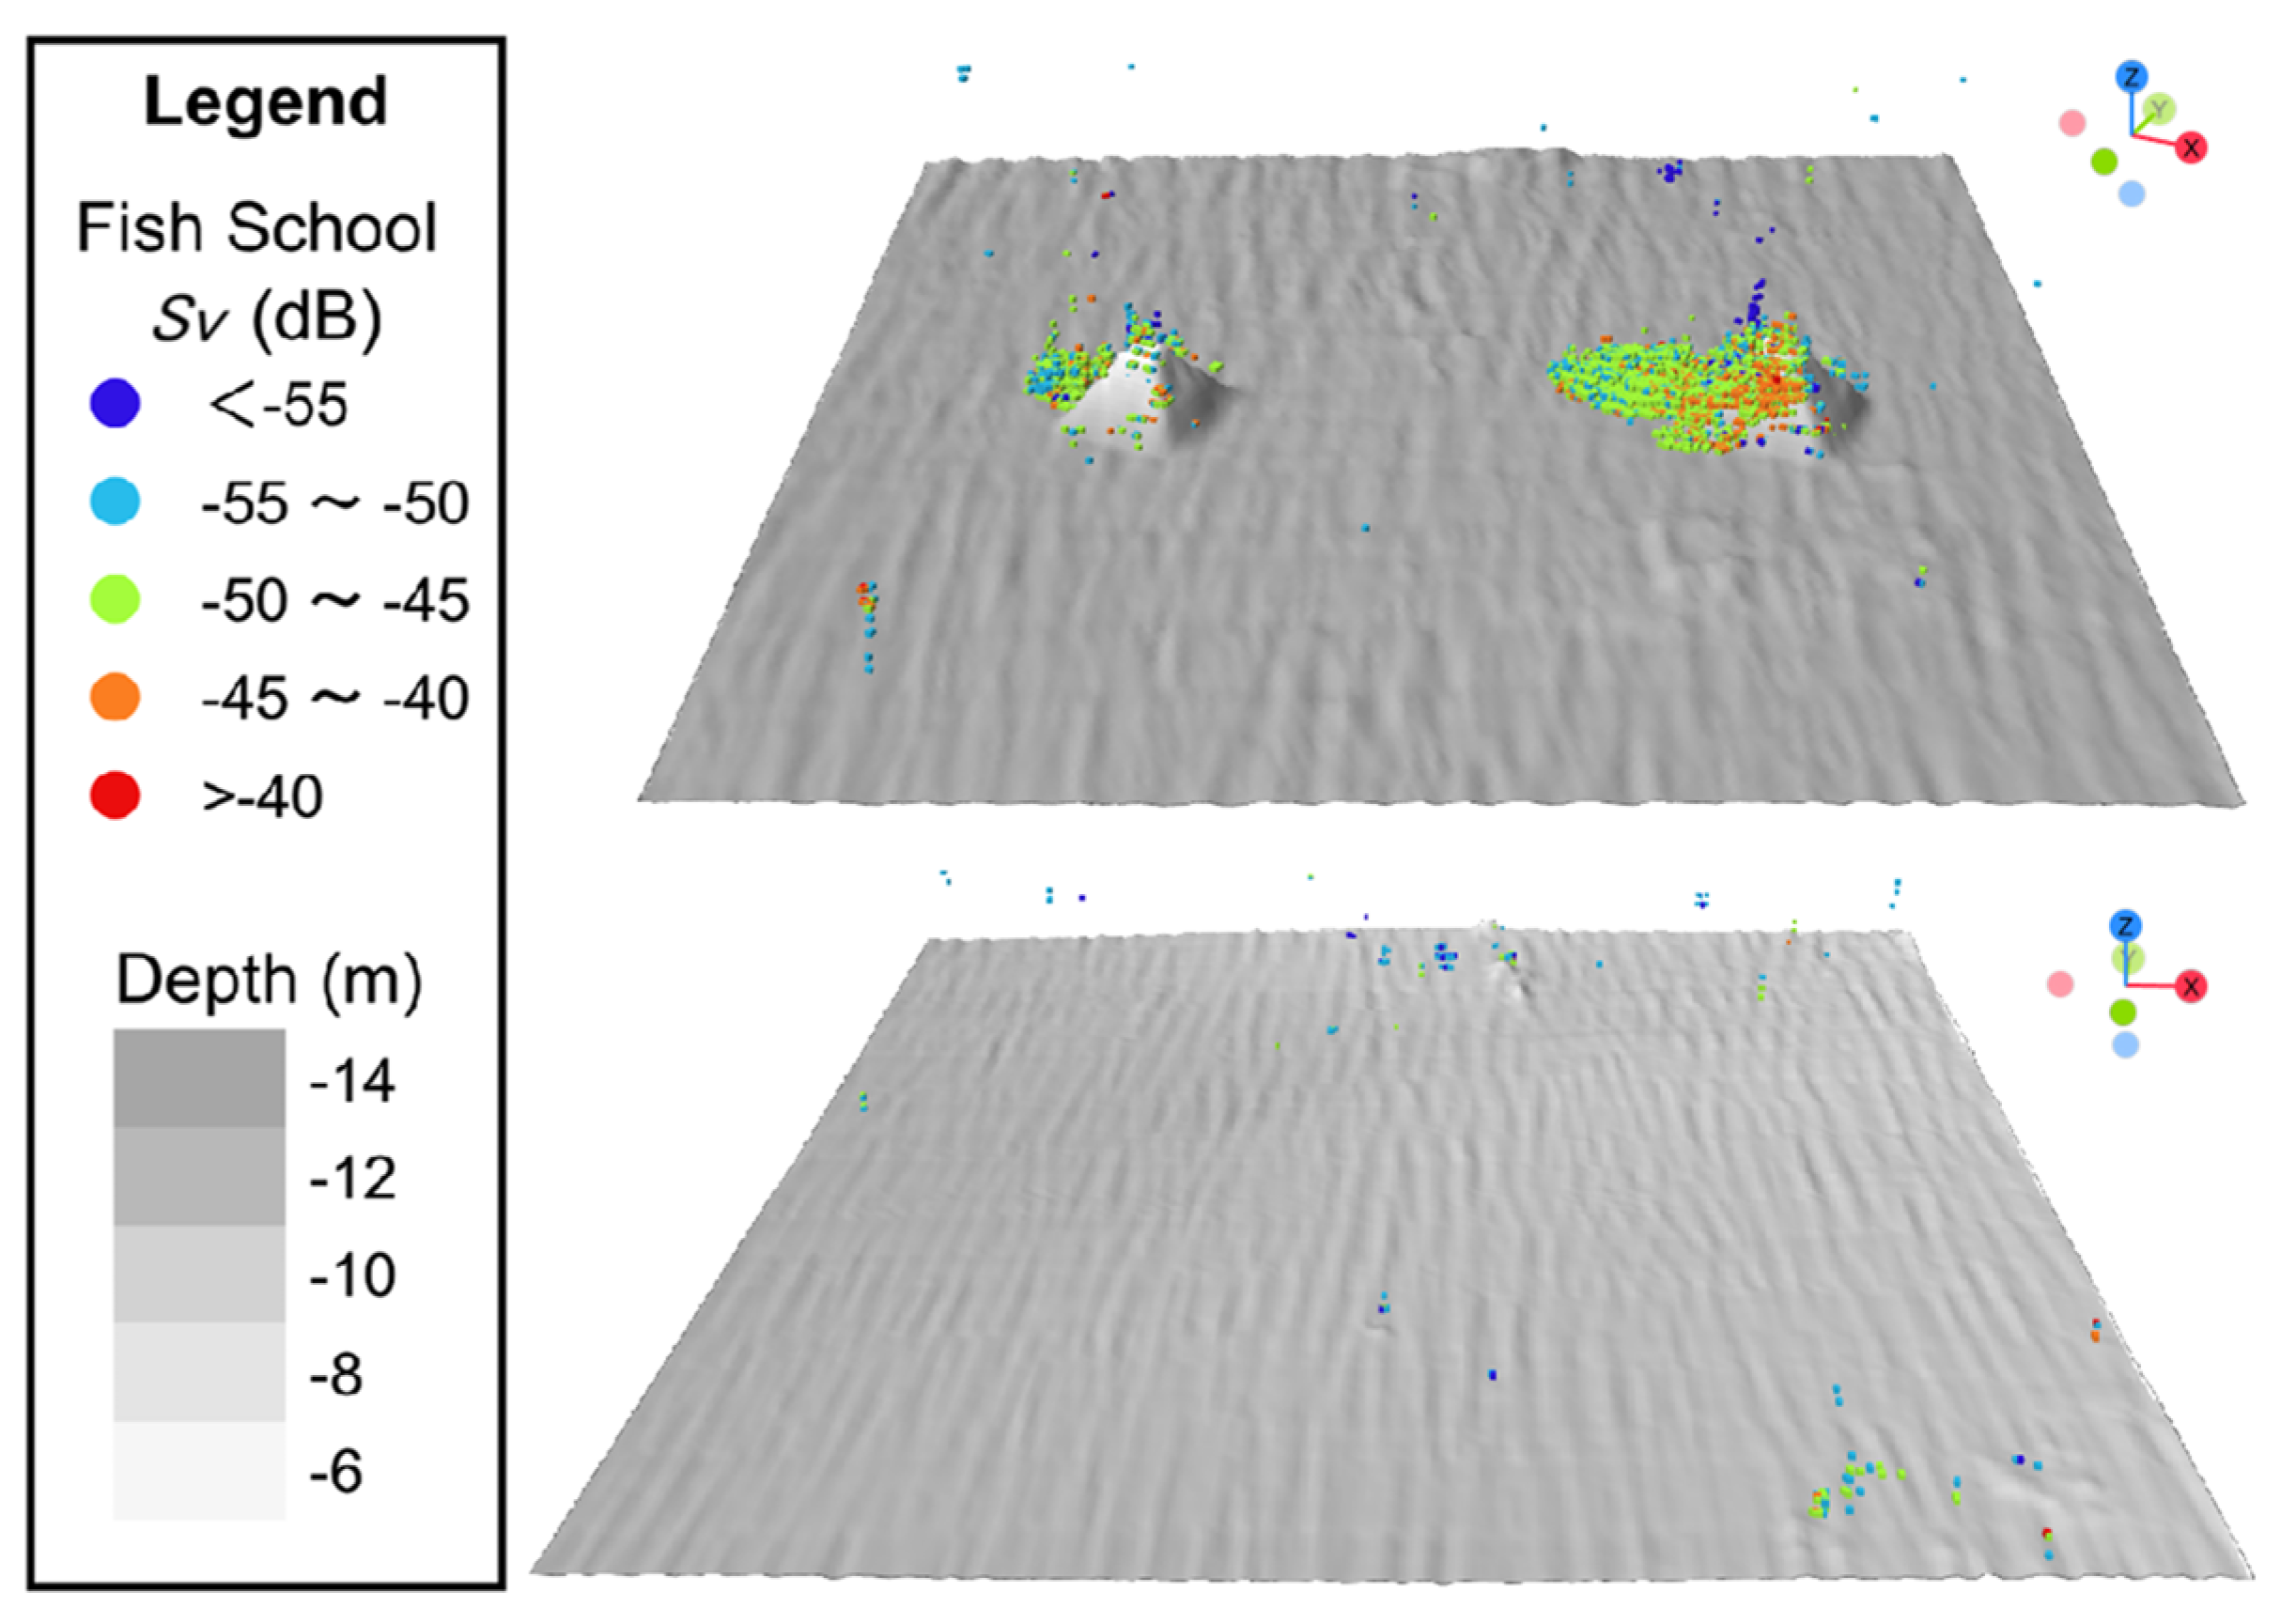
Dense concentrations of fish were observed exclusively in the OWF area, particularly on the west side of both the OT and WT, at depths ranging from 3 m to the seafloor (Figure 6). A total of 7035 fish cells (i.e., grid cells containing fish echoes) were identified, of which 6841 (97.2%) were located in the OWF area and 194 (2.8%) in the control area. The mean Sv of fish cells in the OWF was −46.9 ± 3.8 dB, compared to −49.7 ± 2.2 dB in the control area. Sparse fish cells were also observed near the surface and seafloor in both areas. Salinity and temperature profiles indicated comparable environmental conditions, with an average temperature difference of 0.23 °C (14.71 °C in OWF, 14.94 °C in control) and a salinity difference of 0.12 (33.98 in OWF, 33.86 in control).

3.3. Fish Biomass

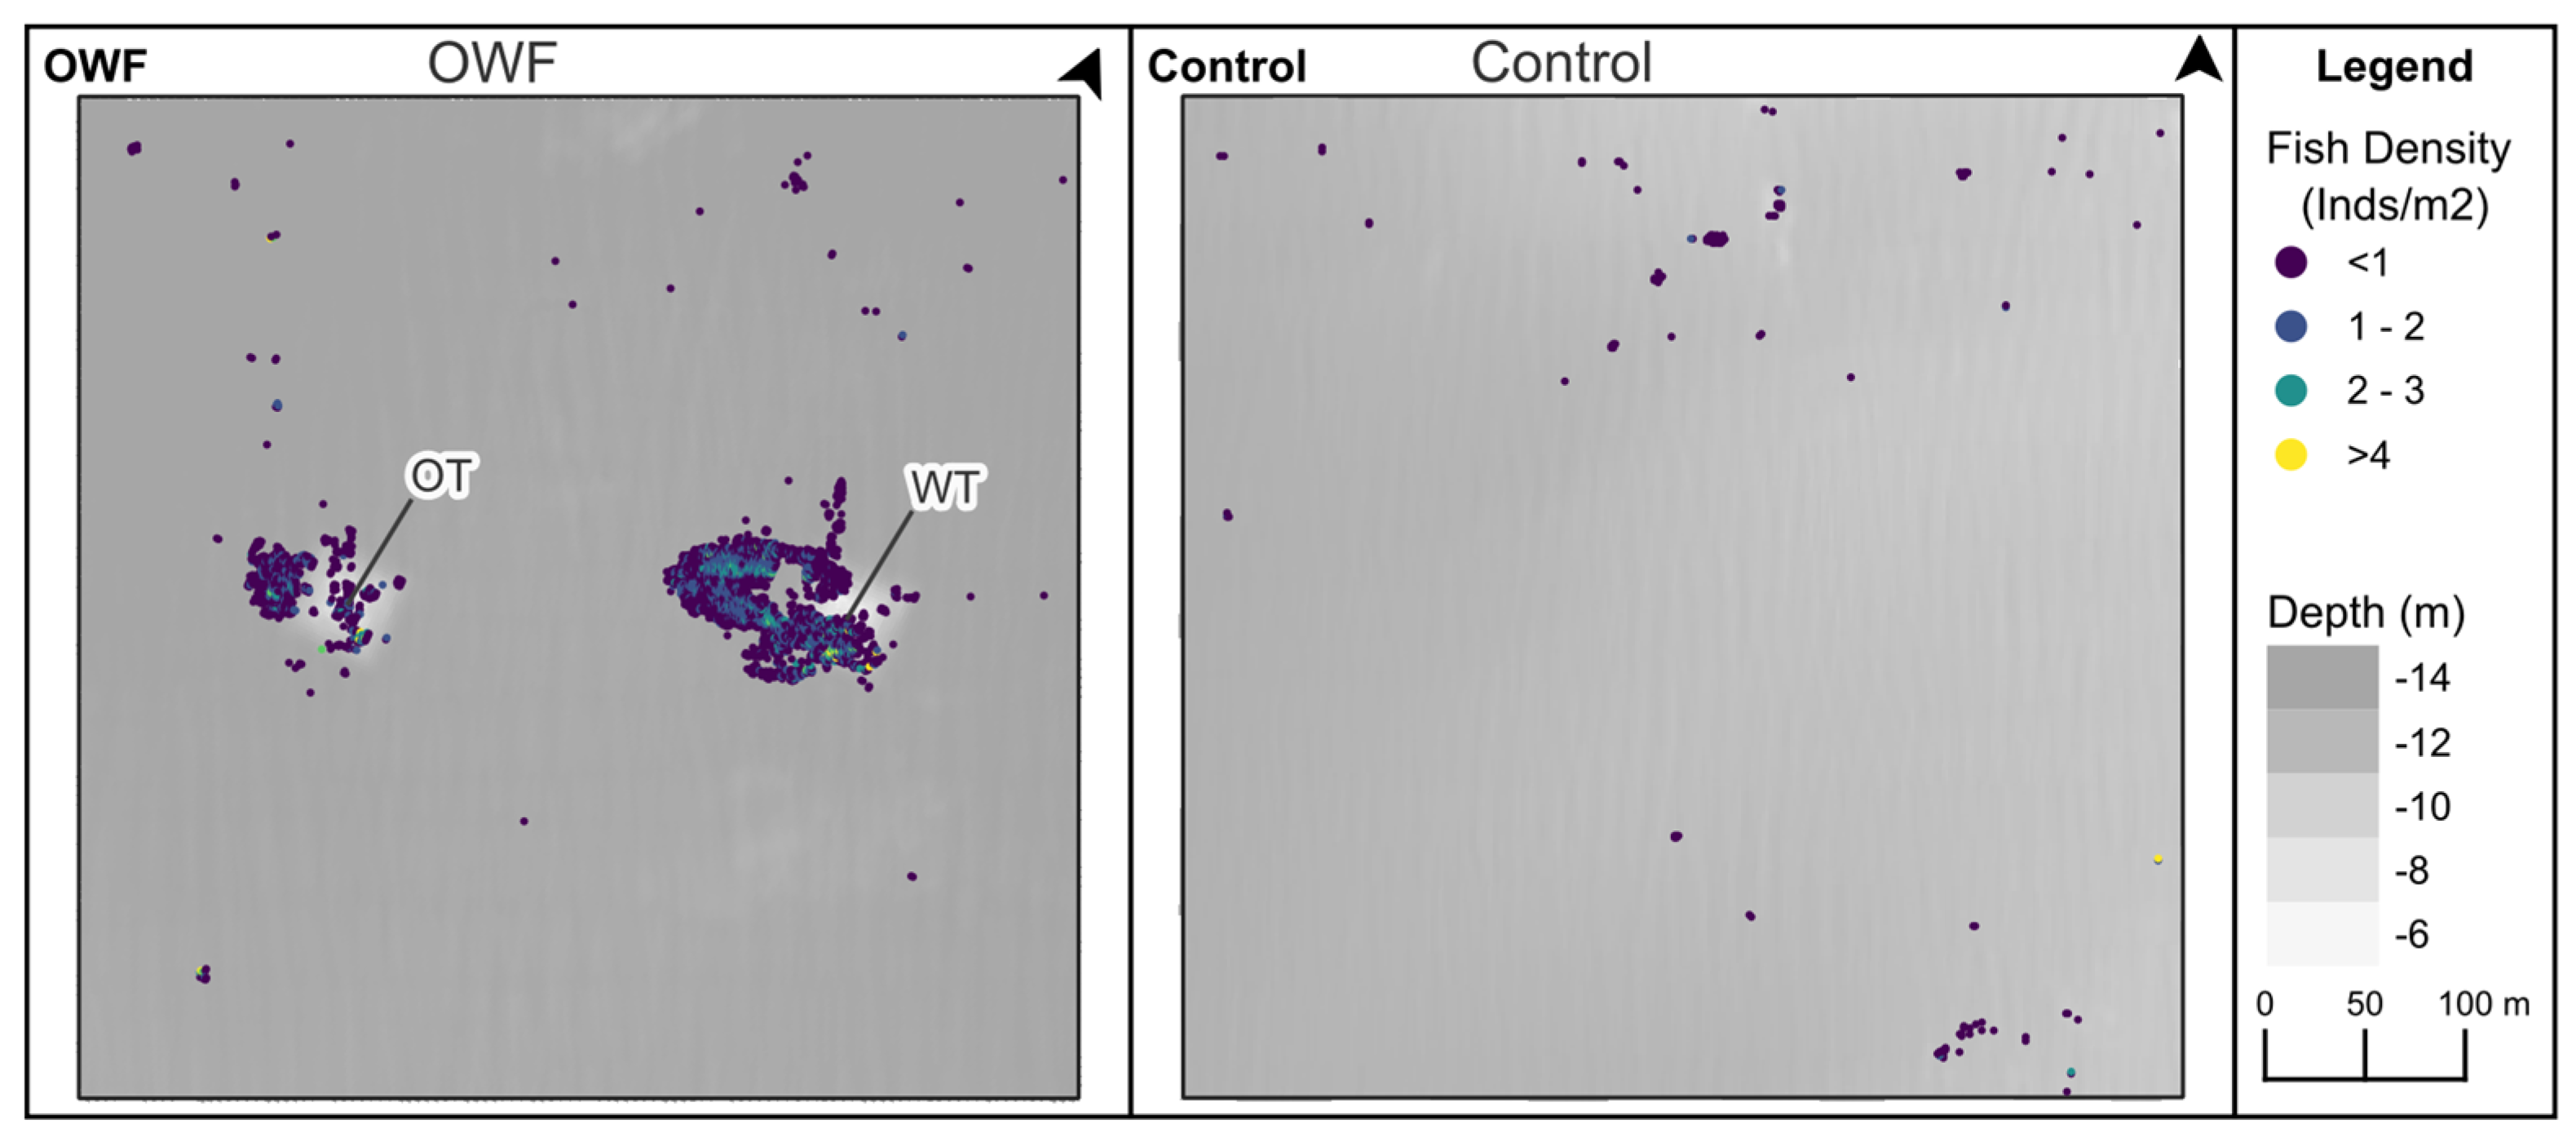
A total of 3528.6 individuals were estimated from 7035 cells, with the majority located in the OWF area (3476.5 individuals). The mean fish density per cell in fish cells was significantly higher in the OWF (0.5 ± 0.4 inds/m3) than in the control area (0.3 ± 0.4 inds/m3; t-test, p < 0.01). Fish biomass per square meter of water column—calculated as the sum of biomass in all fish cells from 3 m depth to the seafloor over 1 m2 of seafloor—ranged from 0.01 to 9.28 inds/m2 in the OWF and 0.03 to 5.60 inds/m2 in the control area (Figure 7).
Fish biomass per meter of water depth (where for example “−3 m” refers to the layer from 3 to 4 m depth) increased with depth in both the OWF and control areas (Figure 8, Table 2). In the OWF area, the mean seafloor depth was 13.7 m, with maximum biomass observed at 12 m depth (1019.8 individuals). In the control area, the mean seafloor depth was 11.6 m, and maximum biomass occurred at 10 m depth (21.1 individuals). These results indicate that fish were aggregated approximately 1.6–1.7 m above the seafloor in both areas.

3.4. Seafloor Slope and Fish Distribution

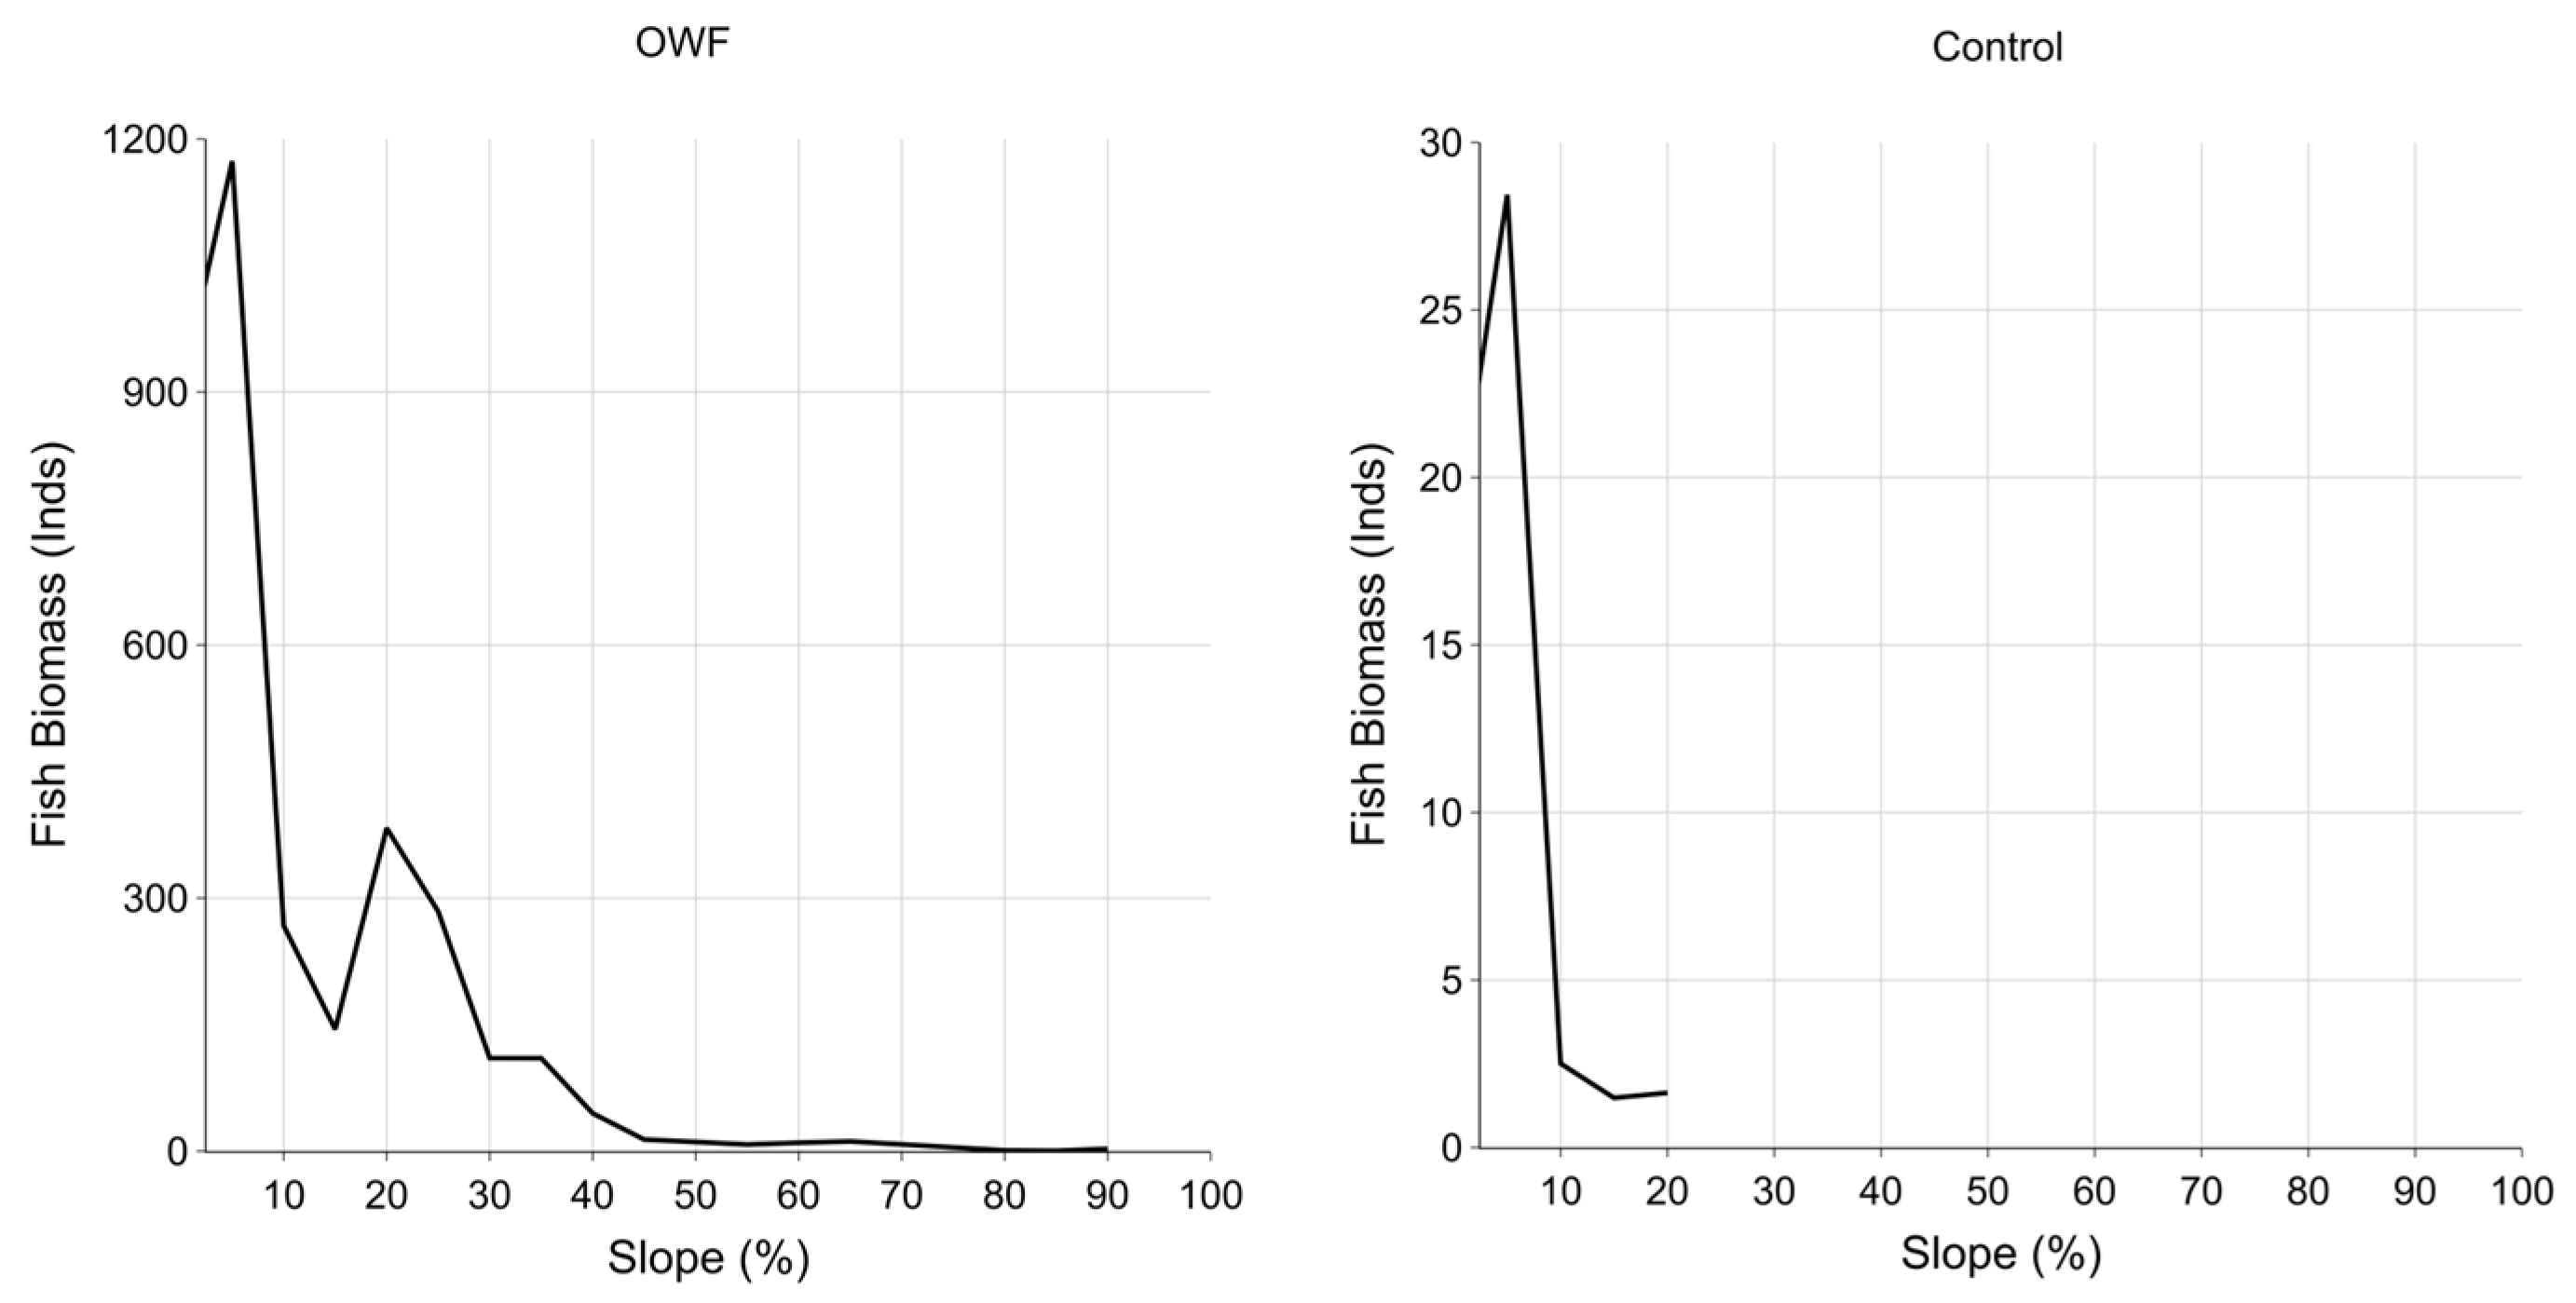
Slope percentages were grouped into 5% classes, with the 0% slope class including cells ranging from 0% to 5%. Fish biomass per square meter of water column was then compared with seafloor slope and distance to the nearest structure.
Biomass peaked at a 5% slope and declined sharply at slopes greater than 10% in both survey areas. In the OWF area, biomass increased again between 15 and 20% slopes (Figure 9), suggesting aggregation near artificial structures. This pattern is consistent with the tendency of fish to concentrate in areas with a rugged seafloor, such as near large rocks or submerged structures, and aligns with previously reported fish aggregation behavior [54].
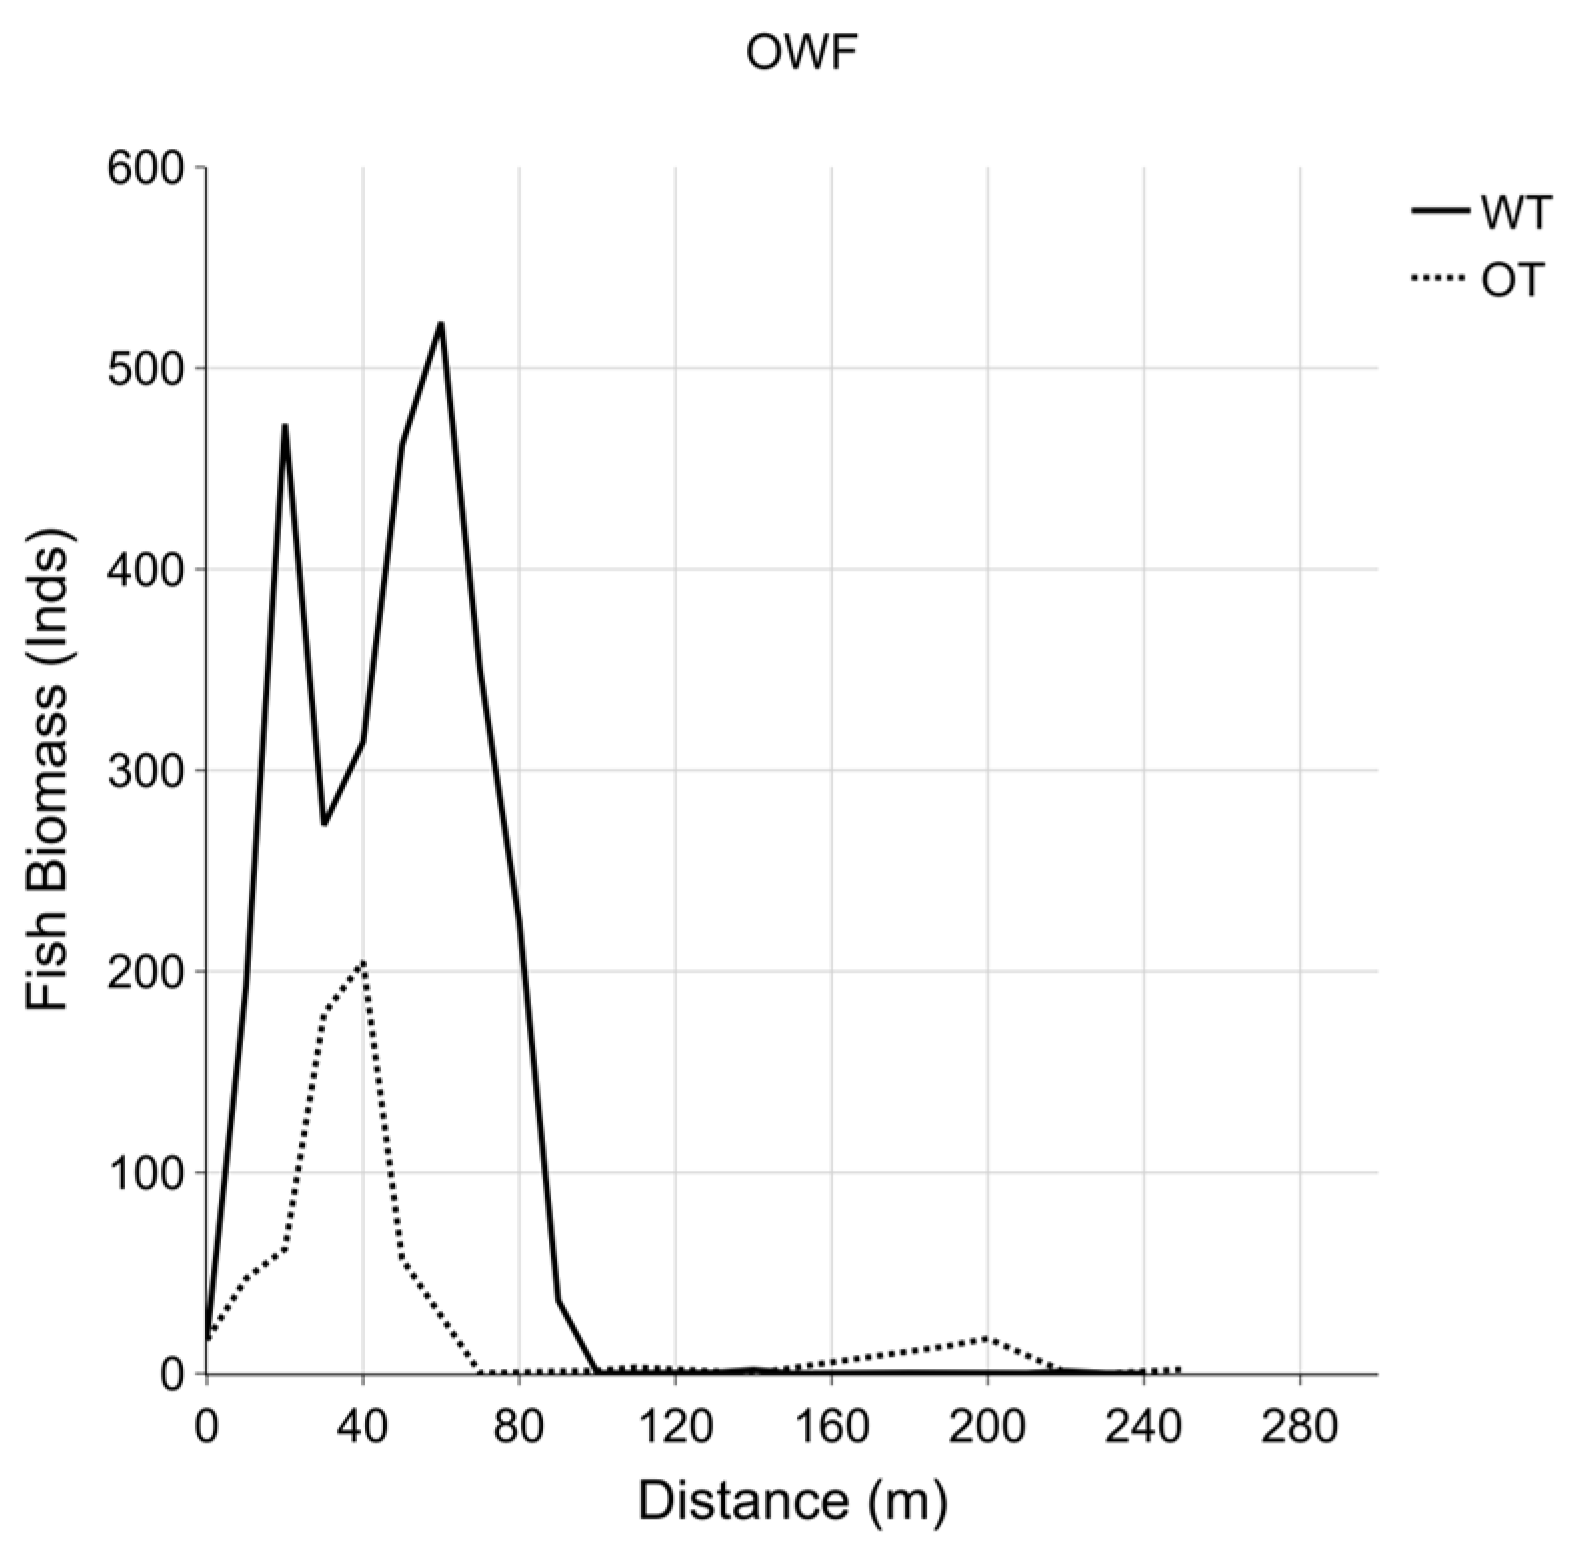
Comparison of horizontal distances from fish cells to the nearest structure (WT or OT) and their corresponding biomass showed that most fish biomass was concentrated within 60 m of the OT or within 100 m of the WT, with higher values near the WT. Combined with the 3-D visualization (Figure 10), which showed aggregations predominantly west of each structure, these results indicate that fish primarily concentrated within 60–100 m west of the artificial structures.

4. Discussion

Variations in environmental conditions, such as temperature and salinity, can influence fish aggregation (e.g., [21]). However, CTD profiles revealed no significant differences between the OWF and control areas. Although currents were not measured directly, the Global Ocean Physics Analysis and Forecast [43] indicated a predominantly westward current of approximately 0.05 m/s (0.1 knots) on the survey day in both areas. Despite these comparable conditions, fish biomass in the OWF area was approximately 66.7 times higher than in the control area, suggesting a strong aggregating effect of the underwater foundations, in agreement with previous findings [7]. It should be noted, however, that this study was conducted on a single day during the winter season. Other studies in nearby areas have reported aggregating effects of floating OWFs on T. japonicus throughout the year [12]. However, Van Hal et al. (2017) [55] suggested that the influence of OWF structures on pelagic fish aggregation is limited, with aggregation timing more strongly linked to sea conditions. Further research is therefore required to clarify seasonal aggregation patterns and improve biomass estimates.
Our observations indicated that most fish were distributed on the west side of both the WT and OT foundations. Interestingly, higher fish biomass was observed within a larger radius around the WT compared to the OT. A likely explanation lies in differences between their foundation structures. Although both the WT and OT were equipped with identical hybrid gravity-type foundations [56,57,58], the WT foundation had a larger diameter, resulting in a base area approximately 1.4 times greater than that of the OT [57].
Underwater structures can modify local currents, and the interaction between a reef and a prevailing current typically produces a downstream wake zone in shallow waters [59]. Such wake regions often attract marine organisms, particularly fish, by providing areas that reduce energy expenditure during movement [60], as well as offering shelter, feeding grounds, resting sites, or temporary stopovers [61]. Seto (2001) [62] reported that model and experimental studies on artificial reefs demonstrated that a steady flow generates a wake region extending roughly three times the reef width along the flow direction.
The hybrid gravity-type foundation of the WT had a base and a jacket structure with widths of 20 m and 10 m, respectively, whereas those of the OT were approximately 0.8 times smaller. Based on Seto (2001) [62], this structure will give a wake length of ~90 m for the WT and ~72 m for the OT, closely corresponding to the observed high-density fish. Altogether, these findings suggest that the WT and OT foundations act as artificial reefs on the flat seabed and contribute to the formation of favorable habitats for marine resources. Nevertheless, further studies incorporating direct measurements of current direction and speed are needed to better elucidate the aggregation mechanisms around underwater foundations.
This study integrated seafloor mapping with fish distribution surveys using only multibeam sonar and proposed an automatic detection algorithm for identifying fish echoes, including those occurring near underwater structures. While automation reduces human bias, it may also exclude valid echoes if thresholds are set too high. The threshold procedure (Equation (4)) followed Nau et al. (2022) [47], which emphasized that the choice of the k factor should account for WCI quality, backscattering strength, and multibeam frequency. Because detection results are highly sensitive to k, low values may insufficiently suppress background noise and result in biomass overestimation, whereas high values may exclude true fish echoes and lead to underestimation. Thus, k remains a major source of uncertainty. Developing an automatic method to optimize k selection would improve detection accuracy and biomass estimation. Incorporating information such as target strength and WCI quality metrics (e.g., signal-to-noise ratio) may support the development of such a method.
Noise removal remains a major challenge for the automatic identification of fish echoes. Seafloor echoes can mask fish echoes within the acoustic blind zone, where backscatter spreads according to beam geometry and incident angle, making detection near the bottom particularly difficult [39,40] and potentially leading to biomass underestimation [63]. Future studies could benefit from incorporating extrapolation algorithms that utilize the mean Sv of fish schools located near the acoustic blind zone, as suggested by Bazigos (1986) [64] and Kloser (1996) [65]. Similarly, side-lobe artifacts, estimated in this study using Equation (5) under the assumption of a linear relationship between beam angle and minimum slant range, may become nonlinear in complex environments [38], such as near OWF foundations, potentially leading to biomass overestimation. Nevertheless, the linear approach to side-lobe artifact removal applied here effectively eliminated these artifacts from WCI recorded near the OWF foundation (see Figure 3E), indicating that the impact of nonlinearity here was likely minimal.
In addition, quantitative estimation of fish biomass using acoustic methods requires proper calibration of the acoustic system and accurate knowledge of fish target strength (TS). Because biomass estimates are highly sensitive to the TS values applied, fish sampling and/or underwater observations in combination with acoustic surveys are essential to identify dominant species and select appropriate TS values, thereby enabling realistic biomass estimation. Japan’s National Research Institute of Fisheries Engineering has developed an acoustic–optical system, “J-QUEST,” to estimate target strength and tilt angles from fish aggregations [66], and has applied it to Boreopacific gonate squid [67]. Similarly, Scoulding et al. (2023) [68] combined acoustics and optics to estimate fish abundance associated with structured habitats. In this study, we employed conventional observation methods, including optical underwater cameras and fishing. However, the use of acoustic cameras or other broad-scale observation techniques could further improve species identification and enhance the accuracy of biomass estimates.

5. Conclusions

This study demonstrates that multibeam sonar can simultaneously map seafloor topography and quantify fish biomass around offshore wind turbine foundations. Repeated surveys of this kind may enable a quantitative assessment of how offshore wind farms influence the distribution of fishery resources. The resulting data on fish biomass distribution could provide a valuable basis for consultations among stakeholders, including the fisheries sector. Continued application of multibeam surveys is essential to support the sustainable development of offshore wind farms.

Author Contributions

Conceptualization, M.H. and S.G.; Data Curation, M.H. and S.G.; Formal Analysis, M.H. and S.G.; Funding Acquisition, T.K.; Investigation, M.H. and T.O.; Methodology, M.H. and S.G.; Project Administration, T.K.; Resource, T.K.; Software, M.H. and S.G.; Supervision, T.K.; Validation, T.K.; Visualization, M.H. and S.G.; Writing—Original Draft, M.H. and S.G.; Writing—Review and Editing; M.H., S.G. and T.K. All authors have read and agreed to the published version of the manuscript.

Funding

This research was conducted with funding from Next Energy Co., Ltd. for “Research on fish aggregation using multi-beam sonar and quantitative echosounders” under the project of “Offshore Wind Power Demonstration Project off Choshi and Kitakyushu”.

Data Availability Statement

The raw data supporting the conclusions of this article will be made available by the authors on request.

Acknowledgments

We thank Ken Usui of E & E Solutions Inc., who helped us to conduct the field survey and provided advice on this study. We extend our sincere gratitude to the fishermen of the JF Kitakyushu Cooperative and to the technical support of E & E Solutions Inc. and Toyo Corporation for their cooperation during the field survey. During the preparation of this manuscript/study, the authors have reviewed and edited the output and take full responsibility for the content of this publication.

Conflicts of Interest

Author M.H. was employed by Takenaka Civil Engineering & Construction Co., Ltd., Author S.G. was employed by Sanyo Techno Marine, Inc., The remaining authors declare that the research was conducted in the absence of any commercial or financial relationships that could be construed as a potential conflict of interest.

References

  1. Perveen, R.; Kishor, N.; Mohanty, S.R. Off-shore wind farm development: Present status and challenges. Renew. Sustain. Energy Rev. 2014, 29, 780–792. [Google Scholar] [CrossRef]
  2. GWEC. Global Wind Energy Council. Global Wind Report 2025; GWEC: Brussels, Belgium, 2025; pp. 1–108. Available online: https://www.gwec.net/reports/globalwindreport (accessed on 11 September 2025).
  3. Díaz, H.; Soares, C.G. Review of the current status, technology and future trends of offshore wind farms. Ocean Eng. 2020, 209, 107381. [Google Scholar] [CrossRef]
  4. Gkeka-Serpetsidaki, P.; Skiniti, G.; Tournaki, S.; Tsoutsos, T. A Review of the Sustainable Siting of Offshore Wind Farms. Sustainability 2024, 16, 6036. [Google Scholar] [CrossRef]
  5. Shimada, H.; Asano, K.; Nagai, Y.; Ozawa, A. Assessing the Impact of Offshore Wind Power Deployment on Fishery: A Synthetic Control Approach. Environ. Resour. Econ. 2022, 83, 791–829. [Google Scholar] [CrossRef]
  6. Tajima, S.; Yamaguchi, K.; Shiroyama, H. Consensus building with fishermen on offshore wind farms in Japan: Current status and policy recommendations. Mar. Policy 2024, 160, 105975. [Google Scholar] [CrossRef]
  7. Methratta, E.T.; Dardick, W.R. Meta-analysis of finfish abundance at offshore wind farms. Rev. Fish. Sci. Aquac. 2019, 27, 242–260. [Google Scholar] [CrossRef]
  8. Degraer, S.; Carey, D.A.; Coolen, J.W.; Hutchison, Z.L.; Kerckhof, F.; Rumes, B.; Vanaverbeke, J. Offshore wind farm artificial reefs affect ecosystem structure and functioning. Oceanography 2020, 33, 48–57. [Google Scholar] [CrossRef]
  9. Lemasson, A.J.; Somerfield, P.J.; Schratzberger, M.; Thompson, M.S.; Firth, L.B.; Couce, E.; McNeil, C.L.; Nunes, J.; Pascoe, C.; Watson, S.C.L.; et al. A global meta-analysis of ecological effects from offshore marine artificial structures. Nat. Sustain. 2024, 7, 485–495. [Google Scholar] [CrossRef]
  10. Bergström, L.; Kautsky, L.; Malm, T.; Rosenberg, R.; Wahlberg, M.; Capetillo, N.Å.; Wilhelmsson, D. Effects of offshore wind farms on marine wildlife—A generalized impact assessment. Environ. Res. Lett. 2014, 9, 034012. [Google Scholar] [CrossRef]
  11. Hammar, L.; Wikström, A.; Molander, S. Assessing ecological risks of offshore wind power on Kattegat cod. Renew. Energy 2014, 66, 414–424. [Google Scholar] [CrossRef]
  12. Tsuchida, S.; Kato, R.; Nishitsuji, S.; Anzai, S.; Azmi, S.S.B.; Tanaka, S.; Masumi, S.; Uchida, J.; Aoshima, T.; Hirasaka, K.; et al. Floating Offshore Wind Farms Attract Japanese Horse Mackerel. Aquat. Conserv. Mar. Freshw. Ecosyst. 2025, 35, e70189. [Google Scholar] [CrossRef]
  13. Nagano, A. Fishing ground creation and restoration, and artificial reefs. In Fisheries Handbook Completely Revised; Shima, K., Seki, F., Maeda, M., Kimura, S., Saeki, H., Sakuramoto, K., Suenaga, Y., Nagano, A., Morinaga, T., Yagi, N., et al., Eds.; Kodansha: Tokyo, Japan, 2012; pp. 72–74. (In Japanese) [Google Scholar]
  14. Claudet, J.; Pelletier, D. Marine protected areas and artificial reefs: A review of the interactions between management and scientific studies. Aquat. Living Resour. 2004, 17, 129–138. [Google Scholar] [CrossRef]
  15. Grossman, G.D.; Jones, G.P.; Seaman, W.J. Do Artificial reefs increase regional fish production? A review of existing data. Fisheries 1997, 22, 17–23. [Google Scholar] [CrossRef]
  16. Hamano, A. studies of acoustic method for estimating fishery resources and fishing reef grounds. Fish. Eng. 2019, 55, 175–185, (In Japanese with English abstract and figure captions). [Google Scholar] [CrossRef]
  17. Andersson, M.H.; Öhman, M.C. Fish and sessile assemblages associated with wind-turbine constructions in the Baltic Sea. Mar. Freshw. Res. 2010, 61, 642–650. [Google Scholar] [CrossRef]
  18. Kang, M.; Nakamura, T.; Hamano, A. A methodology for acoustic and geospatial analysis of diverse artificial-reef datasets. ICES J. Mar. Sci. 2011, 68, 2210–2221. [Google Scholar] [CrossRef]
  19. Sato, M.; Inoue, N.; Nambu, R.; Furuichi, N.; Imaizumi, T.; Ushio, M. Quantitative assessment of multiple fish species around artificial reefs combining environmental DNA metabarcoding and acoustic survey. Sci. Rep. 2021, 11, 19477. [Google Scholar] [CrossRef]
  20. Lu, H.J.; Lin, J.R.; Huang, T.C.; Sinaga, S. Comparison of fish assemblages aggregated by artificial reefs using scuba diving and acoustic surveys. J. Mar. Sci. Technol. 2021, 29, 8. [Google Scholar] [CrossRef]
  21. Nakamura, T.; Hamano, A. Seasonal differences in the vertical distribution pattern of Japanese jack mackerel, Trachurus japonicus: Changes according to age? ICES J. Mar. Sci. 2009, 66, 1289–1295. [Google Scholar] [CrossRef]
  22. Tassetti, A.N.; Malaspina, S.; Fabi, G. Using a multibeam echosounder to monitor an artificial reef. Int. Arch. Photogramm. Remote Sens. Spat. Inf. Sci. 2015, 40, 207–213. [Google Scholar] [CrossRef]
  23. Zhu, K.; Xiao, B. Research of three-dimensional imaging sonar technology in the detection of underwater engineering project. In Advances in Civil Engineering and Environmental Engineering Volume 1; Yahya, W., Daud, Z., Eds.; CRC Press: London, UK, 2023; pp. 437–444. [Google Scholar] [CrossRef]
  24. Lurton, X. An Introduction to Underwater Acoustics: Principles and Applications, 2nd ed.; Praxis Publishing: Chichester, UK, 2010; pp. 1–724. [Google Scholar]
  25. Komatsu, T.; Igarashi, C.; Tatsukawa, K.; Sultana, S.; Matsuoka, Y.; Harada, S. Use of multi-beam sonar to map seagrass beds in Otsuchi Bay on the Sanriku Coast of Japan. Aquat. Living Resour. 2003, 16, 223–230. [Google Scholar] [CrossRef]
  26. Hamana, M.; Komatsu, T. Mapping 3D structure of a Sargassum forest with high-resolution sounding data obtained by multibeam echosounder. ICES J. Mari. Sci. 2021, 78, 1458–1469. [Google Scholar] [CrossRef]
  27. Weber, T.C. A CFAR detection approach for identifying gas bubble seeps with multibeam echo sounders. IEEE J. Ocean. Eng. 2021, 46, 1346–1355. [Google Scholar] [CrossRef]
  28. Zhang, W.; Zhou, T.; Li, J.; Xu, C. An efficient method for detection and quantitation of underwater gas leakage based on a 300-kHz multibeam sonar. Remote Sens. 2022, 14, 4301. [Google Scholar] [CrossRef]
  29. Brehmer, P.; Vercelli, C.; Gerlotto, F.; Sanguinède, F.; Pichot, Y.; Guennégan, Y.; Buestel, D. Multibeam sonar detection of suspended mussel culture grounds in the open sea: Direct observation methods for management purposes. Aquaculture 2006, 252, 234–241. [Google Scholar] [CrossRef]
  30. Gerlotto, F.; Soria, M.; Fréon, P. From two dimensions to three: The use of multibeam sonar for a new approach in fisheries acoustics. Can. J. Fish. Aquat. Sci. 1999, 56, 6–12. [Google Scholar] [CrossRef]
  31. Colbo, K.; Ross, T.; Brown, C.; Weber, T. A review of oceanographic applications of water column data from multibeam echosounders. Estuar. Coast. Shelf Sci. 2014, 145, 41–56. [Google Scholar] [CrossRef]
  32. Innangi, S.; Bonanno, A.; Tonielli, R.; Gerlotto, F.; Innangi, M.; Mazzola, S. High resolution 3-D shapes of fish schools: A new method to use the water column backscatter from hydrographic MultiBeam Echo Sounders. Appl. Acoust. 2016, 111, 148–160. [Google Scholar] [CrossRef]
  33. Misund, O.A.; Aglen, A. Swimming behaviour of fish schools in the North Sea during acoustic surveying and pelagic trawl sampling. ICES J. Mar. Sci. 1992, 49, 325–334. [Google Scholar] [CrossRef]
  34. Misund, O.A. Dynamics of moving masses: Variability in packing density, shape, and size among herring, sprat, and saithe schools. ICES J. Mar. Sci. 1993, 50, 145–160. [Google Scholar] [CrossRef]
  35. Hafsteinsson, M.T.; Misund, O.A. Recording the migration behaviour of fish schools by multi-beam sonar during conventional acoustic surveys. ICES J. Mar. Sci. 1995, 52, 915–924. [Google Scholar] [CrossRef]
  36. Nagasawa, R.; Horinouchi, R. Initial study on the visualization of physical structures in the ocean utilizing the water column imaging of multibeam echo sounders. Rep. Hydrogr. Oceanogr. Res. 2023, 61, 1–18, (In Japanese with English abstract and figure captions). [Google Scholar]
  37. Schimel, A.C.G.; Brown, C.J.; Ierodiaconou, D. Automated Filtering of multibeam water-column data to detect relative abundance of giant kelp (Macrocystis pyrifera). Remote Sens. 2020, 12, 1371. [Google Scholar] [CrossRef]
  38. Clarke, J.H. Applications of multibeam water column imaging for hydrographic survey. Hydrogr. J. 2006, 120, 1–33. [Google Scholar]
  39. Tanoue, H.; Komatsu, T.; Hamano, A. Determination of upper boundary of an acoustic blind zone produced by the rugged bottom during a survey using a quantitative echosounder. Bull. Jpn. Soc. Fish. Oceanogr. 2013, 77, 53–58. (In Japanese) [Google Scholar]
  40. Rasmuson, L. Susceptibility of Five Species of Rockfish (Sebastes spp.) to Different Survey Gears Inferred from High Resolution Behavioral Data; Science Bulletin, 2021–05; Oregon Department of Fish and Wildlife: Salem, OR, USA, 2021. [Google Scholar]
  41. Hamana, M. Development of Quantitative 3-Dimensional Mapping of Seagrass and Seaweed Beds Using Multibeam Sonar. Ph.D. Thesis, The University of Tokyo, Tokyo, Japan, 2016; pp. 1–82. (In Japanese). [Google Scholar]
  42. New Energy and Industrial Technology Development Organization. NEDO Offshore Wind Energy Progress Edition II; New Energy Technology Department, New Energy and Industrial Technology Development Organization: Kawasaki, Japan, 2013; pp. 1–22. Available online: https://www.nedo.go.jp/library/pamphlets/FF_201306_yojofuryoku_e.html (accessed on 5 May 2024).
  43. Copernicus Marine Service. Global Ocean Physics Analysis and Forecast; E.U. Copernicus Marine Service Information (CMEMS), Marine Data Store (MDS): Toulouse, France, 2025. [Google Scholar] [CrossRef]
  44. François, R.E.; Garrison, G.R. Sound absorption based on ocean measurements. Part II: Boric acid contribution and equation for total absorption. J. Acoust. Soc. Am. 1982, 72, 1879–1890. [Google Scholar] [CrossRef]
  45. Quality Positioning Services, B.V. Fledermaus 7.8 Documentation FMGT 7.10/FMMidwater 7.9; QPS BV: Zeist, The Netherlands, 2022; pp. 1–539. Available online: https://publicdownload.qps.nl/Fledermaus/Fledermaus-7.8-Documentation_v3.pdf (accessed on 1 May 2024).
  46. Urban, P.; Köser, K.; Greinert, J. Processing of multibeam water column image data for automated bubble/seep detection and repeated mapping. Limnol. Oceanogr. Methods 2017, 15, 1–21. [Google Scholar] [CrossRef]
  47. Nau, A.W.; Scoulding, B.; Kloser, R.J.; Ladroit, Y.; Lucieer, V. Extended detection of shallow water gas seeps from multibeam echosounder water column data. Front. Remote Sens. 2022, 3, 839417. [Google Scholar] [CrossRef]
  48. R2SONIC, Inc. Sonic 2026/2024/2022 Broadband Multibeam Echosounders, Operation Manual V6.3; R2SONIC: Austin, TX, USA, 2022; pp. 1–254. Available online: https://www.manualslib.com/manual/2991159/R2sonic-2026.html#manual (accessed on 17 February 2023).
  49. Foote, K.G.; Chu, D.; Hammar, T.R.; Baldwin, K.C.; Mayer, L.A.; Hufnagle, L.C., Jr.; Jech, J.M. Protocols for calibrating multibeam sonar. J. Acoust. Soc. Am. 2005, 117, 2013–2027. [Google Scholar] [CrossRef]
  50. Noguchi, S. Developments of hydroacoustic measurement technology. Oki Tech. Rev. 2005, 72, 38–41. [Google Scholar]
  51. Aoki, I.; Inagaki, T.; Long, L.V. Measurements of the three-dimensional structure of free-swimming pelagic fish schools in a natural environment. Bull. Jpn. Soc. Sci. Fish. 1986, 52, 2069–2077. [Google Scholar] [CrossRef][Green Version]
  52. Pavlov, D.S.; Kasumyan, A.O. Patterns and mechanisms of schooling behavior in fish: A review. J. Ichthyol. 2000, 40, S163. [Google Scholar][Green Version]
  53. Nakamura, T.; Hamano, A.; Abe, K.; Yasuma, H.; Miyashita, K. Acoustic scattering properties of juvenile jack mackerel Trachurus japonicus based on a scattering model and ex situ target strength measurements. Nippon Suisan Gakkaishi 2013, 79, 345–354, (In Japanese with English abstract and figure captions). [Google Scholar] [CrossRef][Green Version]
  54. Genin, A. Bio-physical coupling in the formation of zooplankton and fish aggregations over abrupt topographies. J. Mar. Syst. 2004, 50, 3–20. [Google Scholar] [CrossRef]
  55. Van Hal, R.; Griffioen, A.B.; van Keeken, O.A. Changes in fish communities on a small spatial scale, an effect of increased habitat complexity by an offshore wind farm. Mar. Environ. Res. 2017, 126, 26–36. [Google Scholar] [CrossRef]
  56. Washio, T.; Sakamoto, N.; Nakashima, S.; Aoki, I.; Kawaguchi, K.; Nagai, T.; Nakai, K. Construction of ocean observation tower system off the Kita-Kyushu city for offshore wind farm design. J. Jpn. Soc. Civ. Eng. Ser. B3 Ocean. Eng. 2013, 69, I_1–I_6. (In Japanese) [Google Scholar]
  57. Yoshimura, Y. Present situation of offshore wind power generation system proving research in Kitakyushu city. Proc. Japan Wind Energy Sympo. 2013, 35, 478–481. (In Japanese) [Google Scholar]
  58. Shimaya, M.; Chikarashi, M.; Sasaki, M.; Nakai, T.; Yamaguchi, Y. Construction Management for Offshore Wind Power Facilities. J. Jpn. Soc. Civ. Eng. Ser. B3 Ocean. Eng. 2013, 69, I_114–I_119. (In Japanese) [Google Scholar]
  59. Sheng, Y.P. Chapter 3 Physical Characteristics and Engineering at Reef Sites. In Artificial Reef Evaluation: With Application to Natural Marine Habitats; Seaman, W., Ed.; CRC Press: Boca Raton, FL, USA, 2000; pp. 51–94. [Google Scholar]
  60. Liao, J.C.; Beal, D.N.; Lauder, G.V.; Triantafyllou, M.S. Fish exploiting vortices decrease muscle activity. Science 2003, 302, 1566–1569. [Google Scholar] [CrossRef]
  61. Takeuchi, T. Design of artificial reefs in consideration of environmental characteristics. In Japan–US Symposium on Artificial Habitats for Fisheries Proceedings; Nakamura, M., Grove, R.S., Sonu, C.J., Eds.; Southern California Edison Co.: Rosemead, CA, USA, 1991; pp. 195–203. [Google Scholar]
  62. Seto, M. Studies on development of wake flow and generation of unsteady hydrodynamic force. Fish. Eng. 2001, 38, 127–132. (In Japanese) [Google Scholar]
  63. Rasmuson, L.K.; Marion, S.R.; Fields, S.A.; Blume, M.T.O.; Lawrence, K.A.; Rankin, P.S. Influence of near bottom fish distribution on the efficacy of a combined hydroacoustic video survey. ICES J. Mar. Sci. 2022, 79, 2069–2083. [Google Scholar] [CrossRef]
  64. Bazigos, G.P. A Manual on Acoustic Surveys: Sampling Methods for Acoustic Surveys; Food and Agriculture Organization: Rome, Italy, 1981; 203p. [Google Scholar]
  65. Kloser, R.J. Improved precision of acoustic surveys of benthopelagic fish by means of a deep-towed transducer. ICES J. Mar. Sci. 1996, 53, 407–413. [Google Scholar] [CrossRef]
  66. Sawada, K.; Takahashi, H.; Takao, Y.; Watanabe, K.; Horne, J.K.; McClatchie, S.; Abe, K. (2004, November). Development of an acoustic-optical system to estimate target-strengths and tilt angles from fish aggregations. In Proceedings of the Oceans’ 04 MTS/IEEE Techno-Ocean’04 (IEEE Cat. No. 04CH37600), Kobe, Japan, 9–12 November 2004; Volume 1, pp. 395–400. [Google Scholar]
  67. Sawada, K.; Takahashi, H.; Abe, K.; Takao, Y. In situ measurement of target strength, tilt angle, and swimming speed of Boreopacific gonate squid (Gonatopsis borealis). J. Acoust. Soc. Am. 2006, 120 (Suppl. S5), 3107. [Google Scholar] [CrossRef]
  68. Scoulding, B.; Gastauer, S.; Taylor, J.C.; Boswell, K.M.; Fairclough, D.V.; Jackson, G.; Sullivan, P.; Shertzer, K.; Campanella, F.; Bacheler, N.; et al. Estimating abundance of fish associated with structured habitats by combining acoustics and optics. J. Appl. Ecol. 2023, 60, 1274–1285. [Google Scholar] [CrossRef]
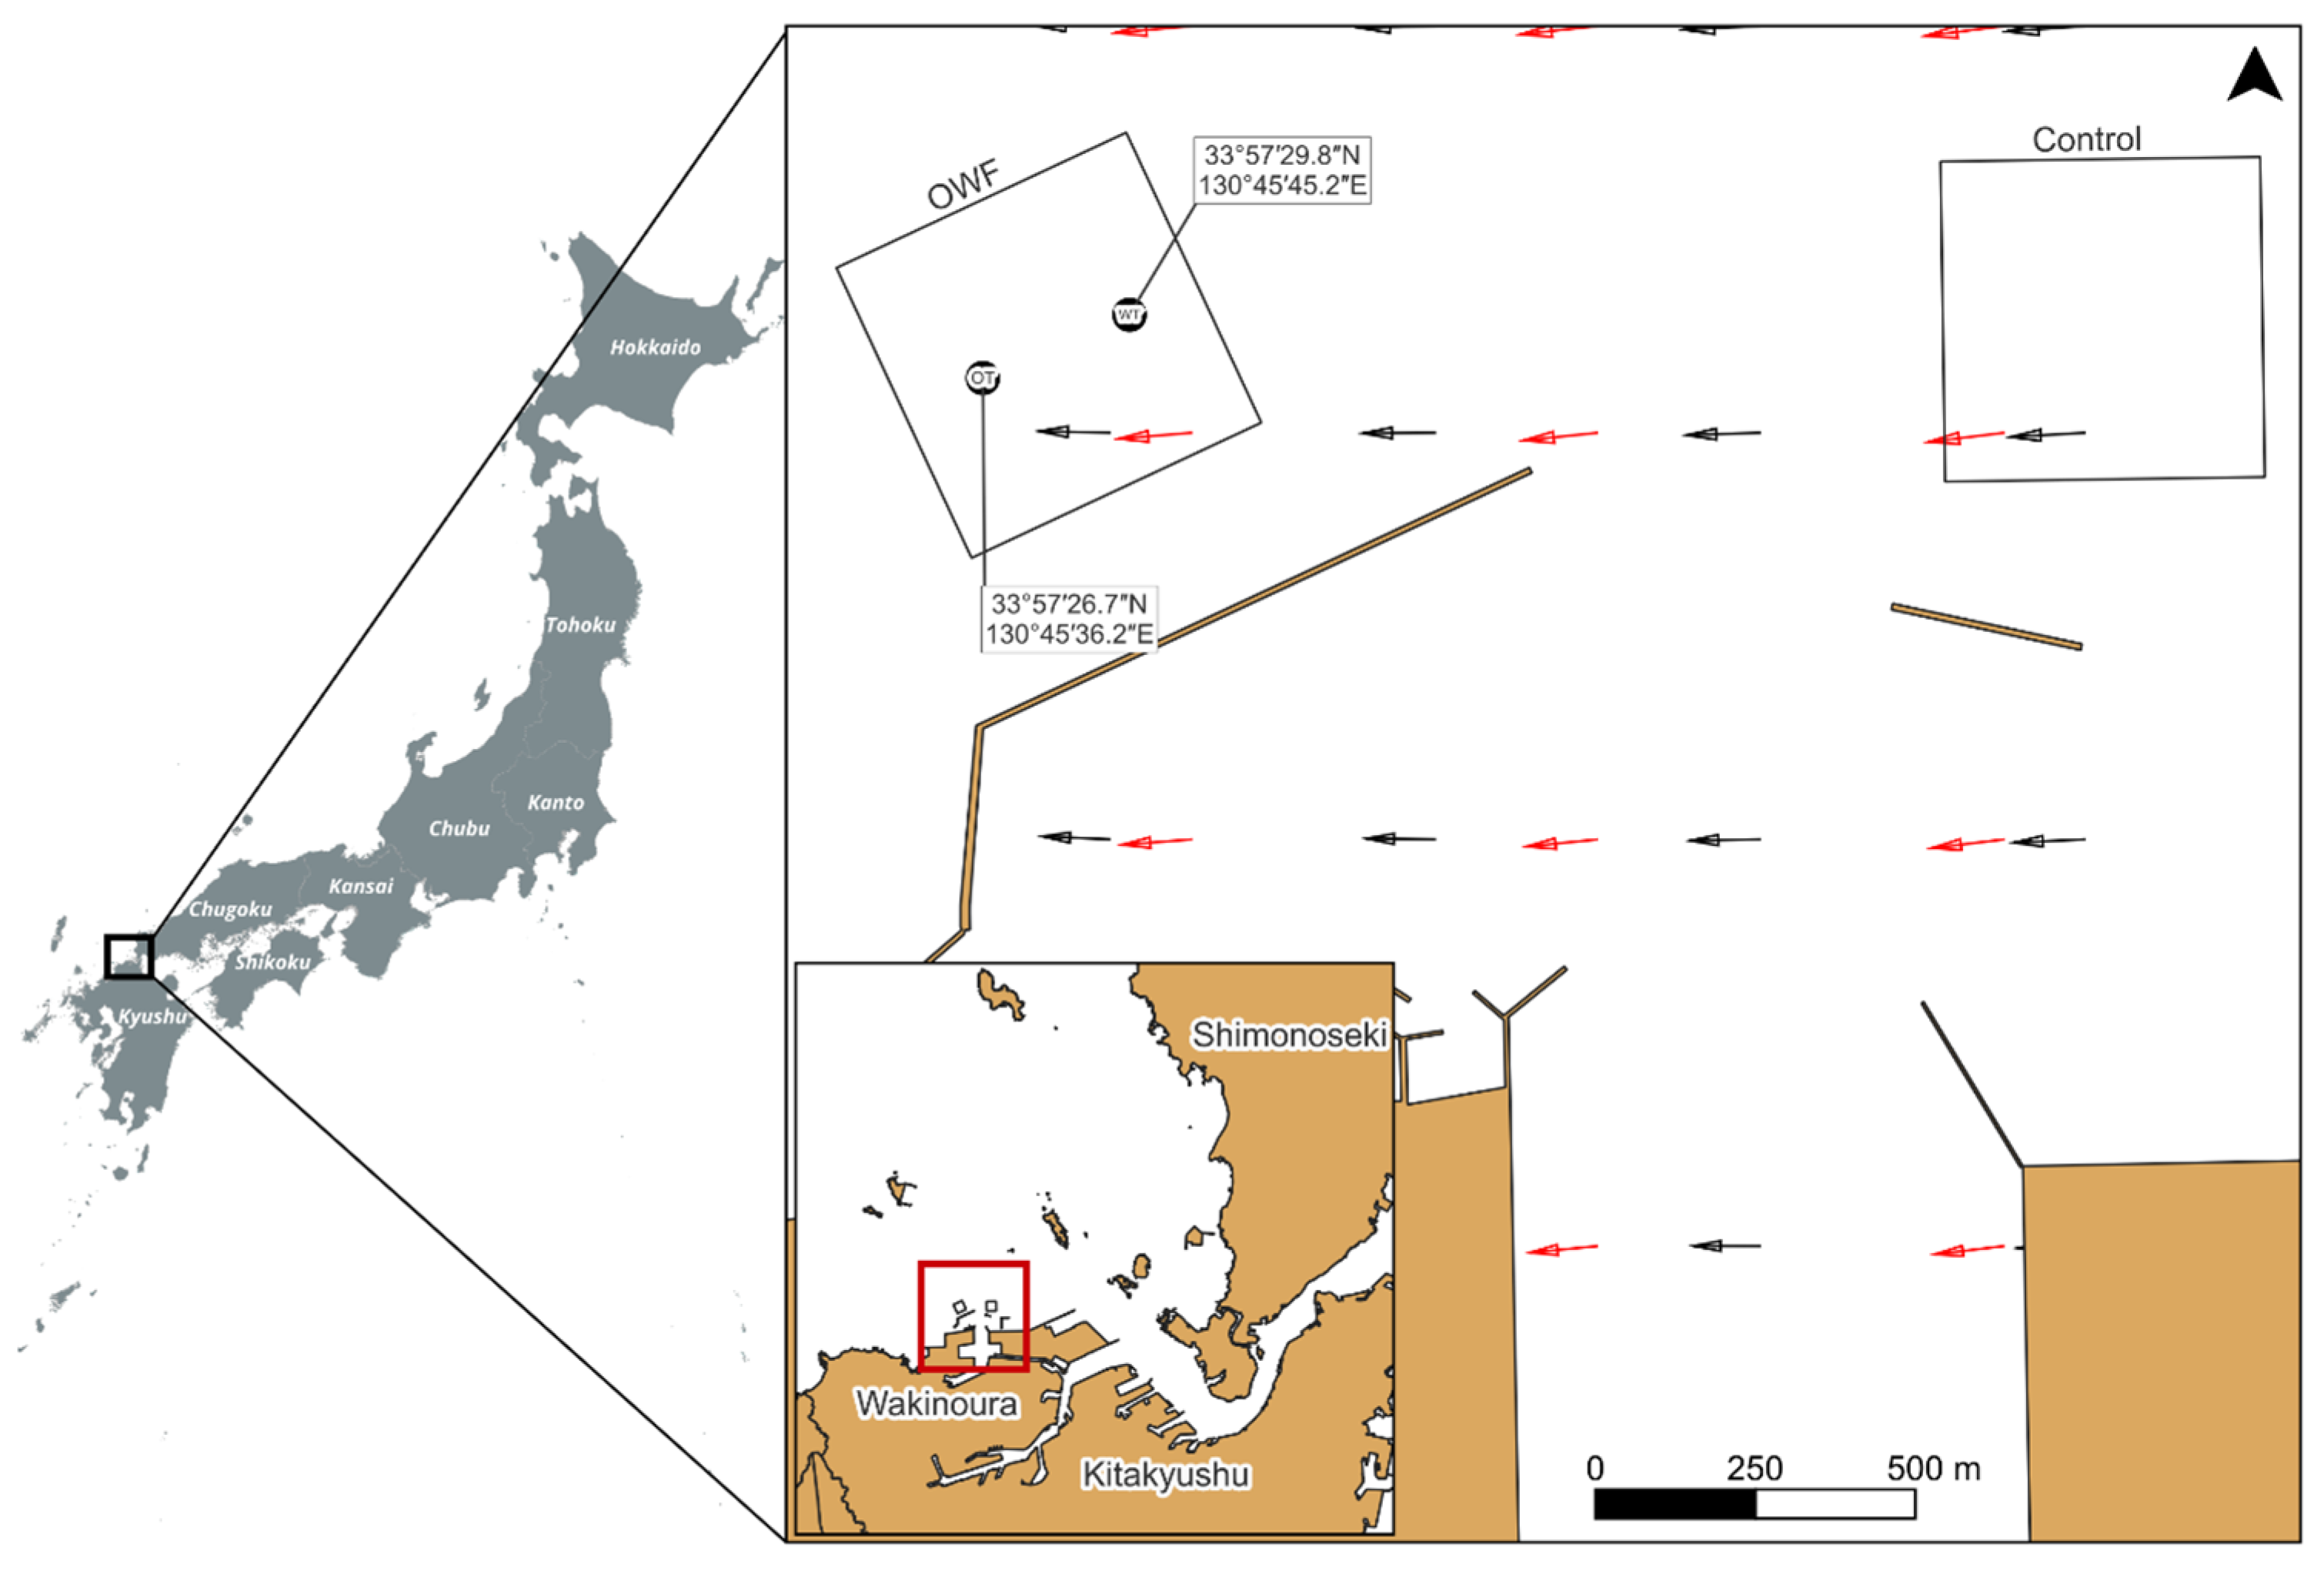
Figure 1. Maps show the survey area in Japan (left) and northern Kyushu Island (bottom right), as well as the enlarged survey area around the offshore wind turbine and observation tower (top right). Black and red arrows indicate the predominant current directions at the surface and at 6.4 m depth, respectively, on the survey date (10 December 2014). Currents were estimated using a marine forecast model provided by the Copernicus Marine Environment Monitoring Service [43].
Remotesensing 17 03255 g001
Figure 2. Flow chart illustrating the steps for processing water column image (WCI) data.
Remotesensing 17 03255 g002
Figure 3. Example of water column image (WCI) acquired by the multibeam sonar and processed through sequential steps: (A) raw backscatter in greyscale with the seafloor indicated by a yellow line; (B) calculated volume backscattering strength (Sv) in color scale (shown at the right of the lower panels) with the seafloor indicated by a black line; (C) Sv after removal of seafloor echoes; (D) Sv after applying a threshold filter; (E) Sv after removal of side-lobe artifacts and outer-beam noise; and (F) Sv after applying a neighborhood filter.
Remotesensing 17 03255 g003
Figure 4. Example of Sv value in WCI before (a) and after (b) applying a spatial filter. Panels (a-1,b-1) show lateral views along the survey transect, while panels (a-2,b-2) show top views of the same transect. The seafloor is indicated in black, and fish echoes are color-coded according to Sv values, as shown by the scale bar in the lower right panel.
Remotesensing 17 03255 g004
Figure 5. Japanese jack mackerel (Trachurus japonicus) captured around the OT.
Remotesensing 17 03255 g005
Figure 6. Distribution of fish cells (upper panel: OWF area; lower panel: control area). Colored dots indicate fish density per cell, and gray shading represents seafloor depth. The color and grayscale scales are shown on the left. The x, y, and z axes indicate east, north, and vertical upward orientations, respectively.
Remotesensing 17 03255 g006
Figure 7. Distribution of fish density per square meter of water column in the OWF area (left) and the control area (right). Colored dots represent fish density on the seafloor, while gray shading indicates bottom depth. The color scale for fish density and the grayscale for bottom depth are shown on the right.
Remotesensing 17 03255 g007
Figure 8. Fish biomass per square meter of water column by bottom depth class in the OWF area (left) and the control area (right). Note that the vertical scales differ between areas.
Remotesensing 17 03255 g008
Figure 9. Relationship between fish biomass per square meter of water column and seafloor slope in the OWF area (left) and control area (right). Biomass values are grouped into 5% slope classes.
Remotesensing 17 03255 g009
Figure 10. Distribution of biomass in fish cells in relation to the horizontal distance from the wind turbine (WT) and observation tower (OT) in the OWF area.
Remotesensing 17 03255 g010
Table 1. Multibeam settings.
ParameterValue
Frequency (kHz)200
Swath Coverage (degrees)150
Number of beams256
Pulse length (μs)100
Power (dB)215
Gain (dB)10
Table 2. Fish cell count and fish biomass (individuals) by bottom depth classes.
Depth (m)Fish Cell CountBiomass (Inds)
OWFControlOWFControl
−31992.81.3
−4662.30.7
−51378.90.7
−646627.60.9
−71462067.12.0
−828035124.94.4
−942254245.517.6
−1081444396.621.1
−11145013723.23.3
−121976 1019.8
−131660 850.0
−145 7.3
−154 0.5
Total68411943476.552.1
Disclaimer/Publisher’s Note: The statements, opinions and data contained in all publications are solely those of the individual author(s) and contributor(s) and not of MDPI and/or the editor(s). MDPI and/or the editor(s) disclaim responsibility for any injury to people or property resulting from any ideas, methods, instructions or products referred to in the content.