Article

CGAQ-DETR: DETR with Corner Guided and Adaptive Query for SAR Object Detection

College of Intelligence Science and Technology, National University of Defense Technology, No. 109 Deya Road, Kaifu District, Changsha 410073, China
*
Author to whom correspondence should be addressed.
Remote Sens. 2025, 17(18), 3254; https://doi.org/10.3390/rs17183254
Submission received: 23 August 2025 / Revised: 17 September 2025 / Accepted: 19 September 2025 / Published: 21 September 2025
(This article belongs to the Section Remote Sensing Image Processing)

Abstract

Highlights

What are the main findings?
  • A novel DETR with Corner Guided and Adaptive Query for SAR Object Detection, named CGAQ-DETR, achieves state-of-the-art mAP@50 scores of 69.8% on SARDet-100K and 92.9% on FAIR-CSAR, demonstrating high accuracy and robustness.
  • A Corner-Guided Multi-Scale Feature Enhancement Module (CMFE) module and an Adaptive Query Regression Module (AQR) module are introduced, enabling the model to perform adaptive, high-precision detection despite fluctuations in the scale and number of SAR objects.
What is the implication of the main finding?
  • This method effectively addresses challenges in SAR object detection, such as fluctuations in object quantity, scale variations, and discrete characteristics, while exploring new applications of DETR’s adaptive query mechanism.
  • This method provides an efficient, input data-driven solution that is applicable to standard SAR detection tasks, without the need for architectural modifications or extensive retraining.

Abstract

Object detection in Synthetic Aperture Radar (SAR) images remains a challenging task due to factors such as complex backgrounds, frequent fluctuations in object scale and quantity, and the inherent discrete scattering characteristics of SAR imaging. To address these challenges, we propose a DETR (DEtection TRansformer) with Corner-Guided and Adaptive Query for SAR Object Detection, which integrates a Corner-Guided Multi-Scale Feature Enhancement Module (CMFE) and an Adaptive Query Regression Module (AQR). The CMFE module processes multi-scale features by detecting and clustering corners to assess the scale and quantity of objects, which are used to compute the importance weights of features at different scales. The AQR module regresses the number of object queries by evaluating the rough object count from the low-level features, thereby achieving more precise and adaptive query allocation. Both modules are supervised by real data. Extensive experiments conducted on the SARDet-100K and FAIR-CSAR datasets demonstrate that our method achieves SOTA (state-of-the-art) performance, and achieved mAP@50 scores of 69.8% and 92.9%, validating its effectiveness and practical applicability in SAR object detection.

1. Introduction

In recent years, the high resolution and wide field of view advantages of Synthetic Aperture Radar (SAR) imagery [1,2,3,4,5,6,7,8,9,10,11,12,13] have led to the widespread application of remote sensing object detection in both civilian and military domains, such as traffic flow management, natural disaster rescue, and monitoring of environmental changes on Earth. However, SAR image data, due to its unique imaging mechanism, often exhibit characteristics such as complex backgrounds, large variations in object scales, significant inter-scene variations in the number of objects, and discrete scattering. These factors present considerable challenges for SAR object detection [14,15,16,17,18,19,20,21,22]. In the field of SAR object detection, methods that focus on the discrete characteristics of objects often employ scattering center detection techniques, which are commonly used and effective. Therefore, to better assess the discrete characteristics of objects in SAR images, we performed corner detection on different types of objects, with the detection results shown in Figure 1a.
Current object detection methods are typically based on CNNs [23,24,25,26,27,28,29,30,31,32,33], where the core idea is to extract image features through convolutional neural networks and often rely on predefined anchor boxes or sliding windows to generate potential object regions [34,35,36]. Examples of such methods include the Region Proposal Network (RPN) in Faster R-CNN [37] and the multi-scale anchor mechanism in RetinaNet. In conventional domains, CNN-based object detection methods have demonstrated excellent performance due to their efficient local feature extraction capabilities. However, in SAR object detection tasks, due to issues such as complex backgrounds and significant variations in object scale and quantity, as shown in Figure 1b, the local feature extraction capability of CNNs and their strategy for selecting object candidate regions often fail to achieve optimal performance. Specifically, the convolution operation of CNNs is limited by the local receptive field, which only captures scattering points within a local range of the SAR image, thus unable to associate global object structures [38]. This limitation is particularly problematic when dealing with substantial noise interference, leading to misidentification of objects. Additionally, the object candidate region selection strategy, due to its predefined settings, is prone to missed detections and misassignments when confronted with significant changes in object scale, which negatively impacts detection performance.
In comparison, DETR (DEtection TRansformer) [39] utilizes the self-attention mechanism [40], which effectively captures long-range dependencies, allowing DETR to better capture macroscopic features and reduce noise interference in SAR images. Additionally, the learnable object queries within DETR enable the model to further enhance the targeting of long-range dependencies. However, DETR suffers from slow convergence during training, requiring more training epochs to achieve optimal performance, and its detection of small objects is suboptimal. Deformable DETR [41], on the other hand, employs deformable attention modules to more efficiently facilitate cross-level feature aggregation. This significantly accelerates the model’s convergence speed during training while allowing it to effectively extract features from smaller objects. While the deformable attention module can focus on multi-scale features, in SAR image processing, due to the frequent fluctuations in object scale, this may lead to the weakening of key features by non-essential ones. This issue primarily arises from the lack of dynamic adaptability in the multi-scale feature fusion of the deformable attention module for SAR detection, where the weights of features across different layers do not account for the object scale distribution and the varying reliability of features in the current image [42,43].
DETR-like methods typically use a fixed number of object queries (K) to query objects. The decoder generates prediction boxes based on the interaction between these queries and image features. However, unlike objects in natural optical images, the discrete scattering characteristics of objects produced by the SAR imaging mechanism present a greater challenge for object detection. In this case, a fixed value of K may lead to the model excessively focusing on noise or failing to capture key scattering points, which can limit the detection performance of DETR in the SAR domain. DQ-DETR [44] addresses this issue by dynamically adjusting K through the classification of a fixed number of object queries to accommodate variations in the number of objects. This approach leads to a more stable model structure and easier convergence when dealing with large-scale variations in object quantity. However, in typical SAR object detection scenarios where such variations are not as significant [45,46], we argue that using classification methods to adjust K may result in inadequate adaptability for the query number at the boundaries.
Based on these considerations, we propose a SAR object detection method based on corner-point clustering and regression K-value to address the challenges posed by complex backgrounds, object scale variations, and significant changes in object quantities in SAR detection. We first introduce a Corner-Guided Multi-Scale Feature Enhancement Module (CMFE), which processes multi-scale features by detecting and clustering corner points to obtain object quantity information. This object quantity information, along with the number of bounding boxes (bbox) in the ground truth, is used for importance weight calculation. The final enhancement of multi-scale features is achieved using these importance weight scores. At this point, the CMFE module utilizes the discrete scattering characteristics of SAR images, allowing the model to dynamically focus on features of key scales based on the quantity and scale of objects in the image. This enhances the model’s ability to adapt to object scale variations encountered during the training phase. Subsequently, we propose an Adaptive Query Regression Module (AQR), which processes the bottom-most layer features that contain the most spatial information for quantity evaluation. Based on this evaluation, the features undergo a regression calculation of the number of object queries for more precise and dynamic adjustments to the DETR object queries, thereby overcoming the detection challenges posed by variations in object quantity. Both of our modules are supervised using ground truth and loss functions. Experimental results demonstrate that our method achieves outstanding performance on the SARDet-100K [47] and FAIR-CSAR [48] datasets, showcasing its practical applicability in SAR object detection. The main contributions of this article can be summarized as follows.
  • We propose a novel SAR object detection method named CGAQ-DETR, which is the first detector designed to simultaneously leverage the discrete characteristics of SAR objects and address the frequent fluctuations in object scale and quantity within this task.
  • To address the issue of object scale variation, we designed a Corner-Guided Multi-Scale Feature Enhancement Module (CMFE), which evaluates the object scale and quantity based on the discrete characteristics of SAR objects. This module, in conjunction with ground truth, enhances multi-scale features during training to enable the model to dynamically focus on important feature layers.
  • To address the issue of object quantity fluctuations, we designed an Adaptive Query Regression Module (AQR), which leverages the most informative low-level features to perform lightweight object quantity estimation, enabling fine-grained dynamic adjustment of K.
  • Our method is extensively evaluated through detailed data statistics and numerous experiments on the SARDet-100K and FAIR-CSAR datasets, achieving outstanding performance in all cases. Experimental results demonstrate that our algorithm delivers excellent performance across datasets with varying scales and quantity distributions.
The remainder of this paper is organized as follows: In Section 2, we review related work; in Section 3, we present the proposed method. In Section 4, we evaluate our method against SOTA approaches on two public datasets and conduct ablation experiments. Finally, in Section 5, we conclude the paper.

2. Related Work

2.1. Detection Transformer

DETR, as the pioneering object detection framework that successfully employs a Transformer encoder–decoder architecture for end-to-end set prediction, without the need for manually designed components such as anchor boxes and NMS. It transforms object detection into an interaction problem between image features and learnable queries, with loss calculation performed via Hungarian matching. However, DETR faces limitations, including slow training convergence and poor performance in small object detection.
To address these issues, Deformable DETR introduces the Deformable Attention Module, which samples only a few key positions around reference points, significantly reducing computational complexity and improving multi-scale feature utilization. This enables multi-scale information fusion and faster convergence, laying the foundation for subsequent improvements.
Conditional DETR [49] focuses on the core issue of slow training convergence in DETR, proposing a conditional cross-attention mechanism. By learning a conditional spatial query in the decoder, it dynamically adjusts the spatial positions of query vectors, allowing the cross-attention heads to adaptively focus on object areas. This separates the roles of content queries and spatial queries, thus reducing training difficulty.
DAB-DETR [50] addresses both the slow training convergence and unclear query function issues in DETR by proposing a new approach using dynamic anchor boxes as queries. The 4D box coordinates are used as queries in the Transformer decoder and dynamically updated layer by layer. By introducing explicit positional priors, the similarity between queries and features is enhanced. Although the above-mentioned DETR design improves object detection accuracy, its fixed query number configuration makes it challenging for the model to achieve efficient object detection performance when faced with frequent fluctuations in the number of objects.
To improve small object detection in DETR, researchers have proposed optimizations from various directions, such as dynamic queries and angle regression. For example, DQ-DETR [44] estimates the number of objects through Categorical Counting Module (CCM), dynamically adjusting the number of decoder queries to address the issue of uneven image density. It also enhances small object feature representation through multi-scale feature fusion. Although DQ-DETR maintains the stability of the model by calculating the query number through classification in response to large-scale object number variations, classification fails to leverage the advantages of query number adaptability when confronted with frequent but less dramatic fluctuations in the number of objects.
To address the issues of the above algorithm and the challenges posed by SAR object detection, we propose the CGAQ-DETR method, which is specifically designed to address the difficulties and characteristics of SAR object detection. The method incorporates targeted modules and achieves promising performance.

2.2. SAR Object Detection

With the rise in deep learning, CNN-based detection methods have gradually dominated the SAR object detection field. The core advantage lies in the automatic learning of hierarchical features, eliminating reliance on manually designed features. Early CNN-based approaches typically involved directly transferring general object detection frameworks, such as applying models like Faster R-CNN and YOLO [51,52,53], to SAR object detection. These methods extract multi-scale features through convolutional layers, generate candidate regions using anchor box mechanisms, and then achieve object localization and recognition through classification and regression branches. However, common CNN structures rely on predefined anchor box scales and ratios, requiring manual parameter tuning to adapt to SAR images with complex backgrounds. Post-processing steps like Non-Maximum Suppression (NMS) can lead to missed detections of densely packed objects, and the limited receptive field of traditional CNNs struggles to capture the global scattering relationships of SAR objects, resulting in poor detection performance for small and low Signal-to-Noise Ratio (SNR) objects.
With the emergence of DETR-based detection methods, an increasing number of scholars have attempted to apply DETR to SAR detection. DETR-like methods, based on the encoder–decoder structure of Transformer, completely discard anchor boxes and NMS, directly outputting object sets through end-to-end set prediction. Compared to CNN-based methods, the DETR framework has a greater advantage in capturing long-range dependencies, which enables it to maintain relatively superior detection performance even in the complex backgrounds of SAR images. However, the DETR framework still requires optimization when faced with the discrete nature of SAR images and other challenges, such as complex backgrounds.
GL-DETR (global-to-local detection transformer) [54], which addresses the complex background challenges faced in detecting small ships in SAR images, introduces a global-to-local Transformer framework. The global layer facilitates extensive interaction between object queries and global contextual information, enabling coarse localization of bounding boxes; the local layer designs a Local Interaction Attention (LIA) module, which leverages local multi-scale ROI (region of interest) information to refine object query features. Additionally, a Multi-Scale Information Enhancement (MIE) module is introduced, which uses Gaussian filtering to extract high-frequency contour information of small ships. However, the MIE module inadequately enhances low-frequency structural information for medium and large objects, making it difficult for the model to adapt to data with scale fluctuations.
OEGR-DETR (orientation enhancement and group relations detection transformer) [55], addressing the direction sensitivity and intra-class variation problems of SAR objects, proposes direction enhancement and group relationship contrast mechanism based on the DETR framework. Its core components include the Orientation Enhancement Module (OEM) and Group Relationship Contrast Loss (GRC Loss): OEM extracts directional features at different angles using Oriented Response Convolution (ORConv), reweights channel features using self-attention, and integrates rotation information into the feature sequence. GRC Loss, based on contrastive learning, introduces a grouping mode within the Content Denoising mechanism (CDN). However, GRC Loss employs a unified intra-class variance minimization strategy to optimize intra-class differences, which results in poor adaptability when dealing with object scale fluctuations.
Recently, generative methods have shown significant effectiveness, and some studies have efficiently leveraged the advantages of both generative and discriminative methods, such as the Confucius tri-learning [56]. This framework consists of three collaboratively trained models: two classifiers with identical structures but different initializations, and one generator. The classifiers learn classification knowledge from “good” examples and avoid error interference by learning from “bad” examples generated by the generator, ultimately optimizing through a combination of encouragement and suppression losses. However, this paradigm focuses on SAR object classification tasks, and its adaptability under conditions of frequent object feature variation has not been validated. Extending it to the object detection domain remains a significant challenge.
Although these methods have achieved relatively excellent SAR object detection results, they still overlook the object characteristics of SAR images, such as object scale or object quantity. This oversight makes it difficult for the model to adapt to the detection challenges posed by the variations in object characteristics under different data conditions.

2.3. Physical Characteristics of SAR

SAR objects pose unique challenges for detection and recognition due to their structural distribution sparsity and scattering characteristics. The structural distribution discreteness of SAR objects primarily originates from the imaging mechanism of SAR, which results in sparse scattering of SAR objects in complex scenes. In such cases, the object is often not presented as a continuous, complete object but rather consists of multiple discrete scattering points distributed across various parts of the object. The scattering characteristics of SAR objects are primarily manifested in phenomena such as single-bounce, double-bounce, edge diffraction and shadow, all induced by the object’s irregular geometric shape. Additionally, there is variation in the scattering intensity across different parts of the SAR object, and the scattering characteristics of the same type of object may change under different observation conditions. These physical properties pose significant challenges for the detection of SAR objects.
As deep learning has emerged, researchers have started incorporating the physical characteristics of SAR objects into network design to address the data processing challenges it poses. For instance, the physics-guided detector (PGD) [57] has proposed a Physics-Guided Self-Supervised Learning (PGSSL) module. This module encodes the discrete scattering structure distribution of an aircraft as feature embeddings by predicting the scattering distribution heatmap, enabling the model to perceive physical characteristics such as edge diffraction and multiple scattering. This effectively improves the accuracy and interpretability of aircraft detection.
In ship detection, the Scattering-Point-Guided Oriented RepPoints for Ship Detection method [58] integrates key scattering points into the Region Proposal Network. It employs the Harris corner detection method to extract scattering points and aligns them with anchor points, guiding the deformable convolution for feature extraction.
Although these methods effectively leverage the discrete characteristics of SAR, they fail to apply this to the model’s adaptation to fluctuations in object count and scale. This oversight of the high value of discrete characteristics results in the model still being affected by variations in the object distribution of the dataset.
Therefore, when introducing DETR to SAR object detection, in the face of challenges such as diverse object scales and frequent variations in object quantity, we believe that fully leveraging the physical characteristics of SAR imaging is of significant value in enhancing detection performance. We designed the Corner-Guided Multi-Scale Feature Enhancement Module utilizing its scattering characteristics. Through corner detection and clustering, we roughly estimate the object scale distribution and quantity, and use this as a prior to compute the importance weights of multi-scale features, in conjunction with the ground truth, thereby enabling effective enhancement of multi-scale features. Additionally, leveraging the sparse spatial distribution of objects in SAR images, we designed the Adaptive Query Regression Module. This module utilizes lightweight feature processing to estimate the object count in the image and regresses the number of object queries, enabling adaptive allocation of the queries.

3. Materials and Methods

In this chapter, we will introduce a SAR object detection method named “Corner-Guided Adaptive Query DETR (CGAQ-DETR)”, which is based on the Deformable DETR framework. Our approach aims to address the challenges of object scale variation and quantity fluctuation in complex SAR images by integrating two innovative modules: the Corner-Guided Multi-Scale Feature Enhancement Module and the Adaptive Query Regression Module.
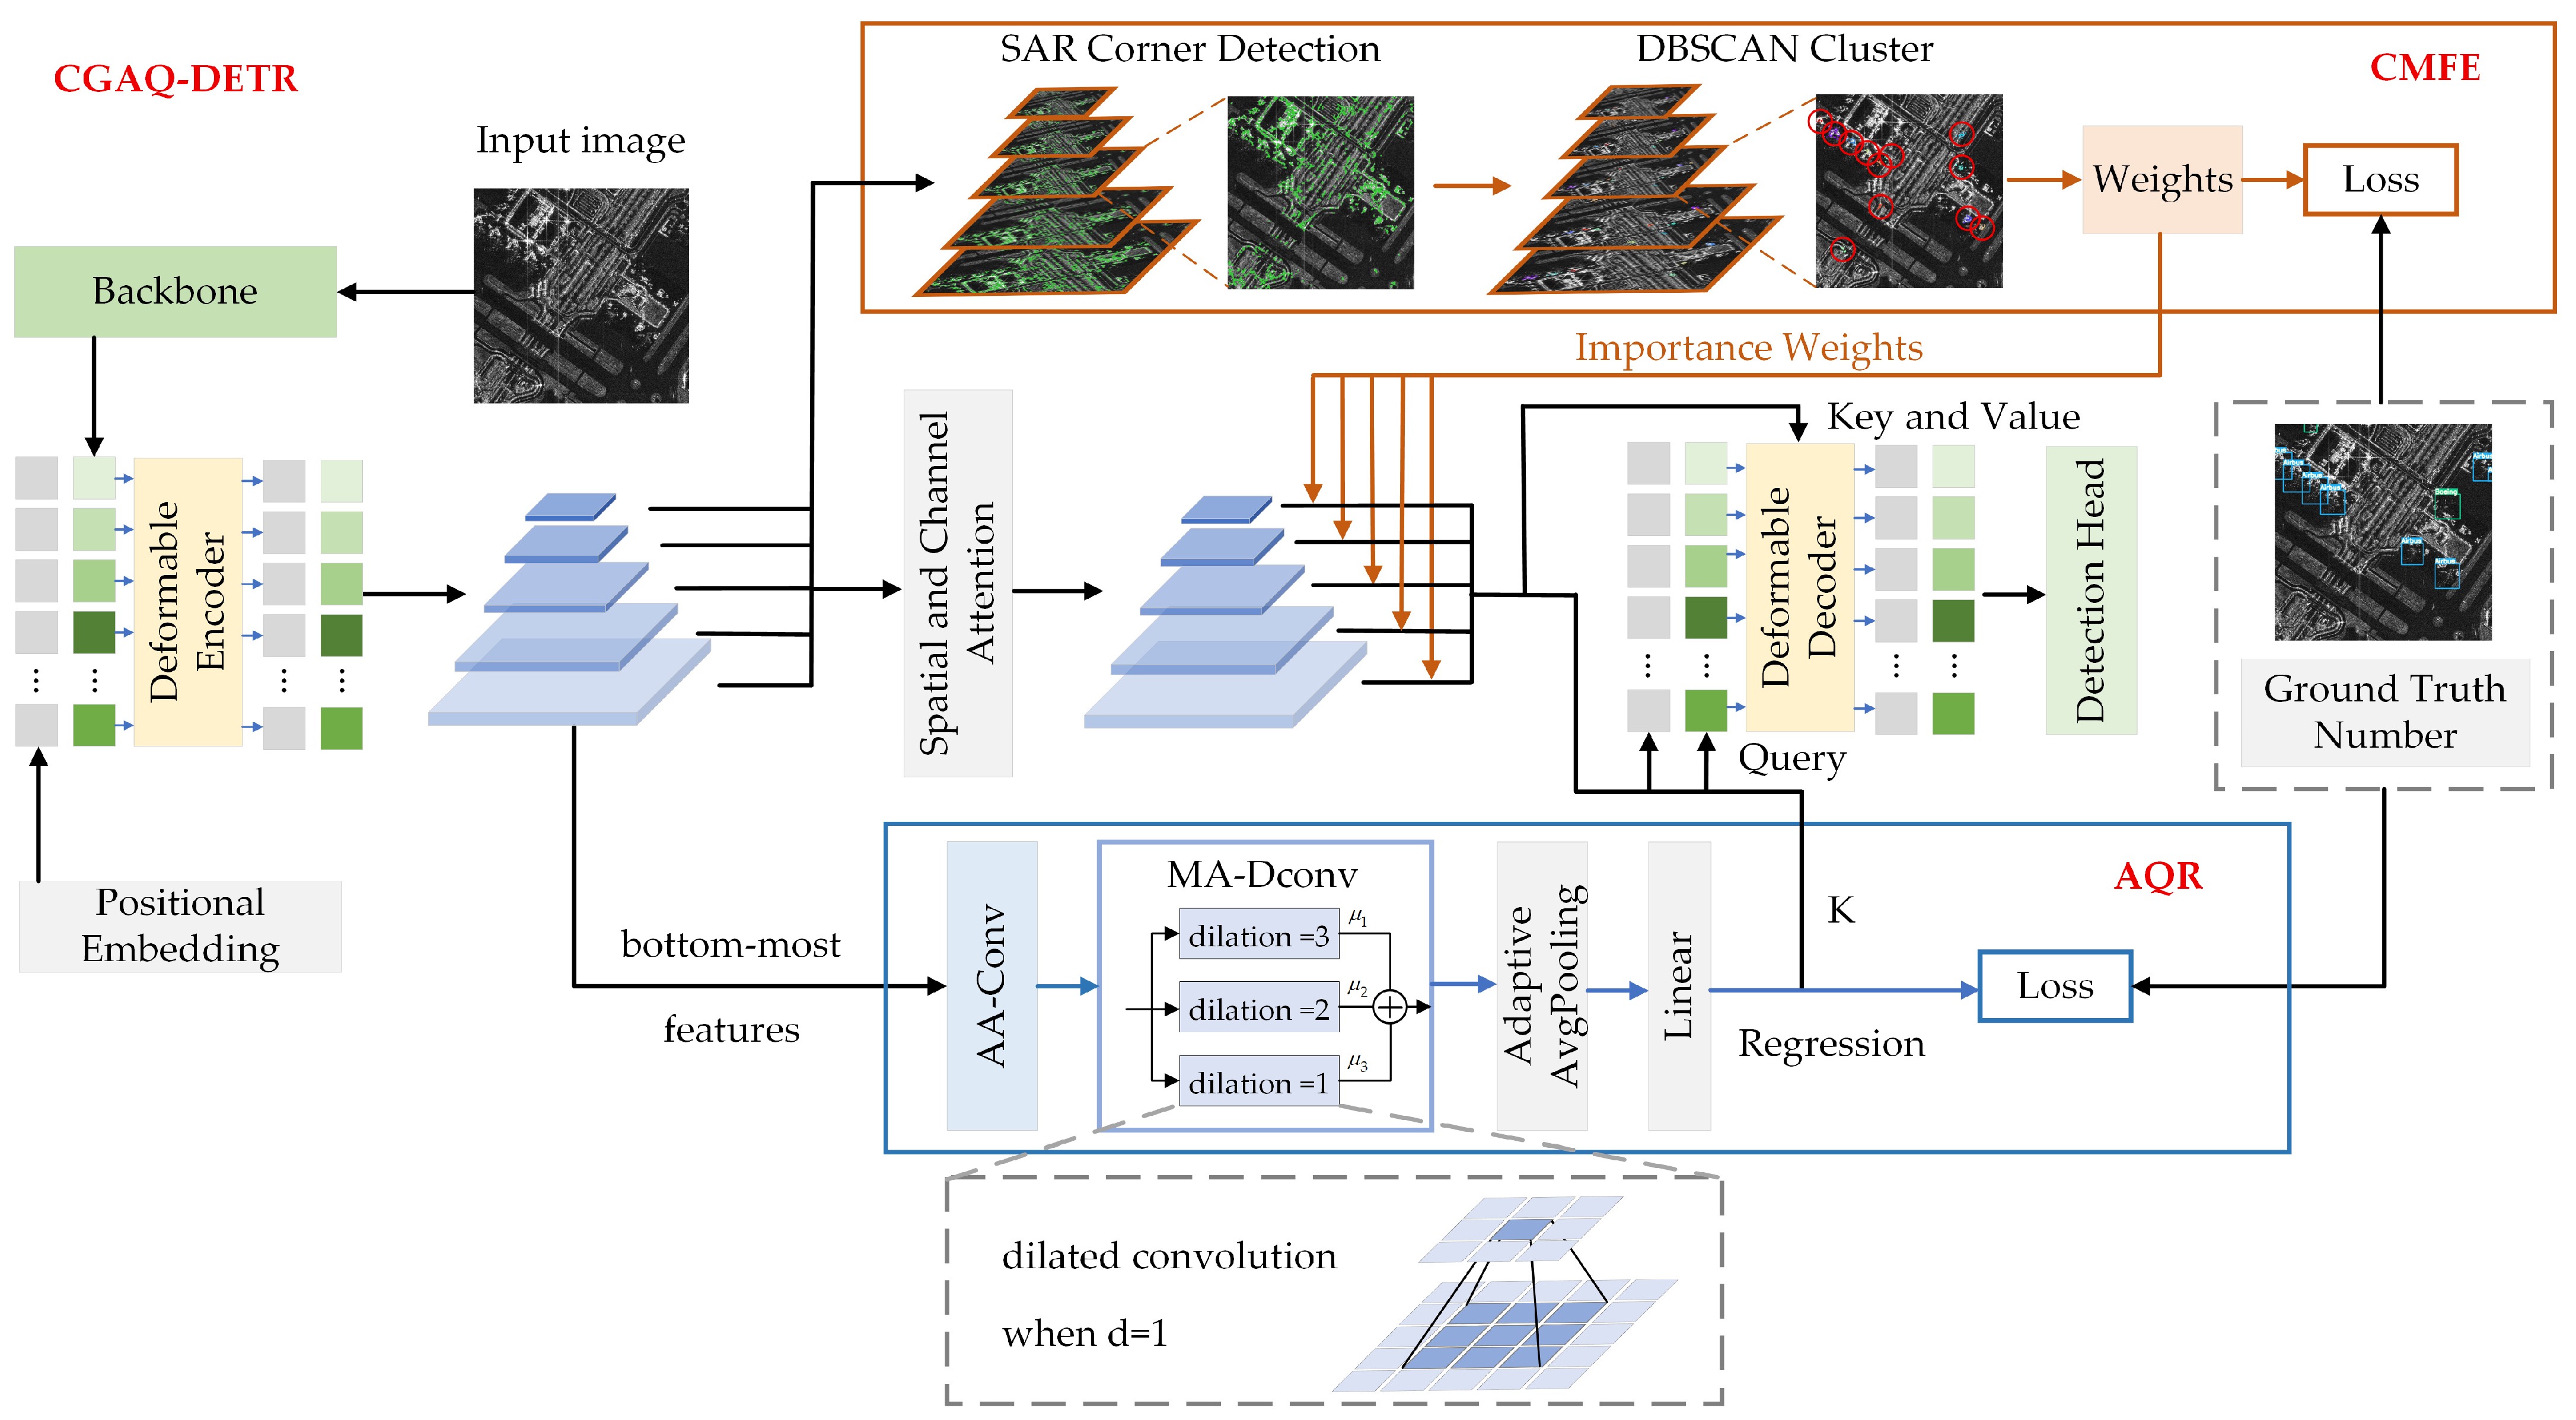
As illustrated in Figure 2, the structure of our SAR detection method first extracts features through the backbone, followed by encoding into the Deformable Encoding [41]. In the Corner-Guided Multi-Scale Feature Enhancement Module, we process the multi-scale features from the encoding into a unified scale and perform corner point detection. The corner detection results are then clustered and based on prior knowledge of the image and ground truth; scale importance weights are calculated. These multi-scale weights are assigned to features at each level to achieve effective feature enhancement for object scale variation.
Meanwhile, in the Adaptive Query Regression Module, we extract features from the lowest level and use lightweight feature processing techniques to estimate the object quantity. Based on this quantity evaluation, we perform a regression on the number of queries K, and then generate the corresponding position queries and content queries according to the value of K, which are input into the deformable decoder [41]. At this stage, the decoder takes K query vectors and feature-enhanced features as inputs, and the K queries output by the decoder are finally used for detection. Both modules are optimized end-to-end through the integration of ground truth and loss functions.

3.1. Corner-Guided Multi-Scale Feature Enhancement Module

To effectively address the issue of frequent object scale variations in SAR images, we have designed the Corner-Guided Multi-Scale Feature Enhancement Module, which leverages the discrete scattering characteristics of SAR images to efficiently allocate the importance weights of multi-scale features. We propose a Multi-Scale SAR Corner Detection method that elevates multi-scale features to a unified scale, subsequently extracting the relevant object information in the multi-scale SAR features. Based on the corner detection results, we apply the DBSCAN clustering method to perform a preliminary assessment of the object structure and quantity. The corner clustering results of multi-scale features are then compared and modeled against known prior information (ground truth) to obtain a rough object detection accuracy for features at different scales. Based on this, the importance of each multi-scale feature is computed. Specifically, we first perform reconstruction on the multi-scale features obtained from the Deformable Encoder:
F i = F [ : , s i : e i , : ] , H i , W i B × C × H i × W i ,
where represents the shape reshaping function, B represents the batch size, C represents the number of channels s i = k = 0 i 1 H k W k , e i = s i + H i W i and H i , W i = S i denotes the spatial dimension of the i-th layer. In this case, we use five layers (i = 5).
After processing the multi-scale features, we apply SAR corner detection methods to each of them to obtain multi-scale corner information:
H i = = N M S C o n v 3 × 3 ( F i ) ,
N M S H = H l H = M a x P o o l k × k H ,
where denotes element-wise multiplication, l is the indicator function, and k = 3 represents the size of the NMS kernel, which is used to retain local maxima while effectively suppressing non-significant responses.
After detecting the corner points in the multi-scale feature maps, we perform corner points clustering on each scale to obtain the structural characteristics and approximate quantity of the object. Since the DBSCAN (Density-Based Spatial Clustering of Applications with Noise) algorithm does not rely on the spherical assumption of clusters, it demonstrates higher robustness when dealing with corner points of objects at various scales and shapes in SAR images. This makes it more effective in achieving accurate clustering of the object corner points. Therefore, we apply the DBSCAN clustering method for multi-scale corner point clustering:
P i b = ( x , y ) H i b [ 0 , x , y ] > τ ,
( C l u s t e r ( p ) = q P p - q 2 ε N ε ( q ) min _ p t s ) ,
c i b = C ( P i b ; ε = 8 , min _ p t s = 8 ) ,
where C represents the DBSCAN clustering algorithm, τ indicates the sensitivity threshold for corner detection, ε denotes the neighborhood radius, and min _ p t s represents the minimum number of samples required for a cluster. In corner detection, τ represents the extraction threshold for corners. Typically, an increase in τ will lead to the neglect of corners with less pronounced features during detection. Although this improves precision, the number of detected corners will decrease. Therefore, we set τ to 0.5 to maintain a balance between the number of corner detections and detection precision. In corner clustering, ε determines the coverage area of the neighborhood. An increase in ε generally allows a broader range of corners to cluster into a single group, which results in more obvious clustering visualization but may also cause multiple objects to be recognized as one, thereby reducing detection accuracy. Conversely, lowering ε makes the clustering process more stringent and may result in a large-scale object being divided into several small clusters. At the same time min _ p t s , affects the ease of cluster formation. An increase in min _ p t s will enhance detection precision for large-scale objects, but small-scale objects may be overlooked. On the other hand, an excessive decrease in min _ p t s may lead to noise being identified as objects. Therefore, the clustering results will be jointly influenced by ε and min _ p t s . To better apply this to SAR images, we set both parameters to 8.
Based on the corner points, we simultaneously compute the clustering area and the area distribution entropy.
a i b = j = 1 n i A r e a ( c j ) ,
e i b = j = 1 n i p j log p j , p j = A r e a ( c j ) a i b ,
where A r e a ( c j ) represents the bounding box area of the j-th cluster, and e i b denotes the uniformity of the cluster size.
Based on the clustering results, we compute the importance weight by comparing the structure and quantity of the clusters with the true count in the ground truth. The true count is denoted as N i b , the bounding box area as A i b , and the area distribution entropy as E i b . The importance of weight is then calculated as follows:
w i b = α 1 | c i b t i b | + ε + β 1 | a i b A i b | / A i b + ε + γ 1 | e i b E i b | + ε ,
where α , β and γ represent the weight balancing coefficients. The multi-scale features are first processed through spatial-channel attention [59], followed by importance weighting. The spatial attention we implemented is defined as:
M s = σ C o n v ( [ A v g P o o l c ( F i ) ; M a x P o o l c ( F i ) ] 1 × H × W ,
F i s = M s F i ,
where A v g P o o l c ( ) and M a x P o o l c ( ) represents global average pooling and max pooling along the channel dimension, σ is the Sigmoid function, represents scalar broadcast multiplication. After the spatial attention processing, we apply channel attention to the features.
g a v g = A v g P o o l s ( F i s ) C × 1 × 1 ,
g max = M a x P o o l s ( F i s ) C × 1 × 1 ,
w c = σ M L P g a v g + M L P g max C × 1 × 1 ,
F i c s = w c F i s ,
where A v g P o o l s ( ) and M a x P o o l s ( ) represents global average pooling and max pooling along the spatial dimension, while M L P (multilayer perceptron) is implemented through two fully connected layers. Finally, we apply importance weighting to the multi-scale features after spatial and channel attention processing:
F i o u t = w i b F i c s ,
where F i o u t denotes the enhanced multi-scale features as the final output.

3.2. Adaptive Query Regression Module

To enable the query processing of DETR to adapt as much as possible to the variations in the quantity of objects in SAR images, we utilize the bottom-most features of multi-scale features. Through amplitude-aware convolution (AA-Conv) and multi-scale adaptive dilated convolution (MA-DConv), we generate the Count-Priming Feature, which is then used to calculate adaptive object queries via regression, providing the model with the most suitable K for efficient query utilization. Specifically, to address the unique discrete and noisy characteristics of SAR images, we have designed an amplitude-aware convolution layer to process the bottom-most features extracted from multi-scale features:
X n o r m = F 0 | | F 0 | | 2 + ,
X c o n v = Re LU ( W c X n o r m ) ,
where = 10 6 prevents division-by-zero errors, | | | | 2 represents the L2 norm, and W c C × 1 × 1 denotes the parameters of the 1 × 1 convolution kernel. This normalization technique effectively addresses the complex noise and discrete characteristics in SAR images, ensuring that weak object features are not overshadowed by strong scattering points. Subsequently, we introduce multi-scale adaptive dilated convolutions to handle multi-scale objects in SAR images, generating the Count-Priming Feature:
Y d ( 1 ) = W d 1 1 X c o n v ,
Y d ( 2 ) = W d 2 2 X c o n v ,
Y d ( 3 ) = W d 3 4 X c o n v ,
μ = S o ft max W a G A P ( X c o n v ) ,
X m s a = Φ k = 1 3 μ k Y d ( k ) ,
where d represents the convolution operation with a dilation rate of d, GAP refers to global average pooling, α = [ α 1 , α 2 , α 3 ] is the adaptive weight vector, and Φ is the ReLU activation function.
Due to the discrete nature of SAR images, traditional convolution methods struggle to precisely capture the structure of SAR objects while maintaining a low parameter count. To better evaluate the number of SAR objects, we design the multi-scale adaptive dilated convolution, which leverages dilated convolutions with a larger receptive field to capture high-order semantic information with low computational cost. Specifically, our multi-scale adaptive dilated convolution is implemented through three parallel branches, each employing a different dilation rate to accurately capture the objects in SAR images.
Given the discrete nature of SAR, local information may be influenced by noise, leading to insufficient data. Therefore, all three branches of our design utilize dilated convolutions. A smaller dilation rate (d = 1) allows the model to capture relatively fine local details of SAR objects and their corner features, even when the SAR object structure is sparse, thus retaining effective local information. A moderate dilation rate (d = 2) enables the model to capture medium-scale structural information, preserving both the discrete structure and local details of the SAR objects. A larger dilation rate (d = 3) permits the model to capture broader contextual and higher-order semantic information.
If the dilation rate were further increased, the convolution receptive field would become excessively large, causing background information in the SAR image to significantly affect the capture of object structural features, thus impacting the object count evaluation. Therefore, the three branches in our design only utilize dilated convolutions with dilation rates ranging from 1 to 3.
Subsequently, based on the characteristics of the input features, the importance weights μ for each scale branch’s output are dynamically computed. This enables the module to maintain the efficiency of the original dilated convolutions while more effectively mitigating the impact of scale variations on feature processing, resulting in a more objected Count-Priming Feature for the number of objects. Finally, spatial aggregation and regression are used to predict the object count K:
P = 1 H × W i = 1 H j = 1 W X m s a ,
K = W f T P + b f ,
where P B × 256 represents the global spatial aggregation feature, and W f 256 denotes the regression weight. After obtaining K through the regression of the Count-Priming Feature, the model generates the corresponding position queries and content queries based on the value of K and inputs them into the deformable decoder. At this stage, each layer of the decoder receives K query vectors and feature-enhanced features (used here as Key and Value) as inputs, establishes the dependency relationship between the queries and the features, and finally, the K queries output by the decoder are fed into the detection head for detection.

4. Results

4.1. Datasets

In this experiment, we evaluate the performance of our algorithm using the SARDet-100K [47] dataset and the FAIR-CSAR [48] dataset. We not only counted the number of objects of various types in both datasets, but also organized the distribution of object counts and object scales within the datasets. This enables a more effective selection of evaluation metrics in the experiment and facilitates a comprehensive assessment of the algorithm’s performance.
The SARDet-100K dataset contains a total of 116,598 images and 245,653 instances distributed across six categories: airplanes, ships, cars, bridges, tanks, and ports. SARDet-100K is the first large-scale SAR object detection dataset, comparable in size to the widely used COCO dataset. Due to its substantial size and diversity, the SARDet-100K dataset serves as a powerful resource for training and evaluating SAR object detection models. Its extensive data has played a pivotal role in advancing the development of SAR object detection algorithms and technologies, facilitating the progress of state-of-the-art models in this field. The quantities of images of different types in the SARDet-100K dataset is shown in Table 1.
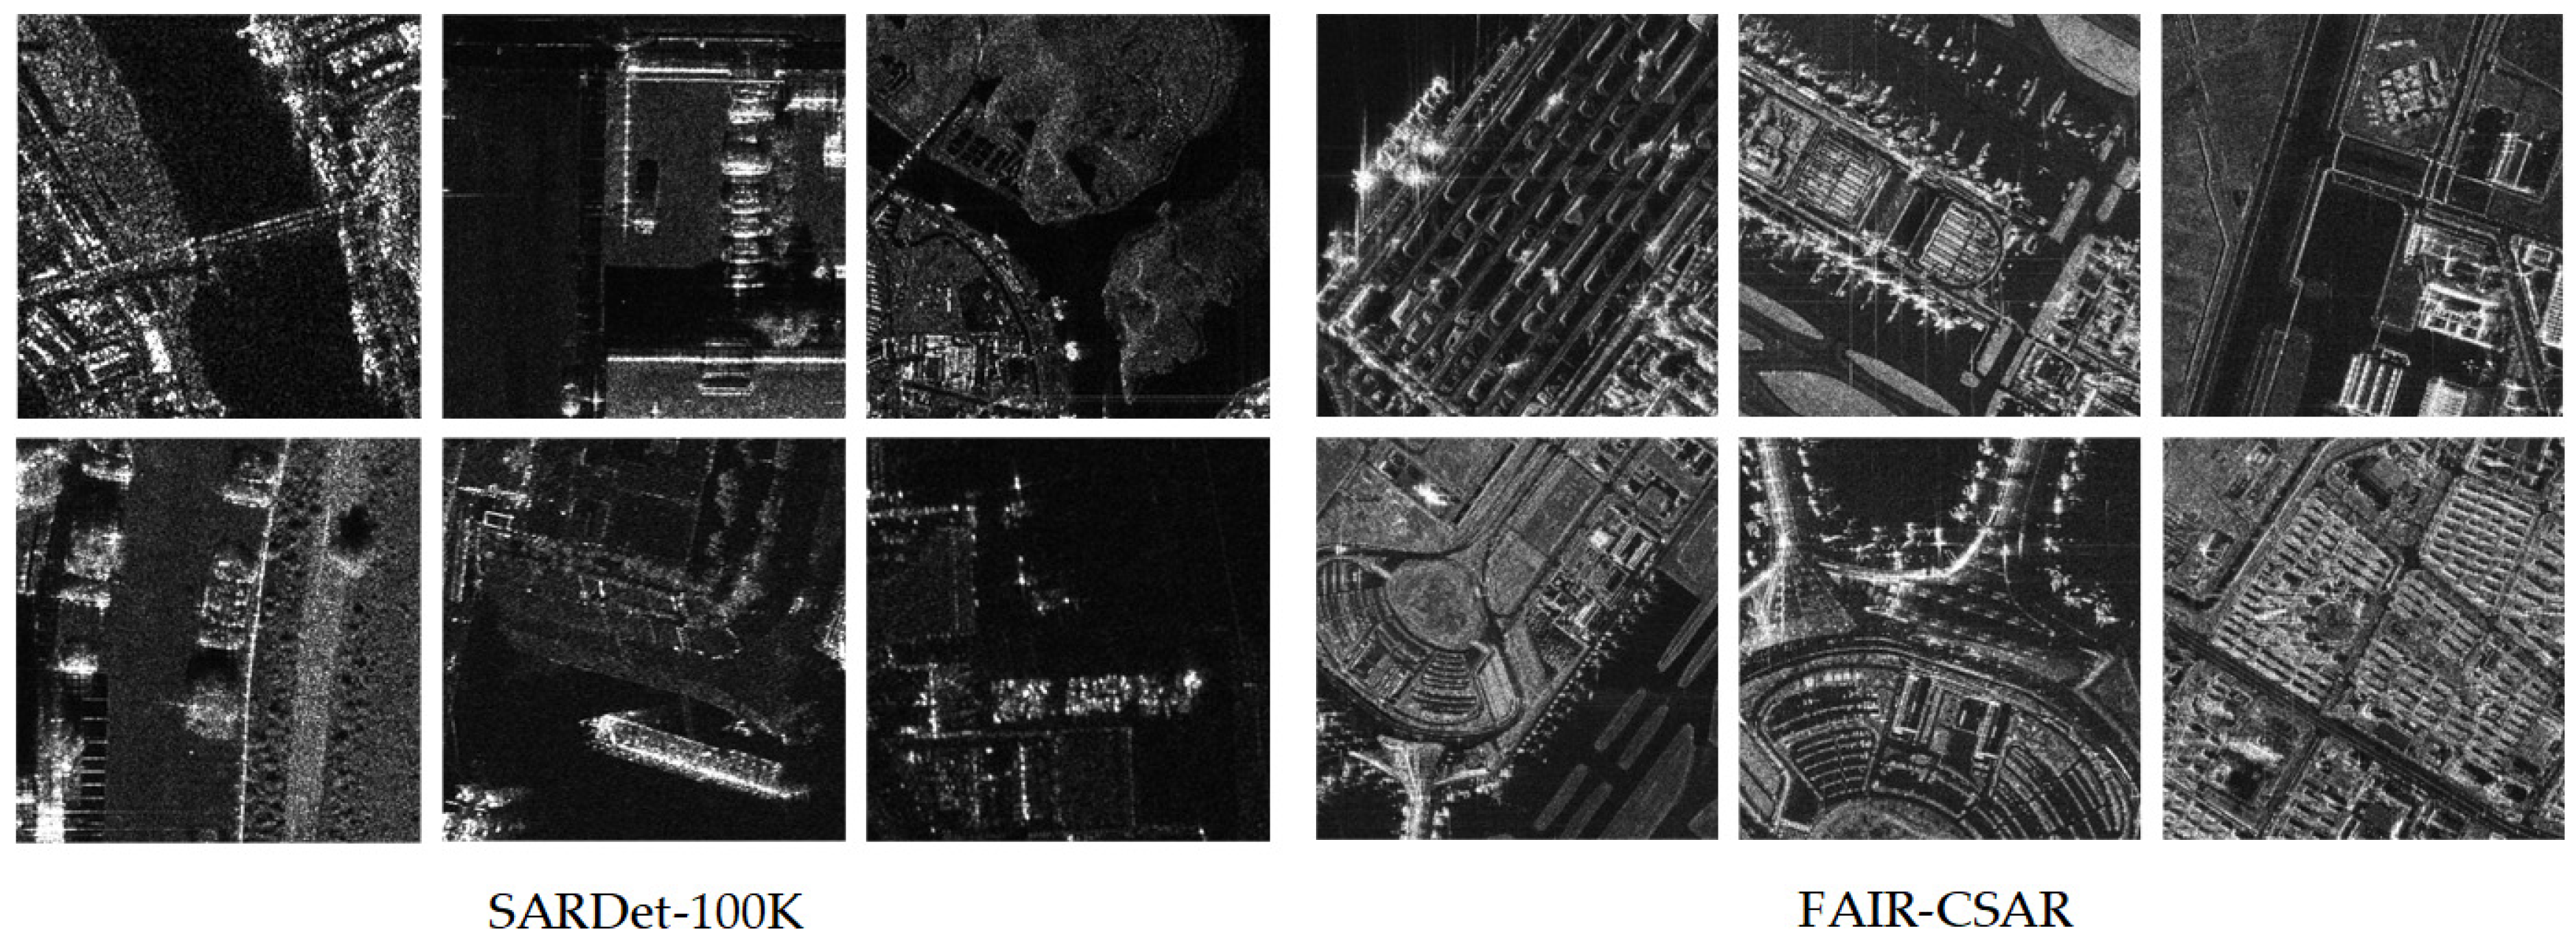
The FAIR-CSAR dataset is constructed based on single-look complex (SLC) imagery products from the Gaofen-3 satellite, offering a fine-grained annotation and rich image information. This dataset includes 14,665 SAR images of size 512 × 512, with 9567 images in the training set, 2706 in the testing set, and 2392 in the validation set, divided into 22 categories. To facilitate model evaluation, we reclassified the 22 categories in the original FAIR-CSAR dataset into 9 categories, totaling 85,285 object instances, with no other modifications made. FAIR-CSAR is designed to drive the development and breakthroughs in core technologies such as SAR image object detection, recognition, and object characteristic understanding. The quantities of images of different types in the FAIR-CSAR dataset is shown in Table 2. Additionally, some images from the SARDet-100K dataset and the FAIR-CSAR dataset are illustrated in Figure 3.
To better evaluate the impact of dataset distributions with different object scales and object counts on the performance of our designed model, we additionally recorded the object box scales and object counts in the SARDet-100K and FAIR-CSAR datasets, and calculated their proportions. These values were used as the basis for selecting model evaluation metrics. The statistical results of our data are presented in Table 3.
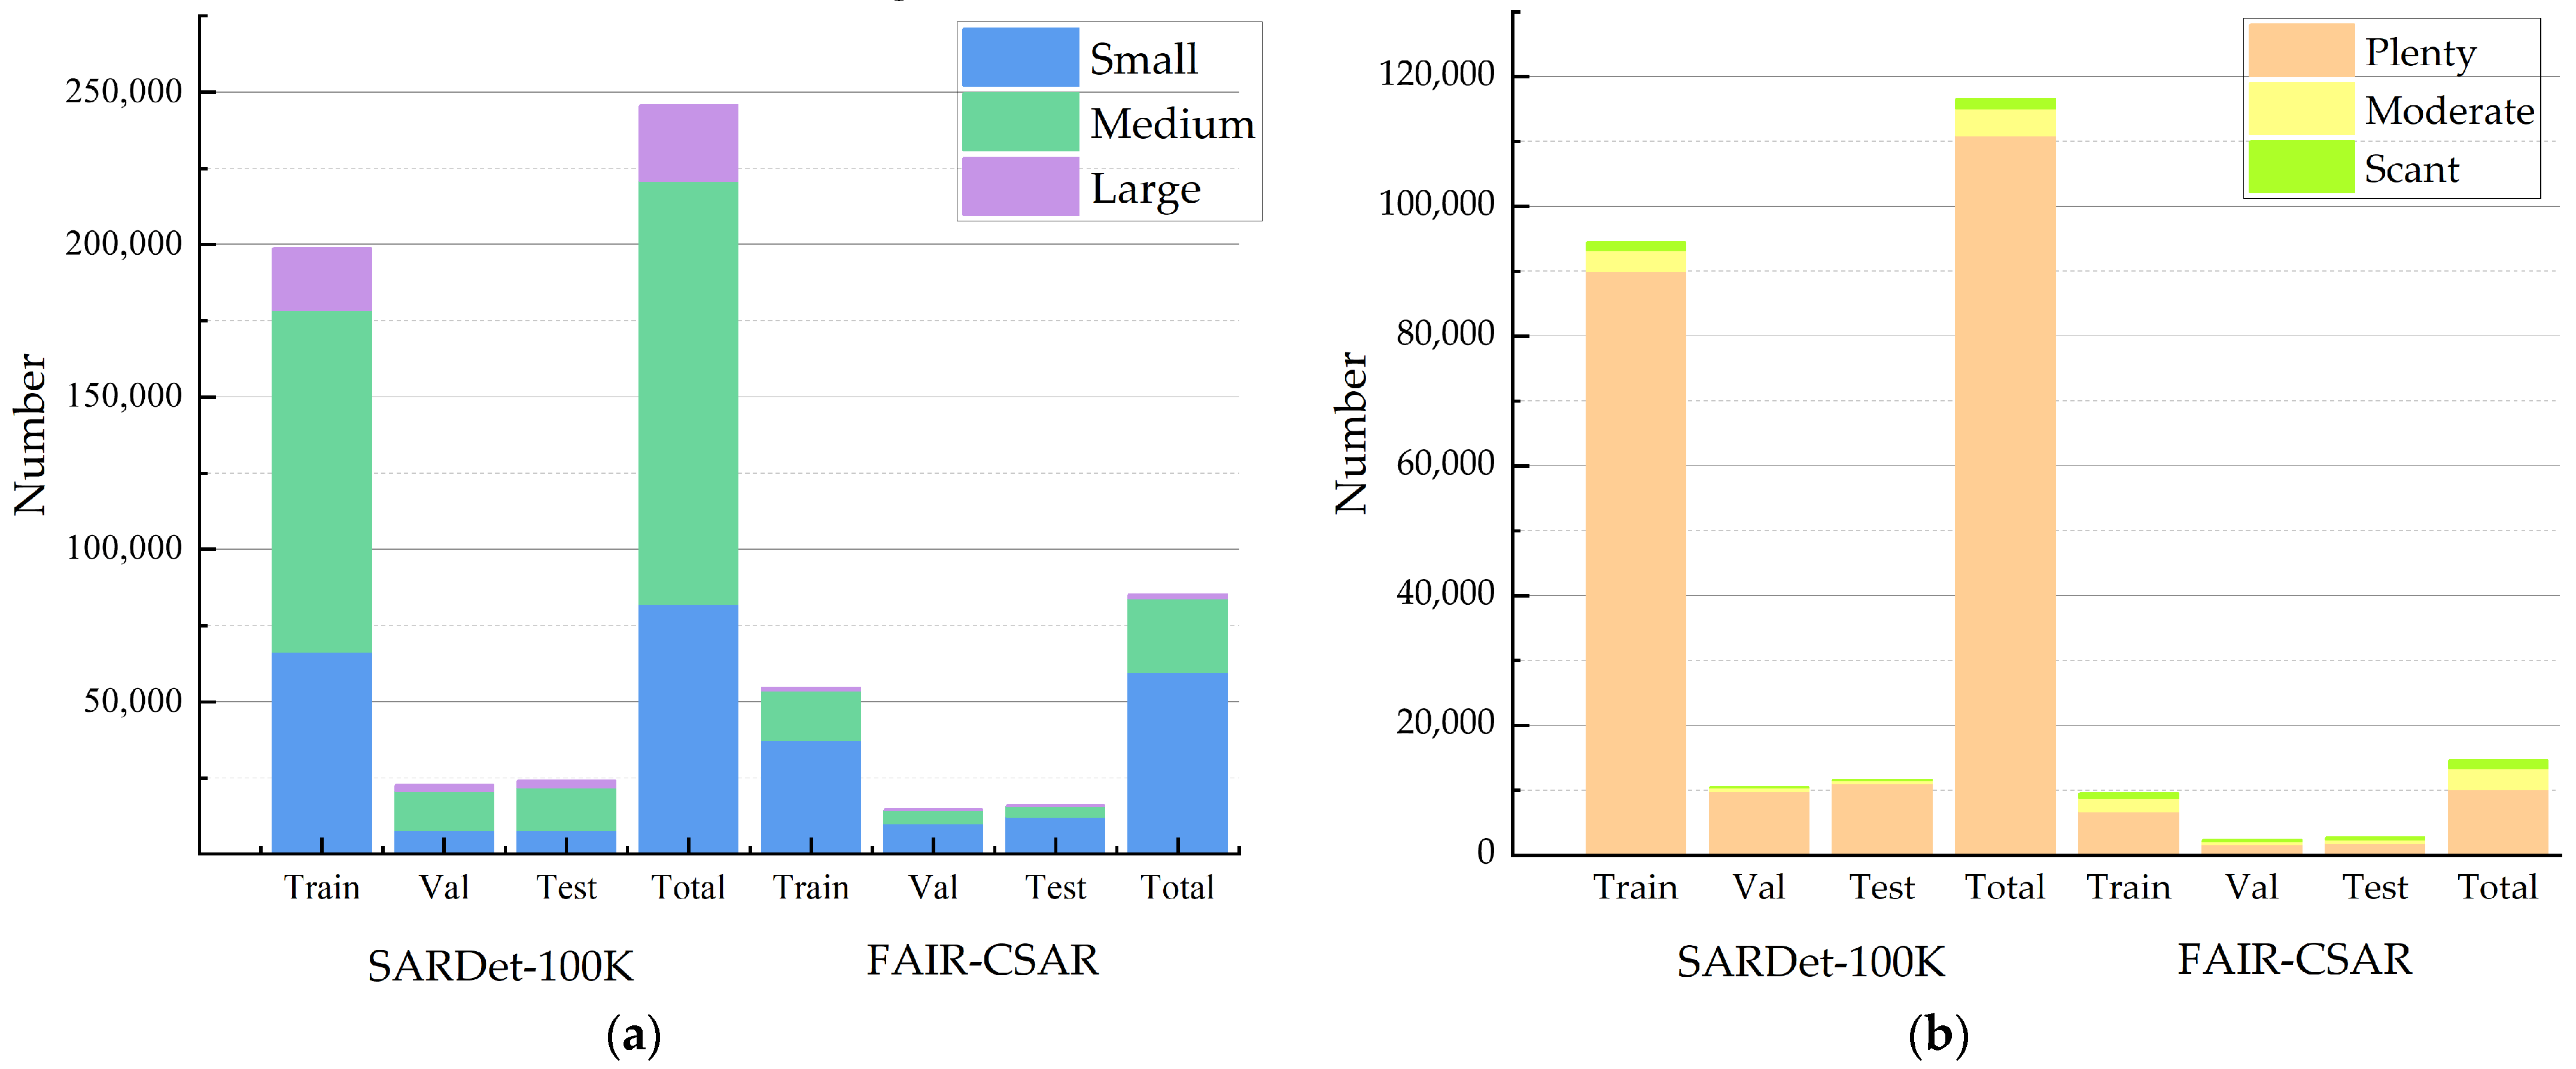
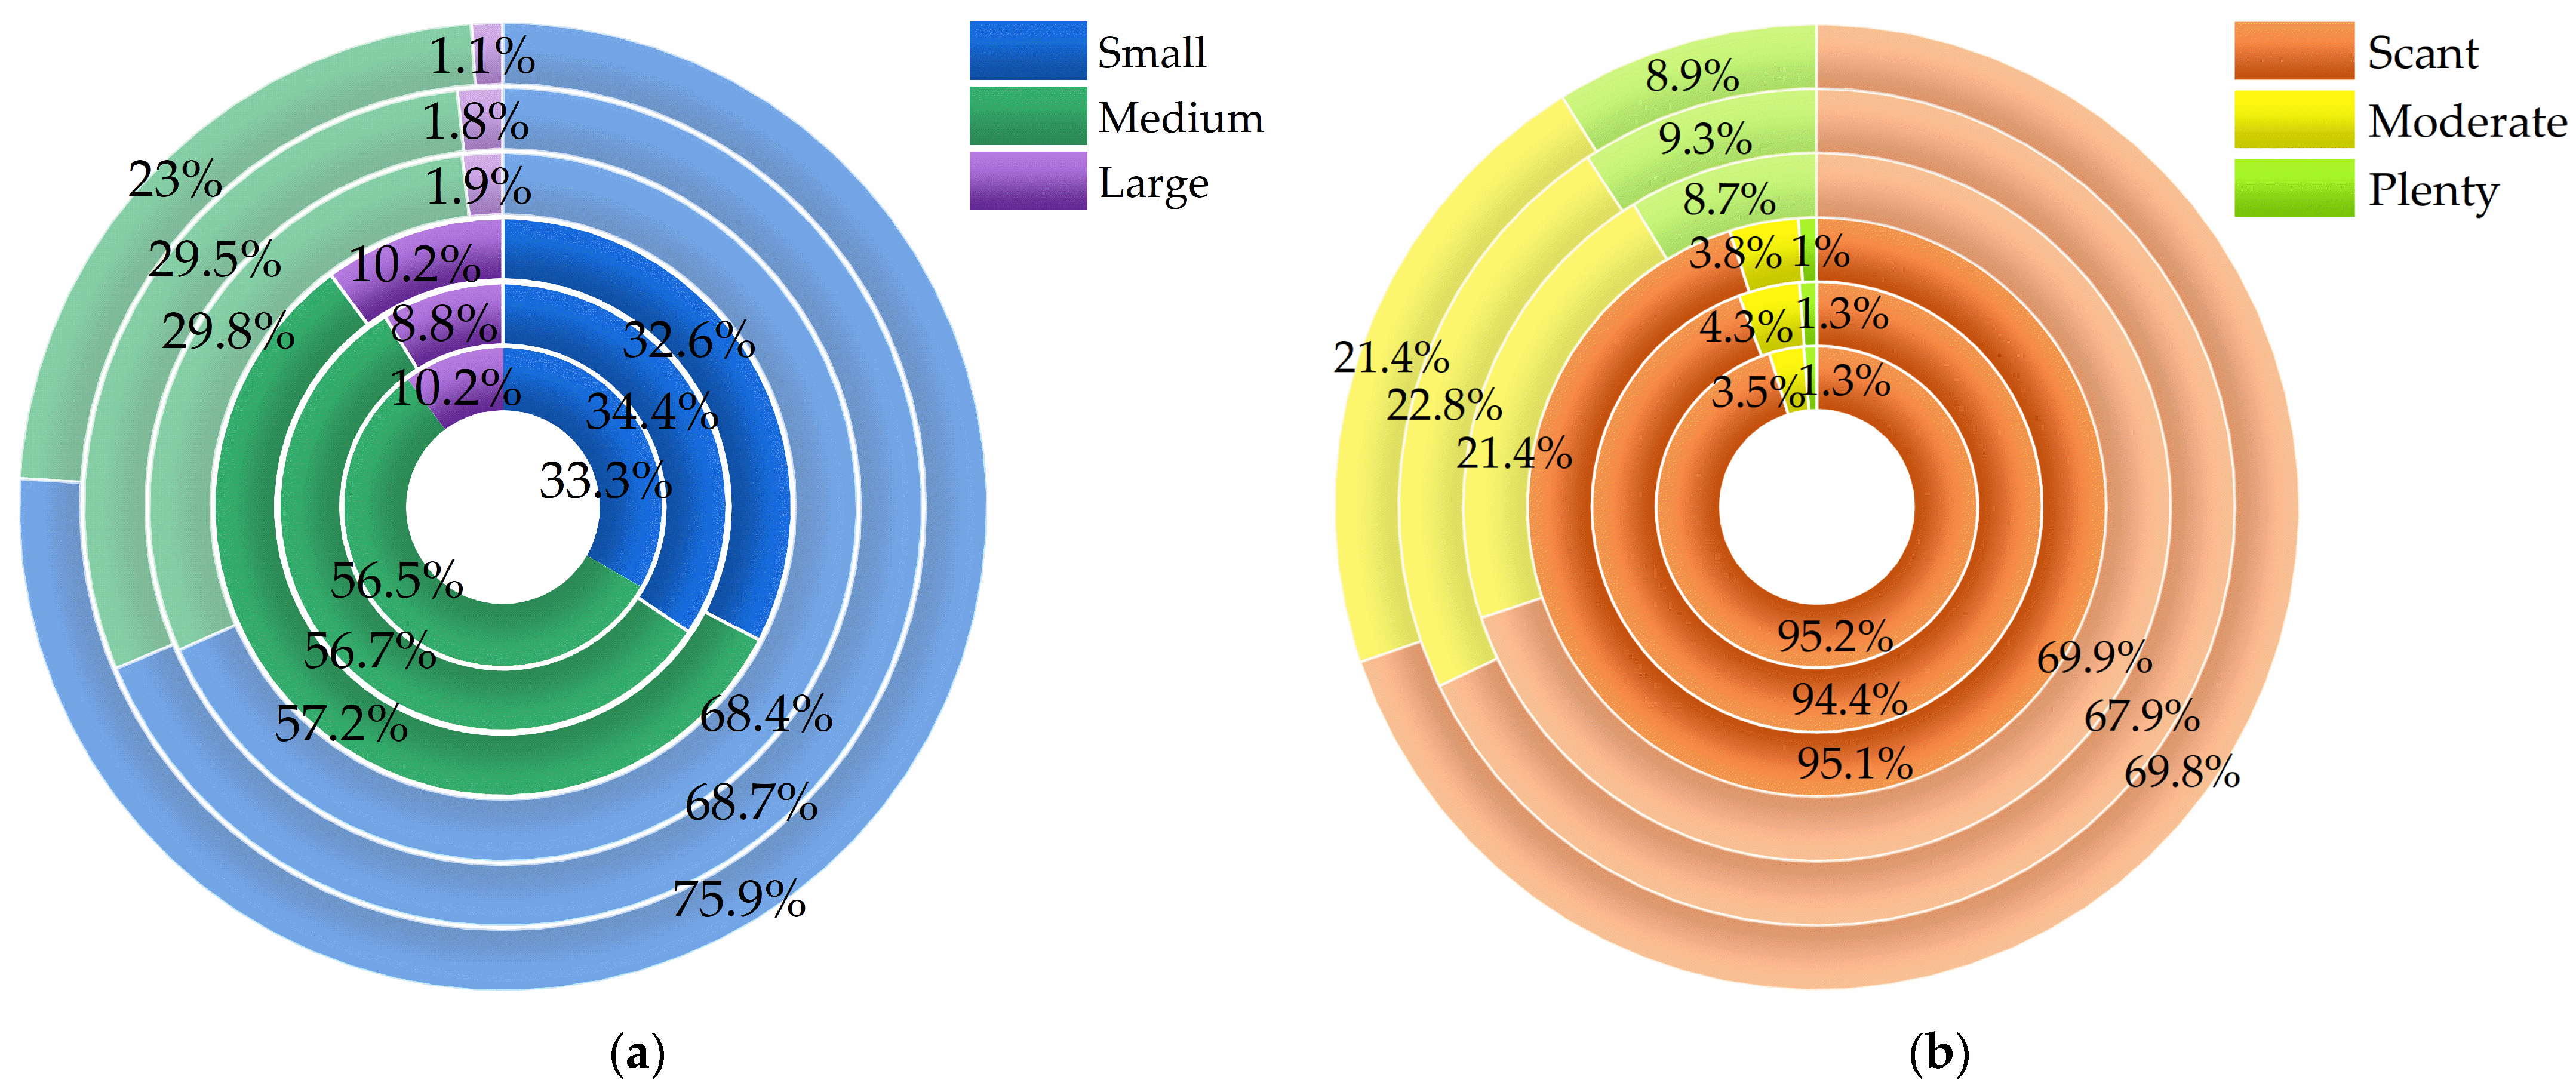
According to the statistical results, the object scale distribution in the SARDet-100K dataset is relatively balanced, with small, medium, and large objects distributed around 33%, 56%, and 10%, respectively, across the Train, Val, and Test sets. In contrast, the object distribution in the FAIR-CSAR dataset shows that small, medium, and large objects account for approximately 68%, 29%, and 2%, respectively. This indicates that the FAIR-CSAR dataset contains fewer large objects, with the majority concentrated on small objects. Based on the object scale distributions of the two datasets, we argue that the SARDet-100K dataset is more suitable for evaluating the impact of scale variations on the model.
Furthermore, based on the object count distribution in each image, the SARDet-100K dataset exhibits an extremely imbalanced distribution, with most images containing only a small quantity of objects, typically around 95%. On the other hand, the FAIR-CSAR dataset has a more uniform object count distribution, with each object count category occupying a certain proportion. In this context, we consider the FAIR-CSAR dataset to be more suitable for evaluating the impact of object count fluctuations on the model. The object scale and object count distributions for the SARDet-100K and FAIR-CSAR datasets are shown in Figure 4 and Figure 5.
In summary, the image data within the SARDet-100K dataset and the FAIR-CSAR dataset reflect common challenges in SAR datasets, such as significant background interference and frequent fluctuations in object number and scale. These datasets cover a range of SAR imaging modes, varying observation resolutions, and different typical application scenarios. Furthermore, the two datasets, respectively, address the data characteristics of most current SAR object detection tasks in terms of scale and diversity, thereby comprehensively evaluating the algorithm’s adaptability to varying data volumes, object types, and interference scenarios. Therefore, we believe that the SARDet-100K dataset and the FAIR-CSAR dataset are sufficiently representative and capable of supporting a general evaluation of the algorithm’s performance.

4.2. Implementation Details

In this experiment, we evaluate the algorithm’s performance using the SARDet-100K dataset and the FAIR-CSAR dataset. For the SARDet-100K dataset, both our method and the comparison methods were trained for 7 epochs. Considering the differences in data volume, data scale, and density distribution between the two datasets, we trained our algorithm for 50 epochs on the FAIR-CSAR dataset, while the comparison algorithms were trained for 300 epochs. This discrepancy arises from our observation that the detection performance of our algorithm after 50 epochs is comparable to that of the comparison algorithms after 300 epochs. The image resolution was set to 640 × 640. Our algorithm is based on the Deformable DETR architecture, thus referring to its training settings, utilizing 5 layers of Deformable Encoder and Deformable Decoder, with ResNet50 as the backbone for feature extraction and the number of object queries set to 300. Given that we compute queries through regression, the queries evolve with the input features as the model trains. We used the Adam optimizer to train our model, with a learning rate of 1e-4 and a batch size of 4. All calculations were performed on a workstation equipped with an 80GB VRAM NVIDIA A100 Tensor Core GPU, an AMD Threadripper PRO 5995WX 64-core processor, and 128GB of RAM.

4.3. Experiment Results

To better evaluate the performance of our algorithm under the effects of object quantity variation and object scale variation, we use different detection performance evaluation metrics for the two datasets. These metrics primarily include mAP@50, mAP@75, mAP@50-95, mAP_l, mAP_m, mAP_s, Params (M), and FPS.
Mean Average Precision (mAP) serves as the primary benchmark for performance assessment, and it can be further categorized into various metrics such as mAP50, mAP75 and mAP, based on the specific Intersection over Union (IoU) thresholds applied. In this context, the metrics mAP50 and mAP are particularly emphasized as the key indicators for evaluation in the experiment.
To evaluate detection robustness across varying object sizes, we categorize objects based on bounding-box area: Large objects (>96 × 96 pixels2), Medium objects (32 × 32∼96 × 96 pixels2) and Small objects (<32 × 32 pixels2) We report the corresponding detection accuracies as mAPl, mAPm and mAPs.
Param.s (M) represents the total number of parameters in millions, which is closely related to the model size, memory usage, and computational complexity. Fewer parameters are more advantageous for deployment on resource-constrained devices. FPS refers to the number of images processed per second, reflecting the inference speed. A higher FPS makes the model more suitable for real-time applications.
We first conduct experimental evaluation on the SARDet-100K dataset. Due to its rich multi-scale objects, the SARDet-100K dataset provides significant value in evaluating detection performance under object scale variation. Therefore, we use mAP@50, mAP@75, mAP@50-95, along with mAP_l, mAP_m, and mAP_s, to assess detection performance. In our experiments on the SARDet-100K dataset, we compare our approach with several SOTA algorithms, including GFL [60], FCOS [61], RetinaNet [62], Cascade R-CNN [63], Grid R-CNN [64], Faster R-CNN, DETR, Deformable DETR, and Dab-DETR. To ensure the fairness of algorithm performance evaluation, the parameters used by the comparison algorithms in the experiments are consistent with those of the proposed algorithm, and all algorithms are trained and inferred on the same hardware platform. The experimental results on the SARDet-100K dataset are shown in Table 4.
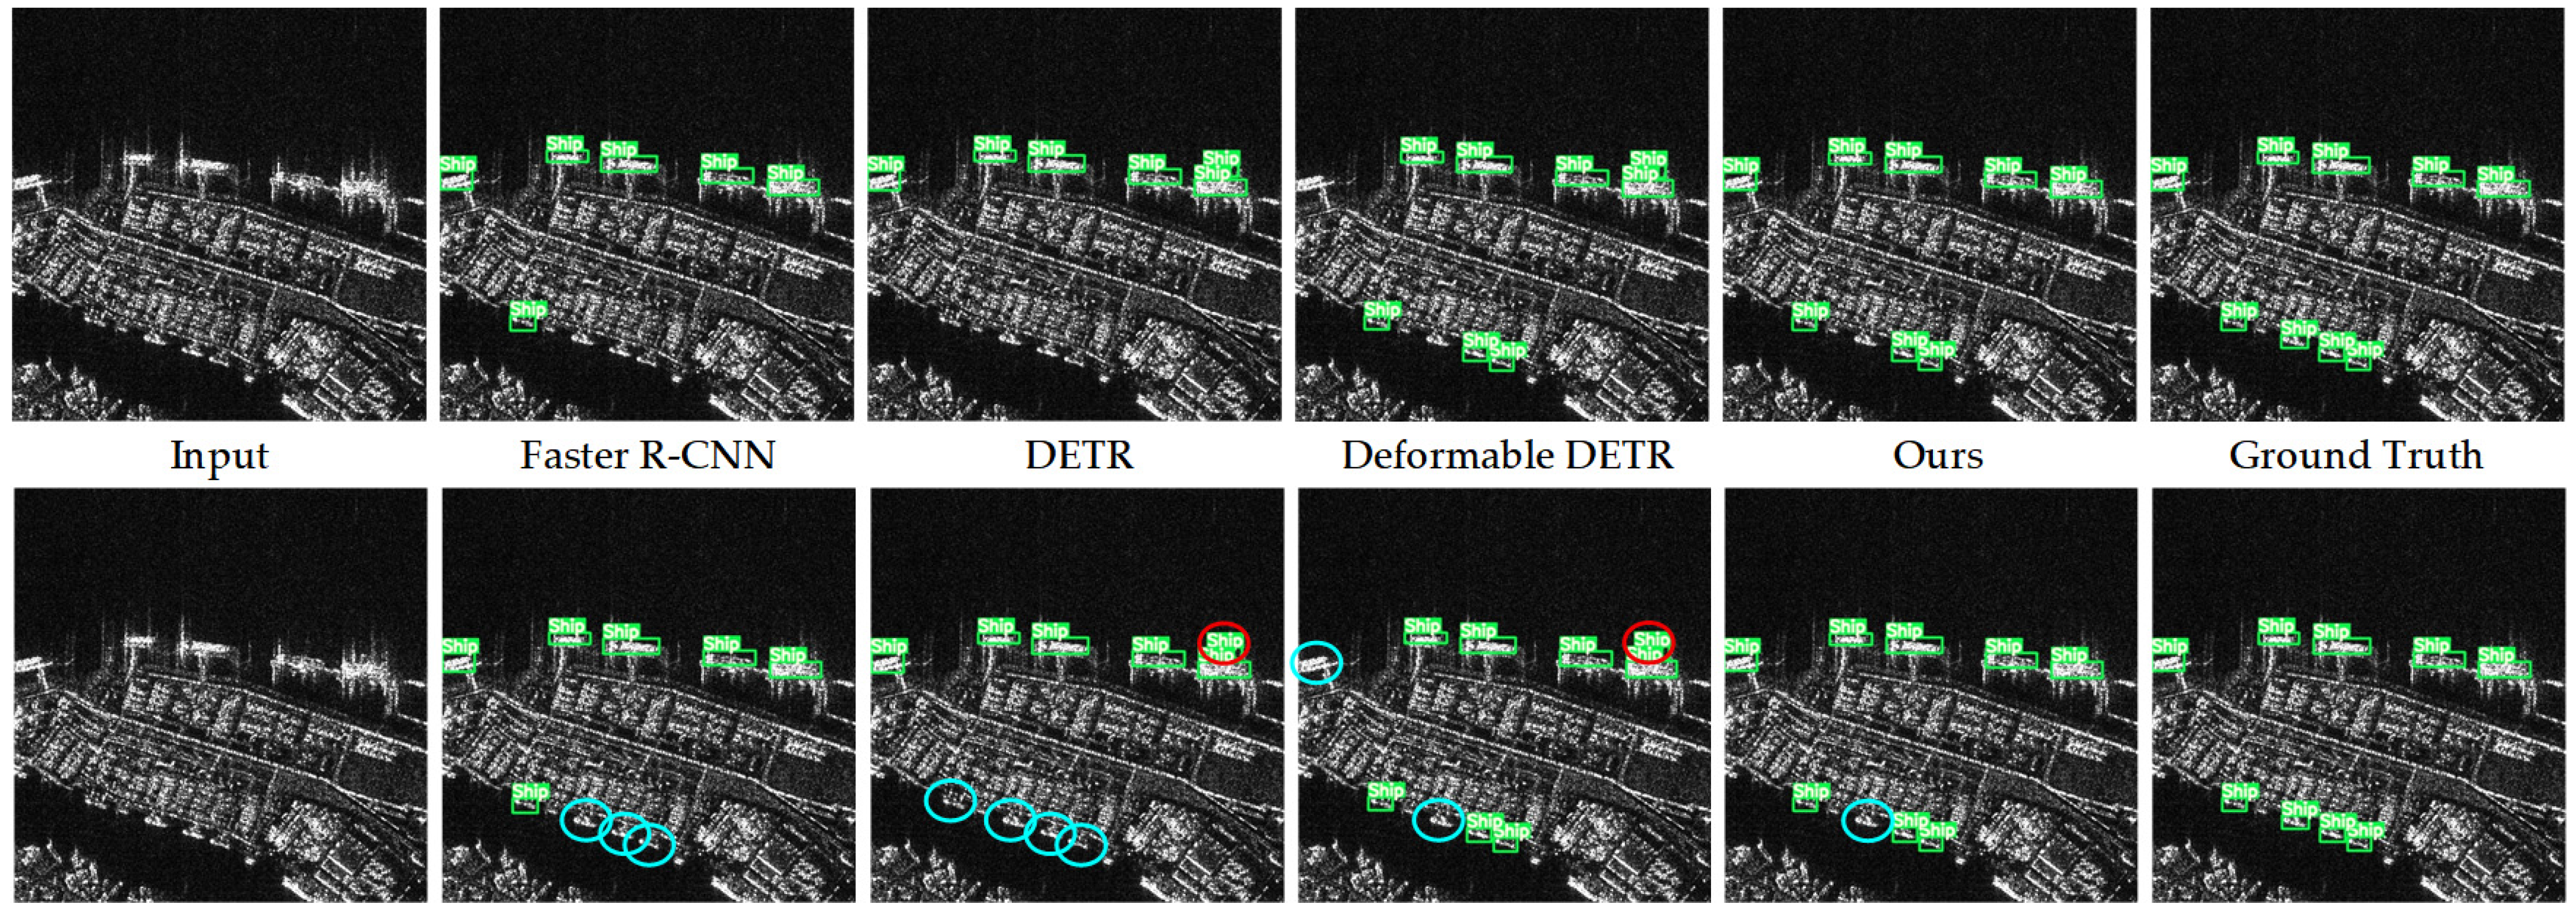
According to the experimental results, our algorithm achieves outstanding performance on the SARDet-100K dataset. Compared to the second-best results, our algorithm improves by 3.2%, 4.8%, and 2.7% in the mAP@50, mAP@75, and mAP@50-95 evaluation metrics, respectively, demonstrating its effectiveness in SAR object detection. Additionally, our algorithm shows improvements of −1.1%, 4.4%, and 3.6% in the mAP_l, mAP_m, and mAP_s metrics, respectively. This indicates that our algorithm can more effectively adapt to object scale variations and significantly enhance the model’s detection performance when faced with changes in object scale. The detection results of Faster R-CNN, DETR, Deformable DETR, and our method on the SARDet-100K dataset are compared, as shown in Figure 6.
Next, we conduct experimental evaluation on the FAIR-CSAR dataset. The FAIR-CSAR dataset features higher image resolution, with rich and detailed annotation information. Compared to the SARDet-100K dataset, it has a more uniform distribution of object quantities. This provides advantages for real-time testing of object detection algorithms and testing the algorithm’s adaptability to variations in object quantity. Therefore, we use mAP@50, mAP@50-95, Params (M), and FPS for algorithm performance evaluation. In our experiments on the FAIR-CSAR dataset, we compare our approach with several SOTA algorithms, including Faster R-CNN, Cascade R-CNN, FoveaBox [65], FCOS, RetinaNet, RepPoints [66] and Deformable-DETR. To ensure the fairness of algorithm performance evaluation, the parameters used by the comparison algorithms in the experiments are consistent with those of the proposed algorithm, and all algorithms are trained and inferred on the same hardware platform. The experimental results on the FAIR-CSAR dataset are shown in Table 5.
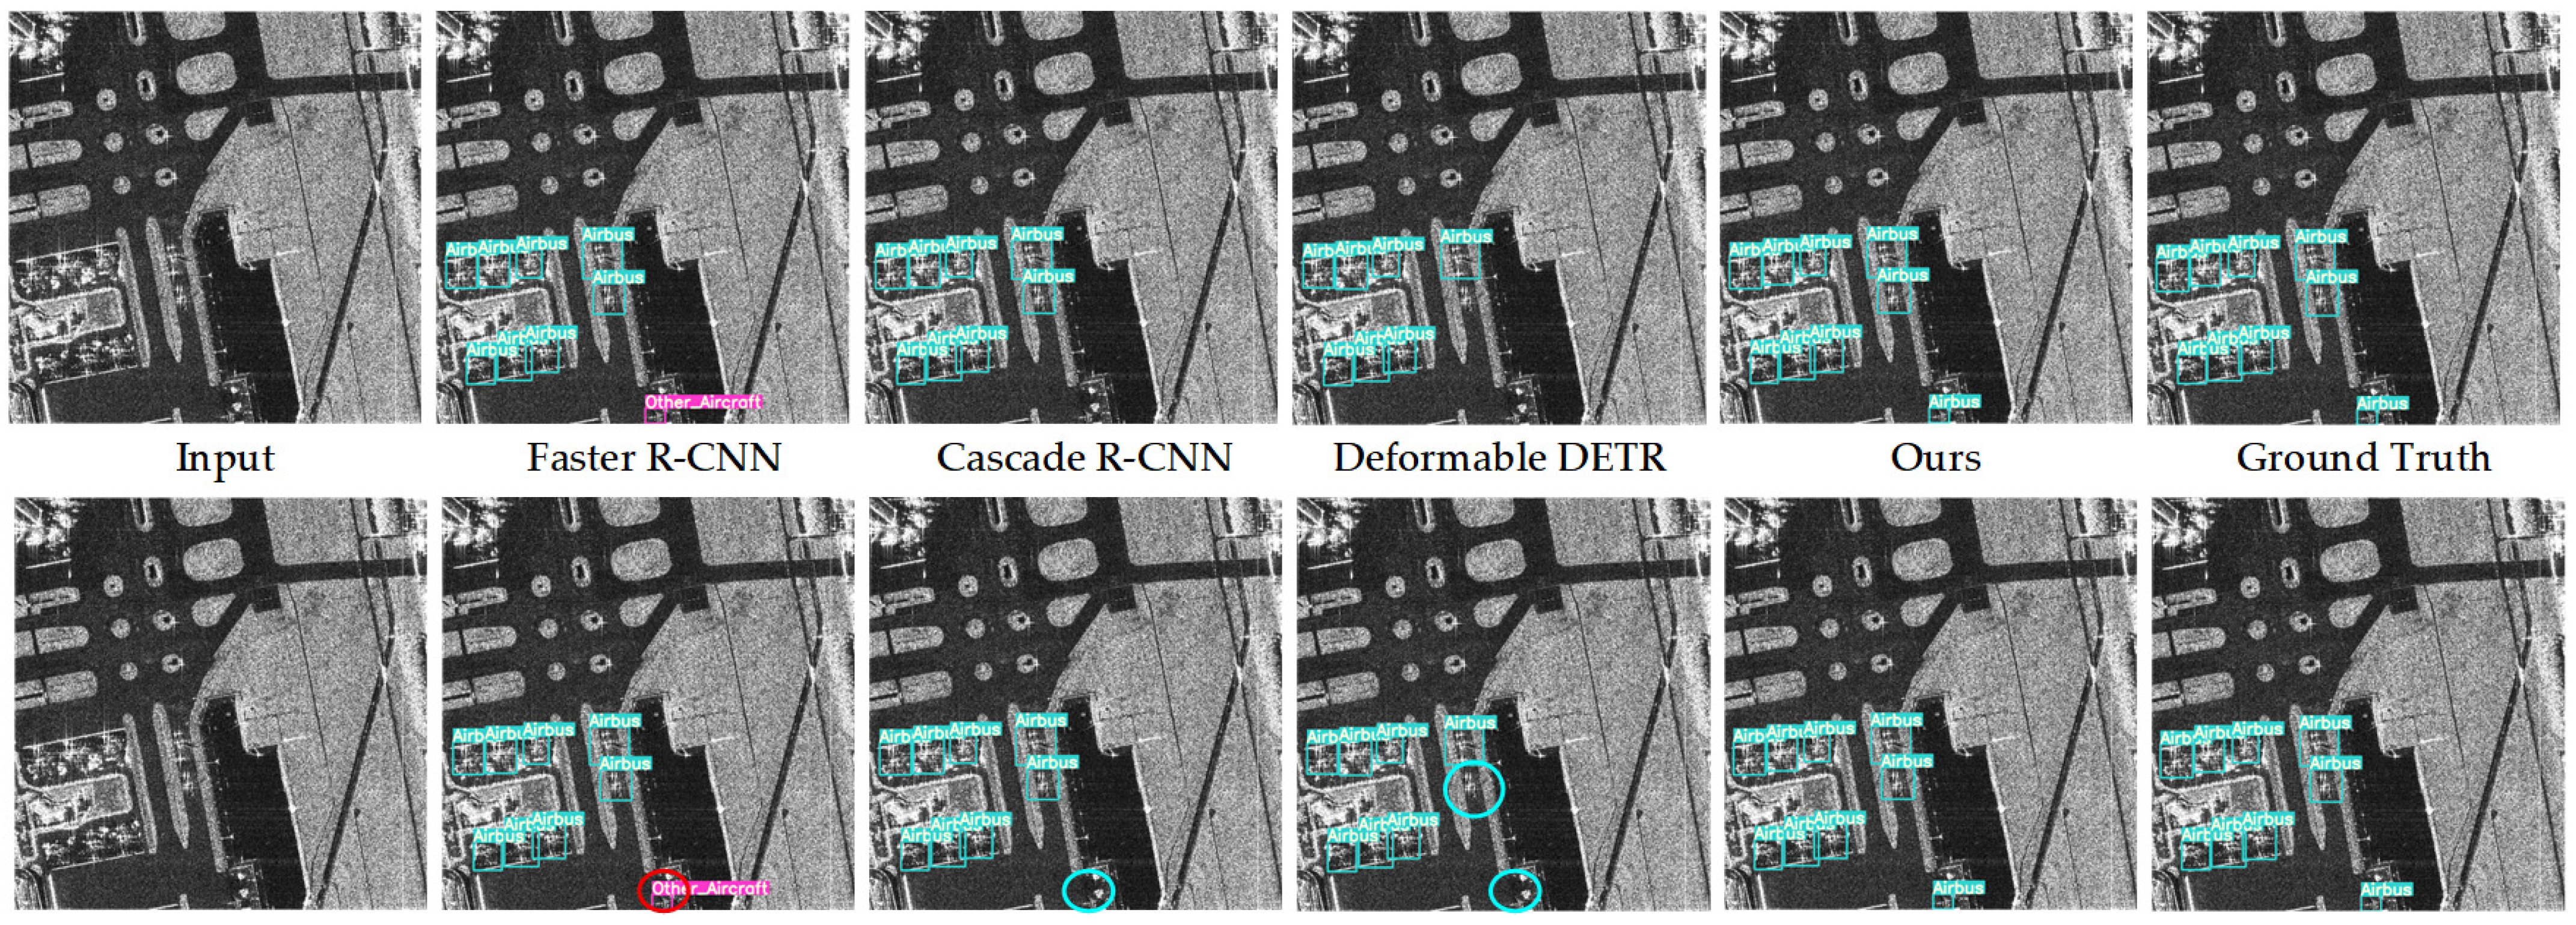
According to the experimental results, our algorithm achieves relatively outstanding performance on the FAIR-CSAR dataset. It attains the best value in mAP@50, outperforming the second-best result by a 3.5% improvement in performance. Although our algorithm ranks second in the mAP@50-95 evaluation metric, it requires fewer parameters compared to the optimal solution, leading to lower computational costs when deployed on airborne platforms. Furthermore, we conducted training on the FAIR-CSAR dataset for only 50 epochs, while other state-of-the-art algorithms were trained for 300 epochs. Our method achieves superior results with fewer training epochs, demonstrating its excellent performance in real-time applications. The detection results of Faster R-CNN, Cascade R-CNN, Deformable DETR, and our method on the FAIR-CSAR dataset are compared, as shown in Figure 7.

4.4. Ablation Experiment

To verify the effectiveness of our algorithm structure and module components in SAR detection, we conduct ablation experiments on the Corner-Guided Multi-Scale Feature Enhancement Module and the Adaptive Query Regression Module.
These experiments are performed on the FAIR-CSAR dataset, with a training duration of 6 epochs and an image resolution set to 640 × 640. We use mAP@50, mAP@75, mAP@50-95, mAP_l, mAP_m, and mAP_s as evaluation metrics to comprehensively assess the SAR object detection performance and effectiveness of our modules. The results of our ablation experiments are shown in Table 6.
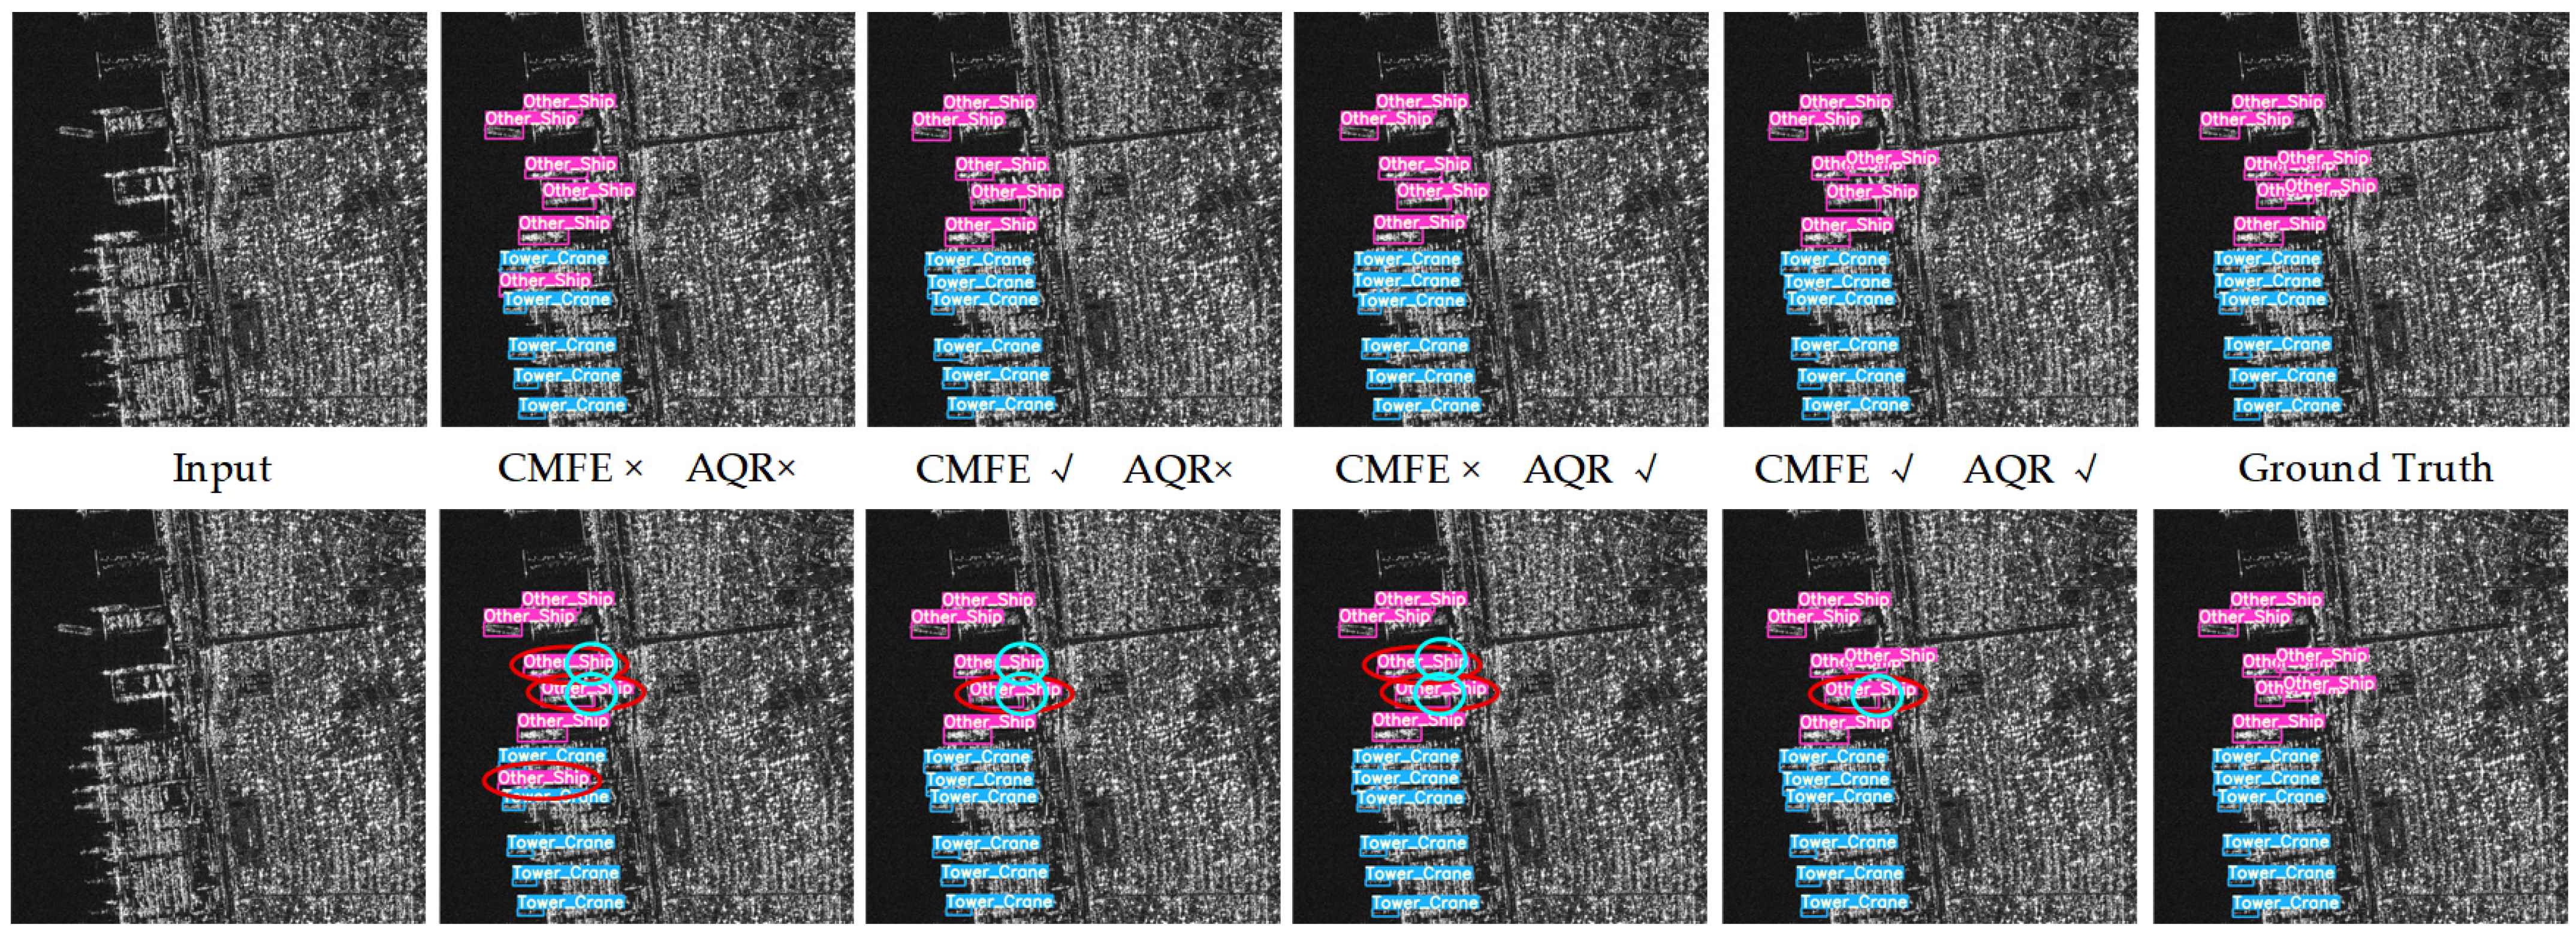
Based on the experimental results, when using only the CMFE module, we observed improvements of 1.8%, 1.6%, and 1.2% in mAP@50, mAP@75, and mAP@50-95, respectively, and increases of 2.7%, 1.1%, and 3.4% in mAP_l, mAP_m, and mAP_s, respectively. When using only the AQR module, improvements of 1.1%, 1.7%, and 0.9% were achieved in mAP@50, mAP@75, and mAP@50-95, respectively, along with increases of 1.4%, 0.8%, and 2.4% in mAP_l, mAP_m, and mAP_s, respectively. When both modules were utilized together, we achieved improvements of 3.7%, 5.9%, and 3.5% in mAP@50, mAP@75, and mAP@50-95, respectively, and increases of 2.5%, 3.9%, and 3.7% in mAP_l, mAP_m, and mAP_s, respectively. The detection results of the ablation experiments are shown in Figure 8.
We observed that the CMFE module enhanced the model’s adaptability to variations in different scales, leading to a greater improvement in detection performance across scales compared to the AQR module. Although the AQR module did not effectively enhance detection performance at varying scales, it still contributed to the overall improvement of the model’s SAR object detection capabilities. Moreover, when used in conjunction with the CMFE module, it significantly boosted the model’s performance. Based on these findings, we conclude that our modules collectively enhance the model’s detection performance in SAR object detection.

5. Discussion

By comparing the experimental results and ablation studies, we demonstrate that our innovation enhances the model’s adaptability to variations in object quantity and scale in SAR detection, thus improving its detection performance. Although our innovation results in an increase in the number of parameters and a decrease in real-time processing, our method outperforms the comparison algorithm, achieving superior object detection performance after 50 training epochs, even surpassing the performance of the comparison algorithm after 300 training epochs. This indicates that our algorithm converges more rapidly, significantly reducing the time cost of model development and lowering the threshold for deployment to edge platforms. Moreover, when the CMFE and AQR modules are used together, their combined performance advantage exceeds the sum of their individual performances. This suggests that the model achieves greater potential when it simultaneously adapts to object quantity and scale.
While the CMFE and AQR modules proposed in this study effectively enhance the performance of SAR object detection, both modules were designed to address the discrete characteristics inherent in SAR images. This design proves effective when applied to image data with similar characteristics. However, when our method is applied to data that do not possess such discrete characteristics, such as visible light images, its performance requires further discussion.
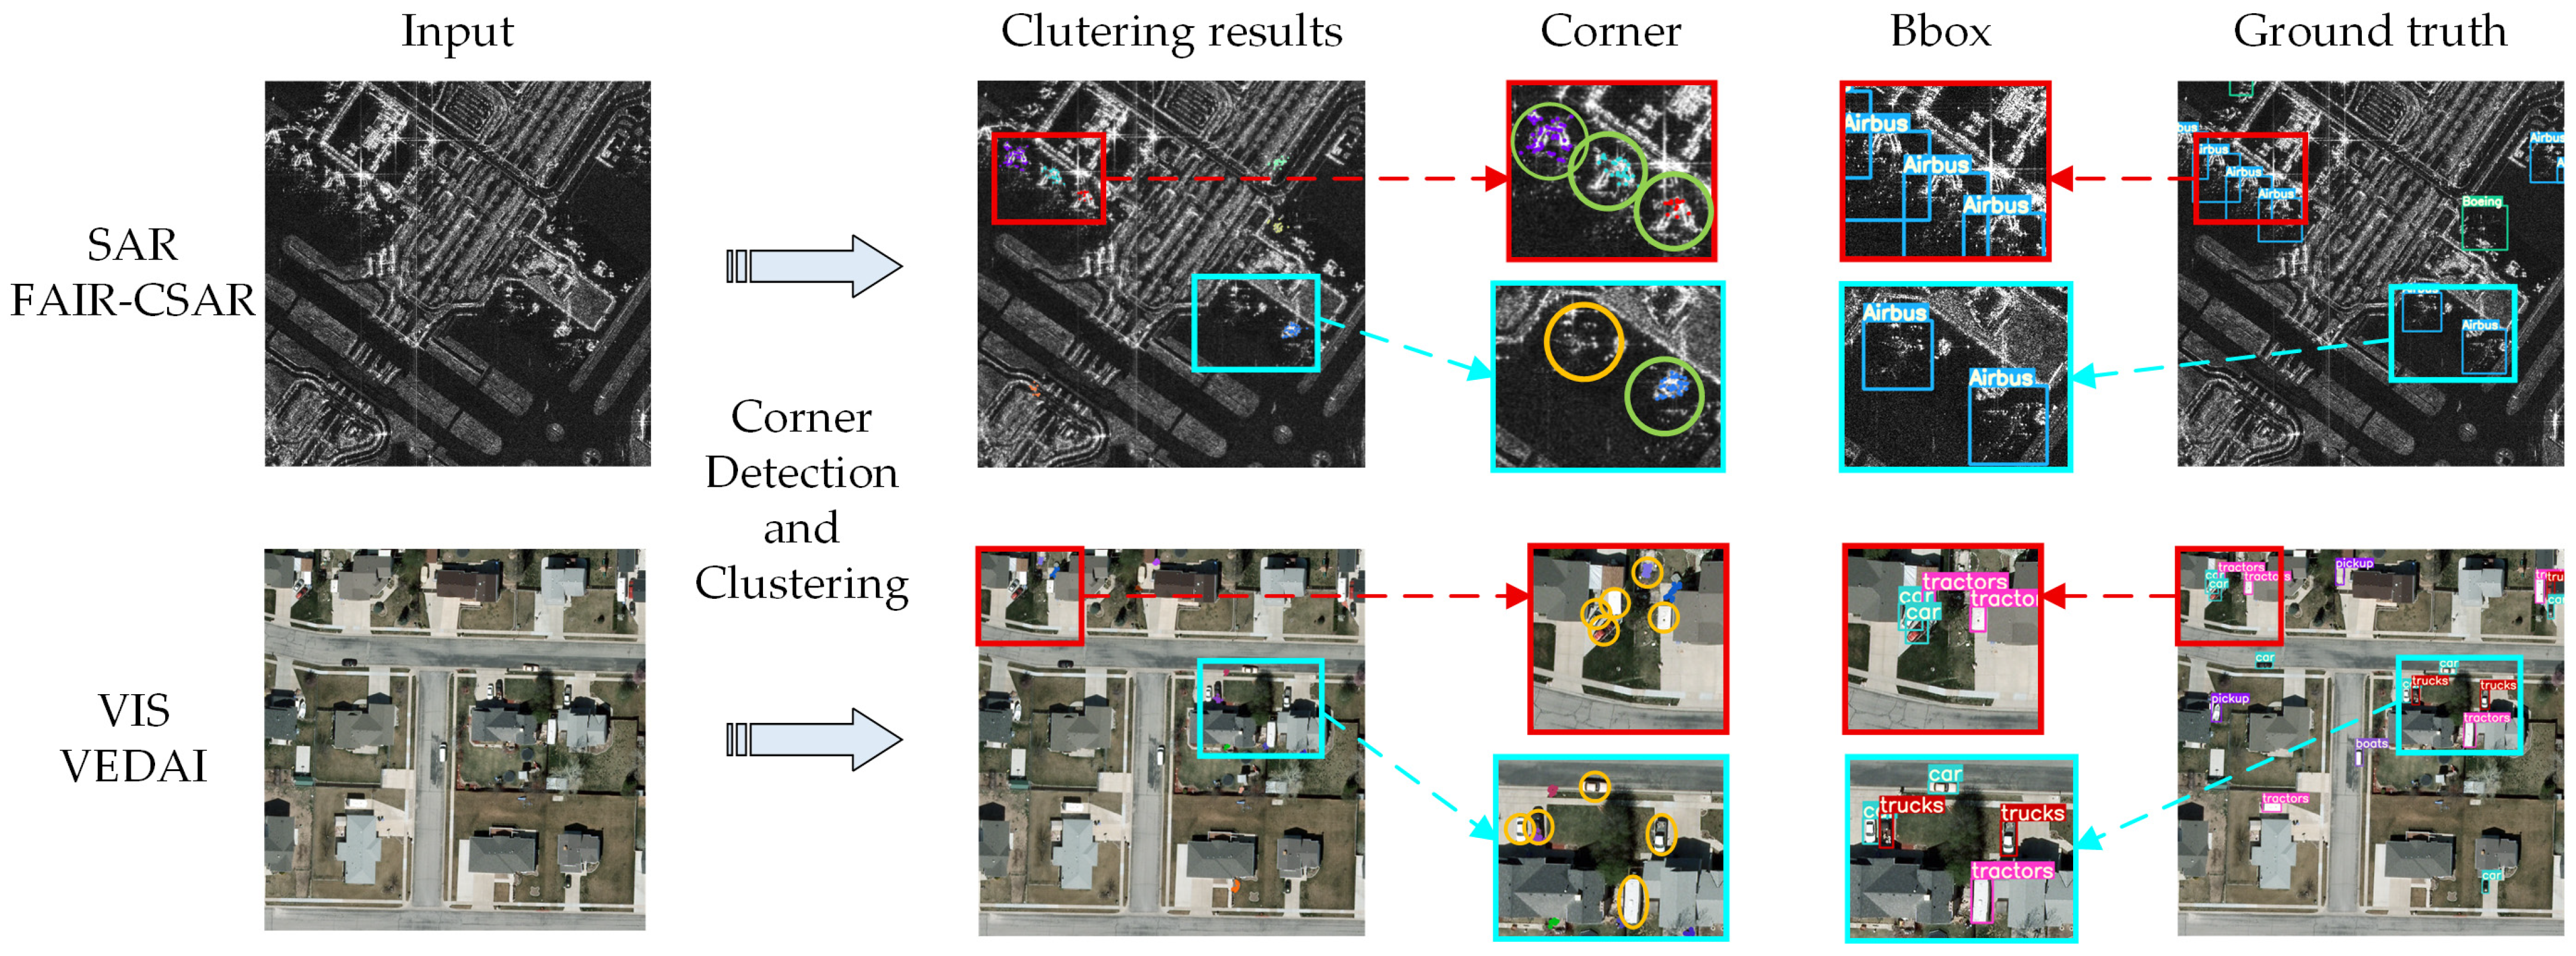
To address this, we performed corner detection and clustering on images from the FAIR-CSAR and VEDAI [67] datasets, and compared the clustering results with the ground truth. The experimental results are shown in Figure 9. As observed from the results, corner detection and clustering methods can effectively extract the number and scale distribution of objects in SAR images. However, when applied to visible light images, the clustering performance is relatively poor, making it challenging to accurately assess the number and scale of objects. At this point, CMFE struggles to effectively extract the importance weights of multi-scale features, making it difficult for the model to enhance multi-scale features efficiently. Meanwhile, AQR, by providing a rough estimate of the number of objects based on low-level features, cannot guarantee its effectiveness in this context.
Based on these findings, we believe that the design of modules targeting discrete characteristics limits the general applicability of our approach, restricting it from achieving the same high versatility as models such as DETR and Deformable DETR. To enhance the model’s generalization capabilities, a more universal method must replace the design tailored to discrete characteristics. However, this would compromise the performance of our model in SAR object detection. Therefore, we currently continue to use modules based on the discrete characteristics design for effective SAR object detection.
Additionally, the AQR module, by regressing the object query count, enables the model to adapt effectively to scenarios with frequent fluctuations in object quantity but limited range. Yet, when dealing with datasets where the object quantity range is more extensive, regression-based calculations lead to high instability in the accuracy of object query count. In such cases, the model decoder struggles to establish a stable query-feature matching pattern, leading to confusion in the Hungarian matching bipartite graph optimization, causing oscillations in model loss and making convergence difficult. This limitation restricts the generalizability of the AQR module for object query adaptation.

6. Conclusions

In this paper, we propose the CGAQ-DETR to address the challenges posed by the discrete characteristics of SAR images and the dynamic variations in object scale and quantity in SAR object detection. We designed the CMFE, which leverages the discrete scattering characteristics of SAR images. By employing a multi-scale SAR corner detection method, the CMFE effectively detects corners and utilizes DBSCAN clustering to efficiently group multi-scale corners of objects. This process provides a rough estimation of the object structure and quantity. Finally, by combining ground truth, we compute importance weights at different levels to enhance multi-scale features, thereby improving the model’s ability to effectively select relevant features across various scales. Additionally, we introduced the AQR, which processes the lowest-level features within multi-scale features using amplitude-aware convolutions and multi-scale adaptive dilated convolutions. The AQR then regresses to generate a dynamic query number K, enabling the model to handle datasets with frequent fluctuations in object quantity more efficiently.
Both modules are optimized end-to-end through the integration of ground truth and loss functions. Our proposed CGAQ-DETR method achieves superior detection accuracy over existing methods on both the SARDet-100K and FAIR-CSAR datasets.
Although our method achieves outstanding performance in object detection, it is specifically designed for images with discrete characteristics, such as SAR images. When applied to images from other domains, such as visible light or infrared images, the performance of the module may degrade due to the absence of discrete characteristics in these images. Therefore, compared to the high versatility of DETR and Deformable DETR, our method may face significant challenges in extending to applications in other fields. Based on this, the design of a more generalizable object quantity and scale extractor holds substantial value, as it would allow our module to be further extended to object detection in other domains, thereby offering new insights for more efficient and highly versatile object detection.
At the same time, when we apply the algorithm to edge platforms for field experiments, it allows the model to perform effectively even in complex environments, minimizing interference caused by these environments. This requires careful design prior to the deployment of the algorithm.
Furthermore, in the field of non-spatial geometric imaging, although our approach provides certain value, further in-depth research is still needed. For example, high-frequency surface wave radars (HFSWRs) have demonstrated significant value due to their ultra-long-range, high-resolution object detection capabilities [68]. Given that both HFSWRs and SAR use active microwave remote sensing technology to acquire data [69], our innovation extends to high-frequency surface wave radar object detection, providing a solid foundation for new approaches in the data processing of HFSWRs.

Author Contributions

Conceptualization, S.H. and J.W.; Methodology, Z.Z., Z.C., S.H., J.W. and Z.W.; Software, Z.C. and Z.W.; Validation, Z.Z. and Z.W.; Investigation, Z.C. and S.H.; Resources, Z.Z. and S.H.; Writing—original draft, Z.C. and J.W.; Writing—review & editing, Z.Z. and S.H.; Visualization, Z.C.; Supervision, Z.Z.; Funding acquisition, Z.Z. All authors have read and agreed to the published version of the manuscript.

Funding

This research was funded by the National Natural Science Foundation of China under Grant No. 62201598.

Data Availability Statement

Data available on request from the authors. The data that support the findings of this study are available from the corresponding author, Siyang Huang, upon reasonable request.

Conflicts of Interest

The authors declare no conflict of interest.

References

  1. Moreira, A.; Prats-Iraola, P.; Younis, M.; Krieger, G.; Hajnsek, I.; Papathanassiou, K.P. A tutorial on synthetic aperture radar. IEEE Geosci. Remote Sens. Mag. 2013, 1, 6–43. [Google Scholar] [CrossRef]
  2. Xu, G.; Gao, Y.; Li, J.; Xing, M. InSAR phase denoising: A review of current technologies and future directions. IEEE Geosci. Remote Sens. Mag. 2020, 8, 64–82. [Google Scholar] [CrossRef]
  3. Chen, J.; Xing, M.; Yu, H.; Liang, B.; Peng, J.; Sun, G.-C. Motion compensation/autofocus in airborne synthetic aperture radar: A review. IEEE Geosci. Remote Sens. Mag. 2022, 10, 185–206. [Google Scholar] [CrossRef]
  4. Li, C.; Yue, C.; Li, H.; Wang, Z. Context-aware SAR image ship detection and recognition network. Front. Neurorobotics 2024, 18, 1293992. [Google Scholar] [CrossRef]
  5. Guo, H.; Yang, X.; Wang, N.; Gao, X. A Centernet++ model for ship detection in SAR images. Pattern Recognit. 2021, 112, 107787. [Google Scholar] [CrossRef]
  6. Zhang, T.; Zhang, X.; Li, J.; Xu, X.; Wang, B.; Zhan, X.; Xu, Y.; Ke, X.; Zeng, T.; Su, H.; et al. SAR Ship Detection Dataset (SSDD): Official Release and Comprehensive Data Analysis. Remote Sens. 2021, 13, 3690. [Google Scholar] [CrossRef]
  7. Zhou, G.; Xu, Z.; Fan, Y.; Zhang, Z.; Qiu, X.; Zhang, B.; Fu, K.; Wu, Y. HPHR-SAR-Net: Hyperpixel High-Resolution SAR Imaging Network Based on Nonlocal Total Variation. IEEE J. Sel. Top. Appl. Earth Obs. Remote Sens. 2023, 16, 8595–8608. [Google Scholar] [CrossRef]
  8. Zhao, G.; Li, P.; Zhang, Z.; Guo, F.; Huang, X.; Xu, W.; Chen, J. Towards SAR Automatic Target Recognition: Multi-Category SAR Image Classification Based on Light Weight Vision Transformer. In Proceedings of the 2024 21st Annual International Conference on Privacy, Security and Trust (PST), Sydney, Australia, 28–30 August 2024; pp. 1–6. [Google Scholar]
  9. Gai, J.; Li, C. Semi-Supervised Multiscale Matching for SAR-Optical Image. arXiv 2025, arXiv:2508.07812. [Google Scholar]
  10. Ho, J.; Jain, A.; Abbeel, P. Denoising diffusion probabilistic models. Proc. Adv. Neural Inf. Process. Syst. (NIPS) 2020, 33, 6840–6851. [Google Scholar]
  11. Xiong, X.; Zhang, X.; Jiang, W.; Liu, L.; Liu, Y.; Liu, T. SAR-GTR: Attributed Scattering Information Guided SAR Graph Transformer Recognition Algorithm. arXiv 2025, arXiv:2505.08547. [Google Scholar] [CrossRef]
  12. Cheng, X.; He, Y.; Zhu, J.; Qiu, C.; Wang, J.; Huang, Q.; Yang, K. SAR-TEXT: A Large-Scale SAR Image-Text Dataset Built with SAR-Narrator and Progressive Transfer Learning. arXiv 2025, arXiv:2507.18743. [Google Scholar]
  13. Luo, B.; Cao, H.; Cui, J.; Lv, X.; He, J.; Li, H.; Peng, C. SAR-PATT: A Physical Adversarial Attack for SAR Image Automatic Target Recognition. Remote Sens. 2025, 17, 21. [Google Scholar] [CrossRef]
  14. Ma, Y.; Guan, D.; Deng, Y.; Yuan, W.; Wei, M. 3SD-Net: SAR small ship detection neural network. IEEE Trans. Geosci. Remote Sens. 2024, 62, 5221613. [Google Scholar] [CrossRef]
  15. Huang, H.; Guo, J.; Lin, H.; Huang, Y.; Ding, X. Domain Adaptive Oriented Object Detection from Optical to SAR Images. IEEE Trans. Geosci. Remote Sens 2024, 63, 5200314. [Google Scholar] [CrossRef]
  16. Wu, F.; Zhou, Z.; Wang, B.; Ma, J. Inshore Ship Detection Based on Convolutional Neural Network in Optical Satellite Images. IEEE J. Sel. Top. Appl. Earth Obs. Remote Sens. 2018, 11, 4005–4015. [Google Scholar] [CrossRef]
  17. Zhang, P.; Xu, H.; Tian, T.; Gao, P.; Tian, J. SFRE-Net: Scattering Feature Relation Enhancement Network for Aircraft Detection in SAR Images. Remote Sens. 2022, 14, 2076. [Google Scholar] [CrossRef]
  18. Liu, Q.; Ye, Z.; Zhu, C.; Ouyang, D.; Gu, D.; Wang, H. Intelligent Target Detection in Synthetic Aperture Radar Images Based on Multi-Level Fusion. Remote Sens. 2025, 17, 112. [Google Scholar] [CrossRef]
  19. Zhao, Z.; Tong, Y.; Jia, M.; Qiu, Y.; Wang, X.; Hei, X. Few-Shot SAR Image Classification via Multiple Prototypes Ensemble. Neurocomputing 2025, 635, 129989. [Google Scholar] [CrossRef]
  20. Zhou, L.; Zhang, G.; Yang, J.; Xie, Y.; Liu, C.; Liu, Y. CSS-YOLO: A SAR Image Ship Detection Method for Complex Scenes. IEEE J. Sel. Top. Appl. Earth Obs. Remote Sens. 2025, early access. [Google Scholar] [CrossRef]
  21. Wang, T.; Zeng, Z. Adaptive multiscale reversible column network for SAR ship detection. IEEE J. Sel. Top. Appl. Earth Obs. Remote Sens. 2024, 17, 6894–6909. [Google Scholar] [CrossRef]
  22. Ning, T.; Pan, S.; Zhou, J. YOLOv7-SIMAM: An Effective Method for SAR Ship Detection. In Proceedings of the 2024 4th International Conference on Neural Networks, Information and Communication Engineering (NNICE), Guangzhou, China, 19–21 January 2024; pp. 754–758. [Google Scholar]
  23. Redmon, J.; Divvala, S.; Girshick, R.; Farhadi, A. You only look once: Unified, real-time object detection. In Proceedings of the 2016 IEEE Conference on Computer Vision and Pattern Recognition (CVPR), Las Vegas, NV, USA, 27–30 June 2016; pp. 779–788. [Google Scholar]
  24. Liu, W.; Anguelov, D.; Erhan, D.; Szegedy, C.; Reed, S.; Fu, C.-Y.; Berg, A.C. SSD: Single Shot MultiBox Detector; UNC Chapel Hill: Chapel Hill, NC, USA; Zoox Inc.: Palo Alto, CA, USA; Google Inc.: Mountain View, CA, USA; University of Michigan: Ann-Arbor, MI, USA; RWTH Aachen: Aachen, Germany; Czech Technical University: Prague, Czech Republic; University of Trento: Povo-Trento, Italy; University of Amsterdam: Amsterdam, The Netherlands, 2016. [Google Scholar]
  25. Kang, M.; Ji, K.; Leng, X.; Lin, Z. Contextual region-based convolutional neural network with multilayer fusion for SAR ship detection. Remote Sens. 2017, 9, 860. [Google Scholar] [CrossRef]
  26. Cui, Z.; Li, Q.; Cao, Z.; Liu, N. Dense attention pyramid networks for multi-scale ship detection in SAR images. IEEE Trans. Geosci. Remote Sens. 2019, 57, 8983–8997. [Google Scholar] [CrossRef]
  27. Sun, Z.; Leng, X.; Lei, Y.; Xiong, B.; Ji, K.; Kuang, G. BiFA-YOLO: A novel YOLO-based method for arbitrary-oriented ship detection in high-resolution SAR images. Remote Sens. 2021, 13, 4209. [Google Scholar] [CrossRef]
  28. Zhang, C.; Yu, R.; Wang, S.; Zhang, F.; Ge, S.; Li, S.; Zhao, X. Edge-Optimized Lightweight YOLO for Real-Time SAR Object Detection. Remote Sens. 2025, 17, 2168. [Google Scholar] [CrossRef]
  29. Zhao, D.; Chen, Z.; Gao, Y.; Shi, Z. Classification Matters More: Global Instance Contrast for Fine-Grained SAR Aircraft Detection. IEEE Trans. Geosci. Remote Sens. 2023, 61, 5203815. [Google Scholar] [CrossRef]
  30. Wang, Z.; Xu, N.; Guo, J.; Zhang, C.; Wang, B. SCFNet: Semantic Condition Constraint Guided Feature Aware Network for Aircraft Detection in SAR Images. IEEE Trans. Geosci. Remote Sens. 2022, 60, 5239420. [Google Scholar] [CrossRef]
  31. Chen, L.; Luo, R.; Xing, J.; Li, Z.; Yuan, Z.; Cai, X. Geospatial transformer is what you need for aircraft detection in SAR Imagery. IEEE Trans. Geosci. Remote Sens. 2022, 60, 5225715. [Google Scholar] [CrossRef]
  32. Zhao, Y.; Zhao, L.; Li, C.; Kuang, G. Pyramid attention dilated network for aircraft detection in SAR images. IEEE Geosci. Remote Sens. Lett. 2021, 18, 662–666. [Google Scholar] [CrossRef]
  33. Guo, Q.; Wang, H.; Xu, F. Scattering enhanced attention pyramid network for aircraft detection in SAR images. IEEE Trans. Geosci. Remote Sens. 2021, 59, 7570–7587. [Google Scholar] [CrossRef]
  34. Zhao, Y.; Zhao, L.; Liu, Z.; Hu, D.; Kuang, G.; Liu, L. Attentional feature refinement and alignment network for aircraft detection in SAR imagery. IEEE Trans. Geosci. Remote Sens. 2022, 60, 5220616. [Google Scholar] [CrossRef]
  35. Yang, R.; Pan, Z.; Jia, X.; Zhang, L.; Deng, Y. A novel CNN-based detector for ship detection based on rotatable bounding box in SAR images. IEEE J. Sel. Top. Appl. Earth Obs. Remote Sens. 2021, 14, 1938–1958. [Google Scholar] [CrossRef]
  36. Zeng, L.; Zhu, Q.; Lu, D.; Zhang, T.; Wang, H.; Yin, J.; Yang, J. Dual-polarized SAR ship grained classification based on CNN with hybrid channel feature loss. IEEE Geosci. Remote Sens. Lett. 2021, 19, 4011905. [Google Scholar] [CrossRef]
  37. Girshick, R. Fast R-Cnn. In Proceedings of the IEEE International Conference on Computer Vision, Santiago, Chile, 7–13 December 2015; pp. 1440–1448. [Google Scholar]
  38. Zhou, Y.; Jiang, X.; Xu, G.; Yang, X.; Liu, X.; Li, Z. PVT-SAR: An Arbitrarily Oriented SAR Ship Detector With Pyramid Vision Transformer. IEEE J. Sel. Top. Appl. Earth Obs. Remote Sens. 2022, 16, 291–305. [Google Scholar] [CrossRef]
  39. Carion, N.; Massa, F.; Synnaeve, G.; Usunier, N.; Kirillov, A.; Zagoruyko, S. End-to-End Object Detection with Transformers. In Proceedings of the European Conference on Computer Vision, Glasgow, UK, 23–28 August 2020; pp. 213–229. [Google Scholar]
  40. Vaswani, A.; Shazeer, N.; Parmar, N.; Uszkoreit, J.; Jones, L.; Gomez, A.N.; Kaiser, Ł.; Polosukhin, I. Attention is all you need. NeurIPS 2017, 30, 600–610. [Google Scholar]
  41. Zhu, X.; Su, W.; Lu, L.; Li, B.; Wang, X.; Dai, J. Deformable Detr: Deformable Transformers for End-to-End Object Detection. arXiv 2020, arXiv:2010.04159. [Google Scholar]
  42. Chen, P.; Zhou, H.; Li, Y.; Liu, B.; Liu, P. A Deformable and Multi-Scale Network with Self-Attentive Feature Fusion for SAR Ship Classification. J. Mar. Sci. Eng. 2024, 12, 1524. [Google Scholar] [CrossRef]
  43. Meng, L.; Li, D.; He, J.; Ma, L.; Li, Z. Convolutional Feature Enhancement and Attention Fusion BiFPN for Ship Detection in SAR Images. arXiv 2025, arXiv:2506.15231. [Google Scholar] [CrossRef]
  44. Huang, Y.X.; Liu, H.I.; Shuai, H.H.; Cheng, W.H. DQ-DETR: DETR with Dynamic Query for Tiny Object Detection. In Computer Vision—ECCV 2024, Proceedings of the 18th European Conference, Milan, Italy, September 29–October 4 2024; Leonardis, A., Ricci, E., Roth, S., Russakovsky, O., Sattler, T., Varol, G., Eds.; Springer: Cham, Switzerland, 2024; pp. 290–305. [Google Scholar]
  45. Liu, C.; He, Y.; Zhang, X.; Wang, Y.; Dong, Z.; Hong, H. CS-FSDet: A Few-Shot SAR Target Detection Method for Cross-Sensor Scenarios. Remote Sens. 2025, 17, 2841. [Google Scholar] [CrossRef]
  46. Xu, Y.; Pan, H.; Wang, L.; Zou, R. MC-ASFF-ShipYOLO: Improved Algorithm for Small-Target and Multi-Scale Ship Detection for Synthetic Aperture Radar (SAR) Images. Sensors 2025, 25, 2940. [Google Scholar] [CrossRef]
  47. Li, Y.; Li, X.; Li, W.; Hou, Q.; Liu, L.; Cheng, M.M.; Yang, J. SARDet-100K: Towards Open-Source Benchmark and ToolKit for Large-Scale SAR Object Detection. arXiv 2024, arXiv:2403.06534. [Google Scholar]
  48. Wu, Y.; Suo, Y.; Meng, Q.; Dai, W.; Miao, T.; Zhao, W.; Yan, Z.; Diao, W.; Xie, G.; Ke, Q.; et al. FAIR-CSAR: A Benchmark Dataset for Fine-Grained Object Detection and Recognition Based on Single-Look Complex SAR Images. IEEE Trans. Geosci. Remote Sens. 2025, 63, 5201022. [Google Scholar] [CrossRef]
  49. Meng, D.; Chen, X.; Fan, Z.; Zeng, G.; Li, H.; Yuan, Y.; Sun, L.; Wang, J. Conditional Detr For Fast Training Convergence. In Proceedings of the IEEE/CVF International Conference on Computer Vision, Montreal, BC, Canada, 11–17 October 2021; pp. 3651–3660. [Google Scholar]
  50. Liu, S.; Li, F.; Zhang, H.; Yang, X.; Qi, X.; Su, H.; Zhu, J.; Zhang, L. DAB-DETR: Dynamic Anchor Boxes Are Better Queries for DETR. arXiv 2022, arXiv:2201.12329. [Google Scholar] [CrossRef]
  51. Wang, C.-Y.; Yeh, I.-H.; Liao, H.-Y.M. YOLOv9: Learning What You Want to Learn Using Programmable Gradient Information. In Computer Vision—ECCV 2024, Proceedings of the European Conference on Computer Vision, London, UK, 15–16 January 2025; Springer: Cham, Switzerland; pp. 1–21.
  52. Khanam, R.; Hussain, M. YOLOv11: An Overview of the Key Architectural Enhancements. arXiv 2024, arXiv:2410.17725. [Google Scholar] [CrossRef]
  53. Tian, Y.; Ye, Q.; Doermann, D. YOLOv12: Attention-Centric Real-Time Object Detectors. arXiv 2025, arXiv:2502.12524. [Google Scholar]
  54. Li, C.; Hei, Y.; Xi, L.; Li, W.; Xiao, Z. GL-DETR: Global-to-Local Transformers for Small Ship Detection in SAR Images. IEEE Geosci. Remote Sens. Lett. 2024, 21, 4016805. [Google Scholar] [CrossRef]
  55. Feng, Y.; You, Y.; Tian, J.; Meng, G. OEGR-DETR: A Novel Detection Transformer Based on Orientation Enhancement and Group Relations for SAR Object Detection. Remote Sens. 2024, 16, 106. [Google Scholar] [CrossRef]
  56. Ren, P.; Han, Z.; Yu, Z.; Zhang, B. Confucius tri-learning: A paradigm of learning from both good examples and bad examples. Pattern Recognit. 2025, 163, 111481. [Google Scholar] [CrossRef]
  57. Huang, Z.; Liu, L.; Yang, S.; Wang, Z.; Cheng, G.; Han, J. Physics-Guided Detector for SAR Airplanes. IEEE Trans. Circuits Syst. Video Technol. 2025, early access. [Google Scholar] [CrossRef]
  58. Zhao, W.; Huang, L.; Liu, H.; Yan, C. Scattering-Point-Guided Oriented RepPoints for Ship Detection. Remote Sens. 2024, 16, 933. [Google Scholar] [CrossRef]
  59. Woo, S.; Park, J.; Lee, J.Y.; Kweon, I.S. CBAM: Convolutional block attention module. In Computer Vision—ECCV 2018, Proceedings of the 15th European Conference, Munich, Germany, 8–14 September 2018; Springer: Cham, Switzerland, 2018; pp. 3–19. [Google Scholar]
  60. Li, X.; Lv, C.; Wang, W. Generalized Focal Loss: Towards Efficient Representation Learning for Dense Object Detection. IEEE Trans. Pattern Anal. Mach. Intell. 2023, 45, 3139–3153. [Google Scholar] [CrossRef]
  61. Tian, Z.; Shen, C.; Chen, H.; He, T. FCOS: Fully Convolutional One-Stage Object Detection. In Proceedings of the 2019 IEEE/CVF International Conference on Computer Vision, Seoul, Republic of Korea, 27–28 October 2019. [Google Scholar]
  62. Lin, T.-Y.; Goyal, P.; Girshick, R.; He, K.; Dollar, P. Focal Loss for Dense Object Detection. In Proceedings of the IEEE International Conference on Computer Vision (ICCV), Venice, Italy, 22–29 October 2017; pp. 2999–3007. [Google Scholar]
  63. Cai, Z.; Vasconcelos, N. Cascade R-CNN: Delving Into High Quality Object Detection. In Proceedings of the 2018 IEEE/CVF Conference on Computer Vision and Pattern Recognition, Salt Lake City, UT, USA, 18–23 June 2018; pp. 6154–6162. [Google Scholar]
  64. Lu, X.; Li, B.; Yue, Y.; Li, Q.; Yan, J. Grid R-CNN. In Proceedings of the 2019 IEEE/CVF Conference on Computer Vision and Pattern Recognition (CVPR), Long Beach, CA, USA, 15–20 June 2019; pp. 7363–7372. [Google Scholar]
  65. Kong, T.; Sun, F.; Liu, H.; Jiang, Y.; Li, L.; Shi, J. Foveabox: Beyound anchor-based object detection. IEEE Trans. Image Process. 2020, 29, 7389–7398. [Google Scholar] [CrossRef]
  66. Yang, Z.; Liu, S.; Hu, H.; Wang, L.; Lin, S. RepPoints: Point Set Representation for Object Detection. In Proceedings of the 2019 IEEE/CVF International Conference on Computer Vision (ICCV), Seoul, Republic of Korea, 27 October–2 November 2019; pp. 9656–9665. [Google Scholar]
  67. Razakarivony, S.; Jurie, F. Vehicle detection in aerial imagery: A small target detection benchmark. J. Vis. Commun. 2016, 34, 187–203. [Google Scholar] [CrossRef]
  68. Golubović, D. The future of maritime target detection using HFSWRs: High-resolution approach. In Proceedings of the 2024 32nd Telecommunications Forum (TELFOR), Belgrade, Serbia, 26–27 November 2024; pp. 1–8. [Google Scholar]
  69. Ji, Y.; Zhang, J.; Meng, J.; Wang, Y. Point association analysis of vessel target detection with SAR, HFSWR and AIS. Acta Oceanol. Sin 2014, 33, 73–81. [Google Scholar] [CrossRef]
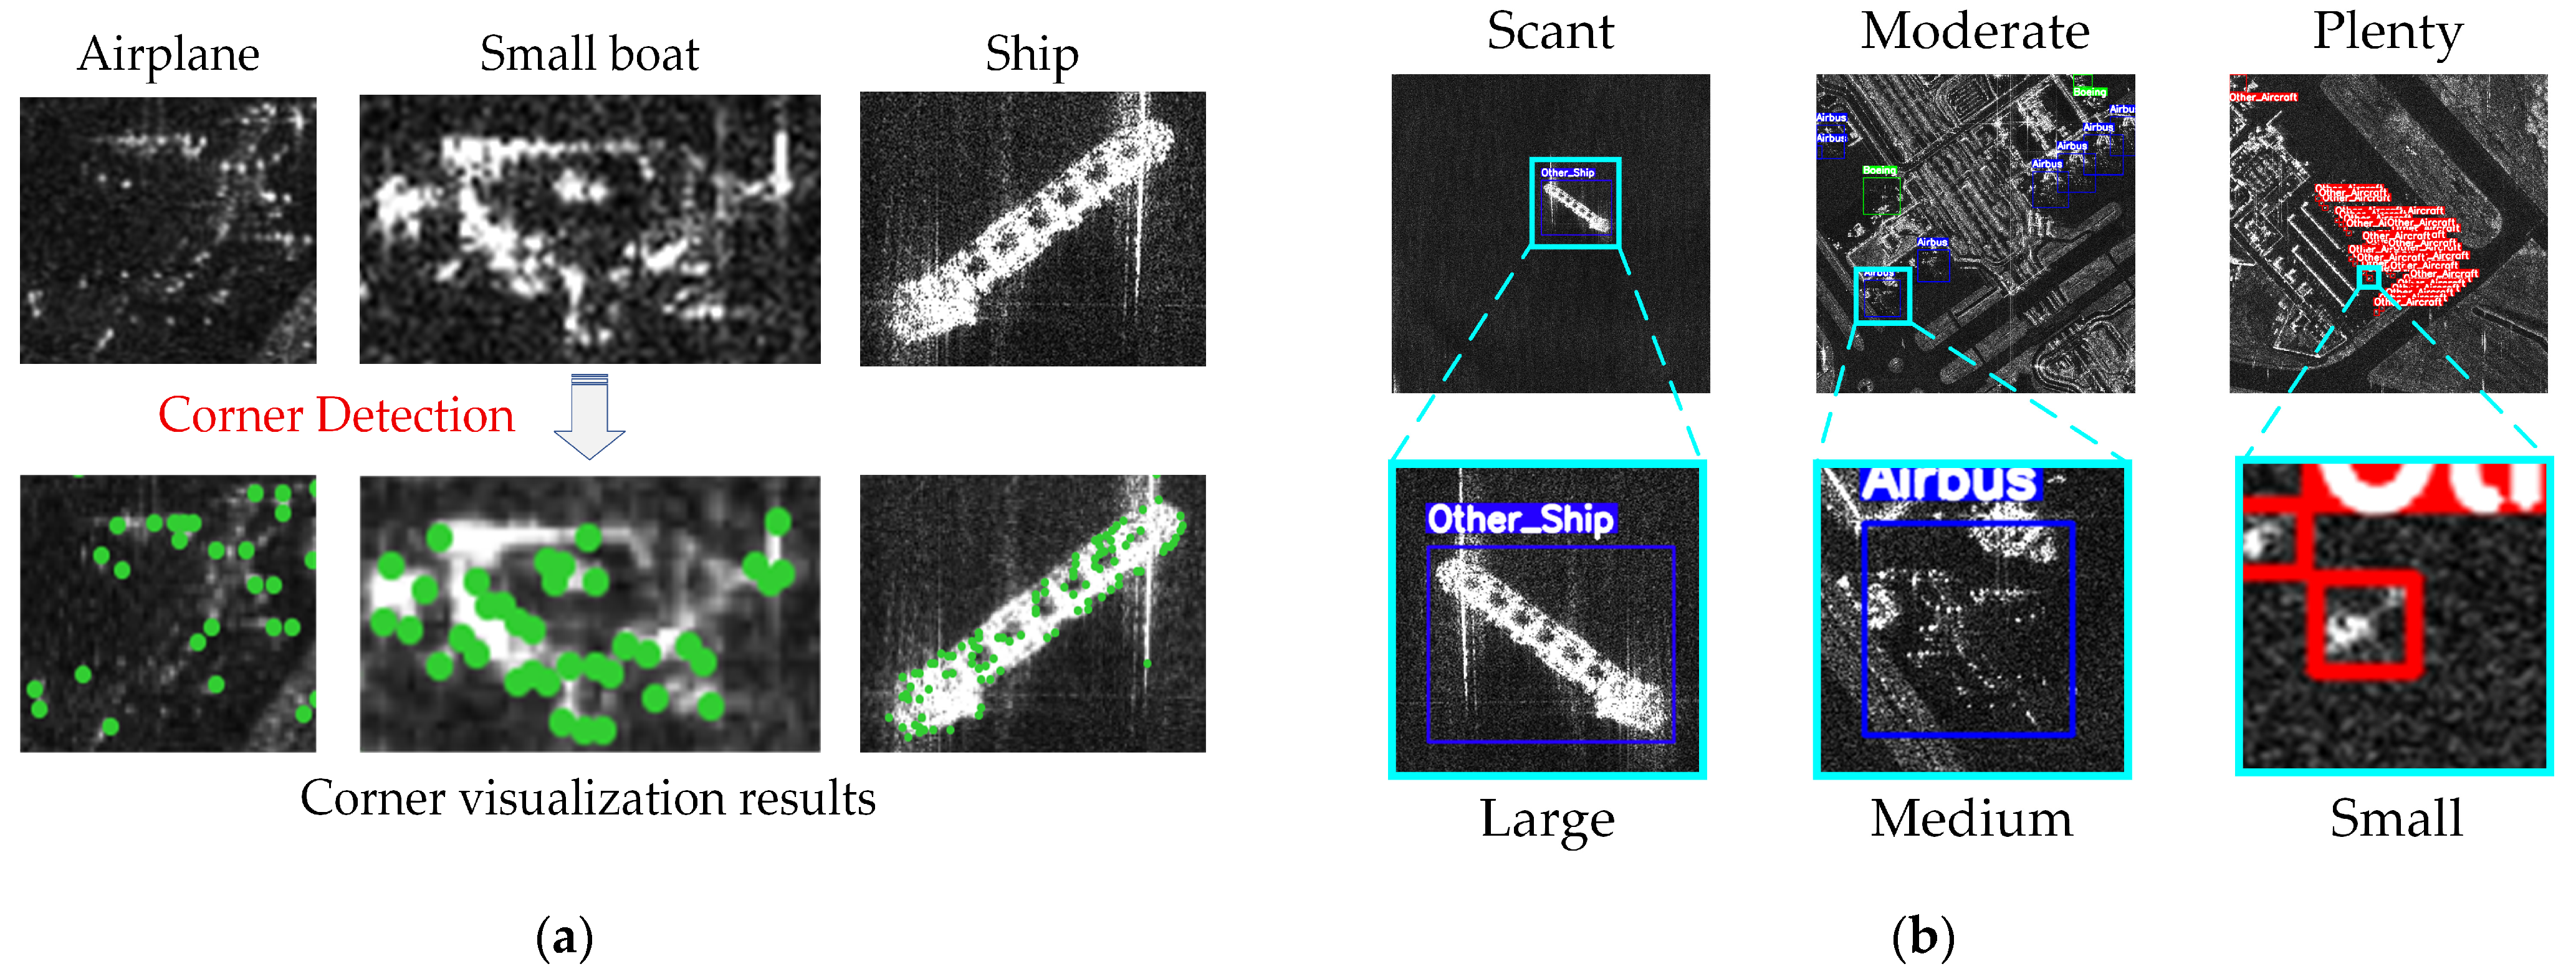
Figure 1. Illustration of objects in common SAR datasets: (a) Illustration of corner detection results for different types of objects in SAR dataset images. (b) Illustration of different quantities and scales of objects contained in SAR dataset images.
Remotesensing 17 03254 g001
Figure 2. Illustration of our CGAQ-DETR architecture. CGAQ-DETR is designed based on a CNN backbone and the structure of Deformable DETR, and primarily consists of two modules: the CMFE and the AQR.
Remotesensing 17 03254 g002
Figure 3. Illustrations of selected images from the SARDet-100K dataset and the FAIR-CSAR dataset.
Remotesensing 17 03254 g003
Figure 4. Dataset distribution statistical chart: (a) Object scale distribution statistics, (b) Object quantity distribution statistics. We define the object size range as follows: large objects are those with a size greater than 96 × 96 pixels2, medium objects have sizes between 32 × 32 and 96 × 96 pixels2, and small objects have sizes smaller than 32 × 32 pixels2. Additionally, when the number of objects in an image is between 1 and 5, it is classified as scant; when the number of objects is between 6 and 15, it is classified as moderate; and when the number of objects exceeds 15, it is classified as plenty.
Remotesensing 17 03254 g004
Figure 5. Dataset distribution percentage chart: (a) Object scale distribution percentage, (b) Object quantity distribution percentage. In the figure, the data in the dark-colored central region represent the SARDet-100K dataset, while the data in the light-colored outer region represent the FAIR-CSAR dataset. We define the object size range as follows: large objects are those with a size greater than 96 × 96 pixels2, medium objects have sizes between 32 × 32 and 96 × 96 pixels2, and small objects have sizes smaller than 32 × 32 pixels2. Additionally, when the number of objects in an image is between 1 and 5, it is classified as scant; when the number of objects is between 6 and 15, it is classified as moderate; and when the number of objects exceeds 15, it is classified as plenty.
Remotesensing 17 03254 g005
Figure 6. The detection results of Faster R-CNN, DETR, Deformable DETR, and our method on the SARDet-100K dataset are illustrated in the figure. The top row shows the detection results of different algorithms, while the bottom row provides a visual representation of the differences between the detection results of each algorithm and the ground truth. In the figure, green box represents the predicted result, blue indicates missed detections, red indicates false detections, and the far-right side shows the ground truth.
Remotesensing 17 03254 g006
Figure 7. The detection results of Faster R-CNN, Cascade R-CNN, Deformable DETR, and our method on the FAIR-CSAR dataset are illustrated in the figure. The top row shows the detection results of different algorithms, while the bottom row provides a visual representation of the differences between the detection results of each algorithm and the ground truth. In the figure, blue and pink box represents the predicted result, blue indicates missed detections, red indicates false detections, and the far-right side shows the ground truth.
Remotesensing 17 03254 g007
Figure 8. The ablation experiment results on the FAIR-CSAR dataset are illustrated in the figure. The top row shows the detection results of different algorithms, while the bottom row provides a visual representation of the differences between the detection results of each algorithm and the ground truth. In the figure, blue and pink box represents the predicted result, blue indicates missed detections, red indicates false detections, and the far-right side shows the ground truth.
Remotesensing 17 03254 g008
Figure 9. The corner detection and clustering results on the SAR and visible datasets are shown in the figure. The upper section displays the results for FAIR-CSAR, along with a comparison to the ground truth, while the lower section shows the results for VEDAI and its comparison to the ground truth. In the figure, red and blue boxes indicate localized zoom-in visualizations, green circles represent correct clustering, and orange circles indicate incorrect or missed clustering.
Remotesensing 17 03254 g009
Table 1. The quantities of images of different types in the SARDet-100K dataset.
ClassThe Quantities of Various Types
TrainValTestAll
Aircraft40,7055194677952,678
Bridge27,6153318328134,214
Car95611222123012,013
Harbor33064043994109
Ship93,37310,53010,741114,644
Tank24,1872035177327,995
all198,74722,70324,203245,653
Table 2. The quantities of images of different types in the FAIR-CSAR dataset.
ClassThe Quantities of Various Types
TrainValTestAll
Airbus5191137512827848
Boeing443113476226400
Other_Aircraft6472160111589231
Other_Ship20,6895569689433,152
Oil_Tanker11733053261804
Warship16683092802257
Bridge16974176932807
Tank12,0903274406219,426
Tower_Crane12504406702360
all54,66114,63715,98785,285
Table 3. Distribution of different object scales and object quantities in the SARDet-100K dataset and the FAIR-CSAR dataset. We define the object size range as follows: large objects are those with a size greater than 96 × 96 pixels2, medium objects have sizes between 32 × 32 and 96 × 96 pixels2, and small objects have sizes smaller than 32 × 32 pixels2. Additionally, when the number of objects in an image is between 1 and 5, it is classified as scant; when the number of objects is between 6 and 15, it is classified as moderate; and when the number of objects exceeds 15, it is classified as plenty.
DatasetsSARDet-100KFAIR-CSAR
TrainValTestTrainValTest
Scale
(number of objects)
Small66,250 (33.33%)7813 (34.41%)7894 (32.62%)37,374 (68.37%)10,057 (68.71%)12,139 (75.93%)
Medium112,232 (56.47%)12,882 (56.74%)13,851 (57.23%)16,275 (29.77%)4324 (29.54%)3680 (23.02%)
Large20,265 (10.20%)2008 (8.84%)2458 (10.16%)1012 (1.85%)256 (1.75%)168
(1.05%)
Quantity
(number of images)
Scant89,983 (95.23%)9903 (94.39%)11,046 (95.13)6689 (69.92%)1603 (67.02%)1887 (69.73%)
Moderate3266 (3.46%)456 (4.35%)446
(3.84)
2048 (21.41%)561 (23.45%)579 (21.40%)
Plenty1244 (1.32%)133 (1.27%)120 (1.03%)830
(8.68%)
228 (9.53%)240
(8.87%)
Table 4. The experimental results on the SARDet-100K dataset.
MethodmAP@50mAP@75mAP@50-95mAP_lmAP_mmAP_s
GFL [60]63.7%33.0%34.1%30.5%41.4%28.2%
FCOS [61]60.9%26.9%30.3%26.4%38.2%24.0%
RetinaNet [62]56.2%34.9%33.5%41.7%37.2%17.7%
Cascade R-CNN [63]65.6%34.0%35.9%38.5%42.7%27.4%
Grid R-CNN [64]63.2%32.3%33.5%35.4%40.7%25.4%
Faster R-CNN [37]63.4%32.1%33.6%35.9%40.5%27.1%
DETR [39]22.0%2.3%7.1%10.9%10.5%3.6%
Deformable DETR [41]66.6%30.0%33.3%32.6%44.7%27.7%
Dab-DETR [50]57.1%24.8%28.1%26.0%37.7%21.9%
Ours69.8%39.7%38.6%40.6%49.1%31.8%
Table 5. The experimental results on the FAIR-CSAR dataset.
MethodmAP@50mAP@50-95Param.s(M)FPS
Faster R-CNN [37]87.8%56.9%41.39144.0
Cascade R-CNN [63]89.2%64.3%77.0522.4
FoveaBox [65]87.0%58.1%36.26135.2
FCOS [61]86.2%55.0%32.13151.3
RetinaNet [62]85.5%55.6%36.50142.4
RepPoints [66]89.4%56.8%36.82145.8
Deformable-DETR [41]81.1%44.5%40.10139.1
Ours92.9%62.5%59.95137.9
Table 6. Ablation experiment results on the FAIR-CSAR dataset.
CMFEAQRmAP@50mAP@75mAP@50-95mAP_lmAP_mmAP_s
××72.7%35.7%38.6%53.1%35.6%26.0%
×74.5%
(+1.8%)
37.3%
(+1.6%)
39.8%
(+1.2%)
55.8%
(+2.7%)
36.7%
(+1.1%)
29.4%
(+3.4%)
×73.8%
(+1.1%)
37.4%
(+1.7%)
39.5%
(+0.9%)
54.5%
(+1.4%)
36.4%
(+0.8%)
28.4%
(+2.4%)
76.4%
(+3.7%)
41.6%
(+5.9%)
42.1%
(+3.5%)
55.6% (+2.5%)39.5%
(+3.9%)
29.7%
(+3.7%)
Disclaimer/Publisher’s Note: The statements, opinions and data contained in all publications are solely those of the individual author(s) and contributor(s) and not of MDPI and/or the editor(s). MDPI and/or the editor(s) disclaim responsibility for any injury to people or property resulting from any ideas, methods, instructions or products referred to in the content.