Article

Multi-Scenario Land Use Simulation and Cost Assessment of Ecological Corridor Construction in Nanchang City

1
School of Geography and Environment, Jiangxi Normal University, Nanchang 330022, China
2
Key Laboratory of Poyang Lake Wetland and Watershed Research, Ministry of Education, Jiangxi Normal University, Nanchang 330022, China
*
Author to whom correspondence should be addressed.
Remote Sens. 2025, 17(18), 3257; https://doi.org/10.3390/rs17183257
Submission received: 12 June 2025 / Revised: 20 August 2025 / Accepted: 19 September 2025 / Published: 21 September 2025
(This article belongs to the Special Issue GeoAI and EO Big Data Driven Advances in Earth Environmental Science)

Abstract

Highlights

What are the main findings?
  • At the city scale, land-use policies oriented toward ecological protection are the most economically efficient with the lowest corridor construction costs.
  • Minimizing ecological corridor construction costs at the district level in Nanchang requires differentiated development scenarios rather than a uniform ecological protection scenario.
What is the implication of the main finding?
  • One-size-fits-all policies overlook local complexities and are suboptimal for urban management and spatial planning.
  • Quantifying corridor costs under multiple scenarios provides a robust decision-making framework for sustainable urban governance.

Abstract

As critical components of regional ecological networks, the protection and development of ecological corridors (ECs) are essential for enhancing ecosystem stability. To promote the effective protection of ECs, this study develops an integrated framework—comprising ecological corridor identification, land use simulation, and construction cost assessment—to evaluate the cost of EC construction in Nanchang under multiple future land-use scenarios. High-resolution, multi-temporal remote sensing data were used to simulate land-use patterns for 2035 under three scenarios—ecological protection (EP), natural development (ND), and urban expansion (UE)—with the PLUS model. ECs were extracted using the Minimum Cumulative Resistance (MCR) model, and construction costs were quantitatively estimated by overlaying simulated land-use maps with corridor networks while incorporating land adjustment and compensation standards. The results show that: (1) 23 ECs (564.01 km in length, 997.93 km2 in area) were identified in Nanchang, with higher corridor density in the northern and southeastern regions. (2) By 2035, the overall land-use structure in Nanchang is projected to remain broadly similar across the three scenarios, though differences will exist in the magnitude of change for individual land-use categories. (3) Cropland dominates the EC landscape (>60%) across all scenarios, while construction land accounts for 6.95%, 7.71%, and 8.39% under the EP, ND, and UE scenarios, respectively. (4) Estimated construction costs are 233.707, 262.354, and 288.897 billion RMB yuan under the EP, ND, and UE scenarios, respectively. Significant spatial variation in costs is observed, and the EP scenario does not consistently yield the lowest costs across administrative units. Additionally, this study proposes a refined zoning strategy for corridor management in Nanchang. The findings offer valuable insights for urban ecological planning and provide a scientific basis for mitigating regional ecological risks while promoting sustainable development in urbanized regions.

1. Introduction

Amid the dual pressures of global environmental change and intensified anthropogenic activities, human–land conflicts have become increasingly acute, exacerbating ecological challenges such as air and water pollution [1,2,3,4]. Rapid urbanization has driven the large-scale conversion of traditional cropland into urban built-up areas, resulting in substantial ecological patch loss and pronounced landscape fragmentation [5,6,7]. Furthermore, the proliferation of transportation networks and the expansion of sprawling metropolitan areas have exacerbated the isolation and fragmentation of natural ecosystems, thereby weakening landscape connectivity [8,9]. These processes disrupt regional ecosystem structures, significantly constrain species migration across ecological spaces, and pose serious threats to the stability of ecosystem functions [10,11,12]. In this context, ecological corridors (ECs) are increasingly recognized as critical linkages connecting fragmented ecological patches and facilitating species dispersal and energy flows between habitats [13,14,15,16]. The construction and conservation of ECs are therefore essential strategies for strengthening spatial ecological connectivity, reconciling economic growth with ecological integrity, and safeguarding long-term ecosystem health [17,18,19,20].
ECs are essential components of ecological networks, typically comprising linear or belt-shaped landscape structures that connect fragmented habitats and facilitate ecological flows [21,22,23]. Globally, the focus of EC development varies: in the United States, corridor initiatives emphasize protecting natural landscapes and providing open spaces for urban residents [24]; in Europe, EC construction primarily aims to mitigate biodiversity pressures associated with high population density [25], while in China, ecological corridor development is often integrated with urbanization management strategies, underscoring its role in balancing development and conservation [26,27,28]. Currently, the standardized “source–resistance–corridor” paradigm is widely applied in regional EC identification [29,30,31,32]. The Minimum Cumulative Resistance (MCR) model, which integrates resistance surfaces derived from land use, topography, and anthropogenic disturbances, has become a principal tool for corridor delineation [33,34]. Building on the MCR model, the Linkage Mapper tool enables the identification of ECs with embedded width attributes, providing critical technical support for corridor delineation and for guiding ecological restoration and reconstruction efforts [35,36]. However, existing research has predominantly focused on corridor identification and ecological network layout optimization, while offering relatively limited in-depth exploration of corridor construction and management [37].
Land use and land cover change (LUCC) affect the spatial layout and connectivity of ecological corridors, and rational land resource allocation is fundamental to achieving sustainable urban development [38,39,40]. Land use simulation enables projections of both the quantitative structure and the spatial configuration of future land use [41]. Previous studies have used simulation outputs to delineate future ecological security patterns [42,43,44,45], thereby providing critical guidance for ecological zoning management and network optimization. However, in rapidly urbanizing regions, simply protecting existing ecological spaces is often insufficient to sustain ecological processes [7]. For example, Hou et al. advocated for controlling urbanization intensity along ecological corridors [38], whereas Liu et al. proposed reducing construction land within these corridors [46]. Nevertheless, most related studies have primarily focused on spatial control strategies for the entire corridors, while relatively little attention has been paid to the systematic construction and internal management of ECs [32]. ECs in urbanizing regions exhibit highly sensitive natural and social characteristics, making them vulnerable to development pressures [47]. Therefore, quantifying the investment required for EC construction under future multi-scenario land-use conditions is necessary, as this can promote corridor protection from an economically rational perspective and provide scientific support for urban ecological development.
To fill these knowledge gaps, this study focuses on Nanchang City, a rapidly urbanizing region in China, and develops an integrated analytical framework encompassing ecological corridor identification—land-use simulation—corridor construction cost assessment. The primary objectives of this study are to:
(1) Identify and map ECs using the MCR model and the Linkage Mapper tool. (2) Simulate land-use patterns for 2035 under multiple development scenarios—EP, ND, and UE—using the PLUS model. (3) Quantitatively evaluate the construction costs of ECs under different scenarios and propose policy-oriented recommendations.

2. Materials and Methods

2.1. Study Area

Nanchang City, located in northern Jiangxi Province, China, lies between 115°27′–116°35′E and 28°10′–29°11′N (Figure 1). Covering an area of roughly 7200 km2, Nanchang had a population of 6.44 million in 2021 and accounted for approximately 22.45% of Jiangxi Province’s total GDP, according to the Jiangxi Statistical Yearbook. The city has a humid subtropical monsoon climate (average annual temperature: 17–17.7 °C; annual precipitation: 1600–1700 mm), 23% forest cover, flat terrain with low hills, and evergreen broad-leaved vegetation. Nanchang administers six districts and three counties: Donghu, Xihu, Qingyunpu, Qingshan Lake, Xinjian, and Honggutan districts; as well as Nanchang, Anyi, and Jinxian counties. As the provincial capital, Nanchang serves as a key growth pole for Jiangxi’s economic development [39]. In recent years, accelerated urbanization and industrialization have strained the balance between economic development and regional ecological security in Nanchang [48], underscoring the urgent need for ecological infrastructure development and the scientific planning of ECs to foster sustainable ecological—economic synergy.

2.2. Data Sources and Processing

Multi-source remote sensing datasets provide indispensable spatial and spectral information for accurate land-use classification, vegetation monitoring, and resistance surface construction—capabilities unattainable with conventional statistical data alone [2]. This study employed eight categories of data: normalized difference vegetation index (NDVI), land use, nighttime light, digital elevation model (DEM), soil, base geographic data, meteorological data, and socio-economic data. All datasets were resampled and spatially standardized to a 30 m × 30 m resolution in ArcGIS, ensuring spatial consistency and analytical compatibility. Detailed data sources and descriptions are provided in Table 1.

2.3. Research Framework and Methodology

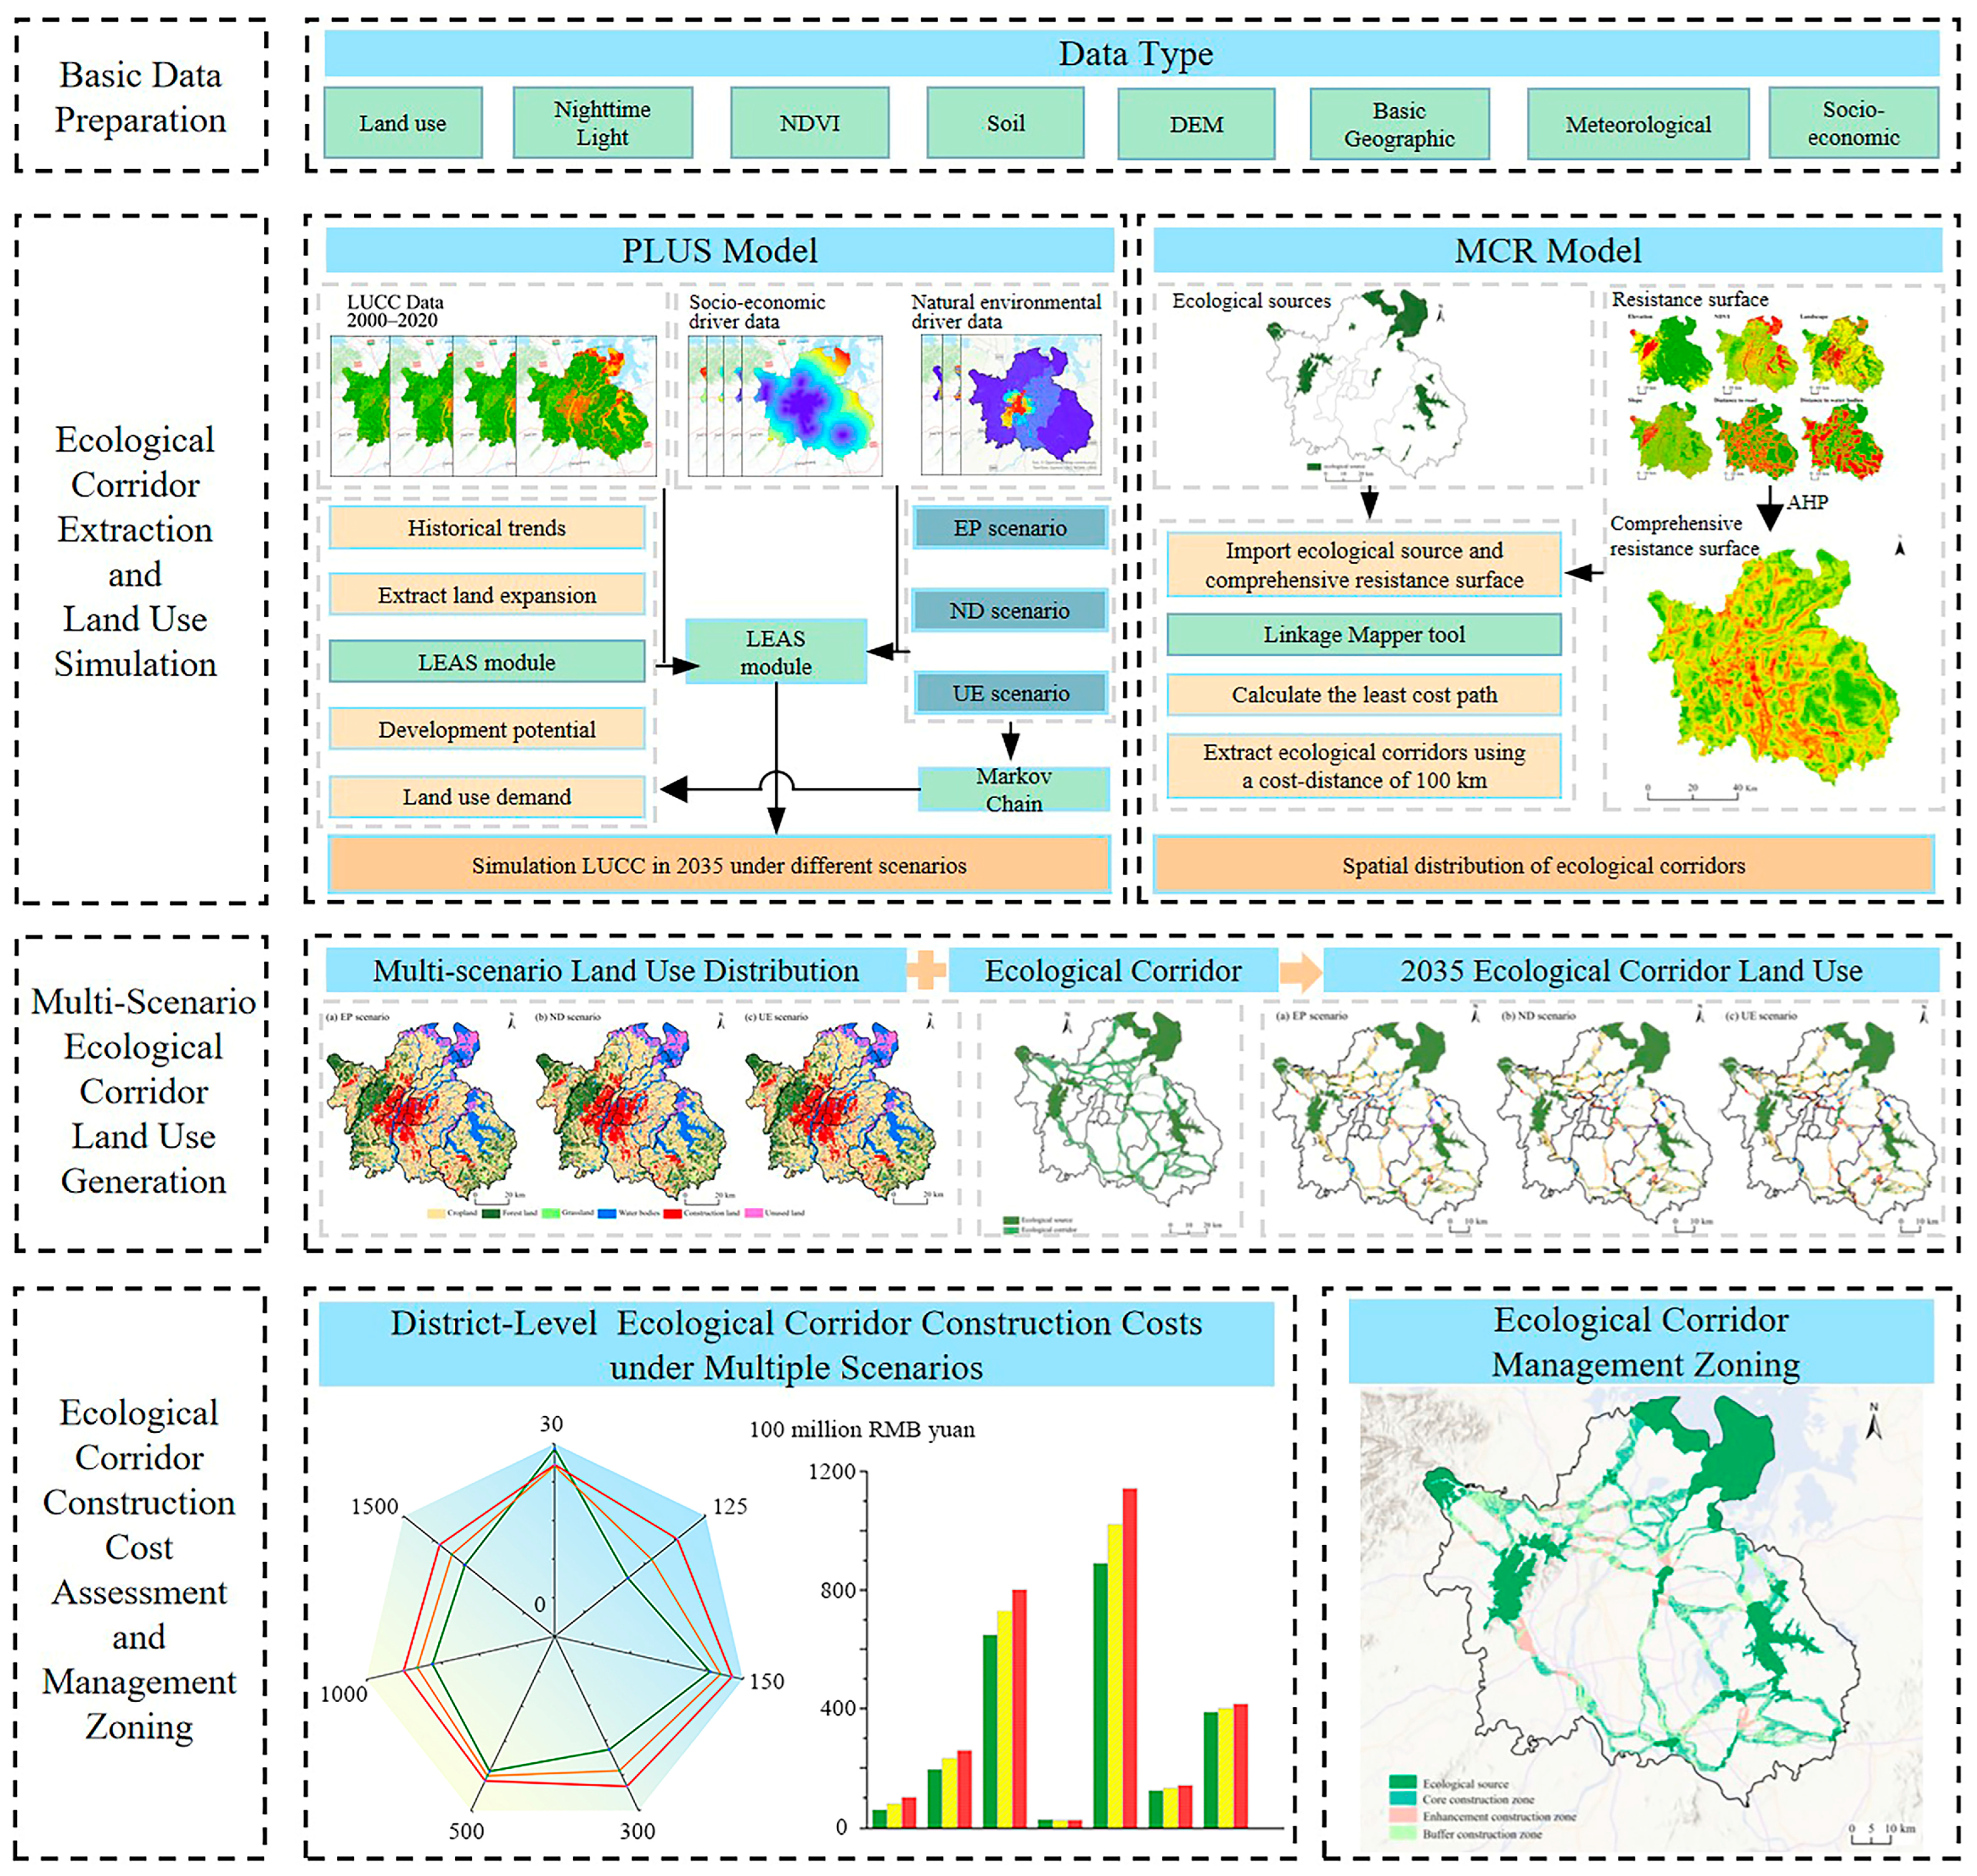
To scientifically evaluate the construction costs of ECs in Nanchang City under multiple future land-use scenarios, this study develops an integrated analytical framework encompassing ecological corridor identification, land-use simulation, and corridor construction cost assessment. First, nature reserves in Nanchang City were designated as ecological source areas. Ecological resistance surfaces were constructed from a combination of topographic conditions, landscape elements, and anthropogenic disturbances. The MCR model was subsequently applied to delineate ECs. Second, land-use demand for 2035 was projected with the Markov model, and spatial patterns under the EP, ND, and UE scenarios were simulated using the Patch-generating Land Use Simulation (PLUS) model. Finally, the construction costs of ECs under the three development scenarios for 2035 were estimated to support EC protection and development from an economically rational perspective. Based on the results, this study proposes a refined zoning strategy for ecological corridor construction in Nanchang, aiming to mitigate the impacts of urban expansion, reconcile economic growth with ecological preservation, and promote high-quality, sustainable urban development. Figure 2 illustrates the methodological framework and corresponding analytical workflow of this study.

2.3.1. Ecological Corridor Extraction Based on MCR Model

Identify Ecological Sources
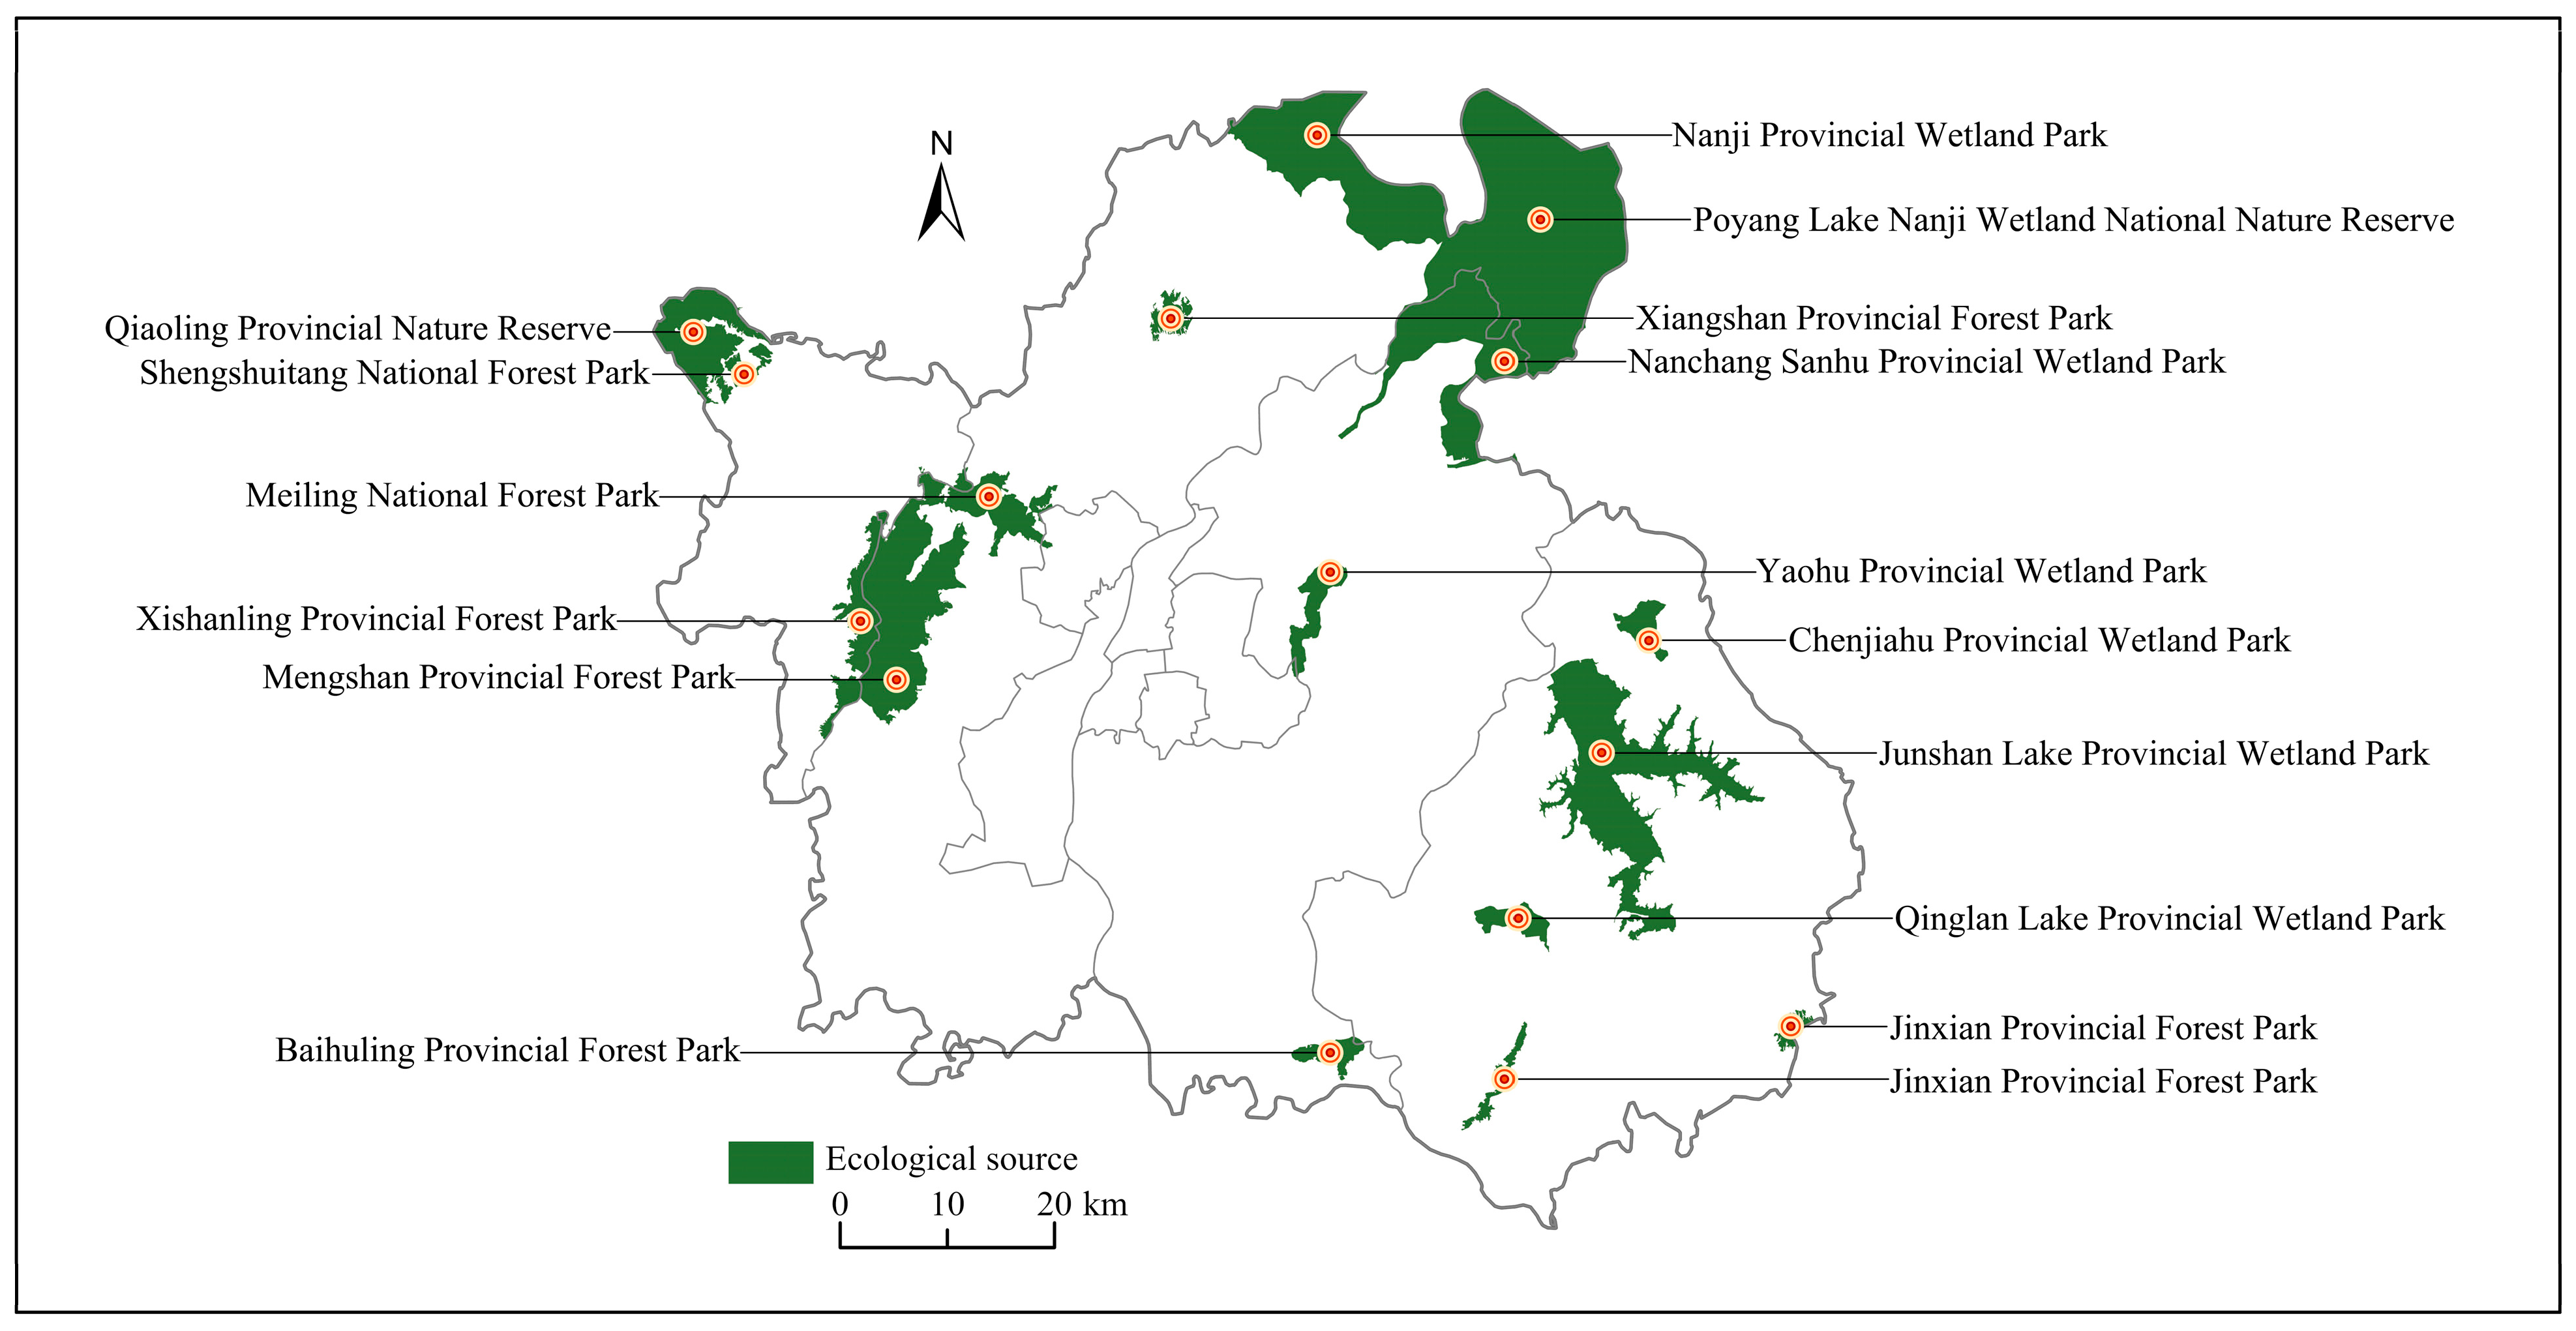
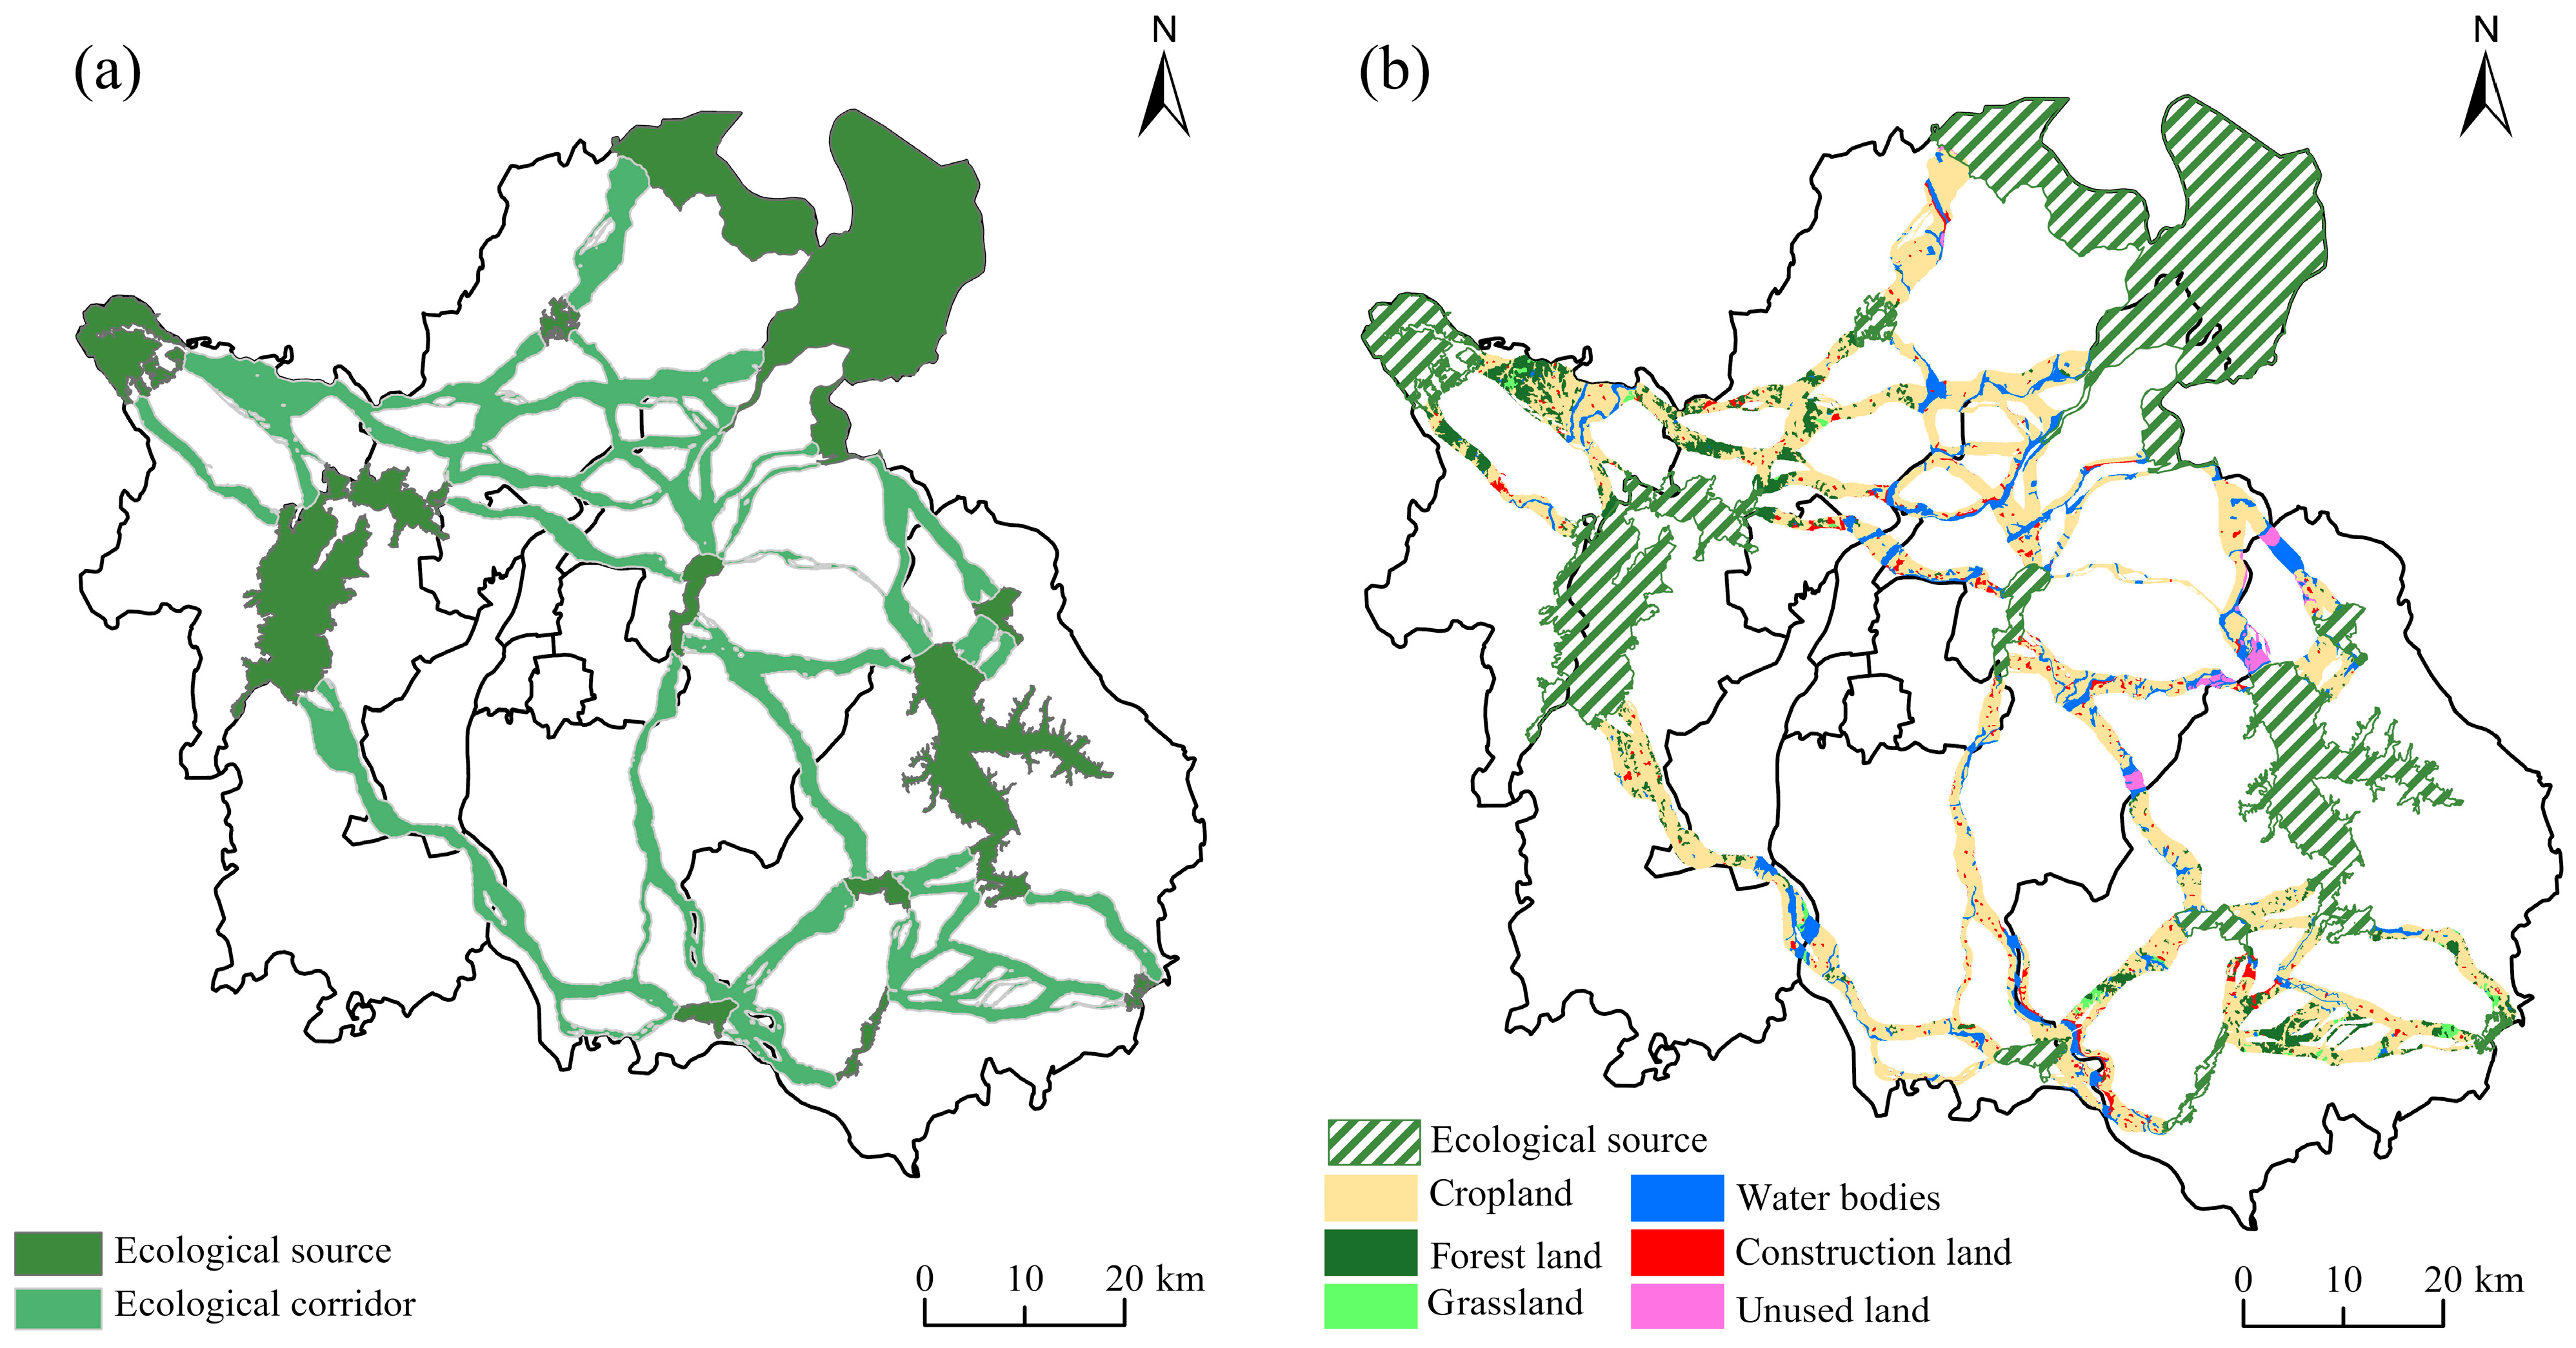
Ecological sources are spatially continuous areas that serve as reservoirs of material, energy, and ecosystem services—such as lakes, forests, and parks—and play a crucial role in enhancing ecosystem stability and maintaining regional ecological security [49]. Nature reserves generally provide more comprehensive ecosystem services and experience minimal human disturbance, making them representative of natural ecosystems and key sources of biodiversity conservation [50]. Therefore, following established literature [38], national and provincial nature reserves in Nanchang City larger than 5 km2 were selected as ecological source sites in this study. To ensure spatial continuity, adjacent source patches were merged in ArcGIS. After processing, 11 ecological source areas were identified across Nanchang City, covering 977.95 km2 and accounting for 13.59% of the city’s total area. The spatial distribution of these sources is shown in Figure 3.
Construct the Ecological Resistance Surface
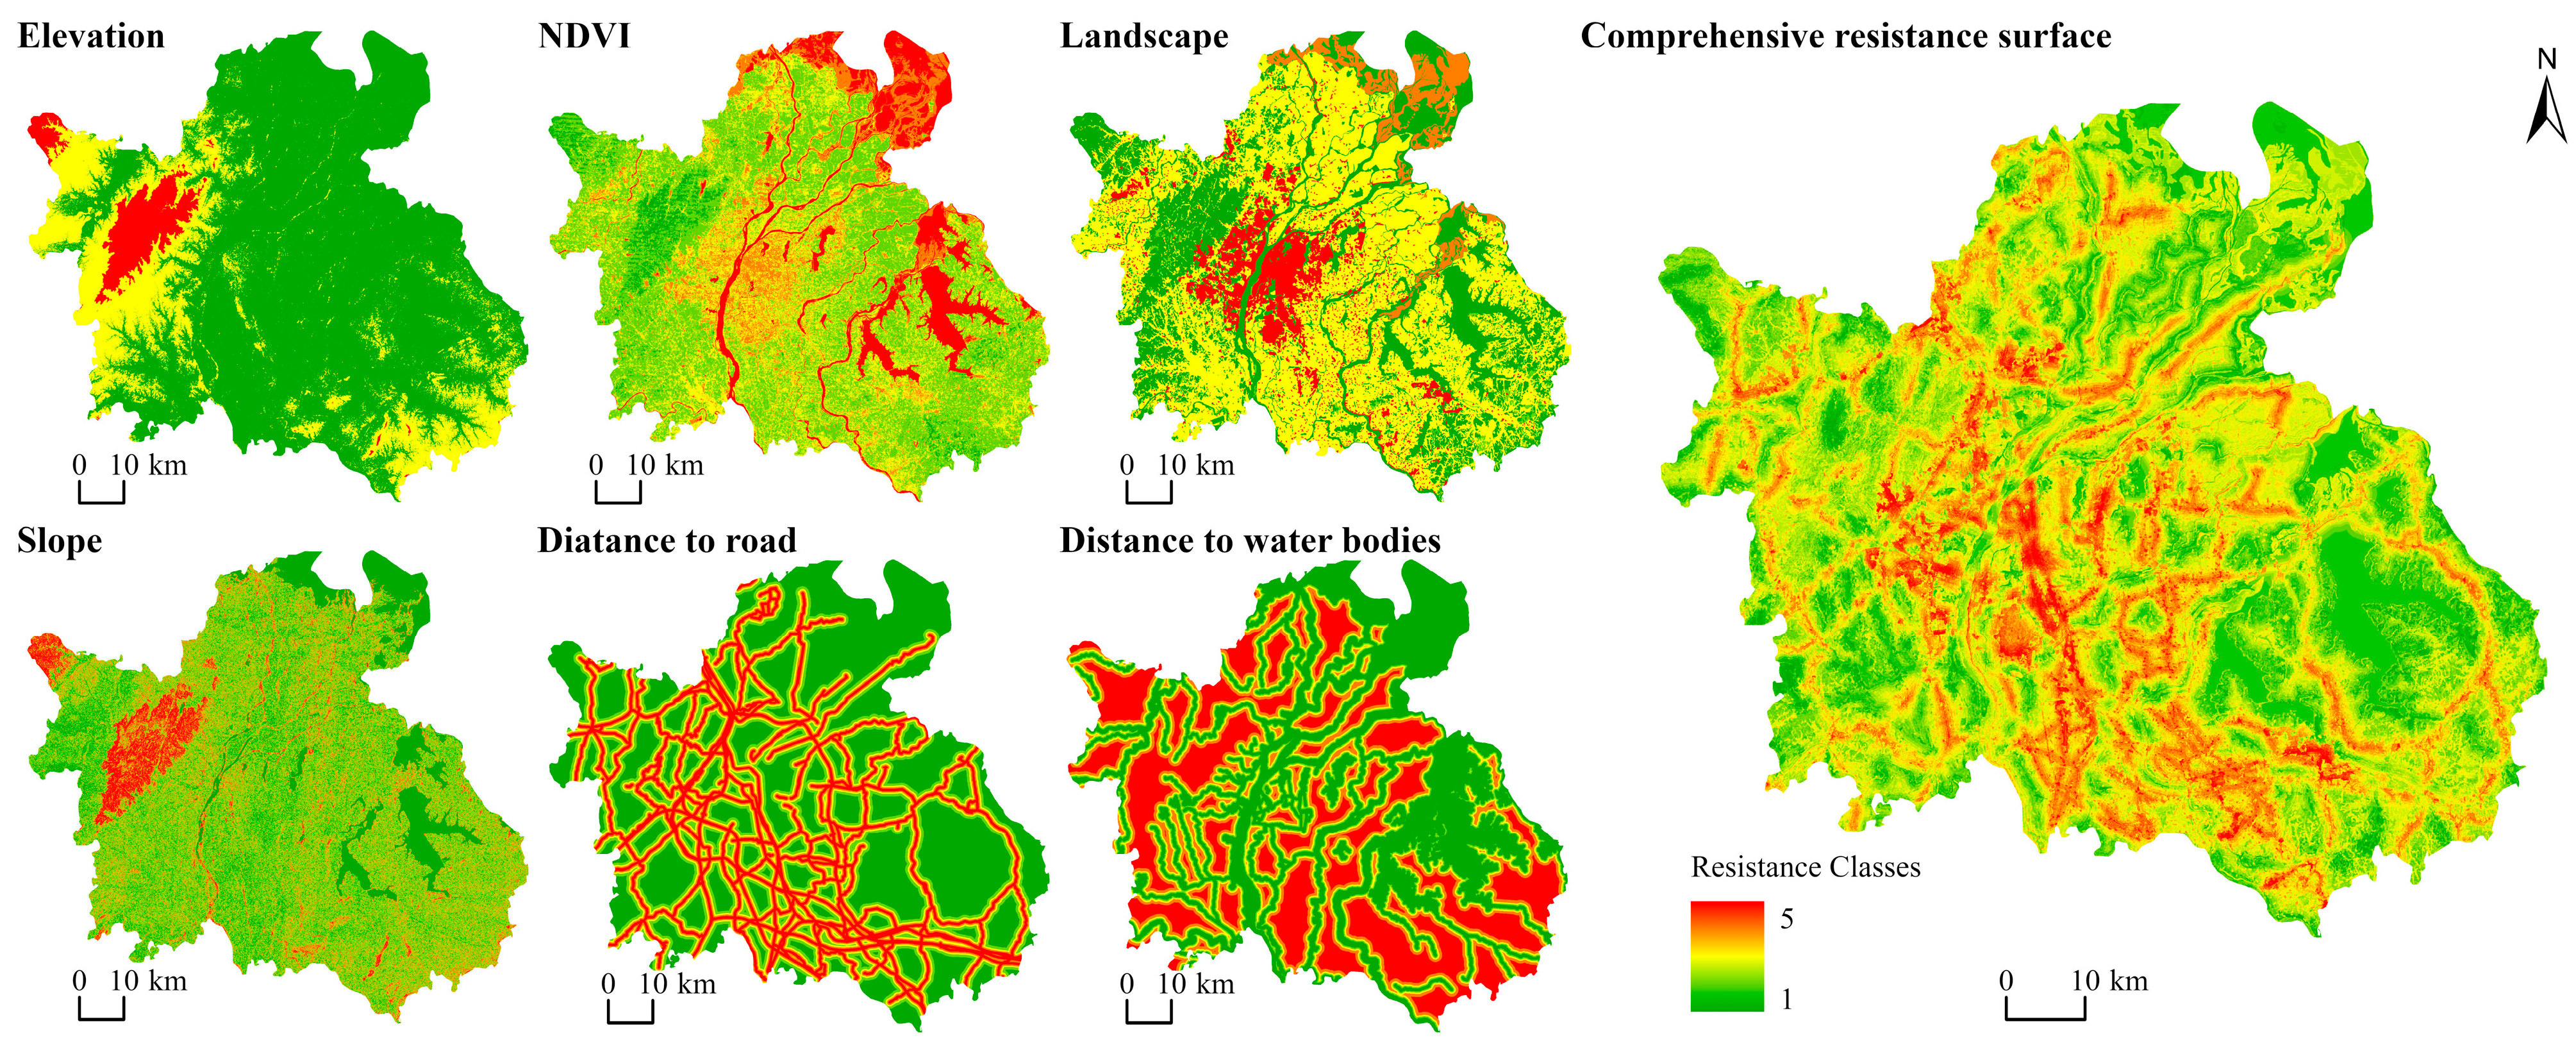
Species migration is constrained by multiple factors, including topography, landscape structure, and anthropogenic disturbances [51]. The ecological resistance surface represents the spatial heterogeneity of barriers to species movement across ecological landscapes [52]. Based on relevant literature [53,54] and considering the specific characteristics and data availability of the study area [55], six resistance factors were selected: elevation, slope, landscape elements, distances to roads, distances to water bodies, and NDVI. These factors were used to construct an ecological resistance index system and to generate a comprehensive resistance surface (Figure 4). Five experts in geography and ecology were invited to score each resistance factor, where higher scores indicate stronger resistance to species movement. The scores were subsequently weighted and standardized to derive the final resistance factor weights (Table 2). The Raster Calculator tool in ArcGIS was applied to overlay the weighted raster layers of each resistance factor, thereby generating the comprehensive ecological resistance surface for Nanchang.
Extract the Ecological Corridor
ECs are essential components of regional ecological networks. These corridors connect discrete ecological source areas and are typically defined as least-cost pathways between pairs of sources [56]. In this study, ECs were delineated using the MCR model to identify least-cost pathways that connect ecological source areas [57,58]. The underlying principle posits that species incur ecological “costs” when moving through heterogeneous landscapes, and the path with the lowest cumulative resistance between a source and a destination is defined as an ecological corridor [59]. The geometric centroids of ecological source areas in Nanchang were designated as source points. Least-cost paths between each pair of source points were calculated, forming a network that constituted the EC system in Nanchang. ECs were delineated by modeling least-cost paths with the Linkage Mapper tool integrated into the ArcGIS 10.2 platform. A maximum cost-distance threshold of 100 km was adopted to extract ecological corridors. This value was informed by a previous study in Taiyuan [38], a second-tier provincial capital where a similar threshold was used to analyze the impact of urban expansion on ecological corridors. Given the comparable urban scale, administrative status, and level of urbanization between Taiyuan and Nanchang, the 100 km threshold is considered an appropriate reference for this study.

2.3.2. Multi-Scenario Design

Three land-use scenarios—EP, ND, and UE—were established to simulate and assess spatial land-use patterns in Nanchang by 2035 [60]. The Markov model, a probabilistic forecasting approach grounded in Markov chains, is particularly well-suited for modeling land-use change due to its memoryless property, and has been extensively employed to project future land-use patterns [61]. The transition probability matrix is expressed as follows:
V t + 1 = P i j × V t
where V t and V t + 1 denote the land-use states at times t and t + 1, respectively, and P i j denotes the transition probability from land-use type i to type j.
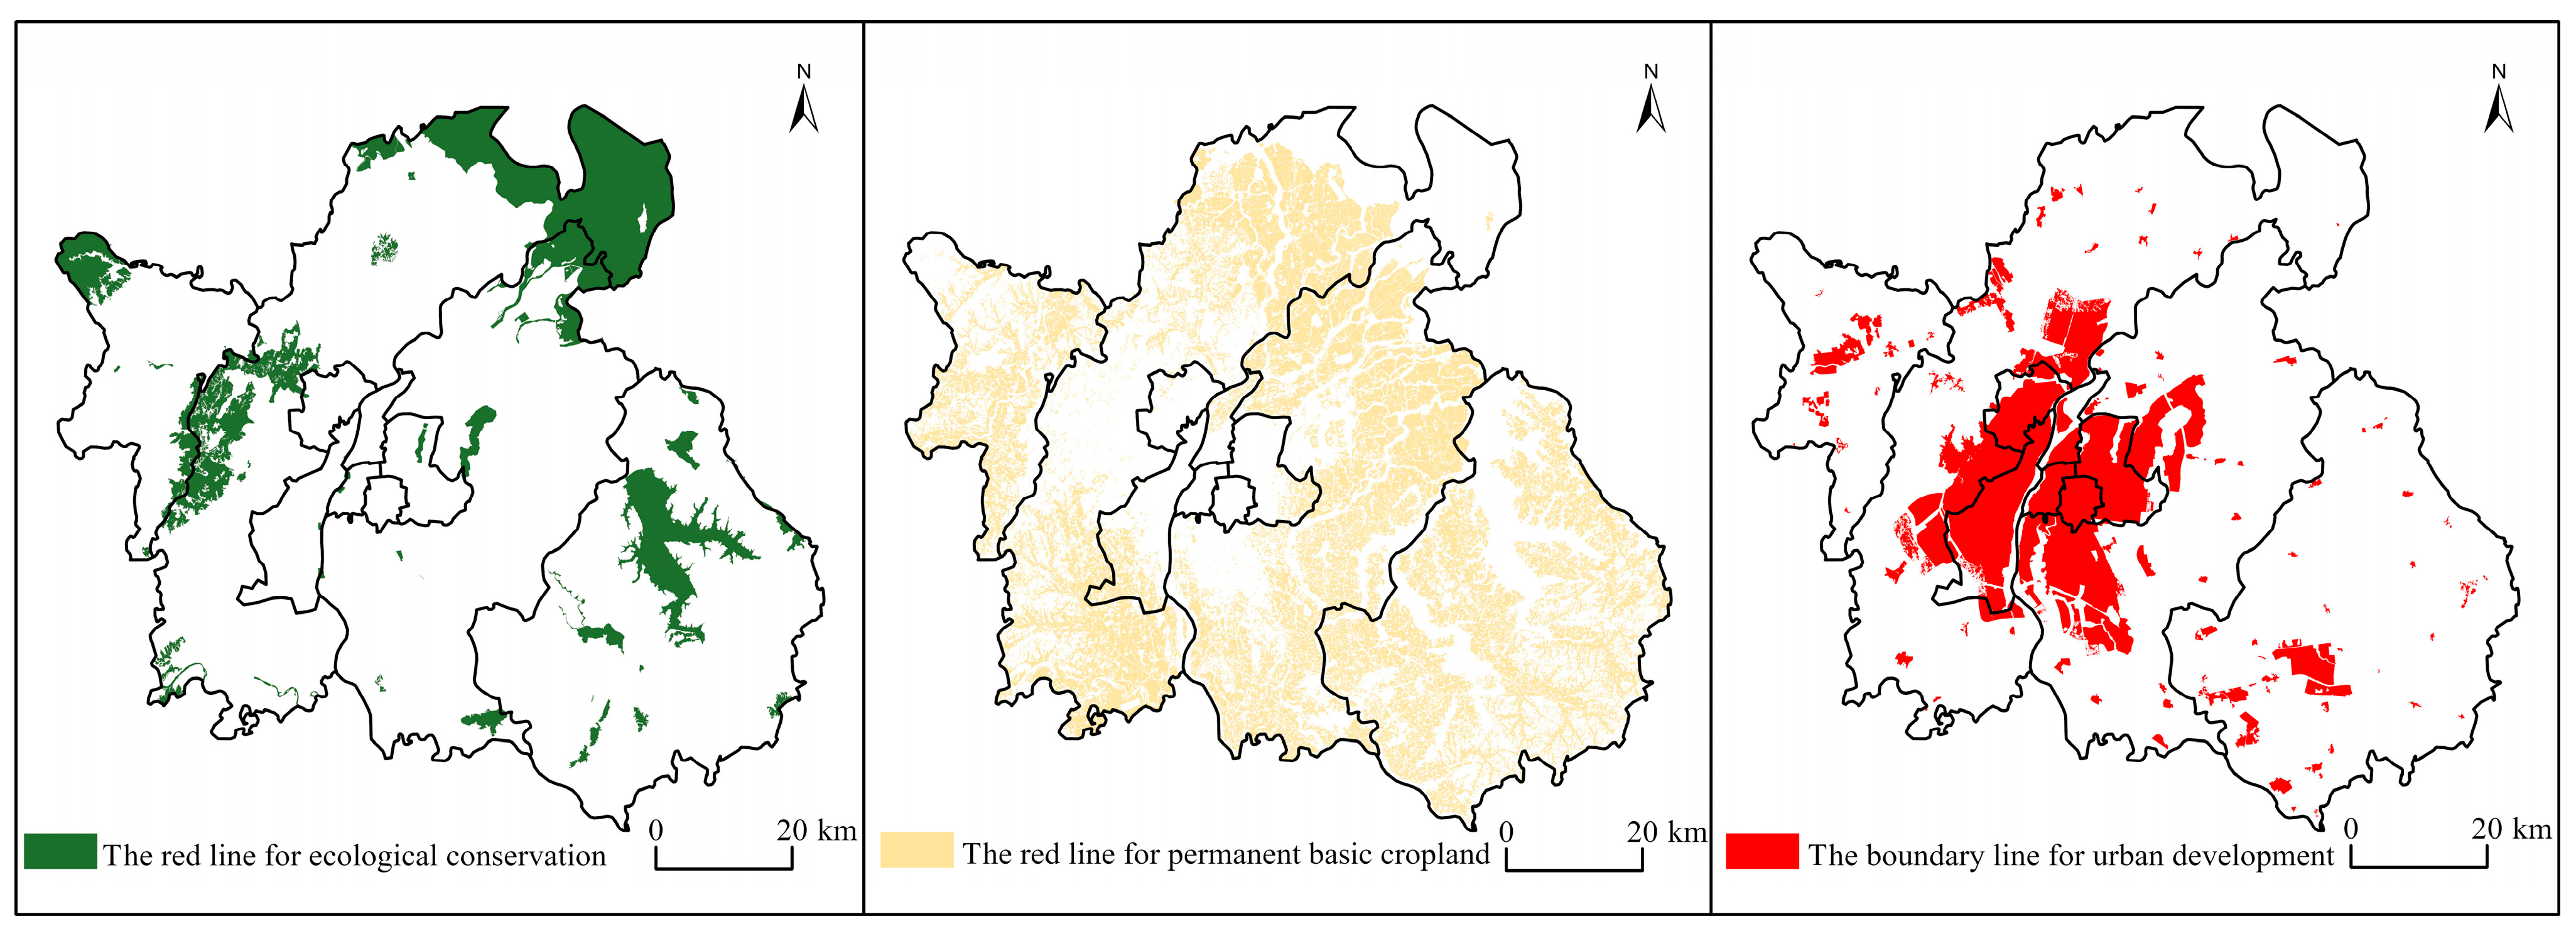
As the primary medium of human activity, land use is driven by socio-economic development and constrained by topographic features and ecological regulations. In November 2019, China’s central government issued the Guiding Opinions on the Coordinated Delineation and Implementation of the Three Control Lines in Territorial Spatial Planning, mandating the scientific delineation of three spatial control boundaries—namely, the Ecological Conservation Redline (ECR), Permanent Basic Farmland (PBF), and Urban Development Boundary (UDB)—hereinafter referred to as the “Three control lines”.
The ECR refers to a legally binding spatial planning tool in China that designates critical ecological zones where human activities are strictly regulated or prohibited [62].
The PBF denotes arable land under permanent and special protection to ensure national food security and the supply of essential agricultural products, which, in principle, must be existing cultivated land [62].
The UDB defines the boundary within which urban development activities are concentrated during a specific planning period, typically encompassing cities, towns, and designated development zones [62].
The delineation of these control lines facilitates the coordination of spatial demands for both development and ecological protection.
Accordingly, a transformation-restricted zone was delineated based on these constraints (Figure 5), serving as the setting for EP scenario in this study. In addition, drawing on previous studies [63,64], two comparative scenarios were established: the UE scenario and the ND (baseline) scenario. The specific scenario settings and associated land-use transition rules are summarized in Table 3.

2.3.3. Land Use Simulation Based on PLUS Model

The PLUS model—combining the Land Expansion Analysis Strategy (LEAS) and a multi-type random-patch cellular automaton (CARS)—was used to diagnose land-use drivers and simulate patch-level transitions [32].
Twelve socio-economic and environmental driving factors were selected, considering data availability. The factors included population density, GDP per grid cell, distance to county or district administrative centers, proximity to primary, secondary, and tertiary roads, soil type, elevation, NDVI, slope, mean annual temperature, mean annual precipitation, and distance to water bodies [32,40].
Rule mining (LEAS). Land-use changes between 2000 and 2015 were extracted, and a random-forest classifier quantified the contribution of each predictor to the expansion of every land-use class.
CA simulation (CARS). A Markov module projected land-use demand for 2020. class-specific neighborhood weights—cropland 0.22, forest 0.12, grassland 0.01, water 0.14, construction 0.49, unused 0.02—were derived from the proportion of each land-use type’s contribution to total expansion during the calibration period and were subsequently used to guide spatial allocation.
Model validation. The 2020 simulation attained a Kappa coefficient of 0.891 and an overall accuracy of 0.928, indicating that the model is sufficiently robust for scenario projections to 2035 [40].

2.3.4. Cost Assessment of Ecological Corridor Construction

The fundamental strategy for constructing ECs involves restoring ecological functions in areas degraded by human activities, thereby converting these areas back into ecological land. This study adopts a cost estimation approach inspired by the methodological framework proposed by Li et al. [65], integrating statistical data and land transaction records to evaluate construction costs.
Land Categories Requiring Restoration. Forests, grasslands, and water bodies exhibit high ecological suitability and require no restoration. Unused land is limited in both area and human disturbance, and thus its restoration costs are excluded. Consequently, only farmland and construction land within ECs require ecological restoration.
Cost Components. The total cost of ecological corridor construction consists of two primary components: opportunity cost and land acquisition cost. Opportunity cost refers to the economic output lost due to converting cropland or construction land into ecological land. When cropland is converted, it ceases to be used for agricultural production, and the resulting decline in agricultural output value is regarded as its opportunity cost. Similarly, when construction land is converted into ecological land, it no longer generates economic activity from the secondary and tertiary industries, and the corresponding reduction in industrial and service output is considered its opportunity cost. Land acquisition cost represents the expenses incurred by the government for acquiring or compensating landowners during the conversion of non-ecological land into ecological land. For cropland, acquisition costs are determined based on the compensation standards issued by the Jiangxi Provincial Government. For construction land, the cost is defined as the compensation or acquisition fees required for repurposing construction land into ecological land. In this study, land transaction data from the Guoxin Real Estate Information Network were used to estimate the average transfer price of construction land across the districts and counties of Nanchang (Table 4), serving as a proxy for construction land acquisition cost.
Calculation Basis. According to the Jiangxi Provincial Statistical Yearbook, the average agricultural output value in Nanchang City is 6.13 yuan/m2. Data from the Nanchang Statistical Yearbook indicate that the average output value of the secondary and tertiary sectors is 773.44 yuan/m2. These figures represent citywide averages because official statistical data are available only at the municipal level, and spatial variation within the city is relatively minor. In contrast, land acquisition costs for cropland and construction land are assessed at the district–county scale to capture spatial heterogeneity in land prices and compensation standards across administrative regions. Table 4 summarizes the unit costs of cropland and construction land, which serve as the baseline per-unit construction costs for ECs under future multi-scenario land use.

3. Results

3.1. Spatial Distribution of ECs in Nanchang

ECs in Nanchang were identified using a cost-distance threshold of 100 km (Figure 6). The total length of the corridors is 564.01 km, encompassing an area of 997.93 km2 and accounting for approximately 13.86% of Nanchang’s total land area.
Cropland dominates the land-use composition within ECs, covering 69.42% of the total corridor area. Water bodies constitute 13.04% of the corridor area, forest land accounts for 11.03%, and construction land occupies 40.36 km2 (4.04% of the total EC area). The spatial distribution of ECs in Nanchang exhibits significant heterogeneity, with dense concentrations in the northern and southeastern regions and comparatively sparser patterns in the central and western areas.

3.2. Multi-Scenario Land Use Simulation Results of Nanchang in 2035

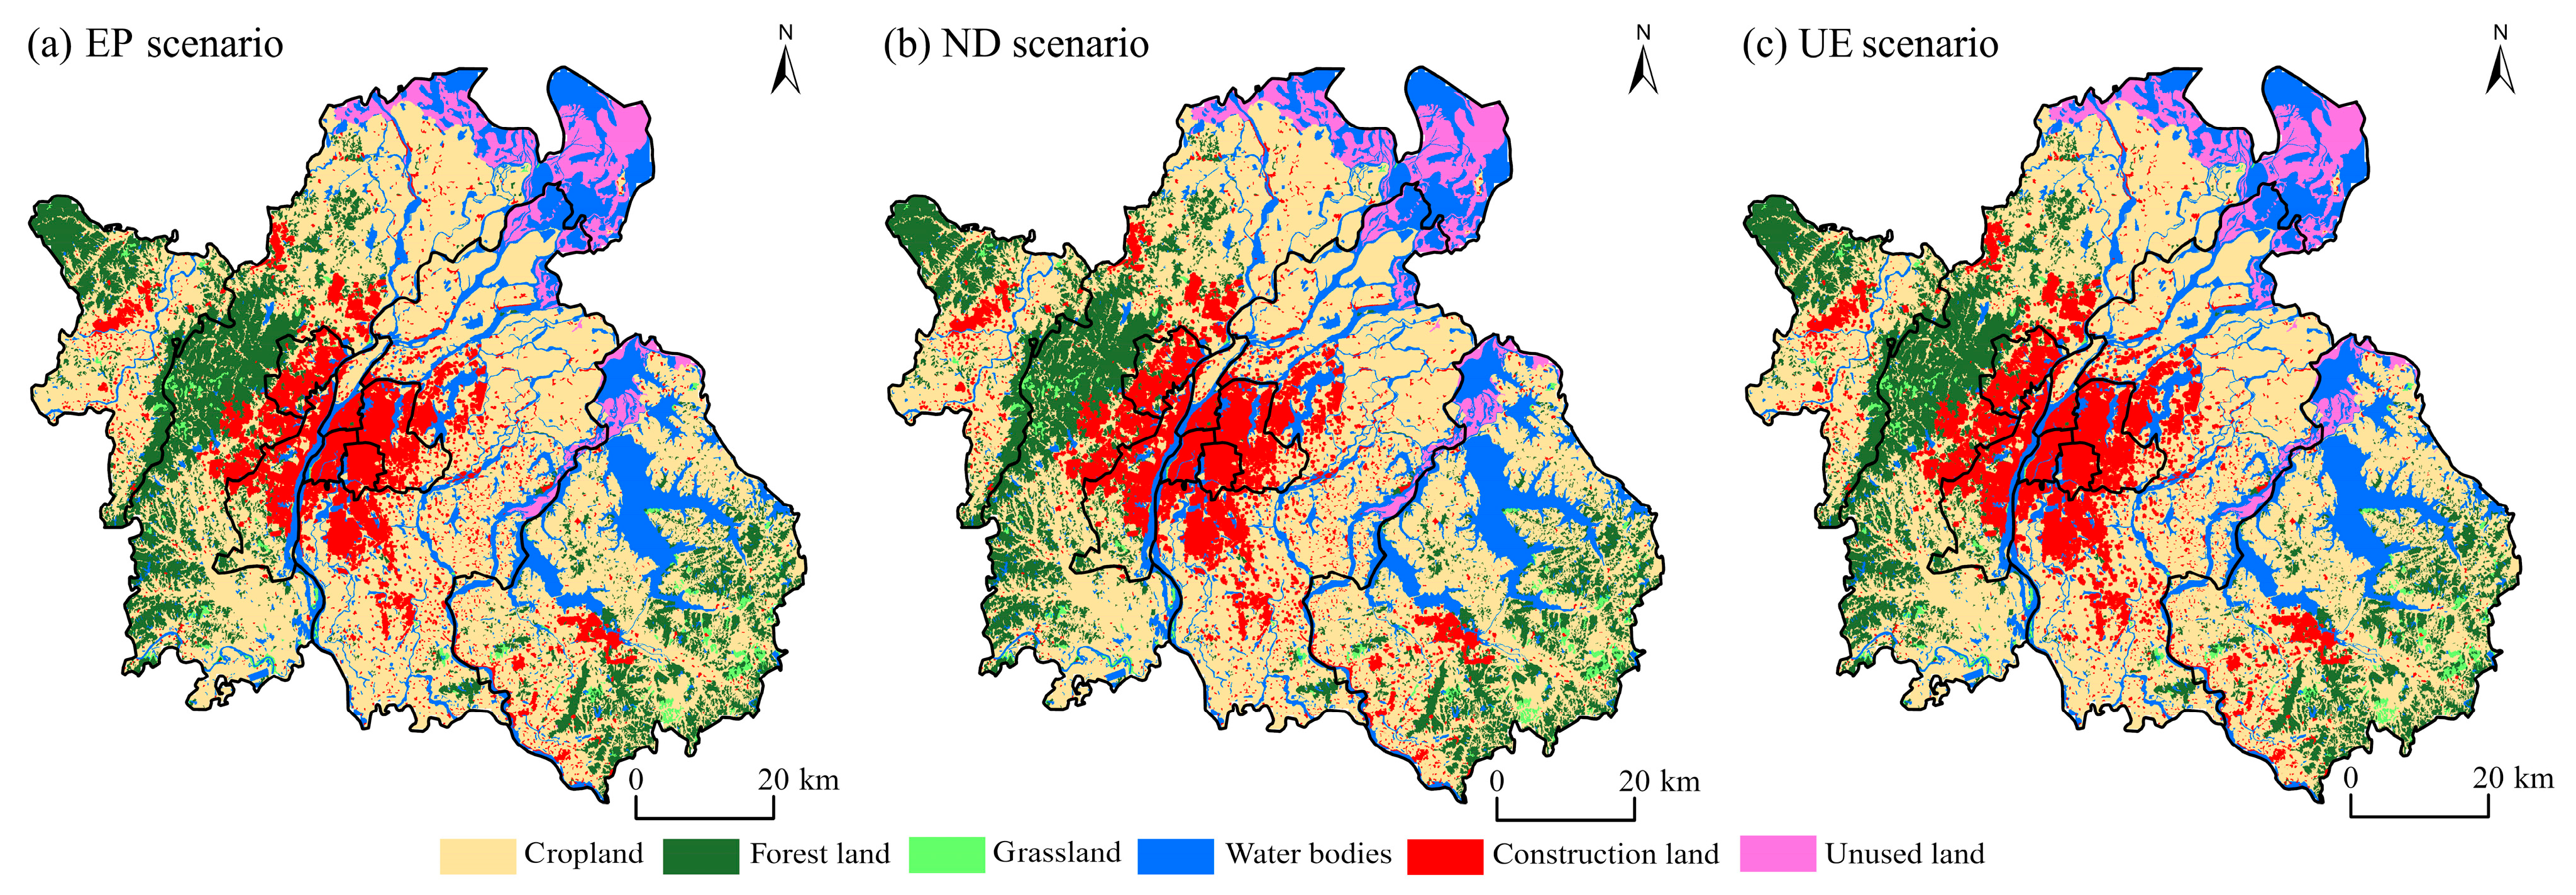
The land-use simulation results generated with the PLUS model (Figure 7 and Figure 8) indicate that the overall land use structure of Nanchang in 2035 remains similar across all simulation scenarios. Farmland, forest land, and water bodies remain the primary land-use types in Nanchang City. Across all scenarios, construction land expands, while other land-use types generally decline, with variations in the magnitude of change.
(1)
Under the EP scenario, cropland conversion is constrained, and urban expansion is limited within designated development boundaries. Water bodies experience the smallest reduction in area (0.51%), while arable land, forest land, and grassland decrease by 2.73%, 3.66%, and 2.92%, respectively. Construction land expands by 98.16 km2, representing a 13.78% increase.
(2)
In the ND scenario, forest land undergoes the largest decline (4.49%), followed by cultivated land (3.91%), grassland (3.10%), and water bodies (0.76%). Construction land increases significantly in area, with a total growth of 21.58%.
(3)
Under the UE scenario, construction land exhibits the greatest expansion, with an increase of 28.16%. In contrast, arable land, forest land, and grassland contract further.

3.3. Impact of Multi-Scenario Land Use on the Ecological Corridor

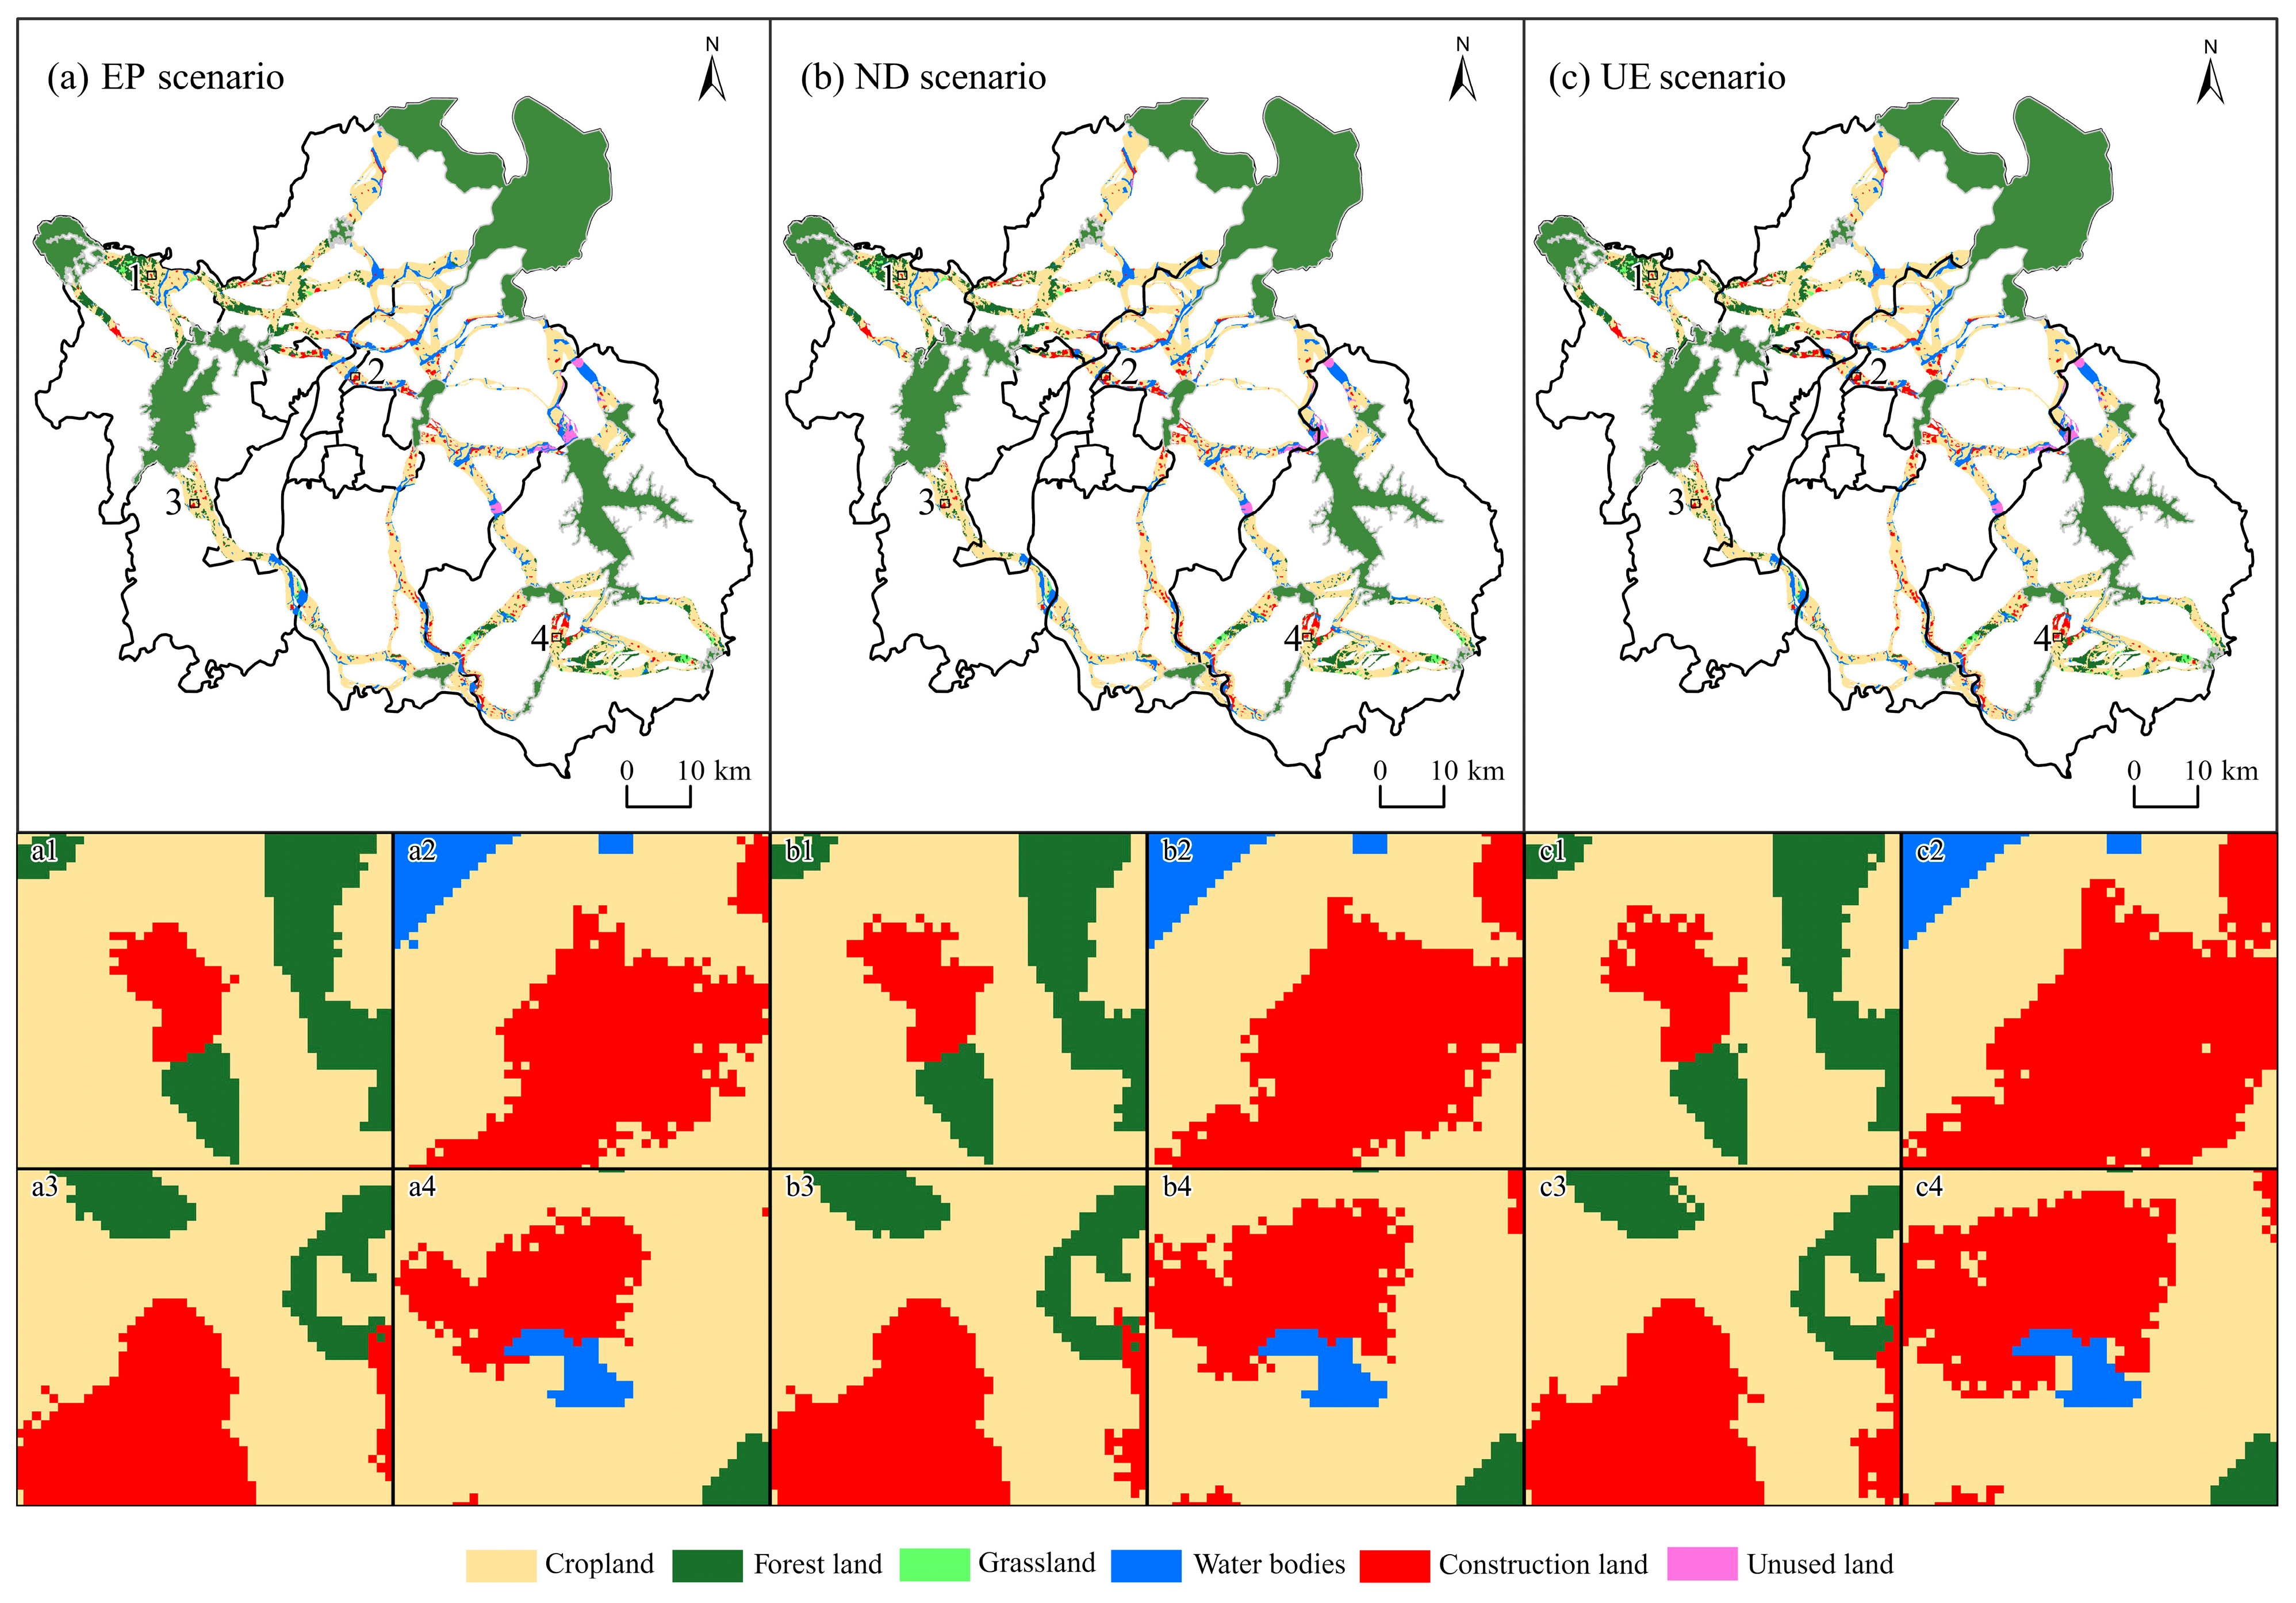
The ecological corridor distribution map of Nanchang was overlaid with simulated land-use maps for 2035 under three scenarios to derive the corresponding land-use composition within the ECs (Figure 9). In all scenarios, cropland remains the dominant land-use type within Nanchang’s ECs, accounting for more than 60% of the total corridor area. Forests and water bodies follow, each comprising approximately 10% of the corridor area, while grasslands and unused land occupy less than 2%. By contrast, construction land constitutes the smallest share and is less compatible with ecological functions.
ECs in Nanchang intersect urbanized zones, particularly in Qingshan Lake, Xinjian, Donghu, and Honggutan Districts. In these urban ECs, cropland is the dominant land-use type and is highly vulnerable to urban development pressures. Under the UE scenario, ecological land within ECs is more likely to be converted into non-ecological land uses. In contrast, under the EP scenario, land-use conversion is limited, thereby facilitating the preservation of corridor ecological functions. Statistical analysis shows that under the EP, ND, and UE scenarios, construction land accounts for 6.95%, 7.71%, and 8.39% of the ecological corridor area, respectively. Compared with the ND and UE scenarios, the EP scenario effectively limits the expansion of construction land and promotes more intensive and efficient land use.

3.4. Cost Assessment of Ecological Corridor Construction Under Multi-Scenario Land Use Simulation

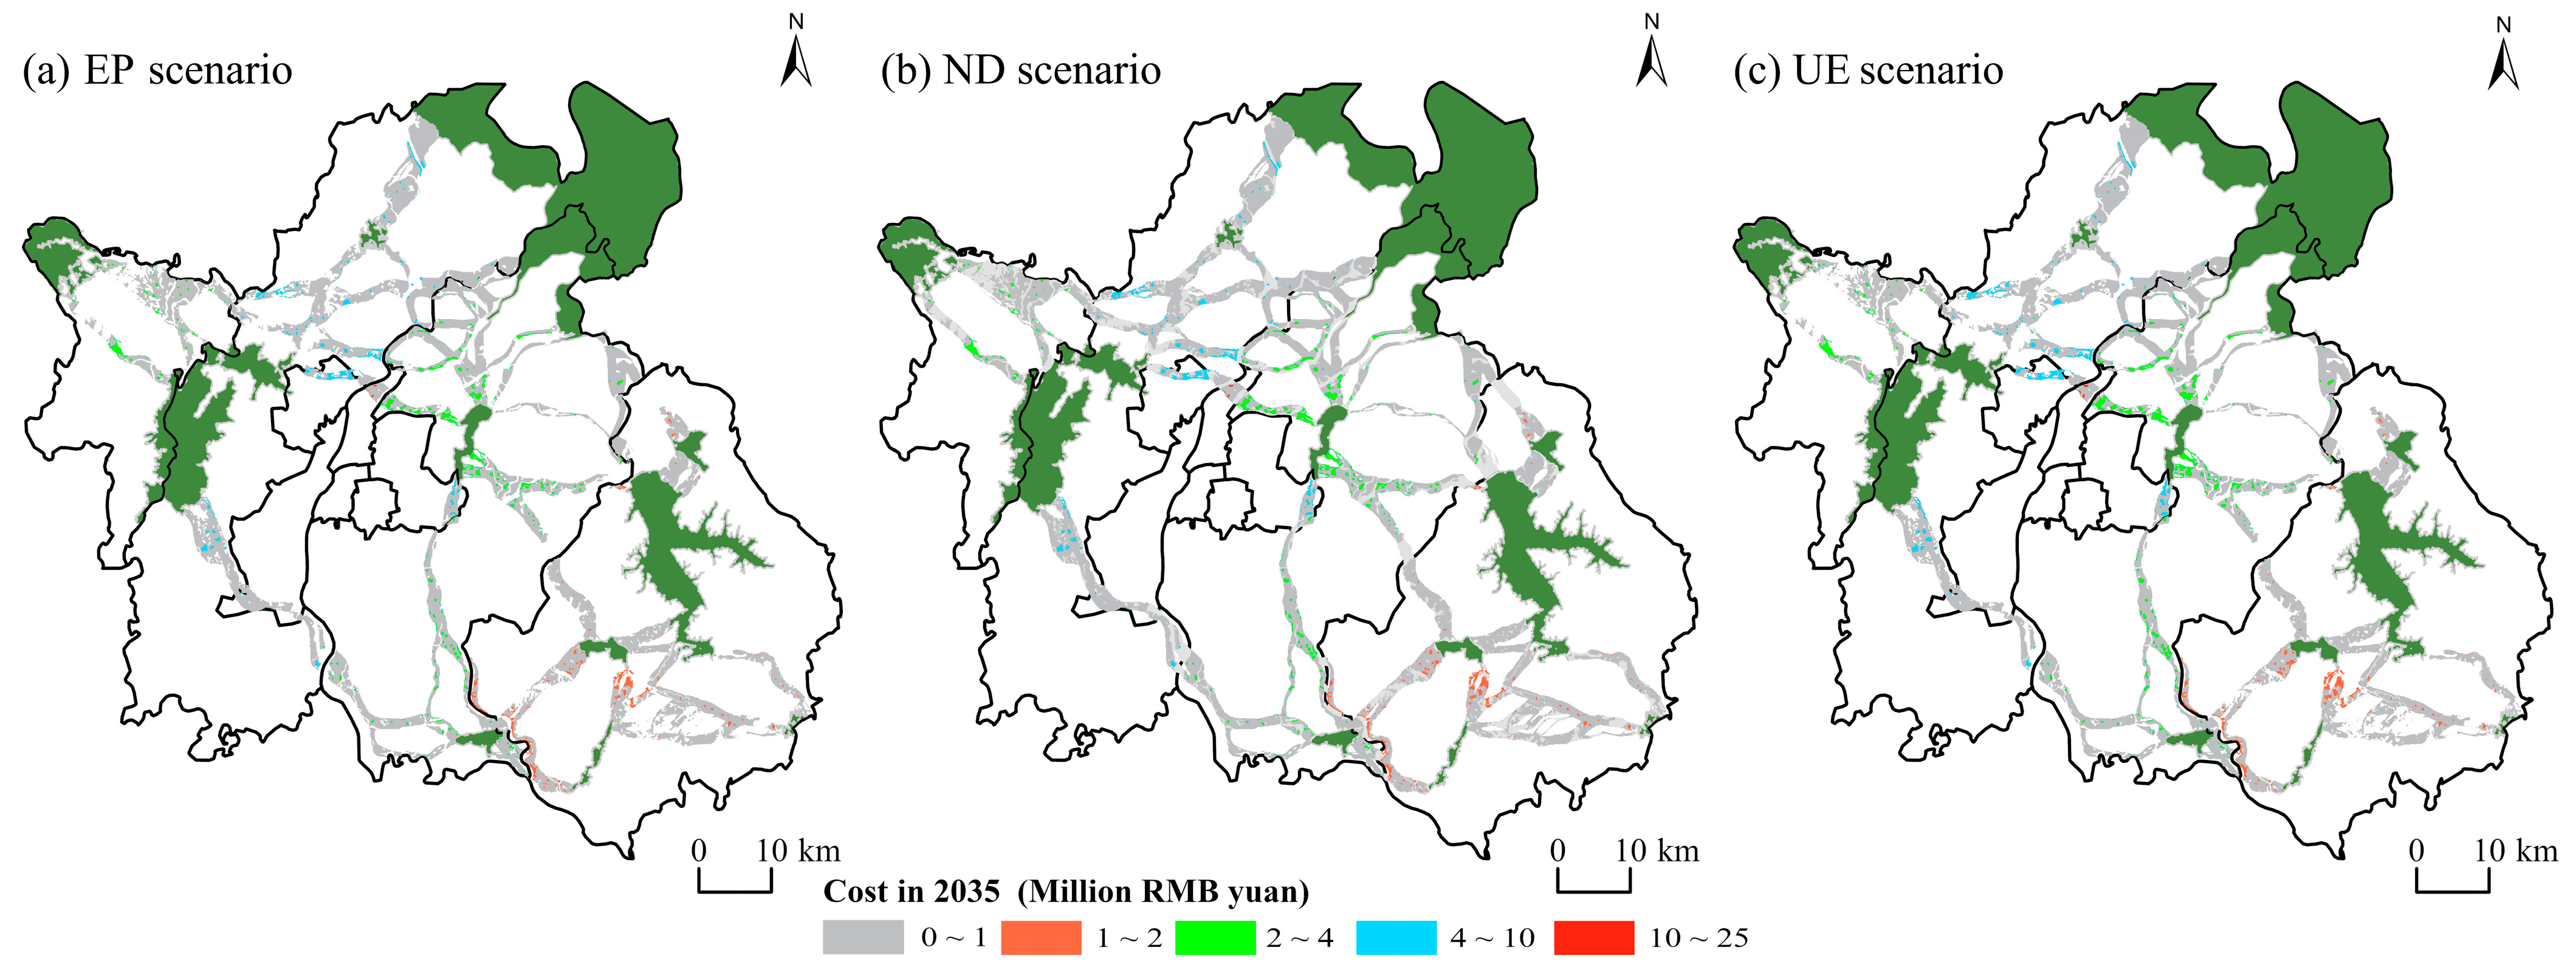
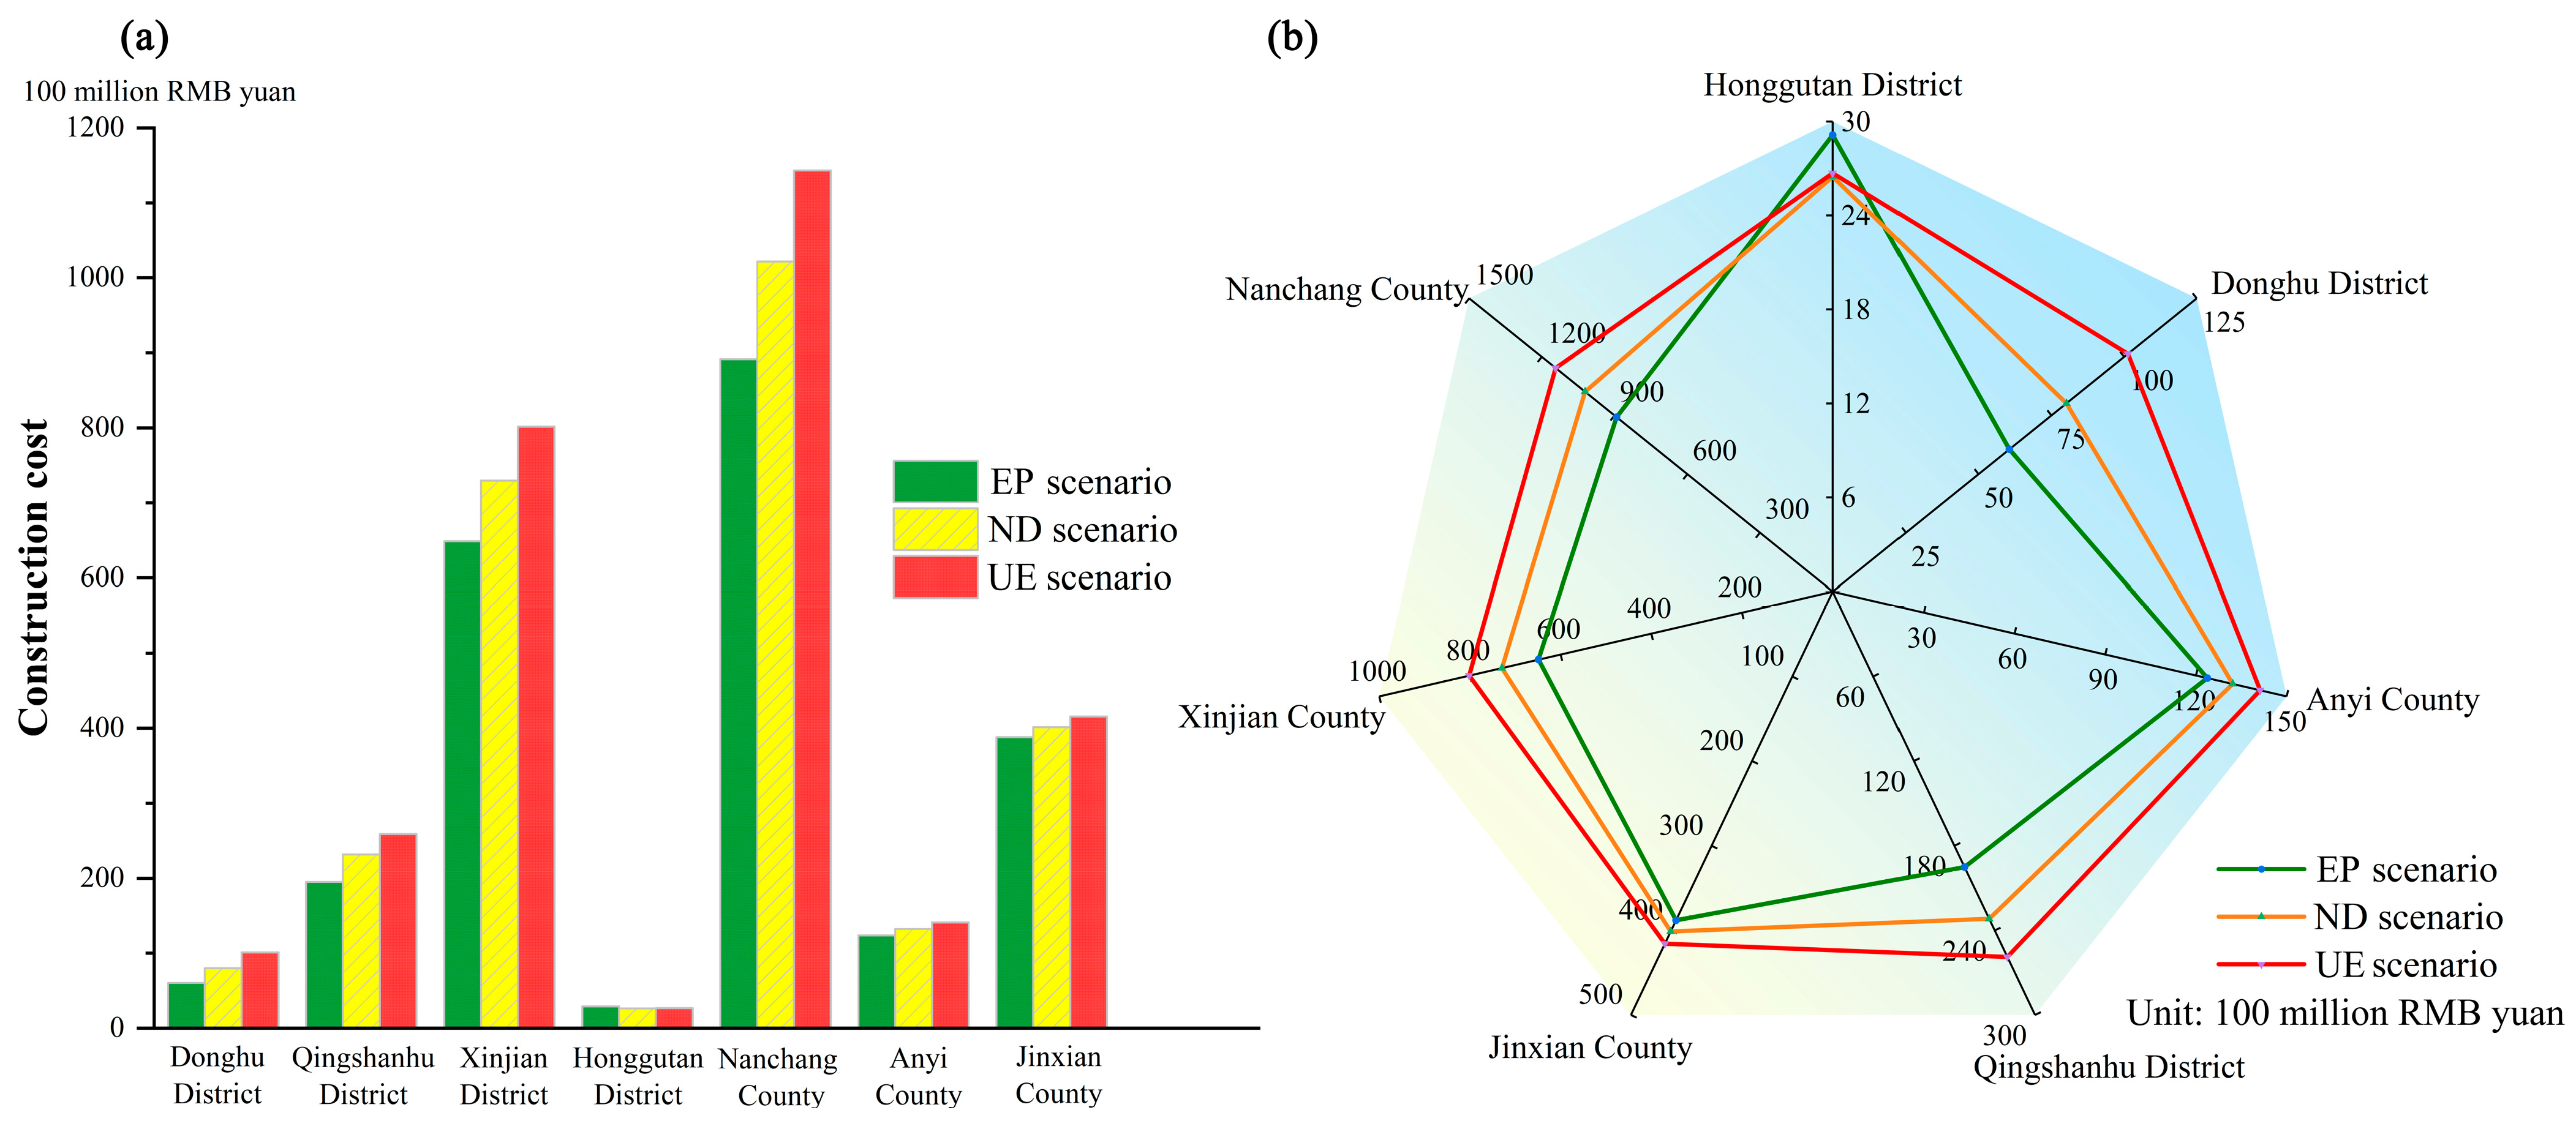
Construction land and cropland constitute the primary sources of land adjustment costs in ecological corridor construction projects; therefore, larger areas of these land types result in higher construction costs. Figure 10 illustrates the spatial distribution of ecological corridor construction costs at a 30 m × 30 m resolution. High-cost zones are primarily concentrated in urbanized areas and along major transportation corridors, where construction land predominates and secondary and tertiary industrial activities are intensive. Low-cost areas are mainly distributed in regions with unused or ecologically functional land, where minimal restoration is required. In 2035, the estimated costs under the EP, ND, and UE scenarios are 233.707, 262.354, and 288.897 billion RMB yuan, respectively. As shown in Figure 11a, the cost of ecological corridor construction in Nanchang varies significantly across development scenarios. In terms of the spatial distribution of costs across administrative units, Xihu and Qingyunpu Districts contain no ECs; thus, their associated construction costs are zero. Nanchang County, with the largest ecological corridor area and the greatest amount of construction and cropland requiring adjustment, incurs the highest construction costs—exceeding 80 billion RMB yuan under all three scenarios. Although the ecological corridor area in Jinxian County is larger than that in Xinjian District, the amount of cultivated and construction land requiring adjustment is smaller, resulting in lower adjustment costs in Jinxian. Nevertheless, the construction costs in both counties exceed 60 billion RMB yuan. A comparison of corridor construction costs across scenarios (Figure 11b) reveals that, with the exception of Honggutan District, all administrative units in Nanchang rank construction costs as follows: UE (highest) > ND > EP (lowest). In contrast, Honggutan District exhibits the opposite pattern, with the highest construction costs under the EP scenario and the lowest under the UE scenario.

4. Discussion

4.1. Comparison of Ecological Corridor Construction Costs Under Multi-Scenario Development

Land-use change is a major driver of ecological degradation and corridor fragmentation, particularly in rapidly urbanizing regions. By integrating multi-source remote sensing data, this study achieved high-accuracy land-use classification and resistance surface construction, thereby ensuring the robustness of future ecological corridor construction cost estimates.
Recent studies have highlighted the importance of combining land-use simulation with ecological assessments [66,67]. For instance, Gao et al. [40] demonstrated that ecological protection scenarios could substantially reduce ecological risks by 2025, whereas Guo et al. [41] found that integrated management scenarios significantly enhanced ecosystem service values in Changting County by 2050. However, most prior research has assessed the ecological benefits of multi-scenario land use change primarily from the perspectives of ecological risk or ecosystem service valuation [11,40,44]. This study establishes a link between scenario-based land use transitions and the costs of ecological corridor construction, thereby introducing a tangible economic dimension to the evaluation of ecological benefits. Consistent with the findings of Gao et al. [40], our results show that ecological protection scenarios yield the most favorable outcomes: in Nanchang, construction costs under the EP scenario are estimated at 233.71 billion RMB yuan, which is approximately 19% lower than those under the UE scenario (288.90 billion RMB yuan), with the ND scenario falling in between (262.35 billion RMB yuan).
In summary, these findings not only validate the “Three Control Lines” strategy as an effective tool for promoting rational land use and reducing ecological restoration costs, but also highlight the economic rationale for incorporating ecological security into territorial spatial planning. Furthermore, given that ecological corridors in urban areas are highly susceptible to human disturbance, natural hazards, and development pressures [47], assessing construction costs under multiple land-use scenarios provides a rational economic perspective for strengthening corridor protection and ensuring the long-term stability of regional ecological functions.

4.2. Diversity in Scenario Selection

Although the EP scenario achieves lower construction costs at the city scale, not all regions exhibit this pattern. Gao et al. [40] also noted that a uniform ecological protection strategy does not always minimize ecological risks in every area. Our results align with this perspective: in Honggutan District—a newly developed urban area of Nanchang—the EP scenario incurs the highest corridor construction costs, while the UE scenario produces the lowest.
This divergence underscores the importance of regional heterogeneity in natural and socio-economic endowments. In newly urbanizing districts such as Honggutan, high land values substantially increase the financial burden of ecological conservation. Conversely, in peri-urban or rural districts, ecological resources are more abundant, land values are lower, and conservation measures align with existing land-use patterns, resulting in substantially lower costs for corridor establishment. These findings show that minimizing future ecological restoration costs cannot be achieved through a uniform development pattern across Nanchang. Therefore, land-use planning and urban design should not adhere to a single scenario but should instead account for the specific development conditions of each district and adopt differentiated strategies. In densely populated, older urban districts and areas with significant ecological value, efforts should focus on maximizing ecological benefits. In contrast, newly developed urban districts offer spatial opportunities for economic growth, where the appropriate expansion of construction land can be accommodated.

4.3. Implications for Corridor Construction and Management

Based on the spatial distribution of ECs, projected construction costs across administrative units, and the current development status of each area, several management implications emerge. First, the results highlight the need to move beyond uniform ecological protection frameworks toward spatially differentiated management zoning, which can better balance ecological integrity with urban expansion pressures.
(1) In Nanchang County and Xinjian District, where ECs are more densely distributed and ecological resistance is relatively low, efforts should prioritize optimizing and enhancing the quality of existing corridor. (2) In Jinxian County, where dense water networks intersect with fragmented ecological sources, corridor planning should emphasize shoreline protection and habitat restoration in overlapping areas to maintain corridor functionality. (3) In Anyi County, where ECs traverse higher elevations and complex terrain, priority should be given to maintaining natural connectivity and minimizing anthropogenic disturbance. (4) In the main urban area, Honggutan District—designated for new urban expansion—a balanced approach is needed to reconcile development with ecological protection. In Qingshan Lake and Donghu Districts, where ECs intersect with transportation infrastructure, urban facilities such as roads should be planned to minimize interference with ECs. In Xihu and Qingyunpu Districts, which currently lack ECs, the development of urban greenbelts could help establish regional ecological networks and support species migration.
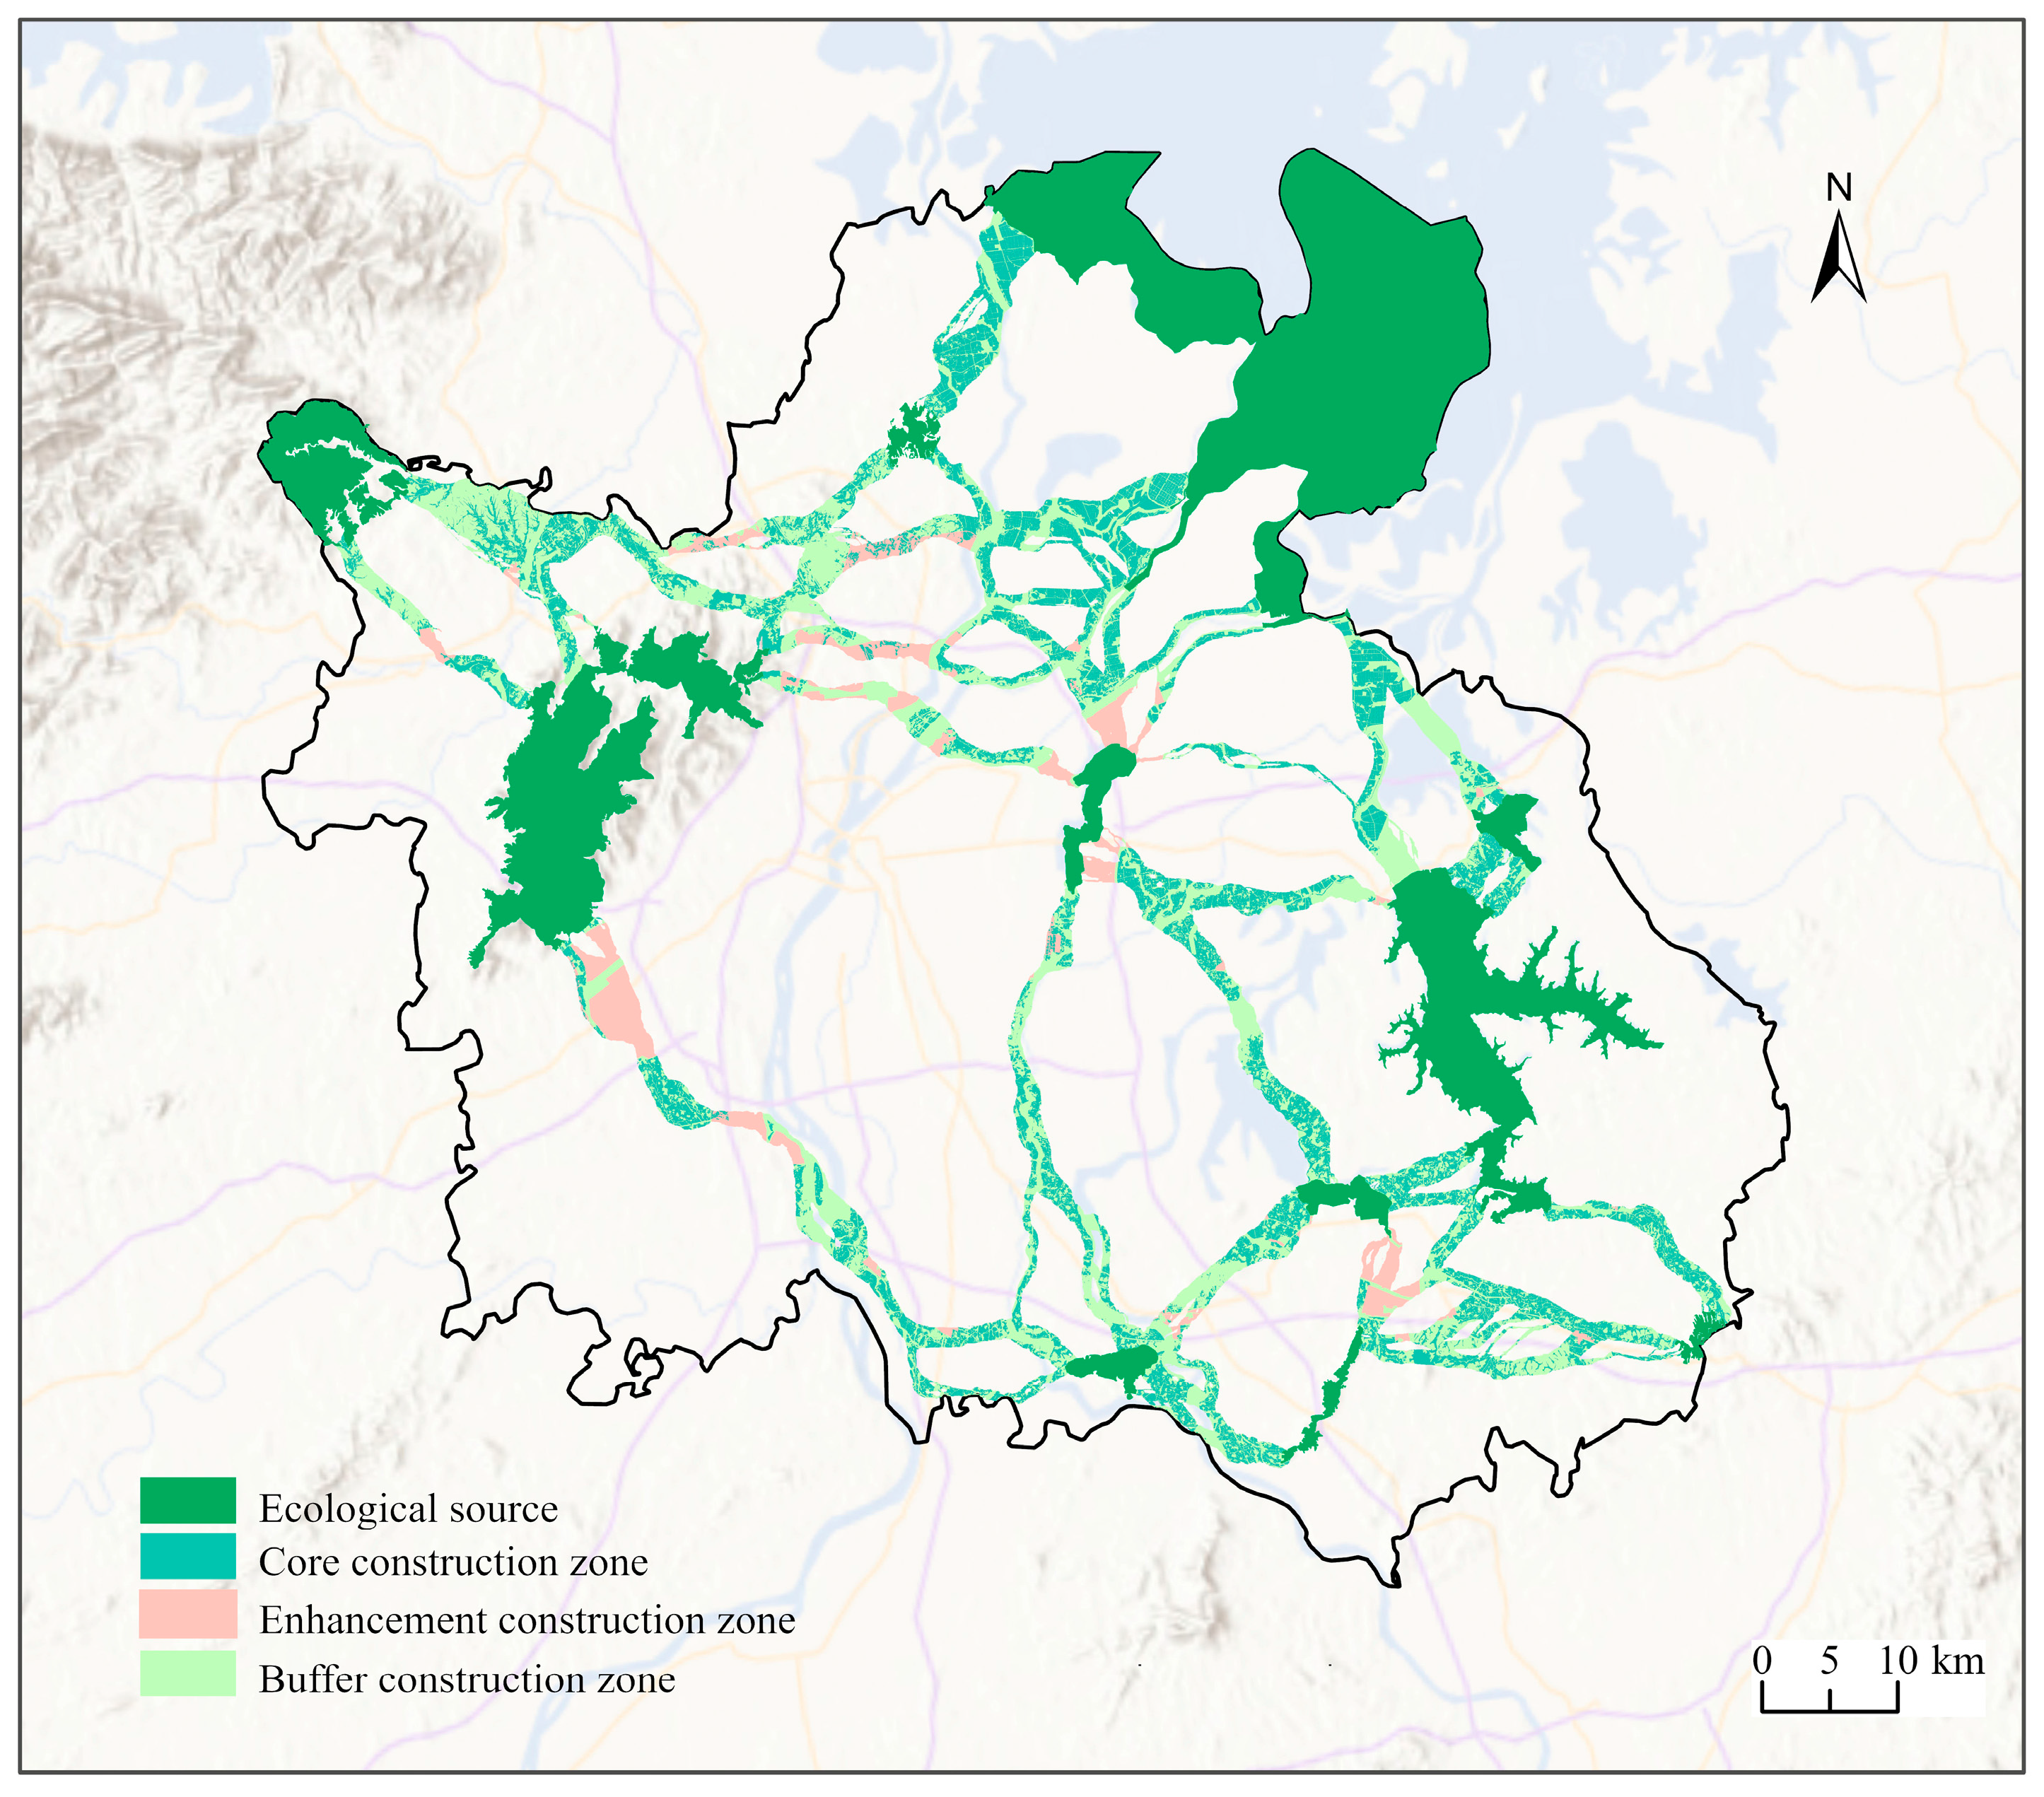
To guide practical planning, this study integrates Nanchang’s ecological redlines, permanent basic farmland, and urban development boundaries to establish an ecological corridor management zoning aligned with urban planning (Figure 12), aimed at promoting sustainable urban development.
Core Construction Zones: Corridors are located within areas designated as permanent basic farmland or ecological redlines. These areas are critical to maintaining core ecological functions and should be strictly protected, with new development generally prohibited.
Buffer Construction Zones: Corridors located outside the urban development boundary should be prioritized for ecological restoration and low-intensity land use.
Enhancement Construction Zones: For corridors situated within the urban development boundary, green infrastructure—such as greenbelts, rooftop vegetation, and ecological parks—should be implemented to enhance landscape connectivity.

4.4. Limitations of the Study and Future Work

This study established an analytical framework consisting of ecological corridor identification, land-use simulation, and ecological corridor construction cost assessment. It identified key ECs in Nanchang, simulated land-use patterns for 2035 under three development scenarios, and evaluated the associated construction costs. The findings provide valuable spatial guidance for ecological planning in Nanchang, contributing to the mitigation of regional ecological risks and supporting high-quality urban development. However, several limitations should be acknowledged. First, the cost estimates for 2035 were based on 2020 price levels for agricultural products and land acquisition, owing to uncertainties in future economic and policy conditions. These static price assumptions may introduce bias into the predicted construction costs of ECs, as future prices are likely to fluctuate with economic and policy changes. Second, the width of ECs in this study was based on Hou et al. [38], which applied a cost-distance threshold of 100 km for corridor delineation. Future research could further enhance the analysis by explicitly examining the optimal corridor width for ecological construction.

5. Conclusions

This study develops an analytical framework integrating ecological corridor identification, land-use simulation, and ecological corridor construction cost assessment. The study meets its objectives by mapping the spatial distribution of ecological corridors, simulating future land-use patterns under multiple scenarios, and quantifying the economic costs of corridor construction in the EP, ND, and UE scenarios. The main conclusions are as follows:
(1)
Ecological corridors exhibit pronounced spatial heterogeneity, with dense concentrations in the ecologically rich northern and southeastern regions, whereas the highly urbanized central core shows a sparse distribution.
(2)
By 2035, the overall land-use structure in Nanchang City is projected to remain generally similar across the three development scenarios. However, the magnitude of change within individual land-use categories varies considerably across scenarios.
(3)
Significant differences in total construction costs are observed among the three scenarios, with the EP scenario producing the lowest overall cost and the UE scenario yielding the highest expenditure. These results underscore the effectiveness of ecological protection policies in supporting ecological functions.
(4)
At the district level, the EP scenario generally results in the lowest corridor construction expenditures. Notably, Honggutan District deviates from this pattern due to its high land values and substantial reserves of developable land, emphasizing the need for district-specific strategies that account for local socio-economic and ecological conditions.
Furthermore, this study delineates core zones, enhancement zones, and buffer zones for ecological corridors. Overall, this study provides a cost-oriented decision-making framework for balancing ecological protection with urban development. It offers practical guidance for strengthening ecological security and promoting sustainable urban growth.

Author Contributions

M.B.: conceptualization, data curation, formal analysis, visualization, software, writing—original draft, methodology, writing—review and editing. Y.Z.: conceptualization, funding acquisition, supervision; resources, writing—review and editing. D.G.: software, writing—review and editing. Z.X.: visualization, data curation. All authors have read and agreed to the published version of the manuscript.

Funding

This work was supported by the National Natural Science Foundation of China (Grant Nos. 42361050 and 42330108).

Data Availability Statement

The data presented in this study are cited within the article.

Acknowledgments

We appreciate the constructive suggestions and comments from the editor and anonymous reviewers.

Conflicts of Interest

The authors declare no conflicts of interest.

References

  1. Harris, L.D. The Fragmented Forest: Island Biogeography Theory and the Preservation of Biotic Diversity; University of Chicago Press: Chicago, IL, USA, 1984; pp. 153–170. [Google Scholar]
  2. Zhu, M.; Zhu, D.; Huang, M.; Gong, D.; Li, S.; Xia, Y.; Lin, H.; Altan, O. Assessing the Impact of Climate Change on the Landscape Stability in the Mediterranean World Heritage Site Based on Multi-Sourced Remote Sensing Data: A Case Study of the Causses and Cévennes, France. Remote Sens. 2025, 17, 203. [Google Scholar] [CrossRef]
  3. Bai, X.; Shi, P.; Liu, Y. Society: Realizing China’s urban dream. Nature 2014, 509, 158–160. [Google Scholar] [CrossRef] [PubMed]
  4. Gong, D.; Dong, D.; Du, H.; Zhou, Y.; Fu, S.; Fujioka, Y. Spatiotemporal coupling mechanisms and driving forces of ecosystem services and human activity from a multidimensional perspective. Int. J. Digit. Earth 2025, 18, 2512061. [Google Scholar] [CrossRef]
  5. Liu, Y.; Fang, F.; Li, Y. Key issues of land use in China and implications for policy making. Land Use Policy 2014, 40, 6–12. [Google Scholar] [CrossRef]
  6. Huang, M.; Zhong, S.; Ge, Y.; Lin, H.; Chang, L.; Zhu, D.; Zhang, L.; Xiao, C.; Altan, O. Evaluating the Performance of SDGSAT-1 GLI Data in Urban Built-up Area Extraction from the Perspective of Urban Morphology and City Scale: A Case Study of 15 Cities in China. IEEE J. Sel. Top. Appl. Earth Obs. Remote Sens. 2025, 18, 17166–17180. [Google Scholar] [CrossRef]
  7. Long, H.; Qu, Y. Land use transitions and land management: A mutual feedback perspective. Land Use Policy 2018, 74, 111–120. [Google Scholar] [CrossRef]
  8. Haddad, N.M.; Brudvig, L.A.; Clobert, J.; Davies, K.F.; Gonzalez, A.; Holt, R.D.; Lovejoy, T.E.; Sexton, J.O.; Austin, M.P.; Collins, C.D. Habitat fragmentation and its lasting impact on Earth’s ecosystems. Sci. Adv. 2015, 1, e1500052. [Google Scholar] [CrossRef]
  9. McKinney, M.L. Urbanization, biodiversity, and conservation: The impacts of urbanization on native species are poorly studied, but educating a highly urbanized human population about these impacts can greatly improve species conservation in all ecosystems. Bioscience 2002, 52, 883–890. [Google Scholar] [CrossRef]
  10. Sun, H.; Huang, M.; Lin, H.; Ge, Y.; Zhu, D.; Gong, D.; Altan, O. Spatiotemporal dynamics of ecological environment quality in arid and sandy regions with a particular remote sensing ecological index: A study of the Beijing-Tianjin Sand source region. Geo-Spat. Inf. Sci. 2025, 1–20. [Google Scholar] [CrossRef]
  11. Yang, S.; Zhao, W.; Liu, Y.; Wang, S.; Wang, J.; Zhai, R. Influence of land use change on the ecosystem service trade-offs in the ecological restoration area: Dynamics and scenarios in the Yanhe watershed, China. Sci. Total Environ. 2018, 644, 556–566. [Google Scholar] [CrossRef]
  12. Wang, S.; Wu, M.; Hu, M.; Fan, C.; Wang, T.; Xia, B. Promoting landscape connectivity of highly urbanized area: An ecological network approach. Ecol. Indic. 2021, 125, 107487. [Google Scholar] [CrossRef]
  13. Song, M.; Li, S.; Paudel, B.; Pan, F. A Framework for Multifunctional Green Infrastructure Planning Based on Ecosystem Service Synergy/Trade-Off Analysis: Application in the Qinling–Daba Mountain Area. Land 2025, 14, 1287. [Google Scholar] [CrossRef]
  14. Zhao, S.-M.; Ma, Y.-F.; Wang, J.-L.; You, X.-Y. Landscape pattern analysis and ecological network planning of Tianjin City. Urban For. Urban Green. 2019, 46, 126479. [Google Scholar] [CrossRef]
  15. Bascompte, J. Structure and dynamics of ecological networks. Science 2010, 329, 765–766. [Google Scholar] [CrossRef] [PubMed]
  16. Jongman, R. Landscape planning for biological diversity in Europe. Landsc. Res. 2002, 27, 187–195. [Google Scholar] [CrossRef]
  17. An, Y.; Liu, S.; Sun, Y.; Shi, F.; Zhao, S. Negative effects of farmland expansion on multi-species landscape connectivity in a tropical region in Southwest China. Agric. Syst. 2020, 179, 102766. [Google Scholar] [CrossRef]
  18. Shi, F.; Liu, S.; Sun, Y.; An, Y.; Zhao, S.; Liu, Y.; Li, M. Ecological network construction of the heterogeneous agro-pastoral areas in the upper Yellow River basin. Agric. Ecosyst. Environ. 2020, 302, 107069. [Google Scholar] [CrossRef]
  19. Mo, W.; Wang, Y.; Zhang, Y.; Zhuang, D. Impacts of road network expansion on landscape ecological risk in a megacity, China: A case study of Beijing. Sci. Total Environ. 2017, 574, 1000–1011. [Google Scholar] [CrossRef]
  20. Blaschke, T. The role of the spatial dimension within the framework of sustainable landscapes and natural capital. Landsc. Urban Plan. 2006, 75, 198–226. [Google Scholar] [CrossRef]
  21. Costanza, J.K.; Terando, A.J. Landscape connectivity planning for adaptation to future climate and land-use change. Curr. Landsc. Ecol. Rep. 2019, 4, 1–13. [Google Scholar] [CrossRef]
  22. Kremen, C.; Merenlender, A.M. Landscapes that work for biodiversity and people. Science 2018, 362, eaau6020. [Google Scholar] [CrossRef] [PubMed]
  23. LaPoint, S.; Gallery, P.; Wikelski, M.; Kays, R. Animal behavior, cost-based corridor models, and real corridors. Landsc. Ecol. 2013, 28, 1615–1630. [Google Scholar] [CrossRef]
  24. Peng, J.; Zhao, H.; Liu, Y. Urban ecological corridors construction: A review. Acta Ecol. Sin. 2017, 37, 23–30. [Google Scholar] [CrossRef]
  25. Toccolini, A.; Fumagalli, N.; Senes, G. Greenways planning in Italy: The Lambro River Valley greenways system. Landsc. Urban Plan. 2006, 76, 98–111. [Google Scholar] [CrossRef]
  26. Jim, C.Y.; Chen, S.S. Comprehensive greenspace planning based on landscape ecology principles in compact Nanjing city, China. Landsc. Urban Plan. 2003, 65, 95–116. [Google Scholar] [CrossRef]
  27. Kong, F.; Yin, H.; Nakagoshi, N.; Zong, Y. Urban green space network development for biodiversity conservation: Identification based on graph theory and gravity modeling. Landsc. Urban Plan. 2010, 95, 16–27. [Google Scholar] [CrossRef]
  28. Dang, H.; Lü, Y.; Guo, J.; Wu, X. Multi-scenario simulation can contribute to identify priorities for regional ecological corridors conservation. Ecol. Indic. 2024, 165, 112166. [Google Scholar] [CrossRef]
  29. Cui, L.; Wang, J.; Sun, L.; Lv, C. Construction and optimization of green space ecological networks in urban fringe areas: A case study with the urban fringe area of Tongzhou district in Beijing. J. Clean. Prod. 2020, 276, 124266. [Google Scholar] [CrossRef]
  30. Liu, X.; Li, X.; Li, Y. Construction and optimization of ecological network in rapidly urbanized area: A case study of Daxing District, Beijing. Acta Ecol. Sin. 2023, 43, 8321–8331. [Google Scholar] [CrossRef]
  31. Wang, H.; Niu, H.; Song, M.; Zhang, B.; Jin, Y. Construction and spatial optimization of ecological network in Shanxi Province based on LUCC and its ESV response. Resour. Sci. 2023, 45, 1380–1395. [Google Scholar] [CrossRef]
  32. Xu, X.; Wang, S.; Rong, W. Construction of ecological network in Suzhou based on the PLUS and MSPA models. Ecol. Indic. 2023, 154, 110740. [Google Scholar] [CrossRef]
  33. Li, Y.-Y.; Zhang, Y.-Z.; Jiang, Z.-Y.; Guo, C.-X.; Zhao, M.-Y.; Yang, Z.-G.; Guo, M.-Y.; Wu, B.-Y.; Chen, Q.-L. Integrating morphological spatial pattern analysis and the minimal cumulative resistance model to optimize urban ecological networks: A case study in Shenzhen City, China. Ecol. Process. 2021, 10, 1–15. [Google Scholar] [CrossRef]
  34. Wang, T.; Li, H.; Huang, Y. The complex ecological network’s resilience of the Wuhan metropolitan area. Ecol. Indic. 2021, 130, 108101. [Google Scholar] [CrossRef]
  35. Balbi, M.; Petit, E.J.; Croci, S.; Nabucet, J.; Georges, R.; Madec, L.; Ernoult, A. Ecological relevance of least cost path analysis: An easy implementation method for landscape urban planning. J. Environ. Manag. 2019, 244, 61–68. [Google Scholar] [CrossRef] [PubMed]
  36. Liu, G.; Yang, Z.; Chen, B.; Zhang, L.; Zhang, Y.; Su, M. An ecological network perspective in improving reserve design and connectivity: A case study of Wuyishan nature reserve in China. Ecol. Model. 2015, 306, 185–194. [Google Scholar] [CrossRef]
  37. Hong, W.; Guo, R.; Su, M.; Tang, H.; Chen, L.; Hu, W. Sensitivity evaluation and land-use control of urban ecological corridors: A case study of Shenzhen, China. Land Use Policy 2017, 62, 316–325. [Google Scholar] [CrossRef]
  38. Hou, W.; Zhou, W.; Li, J.; Li, C. Simulation of the potential impact of urban expansion on regional ecological corridors: A case study of Taiyuan, China. Sustain. Cities Soc. 2022, 83, 103933. [Google Scholar] [CrossRef]
  39. Wang, C.; Yu, C.; Chen, T.; Feng, Z.; Hu, Y.; Wu, K. Can the establishment of ecological security patterns improve ecological protection? An example of Nanchang, China. Sci. Total Environ. 2020, 740, 140051. [Google Scholar] [CrossRef]
  40. Gao, L.; Tao, F.; Liu, R.; Wang, Z.; Leng, H.; Zhou, T. Multi-scenario simulation and ecological risk analysis of land use based on the PLUS model: A case study of Nanjing. Sustain. Cities Soc. 2022, 85, 104055. [Google Scholar] [CrossRef]
  41. Cai, G.; Xiong, J.; Wen, L.; Weng, A.; Lin, Y.; Li, B. Predicting the ecosystem service values and constructing ecological security patterns in future changing land use patterns. Ecol. Indic. 2023, 154, 110787. [Google Scholar] [CrossRef]
  42. Zhang, S.; Shao, H.; Li, X.; Xian, W.; Shao, Q.; Yin, Z.; Lai, F.; Qi, J. Spatiotemporal dynamics of ecological security pattern of urban agglomerations in Yangtze River Delta based on LUCC simulation. Remote Sens. 2022, 14, 296. [Google Scholar] [CrossRef]
  43. Gong, D.; Huang, M.; Ge, Y.; Zhu, D.; Chen, J.; Chen, Y.; Zhang, L.; Hu, B.; Lai, S.; Lin, H. Revolutionizing ecological security pattern with multi-source data and deep learning: An adaptive generation approach. Ecol. Indic. 2025, 173, 113315. [Google Scholar] [CrossRef]
  44. Lu, H.; Qu, Y.; Liang, S.; Shi, L.; Zhang, M.; Jia, H. Spatiotemporal Differentiation of Land Ecological Security and Optimization Based on GeoSOS-FLUS Model: A Case Study of the Yellow River Delta in China Toward Sustainability. Land 2024, 13, 1870. [Google Scholar] [CrossRef]
  45. Green, A.; Sandbrook, C. Beyond connectivity: An exploration of expert perspectives on conservation corridors. Geoforum 2021, 127, 257–268. [Google Scholar] [CrossRef]
  46. Liu, Z.; Wu, W.; Liu, W.; Shen, L. Study on construction land reduction based on “Source-Corridor” ecological security pattern paradigm. Acta Ecol. Sin. 2020, 40, 8230–8238. [Google Scholar] [CrossRef]
  47. Zambrano, L.; Cano-Santana, Z.; Wegier, A.; Arroyo-Lambaer, D.; Zúñiga-Vega, J.J.; Suárez, A.; Bouchain, C.R.; Gual Sill, F.; Campo, J.; Ortega-Larrocea, P. Evaluating socio-ecological interactions for the management of protected urban green spaces. Front. Environ. Sci. 2019, 7, 144. [Google Scholar] [CrossRef]
  48. Wei, X.; Zhao, L.; Zhang, F.; Xia, Y. Multi-scenario simulation prediction of land use in Nanchang based on network robustness analysis. Ecol. Indic. 2024, 167, 112599. [Google Scholar] [CrossRef]
  49. Li, S.; Xiao, W.; Zhao, Y.; Lv, X. Incorporating ecological risk index in the multi-process MCRE model to optimize the ecological security pattern in a semi-arid area with intensive coal mining: A case study in northern China. J. Clean. Prod. 2020, 247, 119143. [Google Scholar] [CrossRef]
  50. Huang, H.; Zhang, M.; Yu, K.; Gao, Y.; Liu, J. Construction of complex network of green infrastructure in smart city under spatial differentiation of landscape. Comput. Commun. 2020, 154, 380–389. [Google Scholar] [CrossRef]
  51. Nie, W.; Shi, Y.; Siaw, M.J.; Yang, F.; Wu, R.; Wu, X.; Zheng, X.; Bao, Z. Constructing and optimizing ecological network at county and town Scale: The case of Anji County, China. Ecol. Indic. 2021, 132, 108294. [Google Scholar] [CrossRef]
  52. Clergeau, P.; Burel, F. The role of spatio-temporal patch connectivity at the landscape level: An example in a bird distribution. Landsc. Urban Plan. 1997, 38, 37–43. [Google Scholar] [CrossRef]
  53. Zhang, T.; Chen, W.; Sheng, Z.; Wang, P.; Guan, F. Ecological network construction and identification of important elements based on morphological spatial pattern analysis and circuit theory in Pingxiang City. J. Nat. Conserv. 2025, 86, 126902. [Google Scholar] [CrossRef]
  54. Ding, M.; Liu, W.; Xiao, L.; Zhong, F.; Lu, N.; Zhang, J.; Zhang, Z.; Xu, X.; Wang, K. Construction and optimization strategy of ecological security pattern in a rapidly urbanizing region: A case study in central-south China. Ecol. Indic. 2022, 136, 108604. [Google Scholar] [CrossRef]
  55. Dai, L.; Liu, Y.; Luo, X. Integrating the MCR and DOI models to construct an ecological security network for the urban agglomeration around Poyang Lake, China. Sci. Total Environ. 2021, 754, 141868. [Google Scholar] [CrossRef] [PubMed]
  56. Li, Q.; Zhang, Z.; Wan, L.; Yang, C.; Zhang, J.; Ye, C.; Chen, Y. Landscape pattern optimization in Ningjiang River Basin based on landscape ecological risk assessment. Acta Geogr. Sin. 2019, 74, 1420–1437. [Google Scholar] [CrossRef]
  57. McRae, B.H.; Dickson, B.G.; Keitt, T.H.; Shah, V.B. Using circuit theory to model connectivity in ecology, evolution, and conservation. Ecology 2008, 89, 2712–2724. [Google Scholar] [CrossRef] [PubMed]
  58. McRae, B.H.; Beier, P. Circuit theory predicts gene flow in plant and animal populations. Proc. Natl. Acad. Sci. USA 2007, 104, 19885–19890. [Google Scholar] [CrossRef]
  59. Knaapen, J.P.; Scheffer, M.; Harms, B. Estimating habitat isolation in landscape planning. Landsc. Urban Plan. 1992, 23, 1–16. [Google Scholar] [CrossRef]
  60. OuYang, X.; He, Q.; Zhu, X. Simulation of Impacts of Urban Agglomeration Land Use Change on Ecosystem Services Value under Multi-Scenarios: Case Study in Changsha-Zhuzhou-Xiangtan Urban Agglomeration. Econ. Geogr. 2020, 40, 93–102. [Google Scholar] [CrossRef]
  61. Wu, J.; Tian, Y.; Xu, W.; Xiao, Y.; Xie, Y.; Cheng, Y. Scenario Analysis of Land Use Change in the Lower Reaches of Wujiang River Based on CA-Markov Model. Res. Soil Water Conserv. 2017, 24, 133–139. [Google Scholar] [CrossRef]
  62. Sun, X. Considerations On “Three Zones and Three Lines” in the Territorial Planning System. City Plan. Rev. 2023, 6, 51–56. [Google Scholar]
  63. Zhang, B.; Li, L.; Xia, Q.; Dong, J. Land use change and its impact on carbon storage under the constraints of “three lines”: A case study of Wuhan City circle. Acta Ecol. Sin. 2022, 42, 2265–2280. [Google Scholar] [CrossRef]
  64. Liang, X.; Guan, Q.; Clarke, K.C.; Liu, S.; Wang, B.; Yao, Y. Understanding the drivers of sustainable land expansion using a patch-generating land use simulation (PLUS) model: A case study in Wuhan, China. Comput. Environ. Urban Syst. 2021, 85, 101569. [Google Scholar] [CrossRef]
  65. Li, P.; Cao, H.; Sun, W.; Chen, X. Quantitative evaluation of the rebuilding costs of ecological corridors in a highly urbanized city: The perspective of land use adjustment. Ecol. Indic. 2022, 141, 109130. [Google Scholar] [CrossRef]
  66. Wang, J.; Zhang, J.; Xiong, N.; Liang, B.; Wang, Z.; Cressey, E.L. Spatial and temporal variation, simulation and prediction of land use in ecological conservation area of Western Beijing. Remote Sens. 2022, 14, 1452. [Google Scholar] [CrossRef]
  67. Deng, Y.; Huang, M.; Gong, D.; Ge, Y.; Lin, H.; Zhu, D.; Chen, Y.; Altan, O. Carbon balance dynamic evolution and simulation coupling economic development and ecological protection: A case study of Jiangxi Province at county scale from 2000–2030. Int. J. Digit. Earth 2025, 18, 2448572. [Google Scholar] [CrossRef]
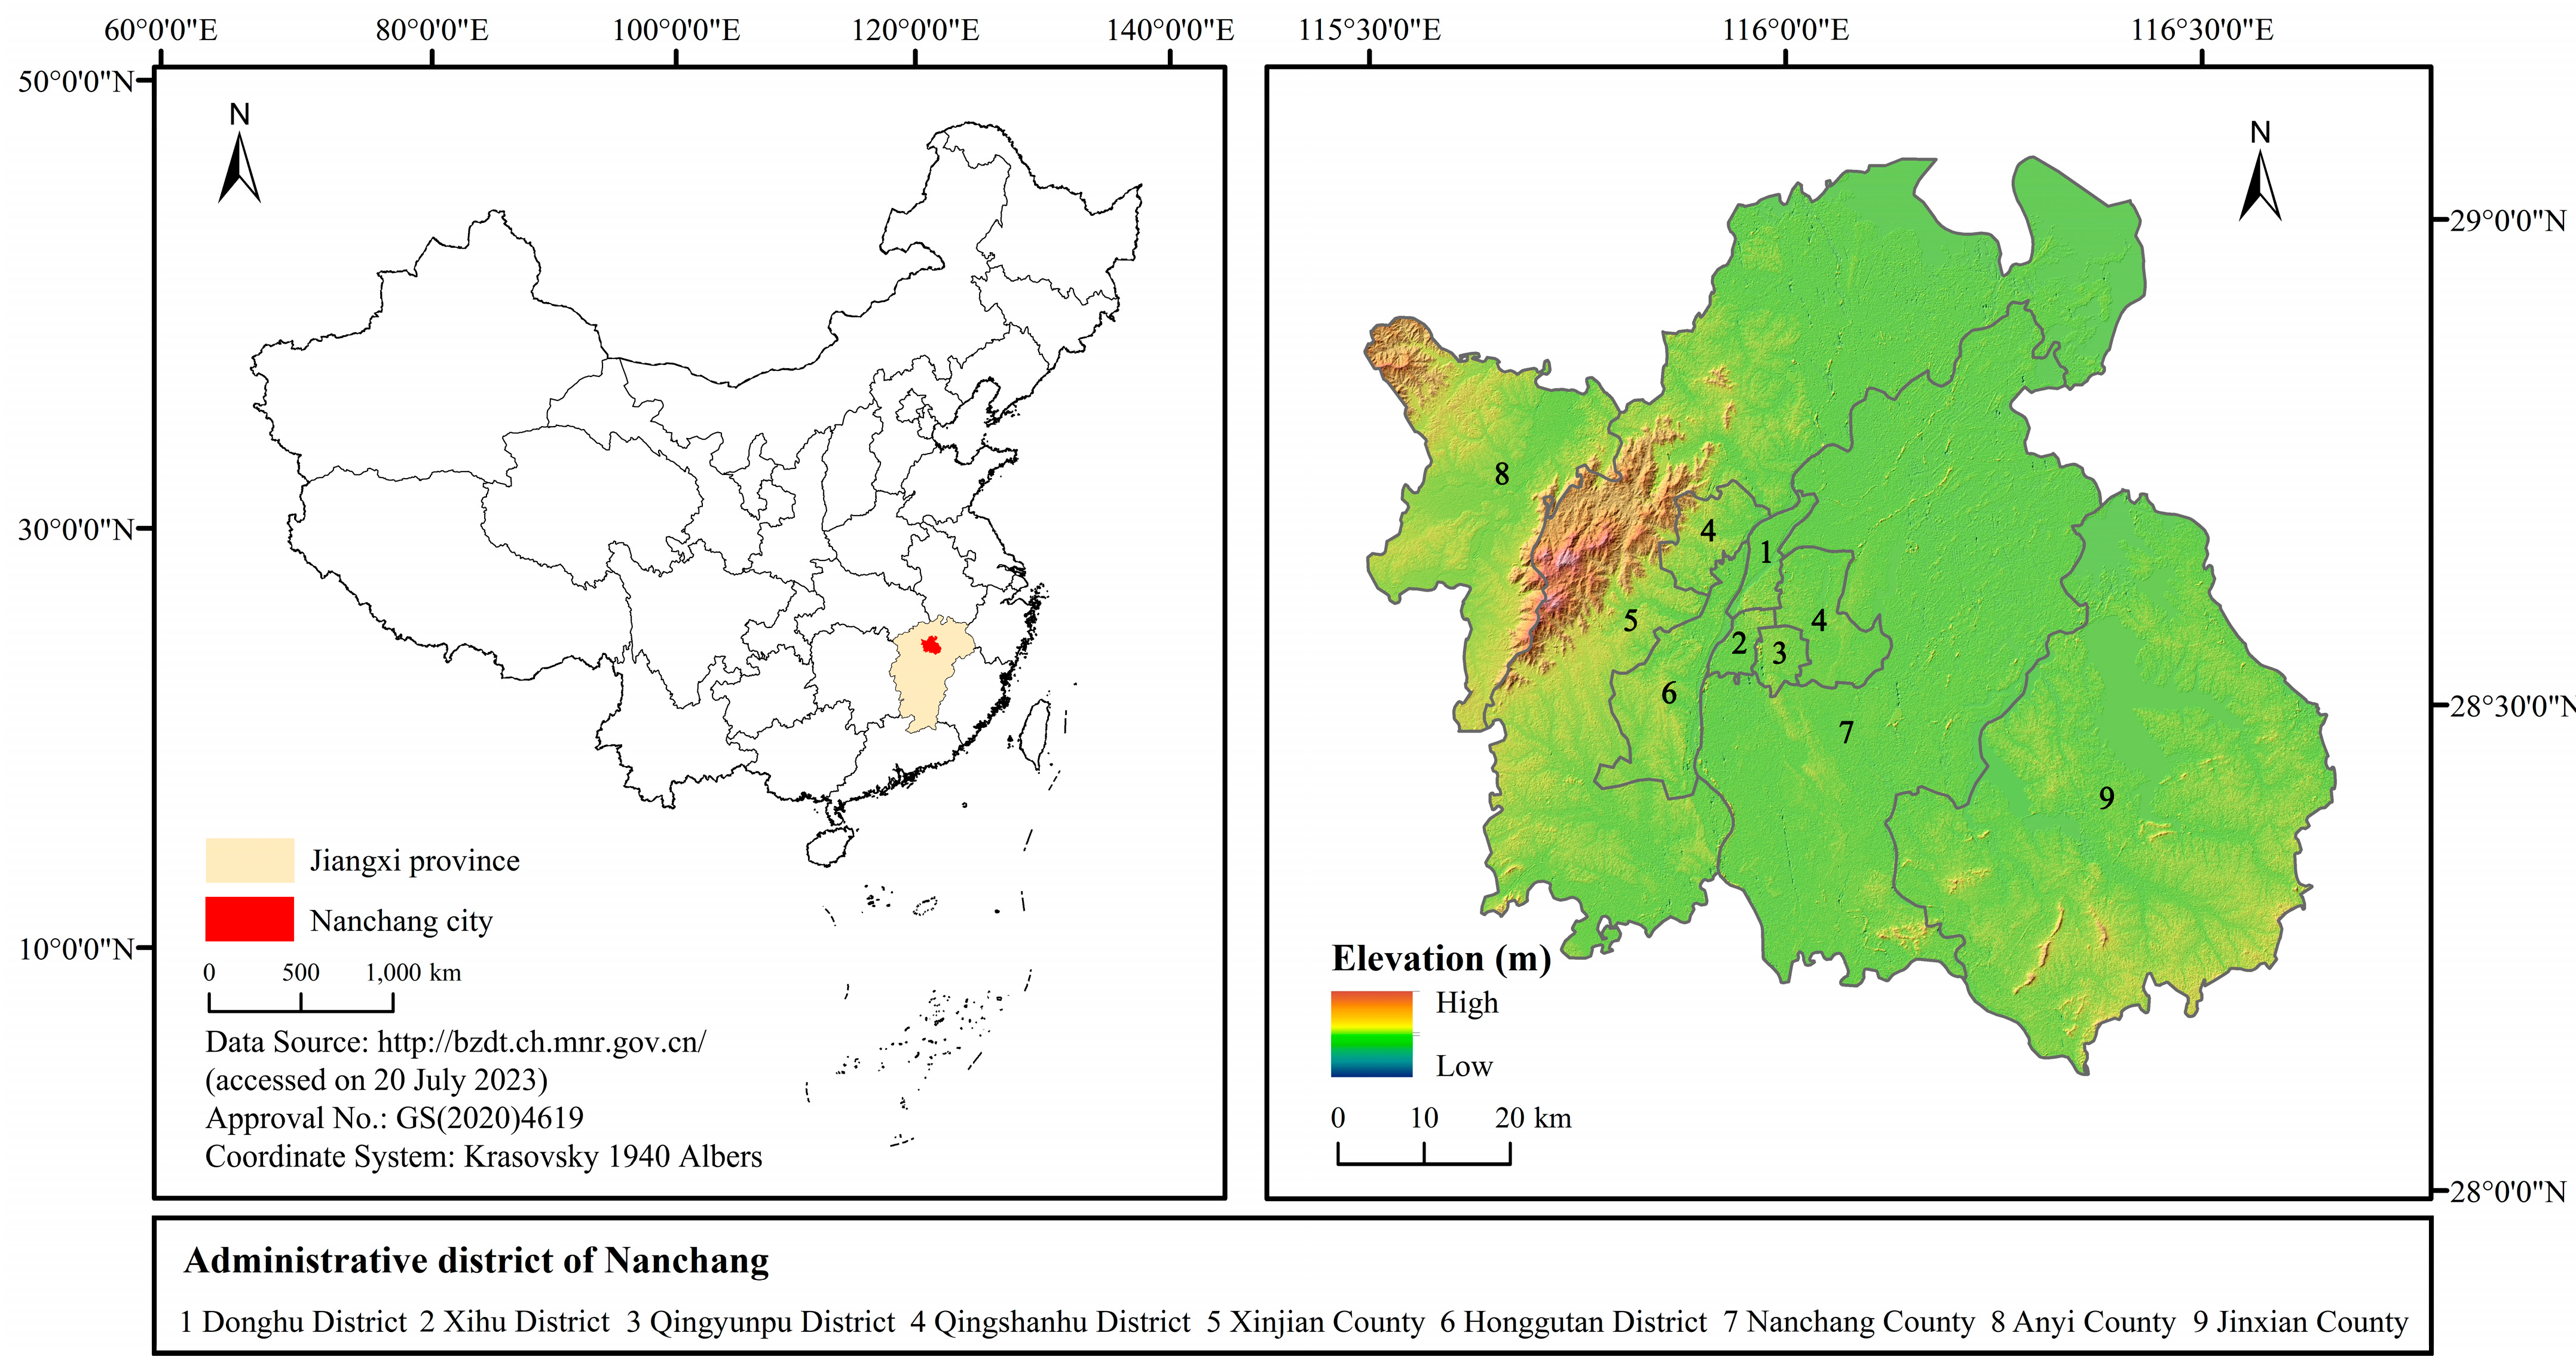
Figure 1. Map of the study area.
Remotesensing 17 03257 g001
Figure 2. Research framework.
Remotesensing 17 03257 g002
Figure 3. Spatial distribution of ecological sources in Nanchang.
Remotesensing 17 03257 g003
Figure 4. Classification of Individual and Composite Resistance Surfaces in Nanchang.
Remotesensing 17 03257 g004
Figure 5. “Three control lines” constraint area in Nanchang. Data Source: Nanchang Natural Resources Department.
Remotesensing 17 03257 g005
Figure 6. Spatial distribution of ECs and associated land use patterns. (a) ECs across Nanchang; (b) Land use in ECs in 2020.
Remotesensing 17 03257 g006
Figure 7. Multi-scenario land use simulation of Nanchang in 2035.
Remotesensing 17 03257 g007
Figure 8. Proportion of land type areas simulated in 2035.
Remotesensing 17 03257 g008
Figure 9. Multi-scenario land use distribution maps and detailed local plots within ECs. The insets show land use for four selected plots (14) under three different scenarios: (a1a4) the EP scenario; (b1b4) the ND scenario; and (c1c4) the UE scenario.
Remotesensing 17 03257 g009
Figure 10. Spatial distribution of ECs construction costs in Nanchang under multi-scenario land use conditions.
Remotesensing 17 03257 g010
Figure 11. District-Level EC Construction Costs under Multi-Scenario Land Use. (a) bar chart by district; (b) radar chart by district.
Remotesensing 17 03257 g011
Figure 12. Zoning of Ecological Corridor Management Areas.
Remotesensing 17 03257 g012
Table 1. Overview of data categories, sources, and preprocessing methods.
TypeData SubcategoryData SourcesData TypeData Preprocessing
Land Use——Resource and Environment Sciences
https://www.resdc.cn/
accessed on 25 July 2023
Raster (30 m)crop, reclassify, and extract
Nighttime Light——Raster (1 km)crop, extract
NDVI——Raster (250 m)
Soil——Raster (1 km)
DEM——Geospatial Data Cloud
https://www.gscloud.cn/
accessed on 25 July 2023
Raster (30 m)calculate, merge, crop, extract
Basic GeographicRoad Network DataOpenStreetMap
https://www.openstreetmap.org/
accessed on 25 July 2023
Vectorcrop, extract, Euclidean distance
River Network DataGeospatial Data Cloud
https://www.gscloud.cn/
accessed on 25 July 2023
Administrative boundary dataNational Geomatics Center of China
https://www.ngcc.cn/
accessed on 25 July 2023
Ministry of Civil Affairs of the People’s Republic of China
http://xzqh.mca.gov.cn/
accessed on 25 July 2023
extract
Government locationsBaidu Maps
https://map.baidu.com/
accessed on 25 July 2023
Euclidean distance
“Three control line” dataNanchang Natural Resources Departmentextract
Nature reserves dataGeographic remote sensing ecological network platform
http://www.gisrs.cn/
accessed on 25 July 2023
merge
MeteorologicalPrecipitation DataResource and Environment Sciences and Data Center https://www.resdc.cn/
accessed on 25 July 2023
Raster (1 km) extract
Temperature Data
Socio-economicPopulation dataResource and Environment Sciences and Data Center https://www.resdc.cn/
accessed on 25 July 2023
Raster (1 km)clip
GDP data
Compensation for land requisitionComprehensive land price list for land acquisition in Jiangxi Province
https://www.jiangxi.gov.cn/
accessed on 25 July 2023
Cross-sectional datasetsCalculate
Construction land auction dataChina Real Estate Information
http://www.crei.com.cn/
accessed on 25 July 2023
Industry output dataJiangxi Statistical Yearbook
Nanchang Statistical Yearbook
Table 2. Classification of Resistance Factors: Weights and Assigned Resistance Values.
Resistance FactorWeightGrading IndexResistance ValueResistance FactorWeightGrading IndexResistance Value
Elevation/m0.08<501Distance to road/m0.18<3005
50~1502300~6004
150~2503600~9003
250~3504900~15002
>3505>15001
Slope/°0.17<31Distance to water bodies/m0.17<3001
3~82300~6002
8~153600~9003
15~254900~15004
>255>15005
Landscape types0.21forest land1NDVI0.190~0.25
Cropland, grassland20.2~0.44
unused land30.4~0.63
water bodies40.6~0.82
construction land50.8~1.01
Table 3. Land-use change rules in Nanchang under different scenarios.
Type of ScenarioScenario Description
Ecological protection (EP)To enhance ecological protection in the land use simulation, transition probabilities from cropland and forest land to construction land were reduced by 30%, whereas those from grassland and water bodies to construction land were lowered by 20%. Conversely, the probability of reconverting construction land to forest land was increased by 10%. Moreover, the ecological redlines, permanent basic farmland, and areas outside the urban development boundaries, as delineated by the “three control lines” policy were designated as spatial constraints to restrict land-use conversions.
Natural development (ND)The ND scenario was constructed without ecological or policy constraints, relying on historical land-use change rates from 2000 to 2015 to project future development trends.
Urban expansion (UE)The development of the Greater Nanchang Metropolitan Area is expected to accelerate the expansion of construction land. Accordingly, under the UE scenario, transition probabilities from cropland, forest, and grassland to construction land were increased by 30%, whereas the probability of converting construction land back into forest land, grassland, and water bodies was decreased by 30%.
Table 4. Average cost of ecological corridor construction in each district of Nanchang.
DistrictCompensation Standard for Cropland Acquisition (Yuan/m2)Average Agricultural Output (Yuan/m2)Construction Cost per Unit Area of Crop Land (Yuan/m2)Average Acquisition Price of Construction Land (Yuan/m2) Average Secondary and Tertiary Industries Output Value (Yuan/m2)Construction Cost per Unit Area of Construction Land (Yuan/m2)
Donghu232.426.19238.6123,167.47773.4423,940.91
Xihu381.90388.0912,645.7113,419.15
Qingyunpu305.85312.0415,780.0116,553.45
Qingshanhu210.00216.193986.784760.22
Xinjian78.7284.914535.045308.48
Honggutan139.16145.3510,111.4310,884.87
Nanchang85.9092.092609.253382.69
Anyi64.1570.341430.512203.95
Jinxian65.6171.801026.241799.68
Disclaimer/Publisher’s Note: The statements, opinions and data contained in all publications are solely those of the individual author(s) and contributor(s) and not of MDPI and/or the editor(s). MDPI and/or the editor(s) disclaim responsibility for any injury to people or property resulting from any ideas, methods, instructions or products referred to in the content.