Abstract
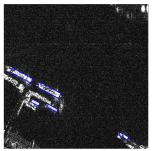
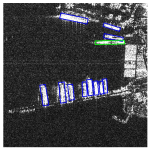
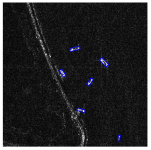
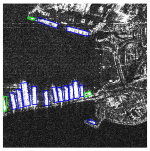
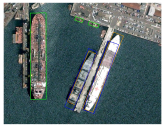
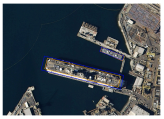
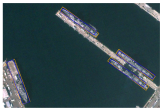
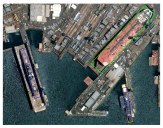
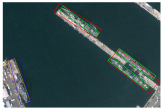
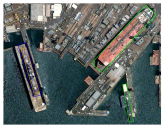
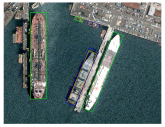
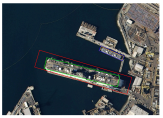
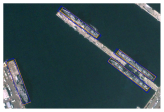
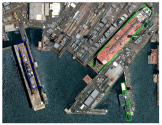
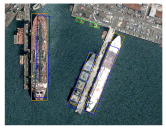
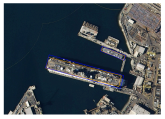
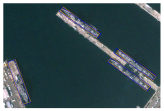
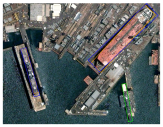
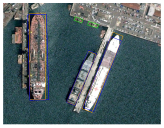
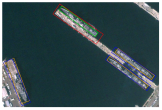
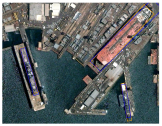
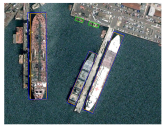
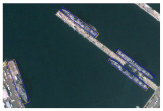
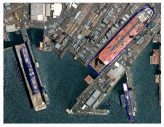
Detecting arbitrarily oriented ships in remote sensing images remains challenging due to diverse orientations, complex backgrounds, and scale variations, leading to a struggle in balancing detector accuracy with efficiency. We propose EfficientRDet, an enhanced rotated-ship detection algorithm built upon the EfficientDet framework. EfficientRDet adapts to rotated objects via an angle prediction branch and then significantly boosts accuracy with a novel pseudo-two-stage paradigm comprising a Rotated-Bounding-Box Refinement Branch (RRB) and a Class-Score Refinement Branch (CRB). Further precision is gained through an optimized Enhanced BiFPN (E-BiFPN), an Attention Head, and Distribution Focal (DF) angle representation. Extensive experiments on the HRSC2016 (optical) and RSDD-SAR datasets show that EfficientRDet consistently outperforms state-of-the-art methods, achieving 97.60% AP50 on HRSC2016 and 93.58% AP50 on RSDD-SAR. Comprehensive ablation studies confirm the effectiveness of all proposed mechanisms. EfficientRDet thus offers a promising and practical solution for precise, efficient ship detection across diverse remote sensing imagery.
1. Introduction
With the advancement of satellite technology, remote sensing satellites have also witnessed long-term development. Synthetic aperture radar (SAR) and optical sensors are the two primary payloads of remote sensing satellites, providing researchers with a wealth of information. SAR is characterized by its all-weather operation, although it is not very friendly to manual processing. Optical imagery, on the other hand, is highly suitable for human visual recognition but is limited to daytime operation. Therefore, SAR and optical imagery have good complementarity. Ship detection is crucial to maritime search and rescue, trade, and traffic planning. Therefore, developing a highly accurate and computationally efficient detection algorithm that can accurately identify ships with arbitrary orientations in both optical and SAR images holds significant research value.
Ship detectors can be mainly divided into traditional algorithms and deep learning-based algorithms. Traditional algorithms typically employ manually designed operators, such as Histogram of Oriented Gradients (HOG) [1] and sliding windows. For SAR-based detection, Constant False Alarm Rate (CFAR) [2] has been widely adopted as the industry standard for maritime surveillance. Additionally, Xiong et al. [3] pioneered the spatial singularity-exponent-domain multiresolution imaging (SSMRI) technique, which innovatively combines pseudo-Wigner–Ville distribution with spectral priors to generate multiresolution representations robust to ultra-low-SNR conditions in both SAR and optical domains. This groundbreaking framework has demonstrated exceptional ship detection capability across imaging modalities, achieving a success rate of over 99.4% at −30 dB SNR. Although traditional algorithms like CFAR and SSMRI have achieved considerable success in ship detection, their limitations in real-time high-precision scenarios persist due to high computational complexity, poor adaptability to geometric variations, and sensitivity to complex background interference.
The field of object detection has witnessed remarkable progress with the rapid development of deep learning technology, particularly in general image detection scenarios. These deep learning-based approaches are broadly categorized into two main types: single-stage methods, known for their efficiency (e.g., YOLO series [4,5,6,7,8,9,10,11,12]), and two-stage methods, which generally offer higher accuracy (e.g., Faster R-CNN [13]). However, directly applying these general object detection algorithms to ship detection in remote sensing images presents significant challenges. Unlike natural images, remote sensing images exhibit unique data distributions, imaging geometries, diverse resolutions, and complex maritime backgrounds, which inherently limit the direct applicability of models trained on natural image datasets. Furthermore, many general object detection algorithms often entail high computational demands and numerous parameters, posing further constraints on their deployment for remote sensing image analysis. Consequently, a substantial research focus on developing highly efficient and accurate deep learning algorithms specifically tailored for ship detection in remote sensing imagery has emerged.
Sun et al. [14] introduced BiFA-YOLO, an object detection algorithm for arbitrarily oriented ships in SAR ships based on YOLO. This method incorporates a bidirectional feature fusion module (Bi-DFFM) for multi-scale feature aggregation and an angular classification structure for precise angle detection. Additionally, a random-rotation mosaic data augmentation technique is used to enhance detection performance. Zhou et al. [15] developed PVT-SAR, a novel SAR ship detection framework leveraging a pyramid vision transformer (PVT) to capture global dependencies via self-attention. The framework includes overlapping patch embedding and mixed transformer encoder modules to handle dense targets and limited data. A multi-scale feature fusion module is employed to improve small-target detection, and a normalized Gaussian Wasserstein distance loss is used to reduce scattering interference. Yu et al. [16] presented AF2Det, an anchor-free and angle-free detector, which uses bounding-box projection (BBP) to predict the angles of target objects’ oriented bounding boxes (OBBs). This approach avoids boundary discontinuity and employs an anchor-free architecture with deformable convolution and bottom-up feature fusion to enhance detection capabilities. Zhou et al. [17] designed a novel ellipse parameter representation method for arbitrarily oriented objects. This method embeds the object’s angle within the ellipse’s focal vector, enabling a single numerical representation and reducing uncertainty in bounding-box regression. The algorithm uses a 2D Gaussian distribution for initial sample selection, employs Kullback–Leibler divergence loss as the regression loss function, and utilizes SimOTA as the label assignment strategy. Song et al. [18] implemented SRDF, a single-stage rotated-object detector that integrates an instance-level false-positive suppression module (IFPSM) to mitigate non-target responses through spatial feature encoding. A hybrid classification and regression approach is used to represent object orientation, and traditional post-processing is replaced with a 2D probability distribution model for more precise bounding-box extraction. Wan et al. [19] developed a SAR ship small-target azimuth detector via Gaussian label matching and semantic flow feature alignment. The method introduces the FAM module into an FPN to align deep and shallow semantics and incorporates attention mechanisms within an adaptive boundary enhancement module. A Gaussian distribution-based label matching strategy enables effective regression learning even when bounding boxes do not overlap. Zhang et al. [20] proposed a novel oriented-ship detection method for SAR images called SPG-OSD. To improve detection accuracy and reduce false alarms and missed detections, SPG-OSD incorporates three mechanisms: first, an oriented two-stage detection module based on scattering characteristics; second, a scattering-point-guided region proposal network (RPN) to predict potential key scattering points; and third, a region-of-interest (RoI) contrastive loss function proposed to enhance inter-class distinction and reduce intra-class variance. Experimental results on images from the Gaofen-3 satellite demonstrate that the algorithm achieves advanced performance. Liu et al. [21] established YOLOv7oSAR, a SAR ship detection model using a rotation box mechanism and KLD loss function to enhance accuracy. The model incorporates a Bi-former attention mechanism for small-target detection and a lightweight P-ELAN structure to reduce model size and computational requirements. Meng et al. [22] proposed LSR-Det, a lightweight object detection algorithm for rotated-ship detection in SAR images. This method employs a contour-guided backbone network to reduce model parameters while maintaining strong feature extraction capabilities and introduces a lightweight adaptive feature pyramid network (FPN) to enhance cross-layer feature fusion. Additionally, a rotating detection head with shared CNN parameters is designed to improve the precision of multi-scale ship target detection. Huang et al. [23] developed NST-YOLO11, an arbitrarily oriented-ship detection algorithm based on YOLO11. It uses an improved Swin Transformer module and a Cross-Stage connected Spatial Pyramid Pooling-Fast (CS-SPPF) module. To eliminate information redundancy from the Swin Transformer module’s local window self-attention, NST-YOLO11 employs a unified spatial-channel attention mechanism. Additionally, an advanced SPPF module is designed to further enhance the detection algorithm’s performance. Li et al. [24] innovated novel conditions for encoding methods and loss functions, introducing the Coordinate Decomposition Method (CDM) and developing a joint optimization paradigm to improve detection performance and address boundary discontinuity issues. Qin et al. [25] proposed DSA-Net based on SkewCIoU, using CLM for spatial attention and GCM for channel attention to enhance ship discrimination. The method introduces SkewCIoU loss to improve the detection of slender ships. Li et al. [26] improved the S2A-Net ship detection method by embedding pyramid squeeze attention to focus on key features and designing a context information module to enhance network context understanding. To improve the detected image’s quality, they used a fog density and depth decomposition-based dehazing network and applied an image weight sampling strategy to handle imbalanced ship category distribution. Liu et al. [27] proposed the TS2Anet model, leveraging the S2Anet rotating box object detection network and the PVTv2 structure as its backbone. The method employs the “cutout” image pre-processing technique to simulate occlusion caused by clouds and uses the GHM loss function to reduce the influence of outlier samples. Liang et al. [28] introduced MidNet, an anchor- and angle-free detector that represents each oriented object using a center and four midpoints. The method employs symmetric deformable convolution to enhance midpoint features and adaptively matches the center and midpoints by predicting centripetal shifts and matching radii. A concise analytical geometry algorithm ensures the accuracy of oriented bounding boxes. Yan et al. [29] enhanced ReDet with three key improvements, resulting in a more powerful ship detection model, ReBiDet. The enhancements include replacing the FPN structure with a ReBiFPN to capture multi-scale features, utilizing K-means clustering to adjust anchor sizes according to ground truth aspect ratios and employing a DPRL sampler to address scale imbalance. Fang et al. [30] proposed YOLO-RSA, composed of a feature extraction backbone, a multi-scale feature pyramid, and a rotated detection head. Tests on HRSC2016 and DOTA show that it outperforms other methods in recall, precision, and mAP. Ablation studies evaluate component contributions, and generalization tests prove its robustness across diverse scenarios. Huang et al. [31] enhanced the YOLOv11 algorithm for ship detection in remote sensing images by introducing a lightweight and efficient multi-scale feature expansion neck module. This method uses a multi-scale expansion attention mechanism to capture semantic details and combines cross-stage partial connections to boost spatial semantic interaction. Additionally, it employs the GSConv module to minimize feature transmission loss, resulting in a ship detection model that is both lightweight and high-precision. Gao et al. [32] proposed a YOLOV5-based oriented-ship detector for remote sensing images. It introduces a cross-stage partial context transformer (CSP-COT) module to capture global contextual spatial relationships; then, an angle classification prediction branch is added to the YOLOV5 head network for detecting targets in any direction, and a probability and distribution loss function (ProbIoU) is designed to optimize the regression effect. Additionally, a lightweight task-specific context decoupling (LTSCODE) module is employed to replace the original YOLOV5 head, to solve the accuracy problem caused by YOLOV5’s hybridization of classification and localization tasks. Sun et al. [33] proposed MSDFF-Net, which integrates a multi-scale large-kernel block (MSLK) to enhance noisy features, a dynamic feature fusion (DFF) module to suppress clutter, and a Gaussian probability loss (GPD) for elliptical-ship regression. This method achieves a state-of-the-art 91.55% AP50 in SAR ship detection tasks. Zhang et al. [34] proposed a cross-sensor SAR image detector based on dynamic feature discrimination and center-aware calibration. It incorporates a dynamic feature discrimination module (DFDM) to alleviate regression offset via bidirectional spatial feature aggregation and multi-scale feature enhancement, and a center-aware calibration module (CACM) to reduce feature misalignment by modeling target salience and focusing on the target’s perception center. Experiments on the MiniSAR and FARAD datasets show improvements of over 6–20% in mAP and F1, validating its effectiveness.
While deep learning has significantly advanced ship detection, two fundamental limitations persist. First, state-of-the-art detectors often entail substantial computational costs; for instance, S2ANet demands 56.22 GFLOPs on the RSDD-SAR dataset, revealing an inefficient computational design. Second, complex backgrounds in remote sensing images—particularly for rotated-object detection—pose significant challenges, often leading to false positives, as current methods struggle to effectively decouple target signatures from background clutter. This creates a pervasive accuracy–efficiency dilemma: two-stage methods achieve high precision through cascaded optimization but suffer from notably longer inference times (e.g., ReDet [35] on NVIDIA V100 with 62.89 ms), significantly exceeding those of single-stage detectors like S2ANet [36] (42.63 ms); conversely, single-stage methods, despite their speed, often struggle in complex scenarios (e.g., dense port ships and coastal line interference) due to the absence of fine-grained regression steps. To address this, we introduce EfficientRDet, a novel "pseudo-two-stage" paradigm that integrates lightweight refinement modules into a single-stage architecture—enabling two-stage-level precision without sequential computational overhead. This paradigm is further bolstered by three novel mechanisms. On the RSDD-SAR dataset, EfficientRDet achieves 93.58% AP50 at 14.08 ms latency, surpassing ReDet by 1.29% AP50 while operating at 4.47× its frame rate, thereby shattering the conventional accuracy–efficiency trade-off.
The main contributions of this article are as follows:
- 1.
- We propose EfficientRDet, a novel single-stage framework that pioneers a “pseudo-two-stage” paradigm. This framework is driven by two synergistic components: the Rotated-Bounding-Box Refinement Branch (RRB), which significantly improves box quality via feature resampling and deformable convolution, and the Class-Score Refinement Branch (CRB), which mitigates the misalignment between classification confidence and localization quality. Together, these branches achieve substantial accuracy gains with negligible computational overhead.
- 2.
- To overcome the specific challenges of ship detection in complex environments, we introduce three novel enhancement mechanisms: the Enhanced BiFPN (E-BiFPN) optimizes multi-scale feature fusion for large-scale variations; the Attention Head enhances feature discrimination to effectively suppress complex background clutter; and the novel DF angle prediction method resolves the boundary discontinuity problem inherent in rotation angle regression.
- 3.
- Extensive experiments across challenging datasets (HRSC2016 and RSDD-SAR) validate the state-of-the-art performance of EfficientRDet. It consistently surpasses existing advanced detectors in both accuracy and efficiency, achieving 93.58% AP50 on RSDD-SAR and 97.60% AP50 on HRSC2016. Comprehensive ablation studies systematically verify the effectiveness of the pseudo-two-stage paradigm and each enhancement mechanism.
The rest of this paper is organized as follows: Section 2 presents the overall algorithm framework and enhancement strategies; Section 3 details the experimental setup, including datasets, environment, and evaluation metrics; Section 4 presents the results and analysis, covering comparisons with other algorithms, ablation studies for the proposed improvement modules, and analysis of hyperparameters of key components, such as the CPLAM, the Attention Head, and DF angle prediction, on detection performance; finally, Section 5 concludes the paper and outlines future research directions.
2. Methodology
2.1. Overall Architecture
In this paper we present EfficientRDet, an efficient framework for arbitrarily oriented-ship detection. Figure 1 gives an overview of the network, which is built from three core components: a backbone, an enhanced neck (E-BiFPN), and a prediction head (Figure 2). The architecture employs EfficientNetB1 [37] as the backbone, constructed by stacking EfficientBlocks, as can be visualized in Figure 3. To enhance interpretability per reviewer feedback, Figure 1 uses distinct visual coding where gold-colored blocks (hue 6, 80% lightness) represent EfficientBlocks (detailed in Figure 3), aqua-colored blocks (hue 4, 40% lightness) indicate Attention Heads (detailed in Figure 2), gold-colored blocks (hue 6, 40% lightness) denote CPLAMs (detailed in Figure 4), orange-colored blocks (hue 5, 25% darkness) denote upsampling layers using nearest interpolation at ×2 scale, and orange-colored blocks (hue 5, 40% darkness) represent downsampling layers with maxpool kernel = 3 and stride = 2. Feature maps from stages 7, 15, and 22 serve as E-BiFPN inputs (denoted by and shown as gray circles), with omitted to reduce computation. E-BiFPN replaces standard convolutions with CPLAMs, enhancing feature extraction capabilities, and outputs (red circles) at 1/8, 1/16, and 1/32 scales for small-, medium-, and large-ship detection, respectively. These features feed into the prediction head (Figure 2), which contains classification and regression branches, including center-point prediction, width–height prediction, angle prediction (using DF angle method), and a novel rotated-box refinement module implementing pseudo-two-stage refinement that first generates coarse rotated boxes and classification scores and then refines them through dedicated rotation refinement (via the RRB) and class-score calibration (via the CRB) to significantly boost detection accuracy and classification reliability.

Figure 1.
Architectural diagram of the proposed EfficientRDet framework.

Figure 2.
The head of EfficientRDet.

Figure 3.
Schematic diagram of the EfficientBlock.

Figure 4.
The basic structure of the CPLAM.
2.2. “Pseudo-Two-Stage” Refinement Paradigm
Existing ship detection methods in remote sensing imagery, while achieving progress, often grapple with balancing detection accuracy and computational efficiency. Traditional two-stage detectors excel in accuracy through iterative refinement but are typically computationally intensive, limiting their real-time applicability. Conversely, single-stage detectors are generally faster but may not achieve the same level of precision, especially for arbitrarily oriented ships in complex scenes. To bridge this gap, we introduce an innovative “Pseudo-Two-Stage” refinement paradigm within our EfficientRDet framework. This paradigm is designed to emulate the high-precision benefits of two-stage systems while retaining the efficiency of a single-stage architecture. At its core, this paradigm incorporates two synergistic branches that progressively enhance detection quality: the Rotated-Bounding-Box Refinement Branch (RRB), which focuses on improving the geometric localization of ships, and the Class-Score Refinement Branch (CRB), which dynamically calibrates classification confidence to better align with localization accuracy.
2.2.1. Rotated-Bounding-Box Refinement Branch
Two-stage object detectors have demonstrated a remarkable accuracy advantage, largely stemming from their region refinement mechanisms. Inspired by this, we introduce the Rotated-Bounding-Box Refinement Branch (RRB) to integrate the strengths of two-stage refinement into our single-stage EfficientRDet framework.
The RRB operates by first generating an initial, coarse prediction box. This initial prediction is then used to guide a deformable convolution layer, as illustrated in Figure 2. Unlike standard convolution with a fixed grid, this guided deformable convolution dynamically adjusts the sampling locations of its kernel based on the position, scale, and orientation of the initial prediction. As shown in Figure 5, this allows the network to adaptively capture features along the target’s principal axes and incorporate a strong positional prior into the feature extraction process, significantly enhancing the specificity and accuracy of the feature representation.

Figure 5.
Different convolution sampling points, with blue points represent sampling points. (a) Traditional convolution. (b) RRB sampling points.
The features enhanced by this process are then fed into a lightweight prediction head to generate a set of refinement adjustments, denoted by . These adjustments are combined with the initial prediction box to produce the final, more precise bounding box, as defined in Equation (1).
where and are the parameters of the final refined bounding box. The ELU and tanh activation functions ensure stable and bounded predictions for the width, height, and angle adjustments. This refinement process, by combining an initial coarse prediction with a feature-driven adjustment, effectively mimics a second-stage refinement while maintaining high computational efficiency. Section 4.2 demonstrates that this RRB module considerably improves the detection accuracy of EfficientRDet.
2.2.2. Class-Score Refinement Branch
In many object detectors, the classification and regression branches are trained with distinct loss functions, leading to a lack of direct information sharing. Consequently, the classification confidence often fails to reflect the localization quality of the corresponding bounding box, which is typically measured by its Intersection over Union (IoU) with the ground truth. This mismatch can negatively impact performance during Non-Maximum Suppression (NMS), where a high-scoring but poorly localized box might erroneously suppress a more accurate prediction. This issue is particularly detrimental for precise vessel detection in cluttered scenes.
To address this, we introduce the Class-Score Refinement Branch (CRB), a mechanism designed to harmonize classification scores with localization accuracy. The CRB is a lightweight head integrated into the final layer of the regression branch tasked with predicting the IoU for each regressed bounding box. During inference, the initial classification scores are calibrated by being multiplied by the predicted IoU scores from the CRB. To ensure efficiency, the CRB consists of a single 3 × 3 convolutional layer followed by a sigmoid activation function, which constrains the predicted IoU values to the interval. As demonstrated in our ablation studies in Section 4.2, the CRB delivers remarkable performance gains with almost no additional computational cost.
2.3. Key Enhancements
To address specific challenges in remote sensing ship detection, we propose three novel mechanisms, detailed as follows.
2.3.1. E-BiFPN
To enhance the feature extraction capability of EfficientRDet’s neck architecture, traditional convolutional layers in the BIFPN are replaced with the more powerful Cross-stage Partial Layer Aggregation Module (CPLAM). Conventional convolutions offer limited feature fusion and struggle to fully integrate multi-level contextual information. In contrast, the CPLAM employs a cross-layer aggregation mechanism for more efficient integration of hierarchical features, thus enhancing feature diversity and discriminative power. The architecture of CPLAM is shown in Figure 4, where parameter n represents the module depth (i.e., the number of convolutional layers in the branch), which we will discuss in detail in Section 4.3.1. Incorporating the CPLAM upgrades the original BIFPN into an Enhanced BiFPN (E-BiFPN).
2.3.2. Attention Head
The original EfficientDet detection head uses 3 × 3 convolutions for feature extraction and prediction. However, this architecture has limitations in focusing on discriminative object features and struggles to effectively model inter-channel correlations, leading to insufficient adaptability for multi-scale targets in complex scenarios. To overcome these, an Attention Detection Head integrating an attention module after the 3 × 3 convolution layer is proposed. This design demonstrates significant improvements, as shown in Section 4.2, through attention module integration. Section 4.3.2 further explores the impact of different attention modules on EfficientRDet’s performance.
2.3.3. DF Angle Prediction
Rotated-bounding-box prediction differs from horizontal prediction by including an angle parameter, which is critical to detecting rotated ships. As shown in Figure 6a, two rotated boxes with identical center coordinates, width, and height but different angles can lead to detection inaccuracies. The angle parameter stands out among due to its periodic nature, which yields multiple equivalent values—this periodicity poses unique challenges for angle prediction. In Figure 6b, the ground truth is marked as a green box, with two predictions shown in red and blue. Visually, the blue box appears more accurate, yet the red box has a smaller angle difference (0.5° vs. 3.0°) from the ground truth. This discrepancy highlights the limitations of standard angle representation methods, which can be resolved by implementing a unique representation conversion to improve detector performance.

Figure 6.
Challenges in angle prediction for rotated-ship detection. (a) Illustration of angle impact on rotated boxes with identical center, width, and height. (b) Visual vs. numerical angle discrepancy: green (ground truth) and red/blue (predictions).
Distribution Focal Loss (DF Loss) is introduced to enhance the model’s bounding-box refinement and prediction accuracy by optimizing the probability distribution of positions. Its core approach models bounding-box positions as probability distributions rather than exact values, focusing on optimizing the probabilities of the positions nearest to the target. For angle prediction, DF Loss discretizes angles at uniform intervals and computes the predicted angle as an integral:
Here, denotes the probability of the angle falling into each interval, is a hyperparameter (discussed in Section 4.3.3), and . By transforming angle prediction into discrete distribution prediction, DF Loss eliminates periodicity-related errors in angle estimation.
2.4. Label Assignment Strategy
The label assignment strategy plays a pivotal role in the training process of object detection algorithms, significantly influencing the final accuracy of the model. During training, each anchor box (for anchor-based detectors) or anchor point (for anchor-free detectors) must be classified as either a positive or negative sample to guide network learning. Label assignment can be broadly categorized into two types: static assignment and dynamic assignment. Static assignment uses the Intersection over Union (IoU) between anchor boxes and ground truth (GT) bounding boxes as the criterion. Anchors with IoU values exceeding a predefined threshold are designated as positive samples, while others are considered negative. A key limitation of static label assignment is its pre-determined nature, where all sample assignments are fixed before training commences, lacking adaptability to evolving network states. In contrast, dynamic label assignment methods adopted by algorithms such as YOLOX [9] and TOOD [38] involve adaptive adjustments to positive/negative sample allocations throughout the training process. This dynamic approach enhances the model’s adaptability to diverse target characteristics by dynamically optimizing sample distributions, particularly effective in complex backgrounds, where it mitigates class imbalance issues. Building upon TOOD’s task alignment assignment, this paper proposes Rotated Task Alignment Assignment, a modified strategy tailored for rotated-object detection. The detailed implementation steps are described as follows:
- Prediction scores, shape (, , ).
- Prediction boxes, shape (, , 5).
- Ground truth labels, shape (, ).
- Ground truth boxes, shape (, , 5).
- Step 1: Calculate the metric matrix:
- -
- Compute the alignment metric matrix using the formulawhere s is the classification score, u is the IoU between the prediction box and the ground truth box, and = 1 and = 6 are weighting hyperparameters.
- Step 2: Select the top-k predictions for each ground truth:
- -
- For each ground truth box, select the top-k predictions with the highest alignment scores as positive samples.
- -
- The value of k varies depending on the dataset: 8 for RSDD-SAR and 12 for HRSC2016.
- Step 3: Handle predictions matching multiple ground truths:
- -
- If a prediction matches multiple ground truth boxes, select the ground truth box with the highest IoU value as the corresponding target.
- -
- This ensures that each prediction is associated with the most relevant ground truth box, maintaining consistency and accuracy in the detection process.
2.5. Loss Function
Unlike traditional horizontal bounding boxes, the Intersection over Union (IoU) of two rotated bounding boxes is non-differentiable. As a result, it cannot be directly used as a loss function for regression, as is done in conventional object detection, where the IoU between the predicted bounding box and the ground truth bounding box serves as the loss function. To address this issue, various methods have been proposed by researchers to approximate the IoU with a differentiable function that can represent the relationship between two rotated bounding boxes, such as SkewIoU [39]. The most widely adopted approach, proposed by Yang et al. [40], involves converting the rotated bounding boxes into 2D Gaussian distributions. By computing the distance between these 2D Gaussian distributions, this method defines a loss function for the predicted and ground truth bounding boxes. In this study, we employ ProbIoU [41], which utilizes the Bhattacharyya Coefficient between the 2D Gaussian distributions of two bounding boxes as the localization loss function. The detailed computation process is provided below.
For the predicted rotated bounding box and the ground truth box , we first convert them into 2D Gaussian distributions using Equation (3), resulting in .
where
The Bhattacharyya Distance between the two Gaussian distributions p and q is calculated as shown in (4):
We assume that the distributions of p and q are as follows:
Finally, we use the Hellinger distance (9) as an approximation of the IoU to obtain the final result of the ProbIoU loss (10):
Then, the loss function for EfficientRDet can be formulated as follows:
here, Loss_cls denotes the classification loss. In this study, we employ the Varifocal Loss [42], whose calculation is presented in Equation (12). Both Loss_riou and Loss_refined-riou leverage the ProbIoU Loss, whereas Loss_angle adopts the Distribution Focal Loss as elaborated in Section 2.3.3. For Loss_crb, a binary classification Cross-Entropy Loss is utilized.
here, p represents the prediction, and q represents the label.
3. Experimental Settings
To comprehensively validate EfficientRDet’s performance, this study constructs a multi-dimensional experimental system using satellite ship remote sensing imagery. The experimental framework includes datasets, evaluation metrics, comparative experiments, and ablation experiments.
3.1. Datasets
We used two publicly available datasets for evaluation: HRSC2016 [43] and RSDD-SAR [44]. These datasets provide diverse challenges for ship detection, covering different ship sizes, resolutions, and environmental conditions. A summary of the key characteristics of each dataset is provided in Table 1.

Table 1.
The information of the datasets we used.
- HRSC2016: This dataset contains 1070 high-resolution optical images with a total of 2976 annotated ship instances. The images cover a variety of scenes, including harbors and shipping lanes.
- RSDD: The RSDD dataset consists of 7000 SAR images with 10,263 ship instances, sourced from the high-resolution Gaofen-3 and TerraSAR-X satellites.
3.2. Metrics
To quantitatively evaluate the performance of the proposed method, we utilize six core evaluation metrics that holistically assess detection accuracy and computational efficiency, structured as follows:
- 1.
- Precision (P): Measure of the proportion of correctly predicted ship instances among all detected instances.where is the number of true-positive predictions and is the number of false-positive predictions.
- 2.
- Recall (R): Measure of the proportion of correctly predicted ship instances among all ground truth instances.where is the number of false-negative predictions.
- 3.
- AP50: Average precision evaluated at the IoU threshold of 50%, reflecting baseline detection capability. Computed as
- 4.
- AP75: Average precision evaluated at the stricter IoU threshold of 75%, indicating high-quality localization accuracy. Computed as
- 5.
- AP: Comprehensive mean average precision integrating AP scores across IoU thresholds from 50% to 95%, providing overall performance measure.
- 6.
- FLOPs: Computational efficiency metric quantifying the floating-point operations required per image inference:where L denotes the total layers, C denotes the channels, K is the kernel size, and are the feature dimensions.
3.3. Experimental Setup
All experiments were conducted in the same environment. The system was equipped with an Intel® Xeon® Gold 6271C processor (Intel Corporation, Santa Clara, CA, USA), featuring 64 cores with a base clock speed of 2.60 GHz, and an NVIDIA Tesla V100 GPU with 32 GB of memory. The operating system used was Ubuntu 16.04. For model training and evaluation, PaddlePaddle 2.4 was utilized, along with Python 3.7.4 and CUDA 11.2, to ensure full compatibility with the GPU. All experiments were performed using the PaddleDetection toolbox [45].
For the HRSC2016 dataset, images were resized to 800 × 800, and for the RSDD-SAR dataset, the original size of 512 × 512 was maintained. All datasets were divided into training and test sets according to the splits specified in the original papers. For the RSDD-SAR dataset and HRSC2016, a cosine decay scheduler adjusted the learning rate, with max epochs of 36 and 72, respectively. Also, a linear warm-up strategy was used for the first 500 iterations, with a start factor of 0.33. The AdamW optimizer was used with gradient clipping set to 35 and an L2 regularization factor of 0.005. The batch size was set to 16. During training, data augmentation techniques such as random flipping and random rotation were employed.
4. Results and Analysis
4.1. Comparative Experiments
To further evaluate the performance of EfficientRDet, this section conducts a comparison between EfficientRDet and several state-of-the-art arbitrarily oriented-object detection methods from the PaddleDetection toolkit. The comparison uses two benchmark datasets, HRSC2016 and RSDD-SAR, and includes representative algorithms such as Oriented R-CNN [46], ReDet [35], R3Det [39], FCOSR [47], S2ANet [36], and the small, medium, and large variants of PP-YOLOE-R [48]. Notably, all these detectors are trained following the identical training strategy detailed in Section 3.3, ensuring the fairness and reliability of the comparative results.
4.1.1. Qualitative Analysis
To offer a more intuitive and concrete understanding of the performance differences, this section presents the test results of EfficientRDet alongside the aforementioned algorithms through visual comparisons. These comparisons are conducted on both SAR and optical imagery, vividly showcasing the detection effects across various scenes. By visually examining the results, the distinctions in performance between the algorithms can be more clearly revealed, as demonstrated below.
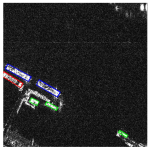
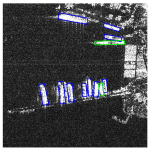
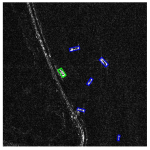
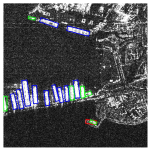
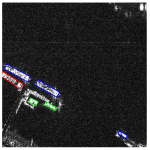
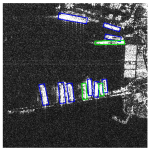
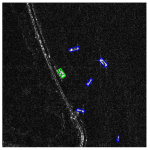
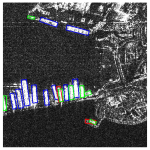
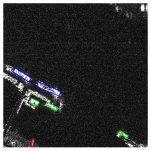
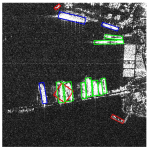
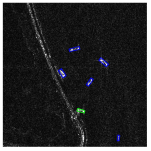
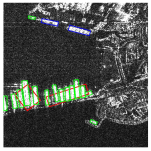
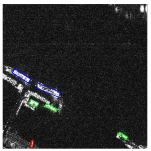
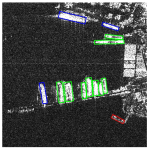
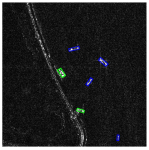
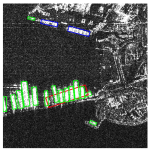
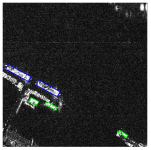
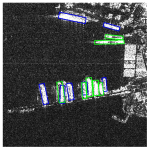
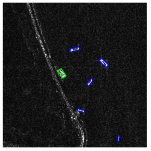
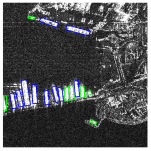
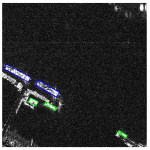
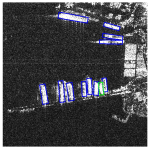
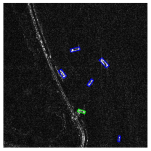
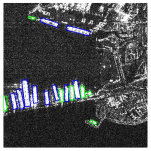
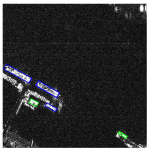
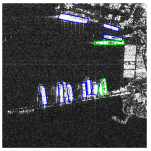
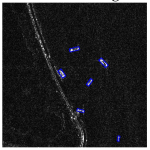
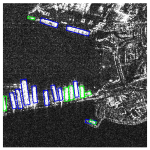
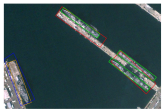
Table 2 presents the detection performance of nine algorithms on four images from the RSDD-SAR test set. For clarity, correct detections are marked with blue boxes, missed detections with green boxes, and false alarms with red boxes. All test images are characterized by complex inshore backgrounds, where ships are embedded in cluttered surroundings. Notably, among the nine evaluated algorithms, EfficientRDet consistently achieves the highest detection accuracy. This superior performance underscores its capability to robustly handle complex inshore environments and effectively distinguish ships from cluttered backgrounds, rendering it particularly suitable for scenarios demanding high detection accuracy and reliability.

Table 2.
Comparison of ship detection performance of nine algorithms on SAR imagery.
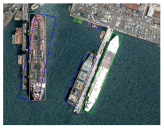
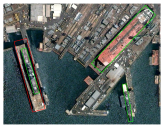
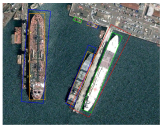
Table 3 displays the detection performance of nine algorithms on five challenging images from the HRSC2016 test set. Each image features complex nearshore backgrounds. For clarity, correct detections are indicated by blue boxes, missed detections by green ones, and false alarms by red ones, while ground truth boxes are marked with orange frames, providing an intuitive measure of detection quality. Among the nine detection algorithms evaluated, EfficientRDet consistently demonstrates the highest detection accuracy, proving particularly effective in navigating complex nearshore scenes where distinguishing ships from background clutter is challenging. Visual comparisons in Table 3 further exemplify its superior capabilities; for instance, examining the same correctly identified ships, EfficientRDet’s output (ninth row, second column) produces noticeably more precise detection boxes compared with PP-YOLOE-R Large (eighth row, second column). This tighter alignment with the ground truth highlights EfficientRDet’s superior localization capabilities, positioning it as a robust candidate for real-world maritime surveillance that demands high reliability and precision.

Table 3.
Comparison of ship detection performance of nine algorithms on optical imagery.
Combining results from both datasets, EfficientRDet consistently outperforms the other eight evaluated algorithms across complex inshore and nearshore scenes, whether in SAR (RSDD-SAR) or optical (HRSC2016) remote sensing imagery. Its superior performance is characterized by two key strengths: first, a robust ability to distinguish ships from cluttered backgrounds, as evidenced by fewer false alarms and missed detections in complex inshore/nearshore environments; second, superior localization precision, with detection boxes that align more tightly with the ground truth (particularly notable in the HRSC2016 comparisons). These consistent advantages across diverse imaging modalities (SAR and optical) and challenging coastal scenarios underscore EfficientRDet’s versatility and reliability, making it a highly effective solution for real-world maritime surveillance tasks demanding high accuracy in both target discrimination and localization.
4.1.2. P-R Curves
To visually compare the detection performance of different algorithms under varying evaluation criteria, we plotted the Precision-Recall (P-R) curves for nine algorithms across two datasets (HRSC2016 and RSDD-SAR) at different IoU thresholds (0.5 and 0.75), as shown below.
The P-R curves in Figure 7, Figure 8, Figure 9 and Figure 10 illustrate the comparative performance of nine algorithms on the HRSC2016 and RSDD-SAR test sets. EfficientRDet consistently outperforms all other evaluated algorithms across both datasets, demonstrating its robustness and adaptability to diverse imaging modalities and environmental conditions. At the lower IoU threshold of 0.5, EfficientRDet achieves strong results, exhibiting a competitive yet less pronounced advantage over other advanced methods. However, at the stricter IoU threshold of 0.75, EfficientRDet’s performance stands out prominently, showing a significant and consistent lead over competitors. This pronounced superiority at a higher IoU threshold highlights the effectiveness of our pseudo-two-stage approach in significantly improving the detector’s localization accuracy, thereby validating its efficacy for tasks demanding high-precision object detection.

Figure 7.
P-R curves of different algorithms on RSDD-SAR dataset with IoU threshold of 0.5.

Figure 8.
P-R curves of different algorithms on RSDD-SAR dataset with IoU threshold of 0.75.

Figure 9.
P-R curves of different algorithms on HRSC2016 dataset with IoU threshold of 0.5.

Figure 10.
P-R curves of different algorithms on HRSC2016 dataset with IoU threshold of 0.75.
4.1.3. Quantitative Analysis
In the previous subsection, we qualitatively analyzed various algorithms’ detection effects, revealing their performance differences in practical applications. However, visual assessment alone cannot comprehensively and accurately evaluate algorithm superiority. To precisely assess EfficientRDet’s advantages and limitations compared with other advanced algorithms, this section delves into quantitative analysis. We quantitatively compare algorithm detection performance using widely recognized metrics: , , and AP. Moreover, considering computational resource constraints in real-world applications, we include computational complexity (measured in FLOPs) to evaluate the balance between performance and efficiency. Through a systematic analysis of these quantitative indicators, we aim to present a clear and objective overview of algorithm performance, thereby more strongly supporting our conclusions. Table 4 presents the detection results of different algorithms on the RSDD-SAR dataset, from which we draw the following conclusions: Among all compared algorithms across the two-stage, single-stage, and anchor-free categories, EfficientRDet demonstrates the lowest computational overhead (4.81 GFLOPs) and the highest inference speed (71.00 FPS) while consistently achieving superior accuracy across key metrics. Specifically, it leads in (93.58%), outperforming the second-best anchor-free competitor, PP-YOLOE-R Large, by 0.52% with merely 13.25% of its computational load. Furthermore, it exhibits a significant 3.24% margin in (59.74% vs. 56.50%) over PP-YOLOE-R Large, highlighting its superior capability in generating high-quality bounding boxes. Moreover, EfficientRDet maintains a 1.47% lead in overall AP (54.51% vs. 53.04%) averaged across IoU thresholds from 50% to 95%, confirming its consistent excellence across diverse thresholds. This comprehensive performance underscores the effectiveness of its pseudo-two-stage paradigm and the three novel mechanisms proposed in this paper.

Table 4.
Detection results of different algorithms on the RSDD-SAR dataset.
Table 5 presents the detection results of different algorithms on the HRSC2016 dataset, from which we draw the following conclusions: Among all algorithms across the two-stage, single-stage, and anchor-free categories, EfficientRDet exhibits the lowest computational overhead (8.46 G FLOPs) and the highest inference speed (21.29 FPS), while achieving superior accuracy across key metrics: it leads in (97.60%), surpassing the closest anchor-free competitor, PP-YOLOE-R Large, by 0.01%; demonstrates a significant 5.43% margin in (90.05% vs. 84.62%) over PP-YOLOE-R Large, highlighting high-quality bounding-box regression; and outperforms PP-YOLOE-R Large by 3.64% in overall AP (73.49% vs. 69.85%), confirming consistent excellence across IoU thresholds.

Table 5.
Detection results of different algorithms on the HRSC2016 dataset.
Combining results from Table 4 and Table 5 demonstrates that EfficientRDet achieves state-of-the-art performance in object detection tasks across both optical and SAR imagery. In optical imagery, EfficientRDet leads with the highest accuracy and the lowest computational overhead. Similarly, in SAR imagery, it surpasses competitors in detection accuracy and efficiency metrics. These results suggest that EfficientRDet is an excellent choice for remote sensing object detection tasks.
4.2. Ablation Study
To comprehensively evaluate the effectiveness of each core component of the proposed EfficientRDet model and its contribution to overall performance, we conducted a series of detailed ablation studies. These experiments are designed to systematically analyze the role of key innovations, including the pseudo-two-stage refinement paradigm (RRB and CRB), the E-BiFPN, the Attention Head, and DF angle prediction, within our model. By incrementally adding or removing specific modules and observing their impact on object detection performance metrics (such as AP, , and ) and computational overhead (FLOPs), we aim to quantify the individual value of each component and their synergistic effects when combined with others. The findings in this section will provide strong experimental evidence for the design choices of EfficientRDet and validate the rationality and efficiency of its holistic design.
First, the significant impact of the pseudo-two-stage refinement paradigm (RRB + CRB) on model performance is evident in Table 6. As shown in Steps 0 to 2, the integration of the RRB and the CRB delivers substantial performance gains, forming an effective and efficient foundation. Specifically, adding the RRB alone (Step 1 vs. Step 0) increases AP by 5.26% (from 65.46% to 70.72%) and boosts by 7.09% (from 79.84% to 86.93%), highlighting its critical role in improving localization quality. The subsequent addition of the CRB (Step 2 vs. Step 1) further enhances AP by 1.06% (to 71.78%) and by 0.92% (to 87.85%), demonstrating a powerful synergy between the two components. Notably, this significant improvement is achieved with only a 0.65% increase in FLOPs (from 7.73 GFLOPs to 7.78 GFLOPs), confirming the computational efficiency of the pseudo-two-stage paradigm.

Table 6.
Ablation study of EfficientRDet.
Next, the individual contributions of the three enhancement mechanisms, when built upon the pseudo-two-stage foundation (Step 2), can be analyzed using Table 6. The E-BiFPN module (Step 3a vs. Step 2) improves multi-scale feature representation, yielding a 0.24% AP gain (to 72.02%) and a 0.38% gain (to 88.23%) with a slight increase in FLOPs (7.80 GFLOPs). The Attention Head (Step 3b vs. Step 2) enhances discriminative feature learning, providing a 0.19% AP gain (to 71.97%) and a 0.41% gain (to 88.26%) without additional computational overhead (7.78 GFLOPs). Most notably, DF angle prediction (Step 3c vs. Step 2) delivers the largest individual improvement, with an AP gain of 0.55% (to 72.33%) and an gain of 0.66% (to 88.51%), underscoring the critical importance of robust angle estimation despite its higher FLOPs (8.43 GFLOPs).
Finally, the synergistic effects of combining these mechanisms are also evident in Table 6. For instance, adding the Attention Head to a model already containing the E-BiFPN (Step 4a vs. Step 3a) results in a 0.95% AP increase (to 72.97%), a gain significantly larger than the module’s individual contribution (0.19%), indicating strong synergy in feature fusion and discrimination. Similar patterns are observed in other combinations: Step 4b (Attention Head + DF angle vs. Step 3b) yields an 0.85% AP gain (to 72.82%), and Step 4c (E-BiFPN + DF angle vs. Step 3c) achieves a 0.76% AP gain (to 73.09%). Finally, the full EfficientRDet model (Step 5), which integrates all mechanisms, achieves the peak performance with an AP of 73.49% and an of 90.05%, representing a total AP improvement of 8.03% over the baseline (Step 0) at 8.46 GFLOPs. This validates the holistic and highly optimized design of the proposed method.
Based on the comprehensive analysis of Table 6, we conclude the following:
- 1.
- The pseudo-two-stage refinement paradigm (RRB + CRB) is a highly effective and computationally efficient foundation, delivering the majority of the performance gains by significantly improving localization and refinement.
- 2.
- Each of the three core mechanisms—the E-BiFPN, the Attention Head, and DF angle—successfully addresses a distinct detection challenge and makes a clear, quantifiable contribution to the model’s overall performance.
- 3.
- The combined use of these mechanisms is highly effective, demonstrating strong synergistic gains and delivering substantial improvements to EfficientRDet.
4.3. Analysis of Hyperparameter Choices
For EfficientRDet, certain parameter choices significantly impact detection performance. These include the depth of the Cross-stage Partial Layer Aggregation Module (CPLAM), the attention module within the Detection Head, and the angle encoding range (angle_max) of the angle prediction branch. This section conducts a series of experiments on the HRSC2016 dataset to determine appropriate values for these parameters.
4.3.1. Impact of CPLAM Depth
This subsection systematically investigates the influence of the Cross-stage Partial Layer Aggregation Module’s (CPLAM) depth on the performance of EfficientRDet. As a critical component in the neck of EfficientRDet, the CPLAM’s depth directly affects the model’s capacity to capture hierarchical semantic information. We conduct a series of experiments on the HRSC2016 dataset to explore the optimal depth configuration. The experimental results are presented in Table 7. Our findings reveal that a depth of yields the best detection performance across all evaluated metrics (, , and AP). Therefore, we select as the depth for the CPLAM in our implementation of EfficientRDet.

Table 7.
Test results of EfficientRDet with different CPLAM depths on HRSC2016 dataset.
4.3.2. Attention Module Selection for Detection Head
To enhance the discriminative ability of the detection head and model channel-wise feature correlations, we integrated an attention mechanism into our detection head. To identify the optimal attention module, we conducted systematic evaluations using five representative modules: Squeeze-and-Excitation (SE) [49], Efficient Squeeze-and-Excitation (eSE) [50], Layer-wise Efficient Channel Attention (ECA-Layer) [51], Coordinate Attention (CA) [52], and Convolutional Block Attention Module (CBAM) [53], as shown in Table 8. These modules were evaluated on the HRSC2016 dataset, with a baseline model (without any attention block) serving as the control group. The results indicate that the SE attention module achieves the highest overall accuracy among the evaluated options. Therefore, we selected SE as the attention block for the detection head of EfficientRDet.

Table 8.
Test results of EfficientRDet with different attention modules on HRSC2016 dataset (baseline denotes no attention block).
4.3.3. Optimal Angle Encoding Range in DF-Based Orientation Regression
This study evaluates the impact of angle encoding range on the Distributional Focal Loss (DFL)-based orientation regression component. The encoding range determines the angular quantization granularity, which directly affects the model’s ability to accurately represent rotated objects. As shown in Table 9, by systematically varying the "angle_max" parameter from 10 to 100 in increments of 10, we observed that an "angle_max" value of 80 yields the optimal overall AP (73.49%). Therefore, we choose "angle_max = 80" for EfficientRDet.

Table 9.
Influence of different angle encoding ranges (angle_max) for EfficientRDet on HRSC2016 dataset.
5. Conclusions
This study tackles the precision–efficiency trade-off in arbitrarily oriented-ship detection by presenting EfficientRDet. EfficientRDet is a single-stage framework that incorporates a pseudo-two-stage paradigm. It includes dedicated Rotated-Bounding-Box Refinement and Class-Score Refinement Branches. These branches allow for high-accuracy localization and classification with minimal computational overhead. Key innovations of this study are as follows: Firstly, an Enhanced BiFPN is proposed for multi-scale feature fusion to handle extreme size variations. Secondly, an Attention Head is introduced to suppress background clutter by enhancing discriminative features. Thirdly, a DF angle prediction method is developed to resolve angular discontinuity through Distribution Focal Loss. The framework achieves state-of-the-art performance on benchmark datasets, with values of 93.58% on RSDD-SAR and 97.60% on HRSC2016. Ablation studies indicate that the pseudo-two-stage paradigm contributes a 6.32% AP gain. Additionally, the E-BiFPN, Attention Head, and DF angle mechanisms result in improvements of 0.24%, 0.19%, and 0.55%, respectively. This work offers a practical solution for maritime surveillance systems, showing effective reconciliation between single-stage efficiency and two-stage precision. Future efforts will explore semi-supervised extensions to decrease annotation dependency in data-scarce environments.
Author Contributions
Writing—original draft, W.Z.; Writing—review & editing, S.F. Authorship must be limited to those who have contributed substantially to the work reported. All authors have read and agreed to the published version of the manuscript.
Funding
This research received no external funding.
Data Availability Statement
The data used in this study are from open-source datasets, and their original papers have been cited in the references. Detailed information on the datasets, including links to their publicly archived repositories, is provided within the article to ensure readers can access the data supporting the reported results.
Conflicts of Interest
The authors declare no conflicts of interest.
Abbreviations
The following abbreviations are used in this paper:
| BiFPN | Bidirectional Feature Pyramid Network |
| E-BiFPN | Enhanced BiFPN |
| CPLAM | Cross-stage Partial Layer Aggregation Module |
| DF | Distribution Focal |
| RRB | Rotated-Bounding-Box Refinement Branch |
| CRB | Class-score Refinement Branch |
| FLOPs | Floating-point operations |
References
- Dalal, N.; Triggs, B. Histograms of oriented gradients for human detection. In Proceedings of the 2005 IEEE Computer Society Conference on Computer Vision and Pattern Recognition (CVPR’05), San Diego, CA, USA, 20–25 June 2005; Volume 1, pp. 886–893. [Google Scholar] [CrossRef]
- Farina, A.; Studer, F.A. A review of CFAR detection techniques in radar systems. Microw. J. 1986, 29, 115. [Google Scholar]
- Xiong, G.; Wang, F.; Yu, W.; Truong, T.K. Spatial Singularity-Exponent-Domain Multiresolution Imaging-Based SAR Ship Target Detection Method. IEEE Trans. Geosci. Remote Sens. 2022, 60, 5215212. [Google Scholar] [CrossRef]
- Redmon, J.; Divvala, S.; Girshick, R.; Farhadi, A. You only look once: Unified, real-time object detection. In Proceedings of the IEEE Conference on Computer Vision and Pattern Recognition, Las Vegas, NV, USA, 27–30 June 2016; pp. 779–788. [Google Scholar]
- Redmon, J.; Farhadi, A. YOLO9000: Better, faster, stronger. In Proceedings of the IEEE Conference on Computer Vision and Pattern Recognition, Honolulu, HI, USA, 21–26 July 2017; pp. 7263–7271. [Google Scholar]
- Redmon, J.; Farhadi, A. Yolov3: An incremental improvement. arXiv 2018, arXiv:1804.02767. [Google Scholar] [CrossRef]
- Bochkovskiy, A.; Wang, C.Y.; Liao, H.Y.M. Yolov4: Optimal speed and accuracy of object detection. arXiv 2020, arXiv:2004.10934. [Google Scholar] [CrossRef]
- Li, C.; Li, L.; Jiang, H.; Weng, K.; Geng, Y.; Li, L.; Ke, Z.; Li, Q.; Cheng, M.; Nie, W.; et al. YOLOv6: A single-stage object detection framework for industrial applications. arXiv 2022, arXiv:2209.02976. [Google Scholar] [CrossRef]
- Ge, Z. Yolox: Exceeding yolo series in 2021. arXiv 2021, arXiv:2107.08430. [Google Scholar] [CrossRef]
- Long, X.; Deng, K.; Wang, G.; Zhang, Y.; Dang, Q.; Gao, Y.; Shen, H.; Ren, J.; Han, S.; Ding, E.; et al. PP-YOLO: An effective and efficient implementation of object detector. arXiv 2020, arXiv:2007.12099. [Google Scholar] [CrossRef]
- Huang, X.; Wang, X.; Lv, W.; Bai, X.; Long, X.; Deng, K.; Dang, Q.; Han, S.; Liu, Q.; Hu, X.; et al. PP-YOLOv2: A practical object detector. arXiv 2021, arXiv:2104.10419. [Google Scholar] [CrossRef]
- Xu, S.; Wang, X.; Lv, W.; Chang, Q.; Cui, C.; Deng, K.; Wang, G.; Dang, Q.; Wei, S.; Du, Y.; et al. PP-YOLOE: An evolved version of YOLO. arXiv 2022, arXiv:2203.16250. [Google Scholar] [CrossRef]
- Ren, S.; He, K.; Girshick, R.; Sun, J. Faster R-CNN: Towards Real-Time Object Detection with Region Proposal Networks. IEEE Trans. Pattern Anal. Mach. Intell. 2017, 39, 1137–1149. [Google Scholar] [CrossRef]
- Sun, Z.; Leng, X.; Lei, Y.; Xiong, B.; Ji, K.; Kuang, G. BiFA-YOLO: A novel YOLO-based method for arbitrary-oriented ship detection in high-resolution SAR images. Remote Sens. 2021, 13, 4209. [Google Scholar] [CrossRef]
- Zhou, Y.; Jiang, X.; Xu, G.; Yang, X.; Liu, X.; Li, Z. PVT-SAR: An arbitrarily oriented SAR ship detector with pyramid vision transformer. IEEE J. Sel. Top. Appl. Earth Obs. Remote Sens. 2022, 16, 291–305. [Google Scholar] [CrossRef]
- Yu, D.; Guo, H.; Zhao, C.; Liu, X.; Xu, Q.; Lin, Y.; Ding, L. An anchor-free and angle-free detector for oriented object detection using bounding box projection. IEEE Trans. Geosci. Remote Sens. 2023. [Google Scholar] [CrossRef]
- Zhou, K.; Zhang, M.; Zhao, H.; Tang, R.; Lin, S.; Cheng, X.; Wang, H. Arbitrary-oriented ellipse detector for ship detection in remote sensing images. IEEE J. Sel. Top. Appl. Earth Obs. Remote Sens. 2023, 16, 7151–7162. [Google Scholar] [CrossRef]
- Song, B.; Li, J.; Wu, J.; Du, B.; Chang, J.; Wan, J.; Liu, T. SRDF: Single-stage rotate object detector via dense prediction and false positive suppression. IEEE Trans. Geosci. Remote Sens. 2023, 61, 5616616. [Google Scholar] [CrossRef]
- Wan, H.; Chen, J.; Huang, Z.; Du, W.; Xu, F.; Wang, F.; Wu, B. Orientation Detector for Small Ship Targets in SAR Images Based on Semantic Flow Feature Alignment and Gaussian Label Matching. IEEE Trans. Geosci. Remote Sens. 2023, 61, 5218616. [Google Scholar] [CrossRef]
- Zhang, Y.; Lu, D.; Qiu, X.; Li, F. Scattering-Point-Guided RPN for Oriented Ship Detection in SAR Images. Remote Sens. 2023, 15, 1411. [Google Scholar] [CrossRef]
- Liu, Y.; Ma, Y.; Chen, F.; Shang, E.; Yao, W.; Zhang, S.; Yang, J. YOLOv7oSAR: A Lightweight High-Precision Ship Detection Model for SAR Images Based on the YOLOv7 Algorithm. Remote Sens. 2024, 16, 913. [Google Scholar] [CrossRef]
- Meng, F.; Qi, X.; Fan, H. LSR-Det: A Lightweight Detector for Ship Detection in SAR Images Based on Oriented Bounding Box. Remote Sens. 2024, 16, 3251. [Google Scholar] [CrossRef]
- Huang, Y.; Wang, D.; Wu, B.; An, D. NST-YOLO11: ViT Merged Model with Neuron Attention for Arbitrary-Oriented Ship Detection in SAR Images. Remote Sens. 2024, 16, 4760. [Google Scholar] [CrossRef]
- Li, P.; Feng, C.; Feng, W.; Hu, X. Oriented Bounding Box Representation Based on Continuous Encoding in Oriented SAR Ship Detection. IEEE J. Sel. Top. Appl. Earth Obs. Remote Sens. 2025, 18, 6350–6362. [Google Scholar] [CrossRef]
- Qin, C.; Wang, X.; Li, G.; He, Y. An improved attention-guided network for arbitrary-oriented ship detection in optical remote sensing images. IEEE Geosci. Remote Sens. Lett. 2022, 19, 1–5. [Google Scholar] [CrossRef]
- Li, J.; Chen, M.; Hou, S.; Wang, Y.; Luo, Q.; Wang, C. An Improved S2A-Net Algorithm for Ship Object Detection in Optical Remote Sensing Images. Remote Sens. 2023, 15, 4559. [Google Scholar] [CrossRef]
- Liu, D. TS2Anet: Ship detection network based on transformer. J. Sea Res. 2023, 195, 102415. [Google Scholar] [CrossRef]
- Liang, Y.; Feng, J.; Zhang, X.; Zhang, J.; Jiao, L. MidNet: An anchor-and-angle-free detector for oriented ship detection in aerial images. IEEE Trans. Geosci. Remote Sens. 2023, 61, 5612113. [Google Scholar] [CrossRef]
- Yan, Z.; Li, Z.; Xie, Y.; Li, C.; Li, S.; Sun, F. Rebidet: An enhanced ship detection model utilizing redet and bi-directional feature fusion. Appl. Sci. 2023, 13, 7080. [Google Scholar] [CrossRef]
- Fang, Z.; Wang, X.; Zhang, L.; Jiang, B. YOLO-RSA: A Multiscale Ship Detection Algorithm Based on Optical Remote Sensing Image. J. Mar. Sci. Eng. 2024, 12, 603. [Google Scholar] [CrossRef]
- Huang, J.; Wang, K.; Hou, Y.; Wang, J. LW-YOLO11: A Lightweight Arbitrary-Oriented Ship Detection Method Based on Improved YOLO11. Sensors 2024, 25, 65. [Google Scholar] [CrossRef]
- Gao, G.; Wang, Y.; Chen, Y.; Yang, G.; Yao, L.; Zhang, X.; Li, H.; Li, G. An Oriented Ship Detection Method of Remote Sensing Image with Contextual Global Attention Mechanism and Lightweight Task-Specific Context Decoupling. IEEE Trans. Geosci. Remote Sens. 2024, 63, 4200918. [Google Scholar] [CrossRef]
- Sun, Z.; Leng, X.; Zhang, X.; Zhou, Z.; Xiong, B.; Ji, K.; Kuang, G. Arbitrary-Direction SAR Ship Detection Method for Multiscale Imbalance. IEEE Trans. Geosci. Remote Sens. 2025, 63, 5208921. [Google Scholar] [CrossRef]
- Zhang, X.; Zhang, S.; Sun, Z.; Liu, C.; Sun, Y.; Ji, K.; Kuang, G. Cross-Sensor SAR Image Target Detection Based on Dynamic Feature Discrimination and Center-Aware Calibration. IEEE Trans. Geosci. Remote Sens. 2025, 63, 5209417. [Google Scholar] [CrossRef]
- Han, J.; Ding, J.; Xue, N.; Xia, G.S. ReDet: A Rotation-equivariant Detector for Aerial Object Detection. In Proceedings of the IEEE/CVF Conference on Computer Vision and Pattern Recognition (CVPR), Nashville, TN, USA, 19–25 June 2021; pp. 2786–2795. [Google Scholar]
- Han, J.; Ding, J.; Li, J.; Xia, G.S. Align deep features for oriented object detection. IEEE Trans. Geosci. Remote Sens. 2021, 60, 5602511. [Google Scholar] [CrossRef]
- Tan, M.; Le, Q. Efficientnet: Rethinking model scaling for convolutional neural networks. In Proceedings of the International Conference on Machine Learning, Long Beach, CA, USA, 9–15 June 2019; pp. 6105–6114. [Google Scholar]
- Feng, C.; Zhong, Y.; Gao, Y.; Scott, M.R.; Huang, W. Tood: Task-aligned one-stage object detection. In Proceedings of the 2021 IEEE/CVF International Conference on Computer Vision (ICCV), Montreal, BC, Canada, 11–17 October 2021; IEEE Computer Society: Washington, DC, USA, 2021; pp. 3490–3499. [Google Scholar]
- Yang, X.; Yan, J.; Feng, Z.; He, T. R3det: Refined single-stage detector with feature refinement for rotating object. In Proceedings of the AAAI Conference on Artificial Intelligence, Online, 2–9 February 2021; Volume 35, pp. 3163–3171. [Google Scholar]
- Yang, X.; Yan, J.; Ming, Q.; Wang, W.; Zhang, X.; Tian, Q. Rethinking rotated object detection with gaussian wasserstein distance loss. In Proceedings of the International Conference on Machine Learning, Virtual, 18–24 July 2021; pp. 11830–11841. [Google Scholar]
- Llerena, J.M.; Zeni, L.F.; Kristen, L.N.; Jung, C. Gaussian bounding boxes and probabilistic intersection-over-union for object detection. arXiv 2021, arXiv:2106.06072. [Google Scholar]
- Zhang, H.; Wang, Y.; Dayoub, F.; Sunderhauf, N. Varifocalnet: An iou-aware dense object detector. In Proceedings of the IEEE/CVF Conference on Computer Vision and Pattern Recognition, Nashville, TN, USA, 19–25 June 2021; pp. 8514–8523. [Google Scholar]
- Liu, Z.; Yuan, L.; Weng, L.; Yang, Y. A high resolution optical satellite image dataset for ship recognition and some new baselines. In Proceedings of the International Conference on Pattern Recognition Applications and Methods, Porto, Portugal, 24–26 February 2017; SciTePress: Setúbal, Portugal, 2017; Volume 2, pp. 324–331. [Google Scholar]
- Congan, X.; Hang, S.; Jianwei, L.; Yu, L.; Libo, Y.; Long, G.; Wenjun, Y.; Taoyang, W. RSDD-SAR: Rotated ship detection dataset in SAR images. J. Radars 2022, 11, 581–599. [Google Scholar]
- Authors, P. PaddleDetection, Object Detection and Instance Segmentation Toolkit Based on PaddlePaddle. 2019. Available online: https://github.com/PaddlePaddle/PaddleDetection (accessed on 24 July 2025).
- Xie, X.; Cheng, G.; Wang, J.; Yao, X.; Han, J. Oriented R-CNN for object detection. In Proceedings of the IEEE/CVF International Conference on Computer Vision, Montreal, BC, Canada, 11–17 October 2021; pp. 3520–3529. [Google Scholar]
- Li, Z.; Hou, B.; Wu, Z.; Ren, B.; Yang, C. FCOSR: A simple anchor-free rotated detector for aerial object detection. Remote Sens. 2023, 15, 5499. [Google Scholar] [CrossRef]
- Wang, X.; Wang, G.; Dang, Q.; Liu, Y.; Hu, X.; Yu, D. PP-YOLOE-R: An efficient anchor-free rotated object detector. arXiv 2022, arXiv:2211.02386. [Google Scholar]
- Hu, J.; Shen, L.; Sun, G. Squeeze-and-excitation networks. In Proceedings of the IEEE Conference on Computer Vision and Pattern Recognition, Salt Lake City, UT, USA, 18–22 June 2018; pp. 7132–7141. [Google Scholar]
- Lee, Y.; Park, J. Centermask: Real-time anchor-free instance segmentation. In Proceedings of the IEEE/CVF Conference on Computer Vision and Pattern Recognition, Seattle, WA, USA, 14–19 June 2020; pp. 13906–13915. [Google Scholar]
- Wang, Q.; Wu, B.; Zhu, P.; Li, P.; Zuo, W.; Hu, Q. ECA-Net: Efficient channel attention for deep convolutional neural networks. In Proceedings of the IEEE/CVF Conference on Computer Vision and Pattern Recognition, Seattle, WA, USA, 14–19 June 2020; pp. 11534–11542. [Google Scholar]
- Hou, Q.; Zhou, D.; Feng, J. Coordinate attention for efficient mobile network design. In Proceedings of the IEEE/CVF Conference on Computer Vision and Pattern Recognition, Nashville, TN, USA, 19–25 June 2021; pp. 13713–13722. [Google Scholar]
- Woo, S.; Park, J.; Lee, J.Y.; Kweon, I.S. Cbam: Convolutional block attention module. In Proceedings of the European Conference on Computer Vision (ECCV), Munich, Germany, 8–14 September 2018; pp. 3–19. [Google Scholar]
Disclaimer/Publisher’s Note: The statements, opinions and data contained in all publications are solely those of the individual author(s) and contributor(s) and not of MDPI and/or the editor(s). MDPI and/or the editor(s) disclaim responsibility for any injury to people or property resulting from any ideas, methods, instructions or products referred to in the content. |
© 2025 by the authors. Licensee MDPI, Basel, Switzerland. This article is an open access article distributed under the terms and conditions of the Creative Commons Attribution (CC BY) license (https://creativecommons.org/licenses/by/4.0/).
