Abstract
Accurate monitoring of the coverage and distribution of photosynthetic (PV) and non-photosynthetic vegetation (NPV) in the grasslands of semi-arid regions is crucial for understanding the environment and addressing climate change. However, the extraction of PV and NPV information from Unmanned Aerial Vehicle (UAV) remote sensing imagery is often hindered by challenges such as low extraction accuracy and blurred boundaries. To overcome these limitations, this study proposed an improved semantic segmentation model, designated SegFormer-CPED. The model was developed based on the SegFormer architecture, incorporating several synergistic optimizations. Specifically, a Convolutional Block Attention Module (CBAM) was integrated into the encoder to enhance early-stage feature perception, while a Polarized Self-Attention (PSA) module was embedded to strengthen contextual understanding and mitigate semantic loss. An Edge Contour Extraction Module (ECEM) was introduced to refine boundary details. Concurrently, the Dice Loss function was employed to replace the Cross-Entropy Loss, thereby more effectively addressing the class imbalance issue and significantly improving both the segmentation accuracy and boundary clarity of PV and NPV. To support model development, a high-quality PV and NPV segmentation dataset for Hengshan grassland was also constructed. Comprehensive experimental results demonstrated that the proposed SegFormer-CPED model achieved state-of-the-art performance, with a mIoU of 93.26% and an F1-score of 96.44%. It significantly outperformed classic architectures and surpassed all leading frameworks benchmarked here. Its high-fidelity maps can bridge field surveys and satellite remote sensing. Ablation studies verified the effectiveness of each improved module and its synergistic interplay. Moreover, this study successfully utilized SegFormer-CPED to perform fine-grained monitoring of the spatiotemporal dynamics of PV and NPV in the Hengshan grassland, confirming that the model-estimated fPV and fNPV were highly correlated with ground survey data. The proposed SegFormer-CPED model provides a robust and effective solution for the precise, semi-automated extraction of PV and NPV from high-resolution UAV imagery.
1. Introduction
Grasslands are among the most extensively distributed types of vegetation in the world. They influence the flow and cycling of nutrients, carbon, water, and energy in ecosystems. They are important for studies on biomass estimation, carbon sources/sinks, water and soil conservation, and climate change [1,2]. Photosynthetic vegetation (PV) refers to the parts of vegetation that contain chlorophyll capable of performing photosynthesis. Non-photosynthetic vegetation (NPV) describes plant material that is unable to carry out photosynthesis, such as dead branches, fallen leaves, and tree trunks [3]. In semi-arid regions, vegetation degradation occurs at an alarming rate, leading to significant ecological concerns. NPV is an important component of natural vegetation in these regions and a crucial factor for monitoring plant survival status and productivity. It plays a significant role in mitigating soil erosion, safeguarding biodiversity, enhancing nutrient cycling, and augmenting carbon sequestration [4]. Prompt and precise observation of PV and NPV coverage and distributions in semi-arid grasslands is crucial for comprehending grassland phenology and ecological succession [5].
Ground-based measurements of PV cover (fPV) and NPV cover (fNPV) are highly accurate [6], but they are limited by spatial, temporal, and financial constraints [7]. Satellite remote sensing can estimate fPV and fNPV over large areas, but it is affected by sensor resolution and weather conditions. This issue of spatial resolution is particularly critical, as it leads to the well-documented mixed-pixel problem. Traditional approaches like spectral unmixing attempt to deconvolve this mixed signal, but inherently lose the fine-scale spatial pattern of vegetation [8]. Other methods rely on spectral indices like the Cellulose Absorption Index (CAI), but existing multispectral satellites such as Landsat and Sentinel-2 lack the specific narrow bands in the SWIR region to accurately calculate them [8,9]. In response to these limitations, the development of low-altitude remote sensing using unmanned aerial vehicles (UAVs) has emerged. UAVs compensate for the shortcomings of satellite remote sensing in terms of image resolution, revisit frequency, and cloud cover [10]. They offer cost-effective, user-friendly operation with high-resolution, real-time imagery, providing a new data source for rapid and accurate vegetation information [11,12]. Crucially, this high resolution enables a paradigm shift: moving from the indirect spectral signal deconvolution required for coarse satellite pixels to the direct spatial classification of individual vegetation components, thus creating a solution to the critical gap in monitoring highly heterogeneous grasslands. However, when processing UAV aerial imagery, traditional pixel-based image interpretation techniques applied to satellite remote sensing data exhibit limitations, including complex feature selection, spectral confusion, low recognition accuracy, and long processing times [13]. Although object-oriented machine learning methods have been widely applied to mitigate some of these issues due to their strong classification performance [14,15], conventional approaches still depend on human–computer interaction, lack full automation, and exhibit poor transferability [16,17].
In recent years, deep learning has become the state-of-the-art for remote sensing image analysis [18]. Early successes were driven by Fully Convolutional Networks (FCNs), which perform efficient pixel-wise classification and spawned influential architectures like U-Net, SegNet, and DeepLab [19,20,21,22,23]. More recently, Transformer-based models such as SegFormer, Mask2Former, and SegViTv2 have become mainstream by capturing global contextual information [24,25,26]. The application of deep learning semantic segmentation models to UAV data for vegetation extraction is becoming increasingly common [27]. Studies have successfully employed and compared various FCN architectures for tasks ranging from mapping urban trees to segmenting PV and NPV in arid regions [28,29]. To tackle more specific challenges, a new generation of targeted models has emerged. For instance, TreeFormer uses hierarchical attention for fine-grained individual tree segmentation [30], while another recent study explores spectral reconstruction from RGB inputs [31]. Furthermore, techniques from adjacent applications, like the MF-SegFormer, which integrates super-resolution for water body extraction, offer valuable inspiration for fine-grained vegetation monitoring [32].
However, despite the demonstrated potential of deep learning methods, significant challenges remain in performing fine-grained segmentation of photosynthetic (PV) and non-photosynthetic vegetation (NPV) in arid and semi-arid grasslands using UAV-based RGB imagery. The Hengshan grassland on the Loess Plateau of China, situated within an arid and semi-arid vegetation zone, is characterized by low species diversity, sparse vegetation cover, a simple community structure, and ecological fragility [33,34]. To date, research on vegetation extraction from UAV data in these regions has predominantly focused on PV, while the coverage estimation of NPV, which occupies a significant ecological niche, has received less attention [35,36]. Standard convolutional and pooling operations in existing models (e.g., U-Net, DeepLabV3+, and SegFormer) inevitably lead to the loss of fine-grained spatial information, thereby diminishing the model’s ability to perceive object boundaries. This problem is particularly pronounced when processing the complex surfaces typical of arid and semi-arid grasslands, which feature a highly interspersed mosaic of PV, NPV, and bare soil with fragmented patches and intricate boundaries. Furthermore, difficulties arise in both distinguishing large, contiguous areas of similar features (e.g., withered grass versus bare soil) and identifying small, interlaced patches, resulting in high rates of misclassification and omission. Consequently, this necessitates a model specifically optimized for this remote sensing problem, capable of handling low inter-class spectral variance and preserving fine textural details that are critical for accurate PV and NPV discrimination.
To address the challenge of accurately segmenting photosynthetic vegetation (PV) and non-photosynthetic vegetation (NPV) from high-resolution UAV imagery, where they are often confounded by similar spectral characteristics and complex spatial distributions, this paper proposes a novel semantic segmentation model, SegFormer-CPED. The model is based on the SegFormer architecture and incorporates several key enhancements: it embeds a CBAM attention module to enhance the network’s identification and perception of important features at an early stage; it introduces a Polarized Self-Attention (PSA) module to improve spatial awareness of large-scale features and mitigate semantic information loss; it adds an auxiliary Edge Contour Extraction Module (ECEM) to the encoder layers to assist the model in extracting shallow edge features; and it replaces the cross-entropy loss function with Dice Loss. To support model development and validation, this study also constructed a high-quality PV and NPV semantic segmentation label database from UAV aerial imagery through multi-scale parameter optimization, feature index selection, and meticulous manual correction.
The contributions of this study are as follows:
- A novel semantic segmentation model, SegFormer-CPED, was proposed. Specifically designed for the fine-grained, high-precision segmentation of photosynthetic (PV) and non-photosynthetic (NPV) vegetation high-resolution UAV remote sensing imagery, this model effectively addresses challenges such as spectral similarity and strong spatial heterogeneity between PV and NPV by synergistically optimizing the SegFormer architecture with multiple modules.
- An innovative, multi-faceted feature enhancement strategy that synergistically optimizes feature discriminability and boundary precision. By integrating a hierarchical attention mechanism (CBAM and PSA) to improve contextual understanding and a parallel Edge Contour Extraction Module (ECEM) to explicitly preserve fine boundary details, our model significantly improves segmentation accuracy in complex grassland remote sensing scenes.
- A meticulously annotated dataset and validated workflow for grassland PV and NPV segmentation, which provides a critical “bridge” for upscaling ecological information. Addressing the scarcity of labeled data, this contribution offers not just a dataset, but a reliable method to generate high-fidelity ground-truth maps. These maps are invaluable for calibrating and validating coarse-resolution satellite remote sensing products, thereby fostering further research in fine-scale ecological monitoring.
2. Materials and Methods
2.1. UAV Aerial Survey Data Acquisition
Hengshan County is located in the central part of the Loess Plateau (Figure 1a) and is a typical semi-arid climatic zone. The region is characterized by harsh natural conditions and complex and varied terrain (Figure 1b), rendering its ecological environment relatively fragile. This unique transitional setting, at the intersection of the Mu Us Desert and the Loess Plateau, creates a natural laboratory containing a mosaic of typical semi-arid landforms, including sandy lands, grasslands, and bare soil. Hengshan County covers an area of approximately 4353 km2, and its geographical location ranges from 37°32′N to 38°31′N latitude and from 108°45′E to 110°31′E longitude.
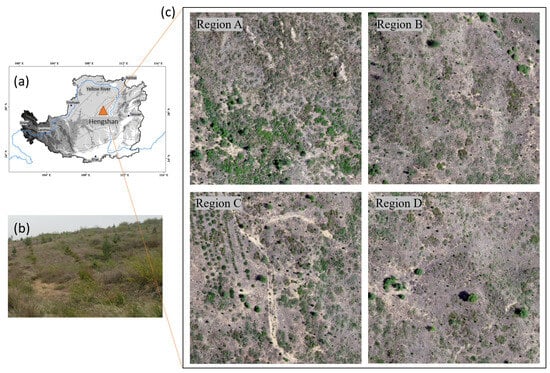
Figure 1.
Overview of the research region. (a) Map of the location of the research area, (b) photograph of the research area, and (c) orthomosaic image of the sub-areas captured by the UAV.
In terms of vegetation types, Hengshan County is predominantly characterized by temperate grasslands and meadow steppes. The main vegetation species are long-awned grass (Stipa bungeana), Dahurian buckwheat (Lespedeza davurica), rigid mugwort (Artemisia sacrorum), and pigweed (Amaranthus spp.) (Figure 1b). These plants have adapted to the semi-arid climate and the soil conditions of the Loess Plateau, forming a representative grassland ecosystem that plays an important role in maintaining ecological balance and conserving soil and water in the region. The co-existence of these species, along with varying degrees of degradation, results in a highly heterogeneous ground cover, making it an ideal and challenging location for developing and testing high-precision vegetation segmentation models.
This study utilized a DJI Phantom 4 Pro UAV, integrated with a CMOS digital camera to acquire low-altitude imagery of typical grassland plots in Hengshan County, a semi-arid region. The UAV remote sensing images were acquired at the beginning of March, on 1 March, 15 March, 30 March, 14 April, 15 May, 13 July, 14 September, and at the end of October. Each flight was scheduled between 11:00 and 13:00, under clear weather conditions with no clouds or wind. The UAV flew at an altitude of approximately 50 m and a speed of 6 m/s, and both the longitudinal and lateral overlaps were set at 80%. The camera lens was maintained at a fixed vertical position relative to the ground to achieve an optimal nadir view. Four plots were strategically selected to represent the internal heterogeneity of the study area, encompassing variations in micro-topography (e.g., slope and aspect) and different mixing ratios of PV, NPV, and bare soil. A total of 4608 original aerial images across nine time periods. These images had a spatial resolution of 0.015 m and included three visible light bands: red (R), green (G), and blue (B). Pix4Dmapper software (v4.5.6) was used to process and mosaic the images, generating DOM and DSM for the plots and providing rich data for the subsequent training of the model.
2.2. Acquisition of Validation Samples and Classification of Ground Objects in Images
In addition to the aerial photography, vegetation surveys were conducted on the ground using the transect method. The transect method involves first marking the center of the plot, and then arranging three 100 m long measuring tapes that proceed from the center point, forming a star shape [37,38]. Starting from the 1 m mark on each tape, vertical observations were made every 1 m, recording the components of the objects on the ground, such as green vegetation, dead vegetation, litter, moss, algae, and various forms of exposed soil. This process resulted in a total of 300 ground observations per plot [31,39]. Finally, by merging and classifying the observations into the categories of PV, NPV, and BS, and dividing by the total number of observations (300), the vertical projected PV and NPV cover levels (i.e., fPV and fNPV) within the plot were calculated. In addition, we collected relevant experimental data accumulated by our research group to obtain fPV and fNPV data derived from a pixel-based tripartite model based on Sentinel-2A imagery for the UAV survey area.
2.3. Construction of Semantic Segmentation Label Database
In this study, the object-oriented classification method proposed by He et al. [29] was adopted to construct a label database supplemented with manual corrections. This method involved multiscale segmentation parameter optimization, feature indicator selection, and manual corrections.
First, we optimized the multi-resolution segmentation (MRS) parameters [40]. The shape and compactness factors were tested at values from 0.1 to 0.9, with the combination of 0.1 (shape) and 0.5 (compactness) yielding the best object homogeneity and clearest edge delineation (Figure 2). Subsequently, using the ESP2 tool [41], we analyzed the local variance curve across scale parameters from 10 to 300 and determined that a scale of 72 was optimal for effectively segmenting PV, NPV, and BS without significant over- or under-segmentation. Second, we optimized the feature set for classification. From an initial set of 24 spectral, textural, and geometric features, we used a random forest algorithm to rank their importance. The analysis revealed that spectral features like Max.dff and vegetation indices like EXG were the most critical. Based on this, we selected the top 10 most important features, which accounted for over 90% of the total contribution, to enhance classification precision and reduce computational complexity.
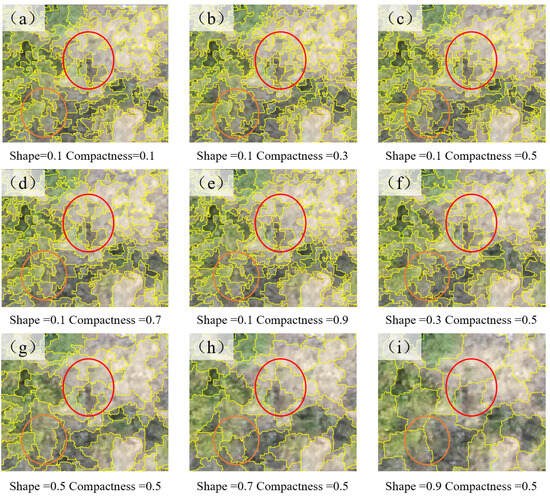
Figure 2.
Segmentation outcomes for various combinations of shape and compactness factors in the Hengshan grassland. Each subfigure represents a different parameter combination: (a) Shape = 0.1, Compactness = 0.1; (b) Shape = 0.1, Compactness = 0.3; (c) Shape = 0.1, Compactness = 0.5 (identified as optimal); (d) Shape = 0.1, Compactness = 0.7; (e) Shape = 0.1, Compactness = 0.9; (f) Shape = 0.3, Compactness = 0.5; (g) Shape = 0.5, Compactness = 0.5; (h) Shape = 0.7, Compactness = 0.5; (i) Shape = 0.9, Compactness = 0.5. The red/orange circles highlight areas where the optimal parameters (c) achieve better object homogeneity and clearer edge delineation compared to others.
Finally, the classification maps generated using these optimized parameters underwent a crucial step of manual visual interpretation and correction to rectify any remaining misclassifications. Upon completion, these high-fidelity label maps were transformed into an indexed map and used to create the final dataset. The regional images and labels were divided into 2150 image patches (512 × 512 pixels). Data augmentation was then applied to expand the dataset to 8600 images, which were partitioned into training (6020), validation (1720), and testing (860) subsets.
2.4. Methods
2.4.1. Overall Technical Framework
The overall technical framework of this study revolves around the construction and application of the SegFormer-CPED model, encompassing four core stages (Figure 3).
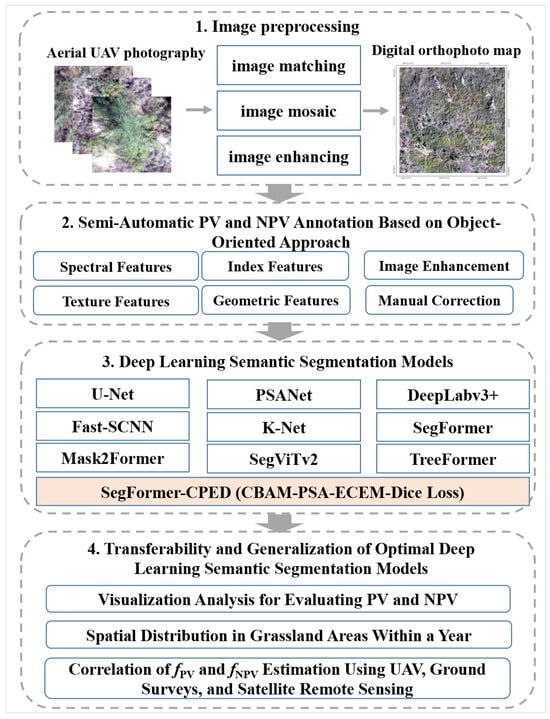
Figure 3.
PV and NPV extraction framework for a typical grassland plot in Hengshan.
First, UAV aerial imagery was acquired and pre-processed. Second, a high-quality semantic segmentation label database for PV and NPV was constructed through multi-scale parameter optimization, feature index selection, and meticulous manual correction. Subsequently, the SegFormer-CPED model was designed and implemented based on the SegFormer architecture. Key improvements included the integration of a multi-level attention mechanism (CBAM and PSA) into the encoder, the introduction of the ECEM edge contour extraction module, and the adoption of Dice Loss for optimization. Finally, the trained SegFormer-CPED model was utilized to perform semantic segmentation of PV and NPV in the UAV grassland imagery, followed by a comprehensive performance evaluation.
2.4.2. The Improved SegFormer-CPED Model
SegFormer [27] is a framework for semantic segmentation. Its key advantage lies in the combination of a hierarchical Transformer encoder and a lightweight, all-MLP (multilayer perceptron) decoder. The encoder utilizes a hierarchical structure to progressively downsample feature maps while increasing channel dimensions, which allows for the effective capture of multi-scale contextual information. Notably, its design avoids complex positional encodings, enabling the model to flexibly adapt to input images of varying resolutions. The decoder, in turn, aggregates features from the different levels of the encoder via simple MLP layers to produce the final segmentation mask.
To address the segmentation difficulties for photosynthetic (PV) and non-photosynthetic (NPV) vegetation in UAV grassland imagery, which arise from factors such as spectral similarity, blurred boundaries, and scale variations, this study performed a multi-module, synergistic optimization of the original SegFormer model.
This study implemented a multi-level hierarchical encoder by embedding different attention modules at various stages of the SegFormer architecture. Specifically, the CBAM attention module was embedded before Block 2 to enhance the network’s ability to identify and perceive important features at an early stage. The Polarized Self-Attention (PSA) module was introduced before Block 3 to augment the network’s spatial awareness of large-scale features and to mitigate semantic information loss. Furthermore, an Edge Contour Extraction Module (ECEM) was added to the encoder layers to assist the model in extracting shallow edge features of the targets. Finally, the Dice Loss function was adopted to replace the cross-entropy loss, thereby enabling high-performance semantic segmentation of UAV grassland imagery. The overall architecture of SegFormer-CPED is illustrated in Figure 4.
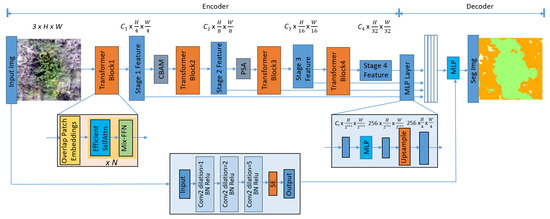
Figure 4.
Architecture of the improved SegFormer-CPED model. The arrows indicate the workflow sequence and the different colors represent the core stages of our framework.
- (1)
- CBAM for Early Feature Enhancement
In the early stages of the SegFormer encoder, specifically after the output of Stage 1 and before Block 2, we introduced the Convolutional Block Attention Module (CBAM) [42]. By sequentially applying channel and spatial attention, CBAM adaptively refines the feature map (Figure 5a), enabling the model to focus on initial features valuable for the identification and classification of grassland PV and NPV at an earlier stage, while suppressing irrelevant or noisy information.
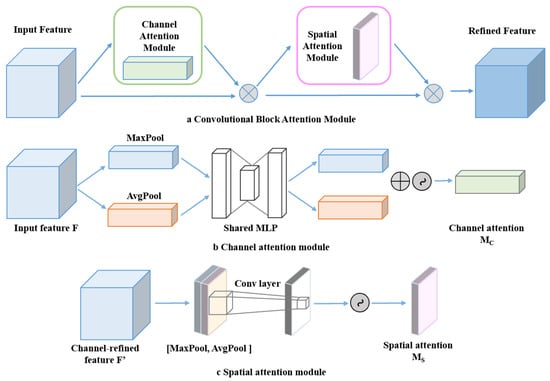
Figure 5.
Architecture of the CBAM model [42]. (a) The overall structure. (b) The Channel Attention Module. (c) The Spatial Attention Module.
The Channel Attention Module aggregates spatial information using both global average pooling and global max pooling. It then learns the importance weights for each channel through a shared multilayer perceptron (MLP), ultimately generating a channel attention map, Mc (Figure 5b). It learns the importance of spatial regions by applying pooling operations across the channel dimension, followed by a convolutional layer, to generate a spatial attention map, Ms (Figure 5c).
- (2)
- PSA for Deep Feature Perception
To enhance the network’s understanding of contextual information and to mitigate the potential loss of semantic feature information in deep network layers, we embedded the Polarized Self-Attention (PSA) module before Block 3 of the SegFormer encoder (Figure 6).
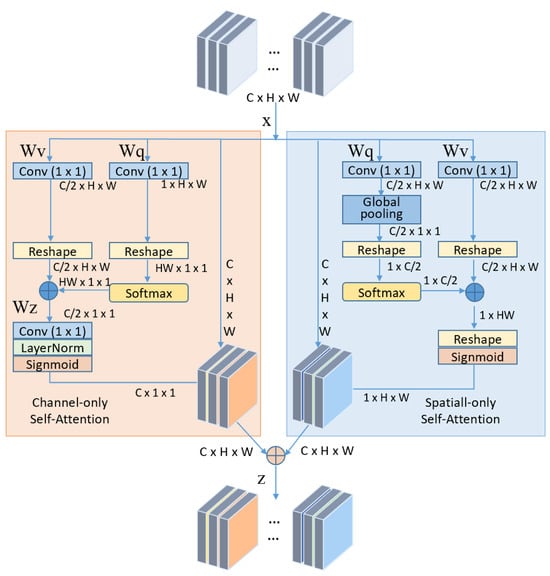
Figure 6.
Architecture of the PSA model [43].
PSA captures long-range dependencies effectively by processing channel and spatial attention in parallel and combining them in a highly efficient manner [43]. This enhances the model’s contextual understanding and spatial awareness of large-scale objects, which is particularly crucial for distinguishing extensive, contiguous regions of PV or NPV.
- (3)
- Edge Contour Extraction Module
To further enhance the precision of boundary segmentation for PV and NPV, we designed and integrated a lightweight Edge Contour Extraction Module (ECEM). The architecture of this module is illustrated in Figure 7.
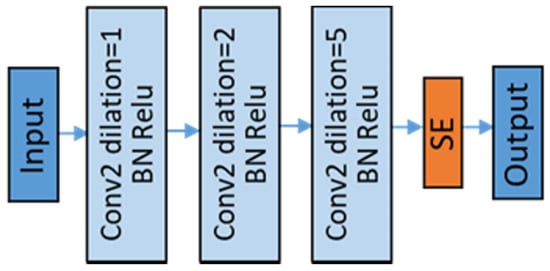
Figure 7.
Architecture of the edge contour extraction module.
Operating as an auxiliary parallel branch, ECEM works in conjunction with the early stages of the SegFormer encoder to explicitly extract multi-scale edge features from the input image.
- (4)
- Dice Loss
To address the common issue of foreground-background pixel imbalance in semantic segmentation tasks and to more directly optimize the regional overlap of segmentation results, we replaced the commonly used cross-entropy loss function in SegFormer with Dice Loss. Dice Loss directly measures the degree of overlap between the predicted mask and the ground truth mask. For multi-class problems, we adopted the average Dice Loss.
2.5. Experimental Setup and Evaluation Metrics
The experiments were conducted using the PyTorch 2.1.2 development framework. The hardware configuration consisted of a GeForce RTX 4090D GPU (NVIDIA, Santa Clara, CA, USA) with 24 GB of VRAM and 240 GB of system memory, enabling rapid training and testing of the semantic segmentation models. The network training parameters were set as follows: the number of input channels was 3; the number of classes was 3; the batch size was set to 4; the number of epochs was 20,000; the base learning rate was 0.001; the learning rate policy was “poly” with a power of 0.9; and stochastic gradient descent (SGD) was chosen as the optimization algorithm.
To evaluate the classification results on the Hengshan grassland UAV imagery, this study employed a comprehensive set of metrics, including Accuracy, Mean Intersection over Union (mIoU), F1-Score, Precision, and Recall [44,45]. These metrics collectively measure the model’s performance on the fine-grained classification task of PV, NPV, and bare soil in the arid and semi-arid grassland from different perspectives.
Accuracy calculates the proportion of correctly predicted pixels to the total number of pixels across all classes. It reflects the overall predictive performance of the model but is susceptible to class imbalance. mIoU is calculated by first computing the ratio of the IoU of the predicted region and the ground truth for each class, and then averaging these values across all classes. It effectively evaluates the model’s accuracy in delineating object boundaries and treats each class equally, demonstrating good robustness against class imbalance. Precision measures the predictive accuracy of the model across all classes. Recall, defined as the average of the recall values for each class, reflects the model’s overall ability to identify all positive samples. F1-Score is the harmonic mean of Precision and Recall, making it suitable for evaluating model performance on imbalanced datasets. The formulas for these metrics are as follows.
where TP represents True Positives, TN represents True Negatives, FP represents False Positives, and FN represents False Negatives.
The coefficient of determination (R2) and significance tests were used for the analysis and evaluation [46]. We analyzed the correlation between three sets of data: (1) the fPV and fNPV values extracted from the UAV imagery of the typical grassland plots in Hengshan, (2) the fPV and fNPV values obtained from concurrent ground surveys, and (3) the fPV and fNPV values derived from the pixel-based tripartite model based on Sentinel-2A imagery.
3. Results
3.1. Performance Comparison of Different Deep Learning Models for Semantic Segmentation in Hengshan Grassland
To comprehensively evaluate the superiority of the proposed SegFormer-CPED model for the task of grassland PV and NPV segmentation, we compared its performance against nine other image segmentation network models: U-Net, PSPNet, DeepLabv3+, Fast-SCNN, K-Net, Mask2Former, SegViTv2, TreeFormer, and the SegFormer. To ensure a fair comparison, all models were tested under identical experimental environments, parameter settings, and datasets. The experimental results are presented in Table 1.

Table 1.
Comparison of PV and NPV segmentation results from different models.
The performance of earlier models underscores the task’s complexity. Classic encoder–decoder architectures like U-Net (75.92% mIoU) and lightweight designs like Fast-SCNN (78.67% mIoU) are insufficient for high-precision segmentation. While more advanced CNN-based models like PSPNet (87.26% mIoU) and the iterative-clustering-based K-Net (87.85% mIoU) show considerable improvement, our direct baseline, SegFormer, establishes a strong starting point at 88.20% mIoU, demonstrating the effectiveness of the Transformer architecture for learning global dependencies in complex grassland scenes.
To situate our work against the latest advancements, we then benchmarked our model against a series of highly competitive contemporary models. Mask2Former, a highly influential universal architecture, significantly raises the bar to 90.52% mIoU. Further pushing the boundary, SegViTv2, a leading general-purpose framework, and TreeFormer, a specialized model for vegetation segmentation, achieved formidable mIoU scores of 91.85% and 92.10%, respectively. These results represent the cutting-edge performance for this type of challenging segmentation task.
Despite this intense competition, our proposed SegFormer-CPED decisively outperforms all other models, achieving a superior mIoU of 93.26%. This represents a substantial 5.06 percentage point improvement over its direct baseline (SegFormer). This marked improvement provides strong evidence for the effectiveness of the introduced CBAM and PSA mechanisms, the ECEM edge module, and the Dice Loss optimization strategy. More importantly, the model’s advantage is even more pronounced when compared to the top-performing competitors. The final result powerfully highlights the benefit of our tailored, problem-specific optimizations, demonstrating that a specialized model can outperform even advanced general-purpose and specialized leading architectures on a specific, challenging task.
Finally, SegFormer-CPED not only ranked first in mIoU and F1-score, which measure overall model performance, but its Precision and Recall also reached 96.87% and 96.04%, respectively, both being the highest among all models. This demonstrates that the proposed model achieves the most comprehensive coverage of target areas while maintaining the accuracy of the segmentation results, striking an optimal balance between precision and completeness.
In terms of model efficiency, SegFormer-CPED has a moderate parameter count (53.86 M) and achieves an inference speed of 29.5 FPS. While the added modules increase complexity and computational cost compared to the original SegFormer, the model still maintains a speed that is viable for near-real-time processing in many UAV monitoring applications, striking a favorable balance between its high accuracy and operational efficiency.
3.2. Qualitative Comparison of Segmentation Results
To more intuitively demonstrate the comprehensive advantages of the SegFormer-CPED model in the PV and NPV segmentation task, we selected a representative area from the Hengshan grassland, designated as Region A, for testing. The segmentation results were then visually compared with those of several other models, analyzing both the overall effects (Figure 8) and local details (Figure 8).
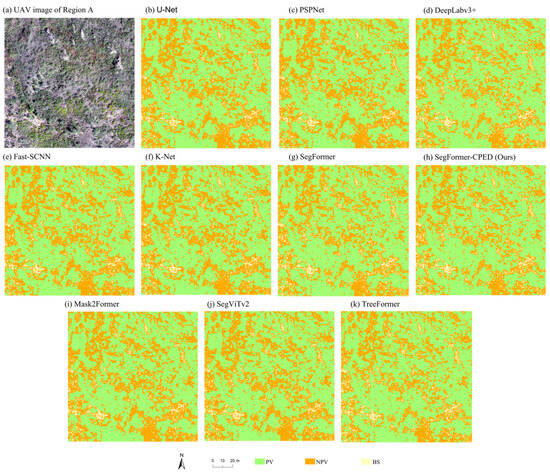
Figure 8.
Overall segmentation results of different models on Region A in the Hengshan grassland.
Figure 8 presents a comparison of the segmentation results in a large-scale, complex scene. From an overall perspective, the segmentation mask generated by our proposed SegFormer-CPED model (Figure 8h) most closely resembles the ground truth image (Figure 8a) at a macroscopic level, exhibiting both continuity and completeness. In contrast, the results from models like U-Net (Figure 8b) and Fast-SCNN (Figure 8e) show significant large-area misclassifications, along with numerous noise artifacts and holes, leading to poor continuity and completeness in the segmentation maps. DeepLabv3+ (Figure 8d) suffered from imprecise boundaries due to excessive smoothing. Although the original SegFormer (Figure 8g) showed some improvement, it still exhibited class confusion in areas where different vegetation types were interspersed (as shown in Region A of Figure 8). To provide a more rigorous comparison, we also observed the results from leading contemporary frameworks. While Mask2Former(Figure 8i), SegViTv2 (Figure 8j), and TreeFormer (Figure 8k) produce highly coherent and visually plausible maps, they tend to slightly over-simplify the most complex textural areas compared to the ground truth. In contrast, our proposed SegFormer-CPED model not only accurately distinguished between PV and NPV but also produced a more continuous and precise overall result with superior robustness, all while preserving fine-grained boundary details (Figure 8h).
To further examine the model’s capability in handling fine-grained structures, Figure 9 provides a magnified view of several typical detail-rich areas for comparison. Regarding boundary processing, U-Net (Figure 9b), Fast-SCNN (Figure 9e), and the original SegFormer (Figure 9g) produced noticeable jagged and blurred artifacts at the junctions between PV and NPV. The excessive smoothing in DeepLabv3+ (Figure 9d) and PSPNet (Figure 9c) resulted in imprecise segmentation boundaries. The advanced frameworks, TreeFormer (Figure 9k) and Mask2Former (Figure 9i), demonstrate superior performance here, generating impressively sharp edges, yet they occasionally miss the most subtle irregularities of the natural boundary. In contrast, SegFormer-CPED (Figure 9h1–h4) was able to generate fine boundaries while maintaining continuity and completeness, a success largely attributable to the enhanced edge feature extraction by the ECEM and the optimization of boundary pixels by the Dice Loss.
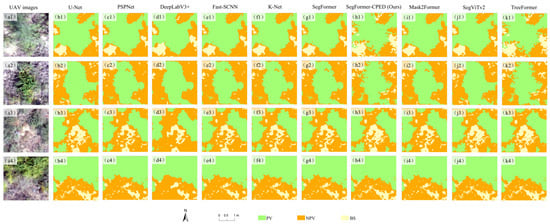
Figure 9.
Local detail comparison of segmentation results from different models on four representative sub-regions (rows 1–4) within Region A. Each column displays the segmentation results of a specific model, corresponding to the labels (a1–k4). The columns represent: (a) Ground Truth; (b) U-Net; (c) PSPNet; (d) DeepLabv3+; (e) Fast-SCNN; (f) K-Net; (g) SegFormer (Baseline); (h) SegFormer-CPED (Ours); (i) Mask2Former; (j) SegViTv2; and (k) TreeFormer.
In terms of small object recognition, other models commonly suffered from omission or commission errors. For instance, DeepLabv3+ (Figure 9d1) overlooked sparsely distributed NPV patches, while U-Net (Figure 9b2) and K-Net (Figure 9f2) incorrectly identified large areas of degraded grassland (NPV) as healthy grassland (PV). Even the highly capable SegViTv2 (Figure 9j1) and Mask2Former (Figure 9i1), while adept at identifying most features, can still overlook the smallest, lowest-contrast NPV patches in our challenging dataset. By leveraging the CBAM in its shallow layers and the PSA module for aggregating multi-scale information, SegFormer-CPED successfully identified and preserved these small features, demonstrating exceptional detail-capturing capabilities. As shown in Figure 9h2, the proposed model could accurately identify even withered grass stems that were only a few pixels wide.
3.3. Ablation Study of the SegFormer-CPED Model
To thoroughly investigate the specific contributions of each improved component within the SegFormer-CPED model—namely, the CBAM attention module, the Polarized Self-Attention (PSA) module, the Edge Contour Extraction Module (ECEM), and the Dice Loss—we designed and conducted a series of ablation experiments. The original SegFormer served as the baseline model. To ensure a fair comparison, all experiments were performed on the same Hengshan grassland PV and NPV semantic segmentation dataset and under identical experimental configurations. The detailed results of the ablation study, including a per-class IoU analysis for photosynthetic vegetation (PV), non-photosynthetic vegetation (NPV), and bare soil (BS), are presented in Table 2.

Table 2.
Ablation study results for the improved modules of the SegFormer-CPED model (√: module included; -: module excluded).
An analysis of the ablation study results in Table 2 reveals the following insights. The baseline model, the original SegFormer, achieved an mIoU of 88.20% and an F1-score of 93.51% on the Hengshan grassland PV and NPV segmentation task. When the CBAM was individually added to the baseline model, the mIoU increased to 89.45% (a 1.25 percentage point improvement) and the F1-score rose to 94.23% (a 0.72 percentage point improvement). This indicates that embedding CBAM in the early stages of the encoder effectively improves segmentation performance by enhancing the identification and perception of important features. The individual introduction of the PSA module resulted in an mIoU of 90.03% (a 1.83 percentage point improvement) and an F1-score of 94.67% (a 1.16 percentage point improvement). This result validates the positive role of the PSA module in augmenting the network’s spatial awareness of large-scale features and mitigating semantic loss in deeper layers, which is particularly crucial for distinguishing between PV and NPV that are spectrally similar but spatially distinct. Similarly, the standalone addition of the ECEM also proved effective, boosting the mIoU to 89.81%. A per-class analysis, also shown in Table 2, reveals that the PSA module provided its greatest benefit to large, contiguous regions like PV (IoU + 1.33%), while ECEM provides the most substantial boost to the IoU of NPV (from 85.11% to 88.52%), which highlights its capability in explicitly refining boundary details for challenging classes with fragmented features. This demonstrates a clear functional differentiation between the modules.
When both the CBAM and PSA modules were introduced simultaneously, the model’s performance was further enhanced, reaching an mIoU of 91.30% and an F1-score of 95.32%. Compared to adding either module alone, the combination of CBAM and PSA yielded more significant performance gains—the mIoU increased by 1.27 percentage points over adding PSA alone and 1.85 percentage points over adding CBAM alone. This demonstrates a strong complementary and synergistic enhancement effect between these two attention mechanisms, which operate at different hierarchical levels and have distinct focuses. Upon further integrating the ECEM on top of the CBAM and PSA combination (as shown in the fifth row of the table), the mIoU rose to 92.41% and the F1-score to 96.03%. This clearly indicates that by assisting the model in extracting shallow edge features of the targets, ECEM effectively improves the accuracy of segmentation boundaries, reducing blurring and misalignment, thereby enhancing overall segmentation quality.
Finally, we investigated the impact of the loss function. As shown in the final rows of Table 2, on the basis of the complete SegFormer-CPED architecture, we compared the performance of the default Cross-Entropy (CE) loss, Focal Loss, and Dice Loss. While Focal Loss, which addresses class imbalance by down-weighting easy examples, improved the mIoU to 92.83% over the CE baseline, the model trained with Dice Loss yielded the best performance across all key metrics (mIoU of 93.26%, F1-score of 96.44%). This proves that for tasks like PV and NPV segmentation, which may involve class imbalance or require high regional overlap, Dice Loss can more directly optimize the segmentation metrics, guiding the model to learn a superior segmentation strategy. Notably, it raised the IoU for the most challenging NPV class to a high of 91.59%, demonstrating its effectiveness in handling complex objects.
Through this series of progressive ablation experiments, it is evident that each improved component in the SegFormer-CPED model makes a positive and quantifiable contribution to its final superior performance. The CBAM and PSA mechanisms enhance feature discriminability at different levels, the ECEM refines the delineation of boundary details, and the Dice Loss guides the model’s training objective towards optimizing for higher regional overlap. The organic integration of these modules enables SegFormer-CPED to effectively address the challenges of PV and NPV segmentation in UAV grassland imagery and achieve high-precision semantic segmentation.
3.4. Generality and Transferability Assessment
To evaluate the practical applicability of the SegFormer-CPED model beyond its specific training dataset, we further examined its generality and transferability under different spatial and temporal conditions. Based on the optimal model trained on the September data from Region A of the Hengshan grassland, we designed a series of direct prediction experiments without any additional fine-tuning. The first set was a spatial transferability test, using data from geographically distinct regions (B, C, and D) but from the same time period (September). This scenario aimed to assess the model’s adaptability to spatial heterogeneity. These regions, while all within the Hengshan grassland ecosystem, exhibit variations in key environmental factors. For instance, Region B is characterized by a gentler slope and higher vegetation coverage, while Region C features steeper terrain and signs of moderate vegetation degradation, and Region D has different soil moisture conditions due to its proximity to a seasonal watercourse. The second set was a series of temporal transferability tests, using data from the same geographical location (Region A) but from different time phases (July and March). This was designed to test the model’s robustness to seasonal phenological changes. The third set was a spatiotemporal transferability test, using sample areas that differed from the training data in both spatial and temporal dimensions (Regions B, C, and D in July). This represented the most challenging test of the model’s generality. The segmentation results from each scenario were quantitatively evaluated using key metrics, including Acc, mIoU, F1-score, Precision, and Recall, supplemented by a visual analysis. Based on the results in Table 3 and Figure 10, the generality and transferability of the SegFormer-CPED model can be analyzed as follows.

Table 3.
Performance of the SegFormer-CPED model under different transfer scenarios.
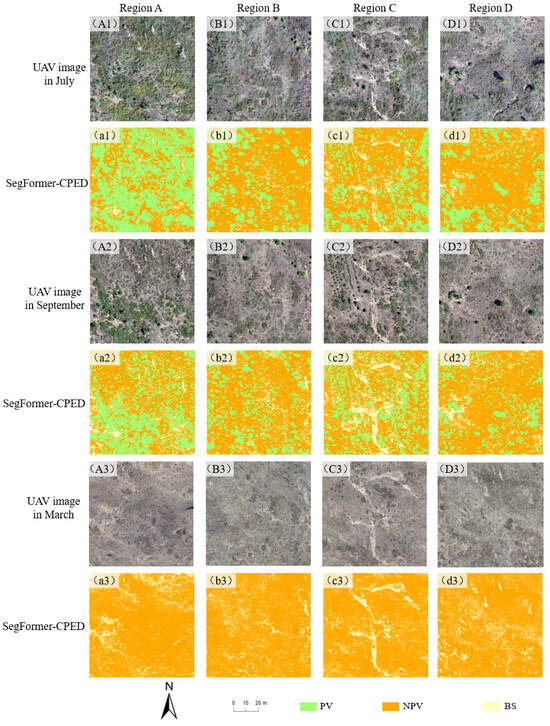
Figure 10.
Comparison between PV and NPV extraction results for July, September, and March when the optimal model SegFormer-CPED was applied to different regions in the Hengshan grassland. The columns represent the different study areas (Region A–D), and the rows display the original UAV imagery and the corresponding segmentation results for each time period. Specifically: (A1–D1) are the UAV images from July, and (a1–d1) are their segmentation results; (A2–D2) are the UAV images from September, and (a2–d2) are their results; (A3–D3) are the UAV images from March, and (a3–d3) are their results.
In the spatial transferability test, the model demonstrated exceptional robustness. Compared to the baseline mIoU of 93.26% in Region A, the mIoU in Regions B, C, and D showed a slight decline but remained at a high level, ranging from 89.42% to 91.08%, with F1-scores all above 94%. This strongly indicates that the model successfully learned generalizable, deep-level features of PV and NPV, rather than overfitting to the specific spatial patterns of the training area. Among these, Region C exhibited the most significant performance drop, with its mIoU decreasing by 3.84 percentage points. This aligns with our field observations, as Region C’s steeper slopes and higher degree of vegetation degradation likely introduced more complex shadows and a greater proportion of bare soil, which are features less prevalent in the training set A, thus posing a greater challenge to the model’s decision-making. This is likely because the surface characteristics, soil moisture, or terrain shadows in this region differed most significantly from those in training set A, thus posing a greater challenge to the model’s decision-making.
In the temporal transferability tests, the decline in the model’s metrics was more pronounced than in the spatial test, and varied significantly with the phenological stage. For instance, in the same Region A, the mIoU for July data (mid-growing season) dropped by 4.23 percentage points to 89.03% compared to the September data. This phenomenon profoundly reveals the model’s sensitivity to phenological variations, as the different spectral responses lead to “concept drift.” Furthermore, to address the critical dormant season, we extended the test to early March. During this time, PV is nearly absent, and the landscape is dominated by NPV, which shares a high degree of similarity with bare soil. As presented in Table 3, this more challenging condition led to a further performance decrease. The mIoU for Region A dropped to 83.54%. This decline highlights the difficulty of distinguishing between senescent vegetation and soil. However, despite this drop, an mIoU score above 80% is still indicative of a highly robust model. This new test powerfully demonstrates that our model retains strong generalization capability even under drastically different phenological conditions.
In the most challenging spatiotemporal transferability scenario, the model’s performance further decreased from the level of the temporal test, with mIoU values ranging between 87.11% and 88.34%. This result was expected, as the model had to simultaneously cope with the dual impacts of spatial heterogeneity and temporal dynamics. However, even under such stringent conditions, the model did not experience catastrophic failure; the overall accuracy remained above 93.6%, and the mean F1-score reached 93.3%. This provides strong evidence that the deep features extracted by the SegFormer-CPED model possess considerable robustness, ensuring a fundamental predictive capability in unseen environments.
In conclusion, the series of transferability experiments clearly delineates the generalization profile of the SegFormer-CPED model. The model exhibits particularly outstanding transferability in the spatial dimension, with strong robustness to geographical heterogeneity. In contrast, changes in the temporal dimension, especially the shift to the dormant season, have a more significant impact on performance, highlighting a key direction for future optimization. In complex, spatiotemporally coupled scenarios, the model maintains reliable segmentation capabilities despite some performance loss, confirming its great potential as a general-purpose tool for PV and NPV extraction. These findings offer valuable insights for developing future remote sensing monitoring models that can be applied across different regions and seasons, suggesting strategies such as joint training with multi-temporal data from different phenological stages or employing domain adaptation techniques to enhance the model’s temporal transferability.
3.5. Application in Dynamic Monitoring and Quantitative Validation
Based on the semi-automated extraction from UAV orthophotos of the Hengshan grassland at different time periods using the SegFormer-CPED model, we successfully obtained clear spatial distribution maps of PV and NPV (Figure 11).
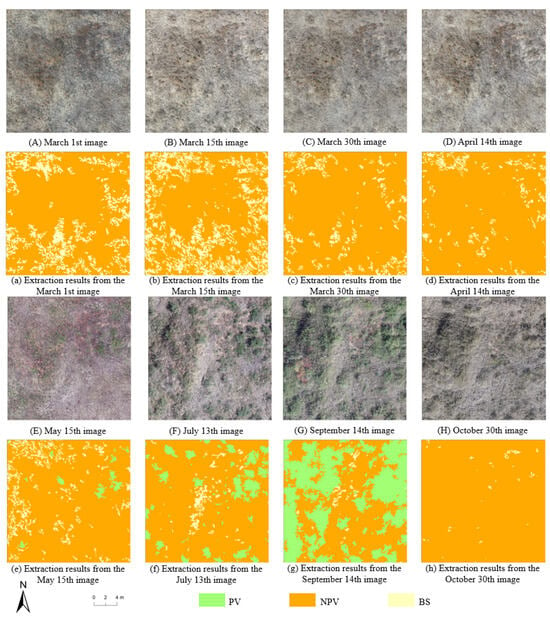
Figure 11.
Results of PV and NPV extraction in different periods for the long-term monitoring sample of the Hengshan grassland.
These time-series distribution maps intuitively reveal the annual growth dynamics of the Hengshan grassland vegetation: from the early year (March–April), when NPV (primarily consisting of greening herbaceous plants and litter) was dominant, to the peak of the growing season (July–September), when PV coverage reached its maximum, and finally to the end of the growing season (October), when PV gradually senesced and transitioned into NPV. PV was predominantly distributed in contiguous patches, while NPV was more commonly found surrounding the PV areas. This capability for fine-grained spatiotemporal dynamic monitoring not only validates the effectiveness of the SegFormer-CPED model in practical applications but also provides invaluable data support for a deeper understanding of regional vegetation phenology and ecological succession processes.
Accurate estimation of fPV and fNPV is crucial for evaluating ecosystem functions. This study further investigated the effectiveness of estimating fPV and fNPV based on the extraction results from UAV imagery using the SegFormer-CPED model. These estimates were then compared with ground-truth survey data and results derived from Sentinel-2A satellite imagery (based on a three-endmember spectral mixture analysis), as shown in Figure 12. The results indicate a high correlation between the fPV and fNPV values obtained from UAV imagery via our proposed framework and the ground-truth survey data across all time periods (fPV: R2 = 0.92; fNPV: R2 = 0.82). This correlation was superior to the comparison between UAV imagery and Sentinel-2A imagery (fPV: R2 = 0.89; fNPV: R2 = 0.74). Notably, for fNPV estimation, the correlation between UAV-derived estimates and ground survey data was significantly higher than that between Sentinel-2A estimates and ground data (R2 = 0.53).
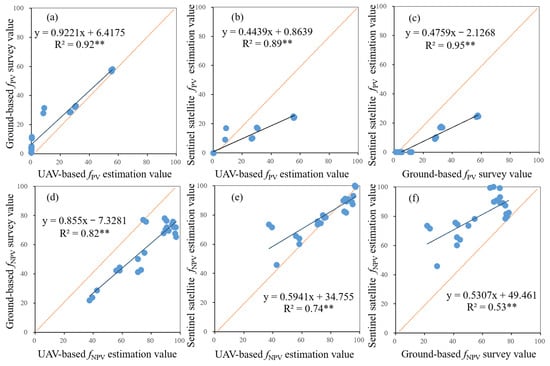
Figure 12.
Correlations between fPV and fNPV estimated from contemporaneous UAV images, ground surveys, and Sentinel-2A images of the Hengshan grassland sample area. (a) Ground-based fPV vs. UAV-based fPV; (b) Sentinel satellite fPV vs. UAV-based fPV; (c) Sentinel satellite fPV vs. ground-based fPV; (d) Ground-based fNPV vs. UAV-based fNPV; (e) Sentinel satellite fNPV vs. UAV-based fNPV; (f) Sentinel satellite fNPV vs. ground-based fNPV. Each blue dot represents a sample plot. The black solid line in each panel is the linear regression fit, while the orange line represents the 1:1 line for reference. The significance level of the correlations is indicated (** p < 0.01).
4. Discussion
4.1. Performance Advantages and Intrinsic Mechanisms of the SegFormer-CPED Model
The experimental results (Table 1) clearly demonstrate that the proposed SegFormer-CPED model significantly outperforms all comparative models, including classic networks like U-Net and PSPNet, and contemporary leading frameworks such as Mask2Former, SegViTv2, and TreeFormer, across all key metrics. Its mIoU and F1-score reached 93.26% and 96.44%, respectively, attesting to its exceptional performance in handling complex grassland scenes. This performance leap is primarily attributable to the designed multi-module synergistic optimization strategy.
The ablation study (Table 2) systematically revealed the contribution of each component. Introducing CBAM in the shallow layers of the encoder (mIoU + 1.25%) and PSA in the deeper layers (mIoU + 1.83%) both led to significant performance gains. CBAM excels at capturing local, detailed features, while PSA effectively captures long-range dependencies and global context. Their hierarchical combination (cumulative mIoU gain of 3.1%) created a complementary advantage, enabling the model to both identify fine, fragmented vegetation patches and understand the overall semantics of large, similar regions (e.g., withered grass vs. bare soil), thereby effectively alleviating the spectral confusion among PV, NPV, and bare soil. Building on this, the introduction of the ECEM further boosted the mIoU to 92.41%. This proves that explicitly extracting and fusing low-level edge features through a dedicated parallel branch can effectively counteract the boundary blurring that may be caused by the patchifying operations in the Transformer architecture. This is crucial for accurately delineating the intricate and fragmented boundaries of vegetation in arid grasslands and is one of the key reasons why the proposed model surpasses others in segmentation detail (as shown in Figure 9). Finally, replacing the loss function with Dice Loss brought the final performance improvement, indicating that for datasets where the areas of PV/NPV/bare soil may be imbalanced, Dice Loss can more directly optimize the regional overlap of segmentation, guiding the model to generate more complete results with fewer holes.
Compared to traditional CNN-based models (e.g., U-Net, PSPNet), the Transformer architecture of SegFormer-CPED provides an inherent advantage in its global receptive field, allowing for a better understanding of contextual information. Compared to the original SegFormer, our targeted improvements make it more adapted to remote sensing segmentation tasks characterized by high spatial resolution, high textural complexity, and high inter-class similarity. A key contribution of this work also lies in positioning this high-resolution segmentation approach within the broader context of remote sensing for vegetation monitoring.
4.2. Methodological Effectiveness, Multi-Source Data Validation, and Limitations
Beyond the model’s performance, the value of this study also lies in positioning its underlying “spatial classification” paradigm within the broader context of remote sensing. As comprehensively reviewed, large-area NPV estimation has traditionally relied on the “spectral unmixing” paradigm, which analyzes the mixed signal from coarse-resolution satellite pixels [8]. While effective for regional assessment, this approach is fundamentally hampered by the mixed-pixel problem.
Our high-resolution UAV-based method offers a complementary solution. By converting the segmentation results into fPV and fNPV, we found a high correlation with ground-truth transect survey data (Figure 12). More importantly, the comparative analysis with Sentinel-2A satellite data demonstrated the immense advantage of our approach in resolving fine, mixed vegetation, a task challenging for medium-resolution remote sensing. This empirically proves that our high-precision method can serve as an effective “bridge” between scales, providing crucial intermediate-scale data for calibrating and validating satellite products and addressing the classic upscaling challenge.
However, the methodology also has limitations. The transferability tests (Table 3) showed that while the model exhibits strong spatial robustness, it experiences a noticeable performance drop in temporal transfer. This performance decay became even more pronounced during the challenging dormant season (March), revealing that phenological change (“concept drift”) is a key factor affecting its generalization ability.
This targeted approach also distinguishes our work from related research [31]. Unlike studies focusing on morphologically distinct objects like urban trees [47], our work tackles the challenge of segmenting low, continuous, yet highly intermixed grassland cover, which tests a model’s texture discrimination capabilities. Furthermore, compared to other improved SegFormer models designed for different tasks like water body extraction [32], our research innovatively integrates multi-level attention and a parallel edge module specifically to solve the remote sensing problem of PV and NPV differentiation.
4.3. Future Research Prospects
Despite the excellent performance of SegFormer-CPED, there is still room for improvement. Future research can be extended in several directions. Concerning model generalization and domain adaptation, our transferability tests confirmed that performance drops during phenological shifts, especially in the dormant season. Therefore, a crucial future direction is to address the challenge of temporal transfer by involving joint training with multi-temporal data or employing unsupervised/self-supervised domain adaptation techniques. This would reduce the model’s dependency on new labeled data for the target time phase. In the area of multi-source data fusion, consideration could be given to mounting hyperspectral or LiDAR sensors on UAVs. Fusing richer spectral and 3D structural information could thereby improve the ability to distinguish between similar vegetation types. Moreover, applying the model’s outputs to quantitative ecological analysis represents a significant future direction. The high-resolution time-series maps produced by SegFormer-CPED can serve as a valuable data source for future studies aiming to quantitatively extract key phenological metrics, such as the start of season (SOS), peak of season (POS), and end of season (EOS), at an unprecedentedly fine scale. Regarding lightweight and efficient models, research into model compression and lightweighting techniques could be pursued while maintaining accuracy. Additionally, fine-tuning hyperparameters such as learning rate and batch size through more extensive automated scanning could also unlock further performance gains. This would adapt the model for edge computing or resource-constrained deployment environments, enabling more efficient real-time monitoring. Integration with emerging vision models presents another promising avenue. Further exploration could involve combining foundational vision models like the Segment Anything Model (SAM) [47,48] with our method, leveraging their powerful zero-shot segmentation capabilities to enhance the automation and generalization of PV and NPV identification.
Through continuous technological innovation and interdisciplinary fusion, the potential of deep learning methods in the remote sensing of photosynthetic and non-photosynthetic vegetation, and in broader vegetation monitoring applications, will be further unlocked, providing stronger technical support and scientific evidence for ecological conservation and sustainable resource management.
5. Conclusions
This study addressed the challenge of precisely segmenting photosynthetic (PV) and non-photosynthetic (NPV) vegetation from high-resolution UAV imagery, where spectral similarity and spatial heterogeneity are significant obstacles. An improved deep learning semantic segmentation model, SegFormer-CPED, was successfully developed and validated. By integrating a multi-level attention mechanism (CBAM and PSA), an Edge Contour Extraction Module (ECEM), and the Dice Loss function into the SegFormer architecture, the model’s segmentation accuracy and robustness were significantly enhanced. The main conclusions are as follows.
- SegFormer-CPED demonstrated superior performance in the Hengshan grassland PV and NPV segmentation task, achieving a mean Intersection over Union (mIoU) of 93.26% and an F1-score of 96.44%. It significantly outperformed the original SegFormer and other mainstream comparative models like U-Net, PSPNet, as well as recent leading frameworks, including Mask2Former, SegViTv2, and TreeFormer.
- The proposed multi-module synergistic optimization strategy proved effective. Ablation studies confirmed that the combination of CBAM and PSA mechanisms enhanced the model’s discriminability of multi-scale features, the ECEM effectively sharpened the boundaries of fragmented vegetation, and the Dice Loss improved the handling of class imbalance. The synergistic action of these components led to a substantial performance leap.
- The method demonstrates significant practical value by acting as a reliable “bridge” between ground surveys and satellite remote sensing. Its ability to generate high-fidelity maps provides a powerful tool for addressing the mixed-pixel problem inherent in coarse-resolution satellite imagery and for providing superior data for the calibration and validation of large-area ecological models.
- The model exhibited strong spatial generalization but higher sensitivity to temporal shifts, particularly during the dormant season. This highlights that phenological change is a key factor affecting the model’s transferability and points to a clear direction for future optimization regarding temporal adaptability.
In summary, the proposed SegFormer-CPED model, along with its accompanying dataset construction methodology, provides an effective solution for the precise and automated extraction of PV and NPV from high-resolution UAV imagery. This work is of significant theoretical and practical value for the fine-grained monitoring of grassland ecosystems, the study of phenological changes, and sustainable management.
Author Contributions
Conceptualization, J.H. and X.Z.; methodology, J.H. and D.L.; software, J.H. and W.L.; validation, J.H. and W.L.; formal analysis, J.H. and W.F.; investigation, Y.R.; resources, J.H. and D.L.; data curation, J.H. and X.Z.; writing—original draft preparation, J.H.; writing—review and editing J.H. and X.Z.; visualization, W.F. and D.L.; supervision, W.L.; project administration, X.Z. and W.L.; funding acquisition, X.Z. and W.L. All authors have read and agreed to the published version of the manuscript.
Funding
This research was funded by the Proof of Concept Fund (grant number XJ2023230052), the Shaanxi Provincial Water Conservancy Fund Project (grant number 2024SLKJ-16), the research project of Shaanxi Coal Geology Group Co., Ltd. (grant number SMDZ-2023CX-14) and the Shaanxi Provincial Public Welfare Geological Survey Project (grant number 202508).
Data Availability Statement
Data is contained within the article. The dataset and code that support the findings of this study are available from the corresponding author upon reasonable request.
Conflicts of Interest
The authors declare that this study received funding from Shaanxi Coal Geology Group Co., Ltd. The funder was not involved in the study design, collection, analysis, interpretation of data, the writing of this article or the decision to submit it for publication.
References
- Bai, X.; Zhao, W.; Luo, W.; An, N. Effect of climate change on the seasonal variation in photosynthetic and non-photosynthetic vegetation coverage in desert areas, Northwest China. Catena 2024, 239, 107954. [Google Scholar] [CrossRef]
- Hill, M.J.; Guerschman, J.P. Global trends in vegetation fractional cover: Hotspots for change in bare soil and non-photosynthetic vegetation. Agric. Ecosyst. Environ. 2022, 324, 107719. [Google Scholar] [CrossRef]
- Carlson, T.N.; Ripley, D.A. On the relation between NDVI, fractional vegetation cover, and leaf area index. Remote Sens. Environ. 1997, 62, 241–252. [Google Scholar] [CrossRef]
- Bannari, A.; Pacheco, A.; Staenz, K.; McNairn, H.; Omari, K. Estimating and mapping crop residues cover on agricultural lands using hyperspectral and IKONOS data. Remote Sens. Environ. 2006, 104, 447–459. [Google Scholar] [CrossRef]
- Wardle, J.; Phillips, Z. Examining Spatiotemporal Photosynthetic Vegetation Trends in Djibouti Using Fractional Cover Metrics in the Digital Earth Africa Open Data Cube. Remote Sens. 2024, 16, 1241. [Google Scholar] [CrossRef]
- Lyu, D.; Liu, B.; Zhang, X.; Yang, X.; He, L.; He, J.; Guo, J.; Wang, J.; Cao, Q. An experimental study on field spectral measurements to determine appropriate daily time for distinguishing fractional vegetation cover. Remote Sens. 2020, 12, 2942. [Google Scholar] [CrossRef]
- Zheng, G.; Bao, A.; Li, X.; Jiang, L.; Chang, C.; Chen, T.; Gao, Z. The potential of multispectral vegetation indices feature space for quantitatively estimating the photosynthetic, non-photosynthetic vegetation and bare soil fractions in Northern China. Photogramm. Eng. Remote Sens. 2019, 85, 65–76. [Google Scholar] [CrossRef]
- Verrelst, J.; Halabuk, A.; Atzberger, C.; Hank, T.; Steinhauser, S.; Berger, K. A comprehensive survey on quantifying non-photosynthetic vegetation cover and biomass from imaging spectroscopy. Ecol. Indic. 2023, 155, 110911. [Google Scholar] [CrossRef]
- Guerschman, J.P.; Hill, M.J.; Renzullo, L.J.; Barrett, D.J.; Marks, A.S.; Botha, E.J. Estimating fractional cover of photosynthetic vegetation, non-photosynthetic vegetation and bare soil in the Australian tropical savanna region upscaling the EO-1 Hyperion and MODIS sensors. Remote Sens. Environ. 2009, 113, 928–945. [Google Scholar] [CrossRef]
- Yao, H.; Qin, R.; Chen, X. Unmanned aerial vehicle for remote sensing applications—A review. Remote Sens. 2019, 11, 1443. [Google Scholar] [CrossRef]
- Osco, L.P.; Junior, J.M.; Ramos, A.P.M.; de Castro Jorge, L.A.; Fatholahi, S.N.; de Andrade Silva, J.; Matsubara, E.T.; Pistori, H.; Gonçalves, W.N.; Li, J. A review on deep learning in UAV remote sensing. Int. J. Appl. Earth Obs. Geoinf. 2021, 102, 102456. [Google Scholar] [CrossRef]
- Liu, Z.; Chen, C.; Huang, Z.; Chang, Y.C.; Liu, L.; Pei, Q. A Low-Cost and Lightweight Real-Time Object-Detection Method Based on UAV Remote Sensing in Transportation Systems. Remote Sens. 2024, 16, 3712. [Google Scholar] [CrossRef]
- Ouchra, H.; Belangour, A.; Erraissi, A. A comparative study on pixel-based classification and object-oriented classification of satellite image. Int. J. Eng. Trends Technol. 2022, 70, 206–215. [Google Scholar] [CrossRef]
- Ozturk, M.Y.; Colkesen, I. A novel hybrid methodology integrating pixel-and object-based techniques for mapping land use and land cover from high-resolution satellite data. Int. J. Remote Sens. 2024, 45, 5640–5678. [Google Scholar] [CrossRef]
- Lin, Y.; Guo, J. Fuzzy geospatial objects−based wetland remote sensing image Classification: A case study of Tianjin Binhai New area. Int. J. Appl. Earth Obs. Geoinf. 2024, 132, 104051. [Google Scholar] [CrossRef]
- De Castro, A.I.; Torres-Sánchez, J.; Peña, J.M.; Jiménez-Brenes, F.M.; Csillik, O.; López-Granados, F. An automatic random forest-OBIA algorithm for early weed mapping between and within crop rows using UAV imagery. Remote Sens. 2018, 10, 285. [Google Scholar] [CrossRef]
- Zi Chen, G.; Tao, W.; Shu Lin, L.; Wen Ping, K.; Xiang, C.; Kun, F.; Ying, Z. Comparison of the backpropagation network and the random forest algorithm based on sampling distribution effects consideration for estimating nonphotosynthetic vegetation cover. Int. J. Appl. Earth Obs. Geoinf. 2021, 104, 102573. [Google Scholar] [CrossRef]
- Kattenborn, T.; Leitloff, J.; Schiefer, F.; Hinz, S. Review on Convolutional Neural Networks (CNN) in vegetation remote sensing. ISPRS J. Photogramm. Remote Sens. 2021, 173, 24–49. [Google Scholar] [CrossRef]
- Gidaris, S.; Komodakis, N. Object detection via a multi-region and semantic segmentation-aware cnn model. In Proceedings of the IEEE International Conference on Computer Vision, Santiago, Chile, 7–13 December 2015; pp. 1134–1142. [Google Scholar]
- Fang, H.; Lafarge, F. Pyramid scene parsing network in 3D: Improving semantic segmentation of point clouds with multi-scale contextual information. ISPRS J. Photogramm. Remote Sens. 2019, 154, 246–258. [Google Scholar] [CrossRef]
- Qin, X.; Zhang, Z.; Huang, C.; Dehghan, M.; Zaiane, O.R.; Jagersand, M. U2-Net: Going deeper with nested U-structure for salient object detection. Pattern Recognit. 2020, 106, 107404. [Google Scholar] [CrossRef]
- Badrinarayanan, V.; Kendall, A.; Cipolla, R. SegNet: A deep convolutional encoder-decoder architecture for image segmentation. IEEE Trans. Pattern Anal. Mach. Intell. 2017, 39, 2481–2495. [Google Scholar] [CrossRef] [PubMed]
- Liu, C.; Chen, L.; Schroff, F.; Adam, H.; Hua, W.; Yuille, A.L.; Fei-Fei, L. Auto-deeplab: Hierarchical neural architecture search for semantic image segmentation. In Proceedings of the IEEE/CVF Conference on Computer Vision and Pattern Recognition, Long Beach, CA, USA, 15–21 June 2019; pp. 82–92. [Google Scholar]
- Xie, E.; Wang, W.; Yu, Z.; Anandkumar, A.; Álvarez, J.M.; Luo, P. SegFormer: Simple and Efficient Design for Semantic Segmentation with Transformers. Neural Inf. Process. Syst. 2021, 34, 12077–12090. [Google Scholar]
- Guo, S.; Yang, Q.; Xiang, S.; Wang, S.; Wang, X. Mask2Former with Improved Query for Semantic Segmentation in Remote-Sensing Images. Mathematics 2024, 12, 765. [Google Scholar] [CrossRef]
- Zhang, B.; Liu, L.; Phan, M.; Tian, Z.; Shen, C.; Liu, Y. SegViTv2: Exploring efficient and continual semantic segmentation with plain vision transformers. Int. J. Comput. Vis. 2023, 132, 1126–1147. [Google Scholar] [CrossRef]
- Putkiranta, P.; Räsänen, A.; Korpelainen, P.; Erlandsson, R.; Kolari, T.H.; Pang, Y.; Villoslada, M.; Wolff, F.; Kumpula, T.; Virtanen, T. The value of hyperspectral UAV imagery in characterizing tundra vegetation. Remote Sens. Environ. 2024, 308, 114175. [Google Scholar] [CrossRef]
- Lobo Torres, D.; Queiroz Feitosa, R.; Nigri Happ, P.; Elena Cué La Rosa, L.; Marcato Junior, J.; Martins, J.; Ola Bressan, P.; Gonçalves, W.N.; Liesenberg, V. Applying fully convolutional architectures for semantic segmentation of a single tree species in urban environment on high resolution UAV optical imagery. Sensors 2020, 20, 563. [Google Scholar] [CrossRef]
- He, J.; Lyu, D.; He, L.; Zhang, Y.; Xu, X.; Yi, H.; Tian, Q.; Liu, B.; Zhang, X. Combining object-oriented and deep learning methods to estimate photosynthetic and non-photosynthetic vegetation cover in the desert from unmanned aerial vehicle images with consideration of shadows. Remote Sens. 2022, 15, 105. [Google Scholar] [CrossRef]
- Zhao, H.; Shi, J.; Qi, X.; Wang, X.; Jia, J. Pyramid scene parsing network. In Proceedings of the IEEE Conference on Computer Vision and Pattern Recognition, Honolulu, HI, USA, 21–26 July 2017; pp. 2881–2890. [Google Scholar]
- Pei, Z.; Wu, X.; Wu, X.; Xiao, Y.; Yu, P.; Gao, Z.; Wang, Q.; Guo, W. Segmenting vegetation from UAV images via spectral reconstruction in complex field environments. Plant Phenom. 2025, 7, 100021. [Google Scholar] [CrossRef]
- Zhang, T.; Li, W.; Feng, X.; Ren, Y.; Qin, C.; Ji, W.; Yang, X. Super-Resolution Water Body Extraction Based on MF-SegFormer. In Proceedings of the IGARSS 2024–2024 IEEE International Geoscience and Remote Sensing Symposium, Athens, Greece, 7–12 July 2024; pp. 9848–9852. [Google Scholar]
- Zhang, Z.; Pan, H.; Liu, Y.; Sheng, S. Ecosystem Services’ Response to Land Use Intensity: A Case Study of the Hilly and Gully Region in China’s Loess Plateau. Land 2024, 13, 2039. [Google Scholar] [CrossRef]
- Yang, H.; Gao, X.; Sun, M.; Wang, A.; Sang, Y.; Wang, J.; Zhao, X.; Zhang, S.; Ariyasena, H. Spatial and temporal patterns of drought based on RW-PDSI index on Loess Plateau in the past three decades. Ecol. Indic. 2024, 166, 112409. [Google Scholar] [CrossRef]
- Sato, Y.; Tsuji, T.; Matsuoka, M. Estimation of rice plant coverage using sentinel-2 based on UAV-observed data. Remote Sens. 2024, 16, 1628. [Google Scholar] [CrossRef]
- Zhang, Z.; Huang, L.; Wang, Q.; Jiang, L.; Qi, Y.; Wang, S.; Shen, T.; Tang, B.; Gu, Y. UAV Hyperspectral Remote Sensing Image Classification: A Systematic Review. IEEE J. Sel. Top. Appl. Earth Obs. Remote Sens. 2024, 18, 3099–3124. [Google Scholar] [CrossRef]
- Burnham, K.P.; Anderson, D.R.; Laake, J.L. Estimation of density from line transect sampling of biological populations. Wildl. Monogr. 1980, 72, 3–202. [Google Scholar]
- Chai, G.; Wang, J.; Wu, M.; Li, G.; Zhang, L.; Wang, Z. Mapping the fractional cover of non-photosynthetic vegetation and its spatiotemporal variations in the Xilingol grassland using MODIS imagery (2000−2019). Geocarto Int. 2022, 37, 1863–1879. [Google Scholar] [CrossRef]
- Ez-zahouani, B.; Teodoro, A.; El Kharki, O.; Jianhua, L.; Kotaridis, I.; Yuan, X.; Ma, L. Remote sensing imagery segmentation in object-based analysis: A review of methods, optimization, and quality evaluation over the past 20 years. Remote Sens. Appl. Soc. Environ. 2023, 32, 101031. [Google Scholar] [CrossRef]
- Ye, F.; Zhou, B. Mangrove Species Classification from Unmanned Aerial Vehicle Hyperspectral Images Using Object-Oriented Methods Based on Feature Combination and Optimization. Sensors 2024, 24, 4108. [Google Scholar] [CrossRef]
- Drǎguţ, L.; Tiede, D.; Levick, S.R. ESP: A tool to estimate scale parameter for multiresolution image segmentation of remotely sensed data. Int. J. Geogr. Inf. Sci. 2010, 24, 859–871. [Google Scholar] [CrossRef]
- Woo, S.; Park, J.; Lee, J.; Kweon, I.S. Cbam: Convolutional block attention module. In Proceedings of the European conference on computer vision (ECCV), Munich, Germany, 8–14 September 2018; pp. 3–19. [Google Scholar]
- Liu, H.; Liu, F.; Fan, X.; Huang, D. Polarized self-attention: Towards high-quality pixel-wise regression. arXiv 2021, arXiv:2107.00782. [Google Scholar]
- Congalton, R.G. A review of assessing the accuracy of classifications of remotely sensed data. Remote Sens. Environ. 1991, 37, 35–46. [Google Scholar] [CrossRef]
- Adegun, A.A.; Viriri, S.; Tapamo, J. Review of deep learning methods for remote sensing satellite images classification: Experimental survey and comparative analysis. J. Big Data 2023, 10, 93. [Google Scholar] [CrossRef]
- Karunasingha, D.S.K. Root mean square error or mean absolute error? Use their ratio as well. Inf. Sci. 2022, 585, 609–629. [Google Scholar] [CrossRef]
- Lumnitz, S.; Devisscher, T.; Mayaud, J.R.; Radic, V.; Coops, N.C.; Griess, V.C. Mapping trees along urban street networks with deep learning and street-level imagery. ISPRS J. Photogramm. Remote Sens. 2021, 175, 144–157. [Google Scholar] [CrossRef]
- Reddy, J.; Niu, H.; Scott, J.L.L.; Bhandari, M.; Landivar, J.A.; Bednarz, C.W.; Duffield, N. Cotton Yield Prediction via UAV-Based Cotton Boll Image Segmentation Using YOLO Model and Segment Anything Model (SAM). Remote Sens. 2024, 16, 4346. [Google Scholar] [CrossRef]
Disclaimer/Publisher’s Note: The statements, opinions and data contained in all publications are solely those of the individual author(s) and contributor(s) and not of MDPI and/or the editor(s). MDPI and/or the editor(s) disclaim responsibility for any injury to people or property resulting from any ideas, methods, instructions or products referred to in the content. |
© 2025 by the authors. Licensee MDPI, Basel, Switzerland. This article is an open access article distributed under the terms and conditions of the Creative Commons Attribution (CC BY) license (https://creativecommons.org/licenses/by/4.0/).