Leveraging Sentinel-2 Data and Machine Learning for Drought Detection in India: The Process of Ground Truth Construction and a Case Study
Highlights
- Ensemble learning models trained on Sentinel-2 multispectral indices reliably classified regional drought conditions in India during the Rabi season, with Bagging Classifier and Random Forest yielding accuracies above 83%, and seasonal majority voting raising performance to 94%.
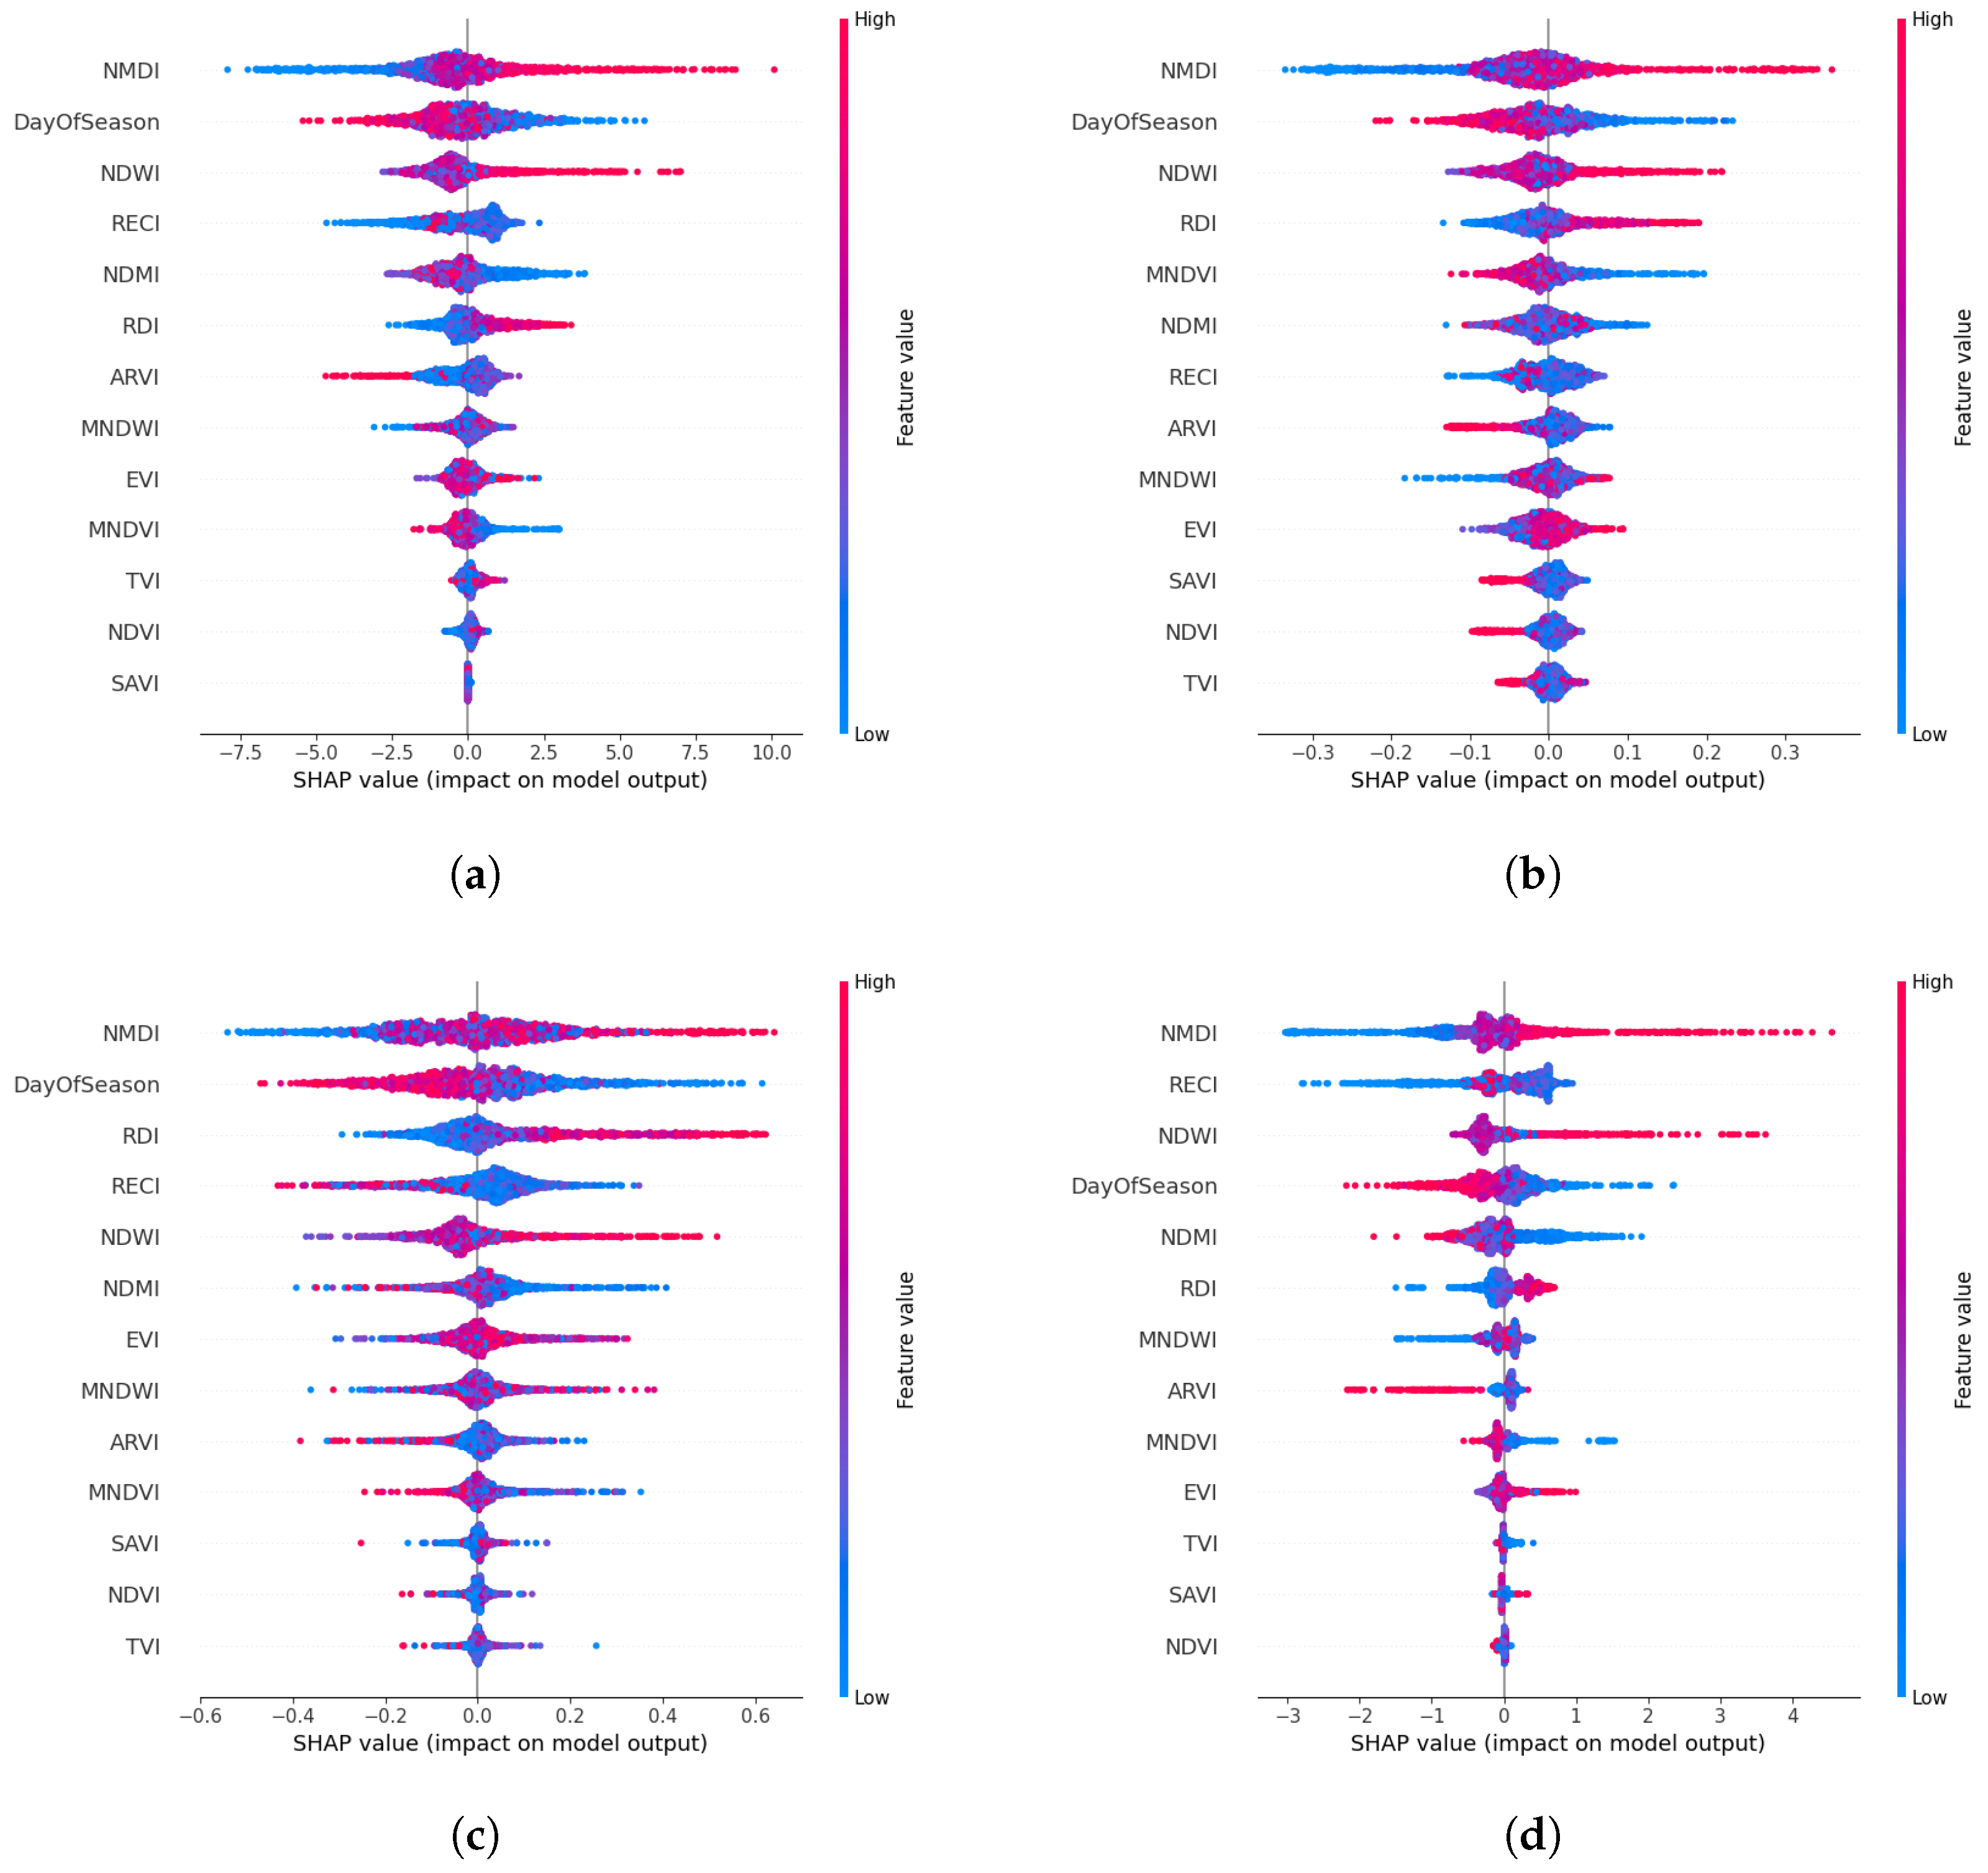
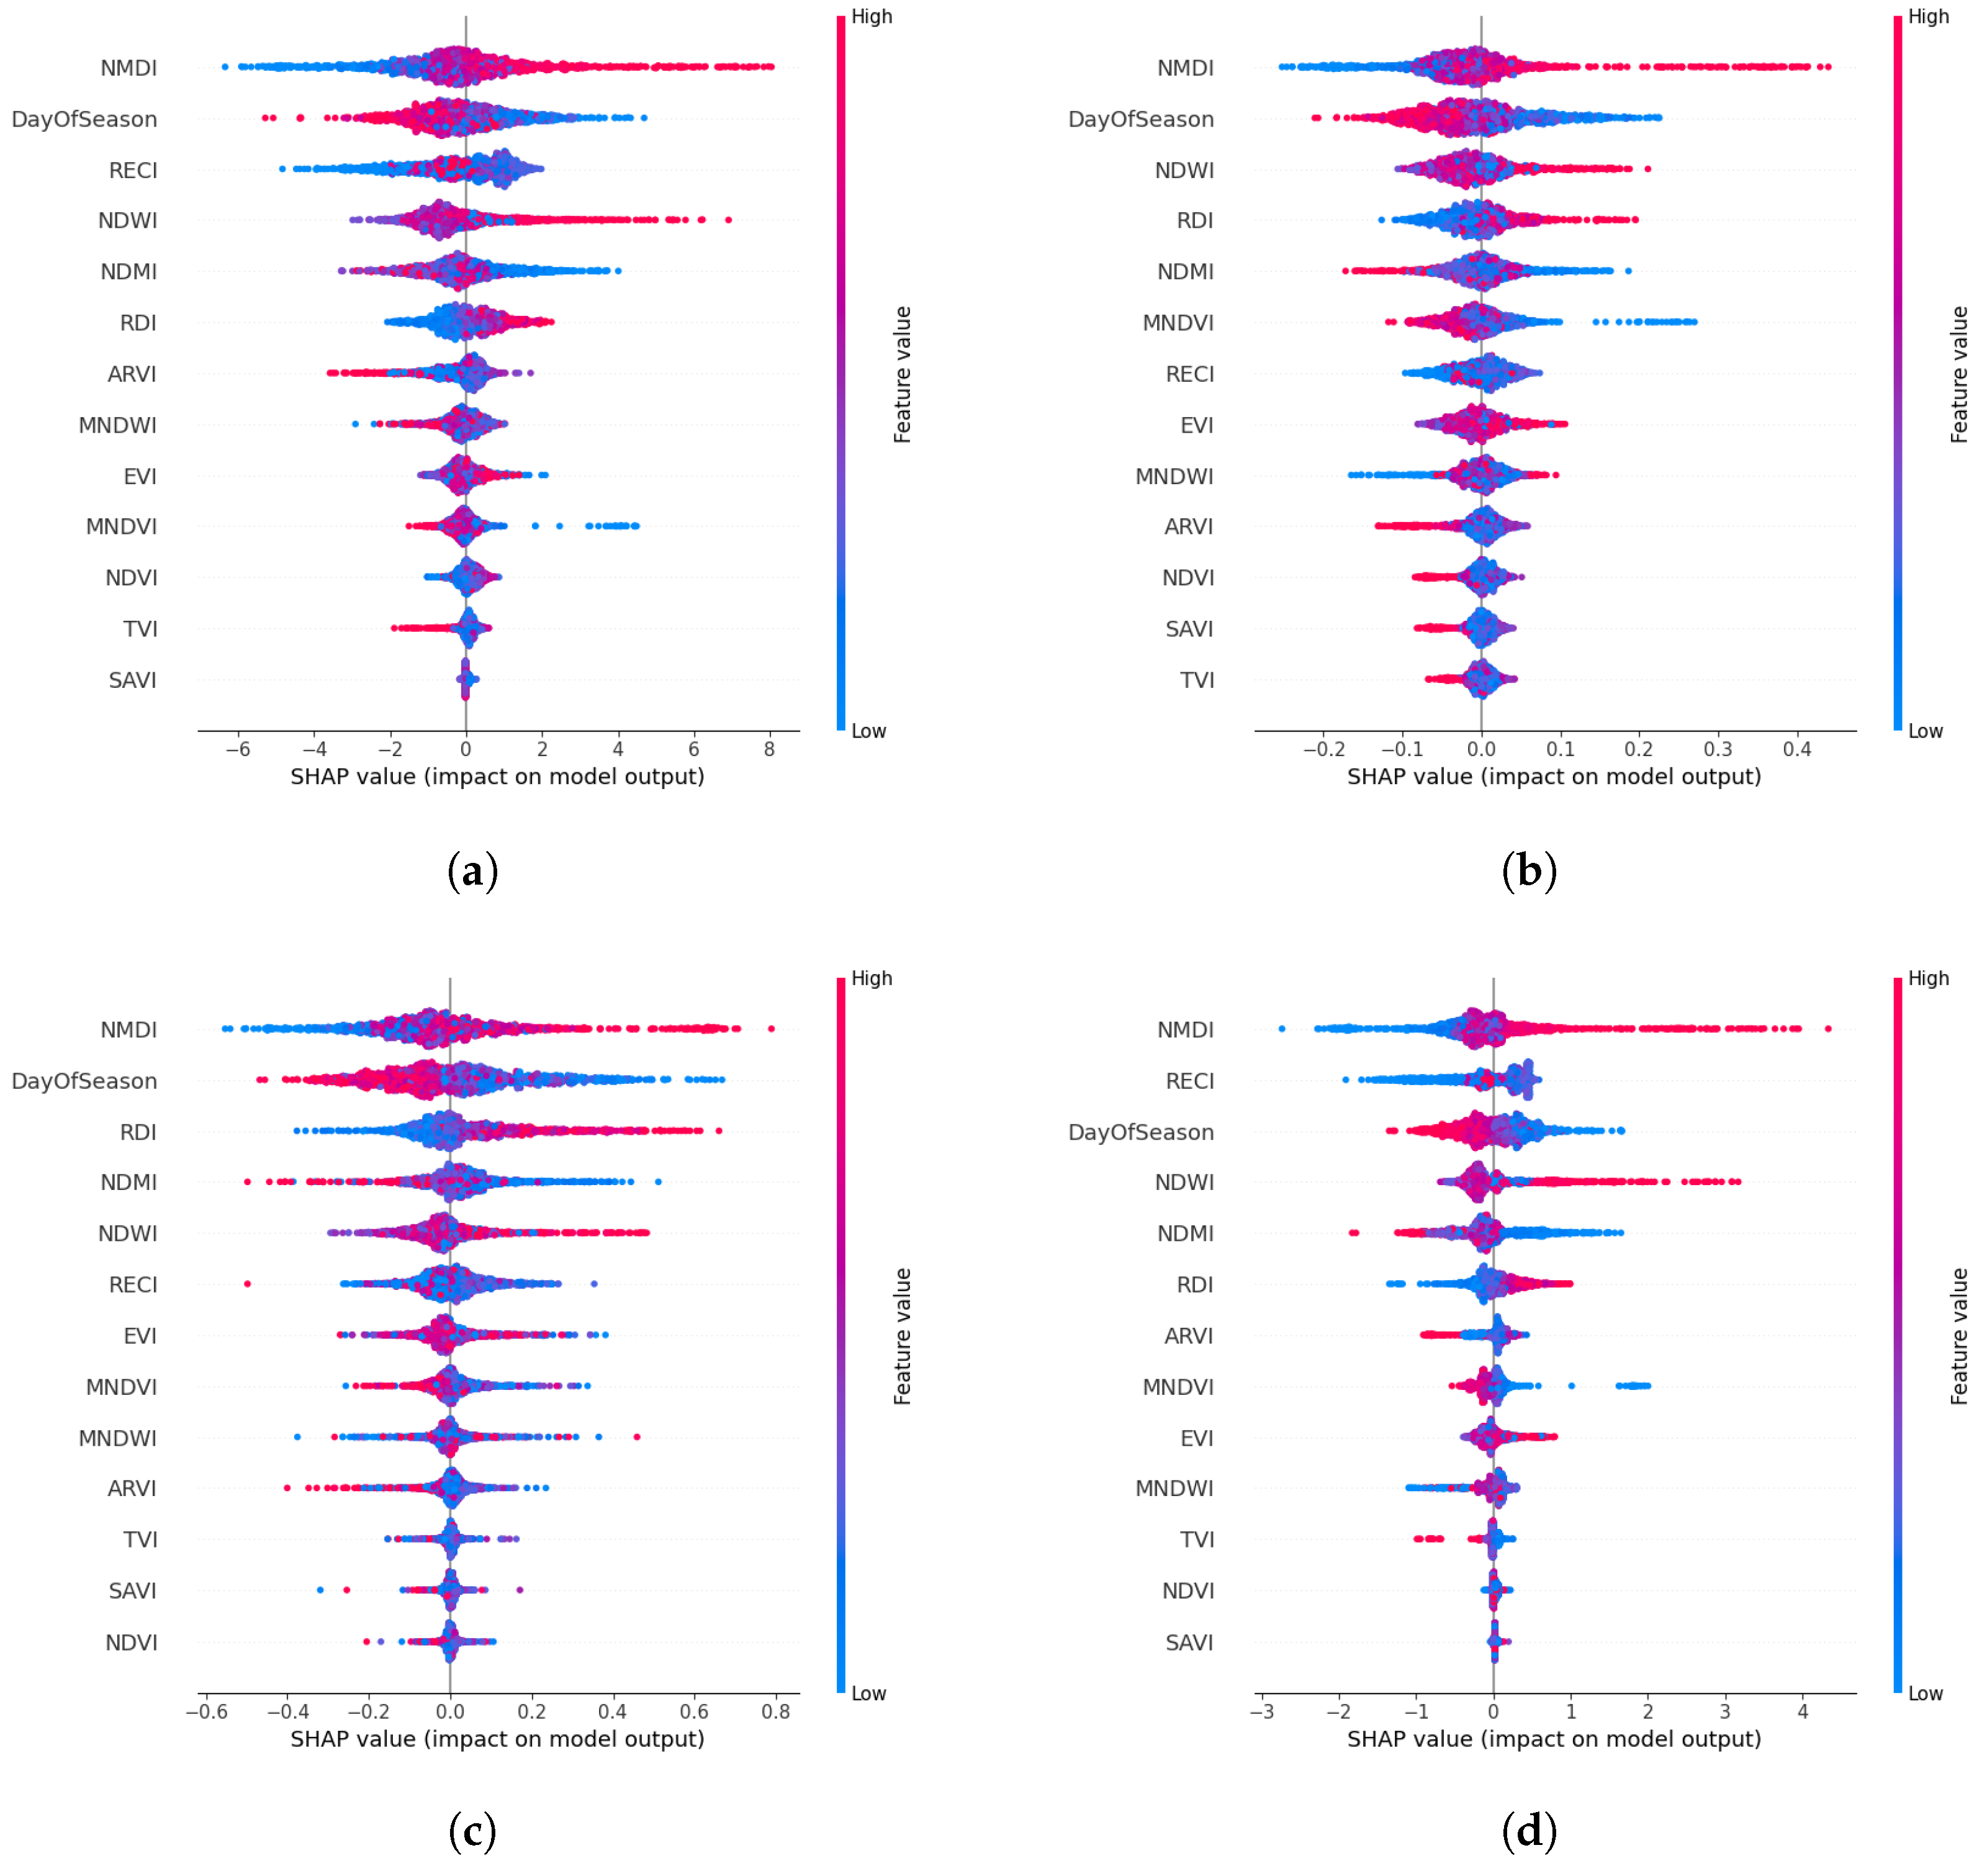
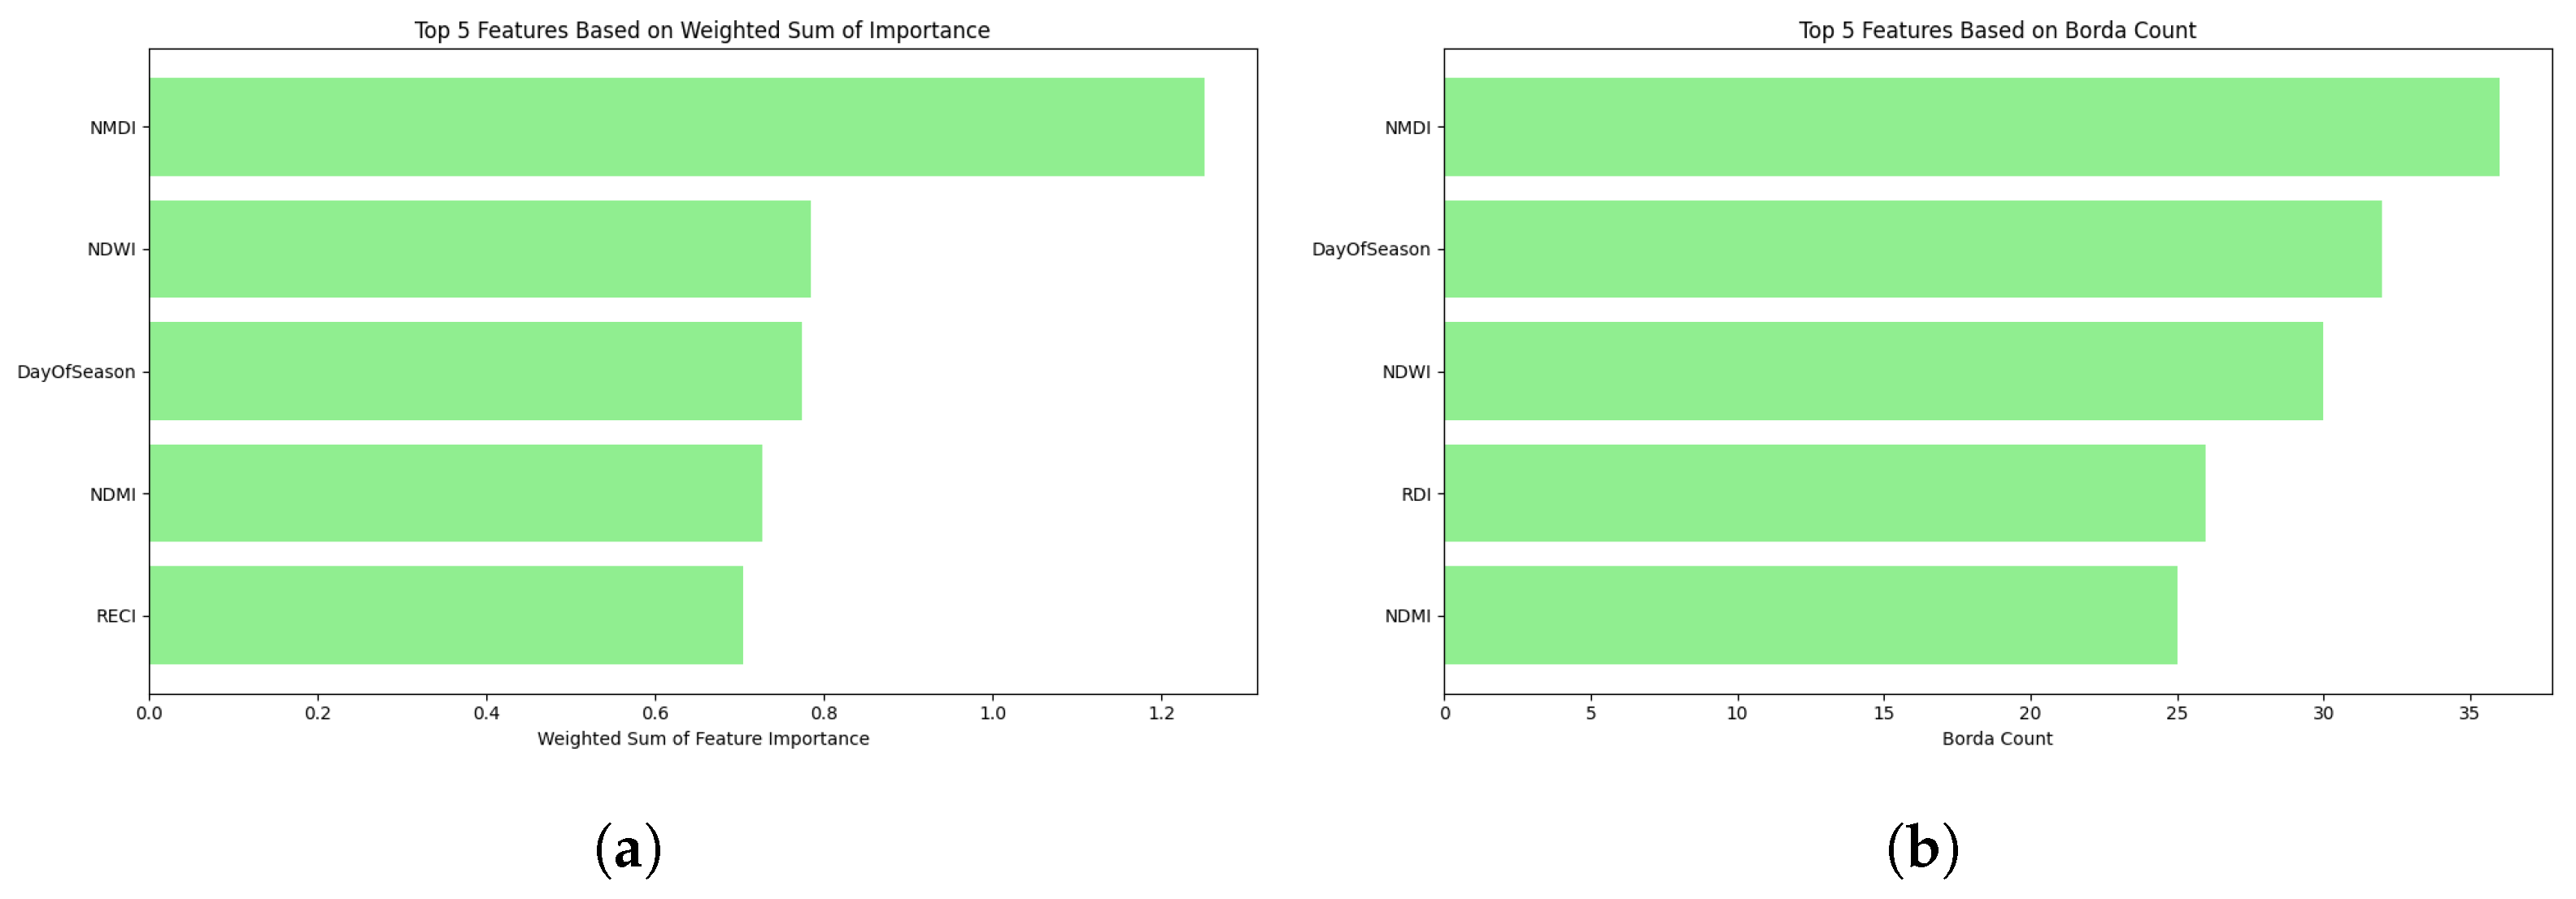
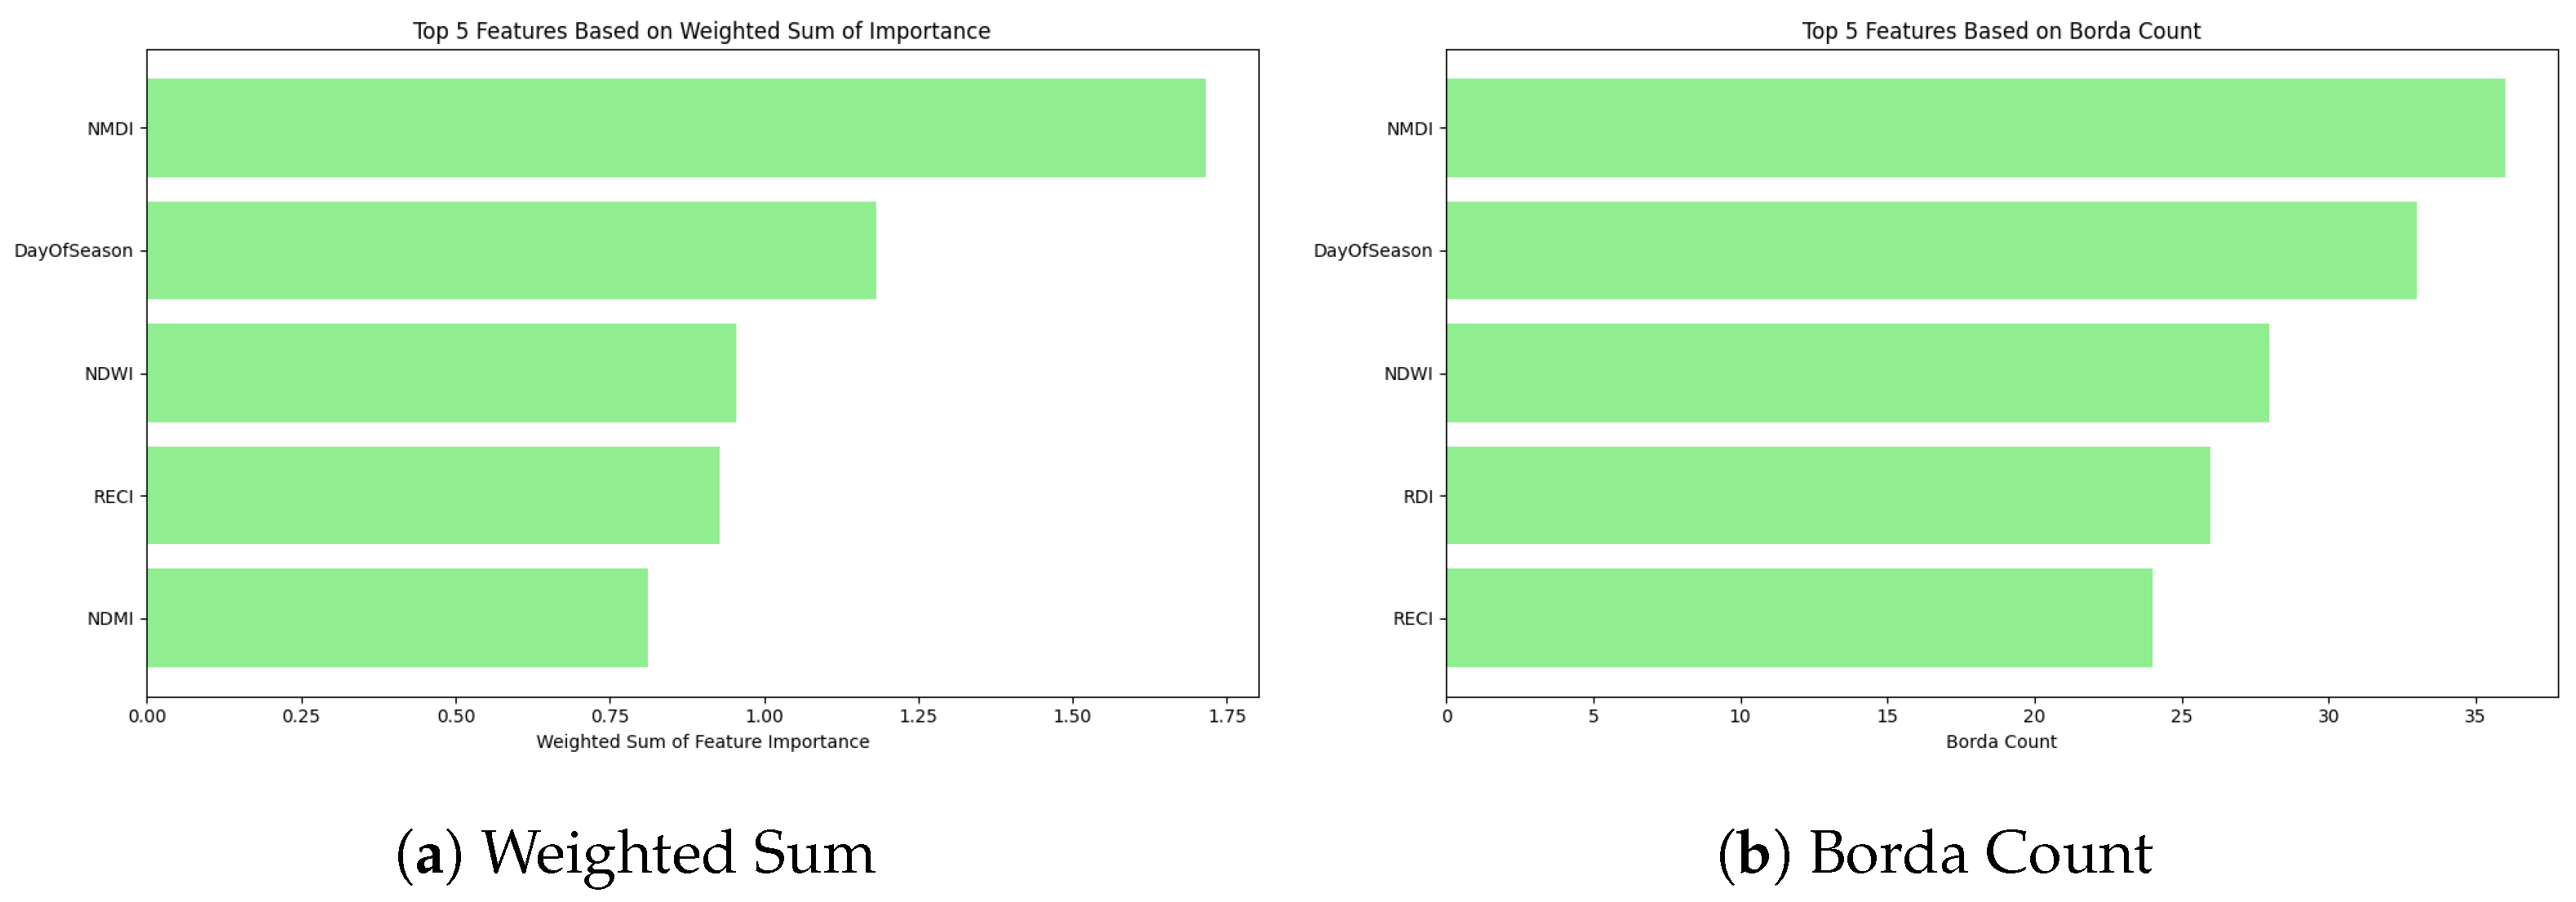
- SHAP-based feature attribution consistently identified the Normalized Multi-band Drought Index (NMDI) and Day of the Season (DOS) as dominant predictors, with RECI, EVI, NDMI, and RDI emerging as additional key contributors across models.
- Integrating multispectral drought-sensitive indices with ensemble classifiers provides a scalable and robust methodological framework for regional drought detection and monitoring, complementing conventional ground-based drought assessments.
- Feature importance rankings demonstrate that vegetation stress and soil-moisture–related indices are central for model generalization, offering transferable insights for agricultural risk management and operational drought early warning systems.
Abstract
1. Introduction
Related Work
2. Preliminaries
2.1. Remote Sensing Indices
2.1.1. Normalized Difference Vegetation Index
2.1.2. Enhanced Vegetation Index
2.1.3. Atmospherically Resistant Vegetation Index
2.1.4. Normalized Difference Water Index
2.1.5. Soil-Adjusted Vegetation Index
2.1.6. Transformed Vegetative Index
2.1.7. Normalized Difference Moisture Index
2.1.8. Normalized Multi-Band Drought Index
2.1.9. Modified Normalized Water Index
2.1.10. Modified Normalized Difference Vegetation Index
2.1.11. Ratio Drought Index
2.1.12. Red-Edge Chlorophyll Index
2.2. Machine Learning Classifier
2.2.1. Random Forest
2.2.2. Gradient Boosting Classifier
2.2.3. Extreme Gradient Boosting (XGBoost)
2.2.4. Bagging Classifier
3. Feature Ranking and Aggregation Techniques
3.1. Shapley Additive Explanation Analysis
3.2. Borda Count
3.3. Weighted Sum
4. Resampling Techniques
4.1. Synthetic Minority Over-Sampling Technique
4.2. Borderline SMOTE
4.3. Adaptive Synthetic Sampling Approach
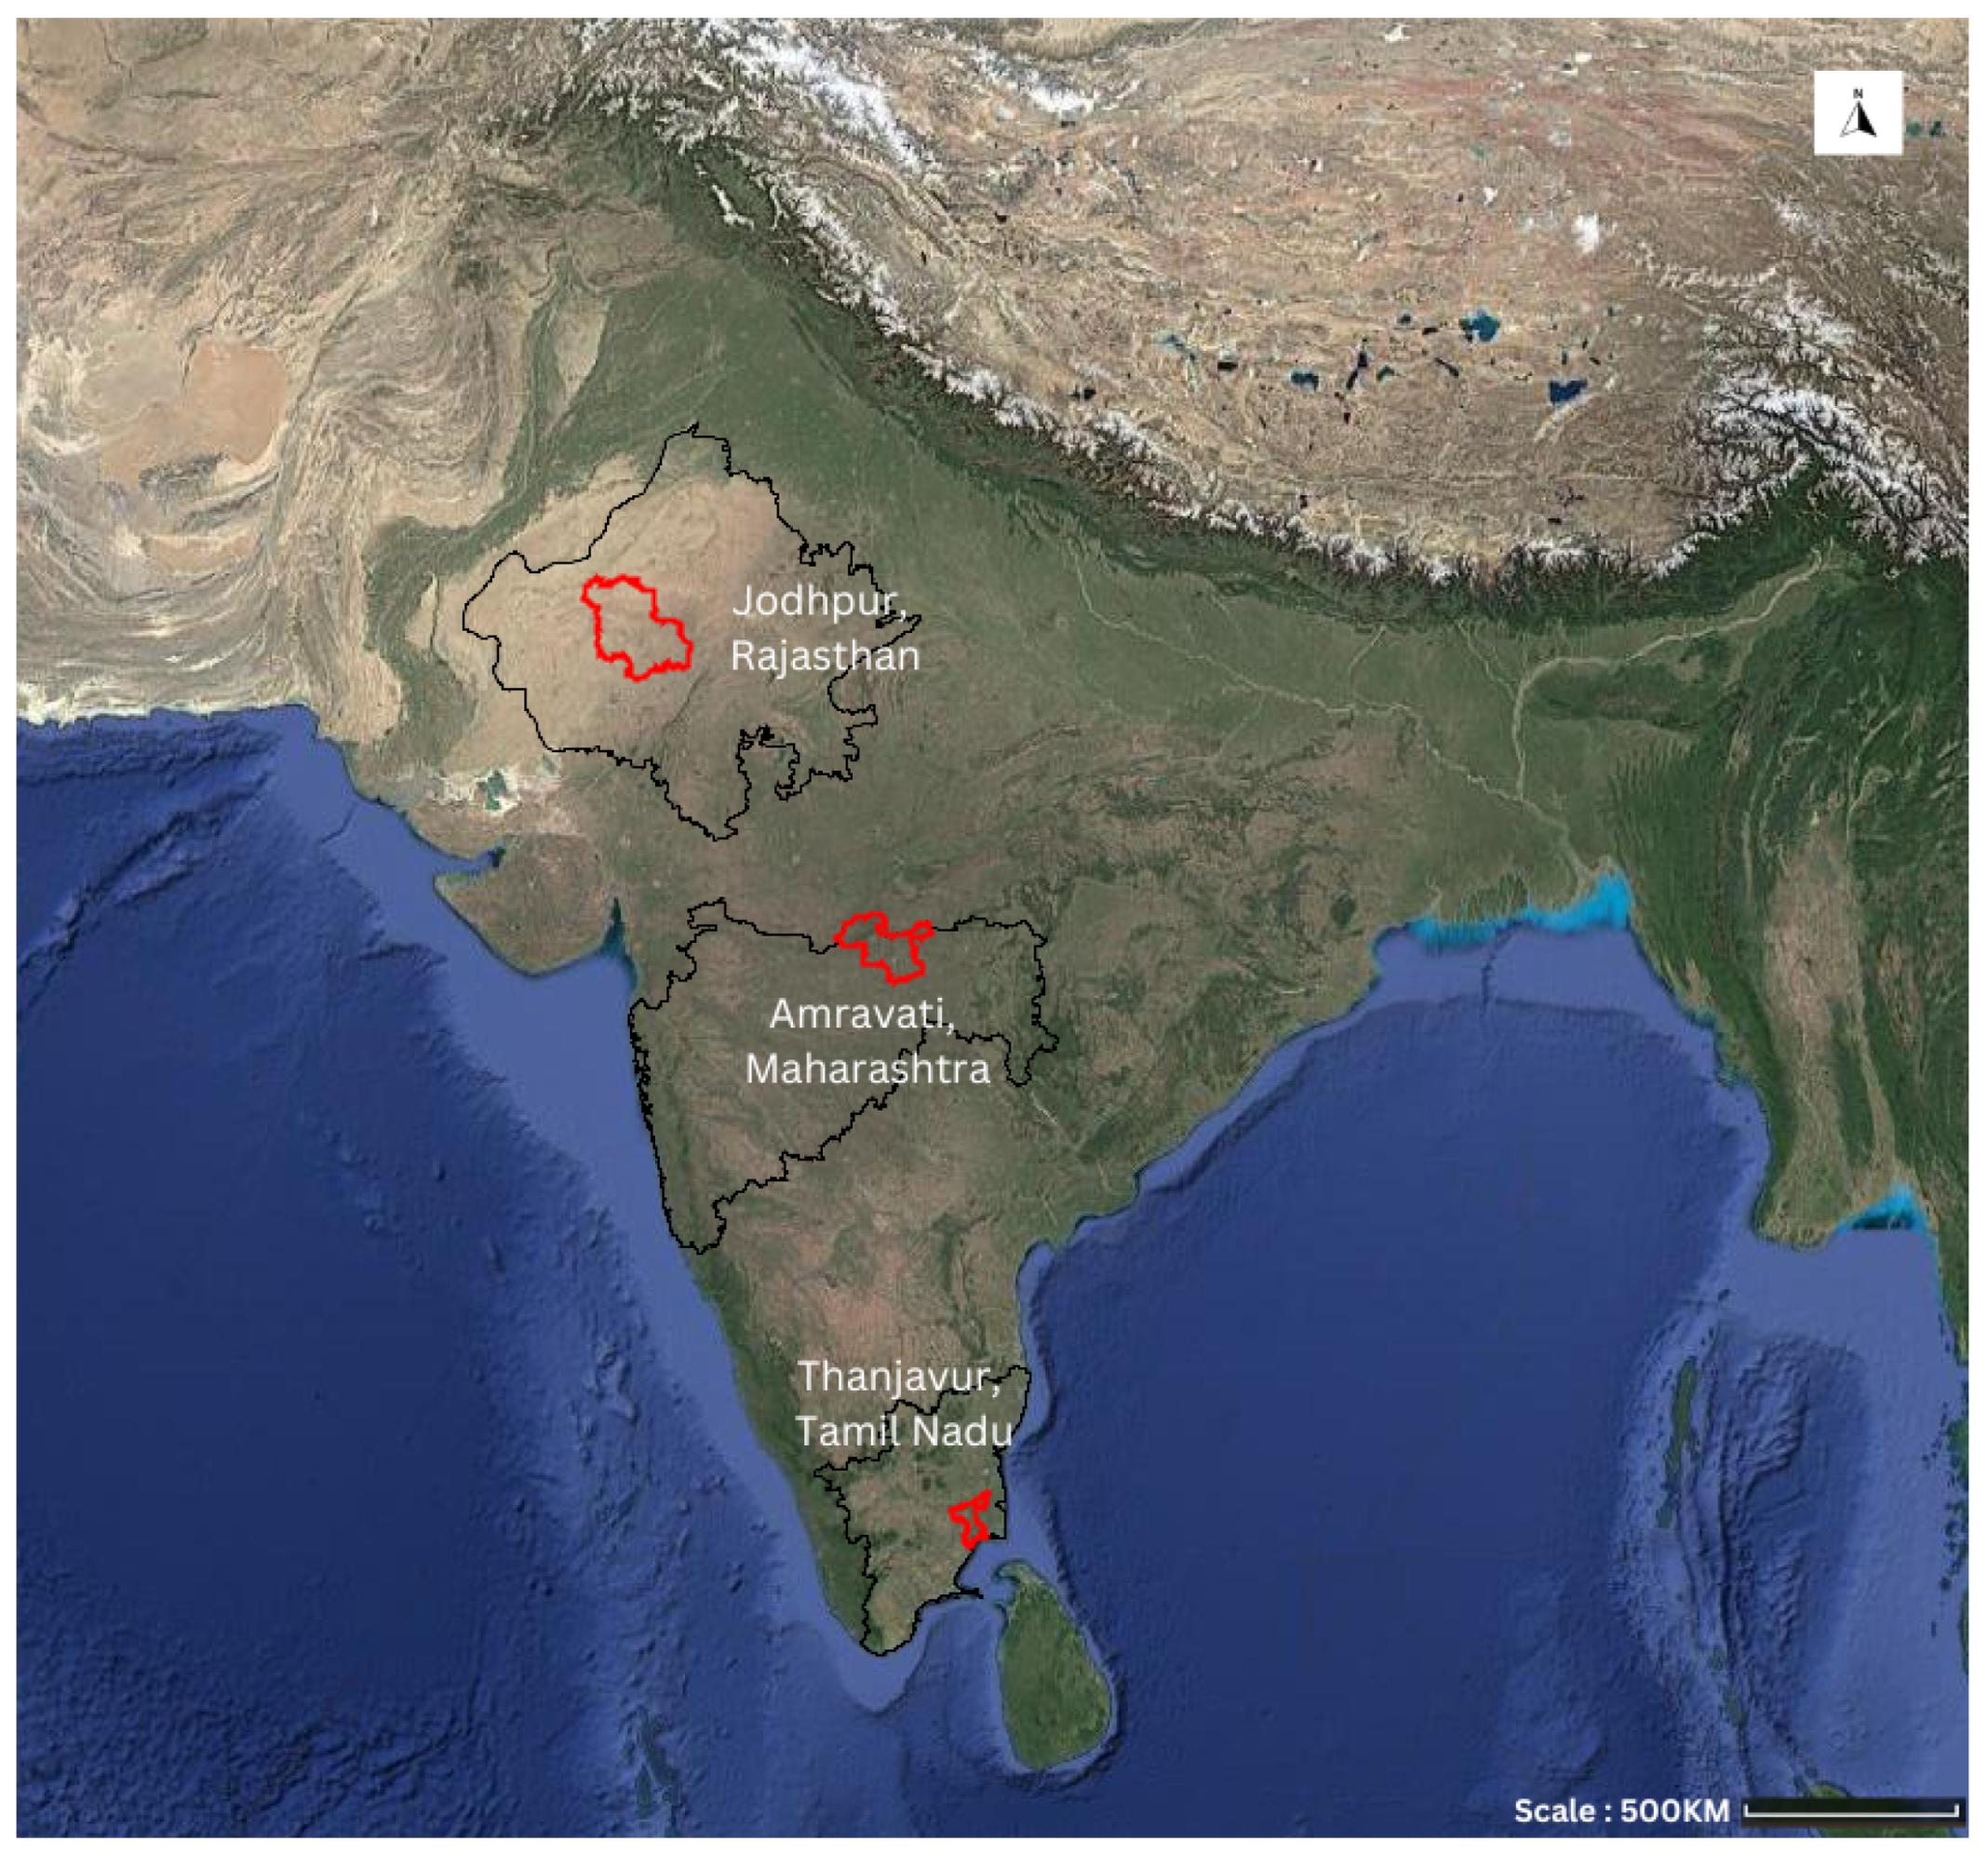
5. Data and Study Area
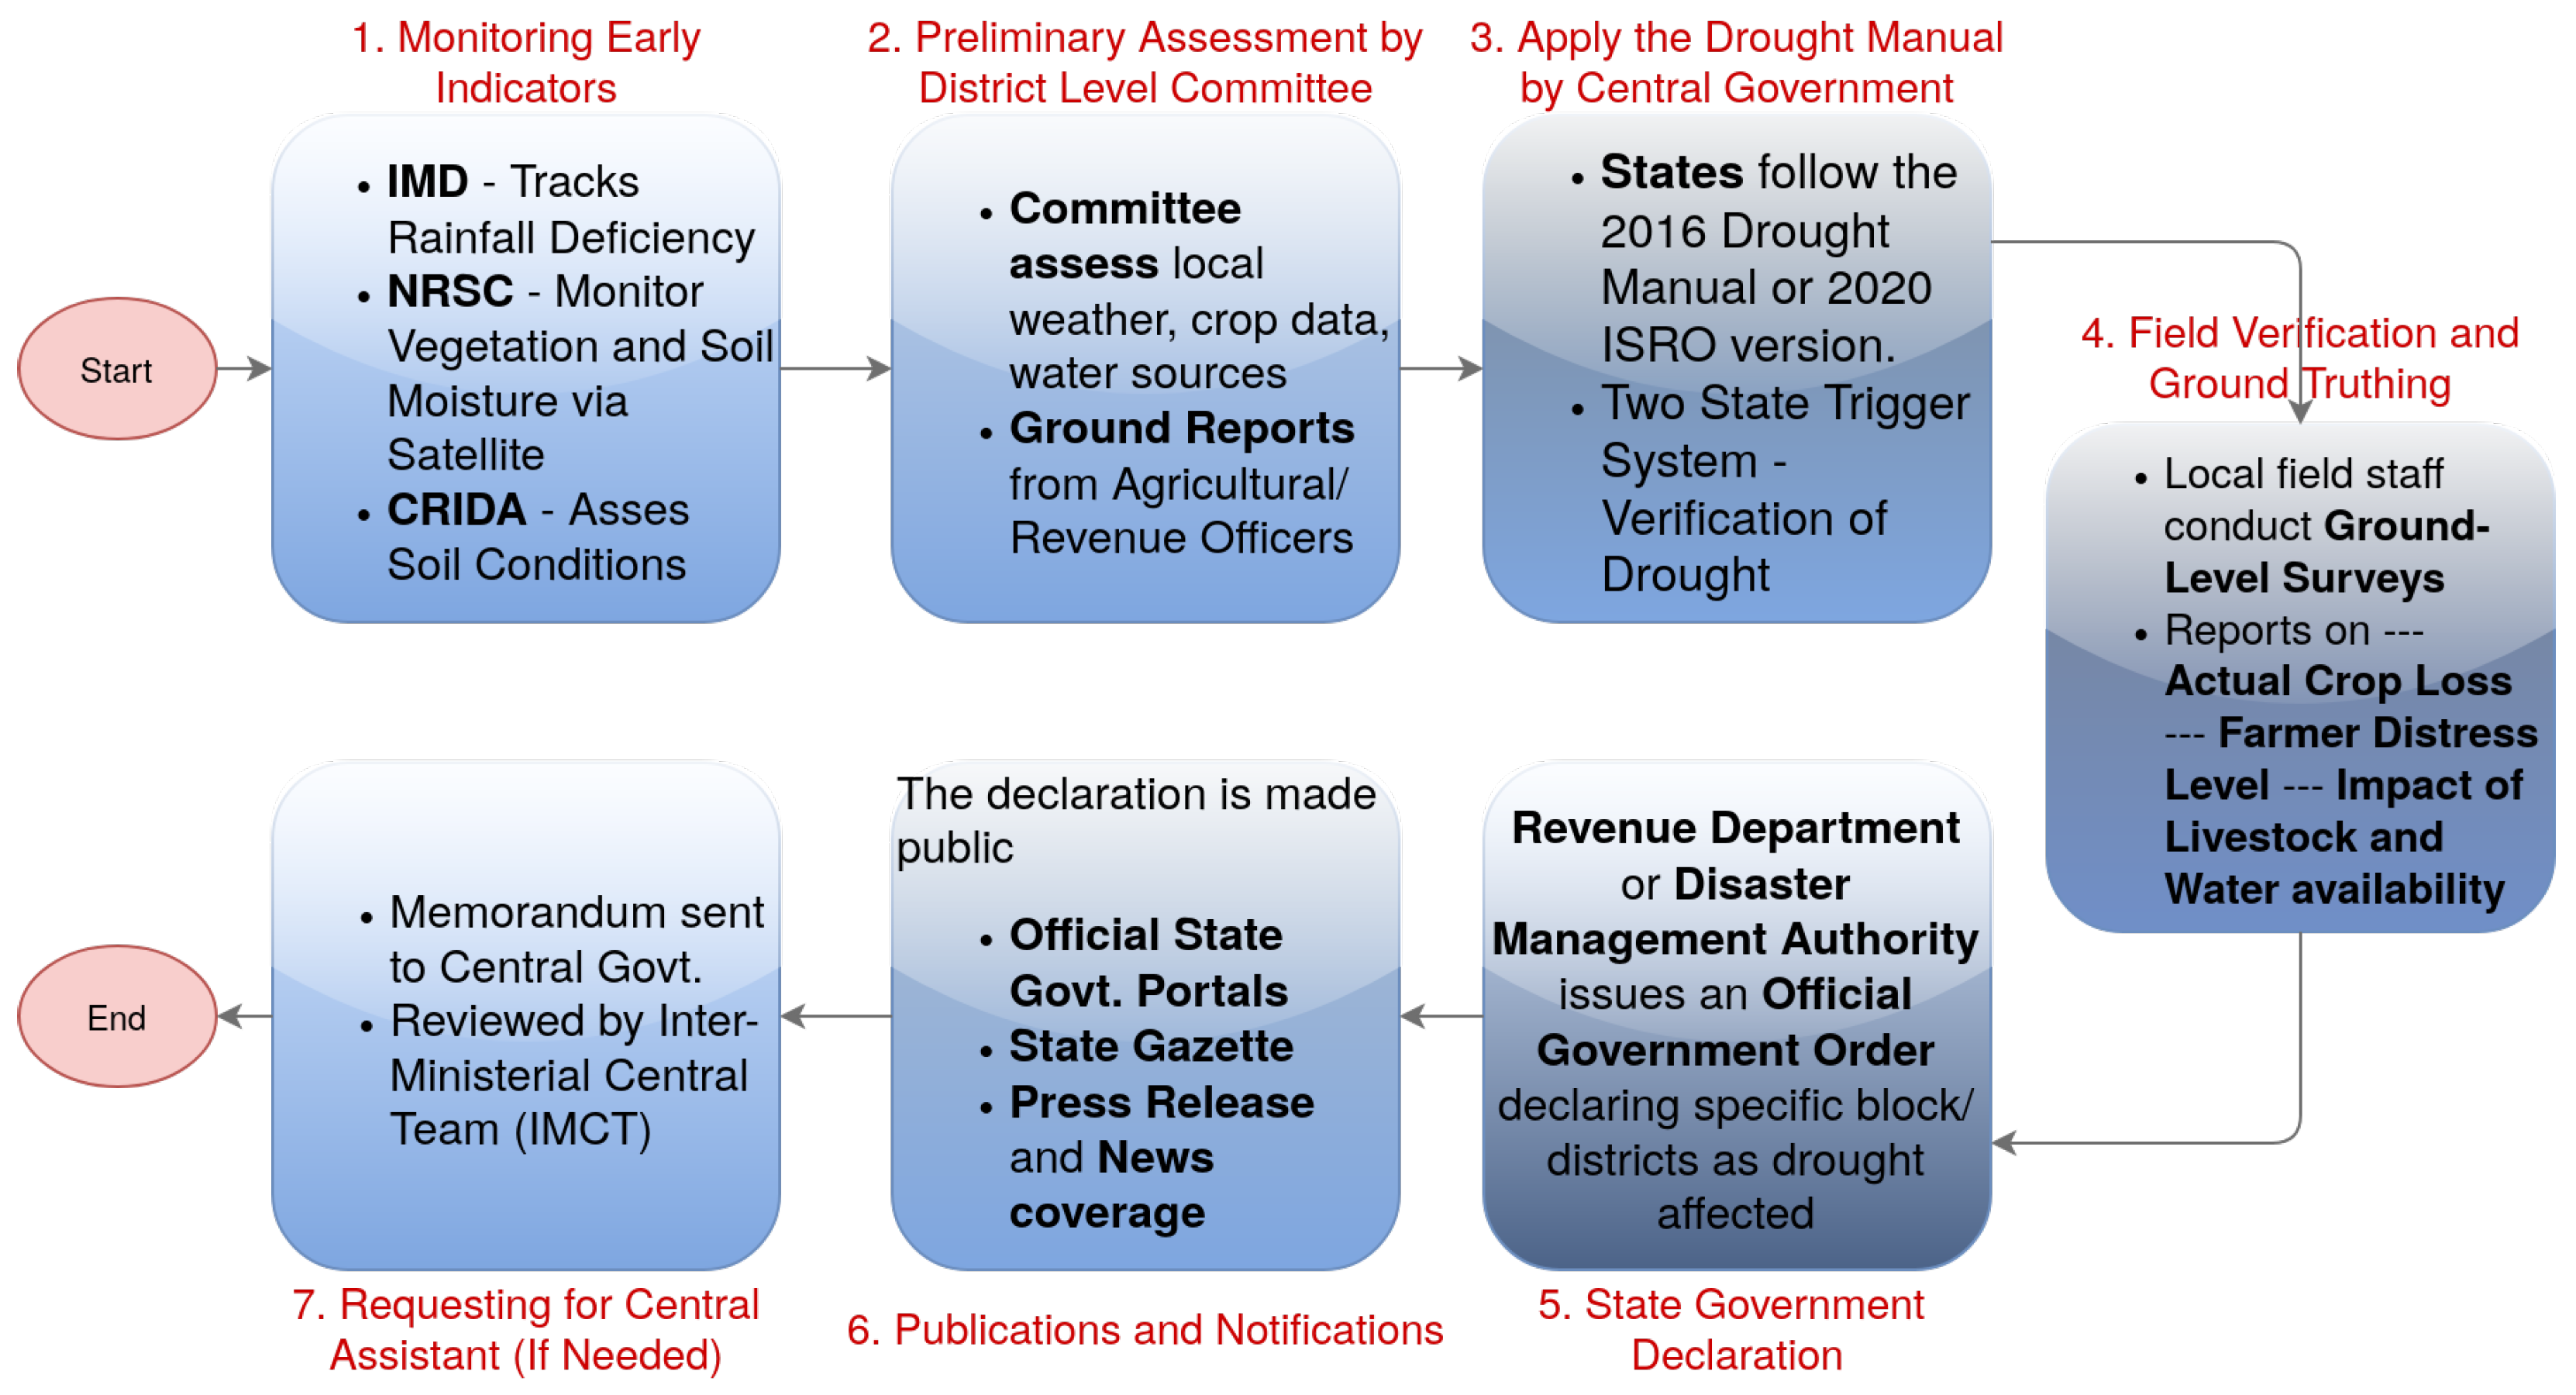
5.1. Drought Declaration Process in India
5.2. Ground Truth Table
5.2.1. Jodhpur
5.2.2. Amravati
5.2.3. Thanjavur
5.2.4. Limitations of Ground Truth Data
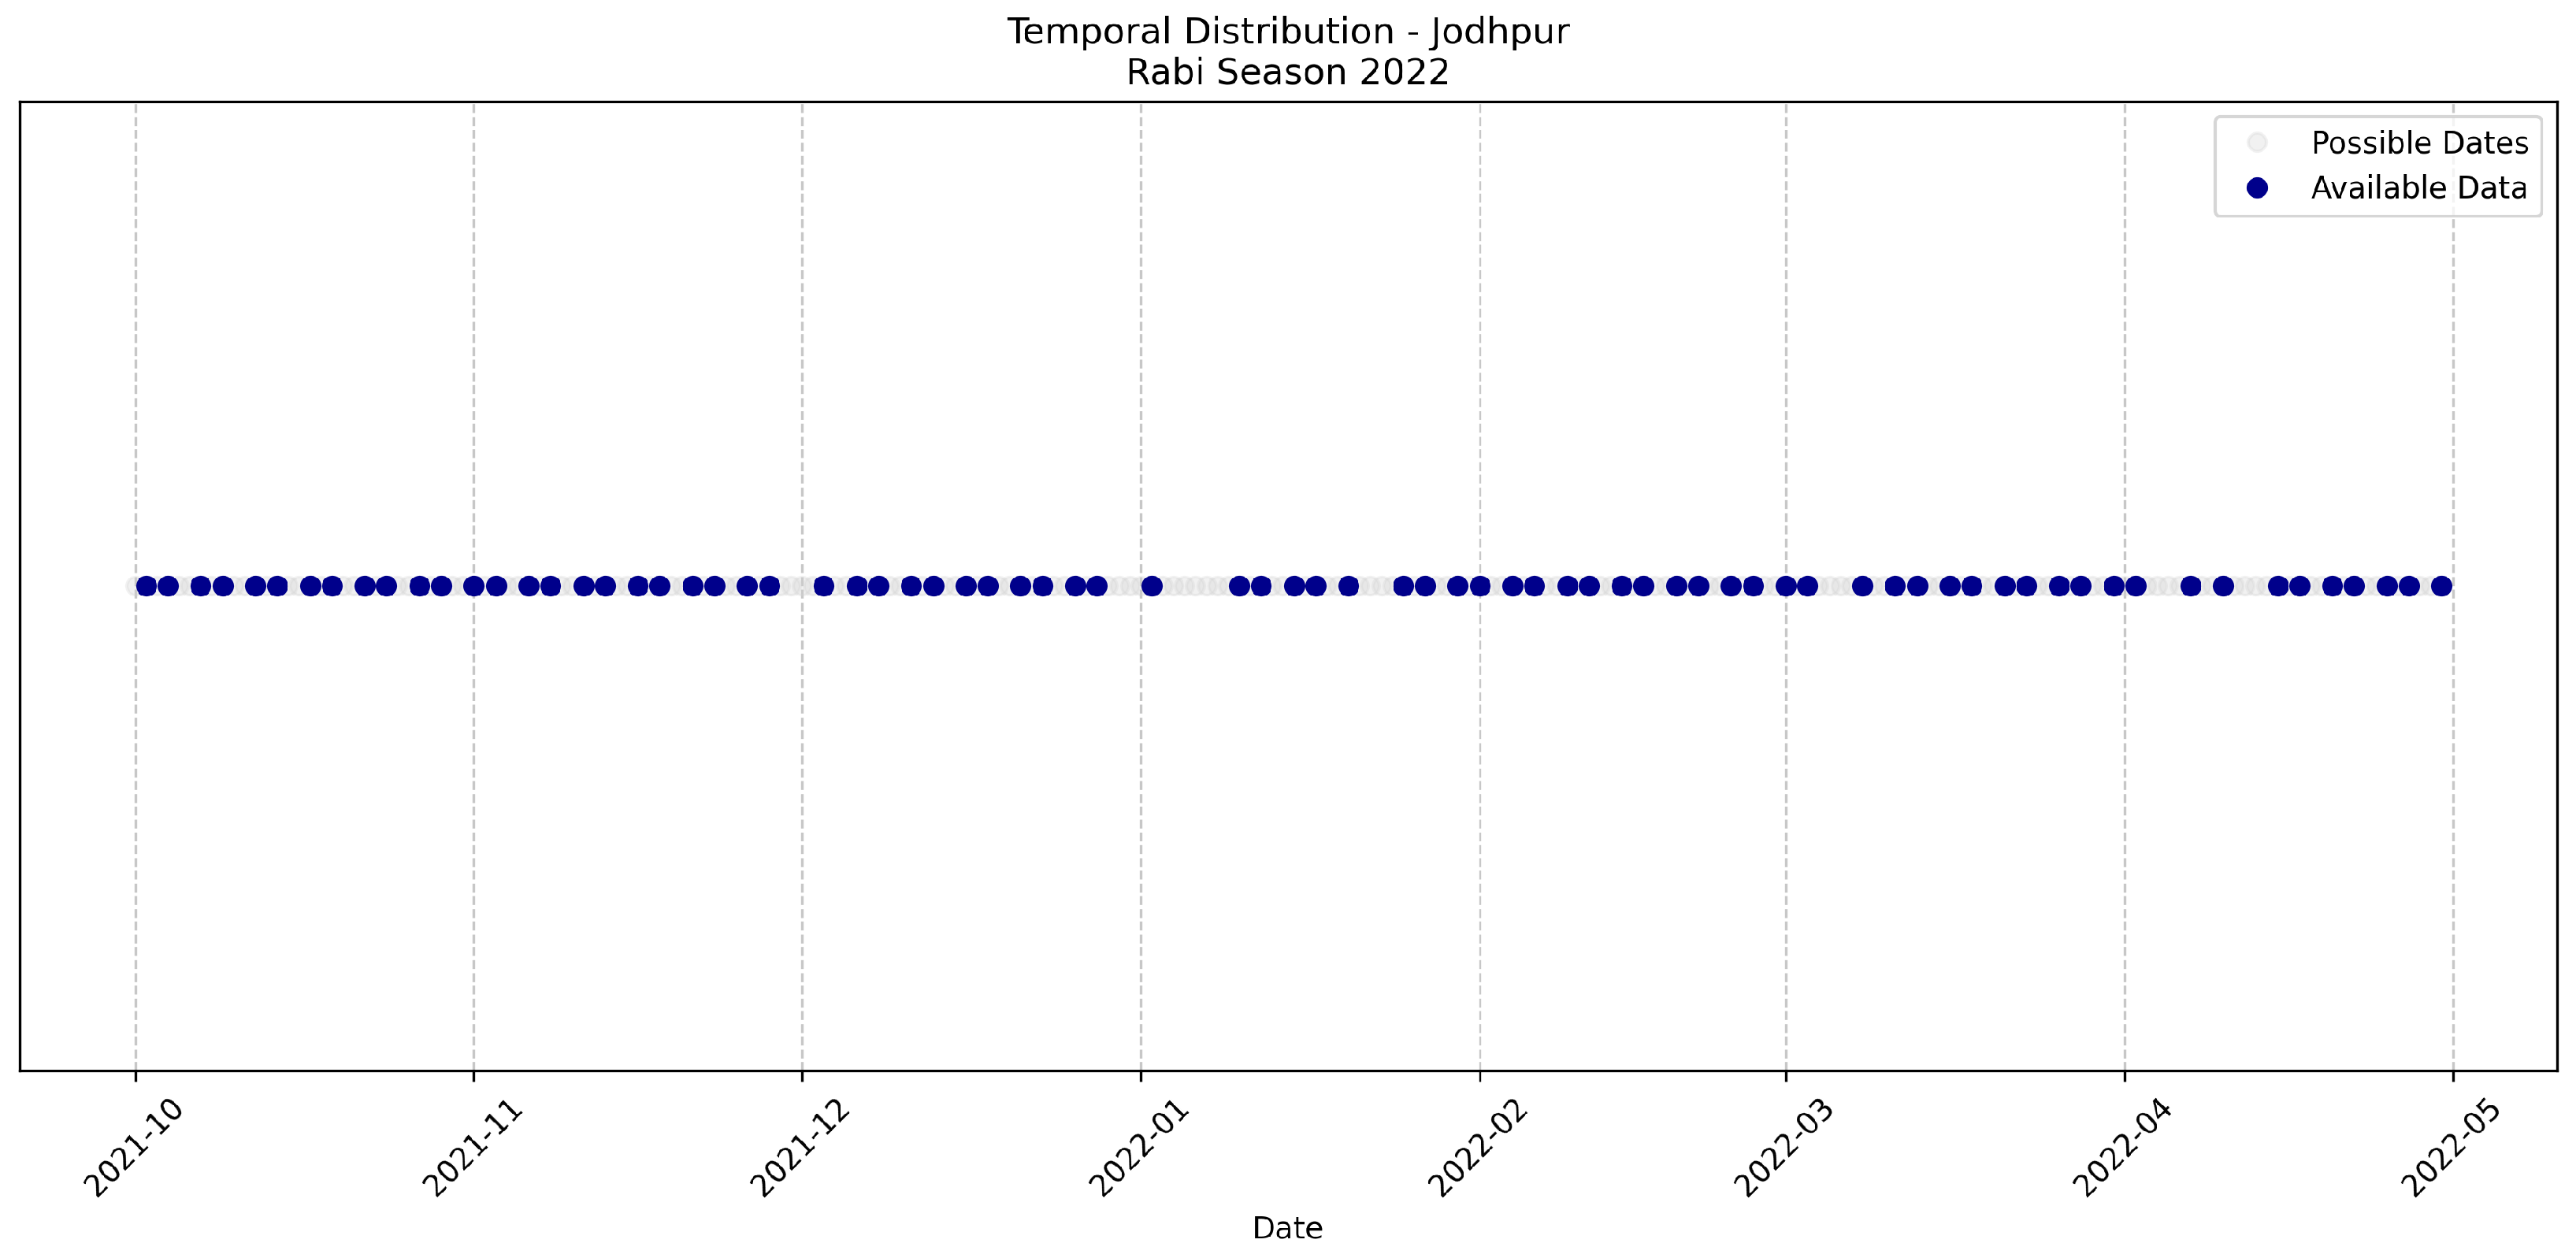
5.3. Temporal Coverage
6. Methodology
6.1. Data Acquisition and Preprocessing
6.2. Feature Engineering
6.3. Machine Learning Model Training and Evaluation
- Data Volume Requirements: Deep learning models require a huge amount of data to generalize effectively. The size of our dataset, while sufficient for robust machine learning techniques, is unsuitable for training deep learning models without a high risk of overfitting.
- Temporal Irregularity: Our time-series data is irregular due to persistent cloud cover and the satellite’s revisit cycle. Sequence-based deep learning models like LSTMs perform best with consistent, high-frequency temporal patterns, which our data cannot provide.
- Interpretability and Efficiency: A core objective of this work is to understand feature influence through interpretable techniques like SHAP. Machine learning models, particularly tree-based ensembles, offer greater explainability, faster training times, and significantly lower computational demands than deep learning alternatives.
6.4. Error Analysis
6.5. Software and Libraries
6.6. Evaluation Metrics
- Accuracy: The percentage of correct predictions. It is defined as per Equation (15).
- Precision: The fraction of true drought predictions among all predicted droughts. It is defined as shown in Equation (16).
- Recall: The fraction of actual droughts that were correctly identified. It is defined by Equation (17).
7. Results and Discussion
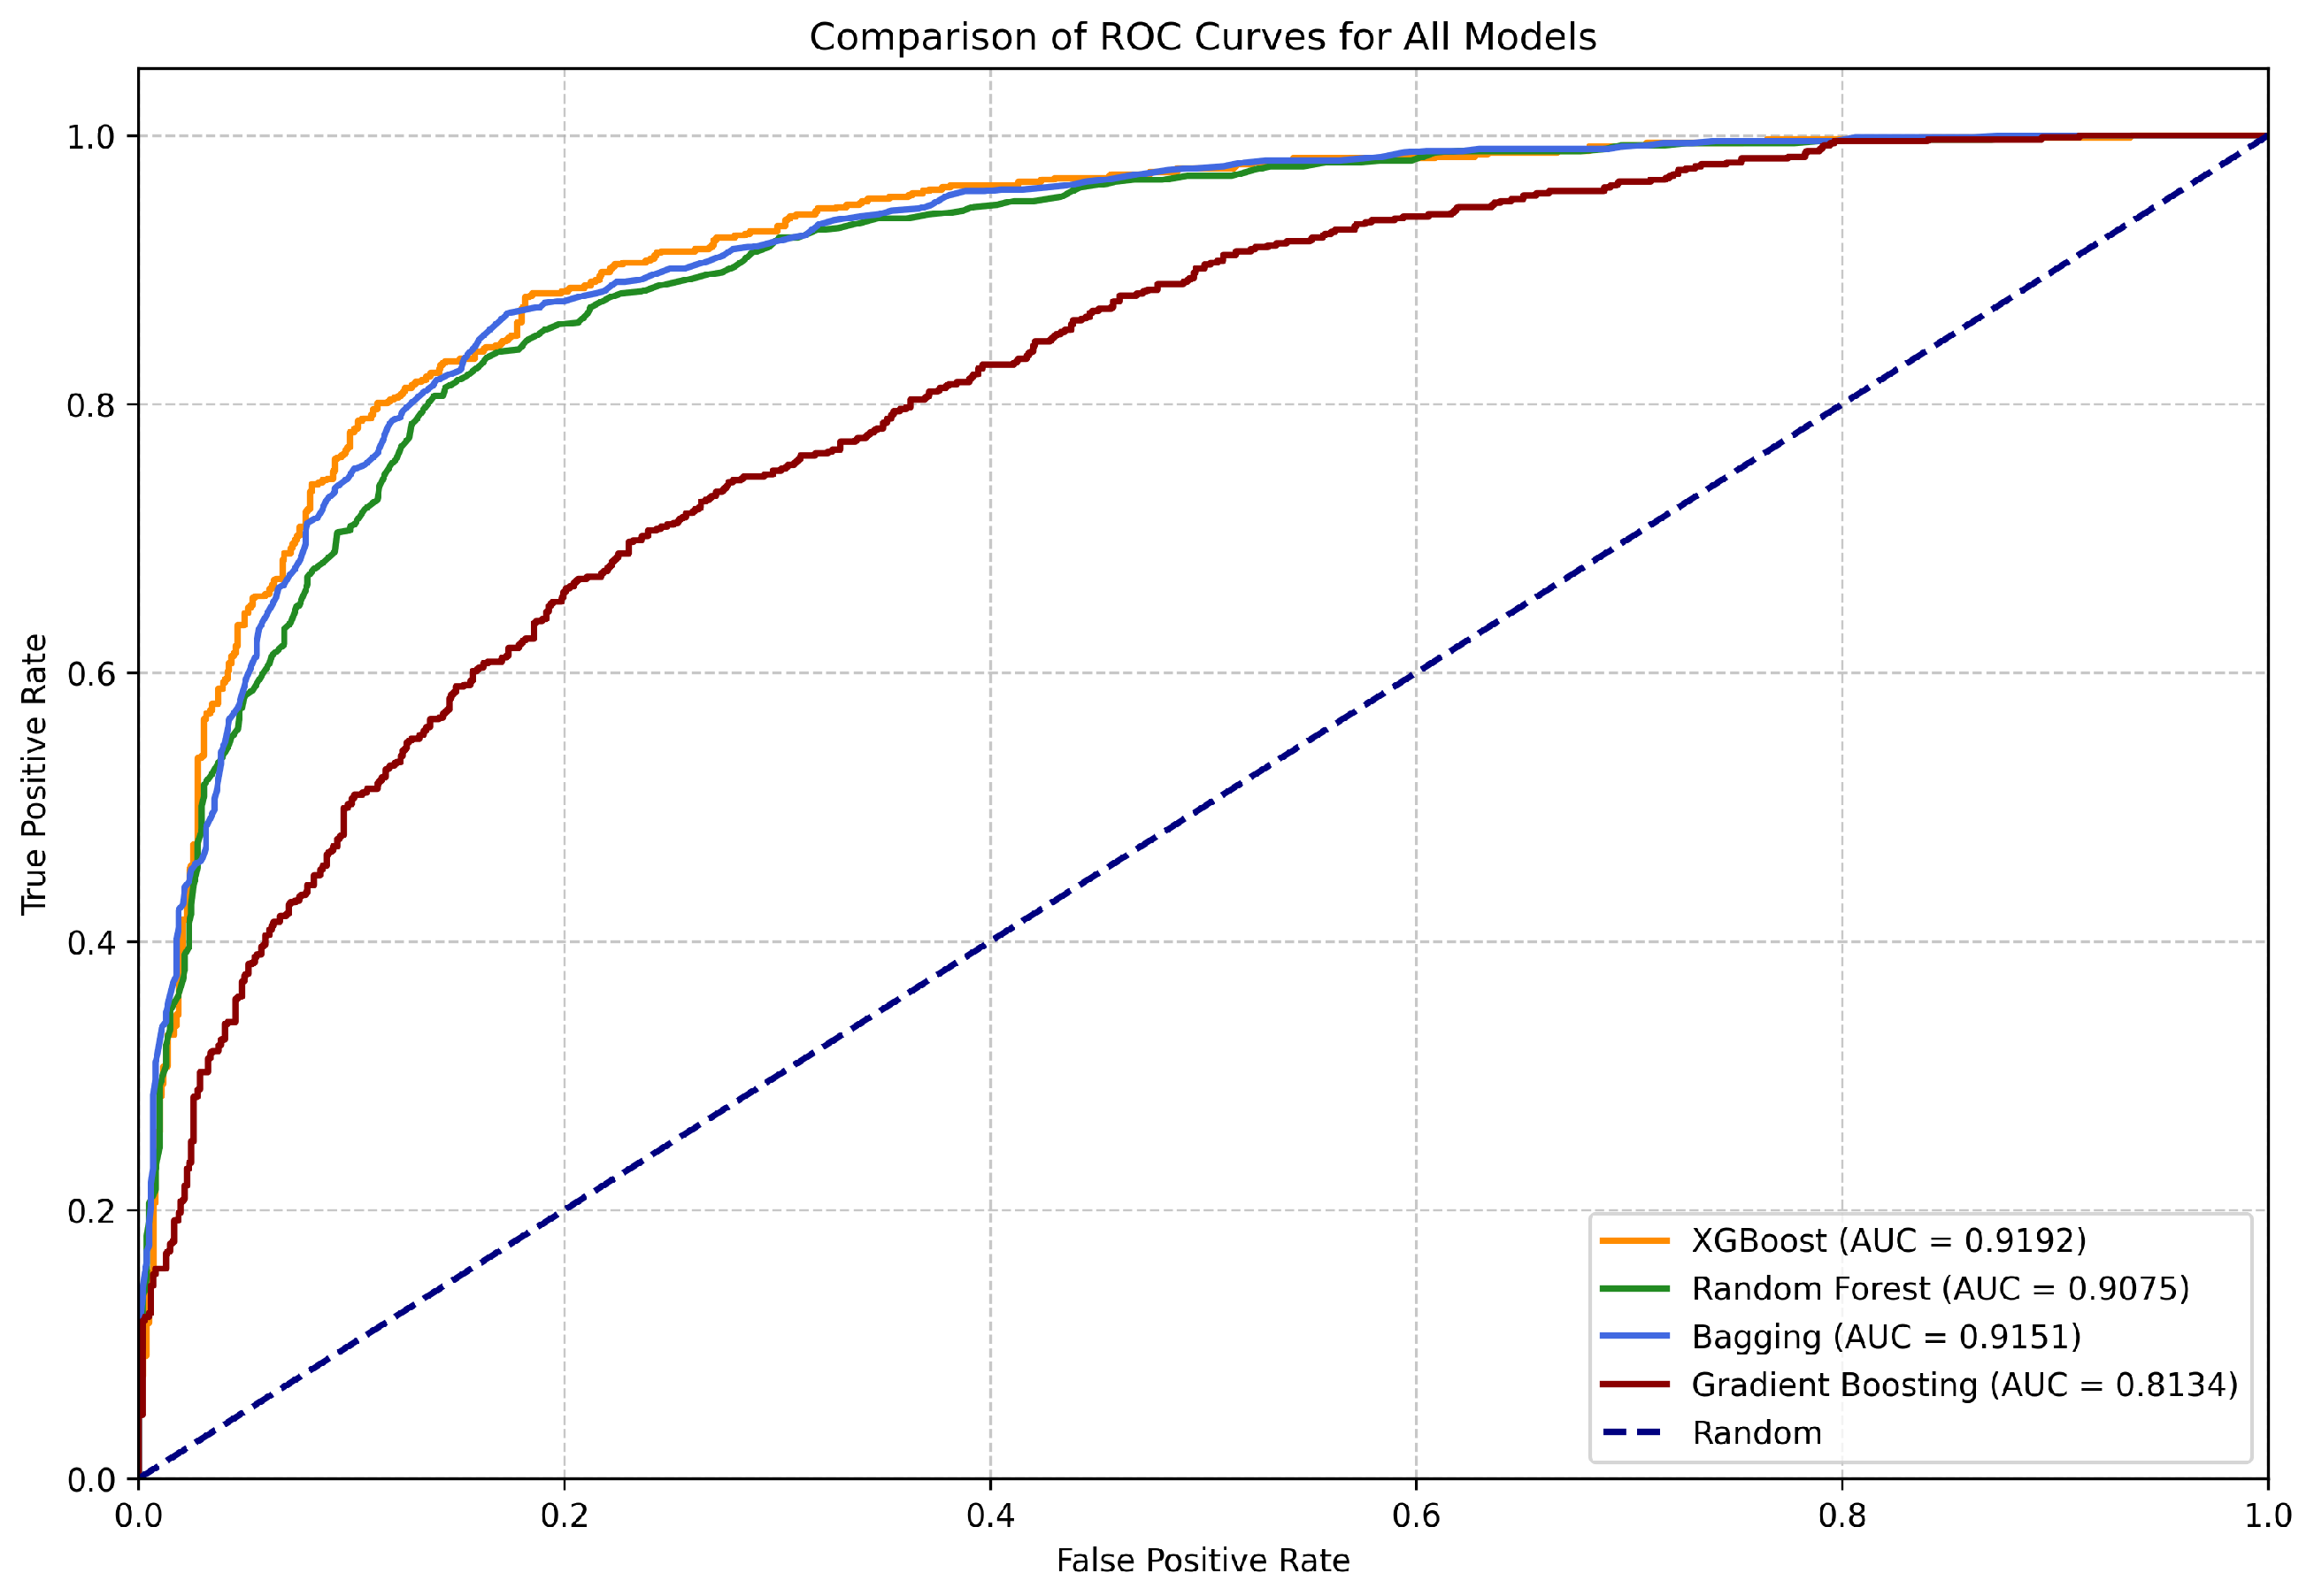
7.1. Model Performance
7.1.1. Before Oversampling
7.1.2. SMOTE
7.1.3. Borderline SMOTE
7.1.4. ADASYN
7.2. Error Analysis
7.3. Model Performance (Season Majority Voting Strategy)
7.4. SHAP Analysis
7.4.1. Before Oversampling
7.4.2. SMOTE
7.4.3. SMOTE Borderline
7.4.4. ADASYN
7.5. Model Aggregation for Most Relevant Features
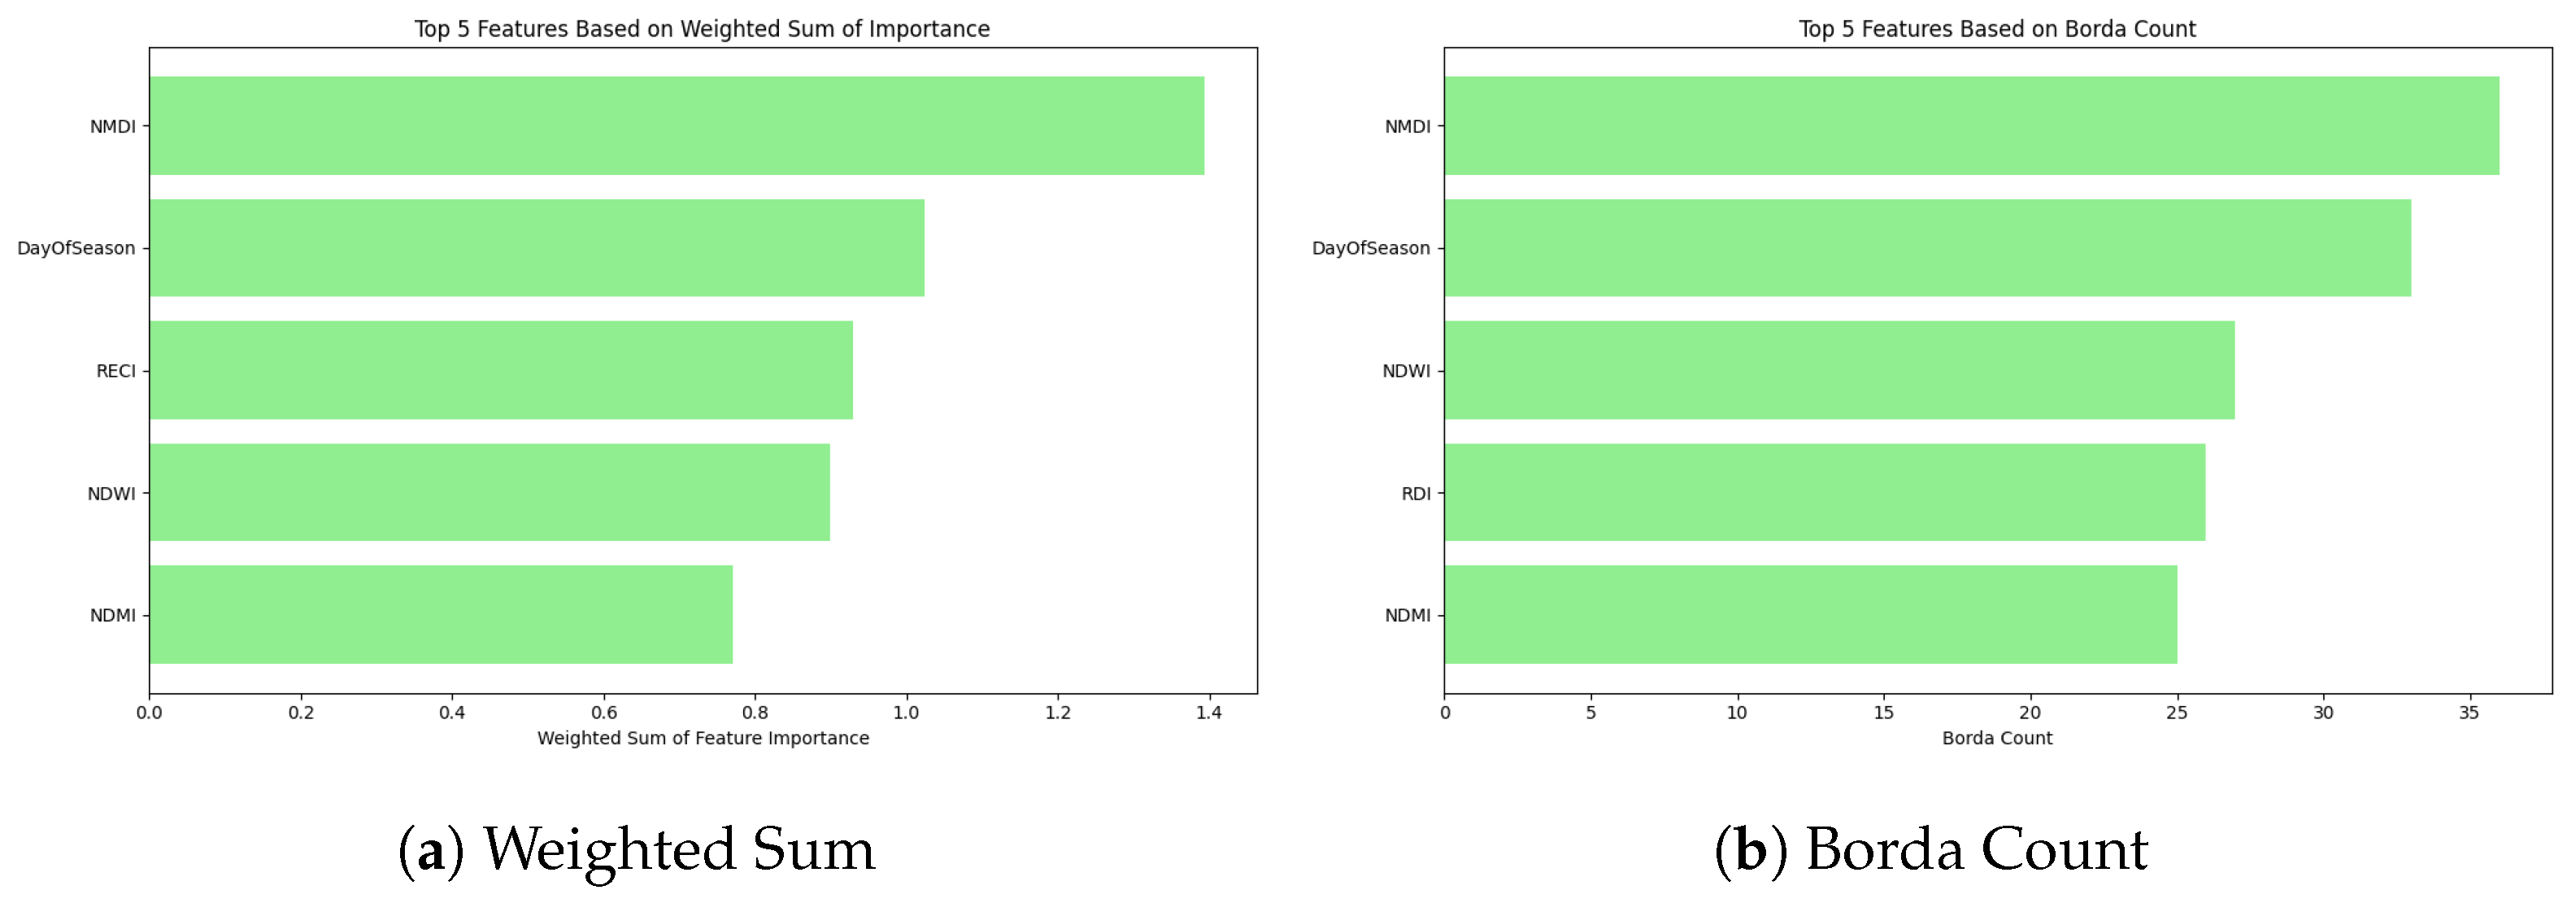
7.5.1. Before Oversampling
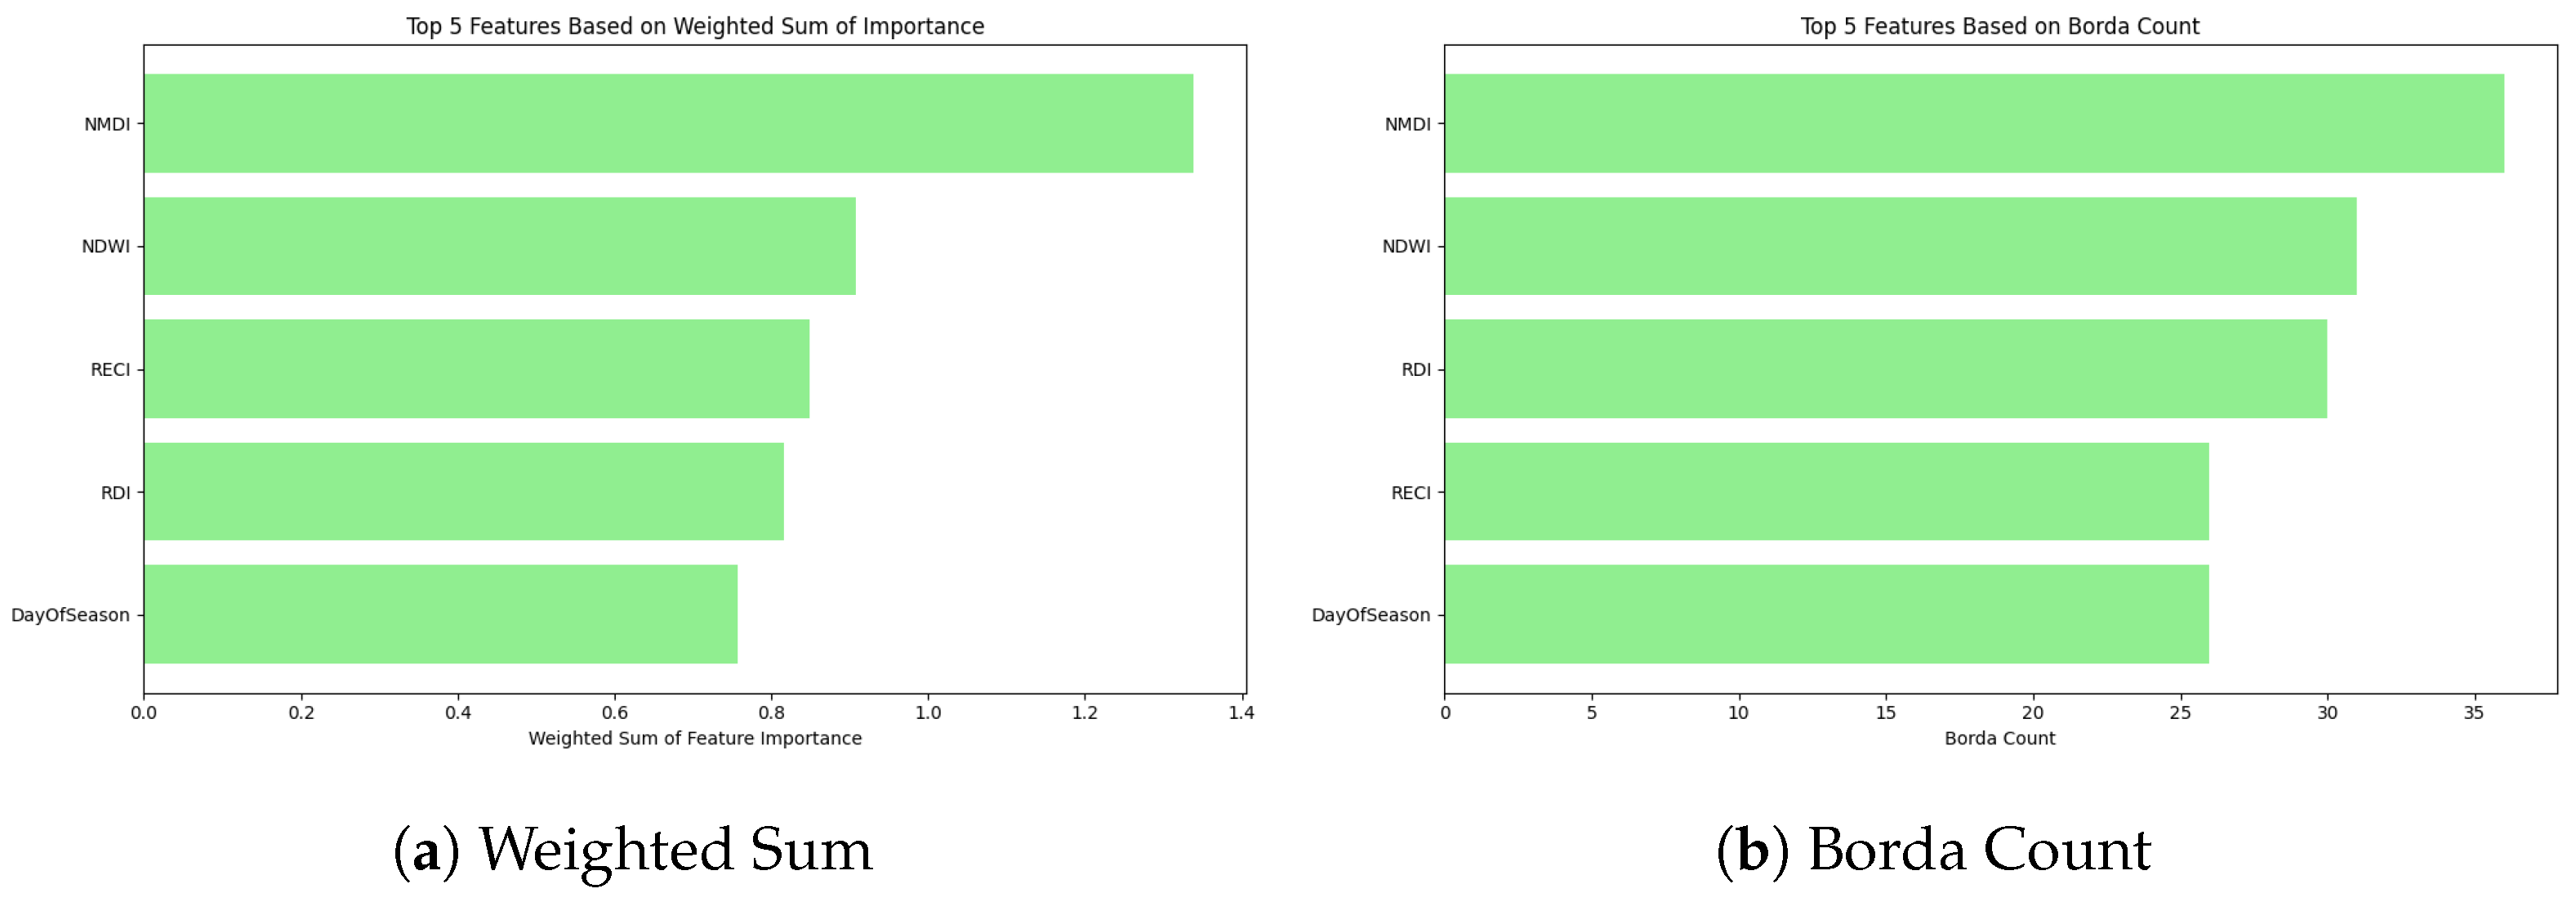
7.5.2. SMOTE
7.5.3. Borderline SMOTE
7.5.4. ADASYN
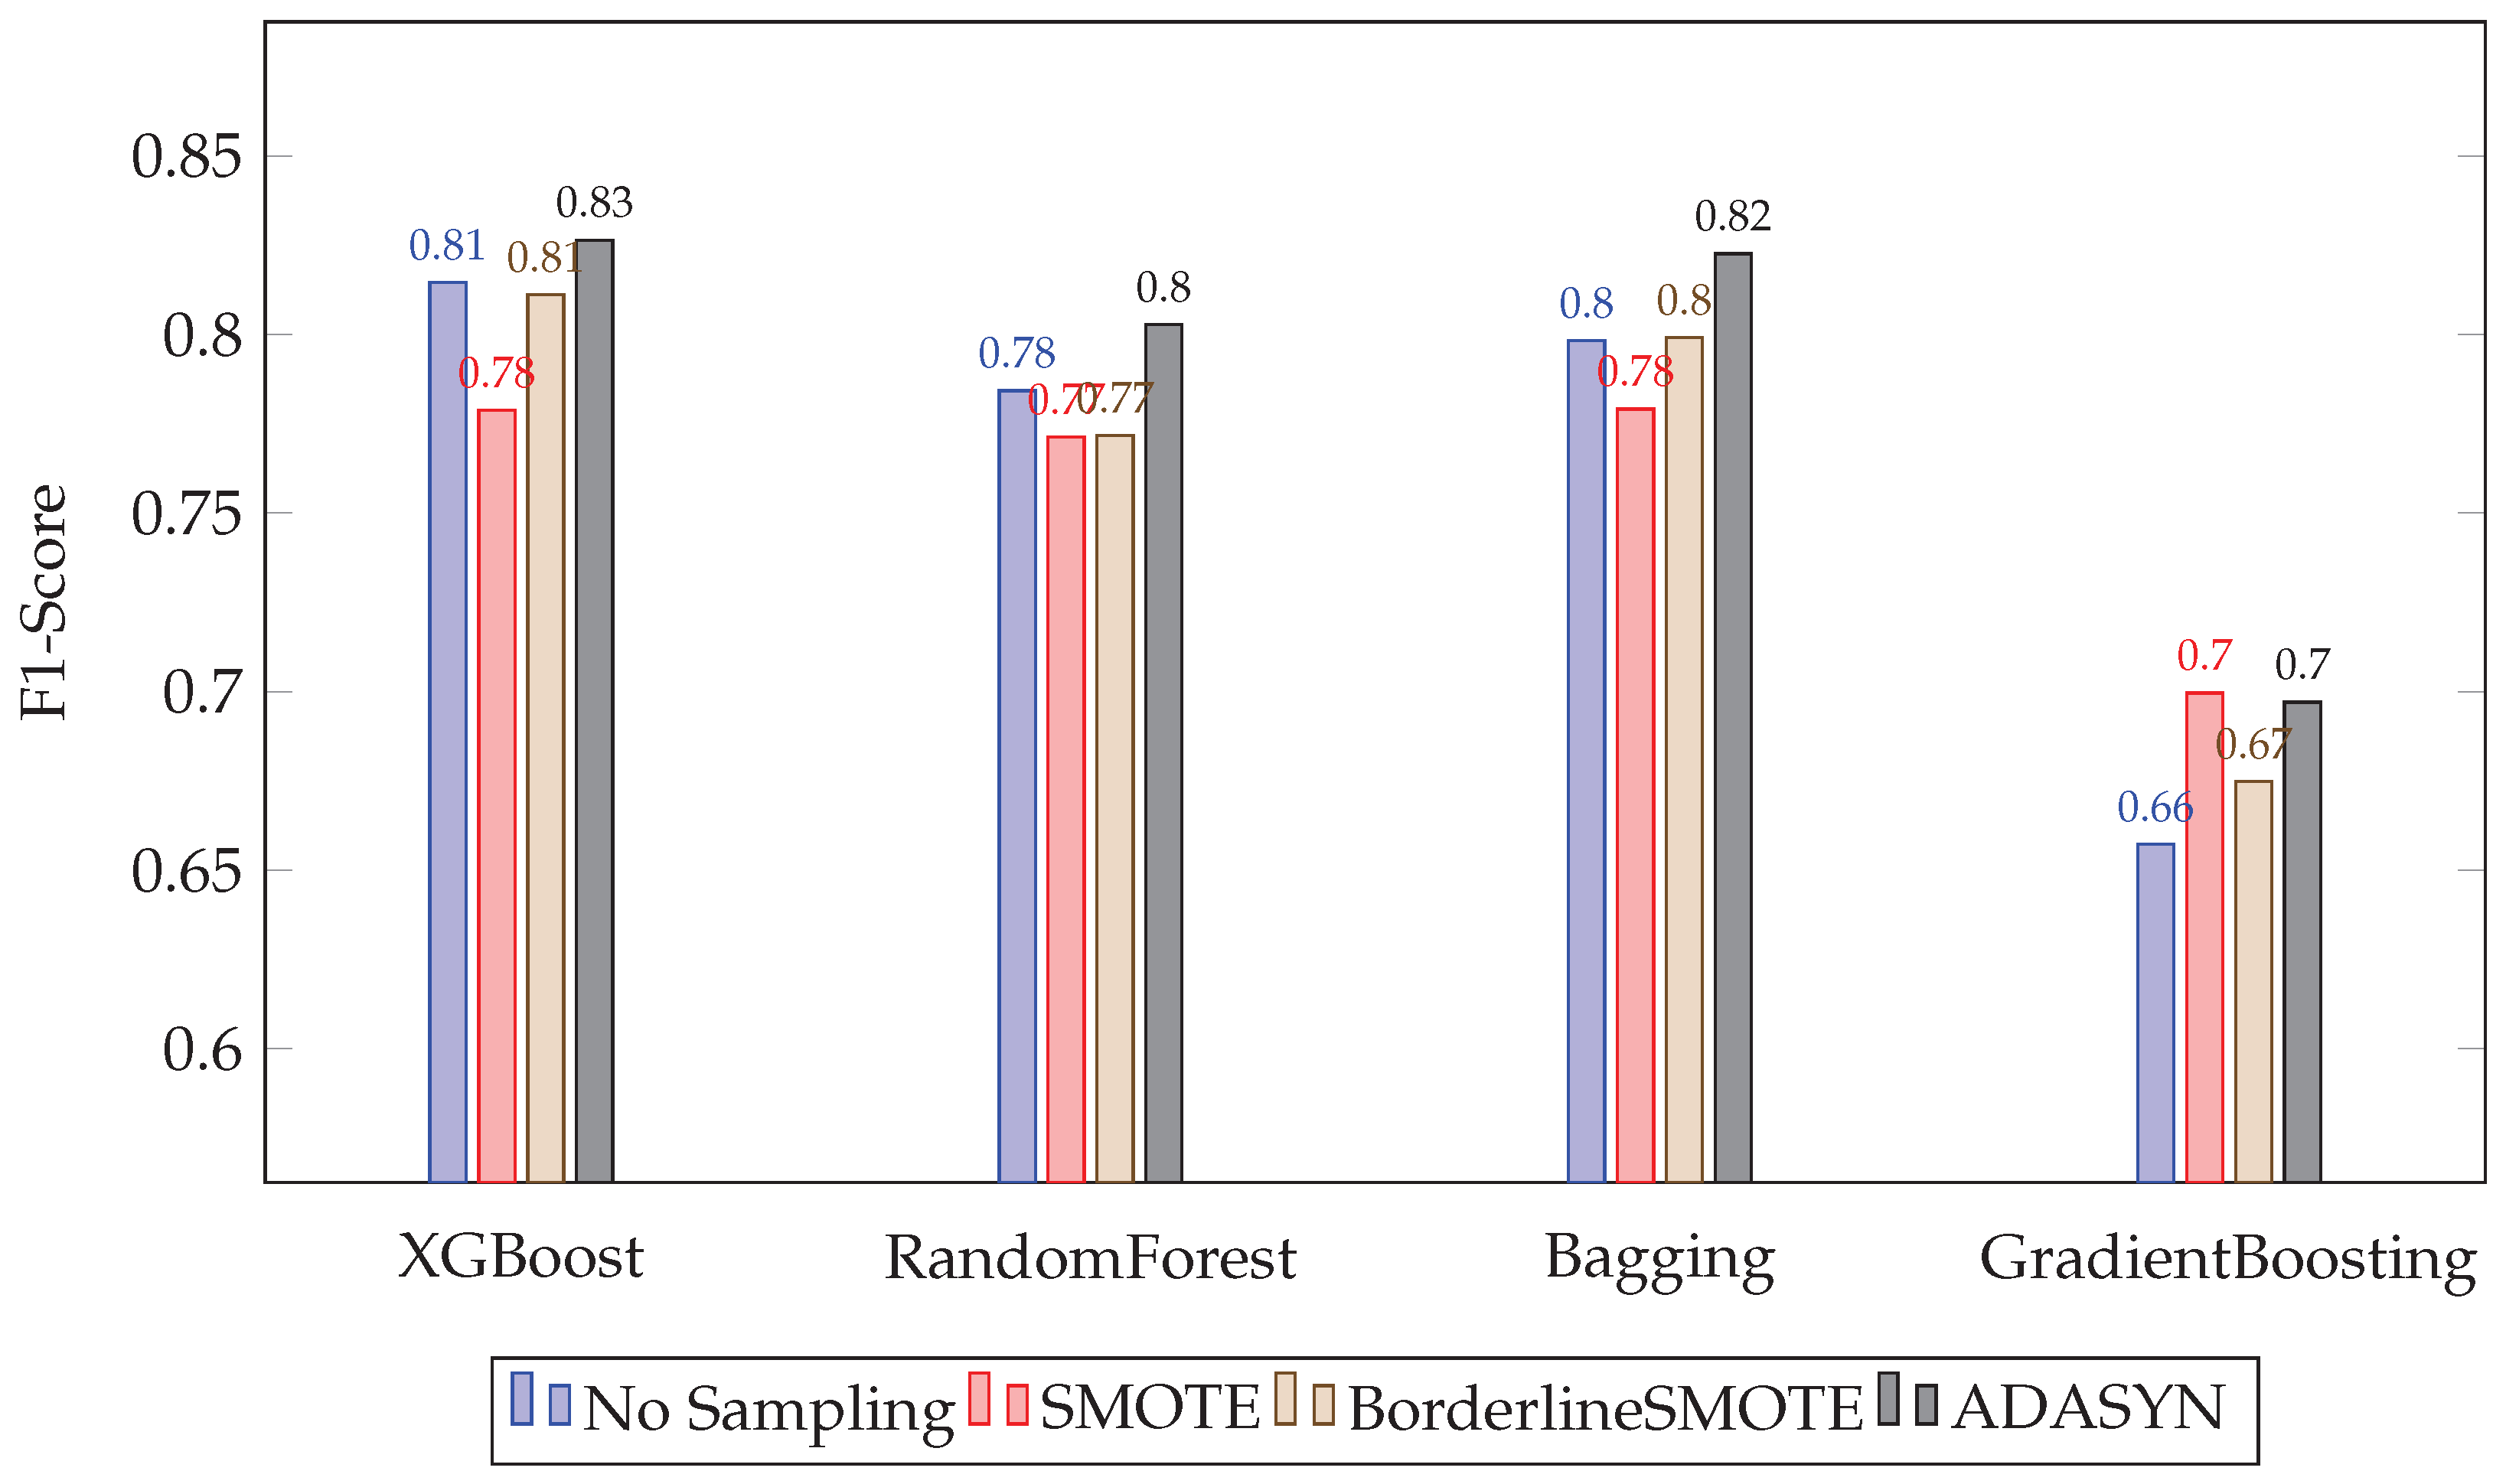
7.6. Statistical Comparison of Oversampling Methods
7.7. Limitations of the Proposed Work
8. Conclusions
Author Contributions
Funding
Data Availability Statement
Conflicts of Interest
Correction Statement
List of Abbreviations
| Abbreviation | Full Form |
| NIR | Near Infrared |
| SWIR | Shortwave Infrared |
| DOS | Day of Season |
| NDVI | Normalized Difference Vegetation Index |
| NDWI | Normalized Difference Water Index |
| EVI | Enhanced Vegetation Index |
| ARVI | Atmospherically Resistant Vegetation Index |
| SAVI | Soil-Adjusted Vegetation Index |
| TVI | Transformed Vegetative Index |
| NDMI | Normalized Difference Moisture Index |
| NMDI | Normalized Multi-band Drought Index |
| MNDWI | Modified Normalized Water Index |
| MNDVI | Modified Normalized Difference Vegetation Index |
| RDI | Ratio Drought Index |
| RECI | Red-edge Chlorophyll Index |
| SAR | Synthetic Aperture Radar |
| RF | Random Forest |
| GB | Gradient Boosting |
| XGB | Extreme Gradient Boosting |
| BGN | Bagging Classifier |
| SHAP | Shapley Additive Explanation Analysis |
| SMOTE | Synthetic Minority Oversampling Technique |
| ADASYN | Adaptive Synthetic Sampling |
| BSMOTE | Borderline Synthetic Minority Oversampling Technique |
| GEE | Google Earth Engine |
| IMD | India Meteorological Department |
| CRIDA | Central Research Institute for Dryland Agriculture |
| NRSC | National Remote Sensing Centre |
| ROC | Receiver Operating Characteristic |
| AUC | Area Under the Curve |
References
- Urban, M.; Berger, C.; Mudau, T.E.; Heckel, K.; Truckenbrodt, J.; Onyango Odipo, V.; Smit, I.P.; Schmullius, C. Surface moisture and vegetation cover analysis for drought monitoring in the southern Kruger National Park using Sentinel-1, Sentinel-2, and Landsat-8. Remote Sens. 2018, 10, 1482. [Google Scholar] [CrossRef]
- Aadhar, S.; Mishra, V. Challenges in drought monitoring and assessment in India. Water Secur. 2022, 16, 100120. [Google Scholar] [CrossRef]
- Mishra, V.; Thirumalai, K.; Jain, S.; Aadhar, S. Unprecedented drought in South India and recent water scarcity. Environ. Res. Lett. 2021, 16, 054007. [Google Scholar] [CrossRef]
- Gimeno-Sotelo, L.; Sorí, R.; Nieto, R.; Vicente-Serrano, S.M.; Gimeno, L. Unravelling the origin of the atmospheric moisture deficit that leads to droughts. Nat. Water 2024, 2, 242–253. [Google Scholar] [CrossRef]
- AghaKouchak, A.; Farahmand, A.; Melton, F.S.; Teixeira, J.; Anderson, M.C.; Wardlow, B.D.; Hain, C.R. Remote sensing of drought: Progress, challenges and opportunities. Rev. Geophys. 2015, 53, 452–480. [Google Scholar] [CrossRef]
- Zhang, Y.; Hao, Z.; Feng, S.; Zhang, X.; Xu, Y.; Hao, F. Agricultural drought prediction in China based on drought propagation and large-scale drivers. Agric. Water Manag. 2021, 255, 107028. [Google Scholar] [CrossRef]
- Satapathy, T.; Dietrich, J.; Ramadas, M. Agricultural drought monitoring and early warning at the regional scale using a remote sensing-based combined index. Environ. Monit. Assess. 2024, 196, 1132. [Google Scholar] [CrossRef] [PubMed]
- Bhatt, S.C.; Singh, V.K.; Singh, M. Perspectives of drought in bundelkhand, central India; Causes, effects, and mitigation: A review. In Geospatial Technologies for Integrated Water Resources Management: Mapping, Modelling, and Decision-Making; Springer: Cham, Switzerland, 2024; pp. 103–114. [Google Scholar]
- Pachore, A.B.; Remesan, R.; Kumar, R. Multifractal characterization of meteorological to agricultural drought propagation over India. Sci. Rep. 2024, 14, 18889. [Google Scholar] [CrossRef]
- Gupta, A.; Jain, M.K.; Pandey, R.P. The changing characteristics of propagation time from meteorological drought to hydrological drought in a semi-arid river basin in India. Hydrol. Processes 2024, 38, e15266. [Google Scholar] [CrossRef]
- Pandey, V.; Srivastava, P.K.; Singh, A.K.; Suman, S.; Maurya, S. Techniques and tools for monitoring agriculture drought: A review. In Geographical Information Science; Elsevier: Amsterdam, The Netherlands, 2024; pp. 497–519. [Google Scholar]
- Senapati, U.; Das, T.K. Geospatial assessment of agricultural drought vulnerability using integrated three-dimensional model in the upper Dwarakeshwar river basin in West Bengal, India. Environ. Sci. Pollut. Res. 2024, 31, 54061–54088. [Google Scholar] [CrossRef]
- Kumaraperumal, R.; Pazhanivelan, S.; Ragunath, K.; Kannan, B.; Prajesh, P.; Mugilan, G. Agricultural drought monitoring in Tamil Nadu in India using Satellite-based multi vegetation indices. J. Appl. Nat. Sci. 2021, 13, 414–423. [Google Scholar] [CrossRef]
- Nguyen, N.; Nguyen, B. Potential of drought monitoring using Sentinel-2 data. In Proceedings of the Conference: GeoInformatics for Spatial-Infrastructure Development in Earth and Allied Sciences (GISIDEAS), Hanoi, Vietnam, 12–15 November 2016. [Google Scholar]
- Behifar, M.; Kakroodi, A.A.; Kiavarz, M.; Azizi, G. Satellite-based drought monitoring using optimal indices for diverse climates and land types. Ecol. Inform. 2023, 76, 102143. [Google Scholar] [CrossRef]
- Sorooshian, S.; AghaKouchak, A.; Arkin, P.; Eylander, J.; Foufoula-Georgiou, E.; Harmon, R.; Hendrickx, J.M.; Imam, B.; Kuligowski, R.; Skahill, B.; et al. Advanced concepts on remote sensing of precipitation at multiple scales. Bull. Am. Meteorol. Soc. 2011, 92, 1353–1357. [Google Scholar] [CrossRef]
- Anderson, M.C.; Hain, C.; Wardlow, B.; Pimstein, A.; Mecikalski, J.R.; Kustas, W.P. Evaluation of drought indices based on thermal remote sensing of evapotranspiration over the continental United States. J. Clim. 2011, 24, 2025–2044. [Google Scholar] [CrossRef]
- Heim, R.R., Jr. A review of twentieth-century drought indices used in the United States. Bull. Am. Meteorol. Soc. 2002, 83, 1149–1166. [Google Scholar] [CrossRef]
- Xie, F.; Fan, H. Deriving drought indices from MODIS vegetation indices (NDVI/EVI) and Land Surface Temperature (LST): Is data reconstruction necessary? Int. J. Appl. Earth Obs. Geoinf. 2021, 101, 102352. [Google Scholar] [CrossRef]
- Gu, Y.; Brown, J.F.; Verdin, J.P.; Wardlow, B. A five-year analysis of MODIS NDVI and NDWI for grassland drought assessment over the central Great Plains of the United States. Geophys. Res. Lett. 2007, 34. [Google Scholar] [CrossRef]
- Nam, W.H.; Tadesse, T.; Wardlow, B.D.; Hayes, M.J.; Svoboda, M.D.; Hong, E.M.; Pachepsky, Y.A.; Jang, M.W. Developing the vegetation drought response index for South Korea (VegDRI-SKorea) to assess the vegetation condition during drought events. Int. J. Remote Sens. 2018, 39, 1548–1574. [Google Scholar] [CrossRef]
- Parkash, V.; Singh, S. A review on potential plant-based water stress indicators for vegetable crops. Sustainability 2020, 12, 3945. [Google Scholar] [CrossRef]
- Martínez-Fernández, J.; González-Zamora, A.; Sánchez, N.; Gumuzzio, A.; Herrero-Jiménez, C. Satellite soil moisture for agricultural drought monitoring: Assessment of the SMOS derived Soil Water Deficit Index. Remote Sens. Environ. 2016, 177, 277–286. [Google Scholar] [CrossRef]
- Anderson, M.C.; Zolin, C.A.; Sentelhas, P.C.; Hain, C.R.; Semmens, K.; Yilmaz, M.T.; Gao, F.; Otkin, J.A.; Tetrault, R. The Evaporative Stress Index as an indicator of agricultural drought in Brazil: An assessment based on crop yield impacts. Remote Sens. Environ. 2016, 174, 82–99. [Google Scholar]
- Mu, Q.; Zhao, M.; Kimball, J.S.; McDowell, N.G.; Running, S.W. A remotely sensed global terrestrial drought severity index. Bull. Am. Meteorol. Soc. 2013, 94, 83–98. [Google Scholar] [CrossRef]
- Dilip, T.; Kumari, M.; Murthy, C.; Neelima, T.; Chakraborty, A.; Devi, M.U. Monitoring early-season agricultural drought using temporal Sentinel-1 SAR-based combined drought index. Environ. Monit. Assess. 2023, 195, 925. [Google Scholar] [PubMed]
- Volden, E. New Capabilities in Earth Observation for Agriculture; European Space Agency: Budapest, Hungary, 2017. [Google Scholar]
- Varghese, D.; Radulović, M.; Stojković, S.; Crnojević, V. Reviewing the potential of Sentinel-2 in assessing the drought. Remote Sens. 2021, 13, 3355. [Google Scholar]
- Wang, Q.; Blackburn, G.A.; Onojeghuo, A.O.; Dash, J.; Zhou, L.; Zhang, Y.; Atkinson, P.M. Fusion of Landsat 8 OLI and Sentinel-2 MSI data. IEEE Trans. Geosci. Remote Sens. 2017, 55, 3885–3899. [Google Scholar]
- Thanh Noi, P.; Kappas, M. Comparison of random forest, k-nearest neighbor, and support vector machine classifiers for land cover classification using Sentinel-2 imagery. Sensors 2017, 18, 18. [Google Scholar] [CrossRef]
- Ferrant, S.; Selles, A.; Le Page, M.; Ahmad, A.B.; Mermoz, S.; Gascoin, S.; Bouvet, A.; Ahmed, S.; Kerr, Y.H. Sentinel-1&2 for near real time cropping pattern monitoring in drought prone areas. application to irrigation water needs in telangana, south-india. Int. Arch. Photogramm. Remote Sens. Spat. Inf. Sci. 2019, 42, 285–292. [Google Scholar]
- Zhang, L.; Liu, Y.; Ren, L.; Teuling, A.J.; Zhu, Y.; Wei, L.; Zhang, L.; Jiang, S.; Yang, X.; Fang, X.; et al. Analysis of flash droughts in China using machine learning. Hydrol. Earth Syst. Sci. 2022, 26, 3241–3261. [Google Scholar] [CrossRef]
- Gupta, A.; Kaur, L.; Kaur, G. Drought stress detection technique for wheat crop using machine learning. PeerJ Comput. Sci. 2023, 9, e1268. [Google Scholar] [CrossRef] [PubMed]
- Mokhtar, A.; Jalali, M.; He, H.; Al-Ansari, N.; Elbeltagi, A.; Alsafadi, K.; Abdo, H.G.; Sammen, S.S.; Gyasi-Agyei, Y.; Rodrigo-Comino, J. Estimation of SPEI meteorological drought using machine learning algorithms. IEEE Access 2021, 9, 65503–65523. [Google Scholar] [CrossRef]
- Sriram, K.; Suresh, K. Machine learning perspective for predicting agricultural droughts using Naïve Bayes algorithm. Middle-East J. Sci. Res. 2016, 24, 178–184. [Google Scholar]
- Lee, C.S.; Sohn, E.; Park, J.D.; Jang, J.D. Estimation of soil moisture using deep learning based on satellite data: A case study of South Korea. GIScience Remote Sens. 2019, 56, 43–67. [Google Scholar] [CrossRef]
- Feng, P.; Wang, B.; Li Liu, D.; Yu, Q. Machine learning-based integration of remotely-sensed drought factors can improve the estimation of agricultural drought in South-Eastern Australia. Agric. Syst. 2019, 173, 303–316. [Google Scholar] [CrossRef]
- Prodhan, F.A.; Zhang, J.; Hasan, S.S.; Sharma, T.P.P.; Mohana, H.P. A review of machine learning methods for drought hazard monitoring and forecasting: Current research trends, challenges, and future research directions. Environ. Model. Softw. 2022, 149, 105327. [Google Scholar] [CrossRef]
- Bowen, D.; Ungar, L. Generalized SHAP: Generating multiple types of explanations in machine learning. arXiv 2020, arXiv:2006.07155. [Google Scholar] [CrossRef]
- Saari, D.G. Selecting a voting method: The case for the Borda count. Const. Political Econ. 2023, 34, 357–366. [Google Scholar] [CrossRef]
- West, H.; Quinn, N.; Horswell, M.; White, P. Assessing vegetation response to soil moisture fluctuation under extreme drought using sentinel-2. Water 2018, 10, 838. [Google Scholar] [CrossRef]
- Huete, A.; Justice, C.; Van Leeuwen, W. MODIS vegetation index (MOD13). Algorithm Theor. Basis Doc. 1999, 3, 295–309. [Google Scholar]
- Jopia, A.; Zambrano, F.; Pérez-Martínez, W.; Vidal-Páez, P.; Molina, J.; De la Hoz Mardones, F. Time-series of vegetation indices (VNIR/SWIR) derived from Sentinel-2 (A/B) to assess turgor pressure in kiwifruit. ISPRS Int. J. Geo-Inf. 2020, 9, 641. [Google Scholar] [CrossRef]
- Jiang, Z.; Huete, A.R.; Didan, K.; Miura, T. Development of a two-band enhanced vegetation index without a blue band. Remote Sens. Environ. 2008, 112, 3833–3845. [Google Scholar] [CrossRef]
- Sentinel Hub. Atmospherically Resistant Vegetation Index (ARVI). 2024. Available online: https://custom-scripts.sentinel-hub.com/sentinel-2/arvi/ (accessed on 27 January 2024).
- Marshall, G.; Zhou, X. Drought detection in semi-arid regions using remote sensing of vegetation indices and drought indices. In Proceedings of the IGARSS 2004, 2004 IEEE International Geoscience and Remote Sensing Symposium, Anchorage, AK, USA, 20–24 September 2004; Volume 3, pp. 1555–1558. [Google Scholar]
- Kaufman, Y.J.; Tanre, D. Atmospherically resistant vegetation index (ARVI) for EOS-MODIS. IEEE Trans. Geosci. Remote Sens. 1992, 30, 261–270. [Google Scholar] [CrossRef]
- Ahmed, T.; Javed, N.; Faisal, M.; Sadia, H. A framework for smart agriculture system to monitor the crop stress and drought stress using sentinel-2 satellite image. In Proceedings of the 3rd International Conference on Artificial Intelligence: Advances and Applications: ICAIAA 2022, Jaipur, India, 23–24 April 2022; Springer: Berlin/Heidelberg, Germany, 2023; pp. 345–361. [Google Scholar]
- McFeeters, S.K. The use of the Normalized Difference Water Index (NDWI) in the delineation of open water features. Int. J. Remote Sens. 1996, 17, 1425–1432. [Google Scholar] [CrossRef]
- Huete, A.R. A soil-adjusted vegetation index (SAVI). Remote Sens. Environ. 1988, 25, 295–309. [Google Scholar] [CrossRef]
- Sun, C.; Li, J.; Cao, L.; Liu, Y.; Jin, S.; Zhao, B. Evaluation of vegetation index-based curve fitting models for accurate classification of salt marsh vegetation using sentinel-2 time-series. Sensors 2020, 20, 5551. [Google Scholar] [CrossRef] [PubMed]
- Nellis, M.D.; Briggs, J.M. Transformed vegetation index for measuring spatial variation in drought impacted biomass on Konza Prairie, Kansas. In Transactions of the Kansas Academy of Science (1903); Kansas Academy of Science: Lawrence, KS, USA, 1992; pp. 93–99. [Google Scholar]
- Gu, Z.; Zeng, Z.; Shi, X.; Yu, D.; Zheng, W.; Zhang, Z.; Hu, Z. Estimating models of vegetation fractional coverage based on remote sensing images at different radiometric correction levels. Front. For. China 2009, 4, 402–408. [Google Scholar] [CrossRef]
- Strashok, O.; Ziemiańska, M.; Strashok, V. Evaluation and Correlation of Sentinel-2 NDVI and NDMI in Kyiv (2017–2021). J. Ecol. Eng. 2022, 23. [Google Scholar] [CrossRef] [PubMed]
- Sentinel Hub. Normalized Difference Moisture Index (NDMI). 2024. Available online: https://custom-scripts.sentinel-hub.com/sentinel-2/ndmi/ (accessed on 27 January 2024).
- Wang, L.; Qu, J.J. NMDI: A normalized multi-band drought index for monitoring soil and vegetation moisture with satellite remote sensing. Geophys. Res. Lett. 2007, 34. [Google Scholar] [CrossRef]
- Zhang, H.w.; Chen, H.l. The Application of Modified Normalized Difference Water Index (MNDWI) by Leaf Area Index in the Retrieval of Regional Drought Monitoring. Int. Arch. Photogramm. Remote Sens. Spat. Inf. Sci. 2015, 40, 141–147. [Google Scholar] [CrossRef]
- Xu, H. Modification of normalised difference water index (NDWI) to enhance open water features in remotely sensed imagery. Int. J. Remote Sens. 2006, 27, 3025–3033. [Google Scholar] [CrossRef]
- Jurgens, C. The modified normalized difference vegetation index (mNDVI) a new index to determine frost damages in agriculture based on Landsat TM data. Int. J. Remote Sens. 1997, 18, 3583–3594. [Google Scholar] [CrossRef]
- Dong, Z.; Wang, L.; Gao, M.; Zhu, X.; Feng, W.; Li, N. Ratio Drought Index (RDI): A soil moisture index based on new NIR-red triangle space. Int. J. Remote Sens. 2024, 45, 6976–6989. [Google Scholar] [CrossRef]
- EOS Data Analytics. Chlorophyll Index: Overview, Calculation, and Application. 2024. Available online: https://eos.com/make-an-analysis/chlorophyll-index/ (accessed on 27 January 2024).
- Sentinel Hub. Red-edge Chlorophyll Index (RECI). 2024. Available online: https://custom-scripts.sentinel-hub.com/custom-scripts/sentinel-2/chl_rededge/ (accessed on 27 January 2024).
- Patil, P.P.; Jagtap, M.P.; Khatri, N.; Madan, H.; Vadduri, A.A.; Patodia, T. Exploration and advancement of NDDI leveraging NDVI and NDWI in Indian semi-arid regions: A remote sensing-based study. Case Stud. Chem. Environ. Eng. 2024, 9, 100573. [Google Scholar] [CrossRef]
- Shibani, N.; Pandey, A.; Satyam, V.K.; Bhari, J.S.; Karimi, B.A.; Gupta, S.K. Study on the variation of NDVI, SAVI and EVI indices in Punjab State, India. In IOP Conference Series: Earth and Environmental Science; IOP Publishing: Bristol, UK, 2023; Volume 1110, p. 012070. [Google Scholar]
- Ali, S.; Tong, D.; Xu, Z.T.; Henchiri, M.; Wilson, K.; Siqi, S.; Zhang, J. Characterization of drought monitoring events through MODIS-and TRMM-based DSI and TVDI over South Asia during 2001–2017. Environ. Sci. Pollut. Res. 2019, 26, 33568–33581. [Google Scholar] [CrossRef]
- Jafarzadeh, H.; Mahdianpari, M.; Gill, E.; Mohammadimanesh, F.; Homayouni, S. Bagging and boosting ensemble classifiers for classification of multispectral, hyperspectral and PolSAR data: A comparative evaluation. Remote Sens. 2021, 13, 4405. [Google Scholar] [CrossRef]
- Shao, Z.; Ahmad, M.N.; Javed, A. Comparison of Random Forest and XGBoost Classifiers Using Integrated Optical and SAR Features for Mapping Urban Impervious Surface. Remote Sens. 2024, 16, 665. [Google Scholar] [CrossRef]
- Breiman, L. Random forests. Mach. Learn. 2001, 45, 5–32. [Google Scholar] [CrossRef]
- Friedman, J.H. Greedy function approximation: A gradient boosting machine. Ann. Stat. 2001, 29, 1189–1232. [Google Scholar] [CrossRef]
- Chen, T.; Guestrin, C. Xgboost: A scalable tree boosting system. In Proceedings of the 22nd ACM Sigkdd International Conference on Knowledge Discovery and Data Mining, San Francisco, CA, USA, 13–17 August 2016; pp. 785–794. [Google Scholar]
- Breiman, L. Bagging predictors. Mach. Learn. 1996, 24, 123–140. [Google Scholar] [CrossRef]
- Shapley, L.S. A value for n-person games. In Contribution to the Theory of Games; Princeton University Press: Princeton, NJ, USA, 1953; Volume 2. [Google Scholar]
- Lundberg, S.M.; Lee, S.I. A unified approach to interpreting model predictions. In Proceedings of the 31st International Conference on Neural Information Processing Systems, Long Beach, CA, USA, 4–9 December 2017; NIPS’17. pp. 4768–4777. [Google Scholar]
- Lundberg, S.M.; Erion, G.; Chen, H.; DeGrave, A.; Prutkin, J.M.; Nair, B.; Katz, R.; Himmelfarb, J.; Bansal, N.; Lee, S.I. From local explanations to global understanding with explainable AI for trees. Nat. Mach. Intell. 2020, 2, 56–67. [Google Scholar] [CrossRef] [PubMed]
- Pacuit, E. Voting Methods. 2011. Available online: https://plato.stanford.edu/eNtRIeS/voting-methods/ (accessed on 1 September 2025).
- Churchman, C.W.; Ackoff, R.L. An approximate measure of value. J. Oper. Res. Soc. Am. 1954, 2, 172–187. [Google Scholar] [CrossRef]
- Chawla, N.V.; Bowyer, K.W.; Hall, L.O.; Kegelmeyer, W.P. SMOTE: Synthetic minority over-sampling technique. J. Artif. Intell. Res. 2002, 16, 321–357. [Google Scholar] [CrossRef]
- Han, H.; Wang, W.Y.; Mao, B.H. Borderline-SMOTE: A new over-sampling method in imbalanced data sets learning. In Proceedings of the International Conference on Intelligent Computing, Hefei, China, 23–26 August 2005; Springer: Berlin/Heidelberg, Germany, 2005; pp. 878–887. [Google Scholar]
- He, H.; Bai, Y.; Garcia, E.A.; Li, S. ADASYN: Adaptive synthetic sampling approach for imbalanced learning. In Proceedings of the 2008 IEEE International Joint Conference on Neural Networks (IEEE World Congress on COMPUTATIONAL Intelligence), Hong Kong, 1–8 June 2008; pp. 1322–1328. [Google Scholar]
- Krawczyk, B. Learning from imbalanced data: Open challenges and future directions. Prog. Artif. Intell. 2016, 5, 221–232. [Google Scholar] [CrossRef]
- Kumari, N.; Kanungo, S.; Mukherjee, J. An Elementary Cellular Automata Based Two-Class Data Imbalance Problem: Initial Study and Observations. In Proceedings of the Asian Symposium on Cellular Automata Technology, Ranchi, India, 6–8 March 2025; Springer: Berlin/Heidelberg, Germany, 2025; pp. 57–68. [Google Scholar]
- Food and Agriculture Organization of the United Nations. FAO Global Administrative Unit Layers (GAUL) 2015. Available online: https://www.fao.org/about/about-fao/en/ (accessed on 27 January 2024).
- Copernicus. Copernicus Global Land Cover. Available online: https://land.copernicus.eu/global/lc (accessed on 27 January 2024).
- ISRO. Drought Assessment Using Remote Sensing and GIS: Drought Manual 2020; Technical Report, National Remote Sensing Centre (NRSC); ISRO: Bengaluru, India, 2020.
- ISRO. Agri-DSS Help Manual; Technical Report, National Remote Sensing Centre (NRSC); ISRO: Bengaluru, India, 2020.
- Mishra, V.; Singh, M.; Ghosh, S. Monitoring Agricultural Drought in India Using Multisource Remote Sensing Indicators. Environ. Challenges 2021, 4, 100021. [Google Scholar]
- The Hindu. 19 Districts in Rajasthan Drought Hit. 2016. Available online: https://www.thehindu.com/news/national/other-states/19-districts-in-rajasthan-droughthit/article8491809.ece (accessed on 7 February 2025).
- Factly. 266 Districts in 11 Different States Declared Drought-Affected (2015-16). 2016. Available online: https://factly.in/266-districts-11-different-states-drought-affected-2015-16/ (accessed on 7 February 2025).
- Parliament of India. Drought Fund Allocation Status (2017). 2017. Available online: https://sansad.in/getFile/loksabhaquestions/annex/14/AU4057.pdf?source=pqals (accessed on 7 February 2025).
- Firstpost Editor. Drought in Rajasthan: Over Rs 7000 Crore Spent on Projects But Not Much Water Has Flown Through Western Region. 2019. Available online: https://www.firstpost.com/india/drought-in-rajasthan-over-rs-7000-crore-spent-on-projects-but-not-much-water-has-flown-through-western-region-6331911.html (accessed on 7 February 2025).
- ANI. Rajasthan Govt Declares 5555 Villages as Drought-Affected. 2019. Available online: https://www.aninews.in/news/national/general-news/rajasthan-govt-declares-5555-villages-as-drought-affected20190306224744/ (accessed on 7 February 2025).
- The Statesman. 1388 Villages in Rajasthan Declared Drought-Affected by State Govt. 2019. Available online: https://www.thestatesman.com/india/1388-villages-in-rajasthan-declared-drought-affected-by-state-govt-1502820817.html (accessed on 7 February 2025).
- NDTV. More Than 1000 Villages in 4 Districts of Rajasthan Affected by Drought. 2019. Available online: https://www.ndtv.com/india-news/more-than-1-000-villages-in-4-districts-of-rajasthan-affected-by-draught-2130998 (accessed on 7 February 2025).
- Government of India. Annexure to Lok Sabha Question AU454: Central Assistance for Drought. 2020. Available online: https://sansad.in/getFile/loksabhaquestions/annex/177/AU454.pdf?source=pqals (accessed on 7 February 2025).
- State Level Bankers’ Committee, Rajasthan. Agenda Notes for the 152nd SLBC Meeting. 2025. Available online: https://slbcrajasthan.in/uploads/CEDocuments/Agenda152.pdf (accessed on 3 August 2025).
- Disaster Management & Relief Department, Government of Rajasthan. Notification Regarding Drought Declaration (Dated: 29/10/2021). 2021. Available online: https://dmrelief.rajasthan.gov.in/documents/Notification_Drought_29102021.pdf (accessed on 3 August 2025).
- Disaster Management & Relief Department, Government of Rajasthan. Notification Regarding Drought Declaration for Pali District (2022). 2022. Available online: https://dmrelief.rajasthan.gov.in/documents/Notifidroughtpali2022.pdf (accessed on 3 August 2025).
- Disaster Management & Relief Department, Government of Rajasthan. Directions Regarding Operation of Fodder Depots (Dated: 28/05/2024). 2024. Available online: https://dmrelief.rajasthan.gov.in/documents/fodder_depot_direction_28052024.pdf (accessed on 3 August 2025).
- Times of India. Funds Okayed for Transporting Water to 13 Drought-Hit Districts. 2024. Available online: https://timesofindia.indiatimes.com/city/jaipur/funds-okayed-for-transporting-water-to-13-drought-hit-districts/articleshow/108427789.cms (accessed on 3 August 2025).
- Economic Times. Maharashtra Government Declares Drought in 29,000 Villages. 2016. Available online: https://economictimes.indiatimes.com/news/politics-and-nation/maharashtra-government-declares-drought-in-29000-villages/articleshow/52238372.cms?from=mdr (accessed on 7 February 2025).
- Hindustan Times. Maharashtra Declares Drought; 26 Districts Hit. 2018. Available online: https://www.hindustantimes.com/mumbai-news/maharashtra-declares-drought-26-districts-hit/story-ETaPfo9owb7yVW8EQ1lQGL.html (accessed on 7 February 2025).
- Times of India. Eight of 11 Vidarbha Districts Declared Drought-Hit. 2018. Available online: https://timesofindia.indiatimes.com/city/nagpur/8-of-11-vid-dists-declared-drought-hitryots-say-need-more-sops-to-tackle-crisis/articleshow/66595394.cms (accessed on 7 February 2025).
- Times of India. Drought Brings down Rabi Crop Area by 40% in 2018-19. 2019. Available online: https://timesofindia.indiatimes.com/city/pune/drought-brings-down-rabi-crop-area-by-40-in-2018-19/articleshow/67949533.cms (accessed on 7 February 2025).
- The News Dirt. Drought-Stricken Vidarbha Faces Falling Dam Levels and Water Supply Gaps. 2024. Available online: https://www.thenewsdirt.com/post/drought-stricken-vidarbha-faces-falling-dam-levels-and-water-supply-gaps (accessed on 3 August 2025).
- Hindustan Times. Drought in 66% of Maharashtra as State Includes 224 More Revenue Circles in the List. 2024. Available online: https://www.hindustantimes.com/cities/mumbai-news/drought-in-66-of-maharashtra-as-state-includes-more-224-revenue-circles-in-the-list-101708281986009.html (accessed on 3 August 2025).
- Agrowon. Drought-Like Condition Declared in 78 Mandals of Amravati. 2024. Available online: https://agrowon.esakal.com/agro-special/drought-like-condition-declared-in-78-mandals-of-amravati-2 (accessed on 3 August 2025).
- Agrowon. Drought Sealed in Amravati District. 2024. Available online: https://agrowon.esakal.com/agro-special/drought-sealed-in-amravati-district (accessed on 3 August 2025).
- Agrowon. Forget the Government to Announce Drought Relief. 2024. Available online: https://agrowon.esakal.com/agro-special/forget-the-government-to-announce-drought-relief?utm_source=chatgpt.com (accessed on 3 August 2025).
- The Hindu. Rain Causes Immense Damage to Huts and Paddy Fields. 2015. Available online: https://www.thehindu.com/news/national/tamil-nadu/rain-causes-immense-damage-to-huts-and-paddy-fields/article7882286.ece (accessed on 7 February 2025).
- Drought-Affected States Report AU981. 2016. Available online: https://sansad.in/getFile/loksabhaquestions/annex/15/AU981.pdf?source=pqals (accessed on 7 February 2025).
- Moneylife. Retreating Monsoon Worst in 140 Years, TN Declares Drought as 144 Farmers Die. 2017. Available online: https://www.moneylife.in/article/retreating-monsoon-worst-in-140-years-tn-declares-drought-as-144-farmers-die/49433.html (accessed on 7 February 2025).
- Tamil Nadu Agricultural Department. Government Order on Drought Declaration. 2017. Available online: https://www.tnagrisnet.tn.gov.in/fcms/documents/go/20-GO.No.29-2(2).pdf (accessed on 7 February 2025).
- The Hindu. Heavy Rain in Tiruvarur and Thanjavur Districts. 2017. Available online: https://www.thehindu.com/news/cities/Tiruchirapalli/heavy-rain-in-tiruvarur-and-thanjavur-districts/article19991157.ece (accessed on 7 February 2025).
- New Indian Express. 24 Districts Declared as Drought-Hit; Number to Rise in Coming Months. 2019. Available online: https://www.newindianexpress.com/states/tamil-nadu/2019/Mar/21/24-districts-declared-as-drought-hit-number-to-rise-in-coming-months-1953962.html (accessed on 7 February 2025).
- News Bricks. Tamil Nadu Weather Forecast 12 December 2019. 2019. Available online: https://www.newsbricks.com/tamil-nadu/tamil-nadu-weather-forecast-december-12-2019/67258 (accessed on 7 February 2025).
- Weather.com. Northeast Monsoon to Commence Over South India From 28 October 2020. 2020. Available online: https://weather.com/en-IN/india/news/news/2020-10-27-northeast-monsoon-commence-over-south-india-from-october-28 (accessed on 7 February 2025).
- Times of India. Disasters That Struck India in 2020. 2020. Available online: https://timesofindia.indiatimes.com/india/disasters-that-struck-india-in-2020/articleshow/79954339.cms (accessed on 7 February 2025).
- Mongabay. Though Cyclone Nivar Had a Soft Landing, Floods Hit Coastal Districts. 2020. Available online: https://india.mongabay.com/2020/12/though-cyclone-nivar-had-a-soft-landing-floods-hit-coastal-districts/ (accessed on 7 February 2025).
- Government of Tamil Nadu. G.O. Ms. No. 111: Government Order Regarding Drought or Relief Measures. 2024. Available online: https://www.slbctn.com/Uploads/G.O.Ms.No.111.pdf?utm_source (accessed on 3 August 2025).
- Government of Tamil Nadu. Tamil Nadu Government Gazette (Extraordinary), Part II—Section 1, Issue No. 105, Dated 13 March 2024. 2024. Available online: https://archive.org/details/in.gazette.tamilnadu.2024-03-13.Extraordinary_105_Part-II_Section-1/mode/2up (accessed on 3 August 2025).
- The New Indian Express. Paddy on 26,508 Acres in Thanjavur Damaged in Northeast Monsoon Rains, Finds Survey. 2024. Available online: https://www.newindianexpress.com/states/tamil-nadu/2024/Dec/19/paddy-on-26508-acres-in-thanjavur-damaged-in-northeast-monsoon-rains-finds-survey?utm_source=chatgpt.com (accessed on 3 August 2025).
- The New Indian Express. Crops in 13,749 Hectares in Tamil Nadu Inundated Due to Rains: Agriculture Minister Panneerselvam. 2024. Available online: https://www.newindianexpress.com/states/tamil-nadu/2024/Nov/28/crops-in-13749-hectares-in-tamil-nadu-inundated-due-to-rains-agriculture-minister-panneerselvam?utm_source=chatgpt.com (accessed on 3 August 2025).
- Lobell, D.B.; Asner, G.P. Moisture effects on soil reflectance. Soil Sci. Soc. Am. J. 2002, 66, 722–727. [Google Scholar] [CrossRef]


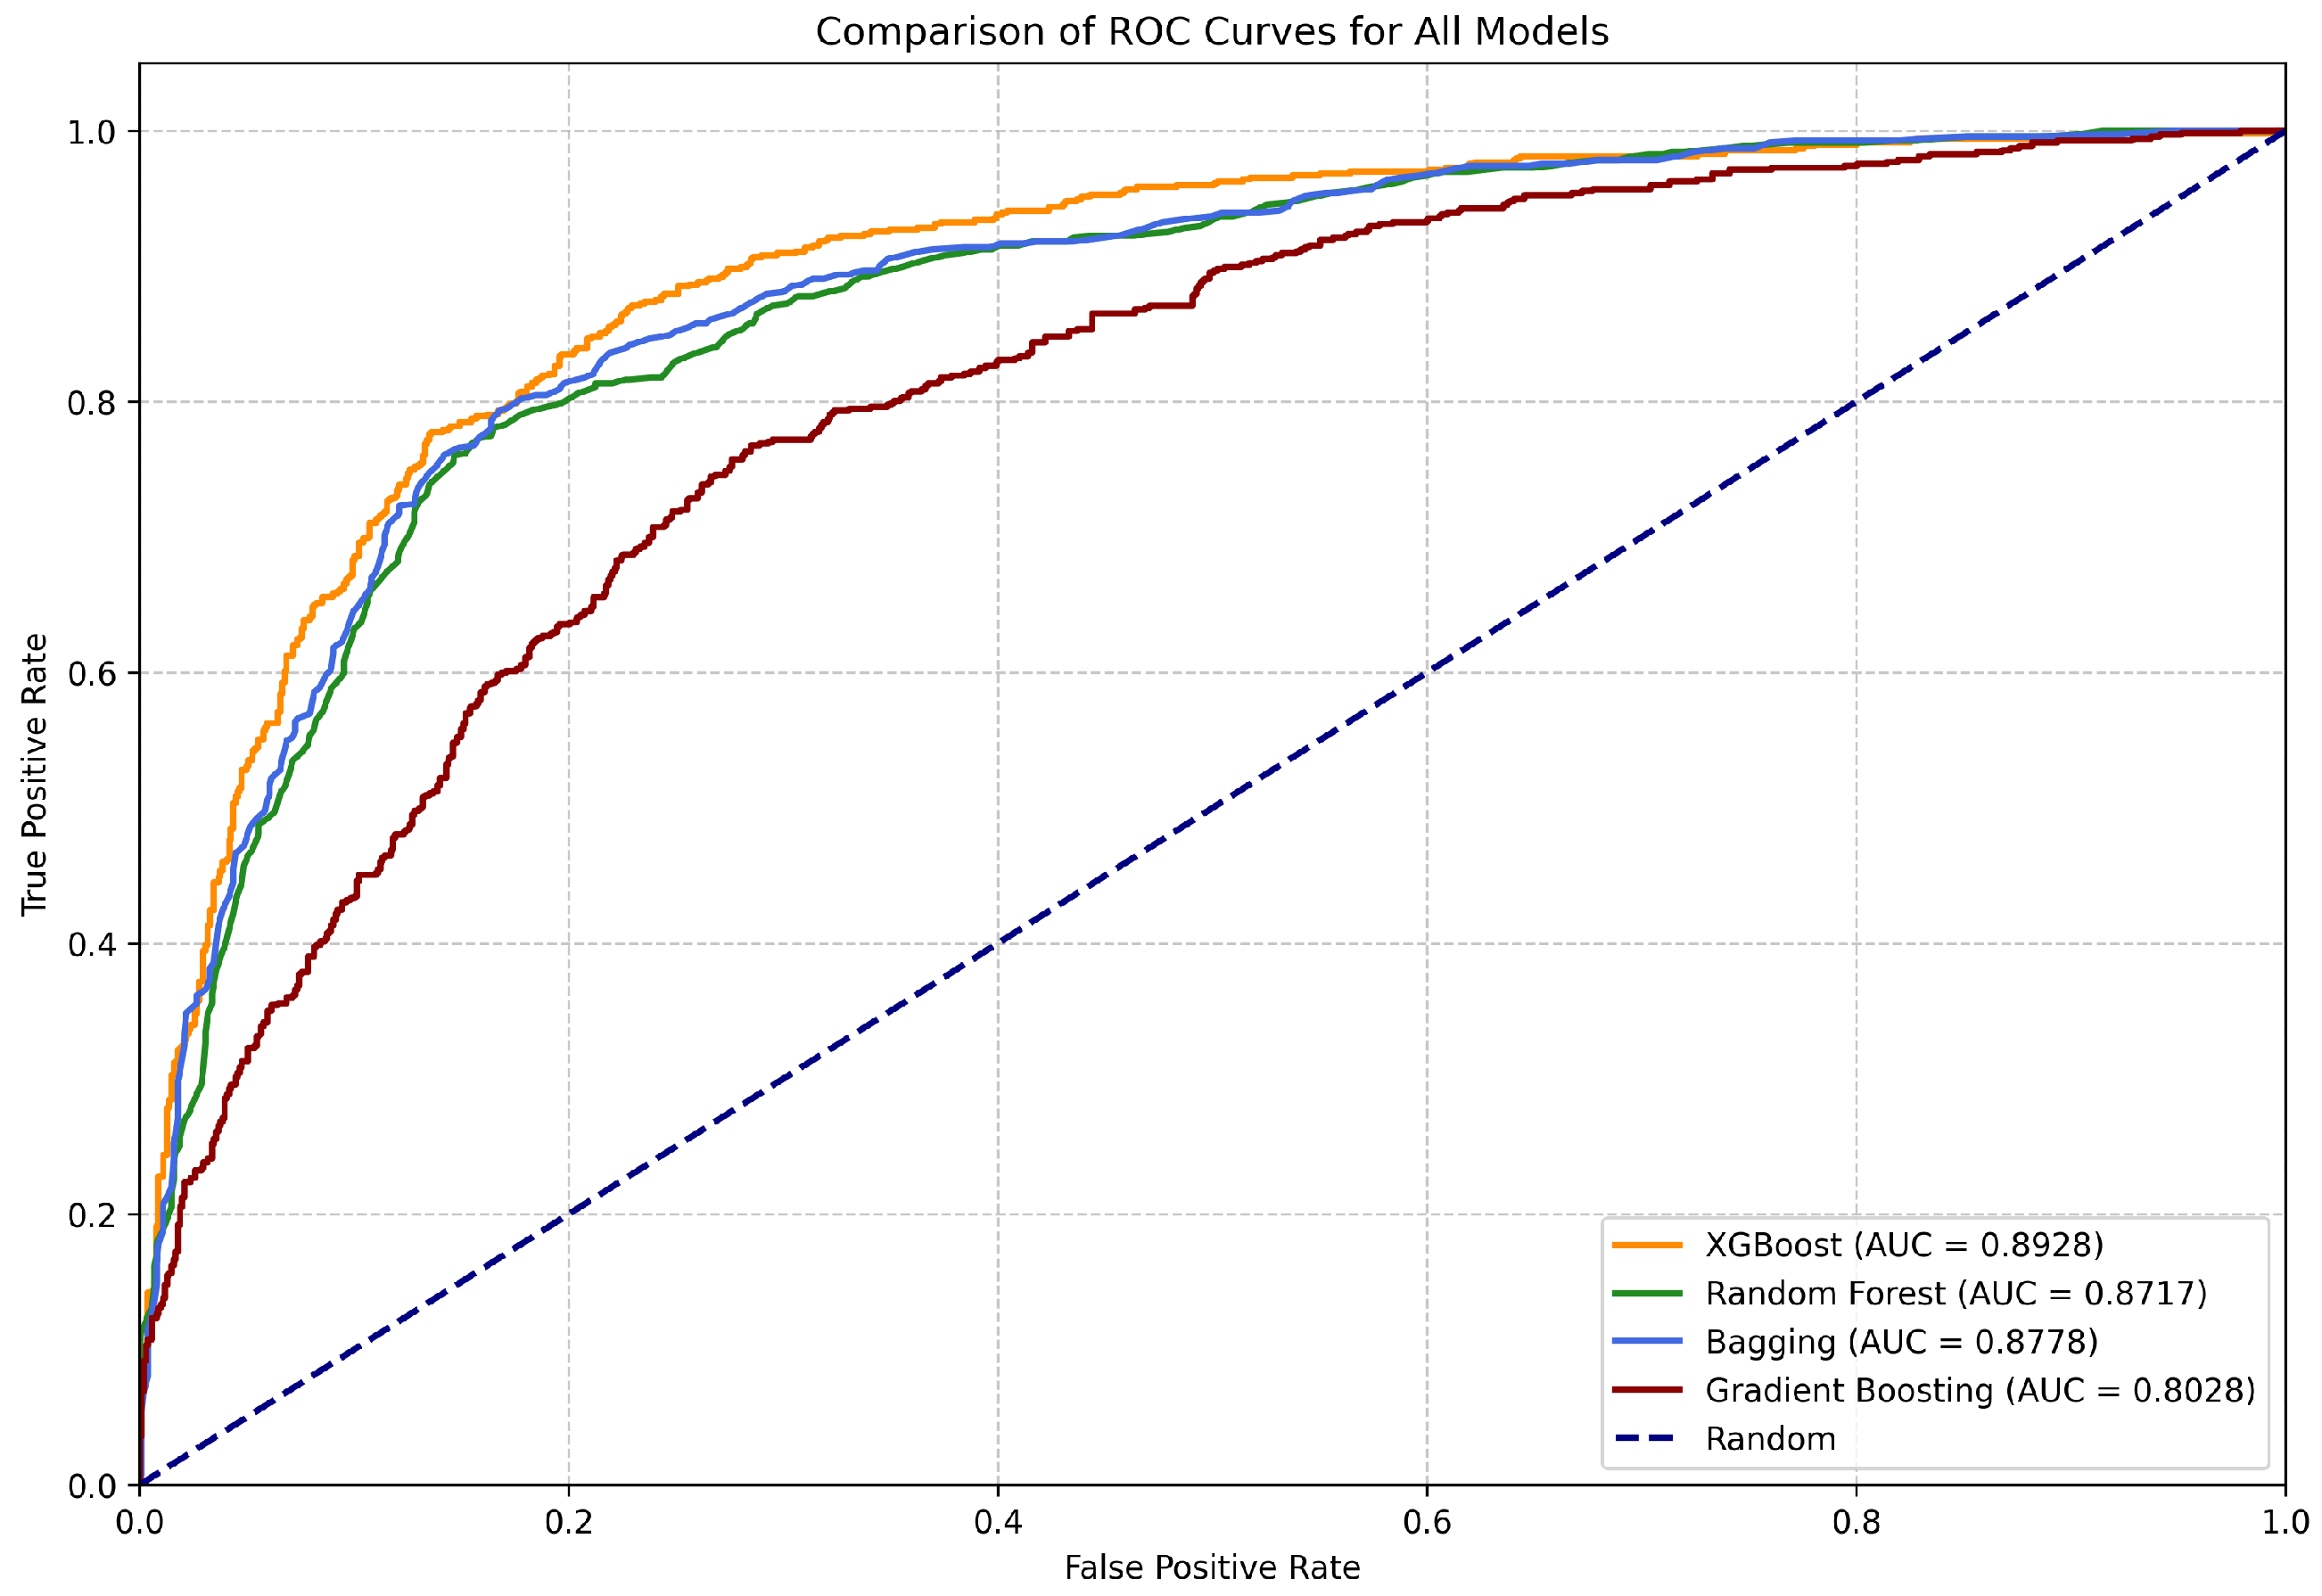
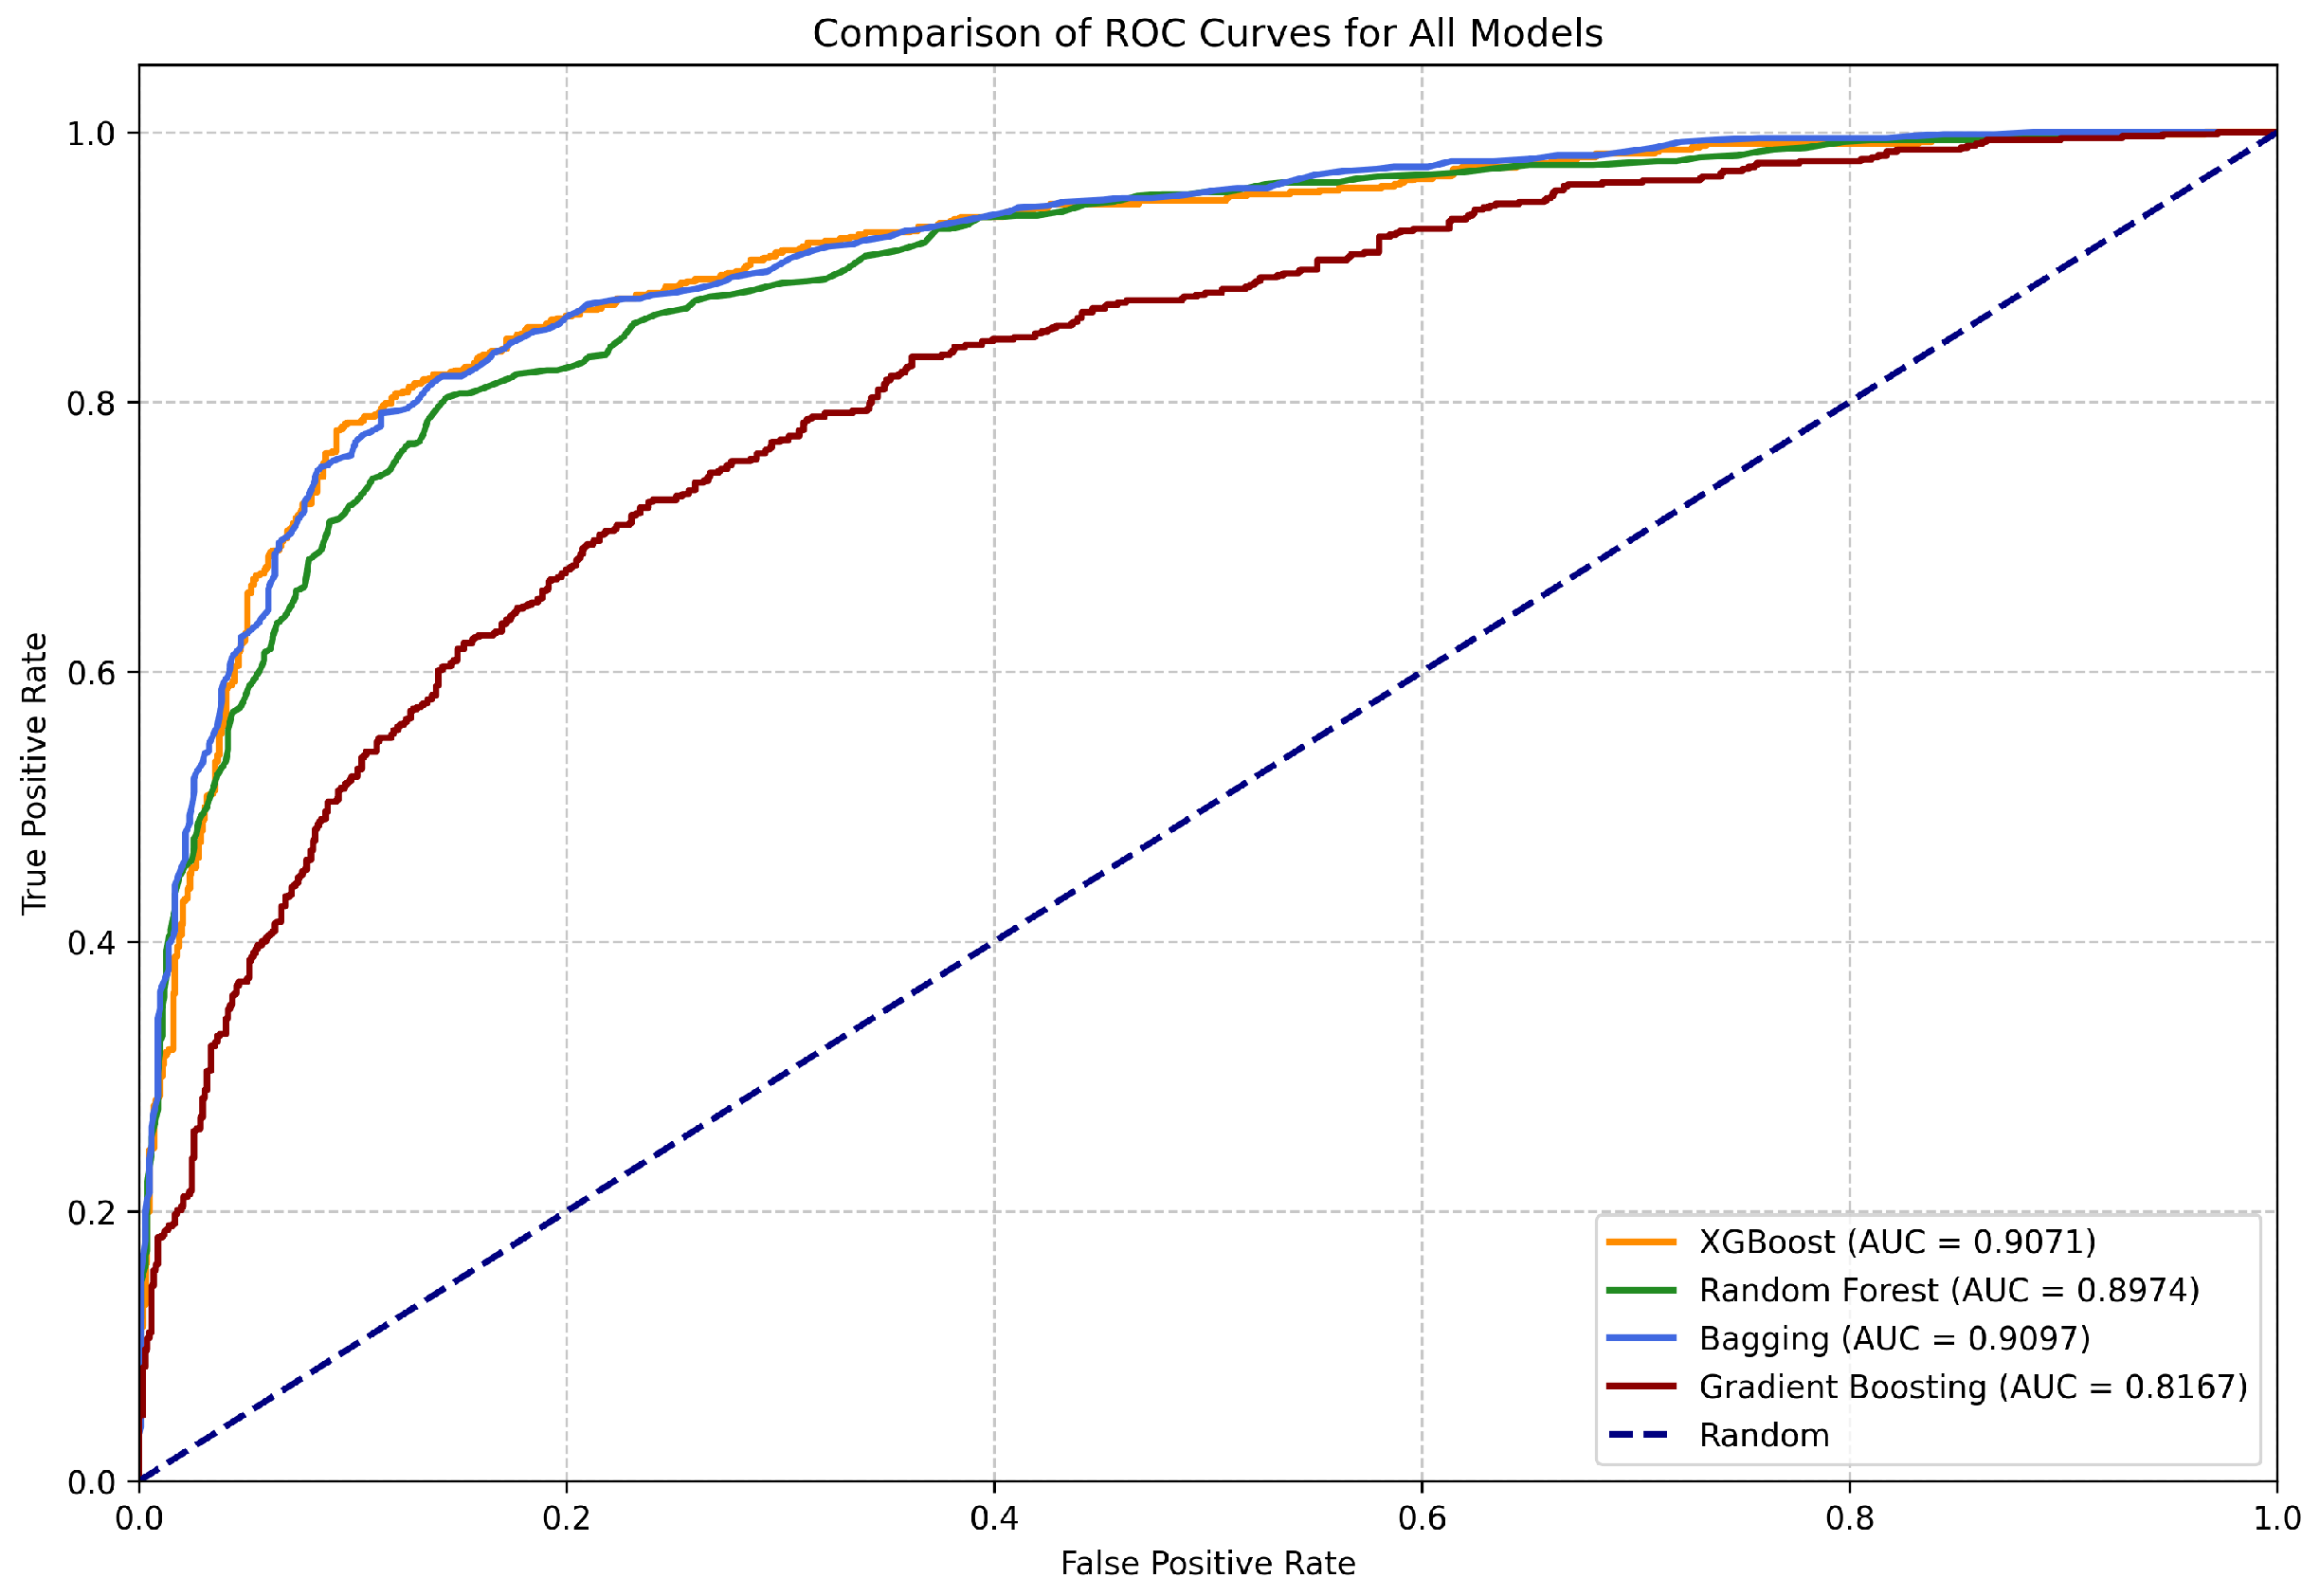
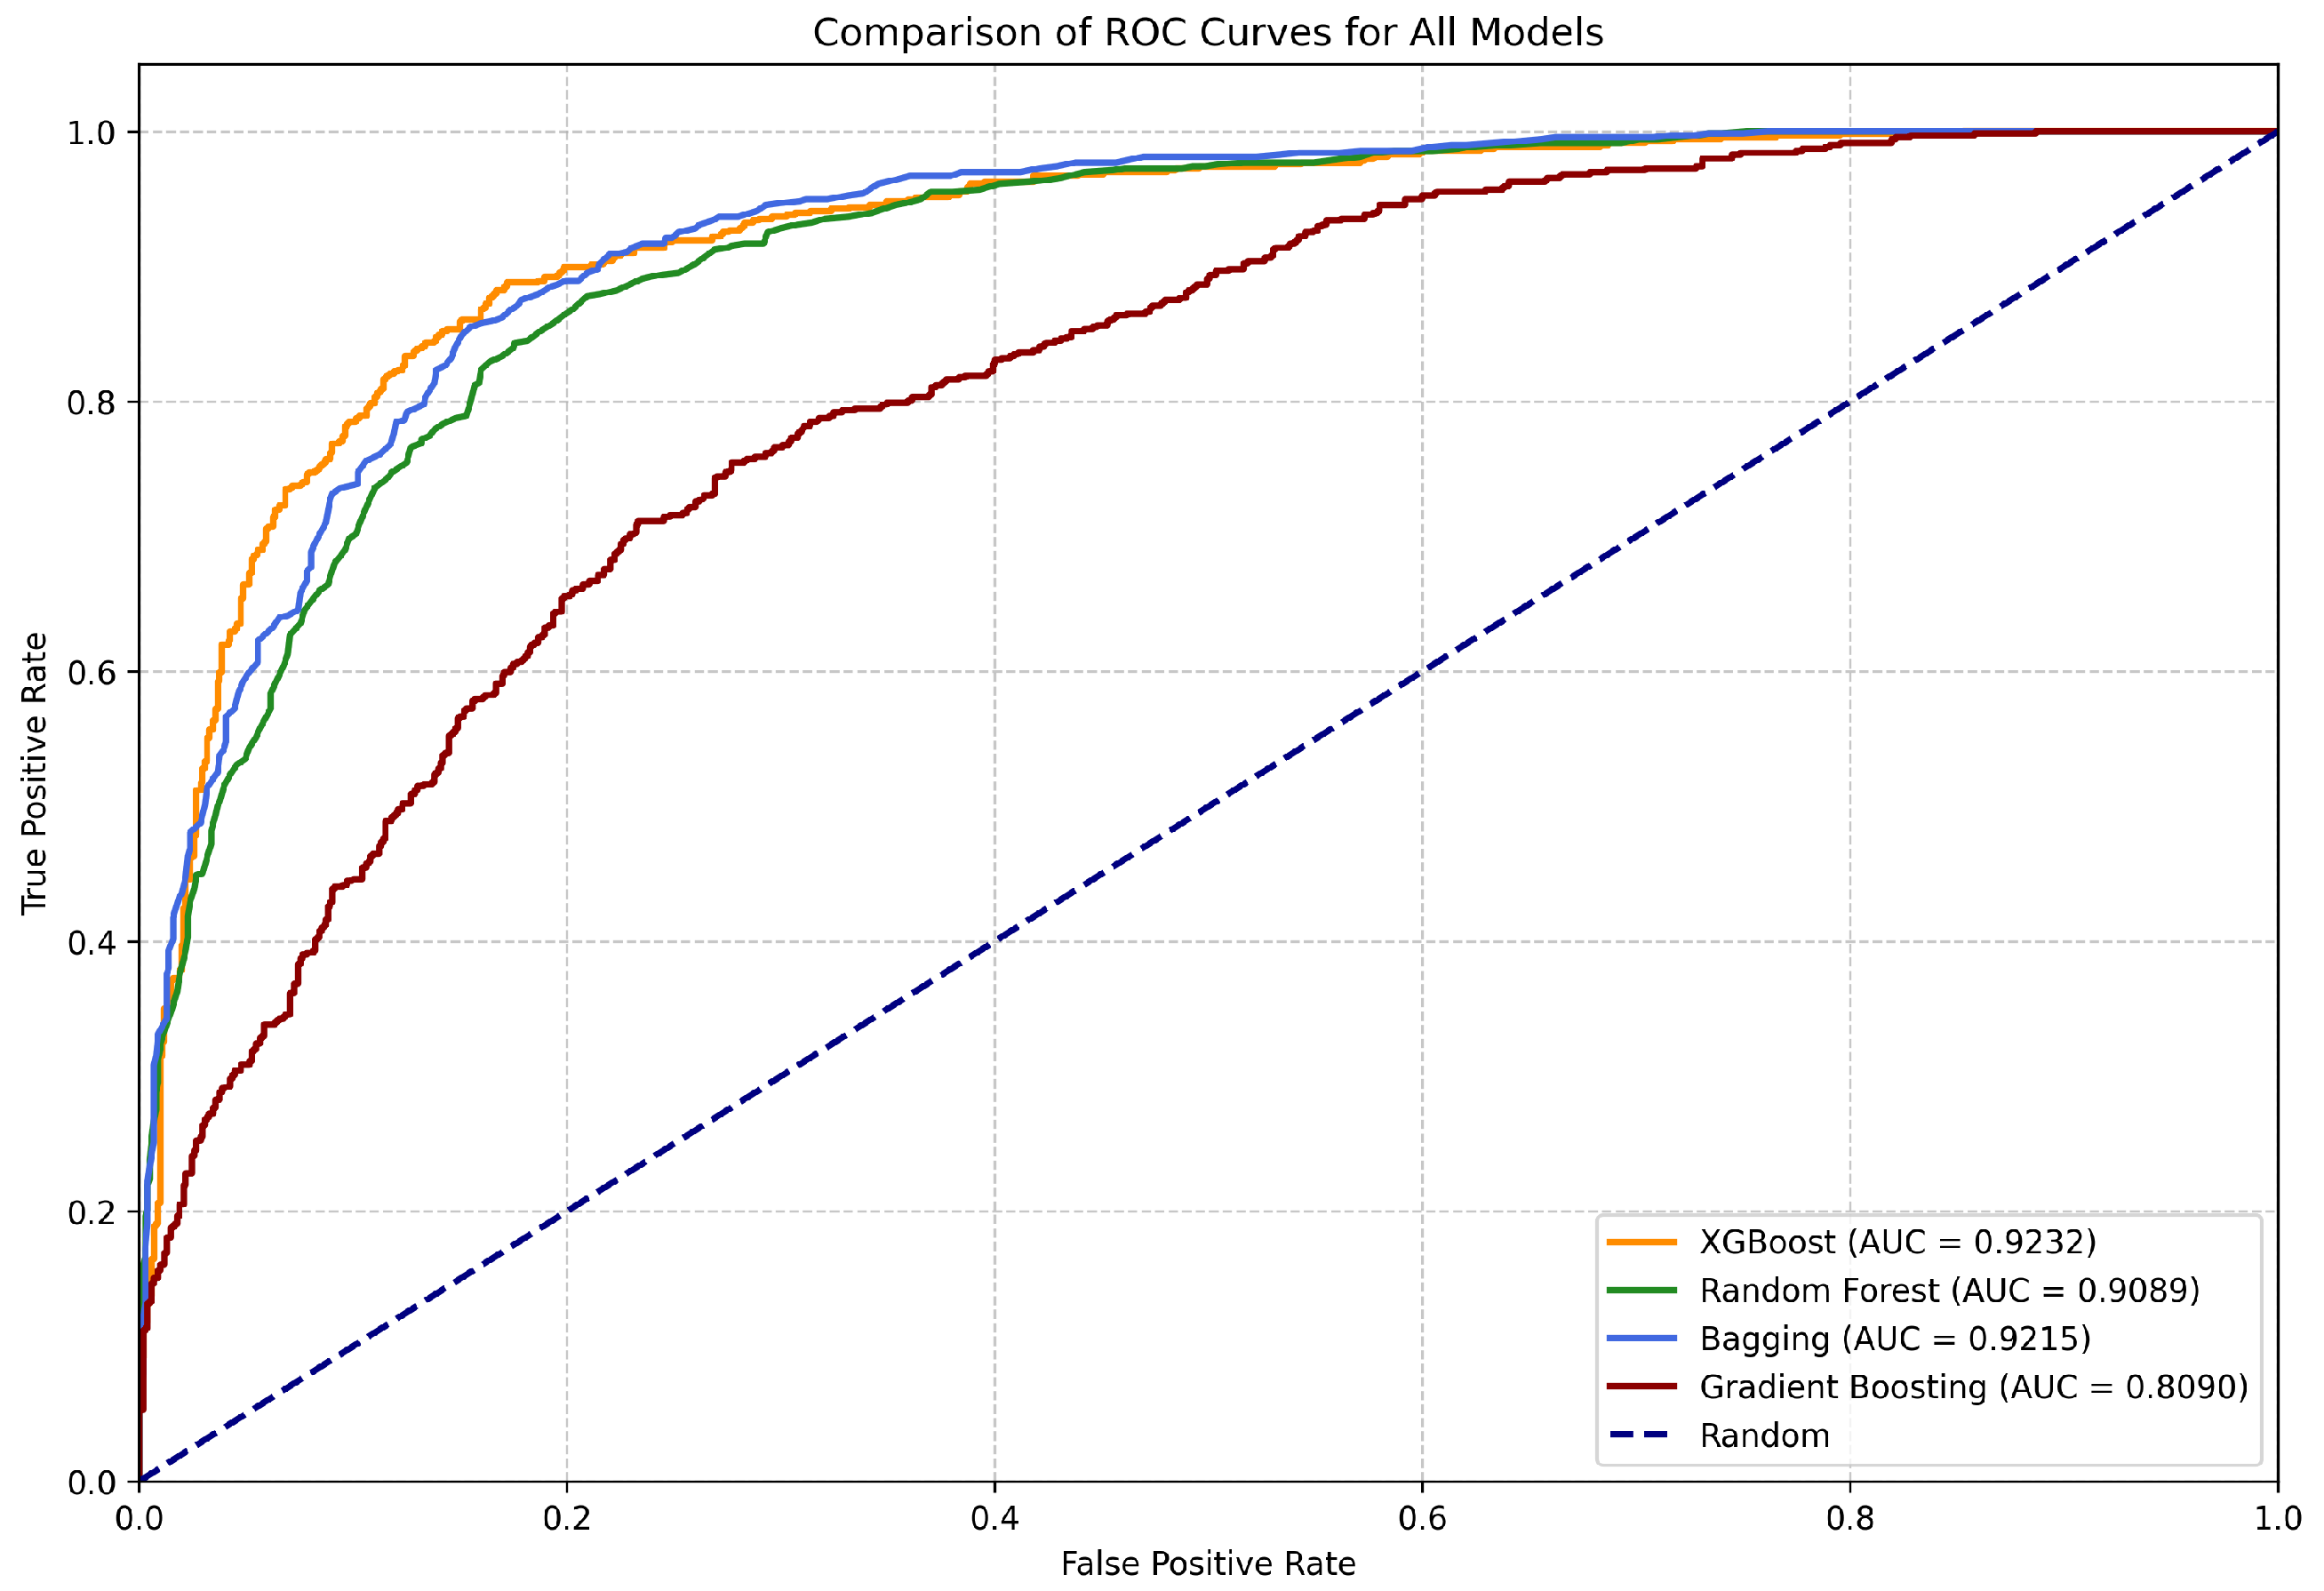
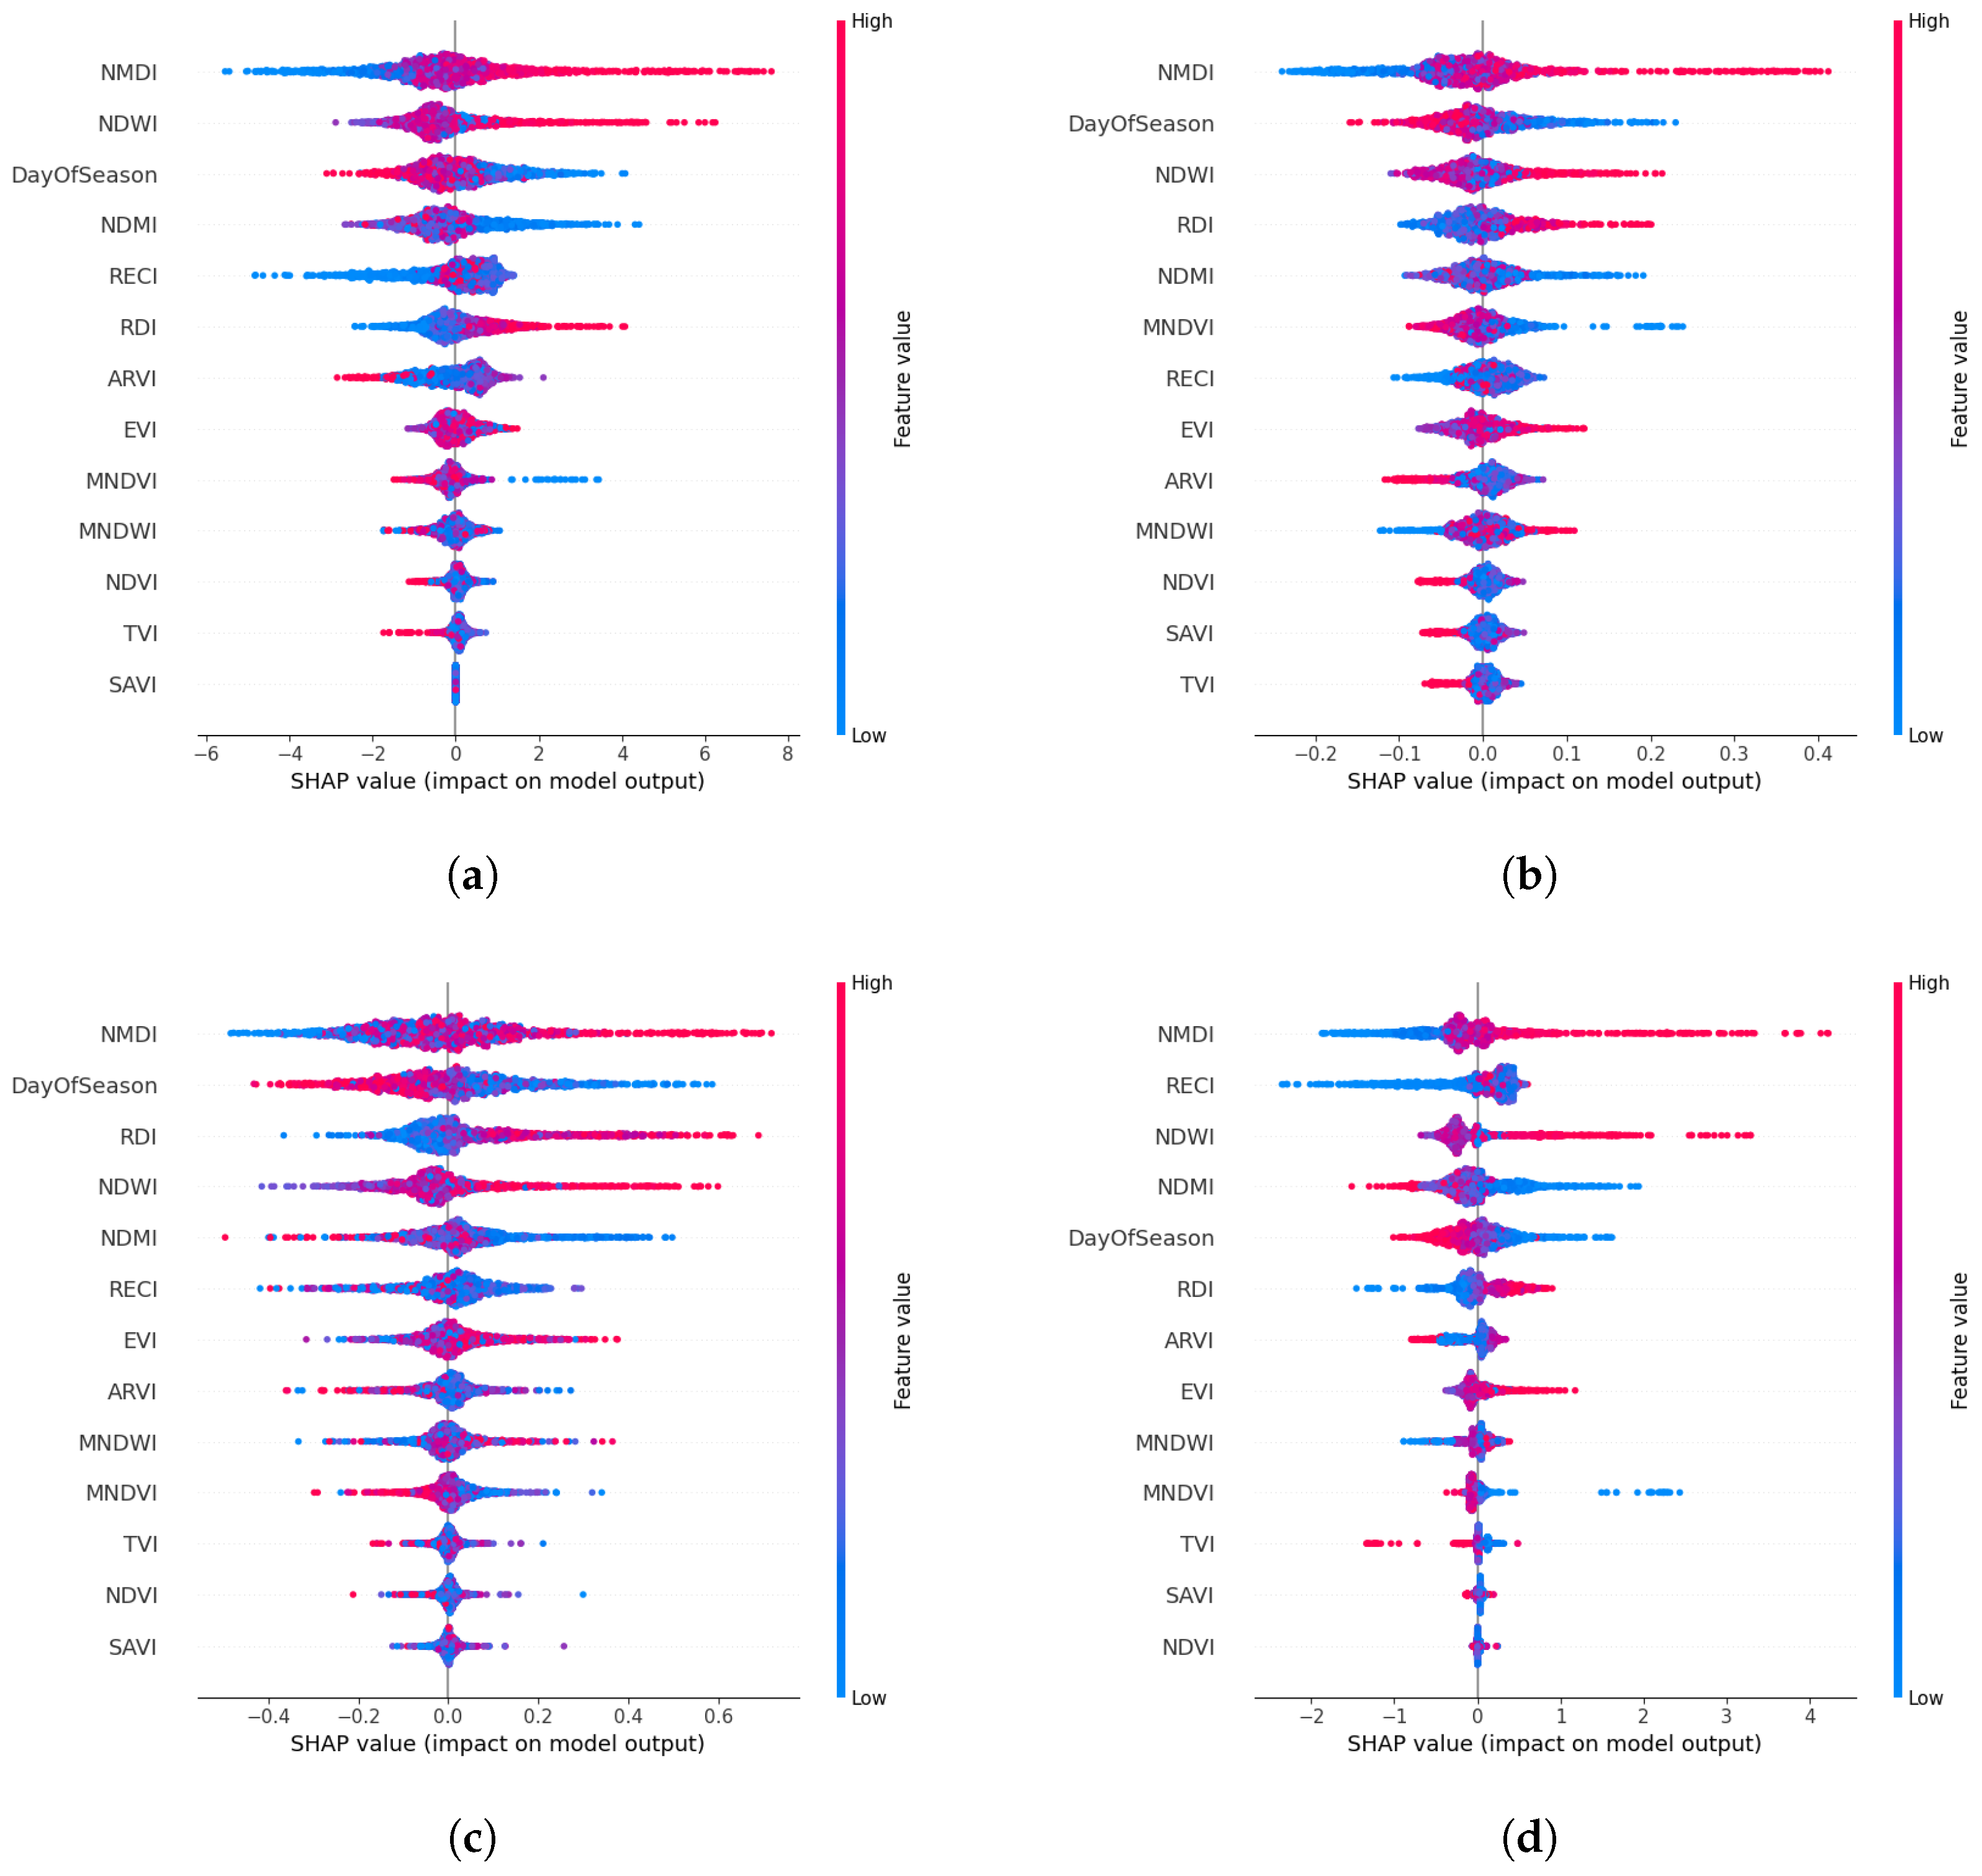

| ARVI | EVI | MNDVI | MNDWI | NDMI | NDVI | NDWI | NMDI | RDI | RECI | SAVI | TVI | Date |
|---|---|---|---|---|---|---|---|---|---|---|---|---|
| 0.2713 | 0.4561 | −0.2863 | −0.2797 | −0.0222 | 0.2668 | −0.2600 | 0.4326 | 1.8608 | 0.5180 | 0.4802 | 0.8747 | 2 January 2018 |
| 0.2912 | 0.6662 | −0.3054 | −0.3240 | −0.0341 | 0.2881 | −0.2937 | 0.4220 | 1.9493 | 0.5633 | 0.5184 | 0.8864 | 7 January 2018 |
| 0.2950 | 0.7153 | −0.3604 | −0.3653 | −0.0481 | 0.2945 | −0.3228 | 0.4089 | 2.2248 | 0.6098 | 0.5299 | 0.8894 | 17 January 2018 |
| Year/District | Jodhpur | Amravati | Thanjavur |
|---|---|---|---|
| 2016 | Drought | Drought | No Drought |
| 2017 | No Drought | No Drought | Drought |
| 2018 | No Drought | No Drought | No Drought |
| 2019 | Drought | Drought | Drought |
| 2020 | Drought | No Drought | No Drought |
| 2021 | No Drought | No Drought | No Drought |
| 2022 | Drought | No Drought | No Drought |
| 2023 | No Drought | Drought | No Drought |
| 2024 | Drought | Drought | Drought |
| 2025 | No Drought | No Drought | No Drought |
| Methods/Metrics | Accuracy | Precision | Recall |
|---|---|---|---|
| XG Boost | 0.8480 | 0.8129 | 0.8164 |
| Random Forest | 0.8298 | 0.8145 | 0.7561 |
| Bagging Classifier | 0.8398 | 0.8232 | 0.7747 |
| Gradient Boosting | 0.7424 | 0.7209 | 0.6040 |
| Methods/Metrics | Accuracy | Precision | Recall |
|---|---|---|---|
| XG Boost | 0.8352 ± 0.0089 | 0.8271 ± 0.0136 | 0.7747 ± 0.0157 |
| Random Forest | 0.8190 ± 0.0032 | 0.8122 ± 0.0058 | 0.7471 ± 0.0137 |
| Bagging Classifier | 0.8232 ± 0.0040 | 0.8138 ± 0.0087 | 0.7578 ± 0.0137 |
| Gradient Boosting | 0.7403 ± 0.0054 | 0.7339 ± 0.0120 | 0.6111 ± 0.0092 |
| Methods/Metrics | Accuracy | Precision | Recall |
|---|---|---|---|
| XG Boost | 0.8140 | 0.7582 | 0.8006 |
| Random Forest | 0.8075 | 0.7503 | 0.7934 |
| Bagging Classifier | 0.8140 | 0.7575 | 0.8020 |
| Gradient Boosting | 0.7359 | 0.6542 | 0.7518 |
| Methods/Metrics | Accuracy | Precision | Recall |
|---|---|---|---|
| XG Boost | 0.9173 ± 0.0064 | 0.9124 ± 0.0080 | 0.9293 ± 0.0099 |
| Random Forest | 0.8837 ± 0.0126 | 0.8722 ± 0.0146 | 0.9081 ± 0.0116 |
| Bagging Classifier | 0.8922 ± 0.0063 | 0.8835 ± 0.0090 | 0.9117 ± 0.0105 |
| Gradient Boosting | 0.8104 ± 0.0085 | 0.7960 ± 0.0151 | 0.8519 ± 0.0130 |
| Methods/Metrics | Accuracy | Precision | Recall |
|---|---|---|---|
| XG Boost | 0.8527 | 0.8528 | 0.7733 |
| Random Forest | 0.8275 | 0.8409 | 0.7131 |
| Bagging Classifier | 0.8468 | 0.8621 | 0.7446 |
| Gradient Boosting | 0.7494 | 0.7192 | 0.6356 |
| Methods/Metrics | Accuracy | Precision | Recall |
|---|---|---|---|
| XG Boost | 0.8856 ± 0.0042 | 0.8731 ± 0.0041 | 0.8645 ± 0.0097 |
| Random Forest | 0.8687 ± 0.0060 | 0.8646 ± 0.0120 | 0.8305 ± 0.0034 |
| Bagging Classifier | 0.8754 ± 0.0067 | 0.8676 ± 0.0095 | 0.8446 ± 0.0071 |
| Gradient Boosting | 0.7756 ± 0.0094 | 0.7714 ± 0.0089 | 0.6934 ± 0.0214 |
| Methods/Metrics | Accuracy | Precision | Recall |
|---|---|---|---|
| XG Boost | 0.8521 | 0.7947 | 0.8608 |
| Random Forest | 0.8333 | 0.7779 | 0.8293 |
| Bagging Classifier | 0.8492 | 0.7926 | 0.8551 |
| Gradient Boosting | 0.7306 | 0.6455 | 0.7575 |
| Methods/Metrics | Accuracy | Precision | Recall |
|---|---|---|---|
| XG Boost | 0.8856 ± 0.0042 | 0.8731 ± 0.0041 | 0.8645 ± 0.0097 |
| Random Forest | 0.8687 ± 0.0060 | 0.8646 ± 0.0120 | 0.8305 ± 0.0034 |
| Bagging Classifier | 0.8754 ± 0.0067 | 0.8676 ± 0.0095 | 0.8446 ± 0.0071 |
| Gradient Boosting | 0.7756 ± 0.0094 | 0.7714 ± 0.0089 | 0.6934 ± 0.0214 |
| (a) XGBoost | (b) Random Forest | ||||
| Predicted | Predicted | ||||
| Actual | No Drought | Drought | Actual | No Drought | Drought |
| No Drought | 876 | 131 | No Drought | 887 | 120 |
| Drought | 128 | 569 | Drought | 170 | 527 |
| (c) Bagging | (d) Gradient Boosting | ||||
| Predicted | Predicted | ||||
| Actual | No Drought | Drought | Actual | No Drought | Drought |
| No Drought | 891 | 116 | No Drought | 844 | 163 |
| Drought | 157 | 540 | Drought | 276 | 421 |
| (a) XGBoost | (b) Random Forest | ||||
| Predicted | Predicted | ||||
| Actual | No Drought | Drought | Actual | No Drought | Drought |
| No Drought | 829 | 178 | No Drought | 823 | 184 |
| Drought | 139 | 558 | Drought | 144 | 553 |
| (c) Bagging | (d) Gradient Boosting | ||||
| Predicted | Predicted | ||||
| Actual | No Drought | Drought | Actual | No Drought | Drought |
| No Drought | 828 | 179 | No Drought | 730 | 277 |
| Drought | 138 | 559 | Drought | 173 | 524 |
| (a) XGBoost | (b) Random Forest | ||||
| Predicted | Predicted | ||||
| Actual | No Drought | Drought | Actual | No Drought | Drought |
| No Drought | 914 | 93 | No Drought | 913 | 94 |
| Drought | 158 | 539 | Drought | 200 | 497 |
| (c) Bagging | (d) Gradient Boosting | ||||
| Predicted | Predicted | ||||
| Actual | No Drought | Drought | Actual | No Drought | Drought |
| No Drought | 924 | 83 | No Drought | 834 | 173 |
| Drought | 178 | 519 | Drought | 254 | 443 |
| (a) XGBoost | (b) Random Forest | ||||
| Predicted | Predicted | ||||
| Actual | No Drought | Drought | Actual | No Drought | Drought |
| No Drought | 852 | 155 | No Drought | 842 | 165 |
| Drought | 97 | 600 | Drought | 119 | 578 |
| (c) Bagging | (d) Gradient Boosting | ||||
| Predicted | Predicted | ||||
| Actual | No Drought | Drought | Actual | No Drought | Drought |
| No Drought | 851 | 156 | No Drought | 717 | 290 |
| Drought | 101 | 596 | Drought | 169 | 528 |
| Methods/Metrics | Accuracy | Precision | Recall |
|---|---|---|---|
| XG Boost | 0.9630 | 0.9630 | 0.9630 |
| Random Forest | 0.9000 | 0.9000 | 0.9000 |
| Bagging Classifier | 0.9630 | 0.9630 | 0.9630 |
| Gradient Boosting | 0.8333 | 0.8333 | 0.8333 |
| District | XGB | RF | Bagging | GB |
|---|---|---|---|---|
| Amravati | 0 | 0 | 0 | 2 |
| Jodhpur | 0 | 0 | 0 | 0 |
| Thanjavur | 1 | 3 | 1 | 3 |
| Total errors | 1 | 3 | 1 | 5 |
| Methods/Metrics | Accuracy | Precision | Recall |
|---|---|---|---|
| XG Boost | 0.9000 | 0.9000 | 0.9000 |
| Random Forest | 0.9333 | 0.9333 | 0.9333 |
| Bagging Classifier | 0.9333 | 0.9333 | 0.9333 |
| Gradient Boosting | 0.8000 | 0.8000 | 0.8000 |
| District | XGB | RF | Bagging | GB |
|---|---|---|---|---|
| Amravati | 0 | 0 | 0 | 2 |
| Jodhpur | 0 | 0 | 0 | 2 |
| Thanjavur | 3 | 2 | 2 | 2 |
| Total errors | 3 | 2 | 2 | 6 |
| Methods/Metrics | Accuracy | Precision | Recall |
|---|---|---|---|
| XG Boost | 0.9333 | 0.9333 | 0.9333 |
| Random Forest | 0.9000 | 0.9000 | 0.9000 |
| Bagging Classifier | 0.9000 | 0.9000 | 0.9000 |
| Gradient Boosting | 0.8333 | 0.8333 | 0.8333 |
| District | XGB | RF | Bagging | GB |
|---|---|---|---|---|
| Amravati | 0 | 0 | 0 | 2 |
| Jodhpur | 0 | 0 | 0 | 0 |
| Thanjavur | 2 | 3 | 3 | 3 |
| Total errors | 2 | 3 | 3 | 5 |
| Methods/Metrics | Accuracy | Precision | Recall |
|---|---|---|---|
| XG Boost | 1.0000 | 1.0000 | 1.0000 |
| Random Forest | 0.9667 | 0.9667 | 0.9667 |
| Bagging Classifier | 0.9667 | 0.9667 | 0.9667 |
| Gradient Boosting | 0.8667 | 0.8667 | 0.8667 |
| District | XGB | RF | Bagging | GB |
|---|---|---|---|---|
| Amravati | 0 | 0 | 0 | 1 |
| Jodhpur | 0 | 0 | 0 | 2 |
| Thanjavur | 0 | 1 | 1 | 1 |
| Total errors | 0 | 1 | 1 | 4 |
| XGBoost | Random Forest | Bagging | Gradient Boosting | |
|---|---|---|---|---|
| Top 1 | Acc: 0.6015 Prec: 0.5204 Rec: 0.3300 | Acc: 0.5452 Prec: 0.4470 Rec: 0.4720 | Acc: 0.5452 Prec: 0.4470 Rec: 0.4720 | Acc: 0.5939 Prec: 0.5065 Rec: 0.2812 |
| Top 2 | Acc: 0.6050 Prec: 0.5198 Rec: 0.4519 | Acc: 0.6097 Prec: 0.5257 Rec: 0.4692 | Acc: 0.6162 Prec: 0.5336 Rec: 0.4892 | Acc: 0.6080 Prec: 0.5315 Rec: 0.3515 |
| Top 3 | Acc: 0.7441 Prec: 0.6986 Rec: 0.6585 | Acc: 0.7676 Prec: 0.7482 Rec: 0.6643 | Acc: 0.7541 Prec: 0.7132 Rec: 0.6671 | Acc: 0.6696 Prec: 0.6309 Rec: 0.4634 |
| Top 4 | Acc: 0.8058 Prec: 0.7691 Rec: 0.7504 | Acc: 0.8163 Prec: 0.7883 Rec: 0.7532 | Acc: 0.8163 Prec: 0.7900 Rec: 0.7504 | Acc: 0.7072 Prec: 0.6911 Rec: 0.5136 |
| Top 5 | Acc: 0.8327 Prec: 0.7901 Rec: 0.8049 | Acc: 0.8345 Prec: 0.8130 Rec: 0.7733 | Acc: 0.8275 Prec: 0.8039 Rec: 0.7647 | Acc: 0.7289 Prec: 0.7094 Rec: 0.5710 |
| XGBoost | Random Forest | Bagging | Gradient Boosting | |
|---|---|---|---|---|
| Top 1 | Acc: 0.6015 Prec: 0.5204 Rec: 0.3300 | Acc: 0.5452 Prec: 0.4470 Rec: 0.4720 | Acc: 0.5452 Prec: 0.4470 Rec: 0.4720 | Acc: 0.5939 Prec: 0.5065 Rec: 0.2812 |
| Top 2 | Acc: 0.6854 Prec: 0.6292 Rec: 0.5624 | Acc: 0.6884 Prec: 0.6258 Rec: 0.5925 | Acc: 0.6737 Prec: 0.6060 Rec: 0.5782 | Acc: 0.6485 Prec: 0.6324 Rec: 0.3357 |
| Top 3 | Acc: 0.7441 Prec: 0.6986 Rec: 0.6585 | Acc: 0.7664 Prec: 0.7325 Rec: 0.6758 | Acc: 0.7523 Prec: 0.7106 Rec: 0.6657 | Acc: 0.6696 Prec: 0.6309 Rec: 0.4634 |
| Top 4 | Acc: 0.8104 Prec: 0.7895 Rec: 0.7317 | Acc: 0.8075 Prec: 0.7869 Rec: 0.7260 | Acc: 0.8104 Prec: 0.7799 Rec: 0.7475 | Acc: 0.7031 Prec: 0.6792 Rec: 0.5194 |
| Top 5 | Acc: 0.8345 Prec: 0.8120 Rec: 0.7747 | Acc: 0.8351 Prec: 0.8210 Rec: 0.7633 | Acc: 0.8298 Prec: 0.8107 Rec: 0.7618 | Acc: 0.7224 Prec: 0.6972 Rec: 0.5681 |
| XGBoost | Random Forest | Bagging | Gradient Boosting | |
|---|---|---|---|---|
| Top 1 | Acc: 0.5370 Prec: 0.4498 Rec: 0.5911 | Acc: 0.5546 Prec: 0.4637 Rec: 0.5681 | Acc: 0.5546 Prec: 0.4637 Rec: 0.5681 | Acc: 0.5352 Prec: 0.4505 Rec: 0.6198 |
| Top 2 | Acc: 0.6808 Prec: 0.5975 Rec: 0.6729 | Acc: 0.6690 Prec: 0.5888 Rec: 0.6327 | Acc: 0.6808 Prec: 0.6035 Rec: 0.6399 | Acc: 0.6127 Prec: 0.5213 Rec: 0.6499 |
| Top 3 | Acc: 0.7406 Prec: 0.6658 Rec: 0.7346 | Acc: 0.7289 Prec: 0.6594 Rec: 0.6973 | Acc: 0.7365 Prec: 0.6671 Rec: 0.7102 | Acc: 0.6450 Prec: 0.5554 Rec: 0.6614 |
| Top 4 | Acc: 0.7805 Prec: 0.7128 Rec: 0.7762 | Acc: 0.7788 Prec: 0.7145 Rec: 0.7647 | Acc: 0.7741 Prec: 0.7074 Rec: 0.7633 | Acc: 0.6696 Prec: 0.5772 Rec: 0.7188 |
| Top 5 | Acc: 0.8016 Prec: 0.7365 Rec: 0.8020 | Acc: 0.7952 Prec: 0.7326 Rec: 0.7862 | Acc: 0.7934 Prec: 0.7309 Rec: 0.7834 | Acc: 0.7119 Prec: 0.6250 Rec: 0.7389 |
| XGBoost | Random Forest | Bagging | Gradient Boosting | |
|---|---|---|---|---|
| Top 1 | Acc: 0.5370 Prec: 0.4498 Rec: 0.5911 | Acc: 0.5546 Prec: 0.4637 Rec: 0.5681 | Acc: 0.5546 Prec: 0.4637 Rec: 0.5681 | Acc: 0.5352 Prec: 0.4505 Rec: 0.6198 |
| Top 2 | Acc: 0.6808 Prec: 0.5975 Rec: 0.6729 | Acc: 0.6690 Prec: 0.5888 Rec: 0.6327 | Acc: 0.6808 Prec: 0.6035 Rec: 0.6399 | Acc: 0.6127 Prec: 0.5213 Rec: 0.6499 |
| Top 3 | Acc: 0.7406 Prec: 0.6658 Rec: 0.7346 | Acc: 0.7289 Prec: 0.6594 Rec: 0.6973 | Acc: 0.7365 Prec: 0.6671 Rec: 0.7102 | Acc: 0.6450 Prec: 0.5554 Rec: 0.6614 |
| Top 4 | Acc: 0.7923 Prec: 0.7340 Rec: 0.7719 | Acc: 0.7752 Prec: 0.7169 Rec: 0.7446 | Acc: 0.7705 Prec: 0.7090 Rec: 0.7446 | Acc: 0.6702 Prec: 0.5822 Rec: 0.6858 |
| Top 5 | Acc: 0.8146 Prec: 0.7592 Rec: 0.8006 | Acc: 0.8028 Prec: 0.7469 Rec: 0.7834 | Acc: 0.7946 Prec: 0.7310 Rec: 0.7877 | Acc: 0.7077 Prec: 0.6194 Rec: 0.7403 |
| XGBoost | Random Forest | Bagging | Gradient Boosting | |
|---|---|---|---|---|
| Top 1 | Acc: 0.5728 Prec: 0.4724 Rec: 0.3802 | Acc: 0.5288 Prec: 0.4295 Rec: 0.4634 | Acc: 0.5288 Prec: 0.4295 Rec: 0.4634 | Acc: 0.5839 Prec: 0.4864 Rec: 0.3070 |
| Top 2 | Acc: 0.6995 Prec: 0.6529 Rec: 0.5667 | Acc: 0.6972 Prec: 0.6496 Rec: 0.5638 | Acc: 0.6866 Prec: 0.6330 Rec: 0.5567 | Acc: 0.6455 Prec: 0.5987 Rec: 0.4046 |
| Top 3 | Acc: 0.7377 Prec: 0.7029 Rec: 0.6212 | Acc: 0.7394 Prec: 0.7185 Rec: 0.5968 | Acc: 0.7418 Prec: 0.7110 Rec: 0.6212 | Acc: 0.6749 Prec: 0.6248 Rec: 0.5136 |
| Top 4 | Acc: 0.7934 Prec: 0.7851 Rec: 0.6815 | Acc: 0.8046 Prec: 0.8085 Rec: 0.6844 | Acc: 0.8052 Prec: 0.8007 Rec: 0.6973 | Acc: 0.7077 Prec: 0.6639 Rec: 0.5782 |
| Top 5 | Acc: 0.8327 Prec: 0.8399 Rec: 0.7303 | Acc: 0.8275 Prec: 0.8375 Rec: 0.7174 | Acc: 0.8210 Prec: 0.8213 Rec: 0.7188 | Acc: 0.7377 Prec: 0.7090 Rec: 0.6083 |
| XGBoost | Random Forest | Bagging | Gradient Boosting | |
|---|---|---|---|---|
| Top 1 | Acc: 0.5728 Prec: 0.4724 Rec: 0.3802 | Acc: 0.5288 Prec: 0.4295 Rec: 0.4634 | Acc: 0.5288 Prec: 0.4295 Rec: 0.4634 | Acc: 0.5839 Prec: 0.4864 Rec: 0.3070 |
| Top 2 | Acc: 0.6995 Prec: 0.6529 Rec: 0.5667 | Acc: 0.6972 Prec: 0.6496 Rec: 0.5638 | Acc: 0.6866 Prec: 0.6330 Rec: 0.5567 | Acc: 0.6455 Prec: 0.5987 Rec: 0.4046 |
| Top 3 | Acc: 0.7388 Prec: 0.7114 Rec: 0.6083 | Acc: 0.7588 Prec: 0.7563 Rec: 0.6055 | Acc: 0.7770 Prec: 0.7673 Rec: 0.6528 | Acc: 0.6766 Prec: 0.6448 Rec: 0.4663 |
| Top 4 | Acc: 0.7993 Prec: 0.7983 Rec: 0.6815 | Acc: 0.8034 Prec: 0.8121 Rec: 0.6758 | Acc: 0.8046 Prec: 0.8054 Rec: 0.6887 | Acc: 0.7072 Prec: 0.6749 Rec: 0.5481 |
| Top 5 | Acc: 0.8263 Prec: 0.8314 Rec: 0.7217 | Acc: 0.8275 Prec: 0.8353 Rec: 0.7202 | Acc: 0.8245 Prec: 0.8284 Rec: 0.7202 | Acc: 0.7312 Prec: 0.7057 Rec: 0.5882 |
| XGBoost | Random Forest | Bagging | Gradient Boosting | |
|---|---|---|---|---|
| Top 1 | Acc: 0.5464 Prec: 0.4556 Rec: 0.5595 | Acc: 0.5252 Prec: 0.4350 Rec: 0.5380 | Acc: 0.5252 Prec: 0.4350 Rec: 0.5380 | Acc: 0.5293 Prec: 0.4497 Rec: 0.6729 |
| Top 2 | Acc: 0.5692 Prec: 0.4778 Rec: 0.5710 | Acc: 0.5904 Prec: 0.4994 Rec: 0.5739 | Acc: 0.5910 Prec: 0.5000 Rec: 0.5725 | Acc: 0.5851 Prec: 0.4941 Rec: 0.6011 |
| Top 3 | Acc: 0.6620 Prec: 0.5761 Rec: 0.6571 | Acc: 0.6802 Prec: 0.5964 Rec: 0.6743 | Acc: 0.6725 Prec: 0.5906 Rec: 0.6499 | Acc: 0.6180 Prec: 0.5253 Rec: 0.6844 |
| Top 4 | Acc: 0.7283 Prec: 0.6448 Rec: 0.7475 | Acc: 0.7453 Prec: 0.6667 Rec: 0.7547 | Acc: 0.7371 Prec: 0.6578 Rec: 0.7446 | Acc: 0.6684 Prec: 0.5766 Rec: 0.7131 |
| Top 5 | Acc: 0.8316 Prec: 0.7649 Rec: 0.8494 | Acc: 0.8263 Prec: 0.7691 Rec: 0.8221 | Acc: 0.8187 Prec: 0.7526 Rec: 0.8293 | Acc: 0.7048 Prec: 0.6160 Rec: 0.7389 |
| XGBoost | Random Forest | Bagging | Gradient Boosting | |
|---|---|---|---|---|
| Top 1 | Acc: 0.5464 Prec: 0.4556 Rec: 0.5595 | Acc: 0.5252 Prec: 0.4350 Rec: 0.5380 | Acc: 0.5252 Prec: 0.4350 Rec: 0.5380 | Acc: 0.5293 Prec: 0.4497 Rec: 0.6729 |
| Top 2 | Acc: 0.5692 Prec: 0.4778 Rec: 0.5710 | Acc: 0.5904 Prec: 0.4994 Rec: 0.5739 | Acc: 0.5910 Prec: 0.5000 Rec: 0.5725 | Acc: 0.5851 Prec: 0.4941 Rec: 0.6011 |
| Top 3 | Acc: 0.6702 Prec: 0.5810 Rec: 0.6944 | Acc: 0.6866 Prec: 0.6049 Rec: 0.6743 | Acc: 0.6843 Prec: 0.6023 Rec: 0.6714 | Acc: 0.6320 Prec: 0.5418 Rec: 0.6514 |
| Top 4 | Acc: 0.7283 Prec: 0.6448 Rec: 0.7475 | Acc: 0.7494 Prec: 0.6709 Rec: 0.7604 | Acc: 0.7394 Prec: 0.6599 Rec: 0.7489 | Acc: 0.6684 Prec: 0.5766 Rec: 0.7131 |
| Top 5 | Acc: 0.8316 Prec: 0.7649 Rec: 0.8494 | Acc: 0.8269 Prec: 0.7666 Rec: 0.8293 | Acc: 0.8187 Prec: 0.7526 Rec: 0.8293 | Acc: 0.7048 Prec: 0.6160 Rec: 0.7389 |
| Model | Method 1 | Method 2 | p-Value | Effect Size | Significant |
|---|---|---|---|---|---|
| XGBoost | No Sampling | SMOTE | 0.0340 | Yes | |
| XGBoost | No Sampling | BSMOTE | 0.3961 | 0.0047 | No |
| XGBoost | No Sampling | ADASYN | 0.4188 | 0.0041 | No |
| Random Forest | No Sampling | SMOTE | 0.0223 | Yes | |
| Random Forest | No Sampling | BSMOTE | 0.6889 | 0.0023 | No |
| Random Forest | No Sampling | ADASYN | 0.6101 | 0.0035 | No |
| Bagging | No Sampling | SMOTE | 0.0258 | Yes | |
| Bagging | No Sampling | BSMOTE | 0.1337 | 0.0070 | No |
| Bagging | No Sampling | ADASYN | 0.1253 | 0.0094 | No |
| Gradient Boosting | No Sampling | SMOTE | 0.4973 | 0.0065 | No |
| Gradient Boosting | No Sampling | BSMOTE | 0.0501 | 0.0070 | No |
| Gradient Boosting | No Sampling | ADASYN | 0.2141 | 0.0117 | No |
| Model | No_Sampling | SMOTE | BorderlineSMOTE | ADASYN | Best Method | Improvement |
|---|---|---|---|---|---|---|
| XGBoost | 0.8146 | 0.7788 | 0.8111 | 0.8264 | ADASYN | +0.0118 |
| RandomForest | 0.7842 | 0.7713 | 0.7717 | 0.8028 | ADASYN | +0.0186 |
| Bagging | 0.7982 | 0.7791 | 0.7991 | 0.8226 | ADASYN | +0.0244 |
| GradientBoosting | 0.6573 | 0.6996 | 0.6748 | 0.6970 | SMOTE | +0.0423 |
Disclaimer/Publisher’s Note: The statements, opinions and data contained in all publications are solely those of the individual author(s) and contributor(s) and not of MDPI and/or the editor(s). MDPI and/or the editor(s) disclaim responsibility for any injury to people or property resulting from any ideas, methods, instructions or products referred to in the content. |
© 2025 by the authors. Licensee MDPI, Basel, Switzerland. This article is an open access article distributed under the terms and conditions of the Creative Commons Attribution (CC BY) license (https://creativecommons.org/licenses/by/4.0/).
Share and Cite
Sharma, S.S.; Mukherjee, J.; Dell’Acqua, F. Leveraging Sentinel-2 Data and Machine Learning for Drought Detection in India: The Process of Ground Truth Construction and a Case Study. Remote Sens. 2025, 17, 3159. https://doi.org/10.3390/rs17183159
Sharma SS, Mukherjee J, Dell’Acqua F. Leveraging Sentinel-2 Data and Machine Learning for Drought Detection in India: The Process of Ground Truth Construction and a Case Study. Remote Sensing. 2025; 17(18):3159. https://doi.org/10.3390/rs17183159
Chicago/Turabian StyleSharma, Shubham Subhankar, Jit Mukherjee, and Fabio Dell’Acqua. 2025. "Leveraging Sentinel-2 Data and Machine Learning for Drought Detection in India: The Process of Ground Truth Construction and a Case Study" Remote Sensing 17, no. 18: 3159. https://doi.org/10.3390/rs17183159
APA StyleSharma, S. S., Mukherjee, J., & Dell’Acqua, F. (2025). Leveraging Sentinel-2 Data and Machine Learning for Drought Detection in India: The Process of Ground Truth Construction and a Case Study. Remote Sensing, 17(18), 3159. https://doi.org/10.3390/rs17183159


